
Submitted:
16 July 2024
Posted:
17 July 2024
You are already at the latest version
Abstract
This paper presents a Cartesian model of sustainability by a novel integration of Circular Economy principles and ESG (Environmental, Social, and Governance) criteria to explicitly establish a clear path for closing the loops of negative social and environmental externalities. As global sustainability transformations accelerate, they bring both opportunities and inherent financial risks and social uncertainties. Historically, economic development has often been achieved at the expense of environmental balance. The contemporary challenge is to attain a dynamic equilibrium between natural and socio-economic systems. We introduce an integrated, multidisciplinary, and dynamic framework for studying and managing sustainability transitions. Our innovative 4-quadrant framework utilizes a Cartesian coordinate system to map the impacts of various business models on natural and socio-economic systems, spanning from linear open-loop to circular closed-loop ESG models. The framework is data-driven, employing normalized coordinates (-1 to 1) to facilitate empirical analysis and the establishment of temporal Key Performance Indicators. By integrating the Human Development Index within ecological limits, our model targets regenerative development that harmonizes human progress with planetary boundaries. This versatile and robust framework serves as a practical tool for businesses, households, organizations, and policymakers to navigate the complexities of sustainable development, promoting innovation and fostering a just transition towards regenerative practices. Our approach provides a comprehensive roadmap for achieving high human development within the planet's ecological limits, contributing significantly to the broader discourse on sustainability science and management.
Keywords:
Sustainability Studies
; Sustainability Transition
; Sustainability Management
; Regenerative Development
; Business Model
Introduction
Induced by convincing climate data (SRC 2023) and its grave consequences for almost all critical systems that sustain life and business (IPCC 2023), supported by proactive and multilateral (Paris Agreement, SDGs) governmental and regulatory EU-Green Deal and taxonomies) initiatives, encouraged by emergence of multiple voluntary sustainability disclosure standards (GRI, ISSB, TCFD), enabled by disruptive green technologies (green energy and EVs), and incentivized by changes in investors and consumers preferences (ESGs) – an unprecedented transformation of global economies is already taking place (UNDP 2023). These citations are few reminders of the numerous drivers of the sustainability disruptions. Where there are clear long-term sustainability advantages of the transition – Green Swans of (Elkington 2020), the short-term disruptions caused by the transition have uncertain socio-economic consequences and risks – Green Swans of (BIS 2020).
This warrants a robust economic model and coherent conceptual framework capable of discussing and analyzing the complexities involved in sustainability transition and its management. The objective of this paper is to present an integrated, multidisciplinary, and dynamic framework for sustainability transition and its management.
The framework presented in Figure 1 comprises the 4 segments. We first discuss the different segments of the framework, and then discuss the risks and opportunities of sustainability transition and add some concluding remarks. The 4-quadrant model is discussed in more detail in Appendix A1.
Segment A:
Business Models: Market Driven Sustainability vs Sustainability Driven Markets
Segment A delineates the sustainability perspective of business models, highlighting the evolution from linear open-loop models, which prioritize short-term profit maximization, to circular closed-loop models that focus on the regeneration of natural and social systems. This transition underscores the shift from a traditional economic focus to a holistic approach that integrates closed-loop circular economy paradigm with Environmental, Social, and Governance (ESG) criteria – pivots summarized in Table 1.
This segment illustrates four distinct business models, arranged along the axes of short-term profit maximization and the regeneration of natural and socio-economic systems. These models simultaneously exist in any location, region or country at a given time. The models include:
- (a)
- Linear Open loop: Represents a traditional business model focused on economic gain (ECON) with minimal consideration of environmental (E), social (S), and governance (G) factors. It is characterized as being based on resource extraction, production, consumption, emissions and waste generation – negative externalities are tolerated as inevitable outcomes of markets. This the dominant neoclassical economic paradigm well known as the shareholders’ capitalism.
- (b)
- Linear Open-loop ESG: Integrates ESG factors into the linear model but maintains a focus on short-term profit maximization – this can be termed as an attempt to achieve sustainability through markets. There’s a careful attempt at markets driven incentive-based internalization of negative externalities, but it leads to moral hazard in the form of green washing.
- (c)
- Circular Closed loop: Adopts circular economy principles, emphasizing resource reuse and waste reduction, waste ideally elimination by closing the loop in the linear system by biological (composting) and technical (design and resource reuse) processes. However, some recent studies highlight that this model bypasses the social and governance considerations of ESG.
- (d)
- Circular Closed-loop ESG: Combines circular economy principles of zero-waste and resource conservation with strong ESG integration, with robust financial, social and governance taxonomies aiming for comprehensive sustainability – this can be termed as sustainability driven markets.
- Segment B:
Dynamic Framework for Sustainability Management
Segment B introduces the dynamic framework for sustainability management, summarized in Table 2 -utilizing a coordinate system to map the impact of different business models on natural and social systems. The horizontal axis (X) represents the impact on social and economic systems, ranging from negative (-1) to positive (1), while the vertical axis (Y) captures the impact on natural systems, also spanning from negative (-1) to positive (1). This quadrant-based approach allows for a nuanced analysis of how different models, such as linear open-loop ESG and circular closed-loop ESG, perform in terms of their sustainability outcomes. By plotting these impacts, businesses can identify pathways to move from degenerative practices towards regenerative ones. This dynamic framework uses a Cartesian plane to map the impacts of different business models on natural and socio-economic systems.
Business models are positioned in quadrants based on their impacts:
Upper Right Quadrant (Y > 0, X > 0): Positive impacts on both systems (e.g., Circular Closed-loop ESG).
Upper Left Quadrant (Y > 0, X < 0): Positive social/economic impact but negative natural impact.
Lower Right Quadrant (Y < 0, X > 0): Negative social/economic impact but positive natural impact.
Lower Left Quadrant (Y < 0, X < 0): Negative impacts on both systems (e.g., Linear Open loop).
The framework’s use of coordinate limits from -1 to 1 significantly enhances its versatility and data-driven capabilities by providing a normalized, standardized scale for evaluating and comparing sustainability performance across diverse contexts. This range allows for a clear and concise representation of impacts on both natural and social systems, with negative values indicating detrimental effects and positive values signifying beneficial outcomes.
The bounded scale facilitates the setting of temporal Key Performance Indicators (KPIs) as normalized coordinates within each quadrant, enabling precise tracking of progress for specific activities, businesses, or policies. By situating sustainability performance within this coordinate system, stakeholders can easily identify current positions and desired targets, thereby fostering a dynamic approach to sustainability management. The normalized coordinates ensure consistency and comparability over time, supporting robust empirical studies and informed decision-making. Additionally, this dynamic value allows for adaptive management practices, where interventions can be regularly adjusted based on real-time data and evolving conditions, driving continuous improvement towards sustainability goals.
Chichilnisky (1995) models showing that natural systems and capital are fundamental to sustaining life and businesses, providing essential resources such as clean air, water, fertile soil, and biodiversity that underpin economic activities and human well-being. Our model emphasizes the restoration and regeneration of these natural systems, integrating nature-based solutions (NBSs) as a crucial pathway in the sustainability transition. By adopting circular closed-loop ESG principles, businesses can shift from exploiting natural resources to enhancing their resilience and regenerative capacities. This approach not only mitigates environmental degradation but also promotes long-term sustainability, ensuring that natural capital continues to support both current and future generations.
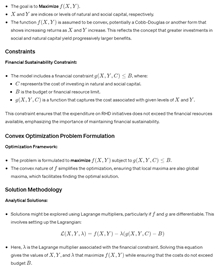
Deeper Stages of Regenerative Transition
Sustainability transition involves stages of deeper levels of transformations as depicted in Figure 2 based on the model and the required policies and initiatives.
- (a)
- ESG integration: Environmental, Social and Governance Disclosures
- (b)
- Reduction of Resource Use: Implement strategies to minimize resource extraction and consumption, promoting the use of sustainable materials.
- (c)
- Extension of Product Lifespan: Encourage the design and production of durable goods, emphasizing reuse, repair, refurbish, and remanufacture.
- (d)
- Improvement of Recycling and Waste Management: Enhance recycling processes and the utilization of production and consumption residues.
- (e)
- Institutional Reform and Effectiveness: Taxonomies for financial, social, educational, and administrative transformation
- (f)
- Integration of social finance: philanthropic social safety net, community institutions and income support and empowerment initiatives for the underprivileged
- (g)
- Regenerative focus: Implement nature-based solutions (NBS) with regenerative focus
- (h)
- Stakeholders: The various stakeholders are engaged meaningfully.
Substitution and Transformation Effects
Substitution (S) and Transformation (T) are critical processes of the sustainability transformation and require some elaboration.
- Substitution (S):
Substitution refers to the process of replacing less sustainable or more harmful practices, materials, or technologies with alternatives that have a lower environmental impact or are more socially responsible. This approach directly impacts the natural capital axis (X) of the framework by improving or sustaining environmental resources. Examples of Substitution are:
Energy Sources: Switching from fossil fuels to renewable energy sources such as solar or wind power.
Materials: Using recycled or biodegradable materials instead of virgin plastic or other non-renewable resources.
Processes: Adopting water-efficient technologies in manufacturing to reduce water use and wastewater generation.
Product Design: Designing products for disassembly and recycling, substituting materials or components that facilitate circular economy practices.
Impact: Substitution typically aims to directly reduce environmental degradation or enhance resource efficiency. It can also indirectly impact social externalities by contributing to a healthier environment and reducing the social harms associated with pollution and resource depletion.
- Transformation (T):
Transformation involves more profound changes that redefine an organization's fundamental practices, including its business models, operational processes, and cultural or strategic frameworks. This change targets both the environmental and social dimensions, aiming to create systemic improvements that align with sustainable development goals. Examples of Transformation are:
Business Models: Moving from single-use product models to service-based models (like product-as-a-service) where the focus shifts from selling physical products to offering the functionality of the product as a service.
Corporate Culture: Developing a corporate culture that prioritizes sustainability, ethical behavior, and social responsibility, which can permeate all levels of decision-making.
Supply Chain: Transforming the supply chain to include only suppliers who adhere to strict environmental and social standards, ensuring sustainability is maintained from source to sale.
Stakeholder Engagement: Changing the way an organization interacts with its stakeholders to ensure their needs and rights are proprietarily considered, promoting transparency and accountability.
Impact: Transformation is aimed at creating long-lasting changes that not only improve the current state but also ensure sustainability is integrated into the core strategic decisions of an organization. By doing so, it helps sustain positive social externalities (Y-axis) and can improve or mitigate negative impacts on natural capital (X-axis).
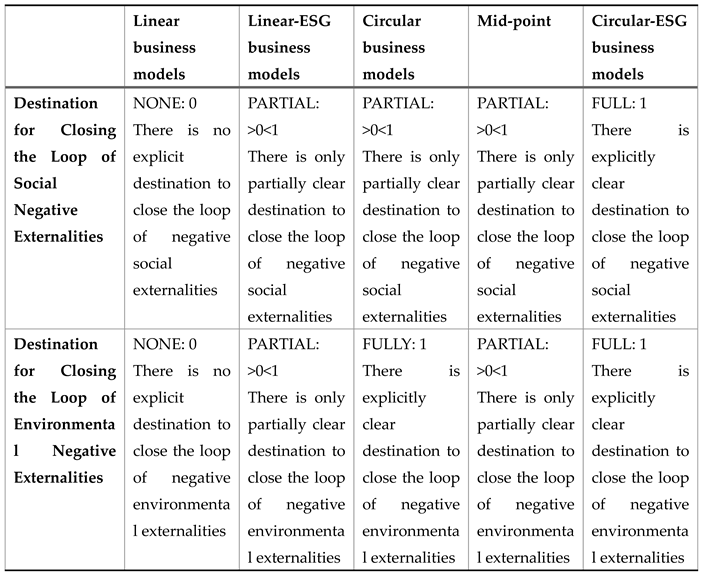
Table 3 provides a comparative analysis of different business models in terms of their effectiveness in addressing social and environmental negative externalities (NEs). The table categorizes the models into five types: Linear, Linear-ESG, Circular, Mid-point, and Circular-ESG business models. Each model is evaluated on its explicit destination for closing the loop of social and environmental NEs, with a scoring system where "NONE: 0" indicates no explicit destination, "PARTIAL: >0<1" indicates a partially clear destination, and "FULL: 1" indicates an explicitly clear destination. Linear business models have no clear destination for closing the loop on either type of NEs. Linear-ESG and Mid-point models only partially address these externalities. Circular business models fully address environmental NEs but only partially address social NEs. The Circular-ESG business model stands out as the only model that explicitly aims to close the loop on both social and environmental negative externalities, achieving full scores in both categories. This table underscores the comprehensive approach of the Circular-ESG model in fostering holistic sustainability.
- Segment C:
Stages of Business Sustainability Transition
Segment C outlines the stages of business sustainability transition, detailing a five-stage journey from open-loop linear models to regenerative closed-loop circular ESG models. The stages progress from basic sustainability measures, such as refuse and rethink (Stage 1), through intermediate steps like repair and refurbish (Stages 2 and 3), to advanced practices such as sustainable and restorative processes (Stage 4), culminating in the fully regenerative models (Stage 5). Each stage emphasizes increasing levels of environmental and social responsibility, encouraging businesses to continually improve their sustainability practices. This segment outlines a progression through five stages of sustainability:
Stage 1: Open-loop Linear: Businesses operate in a traditional linear model with minimal sustainability considerations.
- (a)
- Stage 2: Open-loop Linear ESG: Integrates ESG factors into the linear model, enhancing sustainability awareness.
- (b)
- Stage 3: Closed-loop Circular: Adopts circular economy practices, emphasizing resource efficiency and waste reduction.
- (c)
- Stage 4: Sustainable and Restorative: Combines circular practices with strong ESG considerations, aiming to restore natural and social systems.
- (d)
- Stage 5: Regenerative Closed-loop Circular ESG: Achieves the highest level of sustainability, focusing on regenerative practices that enhance both natural and social systems. Appendix A1 provides an example of a company transitioning from different stages.
- Segment D:
Regenerative Humane Development (RHD)
Segment D adopts the approach of Global Footprint Network (2024) and sets the target of regenerative (humane) development, integrating the Human Development Index (HDI) within the ecological limits of one Earth. The safe planetary boundaries are also the basis of Rockström et. al., (2009) study and the concept of Doughnut Economics (Raworth 2017). This segment emphasizes the importance of achieving high HDI, which reflects improved living standards and social well-being, while staying within the planet’s ecological boundaries. The framework uses a similar coordinate system to Segment B, with the HDI plotted against ecological impact, demonstrating the balance required to achieve sustainable human development. The goal is to attain a positive impact on both axes, ensuring that development is both humane and ecologically sustainable. UNDP (2024) offers an optimistic finding that the emerging economies are showing signs of performing better on HDI with lesser consequential ecological footprint as compared to the developed countries. This positive sign is the result of the efforts and technologies that we mentioned in the introduction of this paper.
This segment sets the goal of RHD - achieving high human development indices (HDI) within the planet's safe ecological boundaries. It presents a two-dimensional graph where:
The X-axis represents ecological footprint, with a boundary indicating the planet's safe limits.
The Y-axis represents HDI, with a minimum threshold required for humane development.
The goal is to achieve a high HDI within the safe ecological footprint, avoiding scenarios of degenerative development (high HDI with unsustainable ecological impact) and aiming for regenerative development (high HDI with sustainable ecological practices).
General RHD Optimization
In the framework regenerative humane development (RHD) maximization replaces the traditional utility maximization. Here we discuss the maximization of the general objective function for the model. Quadrant specific RHD optimization are presented in Appendix A2.
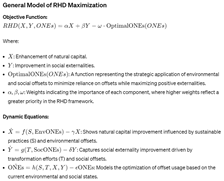
Extended General Model with Financial Sustainability Constraint
The above model clearly defines a structure that balances the dynamic interactions between natural and social capitals and the strategic use of offsets. In general, there are two fundamental consideration that need to be addressed. These are:
- (a)
- Incorporating Financial Constraints: Adding a constraint to ensure that the costs associated with S, T and ONEs do not exceed a predefined budget. This ensures that the RHD maximization efforts are financially sustainable.
- (b)
- Enhancing Objective Function with Convexity: Assuming convex relationships in f, g, and h functions might help in emphasizing the increasing returns on investment in sustainability efforts, making the model even more robust in driving significant enhancements in both X and Y. In general, there are increasing returns associated with investment in education (Y axes) and planting trees (X axes).
This extension enriches the model by ensuring that financial resources are utilized efficiently, aligning economic feasibility with ecological and social benefits, thereby providing a comprehensive and practical framework for sustainable regenerative development. This extended model provides a robust framework for analyzing and maximizing regenerative and humane development under financial constraints. It not only retains the core principles of the RHD maximization model but also enhances its analytical and practical capabilities, making it a powerful tool for sustainable development planning and implementation. This model is particularly useful for policymakers and planners seeking to optimize resource allocation in a way that maximizes both ecological and social welfare within financial limits.
- Objective Function:
Financial sustainability is now assumed to be a constraint rather than it being the objective itself. The objective now is the maximization of regenerative human development continuously in a dynamic equilibrium environment.
Risks and Opportunities
In the open-loop linear system, the focus is predominantly on financial risks such as credit risk, market risk, operational risk, and liquidity risk, with these risks being borne directly by shareholders – Figure 3. However, this system fails to recognize and address broader environmental, social, and governance (ESG) risks, as well as climate, natural capital, and inequality risks. Consequently, these unrecognized risks are effectively transferred to future generations as unintended and underpriced social costs. This transfer results in significant negative externalities that future generations must bear, highlighting a fundamental flaw in the sustainability of the open-loop linear business model.
Conversely, the closed-loop ESG system incorporates a comprehensive approach to risk management, emphasizing risk-sharing between present and future generations. This system recognizes a wide spectrum of risks, including financial, ESG, climate, natural capital, and inequality risks. By integrating ESG principles into a circular economy framework, the closed-loop ESG system aims to balance the immediate financial interests with long-term sustainability goals. This inherent feature of risk-sharing is crucial for effective sustainability transition management, as it promotes the regeneration of natural and social systems, ensuring that the negative externalities are minimized, and the benefits of sustainable practices are maximized for both current and future stakeholders.
Table 3 outlines the uncertainties, hidden disruptive opportunities, and risks associated with sustainability transitions across various domains. Climate change presents uncertainties such as severe weather events and economic loss, but also offers opportunities through advancements in renewable energy technologies and climate-resilient agriculture. Businesses that fail to seize these opportunities risk facing significant economic losses and habitat destruction. Similarly, water scarcity can be mitigated by innovations in purification, desalination, and smart irrigation. Companies that neglect these innovations may encounter water shortages, agricultural decline, and associated health impacts.
Biodiversity loss, food security, and health impacts are other areas with substantial disruptive opportunities. Conservation technologies, vertical farming, and advanced health treatments can address these challenges while providing new market opportunities. Failing to innovate in these areas could lead to ecosystem collapse, food shortages, price spikes, and increased healthcare costs. Additionally, the energy transition towards advanced batteries and hydrogen fuel represents a critical shift. Companies that do not invest in these clean energy solutions may continue to rely on fossil fuels, exacerbating climate impacts.

Table 3.
Challenges of Mankind, Disruptive Opportunities of Transition and Risks.
| Challenge and Hidden Opportunities | Potential Scientific Innovation and Positive Disruption | Risks of Missing Outthe Opportunities |
| Climate Change: Renewable energy technologies, job creation, climate modeling advancements. | Advanced renewable energy tech, carbon capture, climate-resilient agriculture. | Severe weather events, economic loss, habitat loss. |
| Water Scarcity: Growth in water technology industries, improved agricultural productivity. | Efficient purification/desalination, smart irrigation, water recycling. | Water shortages, agricultural decline, health impacts. |
| Biodiversity Loss: Eco-tourism, sustainable agriculture, new pharmaceuticals. | Conservation tech, habitat restoration, genetic diversity preservation. | Ecosystem collapse, loss of ecosystem services. |
| Food Security: Increased efficiency, reduced wastage, sustainable supply chains. | Vertical farming, precision agriculture, resilient GM crops. | Food shortages, price spikes, malnutrition. |
| Health Impacts: Improved health outcomes, digital health market growth. | Advanced treatments, telemedicine, disease prediction/prevention tech. | Increased disease burden, healthcare costs, reduced life expectancy. |
| Energy Transition: Energy independence, reduced emissions, new clean energy | Advanced batteries, hydrogen fuel, smart grids. | Continued reliance on fossil fuels, climate impact. |
| Ocean Degradation: Sustainable fisheries, marine biotechnology, coastal protection. | Pollution control, sustainable aquaculture, ocean monitoring. | Marine ecosystem damage, economic loss for coastal communities. |
| Urbanization and Infrastructure: Improved urban living, efficient public transport. | Smart city tech, sustainable urban planning, resilient infrastructure. | Urban sprawling, water and sewage infrastructure strain, environmental degradation. |
| Economic Inequality: Empowerment, social entrepreneurship, poverty reduction. | Inclusive financial tech, digital inclusion, education access tools, equitable models. | Social unrest, economic disparity, missed growth opportunities. |
| Waste Management: Circular economies, sustainable packaging, landfill reduction. | Zero-waste circular economy prospects Advanced recycling, waste-to-energy, biodegradable materials. | Increased pollution, resource depletion, economic loss. |
| Biocapacity Degradation: Enhanced ecosystem services, carbon sequestration, productivity. | Sustainable land management, reforestation, soil restoration. | Reduced agricultural yields, increased emissions, habitat loss. |
| Resource Depletion: Conservation, alternative materials, sustainable supply chains. | Efficient extraction, circular economy business models and efficient resource management. | Resource scarcity, economic instability, environmental damage. |
| Conflict between Growth and Environment: Balanced growth, sustainable industries, environmental protection. | Green economic models, sustainable policies, impact assessments. Growth and high human development within the planetary capacity of earth. | Environmental degradation, unsustainable growth, social conflict. |
| Antibiotic Resistance: Medical research advancements, improved health outcomes. | New antibiotics, alternative treatments, rapid diagnostics. | Increased morbidity/mortality, higher healthcare costs, pandemics. |
| Political and Social Instability: Global cooperation, peace promotion, crisis management. | Conflict resolution tech, tech in humanitarian aid delivery, resilience programs. | Prolonged conflicts, migration crises, economic instability. |
Source: Compiled by author based on IPCC 2023.
Urbanization, waste management, and biocapacity degradation highlight the need for sustainable urban planning, zero-waste economies, and sustainable land management. Embracing these opportunities can lead to improved urban living and reduced environmental degradation. On the contrary, businesses that overlook these innovations risk contributing to urban sprawl, increased pollution, and resource depletion. Overall, the table emphasizes that the transition to sustainable practices is not only essential for environmental health but also presents significant opportunities for innovation and economic growth, while the failure to adapt poses substantial risks to long-term business viability and societal well-being.
Strengths of the Cartesian Framework in Sustainability Studies and Transition Management
Our study applies the Cartesian framework in sustainability studies and transition management, and this approach has several points of strength:
- Multidimensional Integration:
By incorporating both environmental (natural capital) and socio-economic dimensions on separate axes, the framework allows for a holistic view of sustainability that doesn't prioritize one aspect over the other.
- Quantification and Precision:
The Cartesian framework allows for precise quantification of sustainability impacts. By using normalized coordinates (-1 to 1), it provides a clear, measurable way to assess and compare different entities or strategies across various dimensions of sustainability.
- Visual Representation:
The two-dimensional plotting offers an intuitive visual representation of complex sustainability concepts. This makes it easier for stakeholders, including policymakers and business leaders, to grasp and communicate sustainability performance and goals.
- Comparative Analysis:
The framework facilitates easy comparison between different entities, strategies, or time periods. This can be particularly useful for benchmarking and identifying best practices or areas for improvement.
- Dynamic Tracking:
The coordinate system enables dynamic tracking of progress over time. Organizations can plot their trajectory, set specific targets, and visualize their sustainability journey.
- Flexibility and Scalability:
The framework can be applied at various scales—from individual products or projects to entire organizations or even countries. This scalability makes it a versatile tool for different contexts and purposes.
- Goal Setting and Strategic Planning:
The clear visual representation aids in setting concrete, quantifiable sustainability goals and planning strategic moves to achieve them.
- Identification of Trade-offs and Synergies:
By plotting different aspects of sustainability on separate axes, the framework helps identify potential trade-offs between environmental and social impacts, as well as areas where improvements in one dimension might synergistically benefit the other.
- Compatibility with Data-Driven Approaches:
The quantitative nature of the framework aligns well with modern data-driven decision-making processes, allowing for integration with analytics and machine learning techniques.
- Standardization Potential:
If widely adopted, this approach could provide a standardized method for reporting and comparing sustainability performance across different organizations or sectors.
- Educational Tool:
The visual and quantitative nature of the framework makes it an effective educational tool for teaching complex sustainability concepts.
- Policy Formulation Aid:
For policymakers, the framework offers a structured way to assess the impacts of different policies and visualize desired outcomes.
- Integration of Business Models:
The specific application integrates different business models within the framework, providing a unique perspective on how organizational strategies relate to sustainability outcomes.
- Transition Pathway Visualization:
The framework allows for clear visualization of transition pathways from current states to desired future states of sustainability.
These strengths collectively make the Cartesian framework a powerful tool for advancing sustainability studies and transition management. Its ability to provide clear, quantifiable, and visually intuitive representations of complex sustainability concepts is particularly valuable in a field where communicating and operationalizing abstract ideas is often challenging.
Use Cases of Circular-ESG Model and Role of Technology and Innovations
The Circular-ESG model plays a crucial role in critically evaluating and validating common perceptions about the sustainability of technologies like solar energy and electric vehicles (EVs). While these technologies are widely regarded as environmentally friendly solutions, a nuanced approach reveals the complexities of their lifecycle impacts. The Circular-ESG framework integrates circular economy principles with Environmental, Social, and Governance (ESG) criteria, offering a holistic assessment that goes beyond superficial evaluations. By considering factors such as material sourcing, production processes, and end-of-life disposal, the model provides a realistic and comprehensive view of sustainability. This analysis of this section helps to identify areas where these technologies excel and where they fall short, promoting continuous improvement and more informed decision-making. By challenging common perceptions and highlighting both the strengths and weaknesses of solar energy and EVs, the Circular-ESG model fosters a deeper understanding of sustainability, encouraging the adoption of more robust and genuinely sustainable practices.
- Solar Energy
Solar energy, recognized for its potential to provide clean and renewable power, presents a nuanced picture within the Circular-ESG model. This model integrates circular economy principles with ESG criteria, offering a holistic approach to sustainability. Solar energy's lifecycle impacts and the degree of circular economy and ESG integration determine its position in the Circular-ESG Cartesian dynamic model.
- Quadrant I (Q1 - Circular-ESG:
Strong circular economy practices and robust ESG integration; example, a solar plant designing panels and inverters for longevity, repairability, and recyclability, ensuring fair labor practices, community engagement, and transparent governance. Sustainability coordinates: (0.6, 0.5), indicating positive social and environmental outcomes.
- Quadrant II (Q2) - Circular:
Strong circular economy practices but weak ESG integration, example, a plant focusing on recycling and resource efficiency but neglecting social impacts and governance. Sustainability coordinate (-0.3, 0.4), indicating positive environmental but weaker social outcomes.
- Quadrant III (Q3) - Open Loop Linear:
No circular economy practices or ESG integration; a solar plant with limited recyclability and poor social and governance practices. Sustainability coordinates (-0.2, -0.4), indicating negative social and environmental outcomes, though better than fossil fuels.
- Quadrant IV (Q4) - ESG-Open-Loop Linear:
Strong ESG practices but no circular economy integration; example, a solar plant ensuring fair labor practices and community benefits but using non-recyclable materials. Sustainability coordinate (0.2, -0.3), indicating positive social but negative environmental outcomes.
Lifecycle Impacts: A comprehensive analysis must consider the entire lifecycle of solar energy systems:
- -
- Production: Circular practices mitigate environmental impacts through sustainable materials and recyclability. Strong ESG practices ensure fair wages, safe conditions, and community engagement.
- -
- Operation: Solar energy reduces greenhouse gas emissions and creates jobs, though weak ESG practices can cause social issues.
- -
- End-of-Life: Circular practices minimize environmental impact through recycling and repurposing, creating jobs and reducing community impacts.
- -
- Strategies for Improvement: To move towards Q1 (Circular-ESG):
- -
- Substitution: Use recyclable materials for panels and batteries.
- -
- Transformation: Implement modular designs for easy repair and recycling.
- -
- Offsets for Negative Externalities (ONEs): Invest in reforestation or/and community development programs.
The Circular-ESG model offers a robust framework for enhancing the sustainability of solar energy by integrating circular economy principles with strong ESG practices, aiming for a regenerative future.
- 2.
- Electric Vehicles
Electric Vehicles (EVs) are often touted as a sustainable alternative to traditional combustion engine vehicles. However, their true sustainability depends on various factors throughout their lifecycle. The Circular-ESG model provides a comprehensive framework to assess and improve the sustainability of EVs by integrating circular economy principles with ESG criteria.
- Quadrant I (Q1) - Circular-ESG:
Strong circular economy practices and robust ESG integration; example, an EV manufacturer designing vehicles for longevity, repairability, and recyclability, using sustainably sourced materials, ensuring fair labor practices, promoting community engagement, and maintaining transparent governance.
Sustainability coordinates: (0.7, 0.6), indicating positive social and environmental outcomes.
- Quadrant II (Q2) - Circular:
Strong circular economy practices but weak ESG integration; example, an EV company focusing on battery recycling and resource efficiency but neglecting social impacts and governance issues in their supply chain.
Sustainability coordinates: (-0.2, 0.5), indicating positive environmental but weaker social outcomes.
- Quadrant III (Q3) - Open Loop Linear:
No circular economy practices or ESG integration; an EV manufacturer with limited recyclability of components, poor labor practices in battery mineral sourcing, and opaque governance.
Sustainability coordinates: (-0.3, -0.3), indicating negative social and environmental outcomes, though potentially still better than traditional vehicles.
- Quadrant IV (Q4) - ESG-Open-Loop Linear:
Strong ESG practices but no circular economy integration; example, an EV company ensuring fair labor practices and community benefits but using non-recyclable materials and energy-intensive production processes.
Sustainability coordinates: (0.4, -0.2), indicating positive social but negative environmental outcomes.
- Lifecycle Impacts:
A comprehensive analysis must consider the entire lifecycle of EVs:
Production: Circular practices can mitigate environmental impacts through sustainable material sourcing, recyclable components, and energy-efficient manufacturing. Strong ESG practices ensure fair wages, safe working conditions, and responsible sourcing of battery materials.
Operation: EVs reduce direct emissions during use, but their overall impact depends on the source of electricity. Strong ESG practices ensure ethical charging infrastructure development and fair pricing.
End-of-Life: Circular practices minimize environmental impact through battery recycling, component reuse, and vehicle repurposing, creating jobs and reducing waste.
Strategies for Improvement (Moving towards Q1 Circular-ESG):
- Substitution (S):
Replace rare earth metals in batteries with more abundant, sustainably sourced materials.
Use recycled plastics and metals in vehicle components.
- Transformation (T):
Implement modular designs for easy repair, upgrade, and recycling.
Develop battery-as-a-service models to enhance lifecycle management.
Transition to renewable energy sources for manufacturing and charging.
- Offsets for Negative Externalities (ONEs):
Invest in responsible mining practices and community development in battery material sourcing regions.
Implement carbon offset programs for manufacturing emissions.
Develop programs for repurposing used EV batteries for energy storage.
The Circular-ESG model offers a robust framework for enhancing the sustainability of EVs by integrating circular economy principles with strong ESG practices. It highlights areas for improvement across the entire lifecycle, from responsible material sourcing to end-of-life recycling, while also considering social and governance aspects. By striving towards Quadrant I, EV manufacturers can move beyond mere emission reduction during use and towards a truly regenerative approach to transportation.
This analysis demonstrates how the Circular-ESG model can be applied to a complex product like EVs, considering multiple aspects of sustainability and providing a roadmap for continuous improvement. It also highlights the model's utility in identifying and addressing potential sustainability trade-offs in emerging technologies.
- 3.
- Regenerative and Degenerative Businesses
The Circular-ESG model provides a nuanced framework for assessing businesses that may be regenerative by origin but degenerative by process, as well as those that are degenerative in both origin and process. This analysis integrates circular economy principles with ESG criteria, offering a holistic approach to sustainability assessment and improvement.
- Quadrant I (Q1) - Circular-ESG:
Strong circular economy practices and robust ESG integration; example, a solar panel manufacturer using recycled materials, ensuring fair labor practices, and implementing closed-loop production systems. Sustainability coordinates: (0.7, 0.8), indicating strong positive social and environmental outcomes.
- Quadrant II (Q2) - Circular:
Strong circular economy practices but weak ESG integration; example, an EV company focusing on battery recycling and energy efficiency but neglecting social impacts in their supply chain. Sustainability coordinates: (-0.2, 0.6), indicating positive environmental but weaker social outcomes.
- Quadrant III (Q3) - Open Loop Linear:
No circular economy practices or ESG integration; example, a traditional fossil fuel company with limited environmental considerations and poor labor practices. Sustainability coordinates: (-0.8, -0.7), indicating significant negative social and environmental outcomes.
- Quadrant IV (Q4) - ESG-Open-Loop Linear:
Strong ESG practices but no circular economy integration; example, a fossil fuel company investing in community development and fair labor practices but continuing environmentally harmful extraction methods. Sustainability coordinates: (0.4, -0.6), indicating positive social but negative environmental outcomes.
Lifecycle Impacts: A comprehensive analysis must consider the entire lifecycle of these businesses:
Production: For regenerative businesses, circular practices can mitigate environmental impacts of production. For degenerative businesses, the focus is on minimizing harm and transitioning to more sustainable practices.
Operation: Regenerative businesses like solar energy reduce environmental impact during operation, while degenerative businesses like fossil fuels continue to have negative impacts.
End-of-Life: Circular practices in regenerative businesses can ensure products are recycled or repurposed. Degenerative businesses must focus on responsible decommissioning and environmental restoration.
- Strategies for Improvement:
- To move towards Q1 (Circular-ESG):
- For Regenerative by Origin Businesses:
Substitution: Use more sustainable materials in production processes.
Transformation: Implement closed-loop systems and renewable energy in manufacturing.
Offsets for Negative Externalities (ONEs): Invest in environmental restoration projects.
- For Degenerative by Origin Businesses:
Substitution: Gradually replace fossil fuels with renewable energy sources.
Transformation: Invest in new technologies for cleaner extraction and processing.
Offsets for Negative Externalities (ONEs): Implement comprehensive carbon offset programs and community development initiatives.
The Circular-ESG model offers a robust framework for assessing and improving the sustainability of both regenerative and degenerative businesses. It highlights the importance of considering both the origin and processes of businesses in sustainability assessments. By striving towards Quadrant I, businesses can move beyond their initial categorizations and towards truly regenerative practices that benefit both the environment and society.
This analysis demonstrates the versatility of the Circular-ESG model in addressing complex business scenarios, providing a roadmap for continuous improvement regardless of a business's starting point. It also underscores the model's utility in identifying potential areas for transformation in industries traditionally considered unsustainable.
- 4.
- Role of Technology and Innovations
Substitution (S): Technology and innovation play a crucial role in substitution by providing sustainable alternatives to traditional, often harmful materials and processes. Advanced materials science enables the development of recyclable and biodegradable materials that can replace plastics and other non-renewable resources in production. For example, innovations in battery technology are leading to the use of more abundant and less environmentally damaging materials, such as silicon and sodium, instead of rare earth metals like lithium and cobalt. These substitutions are vital for reducing the environmental footprint of manufacturing processes and products, contributing significantly to the shift towards more sustainable practices. Additionally, renewable energy technologies such as solar and wind power are essential substitutions for fossil fuels, reducing greenhouse gas emissions and promoting cleaner energy production.
Transformation (T): Technology and innovation are equally important in transformation by enabling the redesign of products and processes for enhanced sustainability. Circular economy principles are greatly supported by innovations in modular design, which facilitate easy repair, upgrade, and recycling of products, thereby extending their lifecycle and reducing waste. For instance, the development of modular electric vehicle (EV) batteries allows for individual cells to be replaced or upgraded, rather than discarding the entire battery. Furthermore, advancements in digital technologies such as the Internet of Things (IoT) and artificial intelligence (AI) are transforming manufacturing and supply chain processes, making them more efficient and less resource intensive. These technologies help optimize resource use, monitor environmental impacts in real-time, and improve decision-making processes, all of which are crucial for achieving a transition to Quadrant I (Q1) in the Circular-ESG model.
- Transition to Q1
The transition to Quadrant I (Q1) in the Circular-ESG model, which represents strong circular economy practices and robust ESG integration, heavily relies on continuous technological advancements and innovative solutions. Cutting-edge technologies facilitate the adoption of circular economy principles by enabling closed-loop systems where materials are continuously reused and recycled. Innovations such as advanced recycling technologies, which can efficiently process mixed materials and recover high-purity resources, are essential for minimizing waste and reducing the extraction of virgin materials. Additionally, blockchain technology enhances transparency and traceability in supply chains, ensuring that ESG practices are upheld throughout the production and distribution processes. By leveraging these technological innovations, businesses can not only improve their sustainability performance but also gain competitive advantages, making the transition to Q1 not only feasible but also economically beneficial.
Concluding Remarks
Segment A of the framework represents the real-world situation in any country or region where different types of business models, households, organizations, and policies coexist simultaneously. Each type can be depicted in segment B by specific coordinates within the defined limits, representing their varying impacts on natural and social systems.
For example, a country might be represented in the Upper Left Quadrant (Y > 0, X < 0) with coordinates like (0.8, -0.6), indicating strong socio-economic development but significant environmental impacts. A household practicing minimal composting and recycling might fall in the lower left quadrant with coordinates like (-0.4, -0.3). An organization implementing green technologies but lacking strong social policies might be in the lower right quadrant with coordinates like (0.5, -0.2).
The integrated, multidisciplinary, and dynamic framework for anchoring sustainability studies is designed to navigate the complex interplay between economic growth, environmental sustainability, and social equity. This framework is articulated through four key segments, each addressing a vital aspect of sustainable development.
The framework addresses potential criticisms by balancing economic growth with sustainability. It emphasizes innovation and technological advancements as key drivers of sustainable development, countering concerns that ecological limits may restrict economic progress. By showcasing examples where sustainable practices have led to economic benefits, the framework advocates for a transition that enhances long-term resilience, reduces environmental risks, and fosters equitable growth. This approach ensures that sustainability is seen not as a constraint, but as an opportunity for innovation and prosperity.
The framework provides a comprehensive roadmap for businesses, organizations and policymakers to navigate the complexities of sustainable development. It underscores the need for a balanced approach that integrates economic, social, and environmental dimensions, promoting a just transition towards regenerative practices. By setting clear targets and stages, and using a dynamic coordinate system to map impacts, the framework offers a practical tool for achieving high human development within the planet's ecological limits. This holistic perspective encourages continuous improvement and innovation, ensuring that sustainability becomes an integral part of business strategy and societal progress.
Future Research Pathways
In future research, several useful pathways can be taken in the application of the Cartesian framework in sustainability studies and transition management:
Methodological Refinement and Empirical Validation:
Refinement of the Cartesian framework can involve further validating and calibrating the coordinate system across different sectors and scales. Developing standardized metrics for measuring and plotting various sustainability aspects will enhance the framework’s precision. Additionally, conducting large-scale empirical studies to test its applicability across diverse industries and geographical regions will provide valuable insights. Analyzing longitudinal data will help assess the model's effectiveness in tracking sustainability transitions over time.
- Integration with Existing Tools and Technologies:
Investigating how the Cartesian framework can complement or enhance existing sustainability assessment tools like Life Cycle Assessment (LCA) or Environmental, Social, and Governance (ESG) ratings can offer new perspectives and synergies. The potential for integrating this framework with emerging technologies like blockchain for transparent sustainability reporting is also promising. Furthermore, exploring the use of artificial intelligence and machine learning to predict sustainability trajectories based on current coordinates will advance data-driven decision-making processes.
- Policy Impact Analysis and Sector-Specific Adaptations:
Exploring the framework's potential for assessing the impact of different policy interventions on sustainability outcomes is crucial. Developing case studies on how policymakers can use this tool for evidence-based decision-making will enhance its practical relevance. Tailoring the framework for specific sectors, such as energy, agriculture, and manufacturing, will address unique sustainability challenges and opportunities, providing sector-specific insights.
- Stakeholder Engagement and Educational Applications:
Studying how different stakeholders, including businesses, governments, and NGOs, interpret and use the framework will shed light on its influence on decision-making processes. Developing educational modules and case studies based on the framework for sustainability education at various levels will enhance its educational value and broaden its impact.
- Interdisciplinary Expansion and Dynamic Systems Modeling:
Exploring how the framework can bridge gaps between different disciplines in sustainability science will foster more integrated approaches. Incorporating dynamic systems modeling to capture the complex interactions between different sustainability dimensions over time will provide a more comprehensive understanding of sustainability transitions.
- Scenario Planning and Cultural Contextual Factors:
Utilizing the framework for scenario planning and forecasting future sustainability states under different conditions will enhance strategic planning capabilities. Investigating how cultural and contextual factors influence the interpretation and application of the framework in different global settings will ensure its adaptability and relevance in diverse contexts.
- Alignment with SDGs and Comparative Analysis:
Exploring how the framework can be aligned with or used to track progress towards the UN Sustainable Development Goals (SDGs) will enhance its strategic relevance. Conducting comparative studies between this Cartesian approach and other sustainability frameworks will identify strengths, weaknesses, and potential synergies, contributing to the ongoing development of sustainability assessment tools.
These future research pathways will help refine, validate, and expand the application of the Cartesian framework in sustainability studies and transition management, enhancing its effectiveness and utility in various contexts.
Acknowledgments
This work has benefited from numerous feedback by my students and peers and internet resources and literature, but the following references need special mentioning.
Appendices
Appendix A1. Transition Example
Greentech Manufacturing Inc. Sustainability Transition
Company Overview: Greentech Manufacturing Inc. is a mid-sized company producing eco-friendly consumer electronics. The company aims to transition from a traditional linear business model to a circular closed-loop ESG model.
Initial Assessment: Using the coordinate system, Greentech assesses its current sustainability status. The horizontal axis (X) represents social and economic impacts, and the vertical axis (Y) represents environmental impacts. The coordinates range from -1 to 1, where negative values indicate detrimental impacts and positive values indicate beneficial impacts.
Initial Position: Greentech is currently operating under a Linear Open-loop model with basic sustainability measures. It focuses on short-term profit maximization with minimal environmental and social considerations.
Coordinates: (-0.4, -0.3)
Setting Goals: Greentech sets a goal to move towards a Circular Closed-loop ESG model within the next five years, aiming to achieve positive impacts on both social/economic and environmental dimensions.
Target Coordinates: (0.8, 0.7)
Mapping Progress: To map its progress, Greentech establishes Key Performance Indicators (KPIs) for each axis and tracks them annually.
Year 1: Social/Economic Initiatives: Implementing fair labor practices and improving employee benefits.
Environmental Initiatives: Starting a recycling program and reducing energy consumption in manufacturing.
New Position: Coordinates: (-0.2, 0.0)
Year 2: Social/Economic Initiatives: Launching community development projects and increasing stakeholder engagement.
Environmental Initiatives: Using renewable energy sources and reducing water usage.
New Position:
Coordinates: (0.1, 0.2)
Year 3: Social/Economic Initiatives: Creating educational programs for employees and local communities.
Environmental Initiatives: Enhancing product design for durability and recyclability.
New Position: Coordinates: (0.4, 0.4)
Year 4: Social/Economic Initiatives: Developing a robust supply chain sustainability program.
Environmental Initiatives: Achieving zero waste in production processes.
New Position:
Coordinates: (0.6, 0.5)
Year 5: Social/Economic Initiatives: Establishing a comprehensive ESG governance structure.
Environmental Initiatives: Fully integrating circular economy principles and achieving net-zero emissions.
Final Position:
Coordinates: (0.8, 0.7)
Summary of transition results:
Initial Position: (-0.4, -0.3) - Linear Open-loop Model
Yearly Positions:
Year 1: (-0.2, 0.0)
Year 2: (0.1, 0.2)
Year 3: (0.4, 0.4)
Year 4: (0.6, 0.5)
Year 5: (0.8, 0.7) - Circular Closed-loop ESG Model
Greentech starts in the lower left quadrant (negative impact on both axes).
Yearly Improvements: Each year, Greentech makes specific initiatives to improve its social, economic, and environmental impacts.
Final Position: By Year 5, Greentech reaches its target, operating within the positive quadrant for both social/economic and environmental impacts.
This hypothetical example demonstrates how Greentech Manufacturing Inc. can use the dynamic framework and coordinate system to map its sustainability progress, set clear targets, and measure annual improvements.
Please also refer to S (substitutions) and T (transformation) strategies in Appendix A2.
Appendix A2. Quadrants Specific RHD Maximization
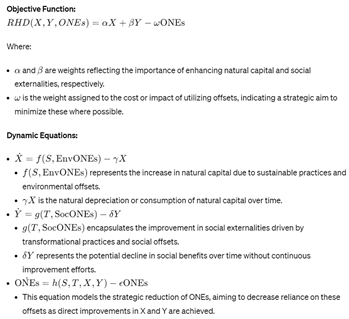
- RHD Maximization - Quadrant I
For Quadrant I, where both natural capital (X) and social externalities (Y) are positive, the focus of Regenerative Humane Development (RHD) maximization involves enhancing these already positive impacts while strategically utilizing and reducing dependence on Offsets for Negative Externalities (ONEs). Let’s detail the model for RHD maximization in this ideal quadrant.
- RHD Maximization - Quadrant II
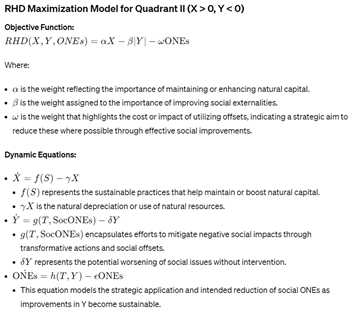
For Quadrant II, where natural capital (X) is positive but social externalities (Y) are negative, the focus of Regenerative Humane Development (RHD) maximization involves sustaining and enhancing the positive environmental conditions while actively working to improve the negative social externalities. This involves strategic application of social Offsets for Negative Externalities (ONEs) and transformative social policies.
- RHD Maximization - Quadrant III
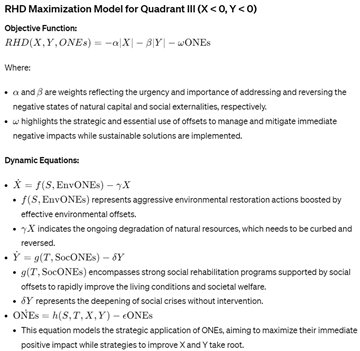
For Quadrant III, where both natural capital (X) and social externalities (Y) are negative, the challenge is considerable. The goal of Regenerative Humane Development (RHD) maximization in this quadrant is to transform both negative conditions into positive ones. This requires comprehensive and intensive regenerative and rehabilitative strategies across both environmental and social dimensions, with a strong reliance on effective Offsets for Negative Externalities (ONEs) to stabilize conditions during the transition.
- RHD Maximization - Quadrant IV
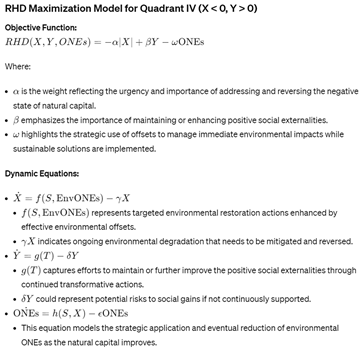
For Quadrant IV, where natural capital (X) is negative and social externalities (Y) are positive, the goal of Regenerative Humane Development (RHD) maximization involves improving the environmental conditions while maintaining or enhancing the positive social outcomes. This requires focused environmental restoration efforts coupled with maintaining the social gains already achieved.
References
- BIS (2020), Bolton, Patrick et.al. "The Green Swan: Central banking and financial stability in the age of climate change".
- ChatGPT version 4-o utilized for validation of model details and data extraction and usage.
- Chichilnisky, Graciela (1995) "An axiomatic approach to sustainable development" Online at http://mpra.ub.uni-muenchen.de/8609/.
- Elkington, J. (2020). Green Swans: The Coming Boom in Regenerative Capitalism. Fast Company Press.
- GGGI (2023) Geen Growth Index 2023. https://gggi.org/report/green-growth-index-2023/.
- Global Footprint Network (2024) “Sustainable Development” HDI and Ecological Footprint https://www.footprintnetwork.org/our-work/sustainable-development/.
- IPCC (2023) “Panel on Climate Change Sixth Assessment Report (AR6)” https://www.ipcc.ch/report/sixth-assessment-report-cycle/.
- Mang, P., & Reed, B. (2012). Designing from Place: A Regenerative Framework and Methodology. Building Research & Information, 40(1), 23-38. [CrossRef]
- Raworth, K. (2017). Doughnut Economics: Seven Ways to Think Like a 21st-Century Economist. London: Random House Business.
- Rockström, J., Steffen, W., Noone, K., Persson, Å., Chapin III, F. S., Lambin, E. F., … & Nykvist, B. (2009). Planetary boundaries: Exploring the safe operating space for humanity. Ecology and Society, 14(2).
- SRC (2023) Planetary Boundaries, Stockholm Resilience Center https://www.stockholmresilience.org/research/planetary-boundaries.html.
- Stahel, W. R. (2019). The Circular Economy: A User’s Guide. 1st Edition. London: Routledge. [CrossRef]
- UNDP (2024) Human Development Report 2023- https://hdr.undp.org/content/human-development-report-2023-24.
- United Nations (2024), The Sustainable Development Goals Report 2024, https://unstats.un.org/sdgs/report/2024/.
Figure 1.
Integrated, Multidisciplinary and Dynamic Framework for Sustainability Studies. Source: Developed by author.
Figure 1.
Integrated, Multidisciplinary and Dynamic Framework for Sustainability Studies. Source: Developed by author.

Figure 2.
The deeper stages of sustainability transition. Key Features of Deeper Levels. Source: Prepared by author.
Figure 2.
The deeper stages of sustainability transition. Key Features of Deeper Levels. Source: Prepared by author.
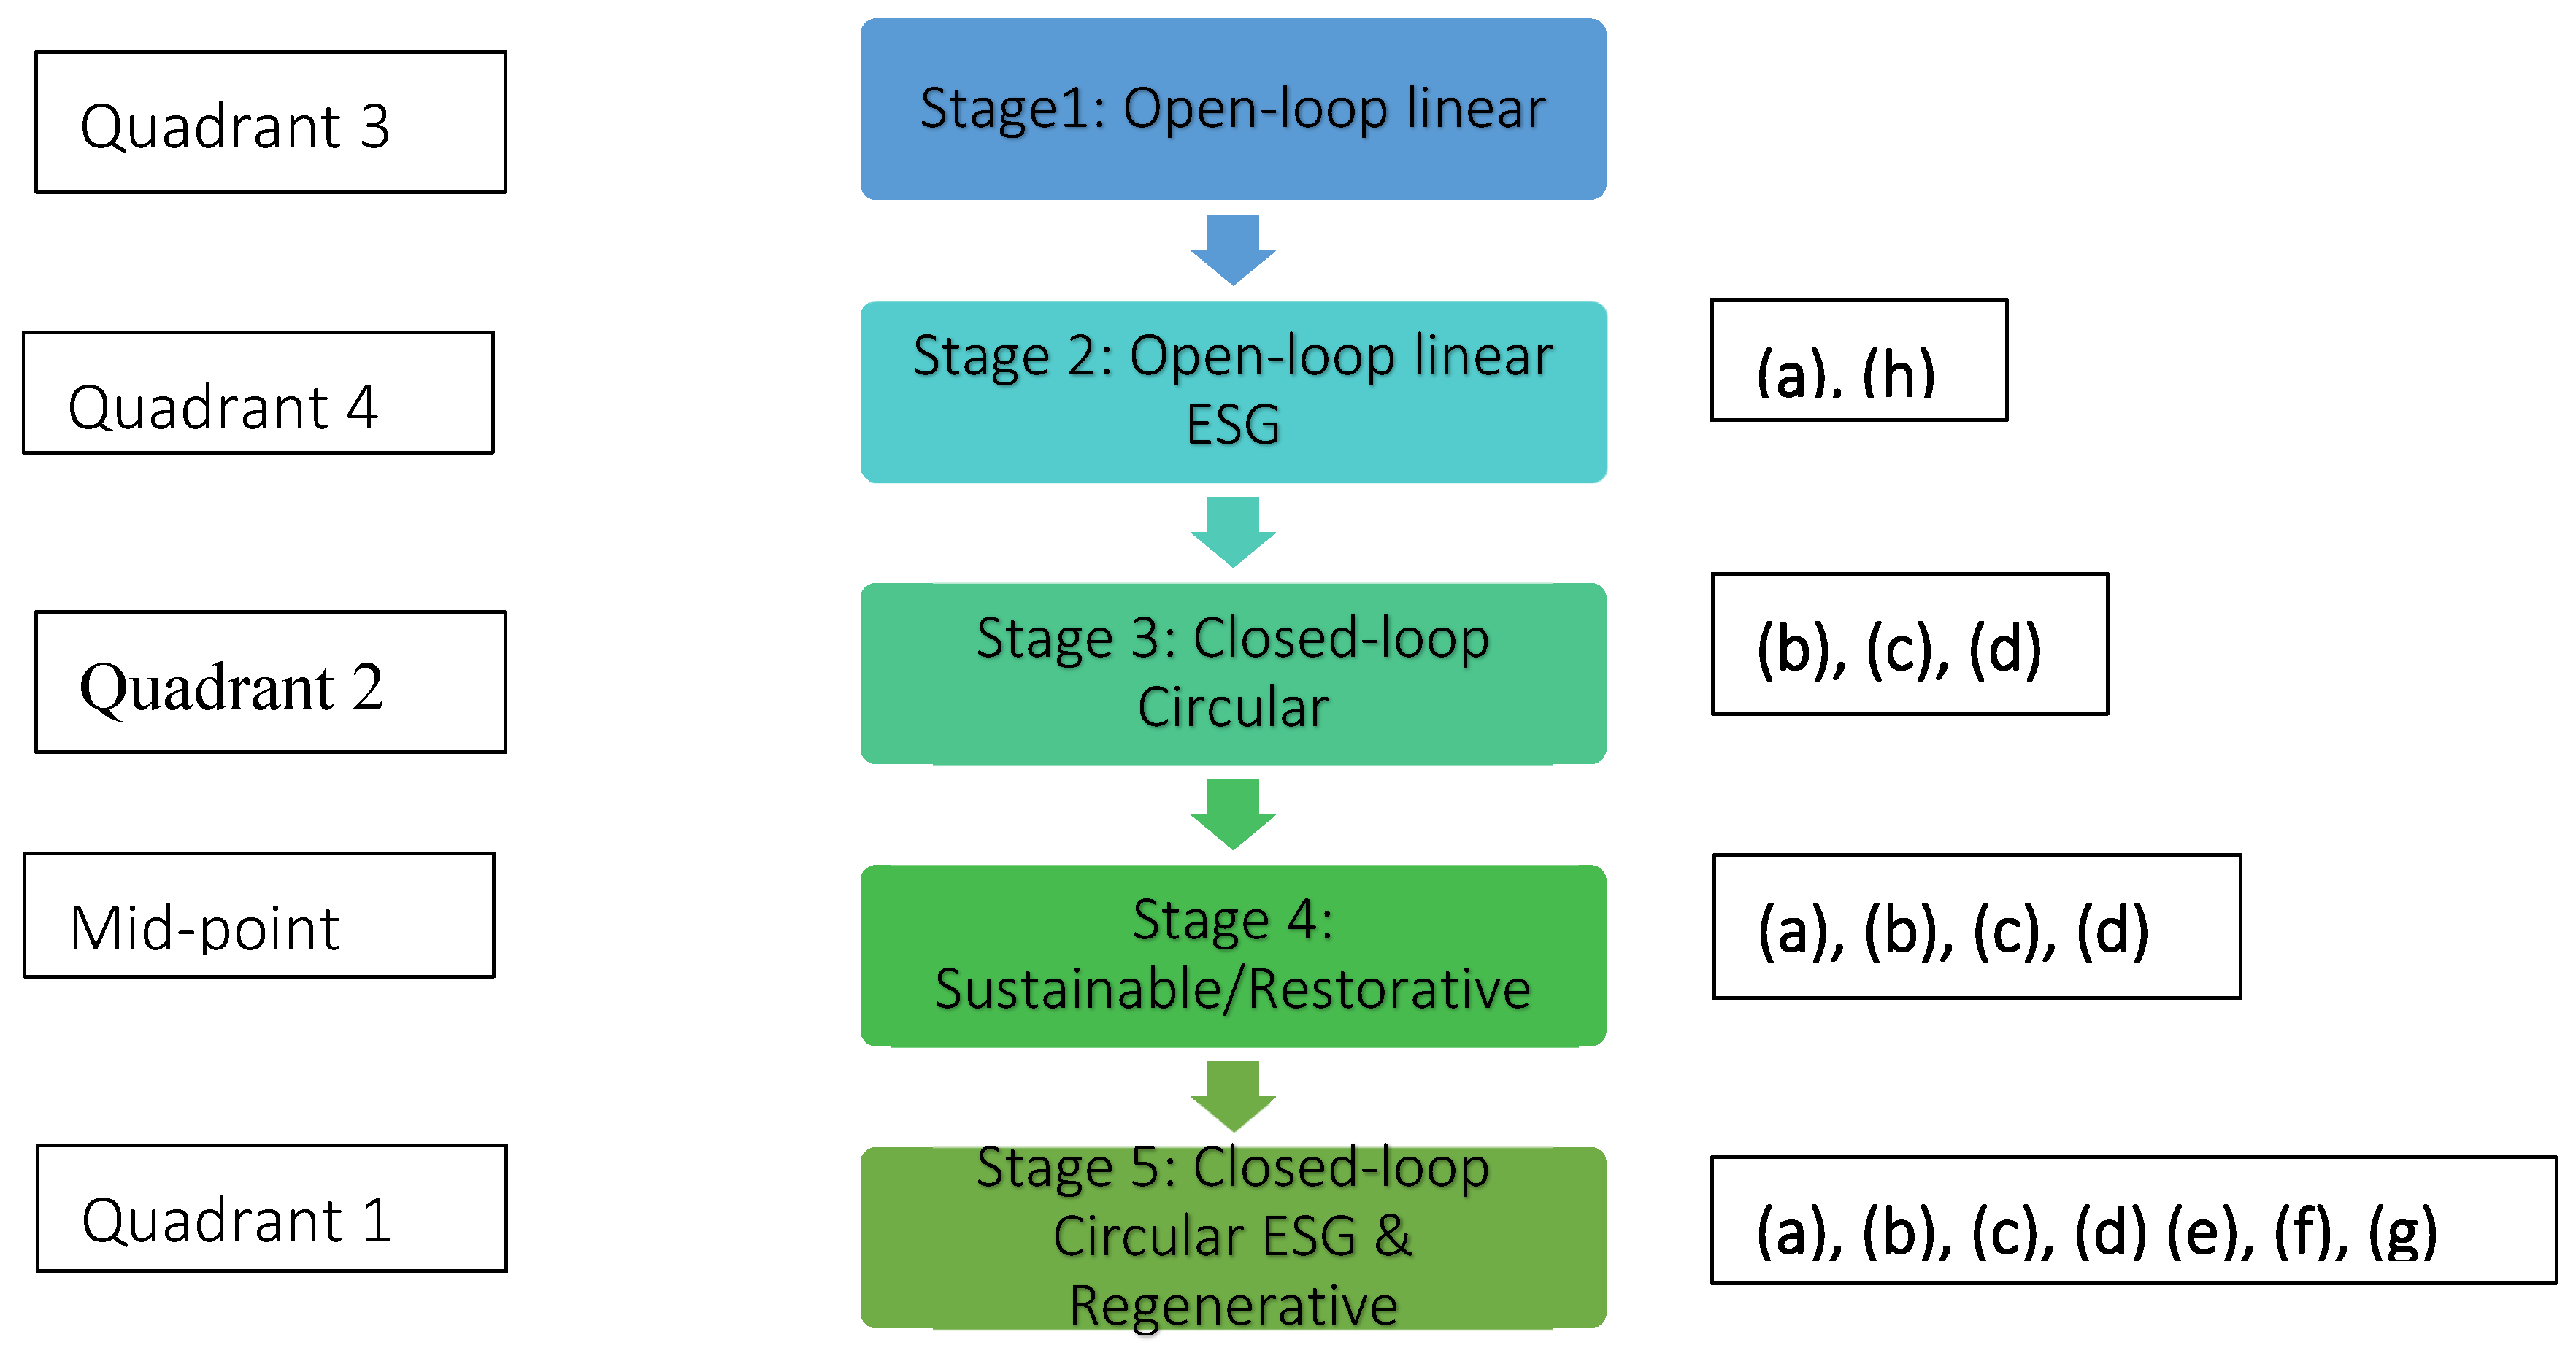
Figure 3.
Risks of alternative business models. Source: Prepared by author.
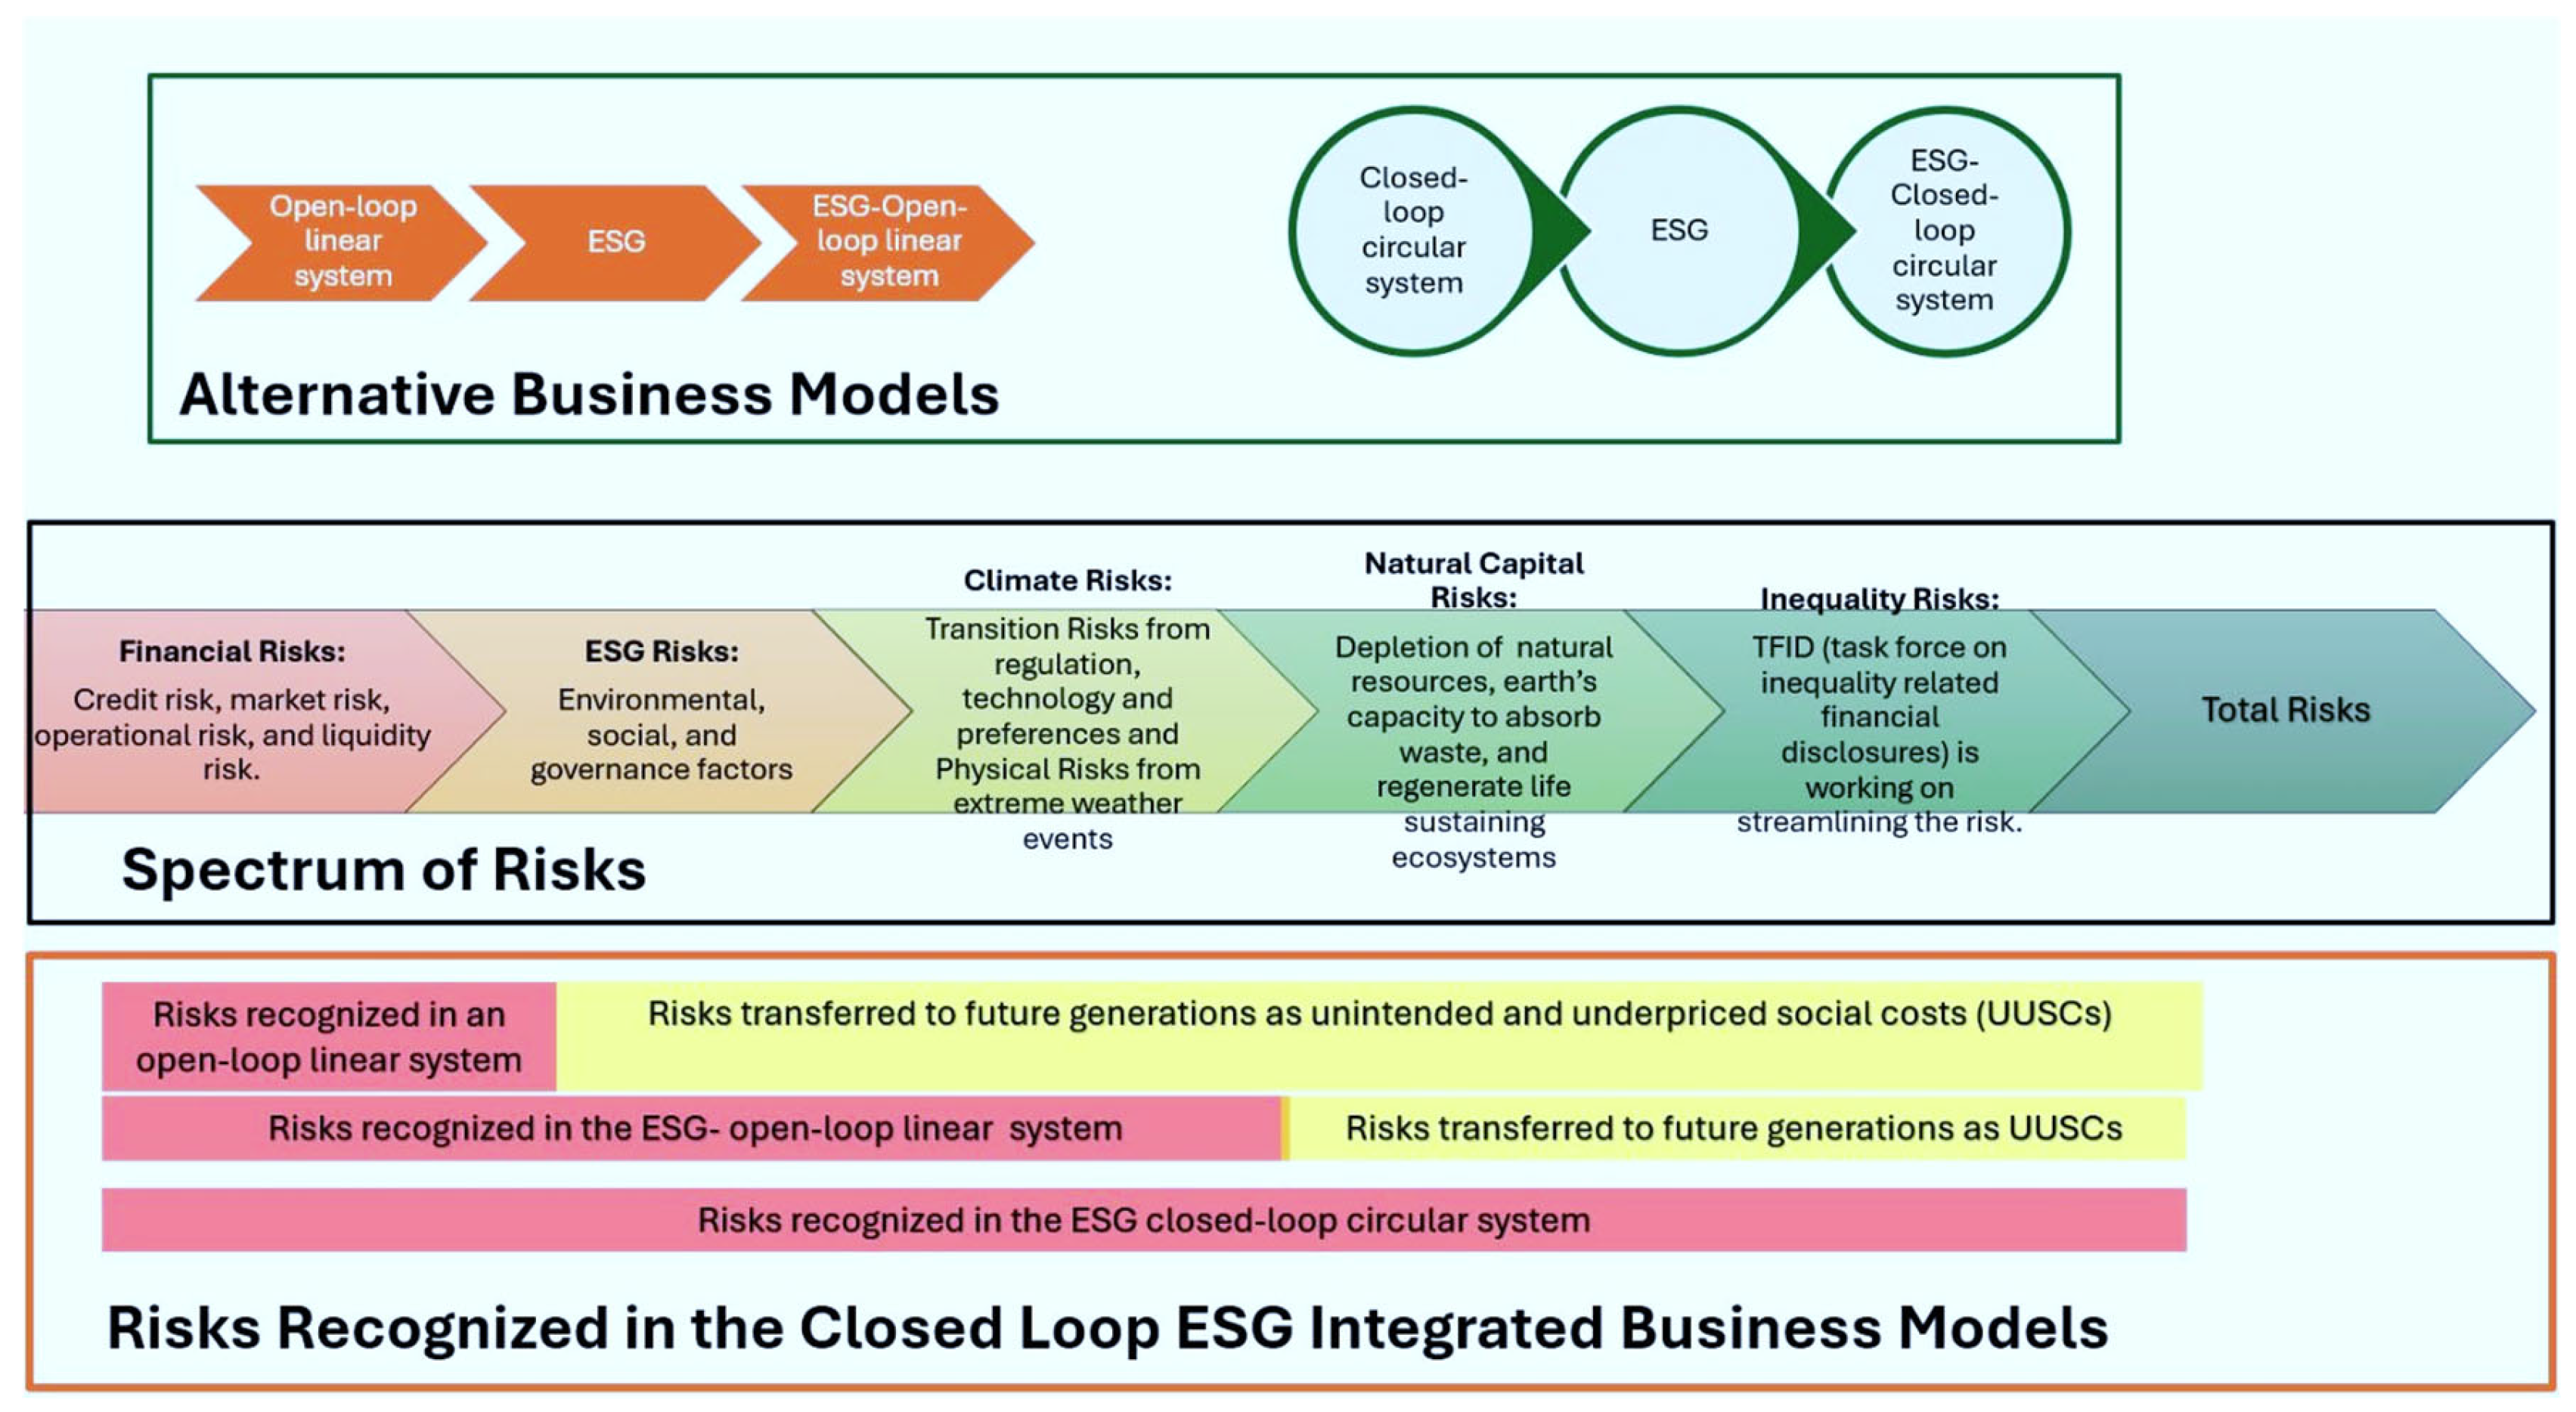
Table 1.
Pivots of business models.
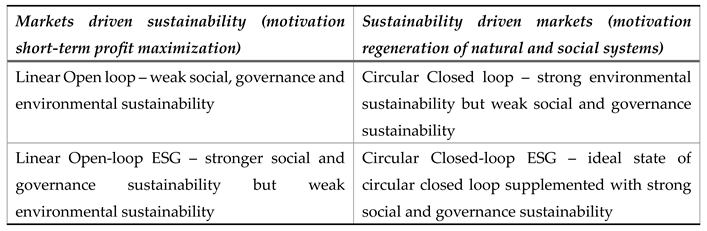
Table 2.
Model specification.
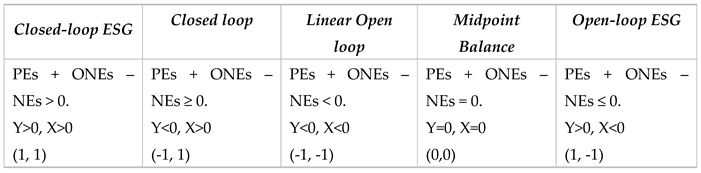
Table 3.
Destinations of Closing the Loop of Negative Externalities.
Disclaimer/Publisher’s Note: The statements, opinions and data contained in all publications are solely those of the individual author(s) and contributor(s) and not of MDPI and/or the editor(s). MDPI and/or the editor(s) disclaim responsibility for any injury to people or property resulting from any ideas, methods, instructions or products referred to in the content. |
© 2024 by the authors. Licensee MDPI, Basel, Switzerland. This article is an open access article distributed under the terms and conditions of the Creative Commons Attribution (CC BY) license (http://creativecommons.org/licenses/by/4.0/).
Copyright: This open access article is published under a Creative Commons CC BY 4.0 license, which permit the free download, distribution, and reuse, provided that the author and preprint are cited in any reuse.


