
Submitted:
15 July 2024
Posted:
15 July 2024
You are already at the latest version
Abstract
The National Institute of Health Stroke Scale (NIHSS) is used worldwide to classify stroke severity as ‘mild’, ‘moderate’ or ‘severe’ based on neurological impairment. Yet stroke survivors argue that the classification of ‘mild’ does not represent the holistic experience and impact of stroke on their daily lives. In this observational cohort study, we aimed to identify different types of impairment among stroke survivors classified as mild. We used mild stroke survivors’ data from the START longitudinal stroke cohort (n=73) with measures related to sensorimotor, cognition, depression, functional disability, physical activity, work and social adjustment over 12 months. Given the multi-source, multi-granular and unlabelled nature of data, we utilised a structure-adapting, unsupervised machine learning approach, the Growing Self-organising Map (GSOM) algorithm to generate distinct clinical profiles. These diverse impairment profiles revealed that mild stroke survivors experience varying degrees of impairment and impact (cognitive, depression, physical activity, work/social adjustment) at different time points, despite the uniformity implied by their NIHSS-classified ‘mild’ stroke. This emphasises the necessity of creating a holistic and comprehensive representation of mild stroke survivors’ needs over the first-year post-stroke to improve rehabilitation and post-stroke care.
Keywords:
mild stroke
; artificial intelligence
; patient profiling
; unsupervised learning
; personalized healthcare
1. Introduction
Despite the largely preventable nature of stroke, it remains the second-leading cause of death and disability in 2019 and is likely to continue [1]. Stroke is a complex condition with variable impairments, yet stroke patients are often classified in an overall sense as ‘mild’, ‘moderate’ or ‘severe’ [2]. This categorization is typically established using the National Institutes of Health Stroke Scale [NIHSS], which is a widely used assessment tool designed to measure neurological impairments in stroke survivors [2]. The NIHSS is used to screen for neurological impairment across multiple domains, such as consciousness, movement, and language using 11 items, and was designed for use primarily in the acute phase post-stroke [3]. The overall score is interpreted as a score of neurological stroke severity according to the following groupings: 0-4 as mild stroke, 5-15 as moderate stroke, 16-20 as moderate to severe stroke and 21-42 as severe stroke [4]. This classification often remains with the stroke survivor in later stages of recovery.
Yet ‘mild’ stroke survivors often argue the classification of ‘mild’ does not correspond with their daily experiences, as they report depression and difficulties in advanced physical and social activities, leading to a diminished quality of life [5]. Moreover, studies show that persons with mild stroke struggle to cope with the consequences of stroke, experience difficulties in everyday life [6], and may undergo persistent disability and difficulty with complex activities [7]. While it is recognized that the NIHSS is a valid and reliable screening measure, it has been reported that many acute stroke survivors with mild classification by NIHSS, could have been easily overlooked for intensive rehabilitation therapy [8].
Given the complexity of physical, psychological and social burdens associated with stroke, it is important to measure the holistic impact of impairment and recovery following stroke to achieve targeted and personalised care [9]. This is particularly important for stroke survivors classified as ‘mild’, as mild stroke survivors may be investigated less due to the assumption that they are expected to regain their premorbid functionality with minimal or no intervention. This is despite evidence that even mild symptoms could impact the ability to perform daily activities and household chores [10]. Given the physical, social, emotional and functional burden experienced by persons with mild stroke and considering the common practice of using only the NIHSS to classify stroke severity, further investigation of the latent impairments associated with ‘mild’ stroke survivorship is required, thus posing the question ‘Is mild really mild?’.
In this study, our objective is to identify groupings of mild stroke survivors based on their cognitive, mood, social, physical abilities and quality of life, to analyse variations in their post-stroke experiences. We utilise a profile of outcome measures that have been developed to evaluate various aspects of stroke, including motor skills, sensory perception, cognitive function, physical capacity, and social interactions among survivors. These multiple stroke impairment metrics are characterized as multi-source and multi-granular data, represented as unlabelled data, making them less amenable to investigation using traditional statistical or supervised machine learning techniques that typically rely on datasets annotated by human experts. Therefore, we utilized a structure-adapting unsupervised machine learning approach, the Growing Self-organising Map (GSOM) algorithm [11], to automatically generate profiles of impairments in survivors classified as ‘mild’ by the NIHSS.
We use data from the START (STroke imAging pRevention and Treatment) [12] longitudinal cohort study which consists of multiple test scores of stroke survivors at three time points [3-7 days; 3-months; 12-months post-stroke] in their stroke journey. These time points align with commonly defined phases of recovery: 3-7 days, within the acute phase; 3-months, end of the early sub-acute phase; and 12 months considered within the chronic phase [13]. Specifically, we processed mild stroke survivors’ data at these time points to generate GSOM representations at each point in time. By examining the representation captured by the GSOM, we have the potential to distinguish unique profiles among ‘mild’ stroke survivors at each time point. These profiles of impairments across multiple domains, including cognition, physical activity, social functioning, and mental health, have potential to provide new insights, all without the need for prior knowledge or human annotation.
2. Materials and Methods
2.1. Data Availability
The participants of this study did not give written consent for their data to be shared publicly, so due to the sensitive nature of the research, supporting data is not available.
2.2. Study Design
The START study [12] is a prospective, longitudinal cohort study of 200 stroke survivors who were investigated at baseline [admission], 24h, 3-7 days, 3 months and 12 months post-stroke [12]. Inclusion criteria included participants diagnosed with ischaemic stroke, aged ≥18 years, and with no prior disability [modified Rankin Scale ≤2 points] [14]. Participants who adhered to these criteria were recruited from participating hospitals throughout Australia and New Zealand, all of which had specialised stroke units, between June 2010 and April 2013. Prior to data collection, informed consent for participation was obtained from the patient or family member or legally responsible person. After enrolment, all participants were contacted again, at each assessment time-point to continue participating in the study. Ethics approval was obtained by the ethics committees responsible for each recruiting hospital site and the tertiary institution involved. Approval was also obtained for use of collected data in subsequent analyses of related research by the research team (HREC/17/Austin/281).
This longitudinal study aimed at assessing participants at different time points for their stroke severity, depression, cognitive abilities, functional outcomes, physical activity, and lifestyle at the 3-7 days, 3-month, and 12-month time points. These assessments were administered by a stroke specialist or healthcare professional trained in their administration and blinded to study design. The classification of neurological stroke severity was provided by The National Institute of Health Stroke Scale (NIHSS) at baseline as ‘mild’, ‘moderate’ or ‘severe’ [15].
2.2.1. Participants and Study Size
The current study included only the stroke survivors who have been classified as ‘mild’ according to the NIHSS at baseline (i.e., (NIHSS ≤ 5 points). There were 107 mild stroke survivors in the START dataset according to the baseline NIHSS, however, after data processing, it was noted that only 73 had complete information over one year due to health conditions, missed participation and consent withdrawal. After eliminating incomplete data, there was a study cohort of 73 stroke survivors for the current study.
2.2.2. Quantitative Measures
The START dataset consists of outcomes based on multiple tests that are used to measure impairment across distinct domains following stroke [12]. In this study, in addition to NIHSS, we analysed data from 6 other measures across different domains: cognition; mental health (depression); disability; physical activity, work and social adjustment, health related quality of life (Figure 1).
The following section outlines a description of each test with the corresponding measurement criteria.
National Institute of Health Stroke Scale (NIHSS)
The National Institute of Health Stroke Scale (NIHSS) is a 11-item assessment used to evaluate the severity of stroke neurological deficits, including consciousness, language, neglect, visual-field loss, extraocular movement, motor strength, ataxia, dysarthria, and sensory loss [16]. The potential scores of NIHSS range from 0 to 42; higher scores represent more severe stroke deficits.
Montreal Cognitive Assessment (MoCA)
The Montreal Cognitive Assessment (MoCA) is a sensitive and widely used screening tool to detect post-stroke vascular cognitive impairment [17,18]. The MoCA assess diverse cognitive domains, including visuospatial and executive functions, attention, memory, language, conceptual thinking, and orientation. The total score of MoCA is 30, with higher scores indicate better cognitive function. An extra 1 point is added to the total score if a person has less than 12 years of formal education.
Montgomery-Asberg Depression Rating Scale (MADRS)
The Montgomery-Asberg Depression Rating Scale (MADRS) measures a person’s depressive symptoms [19]. Using a structured interview, the MADRS was examined to have excellent inter-rater reliability [20]. The MADRS has 10 items rated on a six-point Likert scale (0 – 6). The total score of MADRS is 60, a higher score indicates more severe depressive symptoms. A score of 18 or greater is suggestive of major depression [20].
Modified Ranking Scale (mRS)
The modified Rankin Scale (mRS) is a widely used functional outcome measure in stroke. The mRS assesses an individual’s degree of disability or dependence in daily activities after stroke through a structured interview [14]. Six levels are defined in the mRS scoring from 0 – 6: 0 for no symptoms at all, 5 for total dependence, and 6 for dead.
Rapid Assessment of Physical Activity (RAPA) questionnaire
The Rapid Assessment of Physical Activity (RAPA) is an easy-to-use, valid outcome measure that assesses levels of physical activity, and hence lifestyle, among adults [21]. The RAPA has 9 items, including 7 items for aerobic activities and 2 items for strength training and flexibility.
Work and Social Adjustment questionnaire (WSAS)
The Work and Social Adjustment Scale (WSAS) is a 5-item self-report scale of functional impairment resulting from a health problem [22]. The five WSAS items determine functional impairment according to the following dimensions: (1) work; (2) home management; (3) social leisure activities; (4) private leisure activities; and (5) relationships with others. Each item is rated on a 0 to 8 scale: 0 indicates no impairment at all and 8 indicates very severe impairment. The maximum total score of the WSAS is 40. Good reliability and validity have been reported for the WSAS [22,23].
Stroke Impact Scale (SIS)
The Stroke Impact Scale (SIS) is a disease-specific, self-report questionnaire that evaluates self-perceived disability and health-related quality of life after stroke [24]. The SIS assesses the subjective impact of stroke in eight domains: strength, memory and thinking, emotion, communication, (instrumental) activities of daily living (ADL/IADL), mobility, hand function and participation. All items within each domain are scored on a 1 to 5-point Likert scale. The total scores of each domain range from 0 to 100. Higher item scores indicate a lower level of difficulty experienced. The reliability and validity of the SIS are excellent [24,25].
2.3. Methodology
Stroke survivors undergo multiple assessments to determine their function and ability in various domains. These assessments are conducted independently. In this study, we aim to conduct a fusion of the scores across multiple assessments to understand different variants of impairments within mild stroke survivors. This is particularly important as it will enable distinguishing of poor performing aspects and non-impaired aspects of each individual.
In order to achieve this objective, we utilize an AI framework that can combine multi-source, granular data to create a latent representation of stroke survivor data. The high-level architecture of this framework consists of a data processing module, and an AI module comprising of GSOM [11] which is an unsupervised machine learning approach, and a visualisation module to analyse the outcomes (Figure 2). We have designed this framework to accommodate the selected participants’ data from the START longitudinal study.
2.3.1. Data Pre-Processing
The first module of the proposed framework was used to pre-process the data to explore missing values and anomalies and transform them into comparable and computable information across all the selected tests. As the first step of data processing, we filtered the START patient data sample based on the completeness of the data. We evaluated the missing data for demographic details and selected the assessment data for analysis. As previously noted in Table 1, the selected tests were the NIHSS, Montreal Cognitive Assessment (MoCA), Montgomery-Asberg Depression Rating Scale (MADRS), modified Rankin Scale (mRS), Rapid Assessment of Physical Activity (RAPA), Work and Social Adjustment Scale (WSAS) and Stroke Impact Scale (SIS). As per the inclusion criterion, participants’ records that do not contain data for these tests were removed from the dataset since the objective is to find stroke survivor groupings considering all the aspects of stroke impairment and impact.
2.3.2. Data Standardization—Creating a Stroke Impairment Index
The filtered dataset was then processed to standardize across all the tests, as different tests had different scales to measure impairment and impact. For example, the MoCA assessment uses a scale of 0-30 while the SIS assessment uses a scale of 0-100. In order to standardize the data fed into the machine learning algorithm, it was necessary to ensure that all features adhere to the same scale. Therefore, the data normalization step was carried out using MinMax Scaler to transform assessment scores, so that all values lie between 0 to 1 scale, which served as the impairment index. On this scale, zero indicated no impairment and one indicated severe impairment. The standardized data of each assessment were used as the input feature vector for the artificial intelligence (AI) algorithm.
2.3.3. Growing Self-Organizing Maps to Detect Variants of Impairment
The AI module of the proposed framework used a self-structuring version of the Self Organizing Map (SOM) algorithm called the GSOM (Growing SOM) [11]. This algorithm has a map topography that self-structures by adapting its size and shape based on the attributes and variations of input data without being dependent on a fixed structure. The GSOM can handle outliers and noise in the data, therefore establishing its applicability to conduct unsupervised data exploration, anomaly detection, data mining and profiling applications [26].
We selected GSOM for the AI module considering three major features which align well with the requirements of this study. Firstly, the unsupervised learning capability of the GSOM was important due to the exploratory nature of the analysis to discover previously unknown patterns. Compared to clustering algorithms which need a pre-defined number of clusters, the GSOM has the benefit of not requiring prior knowledge of the input data. Secondly, the GSOM can not only generate clusters based on similar groupings of assessment outcomes but also capture the topological relationships among the clusters with neighbourhood-preserving mappings. The self-structuring ability of the GSOM has been shown to generate clusters that better preserve the relationships in the input variables compared to the SOM [27], therefore is more suited for this study as we use input from multiple assessments. Thirdly, the GSOM ‘grows’ nodes starting from an initial 4-node network and as such is better suited for studies where multiple maps could be visualised and compared. The unsupervised clustering of multiple dimensions of participant data was formed using an improved variant [28] of the GSOM with a transience mechanism facilitating the encapsulation of plasticity in the GSOM. This enables the algorithm to discard outdated information and overfitting knowledge in its knowledge acquisition, without the loss of stability of the algorithm.
In the GSOM, as input data are presented, nodes of the network compete with each other for ownership of the input, and the winners strengthen their relationships with this input. The competitive learning process is repeated for the complete dataset for several cycles and ultimately the map associates output nodes with patterns in the input dataset. The growth of the GSOM is decided by the number of dimensions in the input space and the spread factor (SF), which controls the spread of the neural network structure independent of the dimensionality (features) of the dataset [11]. In this work, we utilize the Python implementation of the GSOM. As the inputs to the GSOM, we used the standardized scores of the assessments for mild stroke survivors.
2.3.4. Identification of Impairment Profiles
The GSOM generates a two-dimensional grid of nodes, with each node denoting a group of similar data patterns. Nodes located in closer proximity to each other on the map are indicative of clusters. As a result, creating GSOM maps enables the automatic detection of data point clusters (participants) through iterative analysis of participant data within each node. This process unveils unique patterns that differentiate these clusters from the larger population. Consequently, by visually inspecting the map, we can identify regions where nodes are densely clustered, as these areas generally correspond to clusters of similar patterns. Therefore, the framework enables the automatic identification of prominent clusters by computing the intra-cluster similarity using the patient data of each cluster. GSOM algorithm was used for this task with a 0.8 spread factor while Euclidean distance [29] was used as the distance measure to calculate the difference in input data between two participants. This resulted in marked regions that indicate different subgroupings (profiles) of mild stroke survivors.
The analysis was conducted to identify:
- (a)
- Profiles (Subgroupings) within NIHSS assessment at day 3-7 post-stroke
- (b)
- Profiles across measures at day 3-7 post-stroke
- (c)
- Profiles across measures at 3 months post-stroke
- (d)
- Profiles across measures at 12 months post-stroke
In this study, we created an interactive visualisation tool using the GSOM maps that can be used by clinicians to monitor each participant’s impairment profiles over time. Appendix A presents screen captures of the developed tool.
2.3.5. Statistical Analysis
After identifying the impairment profiles through the GSOM, we computed the mean for each assessment. Afterwards, t-tests were used to compare the mean of each assessment in the identified profiles with other participants’ data [30]. A significance value of 0.05 was used to reject the null hypothesis and conclude that there is a statistically significant difference in the mean of the assessment scores between the identified profile and other participants.
3. Results
3.1. Demographic and Clinical Characteristics of Stroke Sample
Seventy-three stroke survivors met the inclusion criteria for mild stroke with available data and were included in the study sample. The demographic and background clinical information of the participants is presented in Table 1. Clinical and functional outcome characteristics of the sample are summarised in Table 2 for each of the main variables included in the analysis, i.e., NIHSS, MoCA, MADRS, mRS, RAPA, WSAS and SIS, at 3-7days, 3-months and 12-months post-stroke.
3.2. Stroke Survivor Clusters Based on the NIH Stroke Scale
The NIHSS consists of 11 items that focus on different neurological aspects such as level of consciousness, horizontal eye movement, visual field test, facial palsy, motor arm, motor leg, sensory, speech, language, and attention. Scores for each question item are aggregated to form the final NIHSS score which is used for the stroke severity classification. However, this aggregated score fails to capture the aspects that are more impaired or not. Therefore, we used the AI framework on the baseline NIHSS item scores, at day 3-7 post-stroke, to detect different impairment groupings (annotated regions) that can be derived solely from NIHSS.
This analysis demonstrated five different profiles pertaining to different impairments as shown in Figure 3 and Table 3. The scores of participants in such groupings were compared with the rest of the population to determine if there was any significant difference using t-tests. Participants in non-annotated regions did not exhibit patterns that could be differentiated, meaning they had mixed NIHSS item-score attributes that were not significant.
Profile 1 participants (19.2%) showcased mild to moderate somatosensory loss and impairment of motor abilities in the right leg. The impairment scores given to sensory loss (Sensory Loss Mean: Profile 1=0.571, Other participants=0.068, p<0.05) and difficulty of motor abilities in the right leg (Motor leg right Mean: Profile 1=0.5, Other participants=0.017, p<0.05) in this profile were significantly higher than the other participants. They did not show a remarkable difference in other attributes.
Participants in Profile 2 (15.06%) were separated from the other participants due to their increased impairment scores for facial palsy. Profile 2 participants showcased higher impairment scores (Facial Palsy Mean: Profile 2=1.72, Other participants=0.27, p<0.05) as the majority were suffering from either partial paralysis of the lower face compared to other mild stroke survivors.
Participants in Profile 3 (13.7%) showed increased scores for limb ataxia compared to other participants. All the participants in this profile had ataxia present in either one or two limbs (Limb Ataxia Mean: Profile 3=1.6, Other participants=0.111, p<0.05).
Profile 4 (8.2%) participants were differentiated from the rest due to their impairment in speech. All the participants in this profile had mild to moderate aphasia indicating some obvious loss of fluency or facility of comprehension without significant limitation on ideas expressed (Best language Mean: Profile 4=1.33, Other participants=0.07, p<0.05). Moreover, all the participants had mild to moderate dysarthria, where patients slur at least some words and at worst can be understood with some level of difficulty (Dysarthria Mean: Profile 4=1, Other participants=0.313, p<0.05).
Profile 5 (8.2%) participants showed an increased level of visual impairment compared to the other participants. All the participants in this profile had partial or complete hemianopia indicating visual impairment (Visual Field Test Mean: Profile 5=1.5, Other participants=0.044, p<0.05).
The analysis of NIHSS attributes showcased different subgroupings of impairments among mild stroke survivors that enabled the creation of another layer of granularity for survivors identified as mild.
3.3. Profiles across Measures
Performance on each of the 6 domain assessments was mapped for each individual classified as mild. The GSOM generated a latent representation with the 6 impairment profiles, as shown in Figure 4 for two individuals. As illustrated, different individuals exhibit impairment in different domains consistent with varied post-stroke experiences. This provides valuable insights to identify individual needs that can be considered in delivery of personalised rehabilitation care.
NIHSS (National Institute of Health Stroke Scale; 0 to 42); MADRS (Montgomery-Asberg Depression Rating Scale; scale range 0 to 60); MoCA (Montreal Cognitive Assessment; 0 to 30); mRS (Modified Rankin Scale; 0 to 6); SIS (Stroke Impact Scale; 0 to 100); RAPA (Rapid Assessment of Physical Activity; 0 to 10); WSAS (Work and Social Adjustment Scale; 0 to 40)
3.4. Different Profiles of Mild Stroke Survivors at Different Time Points of Their Recovery Trajectories
The START study obtained measures for participants at 3-7 days, 3-months, and 12-months post-stroke which permitted the longitudinal study of stroke impairment and impact. The measures, NIHSS, MoCA, MADRS, mRS, RAPA, WSAS, and SIS assess the stroke impairment and impact across several different domains. The GSOM algorithm was applied to participant data at these three-time points separately to infer different profiles of mild stroke survivors over time. An example is shown in Figure 5.
3.4.1. Profiling at 3-7 Days Post-Stroke
At 3-7 days post-stroke, only the MADRS and MoCA assessment outcomes were reported in addition to NIHSS. Based on these data, the AI module separated two significant profiles indicating clear impairments in these outcomes compared to the other participants as shown in Figure 6 and Table 4. Based on the analysis, 35.6% of participants reported significant impairment in cognition or depression compared to others.
Participants in Profile 1 scored less on the MoCA assessment, indicating low cognition abilities compared to other participants (MoCA Mean: Profile 1=19, Other participants=25.77, p<0.05). They did not show significant impairment in other domains.
Another grouping exhibited higher levels of depression as they scored higher in MADRS assessment on day 3-7 post-stroke, compared to other participants as shown in Profile 2 (MADRS Mean: Profile 2=16.5, Other participants=3.2, p<0.05). Participants in the non-annotated regions did not exhibit significant variation in assessment scores from other participants.
Thus, the two identified profiles provided evidence of sub-groupings of impairment in cognition or depression at day 3-7 post-stroke among stroke survivors who have been classified as mild.
3.4.2. Profiling at 3-Months Post-Stroke
At 3-months post-stroke, scores related to MoCA, MADRS, mRS, RAPA WSAS and SIS were reported. Based on these data, the AI module generated three significant profiles indicating different impairments among 35.6% of mild stroke patients as shown in Figure 7 and Table 5.
Participants in Profile 1 (9.6%) demonstrated a higher level of depression based on their scores for the MADRS assessment (MADRS Mean: Profile 1=12.71, Other participants=5.47, p<0.05). Apart from higher level of depression they did not exhibit significant impairment in other assessments.
Another notable exemption is Profile 2 (12.3%) where participants recorded higher scores for the mRS assessment (mRS Mean: Profile 2=1.66, Other participants=0.85, p<0.05) which evaluates the degree of disability following stroke. Participants in this cluster also showed comparatively lower scores for SIS assessment that assess the other dimensions of health-related quality of life: emotion, communication, memory and thinking, and social role function (SIS Mean: Profile 2=64.44, Other participants=84.32, p<0.05). It can be determined that, in contrast to other groupings among mild stroke survivors at 3 months post-stroke, Profile 2 participants displayed more impairment and impact due to their increased disability and poor quality of life.
The AI algorithm separated another group of participants in Profile 3 (13.7%) who scored higher for the WSAS assessment (WSAS Mean: Profile 3=15.15, Other participants=3.79, p<0.05) which indicates low work and social adjustment in daily life. These participants did not show a significant change in other assessments.
3.4.3. Profiling at 12 Months Post-Stroke
At 12 months post-stroke, scores related to MoCA, MADRS, mRS, RAPA, WSAS and SIS, were used for the profiling. Among participants at 12 months post-stroke, 43.9% of participants showcased at least one impairment which is greater than the frequency of participants with impairment at day 3-7 or at 3 months post-stroke. The participants were grouped into identified profiles by the AI algorithm as shown in Figure 8 and Table 6. Four distinct impairment profiles were identified at this time point.
Among mild stroke survivors at 12 months post-stroke, a group of participants showed lowered cognitive abilities and low engagement in physical activities. These participants highlighted in Profile 1 (11%) scored less in the MoCA assessment (MoCA Mean: Profile 1=21.12, Other participants=26.59, p<0.05) measuring their cognitive abilities and in the RAPA assessment (RAPA Mean: Profile 1=2.62, Other participants=4.2, p<0.05) which evaluated their level of physical activity.
Another group of participants shown as Profile 2 (9.6%) demonstrated an increased level of depression when compared to other participants as they scored higher in the MADRS assessment for depression (MADRS Mean: Profile 2=9.71, Other participants=4.88, p<0.05). It is noteworthy that higher levels of depression among the group of participants were seen at all three-time points.
Profile 3 (11%) participants were separated from the rest, given their increased level of disability. This group exhibited higher scores for the mRS assessment that evaluates disability in stroke survivors for recovery and continued disability. All participants in this profile had disability symptoms while a few reported moderate disability (mRS Mean: Profile 3=1.5, Other participants=0.75, p<0.05).
In Profile 4 (12.3%), participants indicated a poor quality of life due to their low scores in the SIS assessment which evaluates disability and health-related quality of life after stroke. Their SIS assessment outcomes were significantly poor compared to other participants (SIS Mean: Profile 4=70.55, Other participants=87.67, p<0.05).
3.5. Capturing Individual Patient Trajectories
Using the GSOM algorithm, we generated patient recovery pathways from data collected at day 3/7, 3 months, and 1 year intervals as shown in Figure 9. The selected sub-group of patients, categorized as MILD based on their NIHSS overall scores, display varying trajectories despite their initial categorization.
By day 7, differences in cognitive abilities, as indicated by the MoCA test, emerge among the patients. Over the 3-month period, these patients present similar characteristics, except for disparities in cognitive abilities and the Work and Social Adjustment test. Notably, one patient (represented by the orange pathway) exhibits lower cognitive ability and a higher mRS score by the 1-year mark. Initially, the patients exhibit slight dissimilarities, but by the 3-month and 1-year points, their recovery pathways converge, highlighting the dynamic nature of individual recovery trajectories over time.
4. Discussion
Although the NIHSS screening is used to provide a measurement of ‘mild’ stroke severity, we examined if individual experiences could be varied based on other post-stroke factors such as their cognition, mental health, physical ability, and work and social adjustment. Our findings revealed different groupings (profiles) of mild stroke survivors based on the GSOM maps. By examining the representation captured by the GSOM, we were able to distinguish unique profiles among ‘mild’ stroke survivors at each time point. These profiles revealed impairments in various domains, including cognition, mental health, physical activity, and social functioning, and all without the need for prior knowledge or human annotation. Incorporating such factors from multiple domains adds value to the current NIHSS screening, with potential to better deliver a personalized care plan for stroke survivors.
Identification of distinct clusters of impairments highlights the need to incorporate a comprehensive assessment of mild stroke survivors that encompasses evaluations from multiple domains, in addition to the NIHSS neurological screening, to improve personalised care. Acknowledging a range of deficits across various domains can assist clinicians in gaining a better understanding of the diverse clinical profiles associated with ‘mild’ stroke survivorship. This approach can be used as a value addition to current neurological screening of stroke, to enhance the quality of life and support planning of home-based rehabilitation programs. This is essential for mild stroke survivors who experience additional impairments, as they could be neglected from comprehensive rehabilitation care due to the initial screening of stroke severity.
Our findings, using a structure adapting unsupervised machine learning approach, provide new insights into understanding post-stroke impairment and recovery for those presenting with ‘mild’ stroke according to the NIHSS during the first week post-stroke. First, the investigation of the clustering of impairment across items of the NIHSS revealed that, despite the ‘mild’ classification, variations of impairments can be observed. In this analysis of the NIHSS, five such distinct clusters emerged based on patterns of motor disabilities, somatosensory impairment, speech impairment, visual impairment, and facial palsy; highlighting the necessity to provide individualised rehabilitation and care for mild stroke survivors. We believe that this study is one of the pioneering studies to use an unsupervised machine learning approach to automatically detect different impairment variations of mild stroke survivors using the assessment outcomes of the NIHSS.
Second, we used additional measures of mood, cognition, and functional outcomes at key recovery time points [31] to explore variations of impairment in mild stroke survivors over time. At 3-7 days post-stroke, distinct clusters were defined by the presence of depressive symptoms (based on MADRS) and cognitive impairment (based on MoCA). These findings support the use of mood and cognitive measures at this time, as an adjunct to the NIHSS screening.
The granular level of analysis at 3-months post-stroke enabled the detection of the three groupings of mild stroke survivors: a group with higher levels of depression, a group with poor quality of life coupled with increased disability, and the third group with low work and social adjustment. Among these profiles, special attention should be provided to survivors who have reported poor quality of life and increased disability as it imposes a burden on their daily lives.
At 12 months post-stroke, mild stroke survivors, continued to show impairment across different domains despite zero or low scores on the NIHSS. The number of survivors with impairment was higher at 12 months compared to previous time points; a potentially unexpected finding [32]. At this stage, four clusters were detected with significant impairment across multiple domains. One profile reported lower cognition and markedly reduced physical activity. Given the value of physical activity and cognition on quality of life, it is recommended that health professionals should continue to monitor and address these outcomes even in those without notable impairment. Another profile showed a higher level of depression. Depression was noted as a key issue in mild stroke survivors, as all three-time points reported groups of participants with a significant level of depression based on the MADRS assessment. At 12 months post-stroke, profiles 3 and 4 exhibited increased disability and poor quality of life respectively. Together these findings emphasize the presence of ongoing impairment and poor functional outcomes across a constellation of domains even at 12 months post-stroke in those classified as having a ‘mild’ stroke early post-stroke. These impairment profiles at 12 months post-stroke highlight the burden carried by mild stroke survivors across different domains despite their initial classification as mild.
Capturing personalized longitudinal pathways is crucial for tailoring treatment plans to individual patient needs. By monitoring recovery trajectories over time, healthcare providers can identify specific patterns and variations in patient progress that might otherwise go unnoticed. This detailed insight allows for the customization of interventions based on individual recovery rates, cognitive abilities, and overall health status. Personalizing treatment plans based on longitudinal data ensures that each patient receives the most effective care, improving outcomes and optimizing resource utilization. Moreover, understanding these unique pathways can lead to better-informed clinical decisions, ultimately enhancing the quality of life for patients through more precise and responsive healthcare strategies.
Implications for practice
The presence of impairment across multiple domains advocates that survivors of stroke classified as ‘mild’ in the first-week post-stroke should be closely monitored, at least over the first-year post-stroke, and/or be offered bursts of rehabilitation to prevent or address these ongoing impairments. Our findings also provide strong evidence to support the voice of people classified as having a mild stroke, that ‘mild’ is not really mild, based on their lived experience.
Given the fact that life following a stroke affects the physical, cognitive and mood functionality of a person, it is imperative to identify and understand these complexities [33]. Wide variability in quality-of-life ratings (0.45 to 0.95 on a scale from 0 to 1) has been reported even in those with mild strokes [33]. Yet, it has been established that vague measures aimed at determining the quality of life following stroke impede clinician-decision making [34] as mild stroke survivors report an abundance of issues associated with return to meaningful activities and life satisfaction [6,7]. These findings, together with the current findings, suggest that the NIHSS screening alone cannot adequately capture the underlying reality of survivors of stroke. Rather it suggests the value of a profile of outcomes to provide a more meaningful and comprehensive view of stroke survivorship and quality of life.
Several implications for clinicians arise from this study. First, we provide evidence to showcase different profiles of impairment that exist among ‘mild’ stroke survivors at different times in the first-year post-stroke. The fusion of data from multiple assessments enabled generating an overview for each person, which is otherwise challenging to assess by conventional means. This new approach permitted the illustration of different profiles of stroke survivors despite the single ‘mild’ classification by NIHSS. The evidence presented in this study relating to various groupings of mild stroke survivors confirms that the stroke severity classification should not only rely on neurological functions, but would benefit from incorporating cognition, mood, disability, physical, and social activity measures and self-perceived impact. This enables widening the scope of monitoring of stroke survivors and demonstrates the value of incorporating multiple domains in the severity classification process. This is significant in the medium to longer term when survivors of stroke continue to experience impairments and impact, despite being classified as ‘mild’.
Second, the identification of distinct profiles of impairment and impact at different times enables the provision of personalised and targeted care and rehabilitation to survivors of stroke focusing on the domain and profile of impairment. For example, the identification of cognitive impairment and depression in ‘mild’ stroke survivors may initiate treatments related to mental health, cognition and quality of life. This could promote intervention therapies, as the early detection of survivors of stroke with similar levels of depression could facilitate counselling and evidence-based care at early stages. Such need-based care and precautions would in turn enrich the post-stroke quality of life in ‘mild’ survivors of stroke thereby improving the current rehabilitation and person-centred care.
Third, we suggest the plausibility of integrating AI-enabled insights for decision-making and designing strategies for rehabilitation that are associated with improving function and the quality of life in survivors of stroke. Using the framework presented in this study, clinicians can input data related to different stroke assessments to visualize distinct subgroupings of stroke survivors as shown in Appendix A. The framework is scalable to accommodate data from many patients and operate at a larger scale. While this serves as a cost-effective decision-making platform, it also categorizes stroke survivors based on the similarity of their impairment permitting clinicians and therapists to strategically design treatment and rehabilitation programs for survivors of stroke who have similar disabilities.
As limitations of this study, we acknowledge that the portion of participants with missing data could be improved. This has occurred primarily due to patients not performing all the tests planned in the study. Furthermore, information from survivors categorized as having moderate and severe severity could also be used as additional information for comparison purposes.
5. Conclusions
While presenting the potential for using AI in clinical settings, we believe that conventional means of assessing stroke severity should be revisited to incorporate impairment from different domains. This is important, particularly as the prevalence of mild stroke appears to have seen a substantial increase in recent years [35]. Mild stroke survivorship should be investigated at a granular level to determine if the categorization of mild ‘is really mild?’. The discovery of different profiles for survivors of stroke will systematically empower person-centered precision rehabilitation based on individual treatment needs, thereby advancing the survivorship and care of those previously classified as ‘mild’.
Author Contributions
Conceptualization, Achini Adikari, Rashmika Nawaratne, Daswin De Silva, Damminda (PhD) and Leeanne Carey; Data curation, Alistair Walsh; Formal analysis, Achini Adikari, Rashmika Nawaratne, David Carey and Alistair Walsh; Investigation, Achini Adikari, Rashmika Nawaratne, David Carey, Carolyn Baum, Stephen Davis, Geoffrey Donnan, Damminda (PhD) and Leeanne Carey; Methodology, Achini Adikari, Rashmika Nawaratne, Daswin De Silva, Damminda (PhD) and Leeanne Carey; Software, Alistair Walsh; Supervision, Daswin De Silva, Carolyn Baum, Stephen Davis, Geoffrey Donnan, Damminda (PhD) and Leeanne Carey; Writing – original draft, Achini Adikari, Rashmika Nawaratne, Daswin De Silva, Damminda (PhD) and Leeanne Carey; Writing – review & editing, David Carey, Carolyn Baum, Stephen Davis and Geoffrey Donnan.
Funding
We acknowledge the financial support for the conduct of the research from the Commonwealth Scientific and Industrial Research Organization of Australia, Preventative Health Flagship fund; and support for write up and researchers from the James S. McDonnell Foundation 21st Century Science Initiative in Cognitive Rehabilitation Collaborative Award (#220020413); National Health and Medical Research Council (NHMRC) of Australia Ideas grant (#2004443); NHMRC Centres of Research Excellence in Stroke Rehabilitation and Recovery (#1077898) and Aphasia (#1153236); NHMRC program grant (#1113352); and La Trobe University Post Graduate Research Scholarships awarded to authors (A.A, R.N, A.W.). We thank the survivors of stroke and START researchers who contributed to the data collected for this study.
Institutional Review Board Statement
Ethics approval was obtained by the ethics committees responsible for each recruiting hospital site and the tertiary institution involved. Approval was also obtained for use of collected data in subsequent analyses of related research by the research team (HREC/17/Austin/281).
Informed Consent Statement
Informed consent was obtained from all subjects involved in the study.
Data Availability Statement
The participants of this study did not give written consent for their data to be shared publicly, so due to the sensitive nature of the research, supporting data is not available.
Conflicts of Interest
The authors declare no conflicts of interest.
References
- Feigin VL, Stark BA, Johnson CO, Roth GA, Bisignano C, Abady GG, et al. Global, regional, and national burden of stroke and its risk factors, 1990–2019: a systematic analysis for the Global Burden of Disease Study 2019. The Lancet Neurology. 2021 Oct 1;20(10):795–820.
- Lyden, P. Using the National Institutes of Health Stroke Scale. Stroke. 2017 Feb 1;48(2):513–9.
- Kasner, S.E. Clinical interpretation and use of stroke scales. The Lancet Neurology. 2006;5(7):603–12.
- Spilker J, Kongable G, Barch C, Braimah J, Brattina P, Daley S, et al. Using the NIH Stroke Scale to assess stroke patients. The NINDS rt-PA Stroke Study Group. J Neurosci Nurs. 1997 Dec;29(6):384–92.
- Carlsson GE, Möller A, Blomstrand C. Consequences of Mild Stroke in Persons. CED. 2003;16(4):383–8.
- Carlsson GE, Möller A, Blomstrand C. Managing an everyday life of uncertainty – A qualitative study of coping in persons with mild stroke. Disability and Rehabilitation. 2009 Jan 1;31(10):773–82.
- Edwards DF, Hahn M, Baum C, Dromerick AW. The Impact of Mild Stroke on Meaningful Activity and Life Satisfaction. Journal of Stroke and Cerebrovascular Diseases. 2006 Jul 8;15(4):151–7.
- Chang WH, Sohn MK, Lee J, Kim DY, Lee SG, Shin YI, et al. Long-term functional outcomes of patients with very mild stroke: does a NIHSS score of 0 mean no disability? An interim analysis of the KOSCO study. Disability and Rehabilitation. 2017 Apr 24;39(9):904–10.
- Doyle, P.J. Measuring health outcomes in stroke survivors. Archives of Physical Medicine and Rehabilitation. 2002 Dec 1;83:S39–43.
- Björkdahl A, Rafsten L, Petersson C, Sunnerhagen KS, Danielsson A. Effect of very early supported discharge versus usual care on activi ties of daily living ability after mild stroke: a randomized controlled trial. Journal of Rehabilitation Medicine. 2023 Aug 24;55:jrm12363–jrm12363.
- Alahakoon D, Halgamuge SK, Srinivasan B. Dynamic Self-Organizing Maps with Controlled Growth for Knoledge Discovery. IEEE Transactions on Neural Networks. 2000;11(3):601— – 614.
- Carey LM, Crewther S, Salvado O, Lindén T, Connelly A, Wilson W, et al. STroke imAging pRevention and Treatment (START): A Longitudinal Stroke Cohort Study: Clinical Trials Protocol. International Journal of Stroke. 2015 Jun 1;10(4):636–44.
- Bernhardt J, Hayward KS, Kwakkel G, Ward NS, Wolf SL, Borschmann K, et al. Agreed definitions and a shared vision for new standards in stroke recovery research: the stroke recovery and rehabilitation roundtable taskforce. International Journal of Stroke. 2017;12(5):444–50.
- Wilson JTL, Hareendran A, Grant M, Baird T, Schulz UGR, Muir KW, et al. Improving the assessment of outcomes in stroke: use of a structured interview to assign grades on the modified Rankin Scale. Stroke. 2002 Sep;33(9):2243–6.
- Rost NS, Bottle A, Lee JM, Randall M, Middleton S, Shaw L, et al. Stroke Severity Is a Crucial Predictor of Outcome: An International Prospective Validation Study. J Am Heart Assoc. 2016 Jan 21;5(1):e002433.
- Brott T, Adams HP, Olinger CP, Marler JR, Barsan WG, Biller J, et al. Measurements of acute cerebral infarction: a clinical examination scale. Stroke. 1989 Jul;20(7):864–70.
- Nasreddine ZS, Phillips NA, Bédirian V, Charbonneau S, Whitehead V, Collin I, et al. The Montreal Cognitive Assessment, MoCA: a brief screening tool for mild cognitive impairment. J Am Geriatr Soc. 2005 Apr;53(4):695–9.
- Dong Y, Sharma VK, Chan BPL, Venketasubramanian N, Teoh HL, Seet RCS, et al. The Montreal Cognitive Assessment (MoCA) is superior to the Mini-Mental State Examination (MMSE) for the detection of vascular cognitive impairment after acute stroke. J Neurol Sci. 2010 Dec 15;299(1–2):15–8.
- Montgomery SA, Asberg M. A new depression scale designed to be sensitive to change. Br J Psychiatry. 1979 Apr;134:382–9.
- Williams JBW, Kobak KA. Development and reliability of a structured interview guide for the Montgomery Asberg Depression Rating Scale (SIGMA). Br J Psychiatry. 2008 Jan;192(1):52–8.
- Topolski TD, LoGerfo J, Patrick DL, Williams B, Walwick J, Patrick MB. The Rapid Assessment of Physical Activity (RAPA) among older adults. Prev Chronic Dis. 2006 Oct;3(4):A118.
- Mundt JC, Marks IM, Shear MK, Greist JH. The Work and Social Adjustment Scale: a simple measure of impairment in functioning. Br J Psychiatry. 2002 May;180:461–4.
- Zahra D, Qureshi A, Henley W, Taylor R, Quinn C, Pooler J, et al. The work and social adjustment scale: reliability, sensitivity and value. Int J Psychiatry Clin Pract. 2014 Jun;18(2):131–8.
- Duncan PW, Wallace D, Lai SM, Johnson D, Embretson S, Laster LJ. The stroke impact scale version 2.0. Evaluation of reliability, validity, and sensitivity to change. Stroke. 1999 Oct;30(10):2131–40.
- Duncan PW, Bode RK, Min Lai S, Perera S, Glycine Antagonist in Neuroprotection Americans Investigators. Rasch analysis of a new stroke-specific outcome scale: the Stroke Impact Scale. Arch Phys Med Rehabil. 2003 Jul;84(7):950–63.
- Senadheera I, Larssen BC, Mak-Yuen YYK, Steinfort S, Carey LM, Alahakoon D. Profiling Somatosensory Impairment after Stroke: Characterizing Common “Fingerprints” of Impairment Using Unsupervised Machine Learning-Based Cluster Analysis of Quantitative Measures of the Upper Limb. Brain Sciences. 2023 Sep;13(9):1253.
- Nawaratne R, Alahakoon D, De Silva D, Yu X. HT-GSOM: dynamic self-organizing map with transience for human activity recognition. In: 2019 IEEE 17th International Conference on Industrial Informatics (INDIN). IEEE; 2019. p. 270–3.
- Nawaratne R, Alahakoon D, De Silva D, Kumara H, Yu X. Hierarchical Two-Stream Growing Self-Organizing Maps with Transience for Human Activity Recognition. IEEE Transactions on Industrial Informatics. 2019;1–1.
- Dokmanic I, Parhizkar R, Ranieri J, Vetterli M. Euclidean Distance Matrices: Essential theory, algorithms, and applications. IEEE Signal Processing Magazine. 2015 Nov;32(6):12–30.
- Kim, T.K. T test as a parametric statistic. Korean J Anesthesiol. 2015 Nov 25;68(6):540–6.
- Chamberlain, J. Agreed definitions and a shared vision for new standards in stroke recovery research: The Stroke Recovery and Rehabilitation Roundtable taskforce [Internet]. Stroke Recovery Research CRE. Available online: https://strokerecovery.org.au/cre/agreed-definitions-and-a-shared-vision-srrr/ (accessed on 17 February 2023).
- Grefkes C, Fink GR. Recovery from stroke: current concepts and future perspectives. Neurol Res Pract. 2020;2:17.
- King Rosemarie, B. Quality of Life After Stroke. Stroke. 1996 Sep 1;27(9):1467–72.
- Tengs Tammy, O., Yu Michelle, Luistro Elvina. Health-Related Quality of Life After Stroke A Comprehensive Review. Stroke. 2001 Apr 1;32(4):964–72.
- Wolf TJ, Baum C, Connor LT. Changing Face of Stroke: Implications for Occupational Therapy Practice. Am J Occup Ther. 2009;63(5):621–5.
Figure 1.
Measures used to assess the overall experience of ‘mild’ stroke survivors.
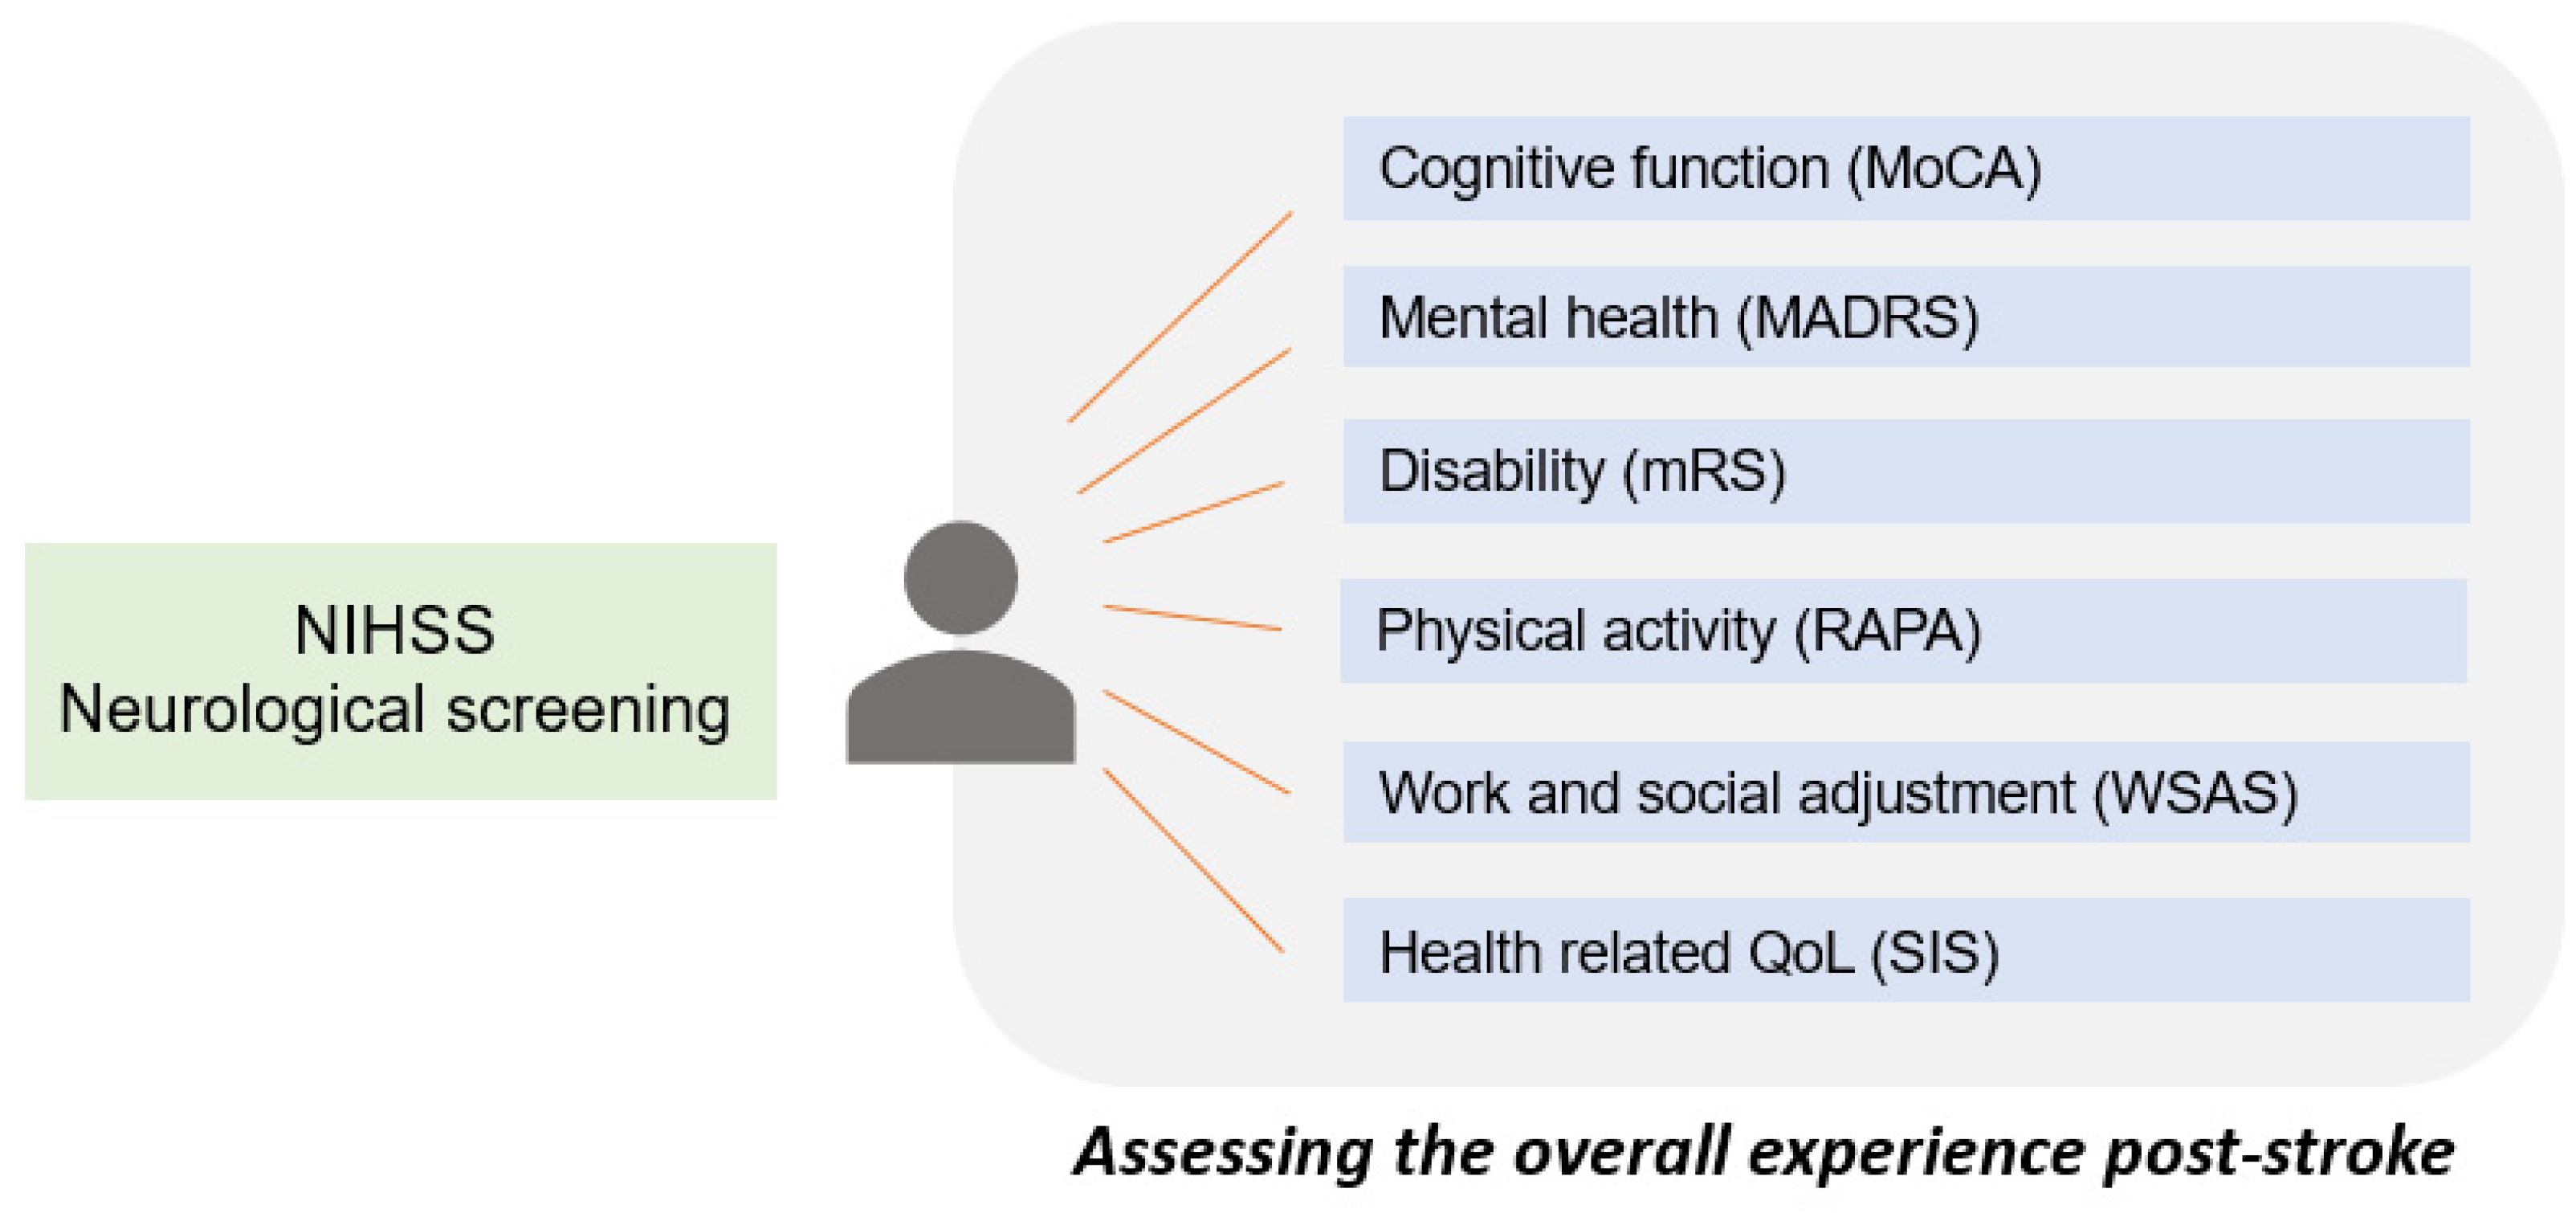
Figure 2.
The proposed framework to identify impairment profiles.
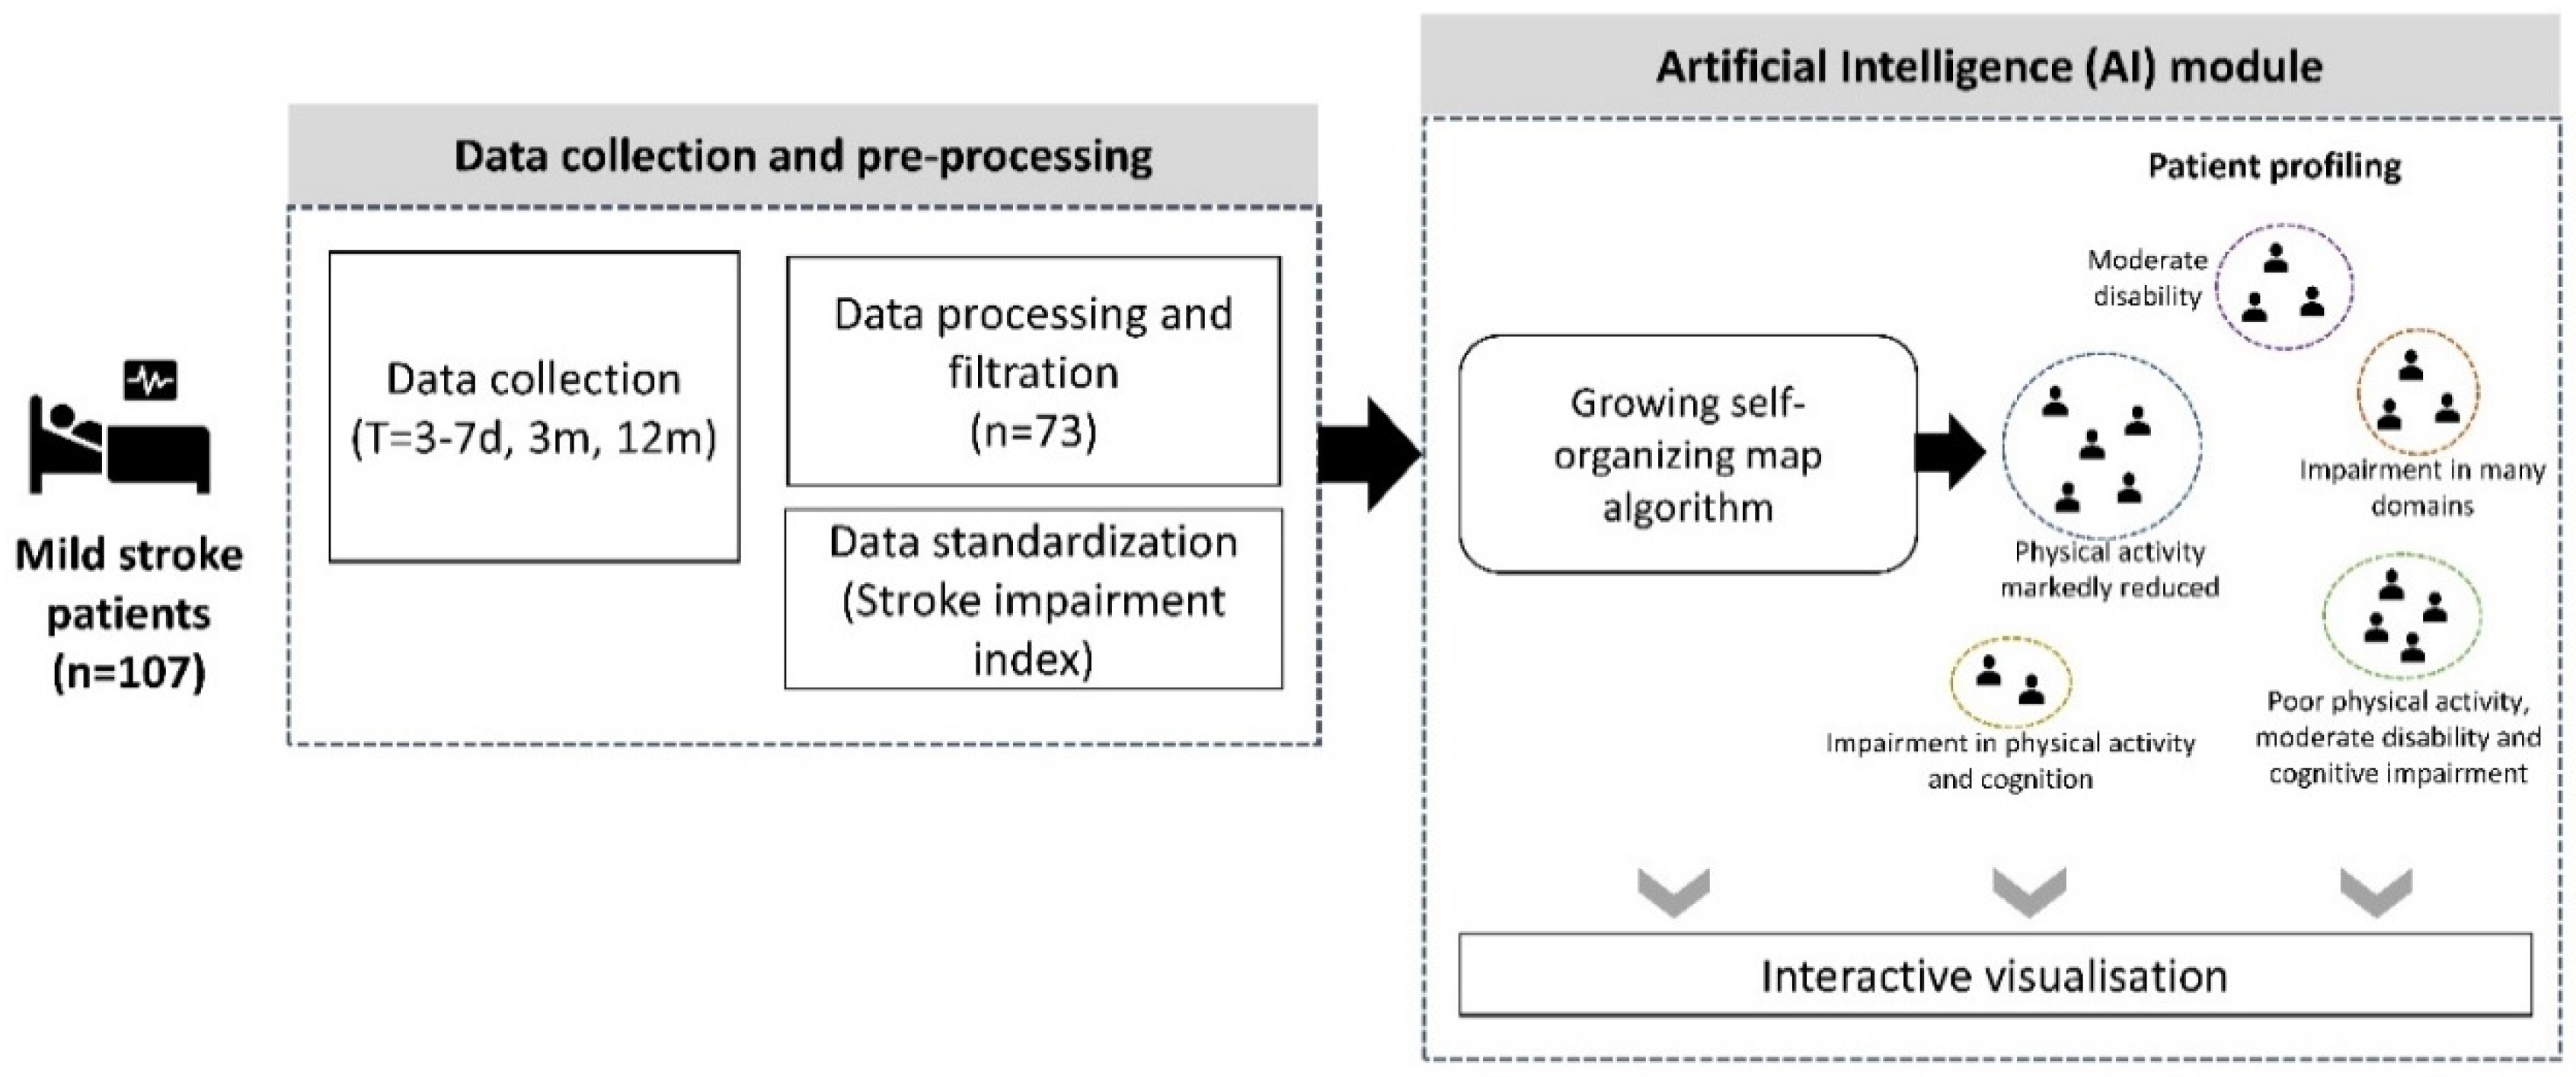
Figure 3.
Impairment profiles identified within NIHSS.
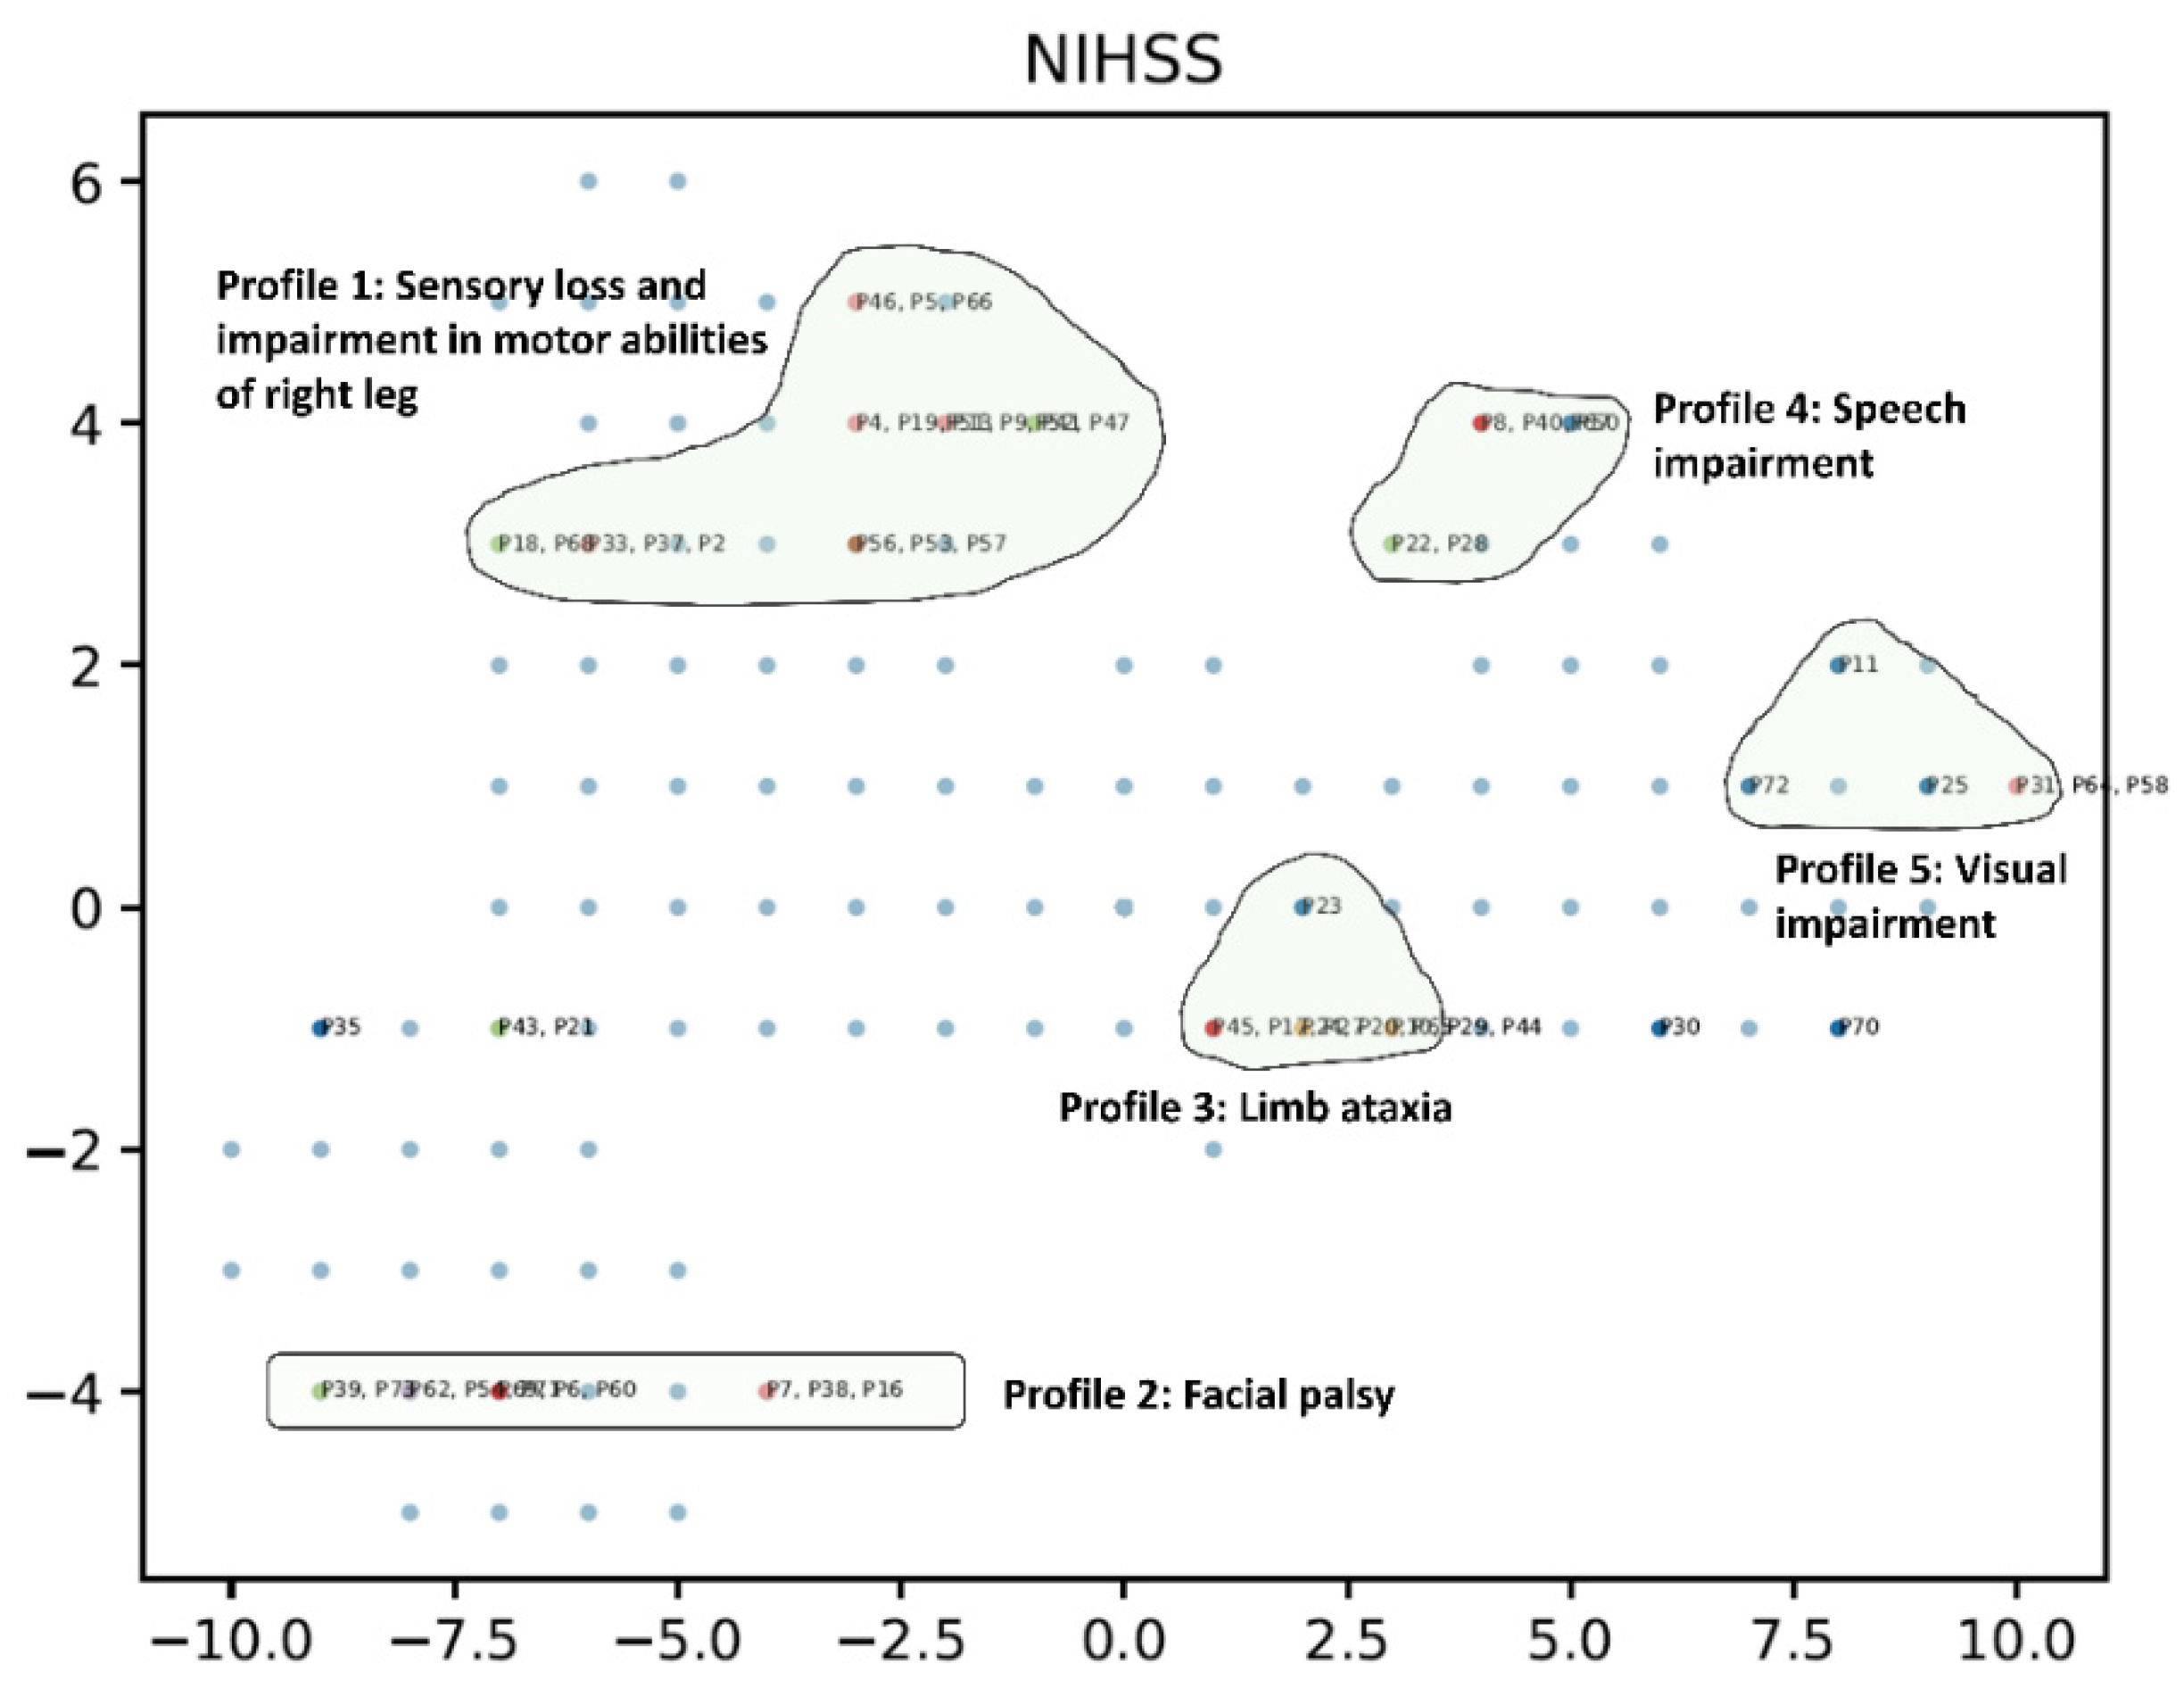
Figure 4.
Illustration of assessment scores across domains in two mild stroke survivors.
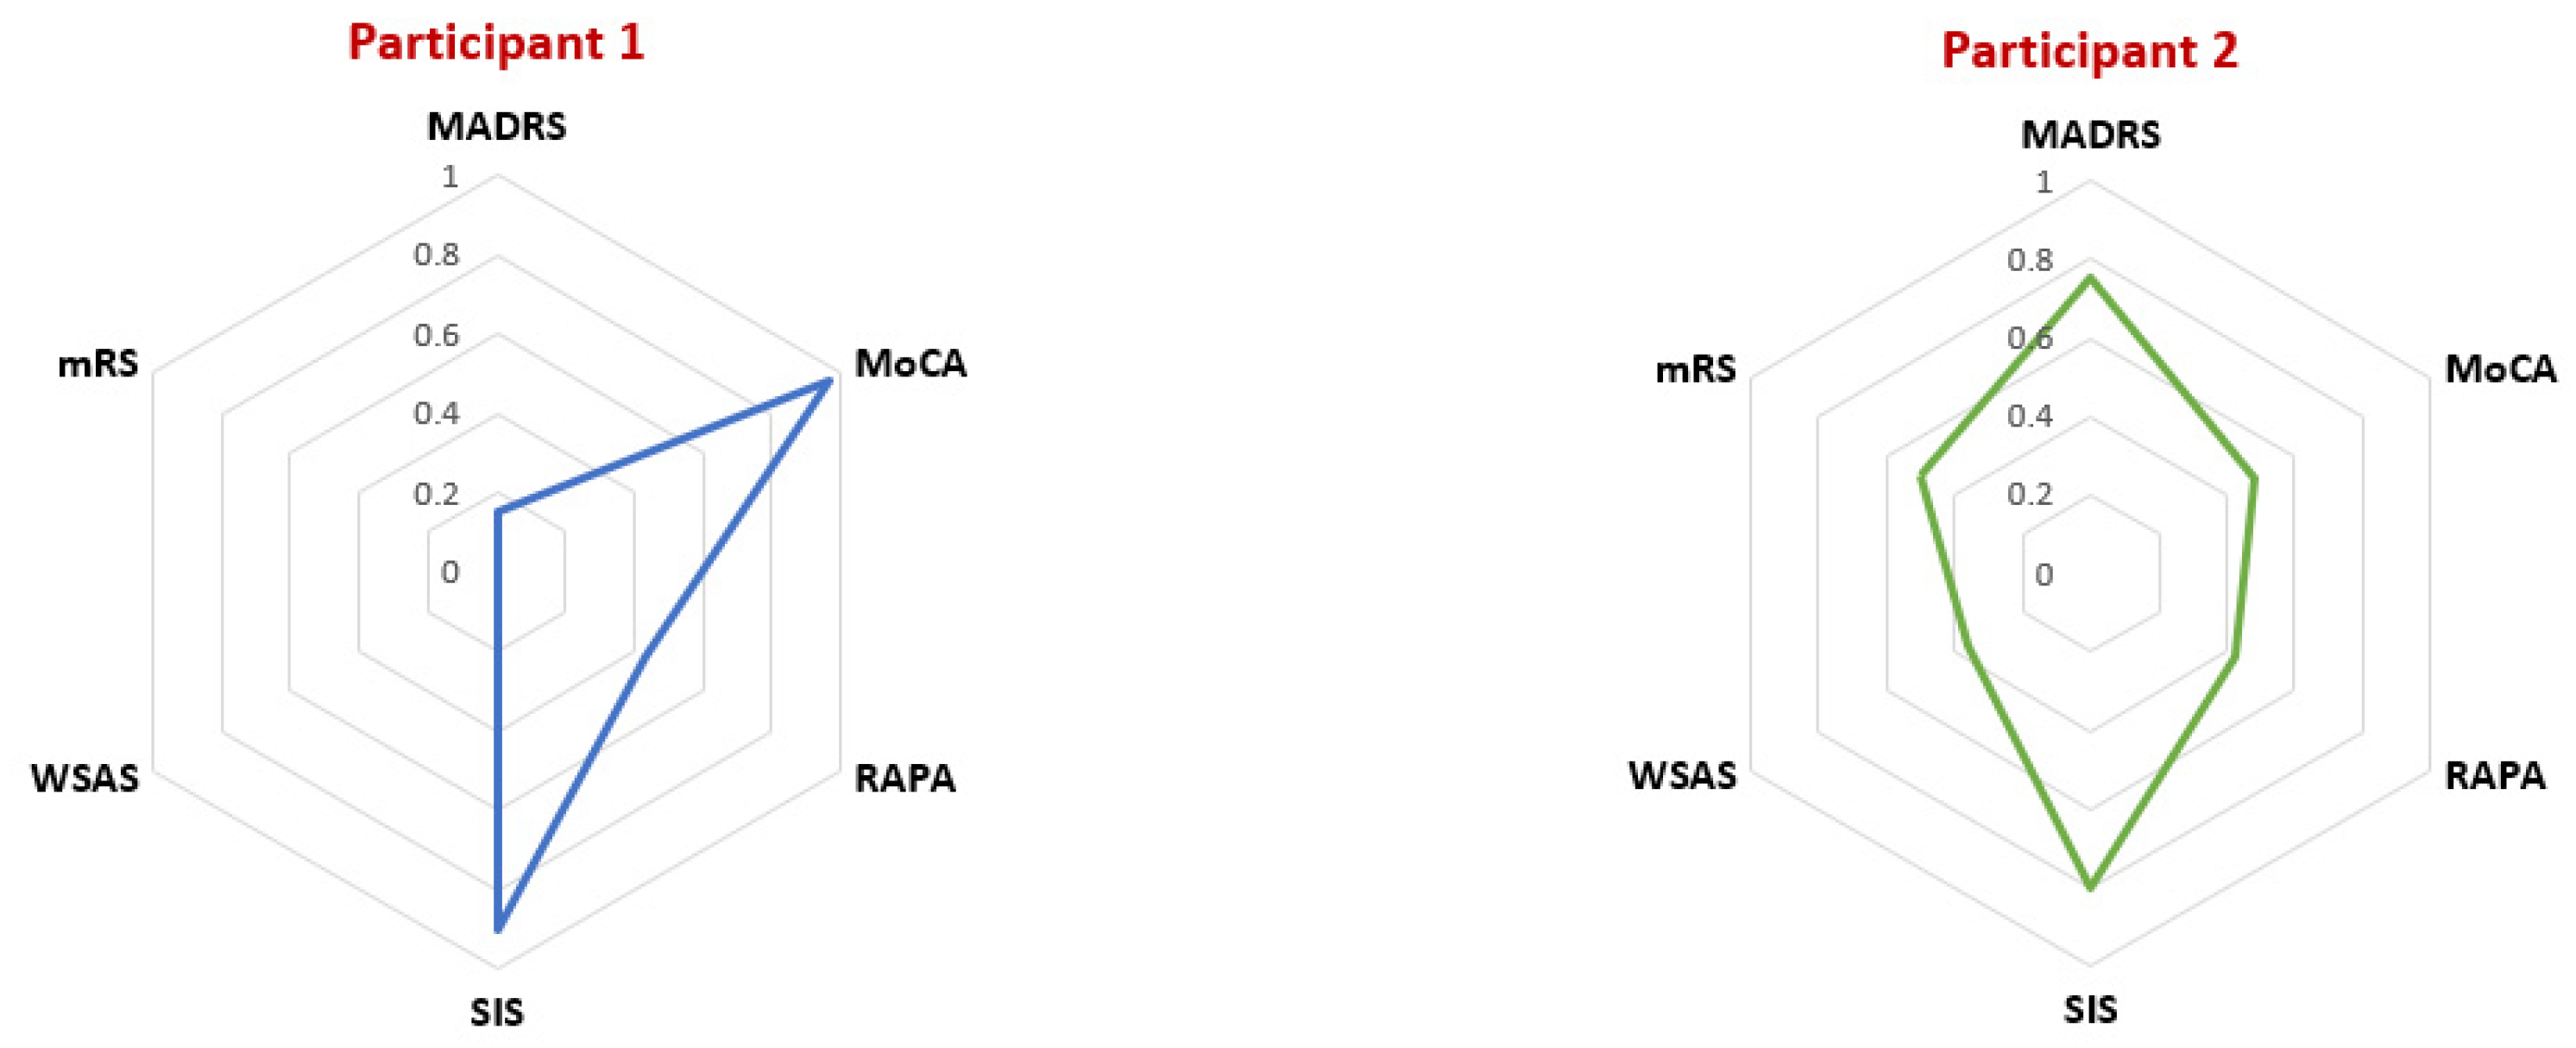
Figure 5.
Illustration of variations in mild stroke survivors.
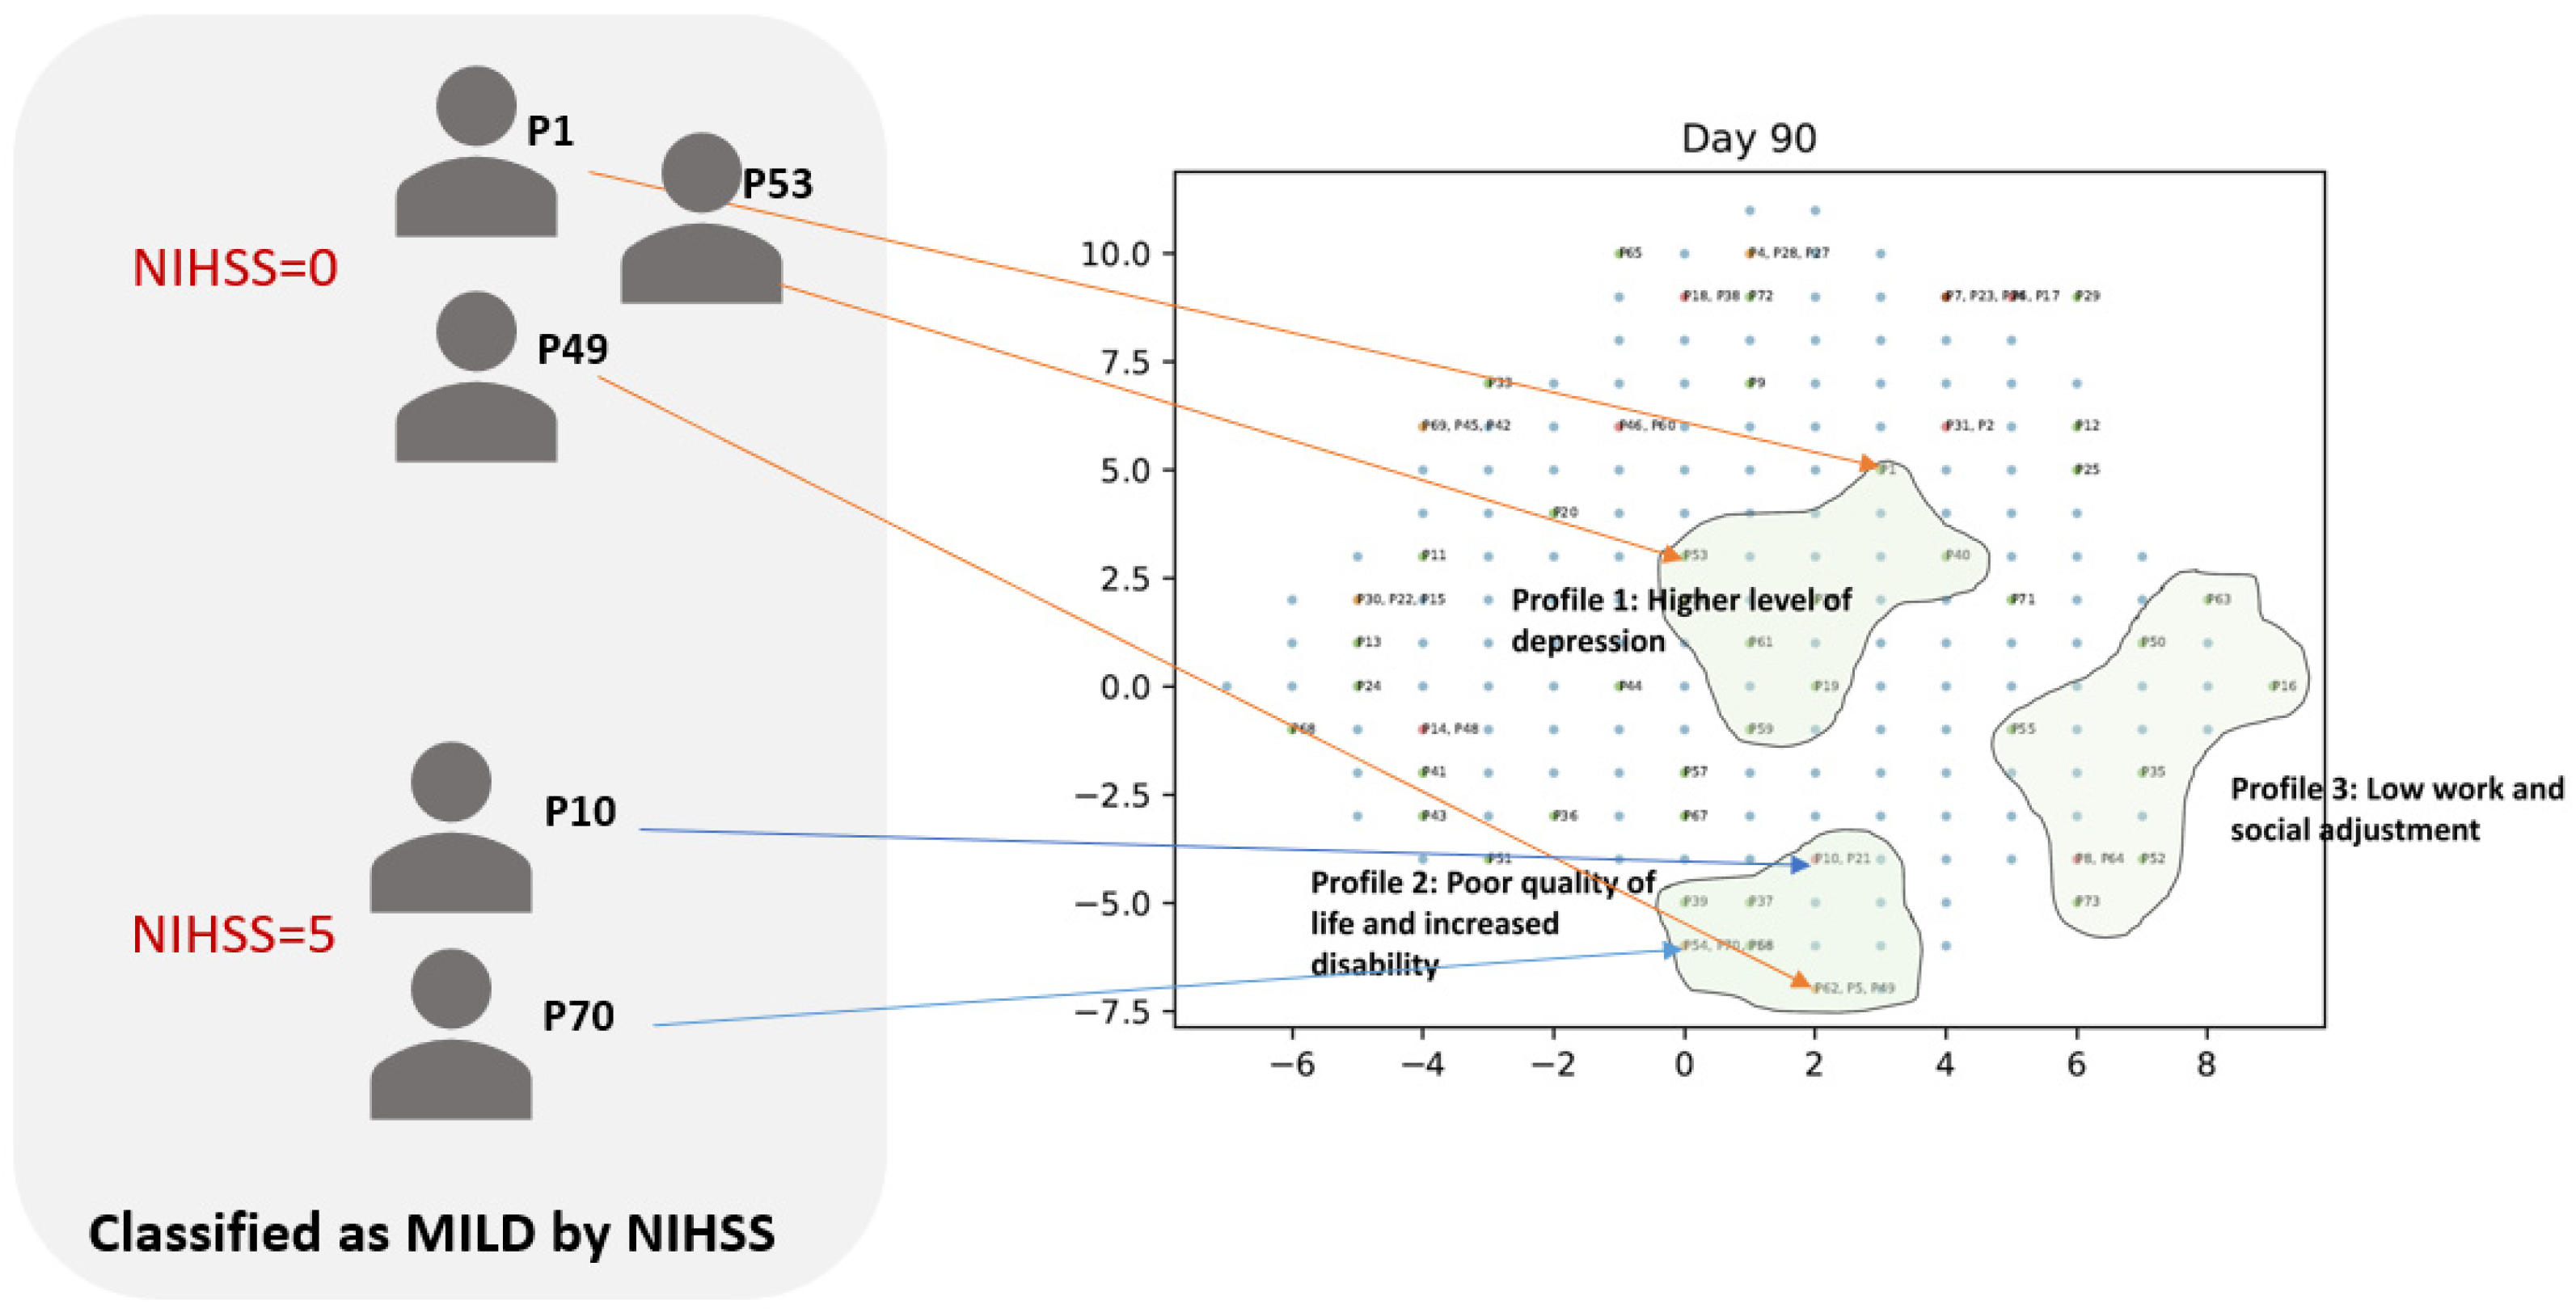
Figure 6.
Impairment profiles on days 3-7 post-stroke.
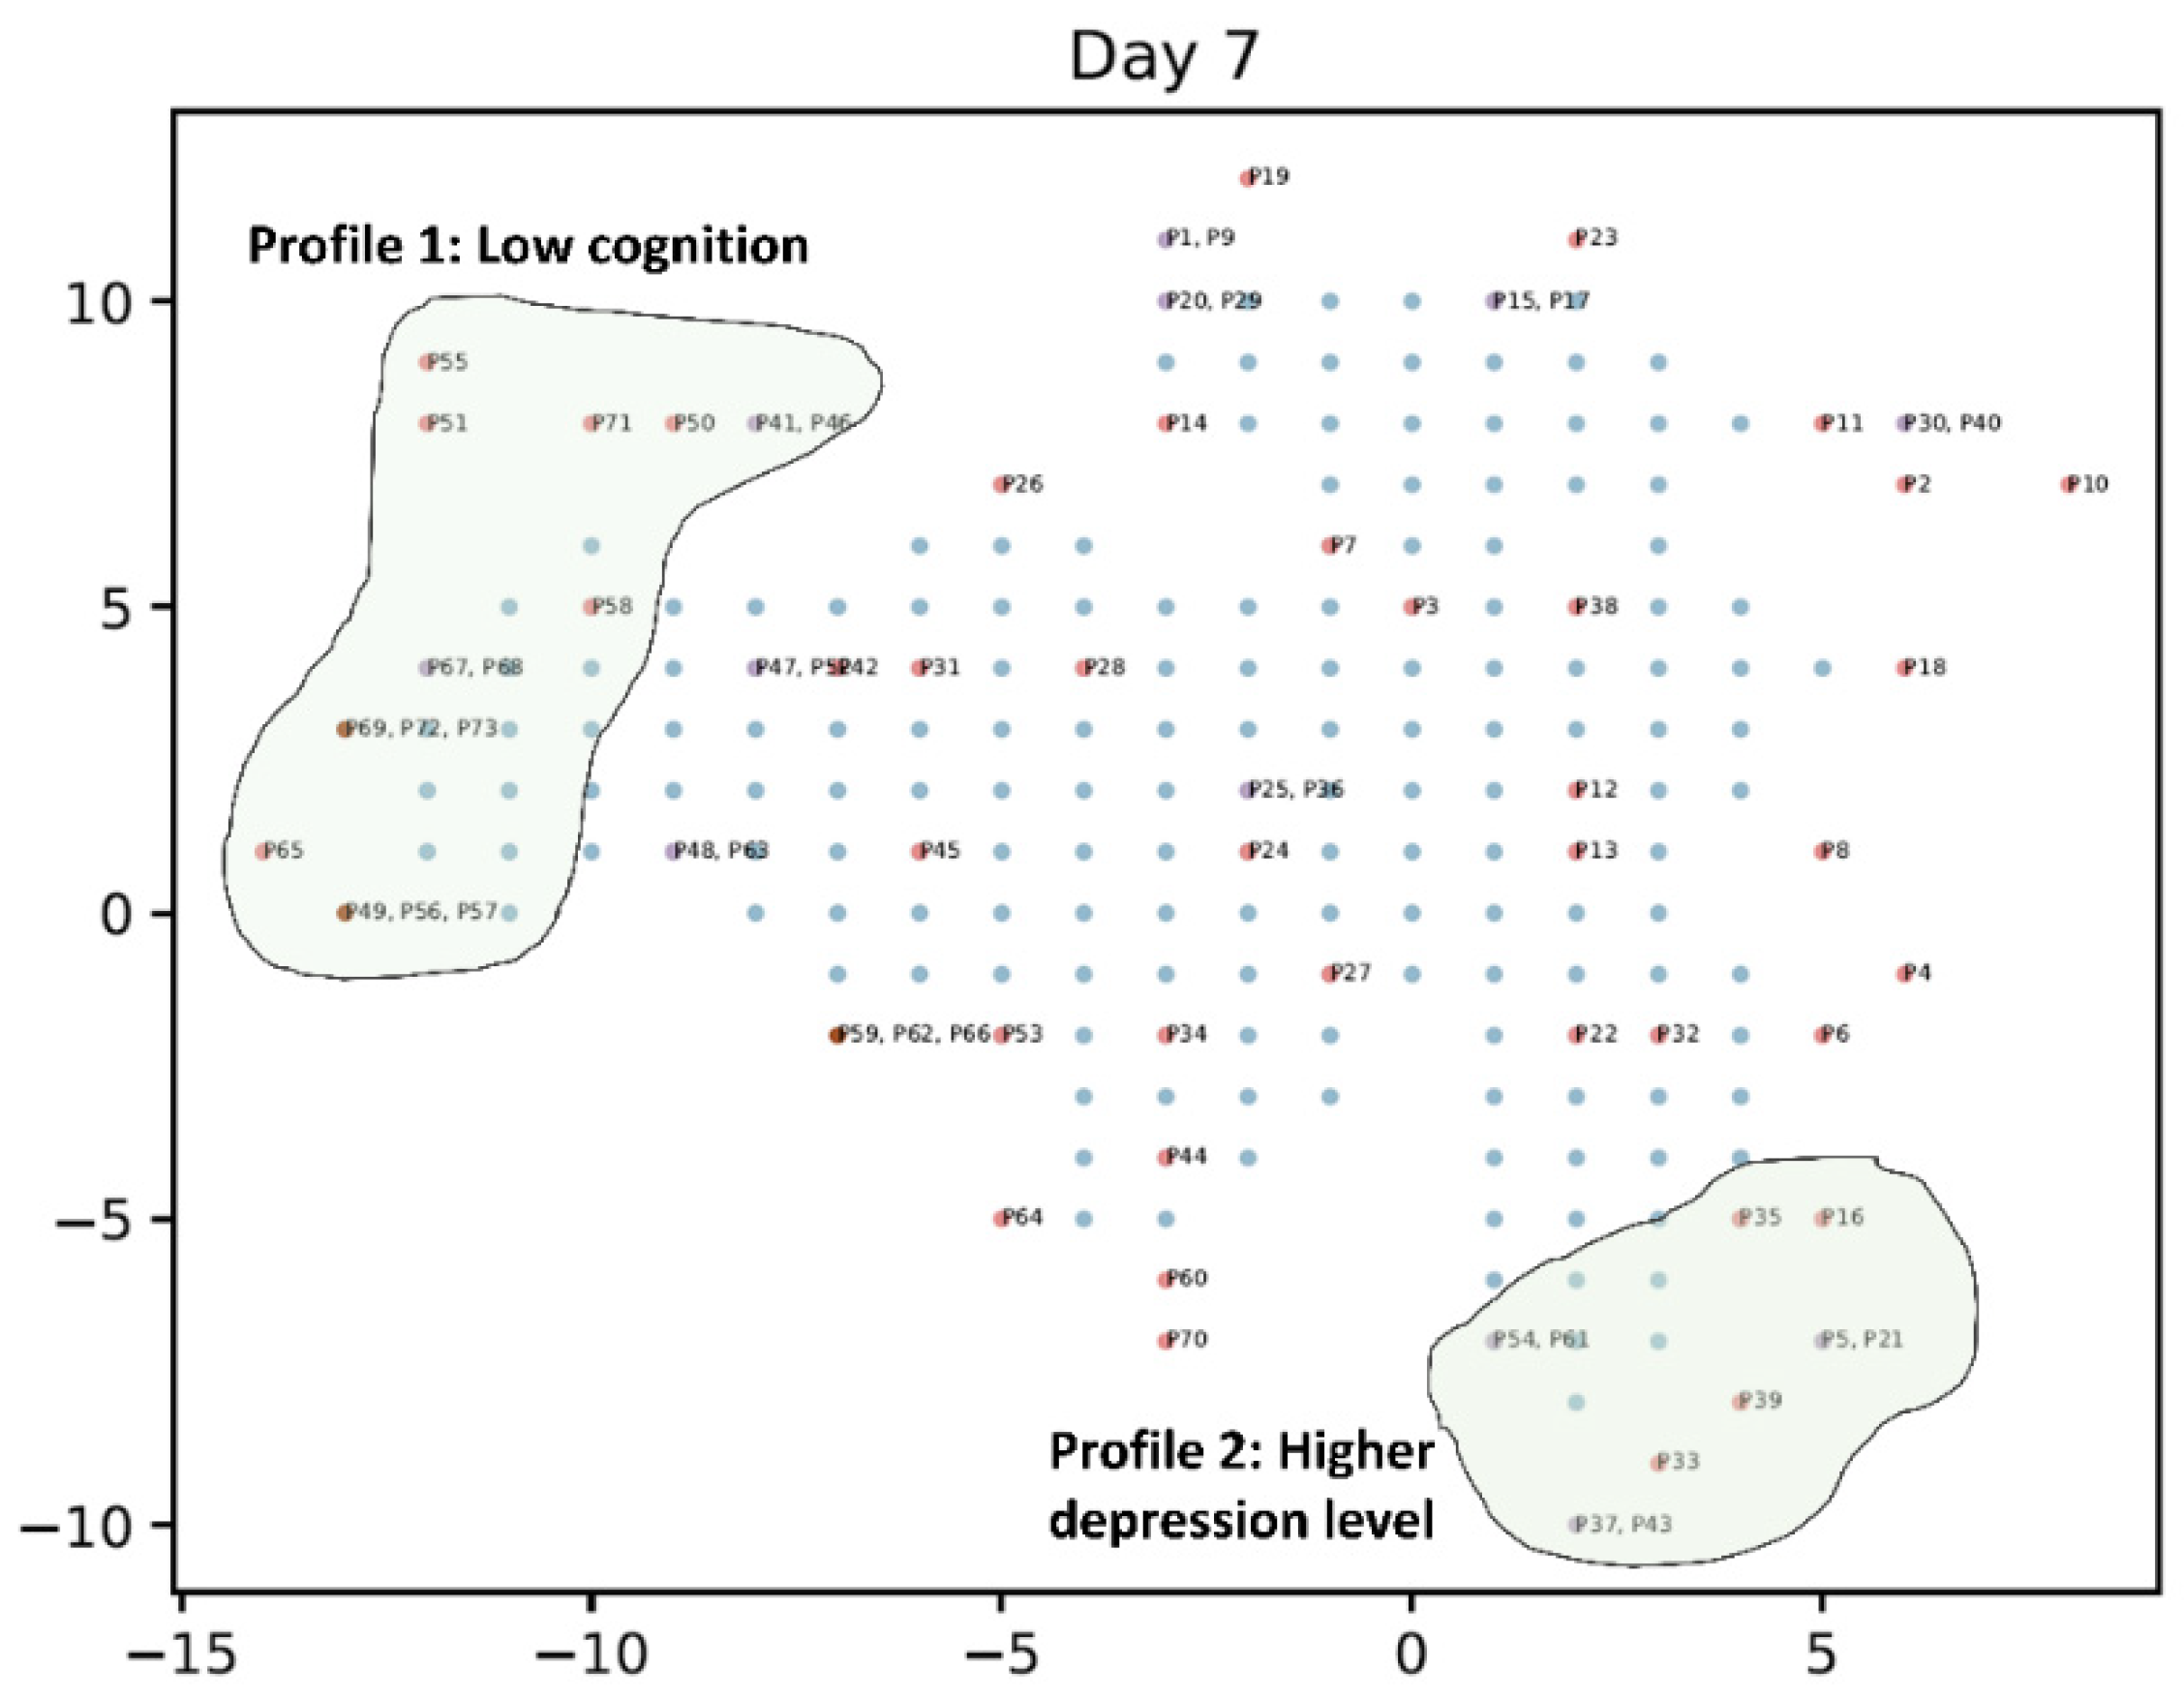
Figure 7.
Impairment profiles at 3 months post-stroke.
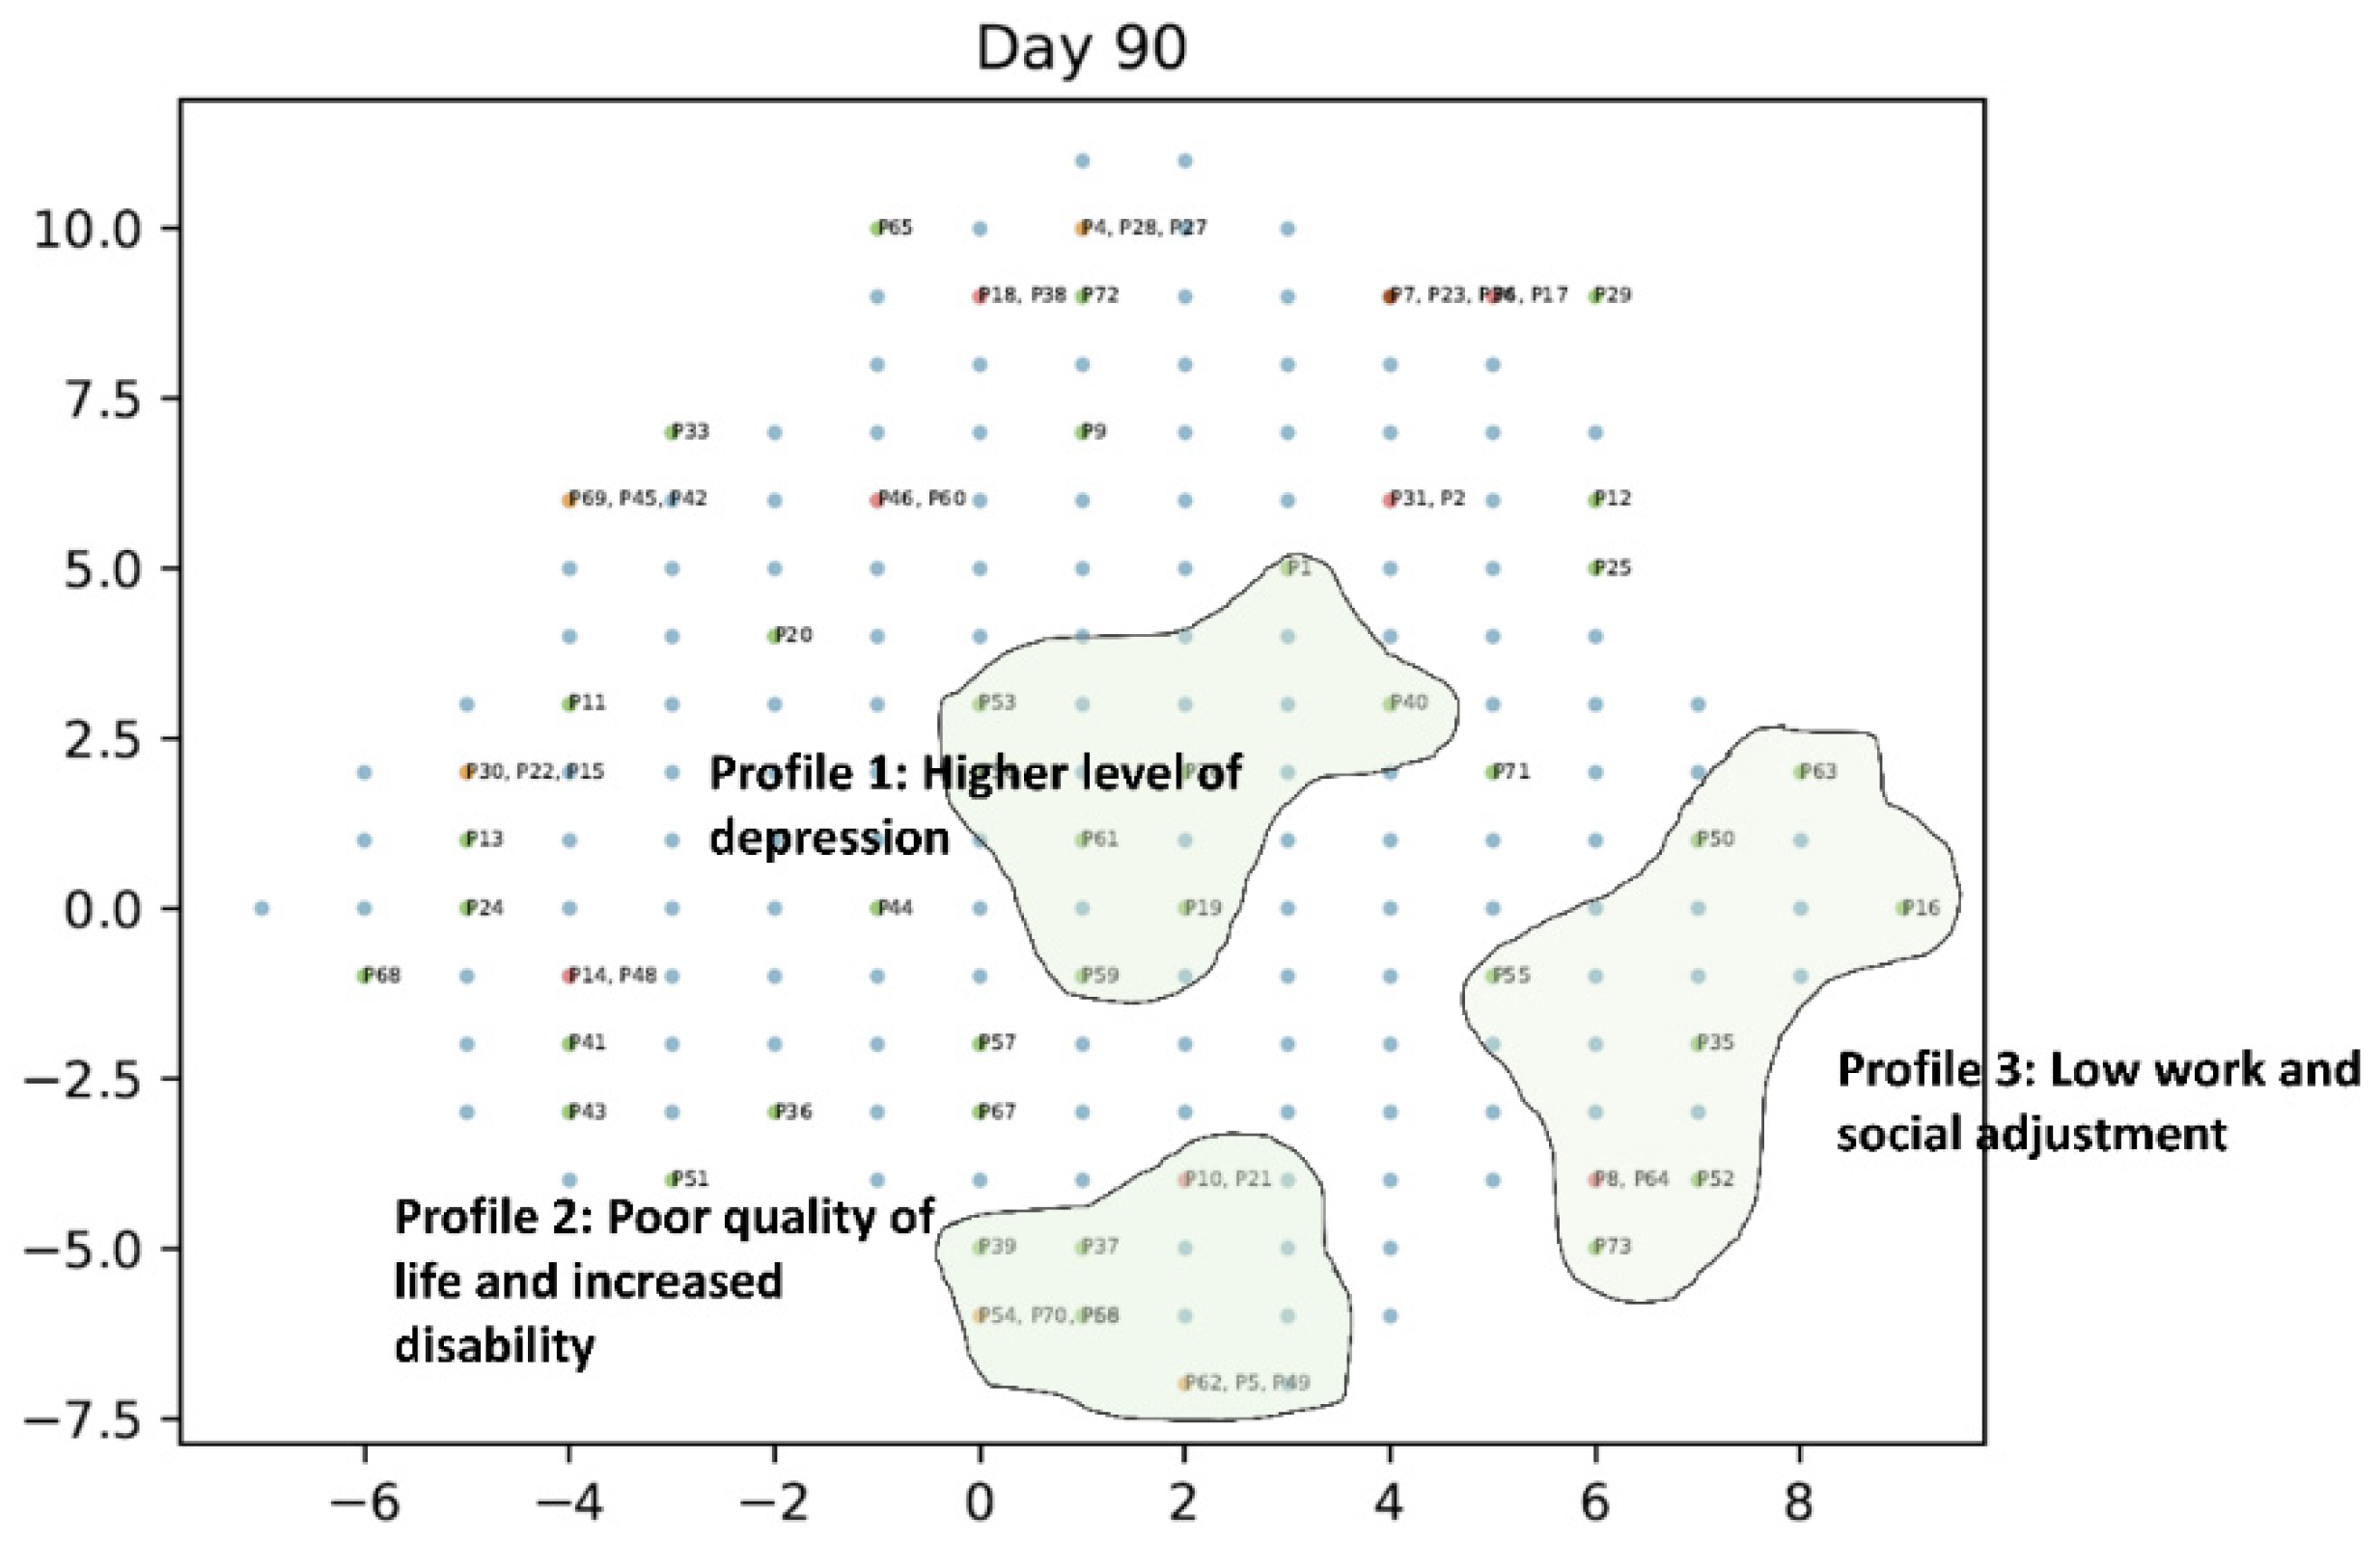
Figure 8.
Impairment profiles at 12 months post-stroke.
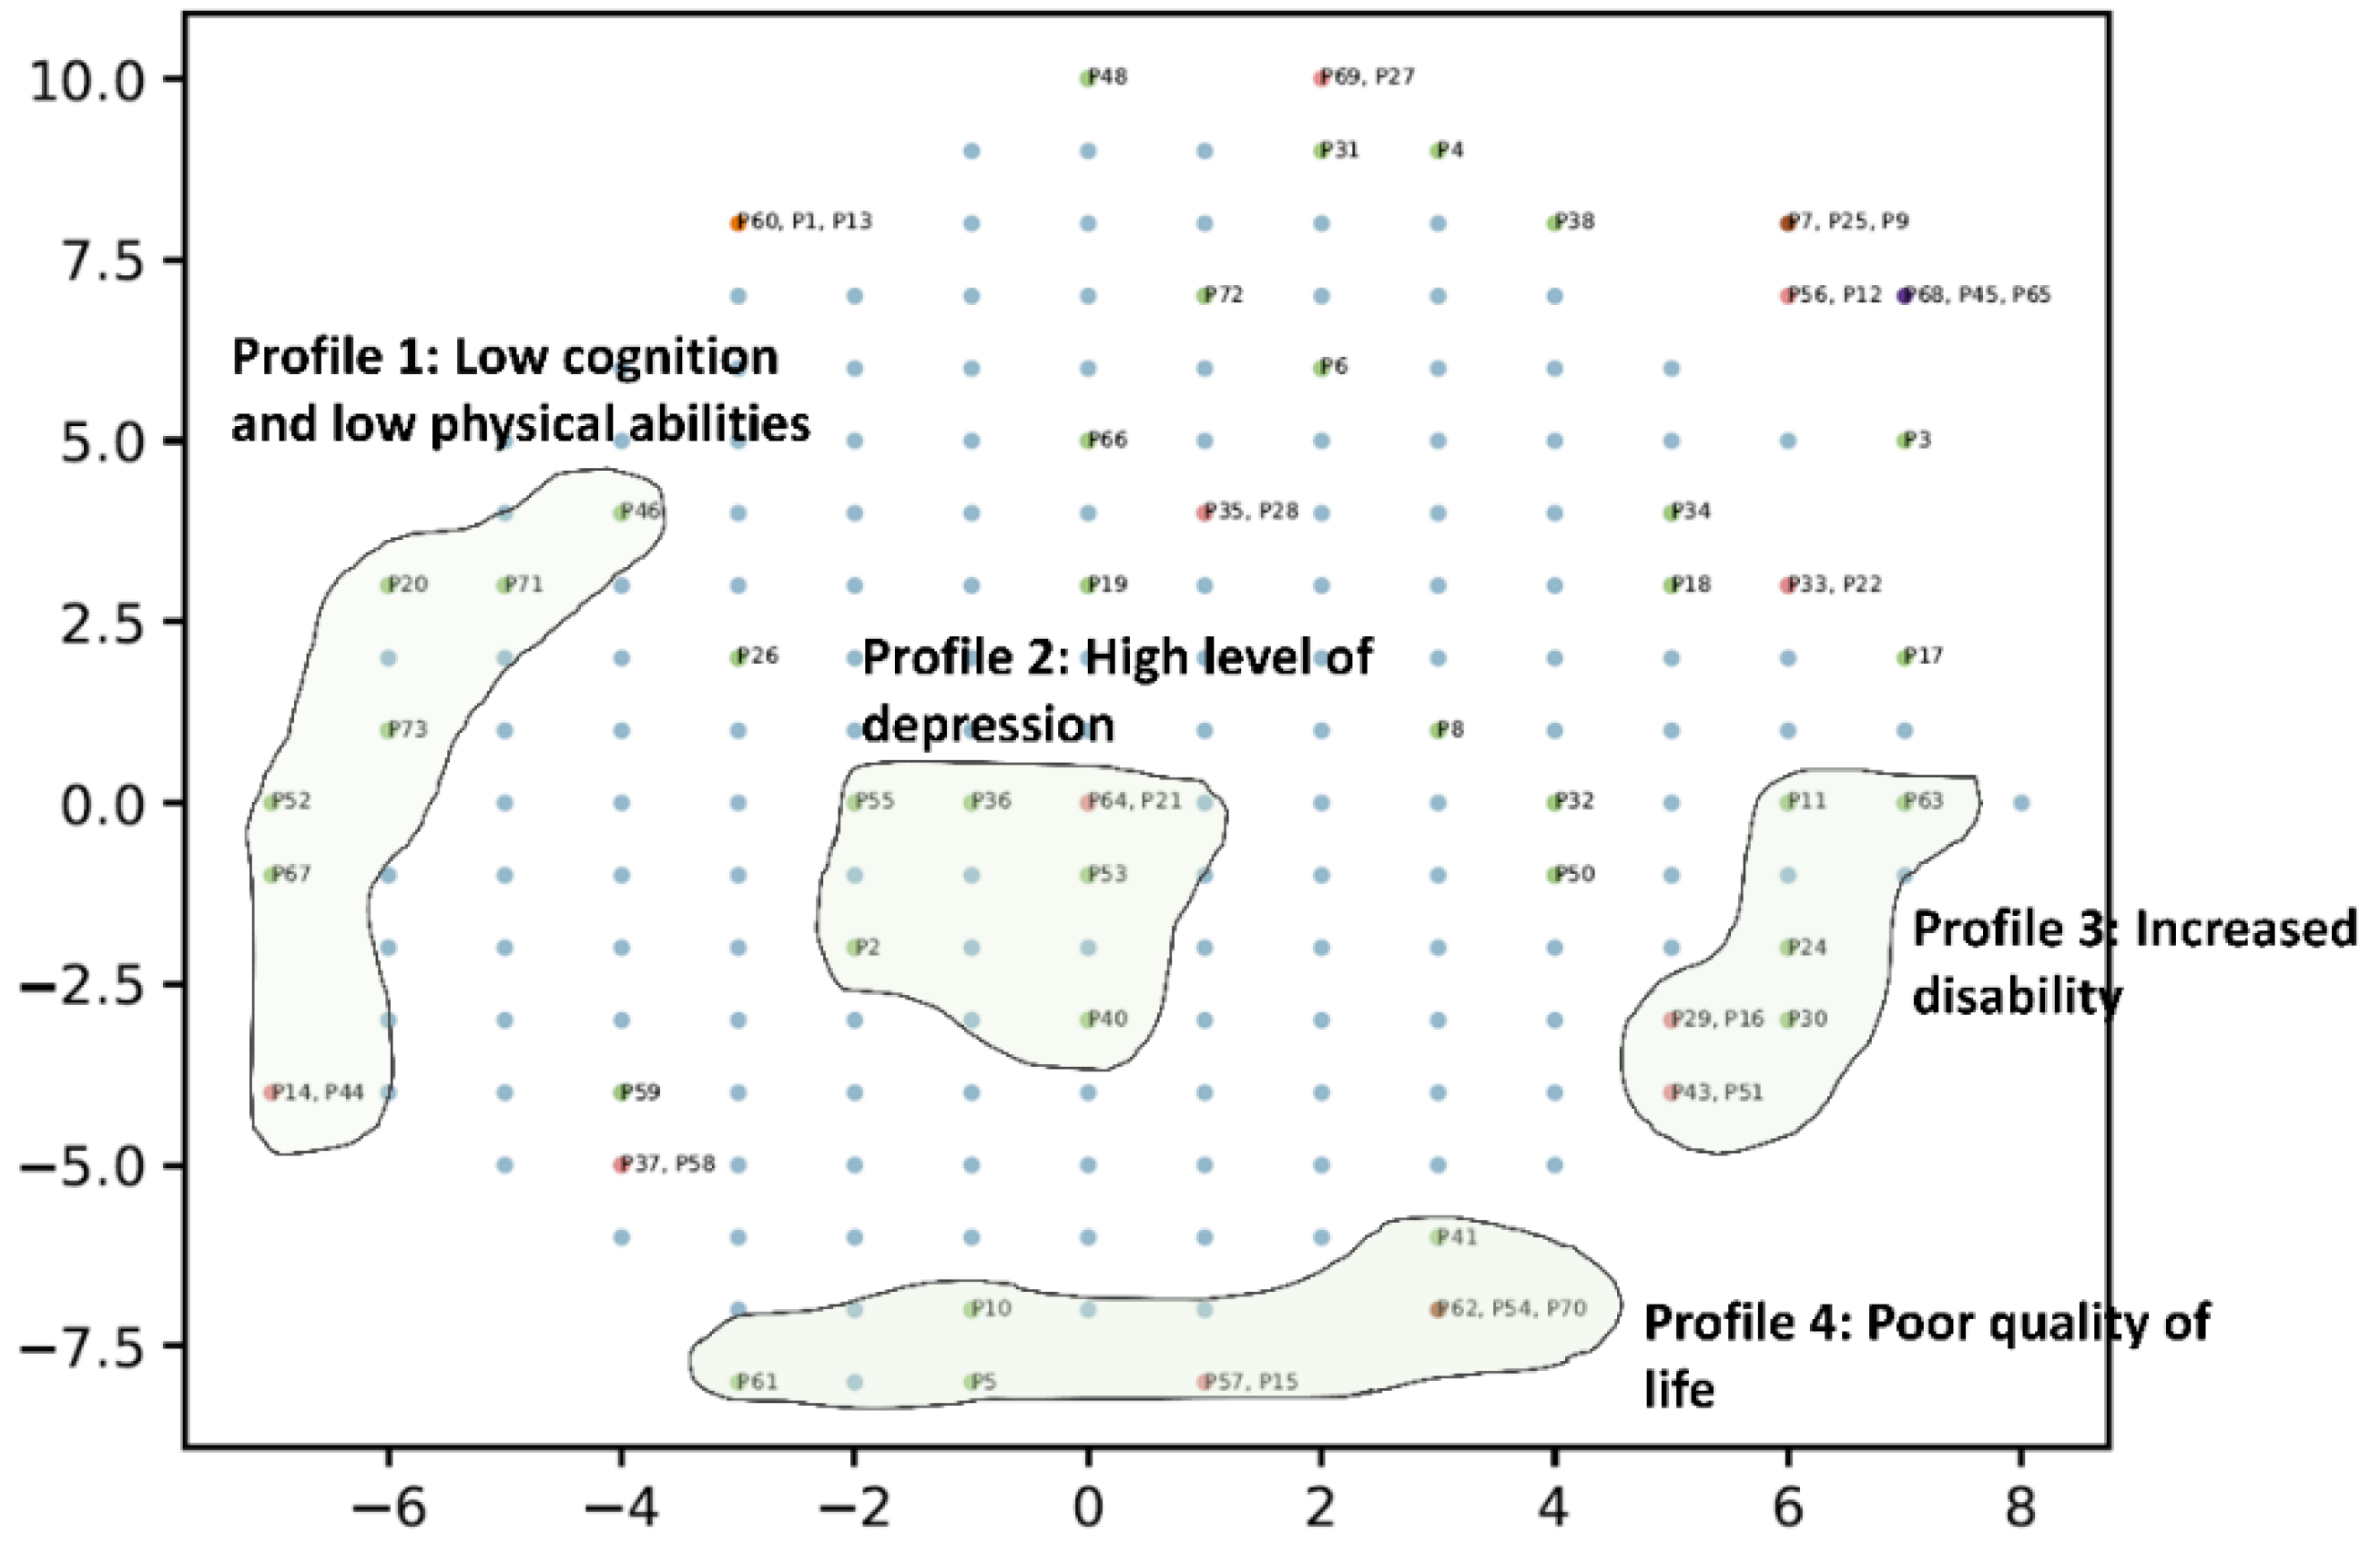
Figure 9.
Individual recovery trajectories.
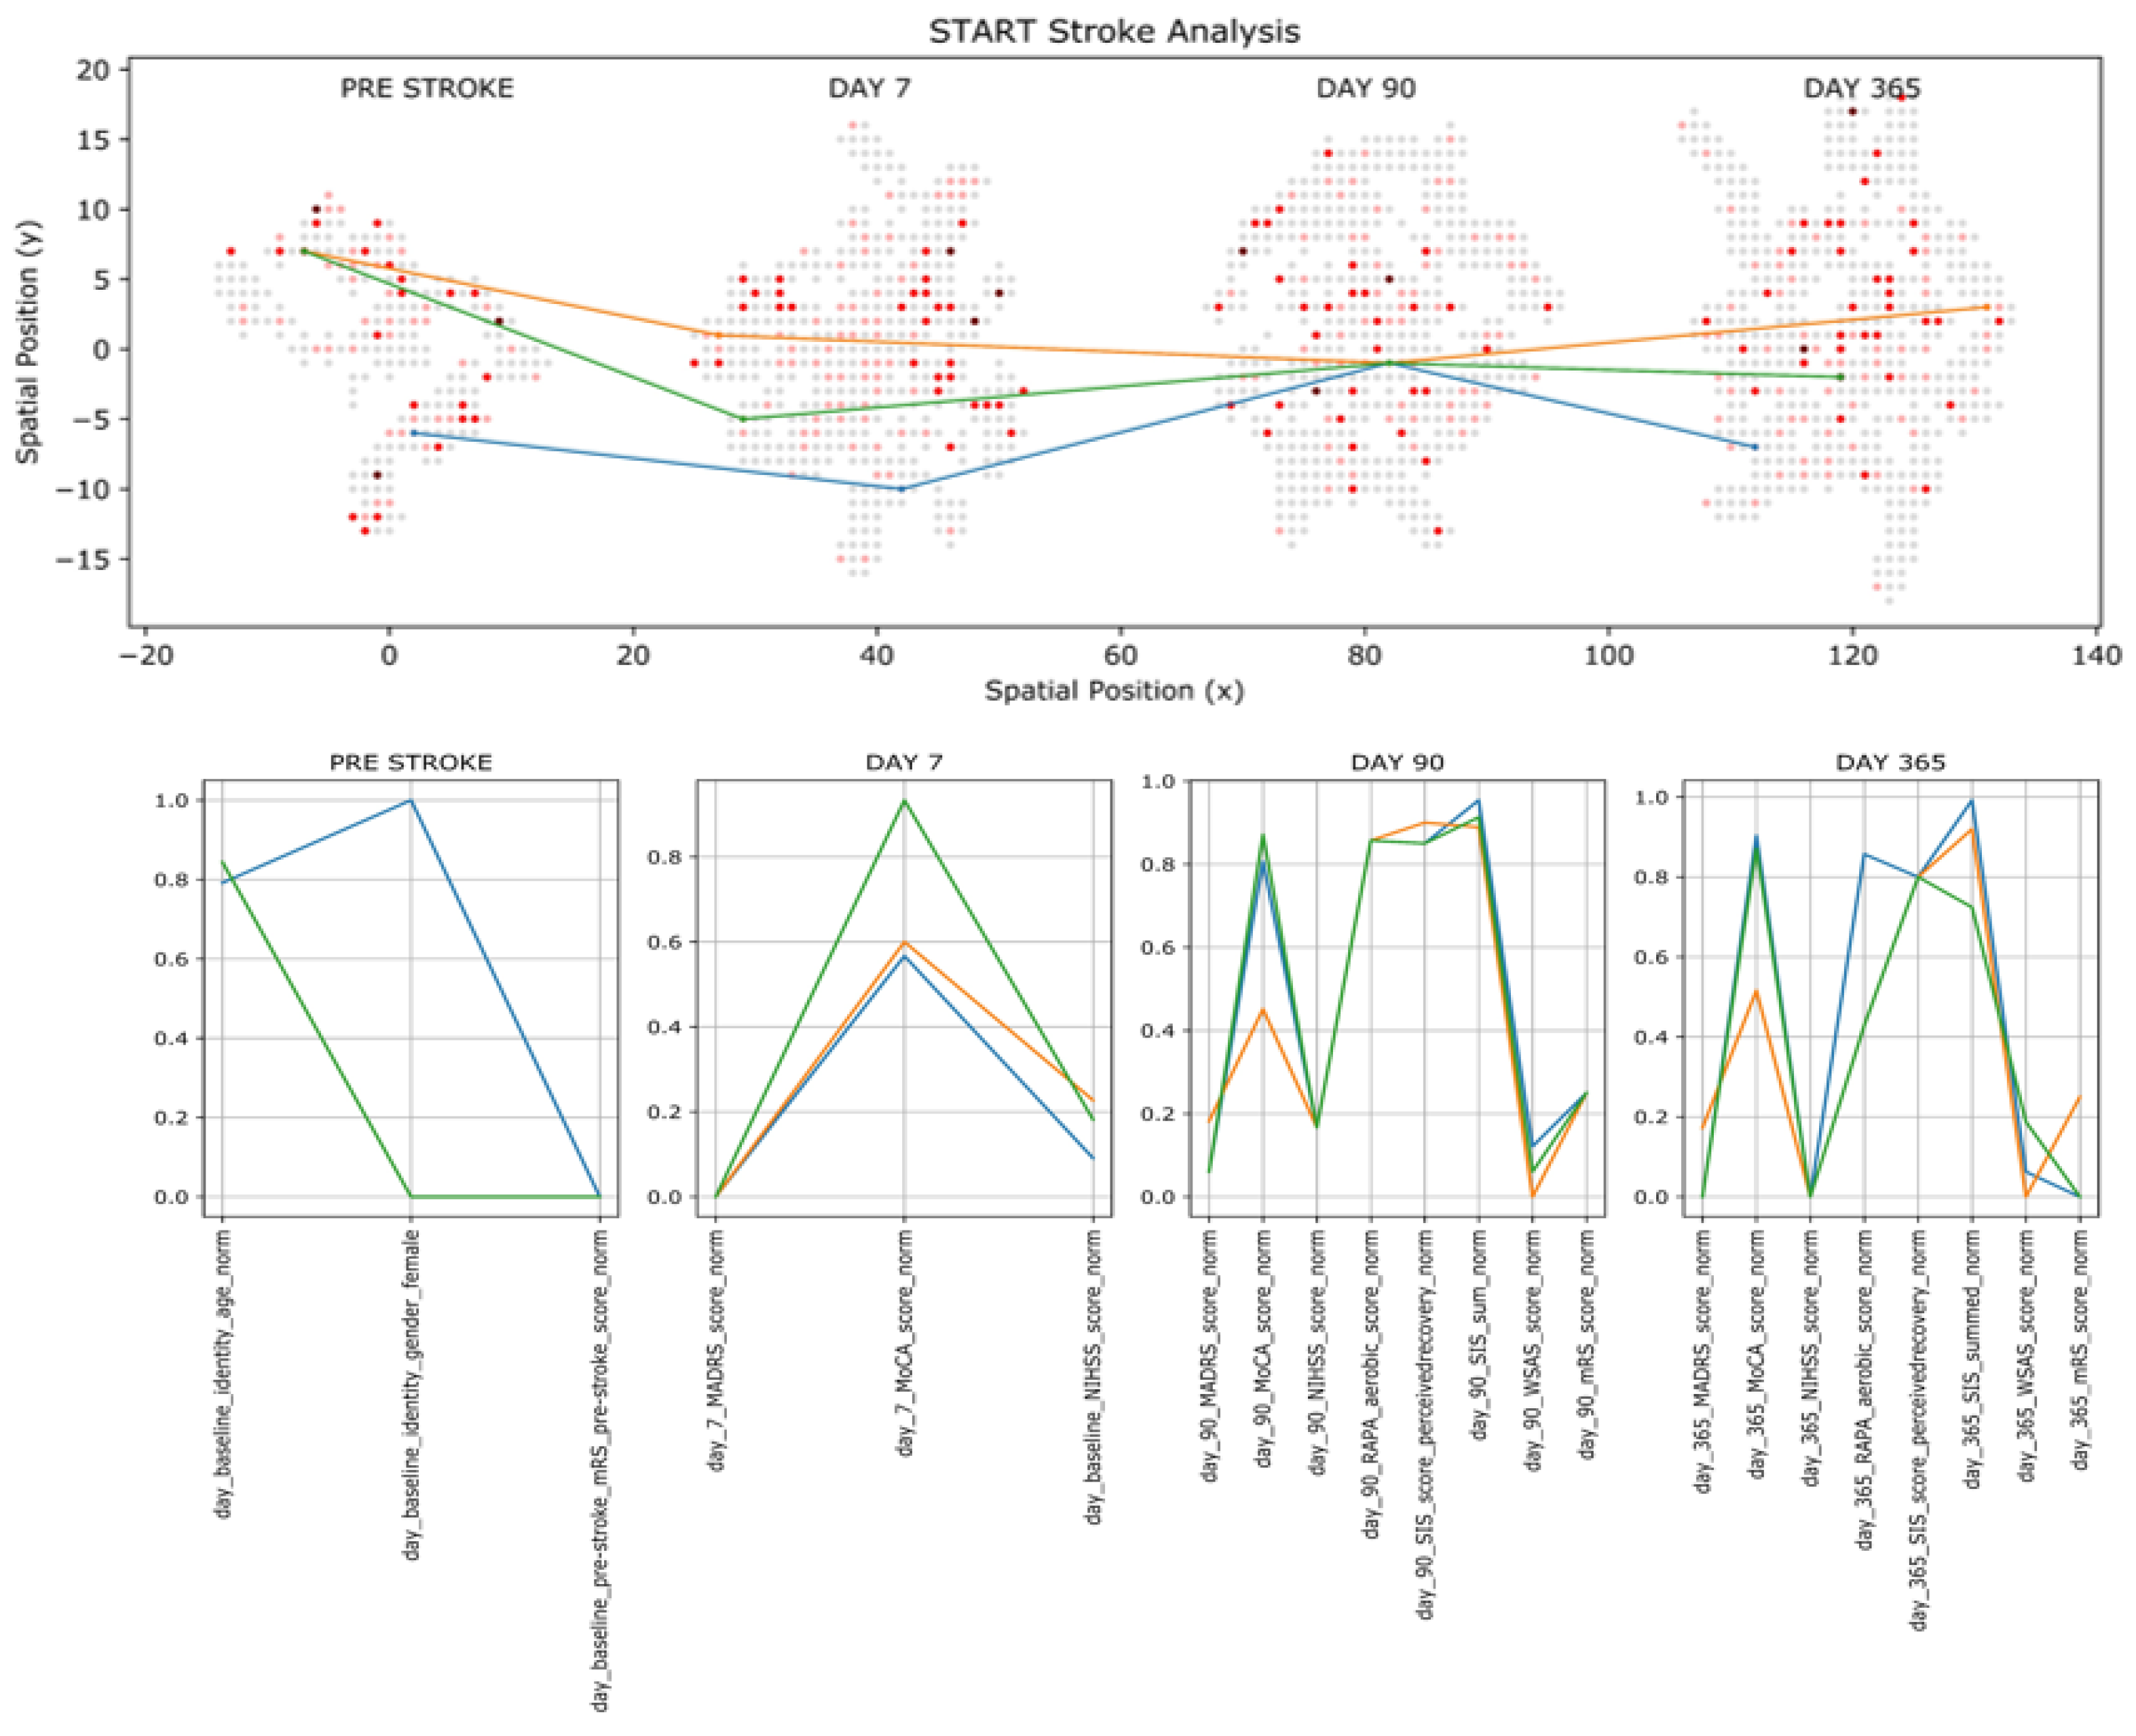

Table 1.
Demographic characteristics of ‘mild’ stroke survivors included in the study (n=73).
| n (%) | |
|---|---|
| Sex | |
| Male | 51 (69.9%) |
| Female | 22 (30.1%) |
| Age group | |
| Mean (years) | 71.45 |
| Standard deviation (years) | 11.37 |
| Ethnicity | |
| Asia | 4 (5.5%) |
| Australian or New Zealander | 46 (63.0%) |
| Europe | 17 (23.3%) |
| other | 6 (8.2%) |
| Marital Status | |
| divorced | 13 (17.8%) |
| married/de facto | 51 (69.9%) |
| other | 2 (2.7%) |
| single | 2 (2.7%) |
| widowed | 5 (6.8%) |
| Employment | |
| employed for wages | 18 (24.7%) |
| homemaker | 1 (1.4%) |
| out of work for < 1 year, | 2 (2.7%) |
| retired | 44 (60.3%) |
| self-employed | 7 (9.6%) |
| unable to work | 1 (1.4%) |
Table 2.
Clinical characteristics and functional outcomes of ‘mild’ stroke survivors at 3-7 days, 3-months and 12-months post-stroke.
Table 2.
Clinical characteristics and functional outcomes of ‘mild’ stroke survivors at 3-7 days, 3-months and 12-months post-stroke.
| Time post-stroke | Median | IQR | Q1 | Q3 |
|---|---|---|---|---|
| 3-7 days | ||||
| NIHSS | 2.00 | 2.25 | 1.00 | 3.25 |
| MoCA | 26.00 | 5.25 | 22.75 | 28.00 |
| MADRS | 3.00 | 5.25 | 0.75 | 6.00 |
| 3-months | ||||
| NIHSS | 0.00 | 1.00 | 0.00 | 1.00 |
| MoCA | 27.00 | 4.00 | 25.00 | 29.00 |
| MADRS | 4.00 | 8.00 | 1.00 | 9.00 |
| mRS | 1.00 | 1.00 | 1.00 | 2.00 |
| RAPA | 5.00 | 3.00 | 4.00 | 7.00 |
| WSAS | 2.00 | 10.00 | 0.00 | 10.00 |
| SIS | 93.06 | 9.21 | 87.55 | 96.76 |
| 12-months | ||||
| NIHSS | 0.00 | 1.00 | 0.00 | 1.00 |
| MoCA | 27.00 | 4.00 | 24.00 | 28.00 |
| MADRS | 3.00 | 8.00 | 0.00 | 8.00 |
| mRS | 1.00 | 2.00 | 0.00 | 2.00 |
| RAPA | 5.00 | 4.00 | 3.00 | 7.00 |
| WSAS | 2.00 | 8.00 | 0.00 | 8.00 |
| SIS | 93.58 | 11.39 | 86.21 | 97.60 |
NIHSS (National Institute of Health Stroke Scale; 0 to 42); MADRS (Montgomery-Asberg Depression Rating Scale; scale range 0 to 60); MoCA (Montreal Cognitive Assessment; 0 to 30); mRS (Modified Rankin Scale; 0 to 6); SIS (Stroke Impact Scale; 0 to 100); RAPA (Rapid Assessment of Physical Activity; 0 to 10); WSAS (Work and Social Adjustment Scale; 0 to 40).
Table 3.
Comparison of impairment profiles identified within NIHSS.
| Profile 1: Sensory loss and impairment in motor abilities of the right leg | ||
|---|---|---|
| Sensory loss | Profile 1 | Other participants |
| Mean | 0.571 | 0.068 |
| Variance | 0.264 | 0.064 |
| Observations | 14 (19.2%) | 59 (80.8%) |
| p=0.001 | ||
| Motor leg (right) | ||
| Mean | 0.500 | 0.017 |
| Variance | 0.423 | 0.017 |
| Observations | 14 (19.2%) | 59 (80.8%) |
| p=0.008 | ||
| Profile 2: Facial palsy | ||
| Profile 2 | Other participants | |
| Mean | 1.727 | 0.274 |
| Variance | 0.618 | 0.202 |
| Observations | 11 (15.06%) | 62 (84.93%) |
| p=0.000 | ||
| Profile 3: Limb ataxia | ||
| Profile 3 | Other participants | |
| Mean | 1.600 | 0.111 |
| Variance | 0.267 | 0.100 |
| Observations | 10.000 | 63.000 |
| p=0.000 | ||
| Profile 4: Speech impairment | ||
| Best Language | Profile 4 | Other participants |
| Mean | 1.333 | 0.075 |
| Variance | 0.267 | 0.070 |
| Observations | 6.000 | 67.000 |
| p=0.001 | ||
| Dysarthria | ||
| Mean | 1.000 | 0.313 |
| Variance | 0.000 | 0.249 |
| Observations | 6.000 | 67.000 |
| p=0.000 | ||
| Profile 5: Visual impairment | ||
| Visual field test | Profile 5 | Other participants |
| Mean | 1.500 | 0.045 |
| Variance | 0.300 | 0.074 |
| Observations | 6.000 | 67.000 |
| p=0.000 | ||
Table 4.
Comparison of impairment profiles on days 3-7 post-stroke.
| Profile 1: Low cognition | ||
|---|---|---|
| Day 3-7 MOCA Score | Profile 1 | Other participants |
| Mean | 19.000 | 25.767 |
| Variance | 13.500 | 8.250 |
| Observations | 13 (17.8%) | 60 (82.2%) |
| p=0.0000 | ||
| Profile 2: Higher depression level | ||
| Day 3-7 MADRS Score | Profile 2 | Other participants |
| Mean | 16.500 | 3.238 |
| Variance | 9.833 | 9.217 |
| Observations | 13 (17.8%) | 60 (82.2%) |
| p=0.0000 | ||
Table 5.
Comparison of impairment profiles at 3 months post-stroke.
| Profile 1: Higher depression level | ||
|---|---|---|
| MADRS | Profile 1 | Other participants |
| Mean | 12.714 | 5.469 |
| Variance | 49.238 | 48.855 |
| Observations | 7 (9.6%) | 66 (90.4%) |
| p=0.017 | ||
| Profile 2: Increased disability and poor quality of life | ||
| mRS | Profile 2 | Other participants |
| Mean | 1.667 | 0.859 |
| Variance | 0.500 | 0.535 |
| Observations | 9 (12.3%) | 64 (87.7%) |
| p=0.004 | ||
| SIS | Profile 2 | Other participants |
| Mean | 68.444 | 84.328 |
| Variance | 289.528 | 266.414 |
| Observations | 9 (12.3%) | 64 (87.7%) |
| p=0.012 | ||
| Profile 3: Low work and social adjustment | ||
| WSAS | Profile 3 | Other participants |
| Mean | 15.150 | 3.794 |
| Variance | 88.781 | 32.183 |
| Observations | 10 (13.7%) | 63 (86.3%) |
| p=0.002 | ||
Table 6.
Comparison of impairment profiles at 12 months post-stroke.
| Profile 1: Low cognition and low physical abilities | ||
|---|---|---|
| MoCA | Profile 1 | Other participants |
| Mean | 21.125 | 26.585 |
| Variance | 18.125 | 9.809 |
| Observations | 8 (11%) | 65 (89%) |
| p=0.003 | ||
| RAPA | Profile 1 | Other participants |
| Mean | 2.625 | 4.200 |
| Variance | 3.411 | 3.819 |
| Observations | 8 (11%) | 65 (89%) |
| p=0.025 | ||
| Profile 2: Higher level of depression | ||
| MADRS | Profile 2 | Other participants |
| Mean | 9.714 | 4.879 |
| Variance | 30.238 | 39.770 |
| Observations | 7 (9.6%) | 66 (90.4%) |
| p=0.030 | ||
| Profile 3: Increased disability | ||
| mRS | Profile 3 | Other participants |
| Mean | 1.500 | 0.754 |
| Variance | 0.571 | 0.657 |
| Observations | 8 (11%) | 65 (89%) |
| p=0.014 | ||
| Profile 4: Poor quality of life | ||
| SIS | Profile 4 | Other participants |
| Mean | 70.556 | 87.672 |
| Variance | 190.278 | 169.113 |
| Observations | 9 (12.3%) | 64 (87.7%) |
| p=0.002 | ||
Disclaimer/Publisher’s Note: The statements, opinions and data contained in all publications are solely those of the individual author(s) and contributor(s) and not of MDPI and/or the editor(s). MDPI and/or the editor(s) disclaim responsibility for any injury to people or property resulting from any ideas, methods, instructions or products referred to in the content. |
© 2024 by the authors. Licensee MDPI, Basel, Switzerland. This article is an open access article distributed under the terms and conditions of the Creative Commons Attribution (CC BY) license (https://creativecommons.org/licenses/by/4.0/).
Copyright: This open access article is published under a Creative Commons CC BY 4.0 license, which permit the free download, distribution, and reuse, provided that the author and preprint are cited in any reuse.


