

Submitted:
12 July 2024
Posted:
14 July 2024
You are already at the latest version
Abstract
Identifying punch types as part of punch kinematic analysis is a key component for both coaches and players, providing critical insights into the variety and effectiveness of punches, which are essential for refining overall performance. Existing research indicates that punch type classification typically relies on data from either wearables or video data. Both approaches have their merits and demerits but require a significant amount of labeled data for modeling the classification algorithm. In this work, we propose a novel approach that significantly reduces the labeling effort by one-sixth by leveraging video data to enhance the training information of sensor data. This enriched training phase enables more accurate punch classification with reduced labeled data. Subsequently, the real-time punch identification and classification use only the wearable data. On a real dataset, with 15% of the labeling efforts, our approach achieved an accuracy rate of 91.41% for rear hand punch recognition and 91.91% for lead hand punch recognition, along with 92.33% and 94.56% for punch classification, respectively. Through the development of our Smart Boxer system, we aim to revolutionize punch analytics in boxing, providing comprehensive insights while enhancing the overall training and competitive experience for athletes and enriching fan engagement with the sport.
Keywords:
IoT Wearables
; punch Detection and Classification
; Computer Vision
; Punch Key Performance Indicator (KPI)
1. Introduction
In recent years, the sport of boxing has undergone a transformative evolution, driven by technological innovations such as computer vision and IoT wearables. These advancements have revolutionized the way boxers train, compete, and analyze their performance, marking a significant shift towards data-driven approaches in the sport. Through the integration of computer vision techniques, boxing training regimens have become more precise and personalized, allowing coaches and athletes to extract invaluable insights from video analysis. Furthermore, the incorporation of IoT wearables has facilitated real-time monitoring of vital physiological parameters, enabling trainers to optimize training protocols and minimize injury risks.
1.1. Computer vision based punch analytics system
Human Action Recognition (HAR) is a crucial task in sports enabling the detection and identification of players’ actions during training, matches, and competitions. HAR involves detecting the person performing an action in a video sequence, determining the action’s duration, and identifying its type. It aims to monitor player performance by tracking movements, recognizing actions, comparing performances, and conducting statistical analyses automatically. Actions in sports encompass a range of physical movements and interactions, varying in complexity and performance level. To address this diversity, a novel systematization of actions based on complexity and interaction levels is proposed. However, certain limitations persist, such as the fixed number of input frames, which may overlook actions requiring longer temporal contexts for accurate detection [1].
Computer vision or HAR in sports, especially in boxing, is utilized to analyze the key performance indicators (KPIs) of the boxer. The statistics on a boxer’s performance, including the amount and type of punches (jab, hook, uppercut) thrown in both lead and rear hands, provide a valuable source of data and feedback that is routinely used for coaching and performance improvement purposes. In [2], a non-invasive method for extracting pose and features of behavior in boxing using vision cameras and time-of-flight sensors is presented to identify the punch types. However, sometimes the vision camera or 2D camera could not identify the punches thrown perpendicular to the camera, especially during occlusion. In [3], utilizing the overhead depth imagery is employed to alleviate challenges associated with occlusions, and robust body-part tracking is developed for the noisy time-of-flight sensors.
1.1.1. Limitations in computer vision based punch analytics system
- Achieving real-time processing of video feeds during matches requires significant computational power.
- Camera angles may not capture the entire action, leading to blind spots or occlusions.
- External factors such as arena lighting, camera vibration, or audience obstruction can impact the quality of video feeds and subsequently affect the performance of computer vision systems.
- Automatic punch recognition proves to be extremely challenging.
- The accuracy of punch classification is lower when compared to IoT wearable devices.
- Labeling frames presents a challenge in supervised machine learning tasks.
1.2. IoT sensor-based punch analytics system
Wearable IoT sensors are now validated tools, providing valuable data for athlete performance analysis in various sports. Due to microelectromechanical systems (MEMS) advancements, these sensors have become more affordable and inconspicuous, thus more accessible to coaching teams. Additionally, the integration of machine learning and artificial intelligence (AI) techniques has greatly improved regression modeling and classification in data analytics. With the sports industry increasingly focused on data, machine learning, and AI algorithms are increasingly utilized for athlete performance monitoring.
Combat sports like boxing are highly physically and emotionally demanding, requiring exceptional levels of strength, endurance, specialized fitness, mental toughness, and skill acquisition [4]. Key performance indicators (KPIs) in boxing analysis, such as punch accuracy, power, speed, defense effectiveness, ring generalship, and Ring IQ, play a crucial role in evaluating a boxer’s performance objectively [5,6,7,8]. These metrics enable coaches, trainers, and analysts to identify strengths, weaknesses, and areas for improvement, empowering them to make informed decisions aimed at enhancing performance.
Utilizing IoT sensor data for punch analysis offers a range of crucial metrics that significantly enhance the assessment of punch performance. These metrics include punch recognition, which allows for the precise identification of each punch executed by the boxer. This is vital for both the boxer and the coach, providing a detailed account of the types of punches thrown during training or competition. Additionally, punch classification further refines the analysis by categorizing punches into specific types such as jabs, hooks, or uppercuts. This classification is essential for understanding the diversity and effectiveness of the boxer’s punch repertoire, aiding in strategic planning. Total punch count is another key metric measured through IMU sensors, offering quantitative insights into the boxer’s overall activity level. This metric is valuable for assessing the boxer’s work rate and conditioning, enabling coaches to tailor training regimens for optimal performance. Furthermore, capturing each punch’s start and end times provides a temporal dimension to the analysis, offering details on the speed and efficiency of punch execution. This temporal information is crucial for refining technique and optimizing overall performance. Identifying the specific type of punch executed, such as distinguishing between a quick jab and a powerful hook, adds a layer of sophistication to the analysis. This detailed categorization assists both the boxer and the coach in honing specific aspects of technique, allowing for targeted improvements [9,10,11,12,13,14,15].
1.2.1. Limitations in IoT sensor based punch analytics system
- Sensors may be affected by impacts and movement during punches, leading to inaccurate readings or damage. so it can be used only during shadowboxing or punch bag training.
- Realtime punch prediction is not possible [16]
- Typically focus on specific areas of the body. This limited coverage may not capture the full range of movements and impacts involved in boxing, leading to incomplete or inaccurate data.
- Training and labeling more data poses challenges
- IoT sensors are primarily employed during training sessions due to the challenges of real-time implementation in live matches
- only evaluated the performance of boxers in a controlled laboratory environment, and the results may not accurately reflect real-world performance [17]
In our research, we address the complementary strengths and weaknesses of IoT wearables and vision systems in analyzing boxing performance. While IoT wearables provide accurate data, they lack real-time bout. On the other hand, vision systems offer real-time bout analysis but may suffer from accuracy issues as shown in Table 1,Table 2. To bridge this gap, we propose a framework that integrates both technologies to enhance performance assessment in boxing as shown in Figure 1. Our framework leverages IoT wearables’ data to train the vision system, aiming for improved accuracy in key performance indicators (KPIs) such as punch identification and classification. We employ an active learning technique to enhance punch recognition and classification algorithms, ensuring better accuracy and adaptability over time. Furthermore, it involves determining the total punch count, identifying the start and end times of each punch, and quantifying the count of individual punch types. This holistic perspective provides valuable insights into a boxer’s activity level, offering a comprehensive view of their engagement and effort during a training or competition session.
2. Materials and Methods
In our analysis at the Inspire Institute of Sports (IIS) in Karnataka, India, we studied five elite boxers (three males, two females) weighing 60 – 75 kg. These athletes, trained by top coaches, showcase exceptional skills. Using the MetaMotion IMU sensor by Mbientlab, we captured precise data on their movements and punch orientations. With a 200 Hz sampling frequency, ±16 g accelerometer, and ±2000 deg/s gyroscope, this sensor tracked motion across x, y, z axes in real time as shown in Figure 2. Its Bluetooth capability enabled data transmission to smartphones and computers. The high-resolution data allowed a detailed examination of punching techniques, ideal for wearable devices, sports equipment, and robotics. The IMU sensor was secured with VelcroTM bands under boxing gloves on both left and right wrists.
2.1. Data Acquisition
The technique was to enable the simultaneous collection of IMU data, as shown in Figure 3 and video data recording at 60 FPS for labeling and ground truth validation. During the data collection session, eight elite boxers (6 orthodox boxers & 2 southpaw boxers) executed a series of 320 shadowboxing punches, encompassing 14 different punch types each. These encompassed long-range lead jabs to the head, long-range rear jabs to the head, long-range lead jabs to the body, long-range rear jabs to the body, long-range lead hooks to the head, long-range rear hooks to the head, mid-range lead hooks to the head, mid-range rear hooks to the head, mid-range lead steep hooks to the head, mid-range rear steep hooks to the head, mid-range lead hooks to the body, mid-range rear hooks to the body, mid-range lead uppercuts to the head, and mid-range rear uppercuts to the head.
In the preliminary stages of our research, we focused on classifying six distinct punch types, including a category for ’no punch.’ These classifications considered actions of both the lead and rear hand. The punch types examined included maneuvers with the lead hand such as the ’long-range lead jab to the head (jab),’ ’mid-range lead hook to the head (hook),’ and ’mid-range lead uppercut to the head (uppercut).’ For the rear hand actions, we considered the ’no punch’ category alongside the ’long-range rear jab to the head (jab),’ ’mid-range rear hook to the head (hook),’ and ’mid-range rear uppercut to the head (uppercut)’.
2.2. Data Pre-Processing
After collecting data from the IMU sensor and cameras, the video frames were not synchronized with each other. This lack of synchronization made it difficult to validate the ground truth and label punching events accurately. Therefore, there was a need to synchronize both the IMU sensor data and video frames, which was achieved using SensiML software by selectively removing either the 6 DoF IMU data or video frames. Figure 4 illustrates the synchronized time of IMU data and punching data, which occurred at 1.69 seconds or 168 milliseconds.
2.3. Feature Extraction
In our study, we conducted extensive feature extraction on punch kinematic data, focusing particularly on the accelerometer and gyroscope data’s x, y, and z axes. Remarkably, all punch types consistently concluded within an average duration of 0.9 seconds, equivalent to approximately 180 data samples. This observation significantly influenced our data analysis approach. We employed a rolling window with a fixed size of around 180 samples and an overlap of 179 samples, maintaining a sampling frequency of 200 Hz to effectively capture time-frequency characteristics. This configuration was also applied to time-domain statistical analysis, ensuring alignment with the temporal aspects of punches. The corresponding spectrogram visually depicted the extracted features from all six axes, revealing vital spatiotemporal features such as power spectral density across frequency bands and 9 statistical features for enhanced classification accuracy. By analyzing power spectral density, we could identify frequency ranges associated with different punch types. Notably, in the x-axis, the jab punch exhibited more spectrum, while the y-axis showed more spectrum for the hook punch, and the z-axis demonstrated a higher spectrum for the uppercut.
2.4. Hierarchical Classification
In the initial phase of our hierarchical classification system, we utilize a binary recognition approach to determine the presence or absence of a punch and accurately identify the start and end times of detected punches. Further, we categorize the binary classification into punch types such as jabs, hooks, and uppercuts. We performed punch classification using the random forest technique, allocating 80% of the data, which included 120 punches from each category of punch, and reserved 20% of the data, comprising 50 punches from each category from unknown boxers, for testing. Our previous research [6] has demonstrated the effectiveness of random forest for punch classification and its accuracy metrics as shown in Table 3. However, labeling a significant amount of data, especially high-frequency data collected at 200 samples per second, can be a demanding and resource-intensive task, both in terms of time and cost. With our extensive dataset containing thousands of samples, manual labeling by a domain expert such as a boxing coach is impractical and laborious. This challenge is also faced by the researcher who are all did IoT wearable sensor-based classification [5,9,18,22].
To address these challenges, we adopted an innovative approach known as active learning modeling from the literatures [24,25,26]. Unlike traditional machine learning methods that often require large portions of the dataset, typically 70% to 80%, for training, active learning significantly streamlines this requirement. It accomplishes accurate classification with just a fraction of the data, such as 18 punches from each category like jab, hook, and uppercut, around 15%. This approach reduces the computational burden and minimizes the cost and time associated with labeling an extensive dataset.
Data labeling was conducted using video data as the ground truth, employing a percentage-based criterion ranging from 10% to 100%. Specifically, under the 60% criteria, instances were labeled as "punch" if 60% of the punch occurred within the fixed-length window of 0.8 seconds (average punch action time) or 160 samples; otherwise, they were labeled as "no punch." This labeling approach was consistently applied across various thresholds, ensuring instances were labeled as "punch" only if they met the corresponding percentage criteria within the specified window duration.
The 60% criteria yielded higher accuracy in punch recognition and classification compared to other percentage criteria. Therefore, our domain expert categorized the data or samples into four distinct classes: ’no punch,’ ’long-range jab to the head,’ ’mid-range hook to the head,’ and ’mid-range uppercut to the head,’ for both rear and lead hand punches, using the 60% criteria.
2.4.1. Active Learning Technique with Query Strategy: Query By Committee (QBC)
We have opted for the Query by Committee (QBC) approach due to its effectiveness in punch classification, especially when using random forest or ensemble learning techniques. QBC is a robust active learning method that harnesses the combined intelligence of multiple weak learners such as the Naive Bayes classifier, k-nearest neighbor, and decision tree.
Steps Followed in Active Learning Using Query by Committee Technique:
- 1.
- Randomly select 5% of the dataset for initial training, reserving 95% for testing.
- 2.
-
Utilize a weak learner committee (Naive Bayes classifier, k-nearest neighbor, decision tree, or ensemble learner) to train the model using the Query by Committee (QBC) strategy.
-
The Bayes classifier, grounded in Bayesian probability theory, excels in probabilistic classification of the punch.= Posterior probability of class given spectro-temporal features X= Likelihood of spectro-temporal features X given classes= Prior probability of punch class= Marginal probability of spectro-temporal features X
-
Decision trees, in the context of punch classification and recognition tasks, two common metrics used for splitting nodes in a decision tree are entropy and Gini impurity. Entropy is a measure of impurity or disorder in a set. Gini impurity quantifies the probability of incorrectly classifying an instance randomly chosen from the set. We used the default hyper-parameter settings such as Maximum number of splits is 100 and the split criterion is Gini’s diversity index.Where,S is the set of punches at a node.c is the number of classes(2 class for punch recognision and 3 class for punch classification)is the probability of punch class
- KNN is particularly adept at capturing the punch signal local patterns and adapting to the underlying data distribution. Mathematically, if has spatio-temporal features of the punch , and is a data point in the training set with features , then the distance d between and can be calculated using Euclidean distance:where is the corresponding feature of
-
- 3.
- Average the output of the committee to classify predicted punches.
- 4.
-
Compute entropy values for each sample using the Entropy sampling method.
-
Entropy, a measure of uncertainty in information theory, is calculated for each sample of IoT sensor data, reflecting the diversity of punch class probabilities. High entropy values indicate instances of significant uncertainty, making them prime candidates for additional labeling.Where is the model, and is the probability that sample x belongs to punch class c according to the model .
-
- 5.
- Arrange entropy values in descending order alongside corresponding samples.
- 6.
- Identify samples with high entropy values, indicating uncertainty in classification.
- 7.
- Involve a domain expert or boxing coach to label uncertain samples for the next 5% of the dataset.
- 8.
- Add annotated data with the initial 5
- 9.
- Repeat the process iterative from step 2 to step 8 until the total training dataset reaches 15% to improve model accuracy and reduce uncertainty in predictions as shown in Table 4
Following the training of the model, we applied it to new athlete punch data for punch recognition, extracting punch count and punch duration (start time and end time). An attempt was made to identify punch start and end times by analyzing alternating occurrences of 0s (indicating punches) and 1s (indicating no punches) as labels. However, misclassifications led to instances where 0s and 1s appeared within the punch event, complicating the precise determination of punch start and end times. To resolve this issue, we recognize that the average duration of punch events is 0.8 seconds, and no events (punches or punches) occur within a 0.2 seconds interval. If there are fluctuations in events during this time frame, misclassified events are reverted to their previous state. This process ensures an accurate determination of punch count and punch duration.
For the second hierarchical classification aimed at identifying specific punch types (e.g., jab, hook, or uppercut) in both rear and lead hand from the previously identified punch samples, the same active learning technique was applied to train the data and its accuracy as shown in Table 5. The trained model was subsequently tested with new athlete data. The mode value was extracted from the label output, transforming the punch labels into a single mode label. This approach enabled the determination of punch count for each punch type.
3. Results
In the hierarchical classification framework, we have successfully identified instances of punching within the provided dataset, where a label of 1 denotes a punch, and a label of 0 indicates no punch, accompanied by the respective start and end times for each punch. Figure 5 and Figure 6 depict the confusion matrices for punch recognition. A notable observation is that most misclassifications occur at the punch’s initiation and conclusion stages. This phenomenon is attributed to the similarity between the preparatory phase (no punch) and the commencement and conclusion segments of the punch.
Table 6 presents accuracy metrics, indicating that both lead and rear hand punch recognition achieve an accuracy of 91.77% and 91.93%. Remarkably, this high level of accuracy is attained through the utilization of only 15% of the total dataset, employing an active learning technique.
3.1. Total Punch Count
The table Table 7 reveals that there are 17 rows indicating the start and end times of punches. This suggests that a total of 17 punches have been identified in the provided dataset. However, the actual ground truth punch count is 18. The discrepancy may be attributed to the occurrence of combined punches or rapidly repeated punches with a gap of less than or equal to 0.2 seconds.
3.2. Punch Start and End Time
Following the classification process, the commencement and conclusion times of punches are derived from the predicted class labels represented as a series of 0’s(No punch) and 1’s(punch). The initiation time of a punch is determined by identifying the start of a series of consecutive 1’s, while the conclusion time corresponds to the termination of that series. The count of unique sets of start and end time values constitutes the total punch count as shown in Table 7.
3.3. Punch Classification
In the second stage of hierarchical classification, the system focuses on categorizing specific types of punches, such as Jab, Hook, and Uppercut, for both lead and rear hand, building upon the initial hierarchical classification for punch recognition. This classification is accomplished through the application of an active Learning technique, utilizing only 15% of the training dataset.
The depicted confusion matrix in Figure 7 and Figure 8 reveals the model’s proficiency in accurately classifying both jab and uppercut punches. However, there are instances where the hook punch is misclassified as a jab. The accuracy metrics has shown in Table 8. To delve deeper, we conducted a comparative statistical analysis, considering metrics such as mean, standard deviation, and variance of the misclassified Jab punch category, contrasting them with the true categories of Jab and Hook data. Surprisingly, the majority of the features exhibited a statistical resemblance to the Jab data category rather than the Hook punch category. This discrepancy is attributed to a boxer’s execution of a preparatory motion for a punch, leading to misclassification as a Jab.
3.4. Punch Type Count
Here, we aim to determine the types of punches and their respective counts in a bout. This is achieved by utilizing punches’ start and end times, where the predominant occurrences in the predicted labels during a specific duration indicate the types of punches. The confusion matrix, as illustrated in Figure 9, serves as a valuable tool for discerning the count of each punch type in the classification process and its accuracy is about 94%. The corresponding counts of ground truth and predicted values can be as illustrated in Figure 10
3.5. Punch Frame Segmentation
We segmented the punch frames in the video using the start and end times of the punches. Figure 11, Figure 12, Figure 13, Figure 14 illustrates the punch segmentation for all punches. In this representation, we have selected of frames, including the starting time frame, the frame where the punch occurs, the ending time frame, rather than showcasing every single frame.
4. Discussion
The punch detection and classification were successfully accomplished using the Active Learning technique. The model was trained and tested with data from an unknown boxer, thus validating its efficacy. It is noteworthy that, in contrast to traditional approaches shown in Table 9 requiring extensive amounts of training data. Our study achieved remarkable results using only a minimal dataset, employing query by committee and entropy sampling to strategically select informative instances for model refinement. This approach reduces the need for extensive data acquisition and suggests real-world applicability, particularly in challenging scenarios.
An inherent limitation arises from the challenge in accurately predicting the start and end times of punch segmentation, primarily because the initiation and conclusion portions of all punches share a similar style, with only the intermediate portion providing distinction among different punch types. Another limitation lies in the system’s inability to independently identify combinations of punches occurring within a time gap of less than or equal to 0.2 seconds as happened in figure Figure 11. The IoT wearable sensor can accurately segment the punches during practice matches without any restrictions, regardless of the boxer’s direction of movement. This technology eliminates the disadvantages associated with computer vision systems, such as blind spots or occlusions as shown in Figure 13.
5. Conclusions
The current study employs active learning techniques for accurate punch recognition and classification using data from Inertial Measurement Unit (IMU) sensors. Our approach not only achieves accurate punch recognition but also provides a comprehensive analysis of key metrics such as total punch count per bout, start and end times of individual punches, and the count of specific punch types. This analysis serves as a valuable asset for boxers and coaches, offering insights into strengths, weaknesses, stamina, and opportunities for technique refinement and game plan optimization. Our proposed method integrates IoT and vision systems, training on bout videos alongside IoT wearable data to assess punches in training environments. Our future plans include developing the Smart Boxer system by creating a framework and integrating IMU sensor data with computer vision to analyze punches in real-time bouts. Expanding the algorithm to cover all 14 types of punches and their ranges is a significant step towards providing comprehensive data and insights into boxers’ performance, including punch force and kinetic chain measurements, enhancing quantitative assessment of force transfer capabilities. This amalgamation of technologies represents a revolutionary paradigm in boxing training and assessment, empowering coaches and athletes with actionable information to inform training strategies, optimize performance, and reduce injury risks.
Author Contributions
Contributions are as follows, name initials are used as shortcuts: conceptualization,S.M., R.S., and B.S.; methodology, S.M., R.H., and B.S; software, S.M., R.H., R.S., and B.S.; validation, S.M. and J.W.; formal analysis, J.W.; investigation, S.M., R.H., and B.S.; resources, S.M.; data curation, S.M.; writing—original draft preparation, S.M., R.S. and B.S.; writing—review and editing, R.S. and B.S.; visualization, S.M.; supervision, B.S.; project administration, R.H. and B.S.; funding acquisition, B.S. and R.S. All authors have read and agreed to the published version of the manuscript.
Funding
This research was funded by the Centre of Excellence for Sports Science and Analytics for funding from the Indian Institute of Technology, Madras, under Grant SP22231231CPETWOSSAHOC.
Institutional Review Board Statement
We hereby confirm that the composition and operating procedures of the Inspire Institute of Sport Research Ethics Committee are as per the ‘Ethical Guidelines for Biomedical Research on Human Participants’ issued by the Indian Council of Medical Research; Schedule Y of the ‘Indian Drugs & Cosmetics Act 1940’ and the ‘Good Clinical Practices Guidelines’ issued by the Department of Health Research, Ministry of Health & Family Welfare, Government of India. Ethics number (EC/IIS/2024/020).
Data Availability Statement
The data used for this study will be shared based on reasonable request to the corresponding author.
Acknowledgments
I am grateful to our co-authors for their continuous guidance and support, as well as to our Human Cyber Physical System (HCPS) labmates for their collaboration and contributions. Thank you all for being part of this journey and for your dedication to advancing knowledge in our field.
Conflicts of Interest
No potential conflict of interest was reported by the author(s).
Abbreviations
The following abbreviations are used in this manuscript:
| IMU | Inertial Measurement Unit |
| KPI | Key Performance Indicator |
| IoT | Internet of Things |
| HAR | Human Action Recognition |
| AI | Artificial Intelligence |
| QBC | Query By Committee |
| KNN | K- Nearest Neighbor |
References
- Host, K.; Ivašić-Kos, M. An overview of Human Action Recognition in sports based on Computer Vision. Heliyon 2022, 8. [Google Scholar] [CrossRef] [PubMed]
- Behendi, S.K.; Morgan, S.; Fookes, C.B. Non-invasive performance measurement in combat sports. In Proceedings of the 10th International Symposium on Computer Science in Sports (ISCSS); Springer International Publishing, 2016; pp. 3–10. [Google Scholar]
- Kasiri-Bidhendi, S.; Fookes, C.; Morgan, S.; Martin, D.T.; Sridharan, S. Combat sports analytics: Boxing punch classification using overhead depthimagery. In Proceedings of the 2015 IEEE International Conference on Image Processing (ICIP), 27 September 2015; pp. 4545–4549. [Google Scholar] [CrossRef]
- Cardino, Phillip Christian C., Jamie Lynn T. Chua, and John Rossi Rafael R. Llaga. "Advance scorecard for boxing: Combat sport analysis with deep learning." (2022).
- Ashker, S.E. Technical and tactical aspects that differentiate winning and losing performances in boxing. International journal of performance analysis in sport 2011, 11, 356–364. [Google Scholar] [CrossRef]
- Manoharan, S.; Warburton, J.; Hegde, R.; Srinivasan, R.; Srinivasan, B. Punch Types and Range Estimation in Boxing Bouts Using IMU Sensors. In Proceedings of the 2023 IEEE International Conference on Internet of Things and Intelligence Systems (IoTaIS), 28 November 2023; pp. 97–102. [Google Scholar]
- Monfared, S. Contributing factors to punching power in Boxing: A narrative review summarizing determinant factors of punching power in boxing and means of improving them. 2021.
- Ishac, K.; Eager, D. Evaluating martial arts punching kinematics using a vision and inertial sensing system. Sensors 2021, 21, 1948. [Google Scholar] [CrossRef] [PubMed]
- Worsey, M.T.; Espinosa, H.G.; Shepherd, J.B.; Thiel, D.V. An evaluation of wearable inertial sensor configuration and supervised machine learning models for automatic punch classification in boxing. IoT 2020, 1, 360–381. [Google Scholar] [CrossRef]
- Wada, T.; Nagahara, R.; Gleadhill, S.; Ishizuka, T.; Ohnuma, H.; Ohgi, Y. Measurement of pelvic orientation angles during sprinting using a single inertial sensor. Proceedings 2020, 49, 10. [Google Scholar] [CrossRef]
- Omcirk, D.; Vetrovsky, T.; Padecky, J.; Vanbelle, S.; Malecek, J.; Tufano, J.J. Punch trackers: correct recognition depends on punch type and training experience. Sensors 2021, 21, 2968. [Google Scholar] [CrossRef] [PubMed]
- Buśko, K. Biomechanical characteristics of amateur boxers. Archives of Budo 2019, 15, 23–31. [Google Scholar]
- Jaysrichai, T.; Srikongphan, K.; Jurarakpong, P. A development machine for measuring the precision and the response time of punches. The Open Biomedical Engineering Journal 2019, 13. [Google Scholar] [CrossRef]
- Sosopoulos, Konstantinos, and Michael Tareke Woldu. "IoT smart athletics: Boxing glove sensors implementing machine learning for an integrated training solution." (2021).
- Khasanshin, I. Application of an artificial neural network to automate the measurement of kinematic characteristics of punches in boxing. Applied Sciences 2021, 11, 1223. [Google Scholar] [CrossRef]
- Merlo, R.; Rodríguez-Chávez, Á.; Gómez-Castañeda, P.E.; Rojas-Jaramillo, A.; Petro, J.L.; Kreider, R.B.; Bonilla, D.A. Profiling the Physical Performance of Young Boxers with Unsupervised Machine Learning: A Cross-Sectional Study. Sports 2023, 11, 131. [Google Scholar] [CrossRef] [PubMed]
- Menzel, T.; Potthast, W. Application of a validated innovative smart wearable for performance analysis by experienced and non-experienced athletes in boxing. Sensors 2021, 21, 7882. [Google Scholar] [CrossRef] [PubMed]
- Gu, F.; Xia, C.; Sugiura, Y. Augmenting the Boxing Game with Smartphone IMU-based Classification System on Waist. In Proceedings of the 2022 International Conference on Cyberworlds (CW); 2022; pp. 165–166. [Google Scholar]
- Stanley, E.; Thomson, E.; Smith, G.; Lamb, K.L. An analysis of the three-dimensional kinetics and kinematics of maximal effort punches among amateur boxers. International Journal of Performance Analysis in Sport 2018, 18, 835–854. [Google Scholar] [CrossRef]
- Tong-Iam, R.; Rachanavy, P.; Lawsirirat, C. Kinematic and kinetic analysis of throwing a straight punch: the role of trunk rotation in delivering a powerful straight punch. Journal of Physical Education and Sport 2017, 17, 2538–2543. [Google Scholar]
- Stefanski, P. Detecting Clashes in Boxing. In Proceedings of the 3rd Polish Conference on Artificial Intelligence; 2022. [Google Scholar]
- Buśko, K.; Staniak, Z.; Szark-Eckardt, M.; Nikolaidis, P.T.; Mazur-Różycka, J.; Łach, P.; Górski, M.; et al. Measuring the force of punches and kicks among combat sport athletes using a modified punching bag with an embedded accelerometer. Acta of bioengineering and biomechanics 2016, 18, 47–54. [Google Scholar] [PubMed]
- Menzel, T.; Potthast, W. Validation of a unique boxing monitoring system. Sensors 2021, 21, 6947. [Google Scholar] [CrossRef] [PubMed]
- Agarwal, D.; Natarajan, B. Active Learning for Node Classification using a Convex Optimization approach. In Proceedings of the 2022 IEEE Eighth International Conference on Big Data Computing Service and Applications (BigDataService), 15 August 2022; pp. 96–102. [Google Scholar]
- Agarwal, D.; Srivastava, P.; Martin-del-Campo, S.; Natarajan, B.; Srinivasan, B. Addressing uncertainties within active learning for industrial IoT. In2021 IEEE 7th World Forum on Internet of Things (WF-IoT), 14 June 2021; pp. 557–562.
- Settles, B. 2009. Active learning literature survey.
- Cizmic, D.; Hoelbling, D.; Baranyi, R.; Breiteneder, R.; Grechenig, T. Smart boxing glove “RD α”: IMU combined with force sensor for highly accurate technique and target recognition using machine learning. Applied Sciences 2023, 13, 9073. [Google Scholar] [CrossRef]
- Amerineni, R.; Gupta, L.; Steadman, N.; Annauth, K.; Burr, C.; Wilson, S.; Barnaghi, P.; Vaidyanathan, R. Fusion models for generalized classification of multi-axial human movement: Validation in sport performance. Sensors 2021, 21, 8409. [Google Scholar] [CrossRef] [PubMed]
Figure 1.
Flow chart of proposed system
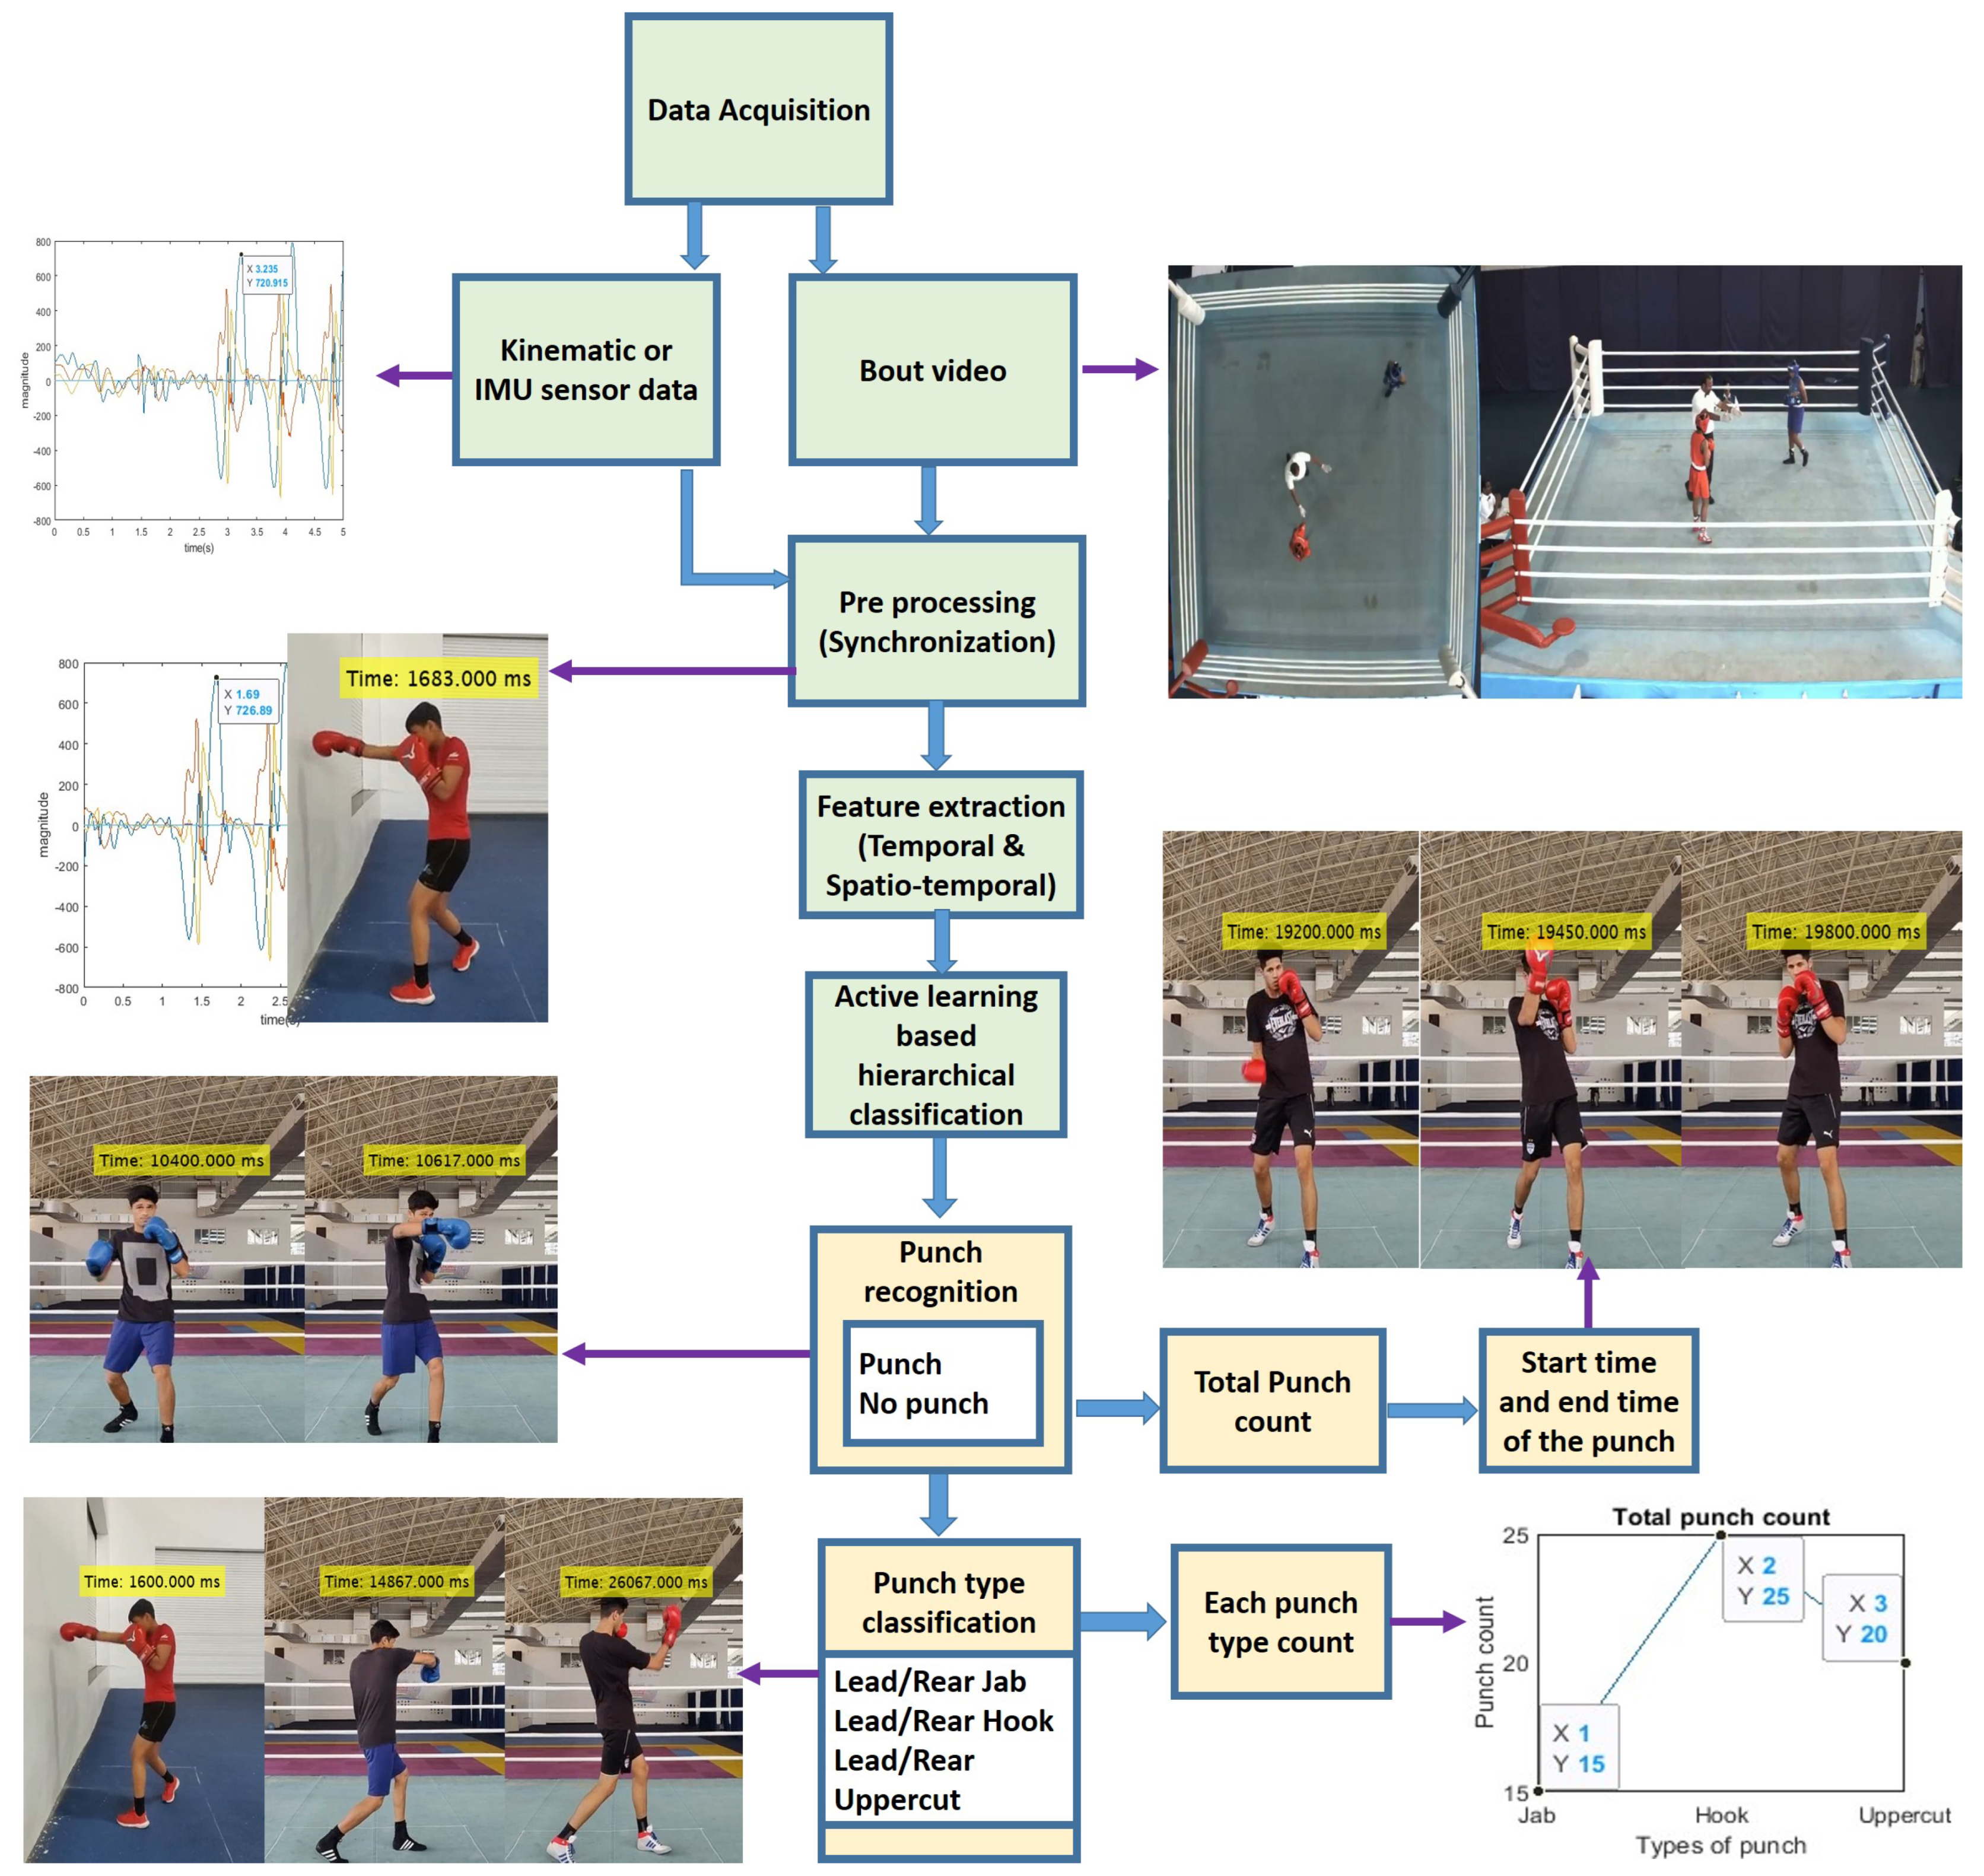
Figure 2.
Punch types; (a) No punch (b) Long-range rear jab to head (c) Mid-range rear hook to head (d) Mid-range rear uppercut to head.
Figure 2.
Punch types; (a) No punch (b) Long-range rear jab to head (c) Mid-range rear hook to head (d) Mid-range rear uppercut to head.
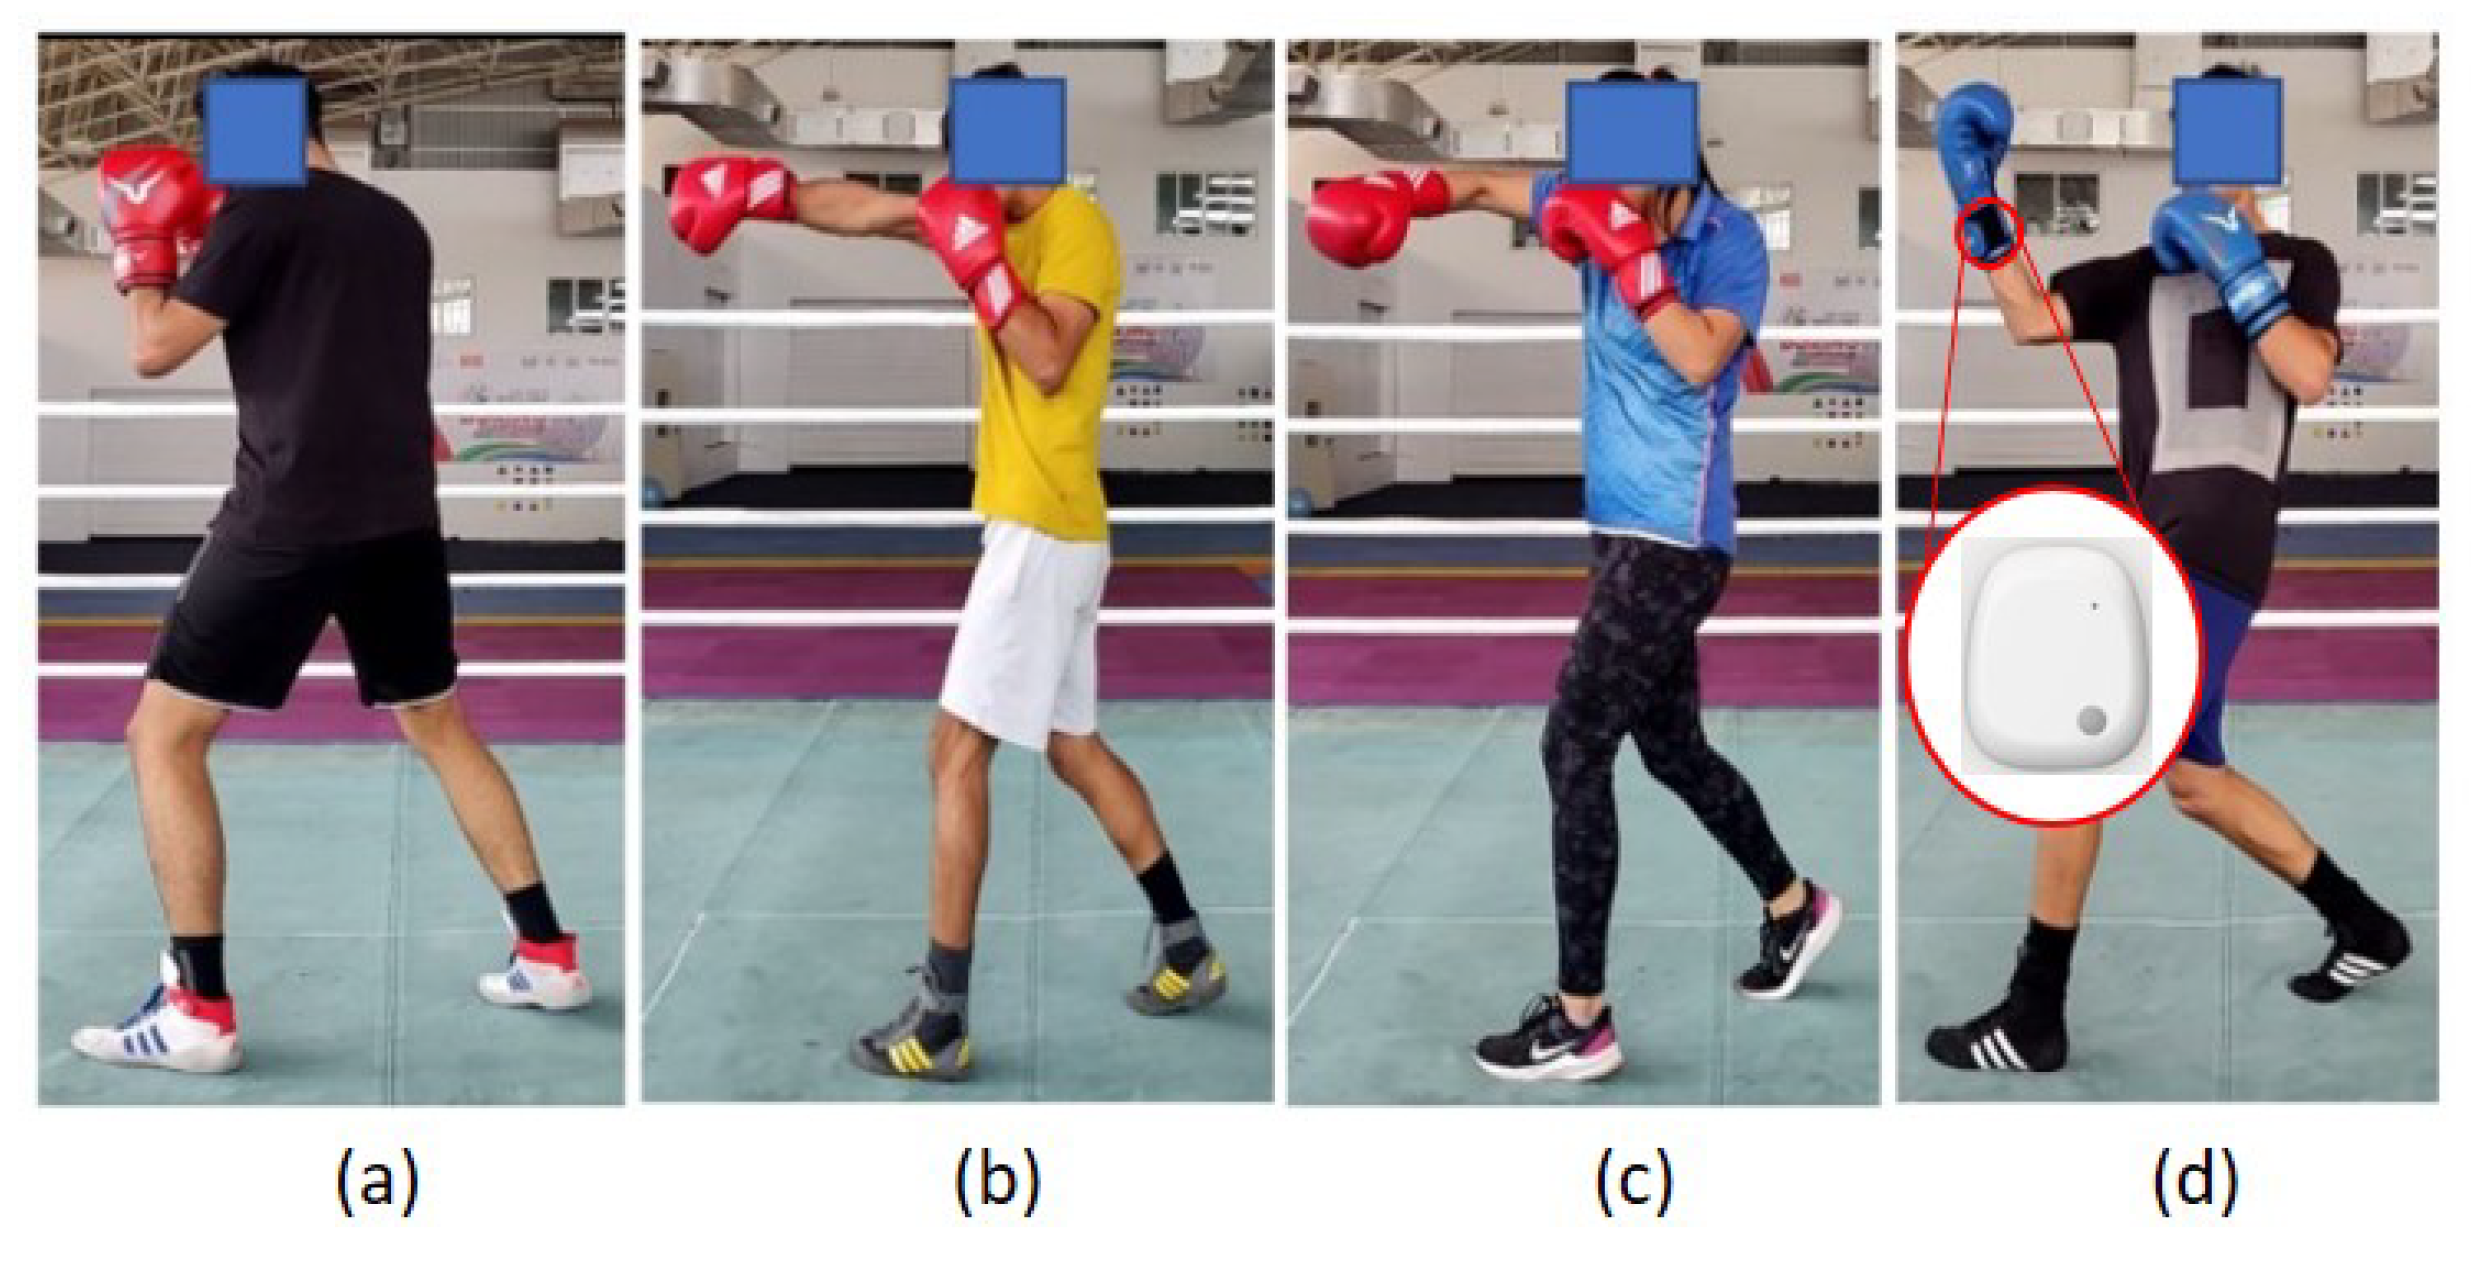
Figure 3.
IMU raw data: (a) 3-DoF accelerometer data (b) 3-DoF gyroscope data .
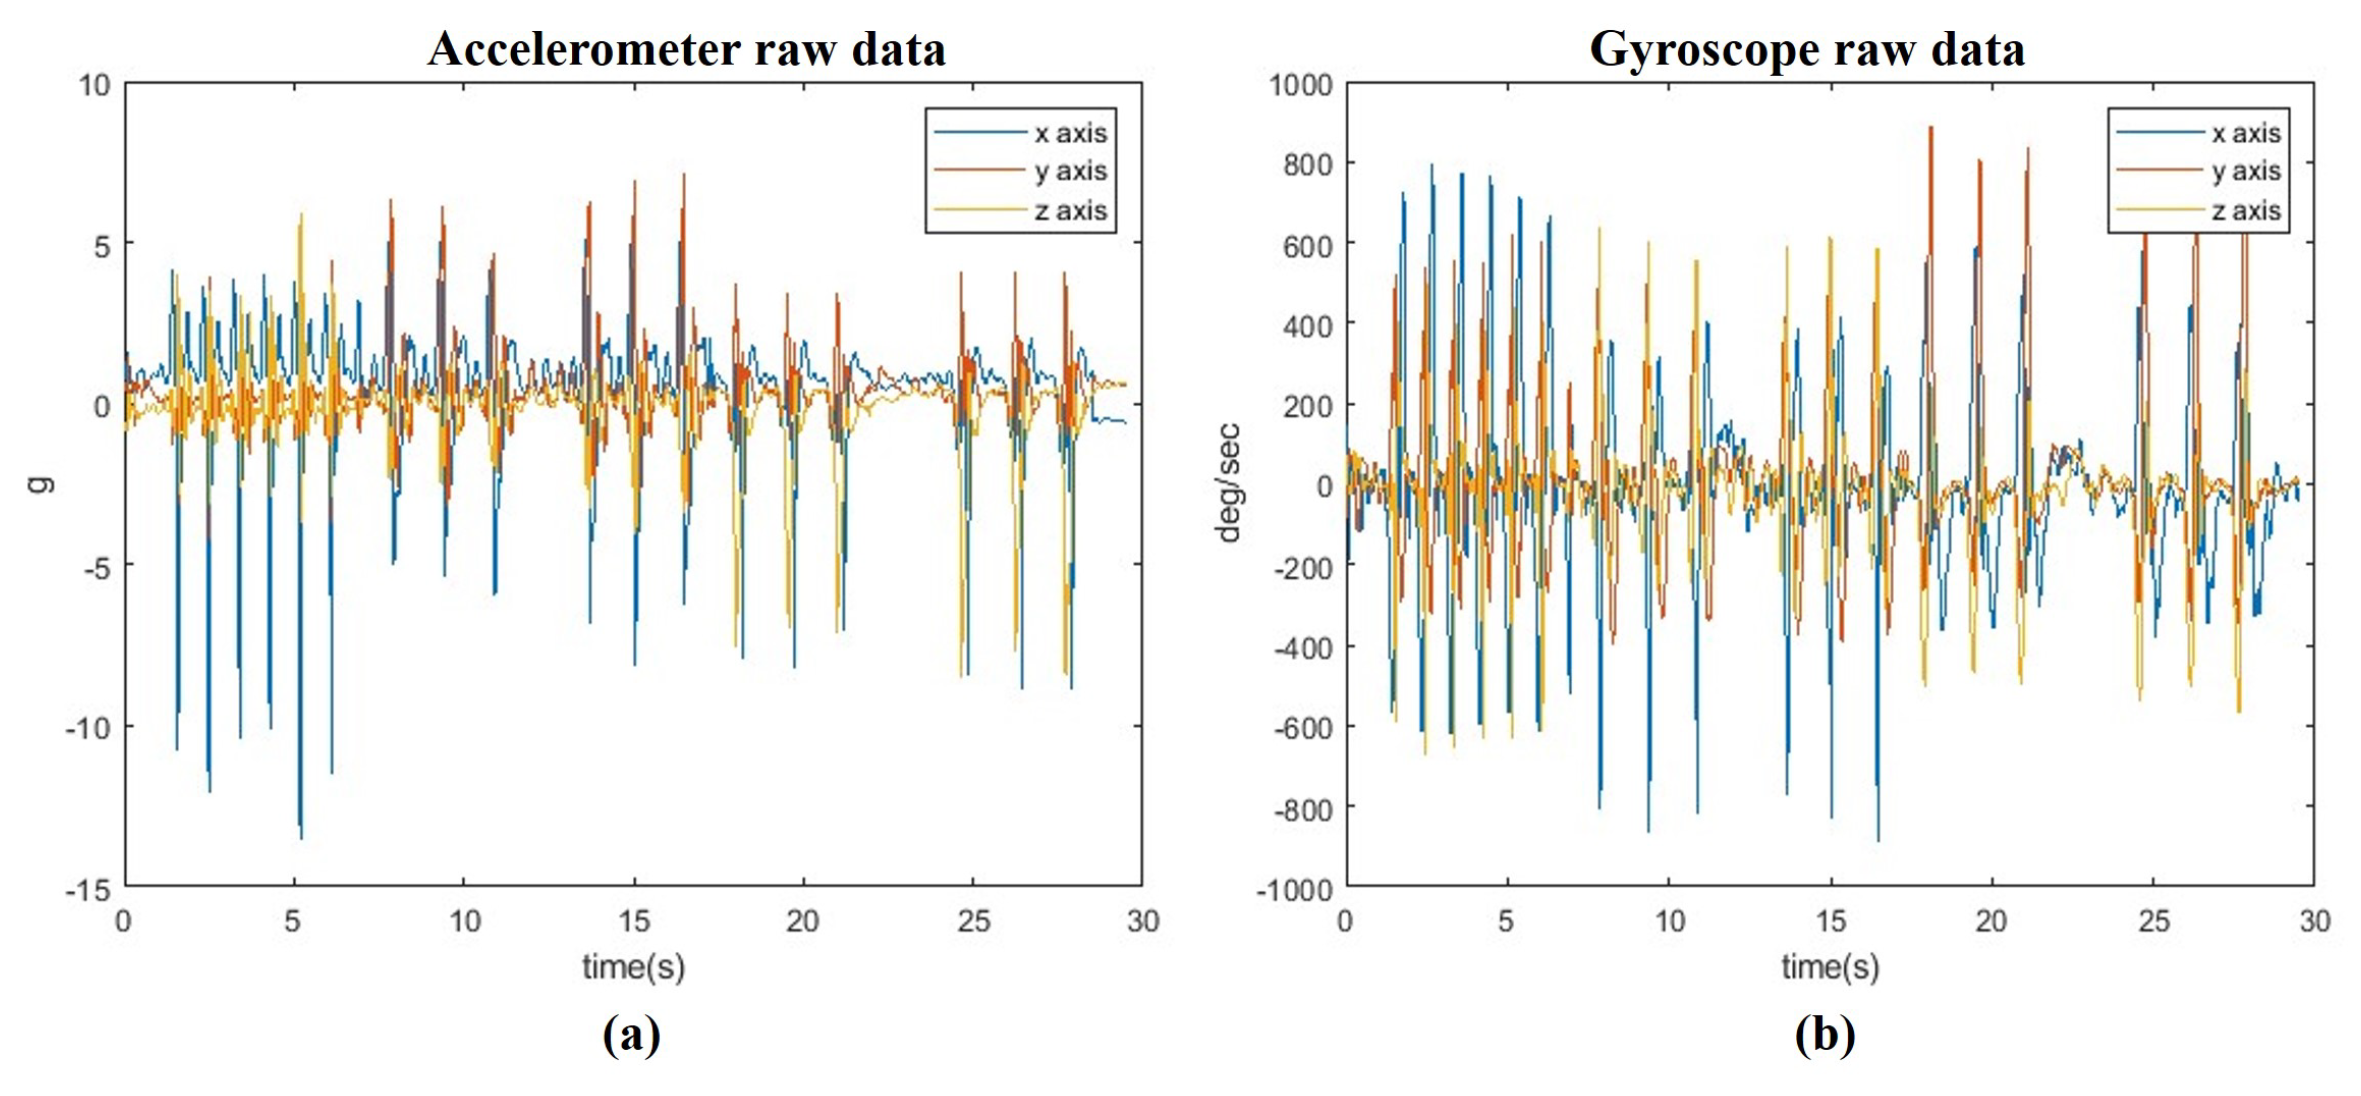
Figure 4.
IMU data and video synchronization.
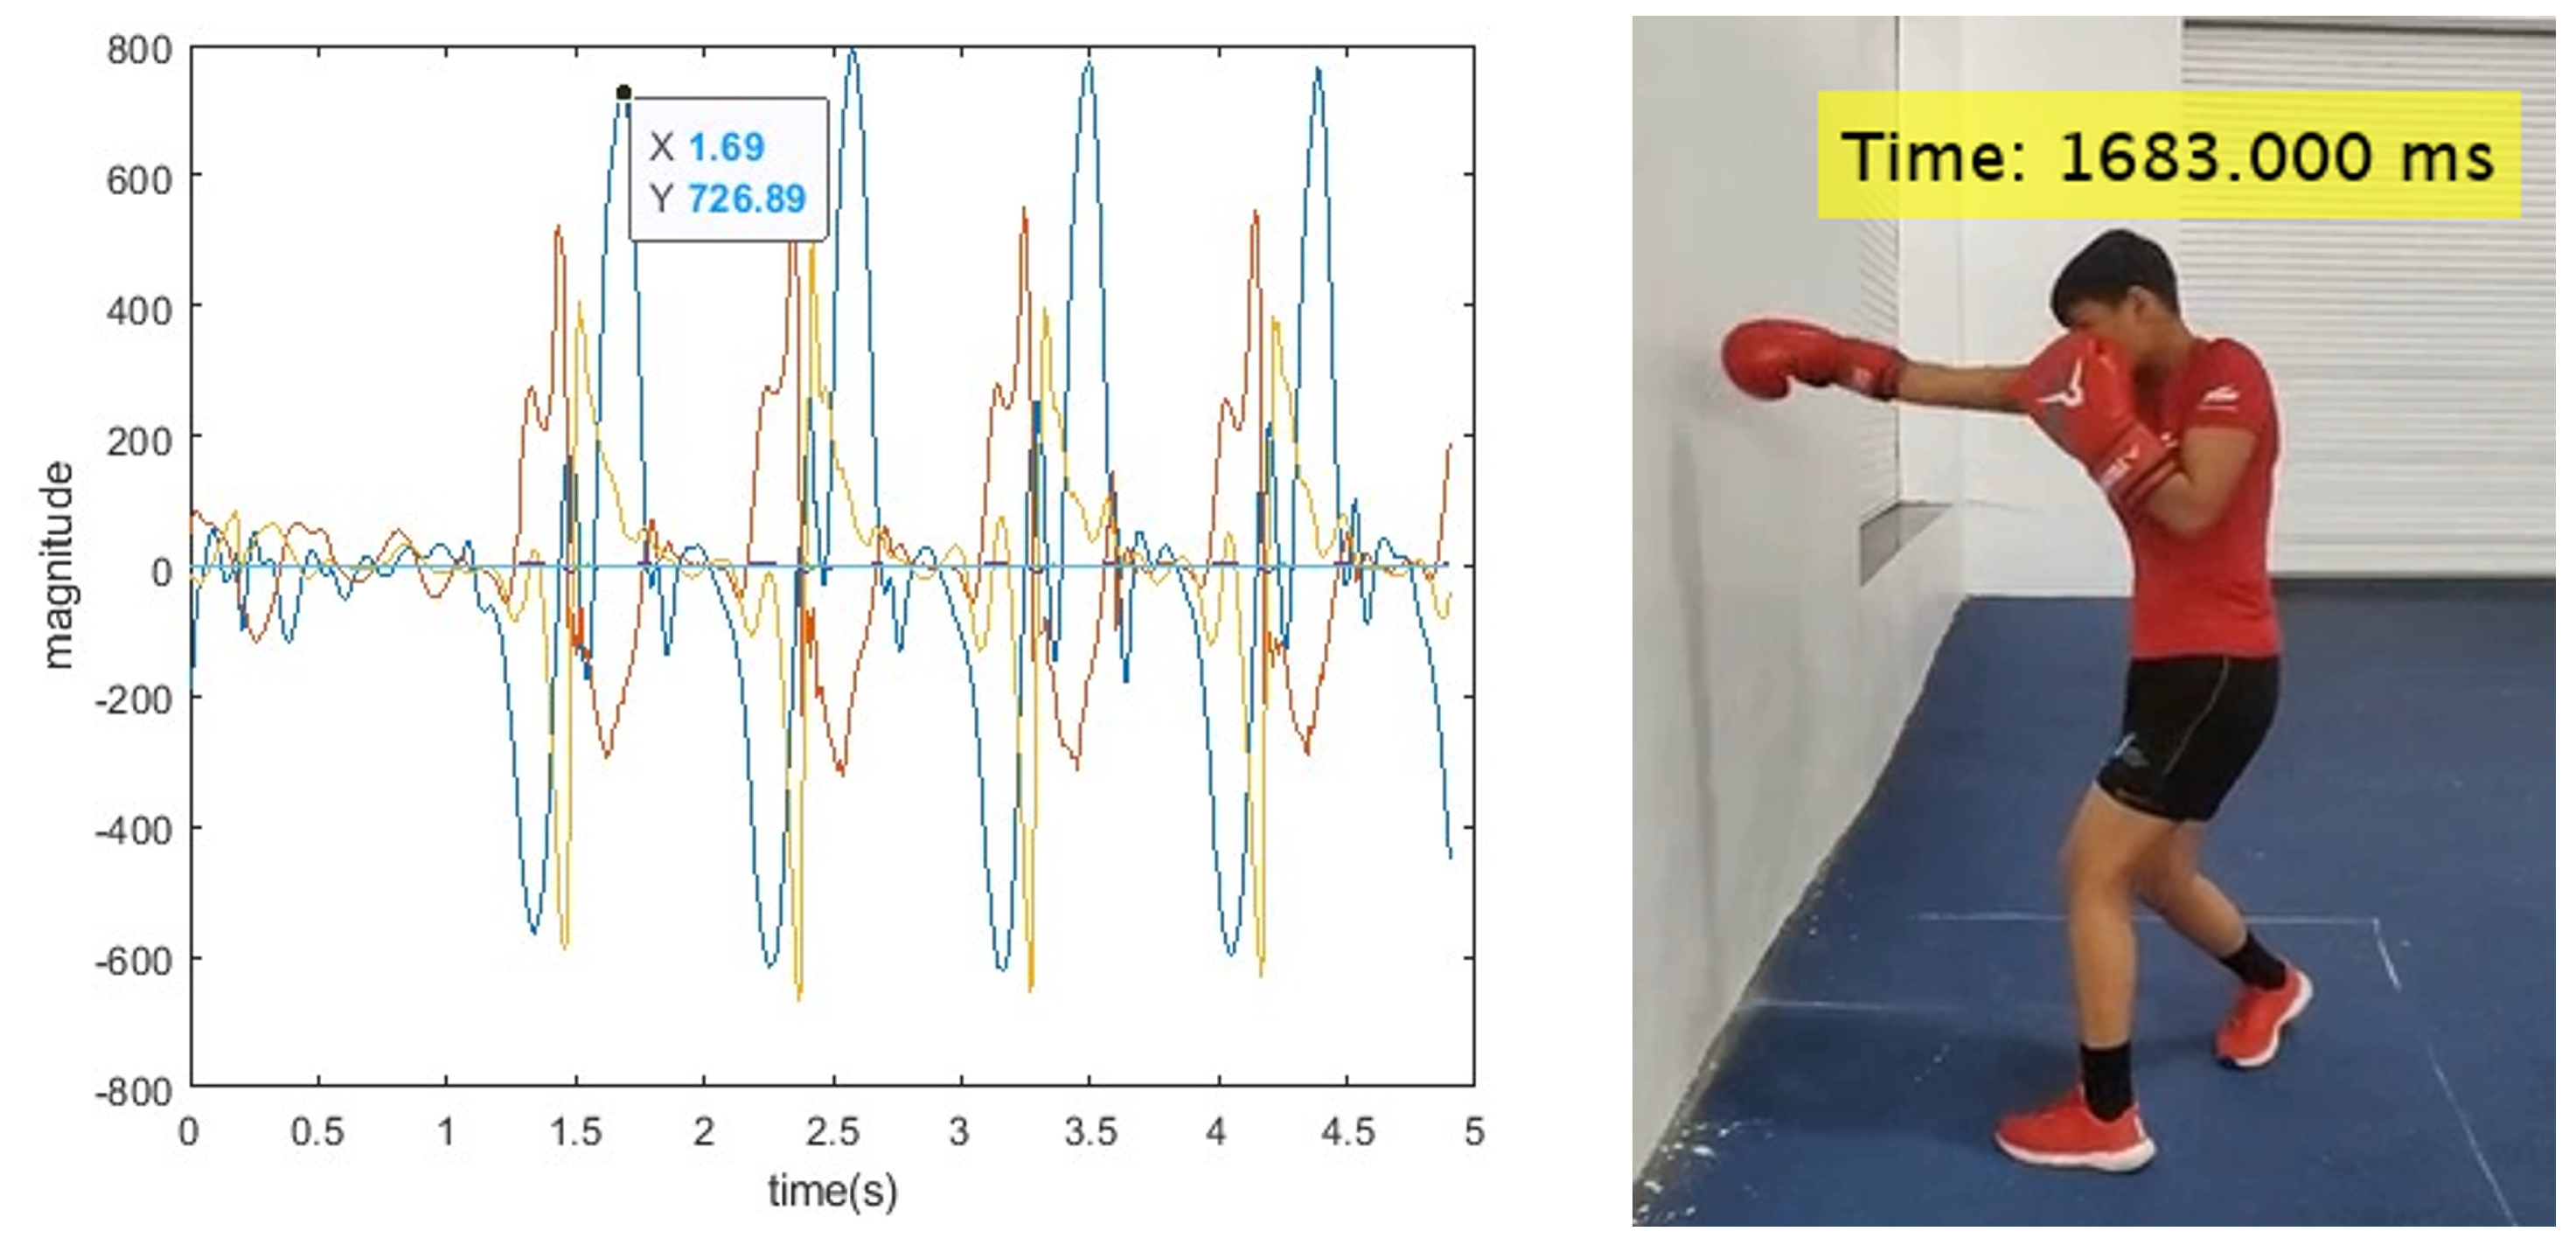
Figure 5.
Combined confusion matrix-Rear hand punch recognition.
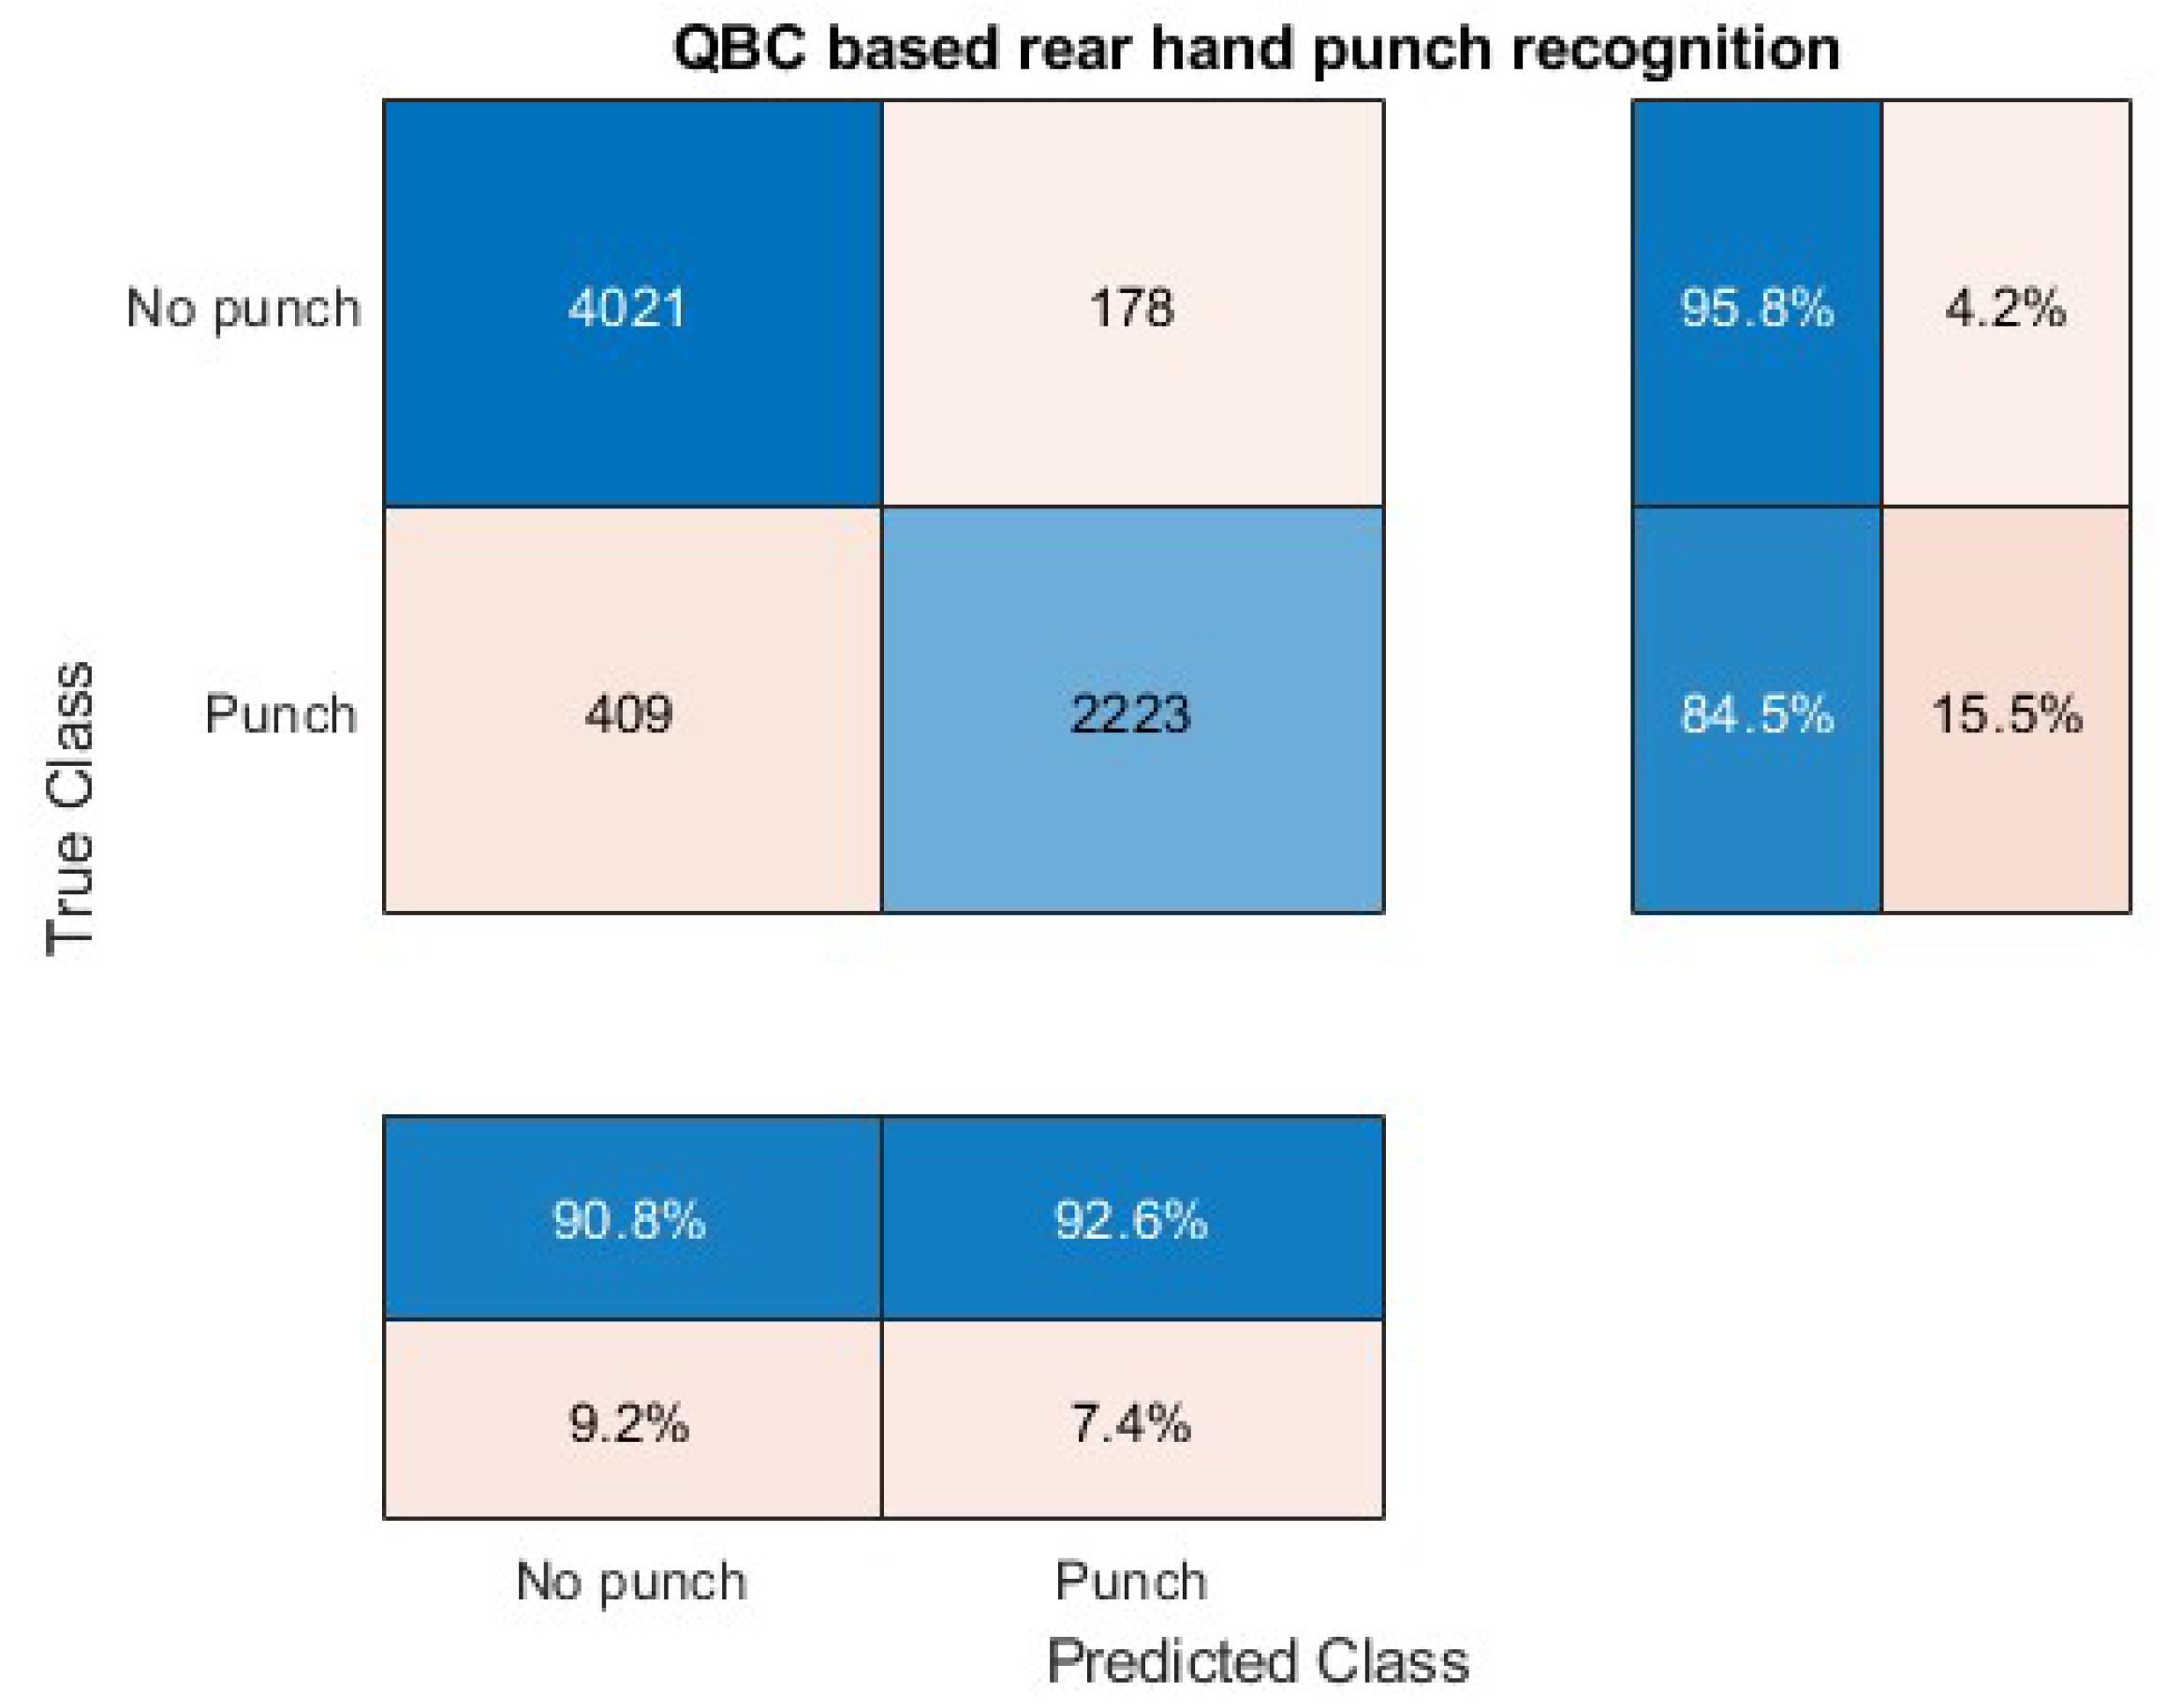
Figure 6.
Combined confusion matrix-Lead hand punch recognition.
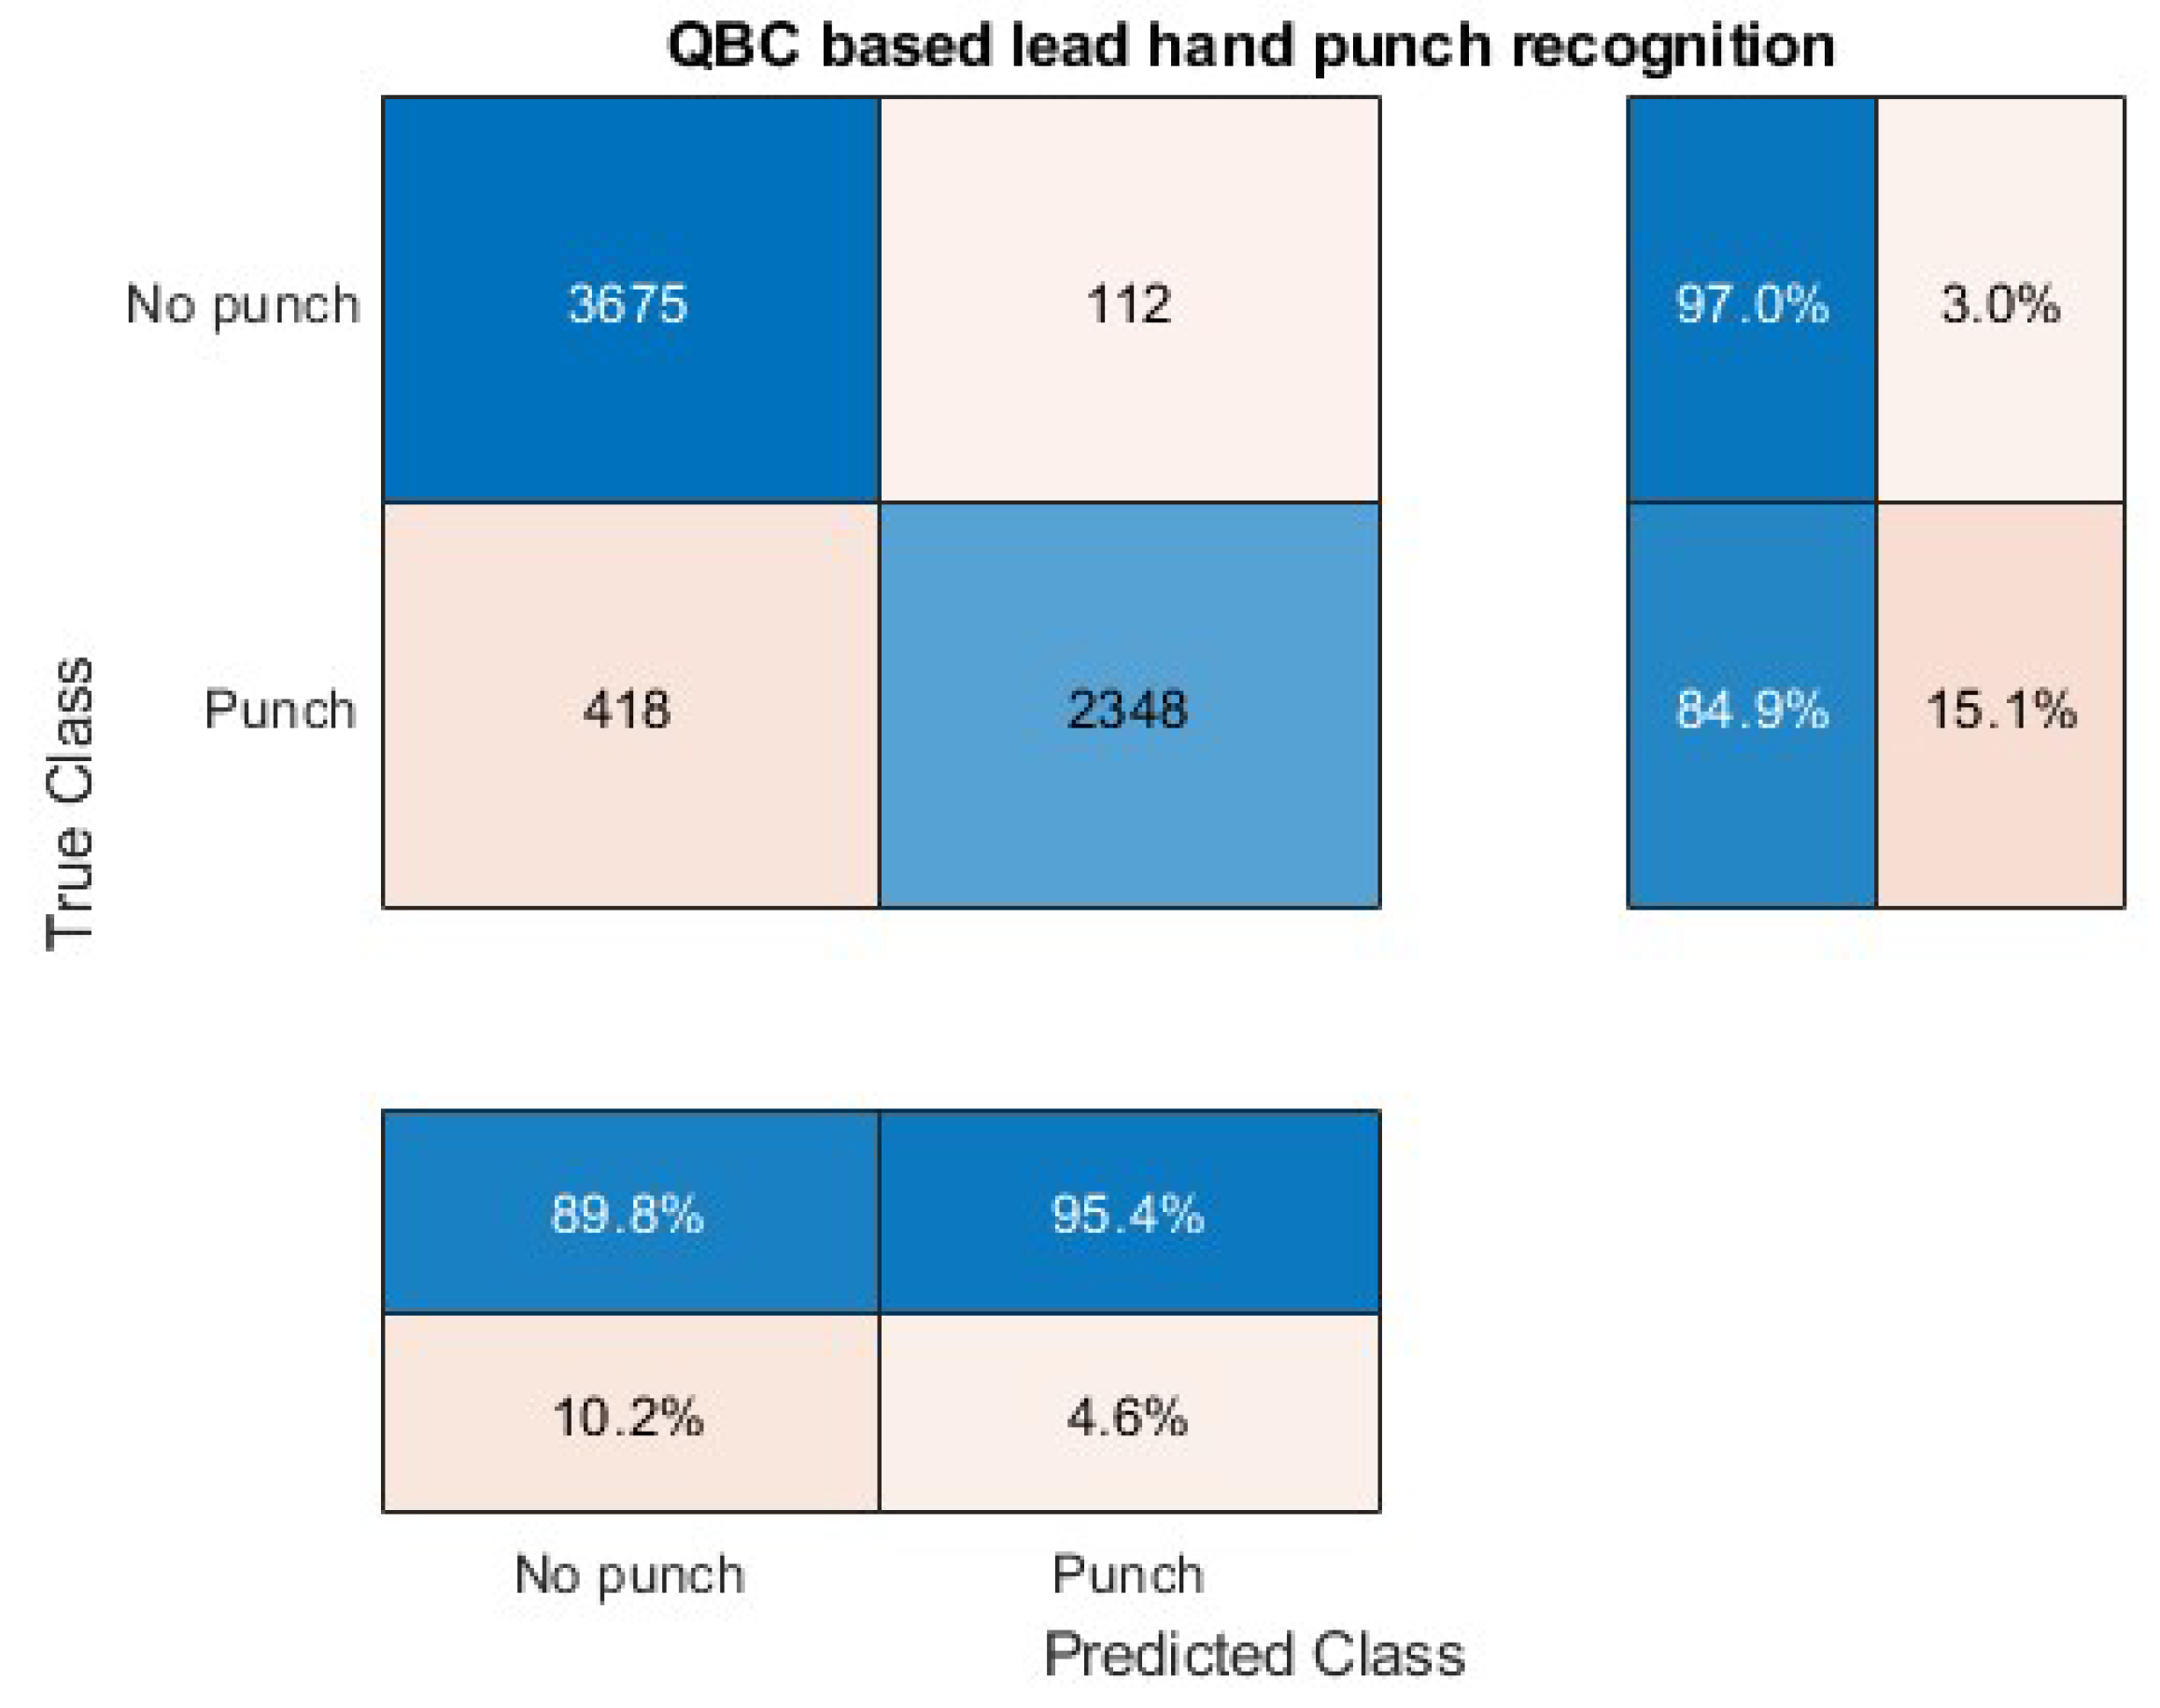
Figure 7.
Combined confusion matrix-Rear hand punch classification.
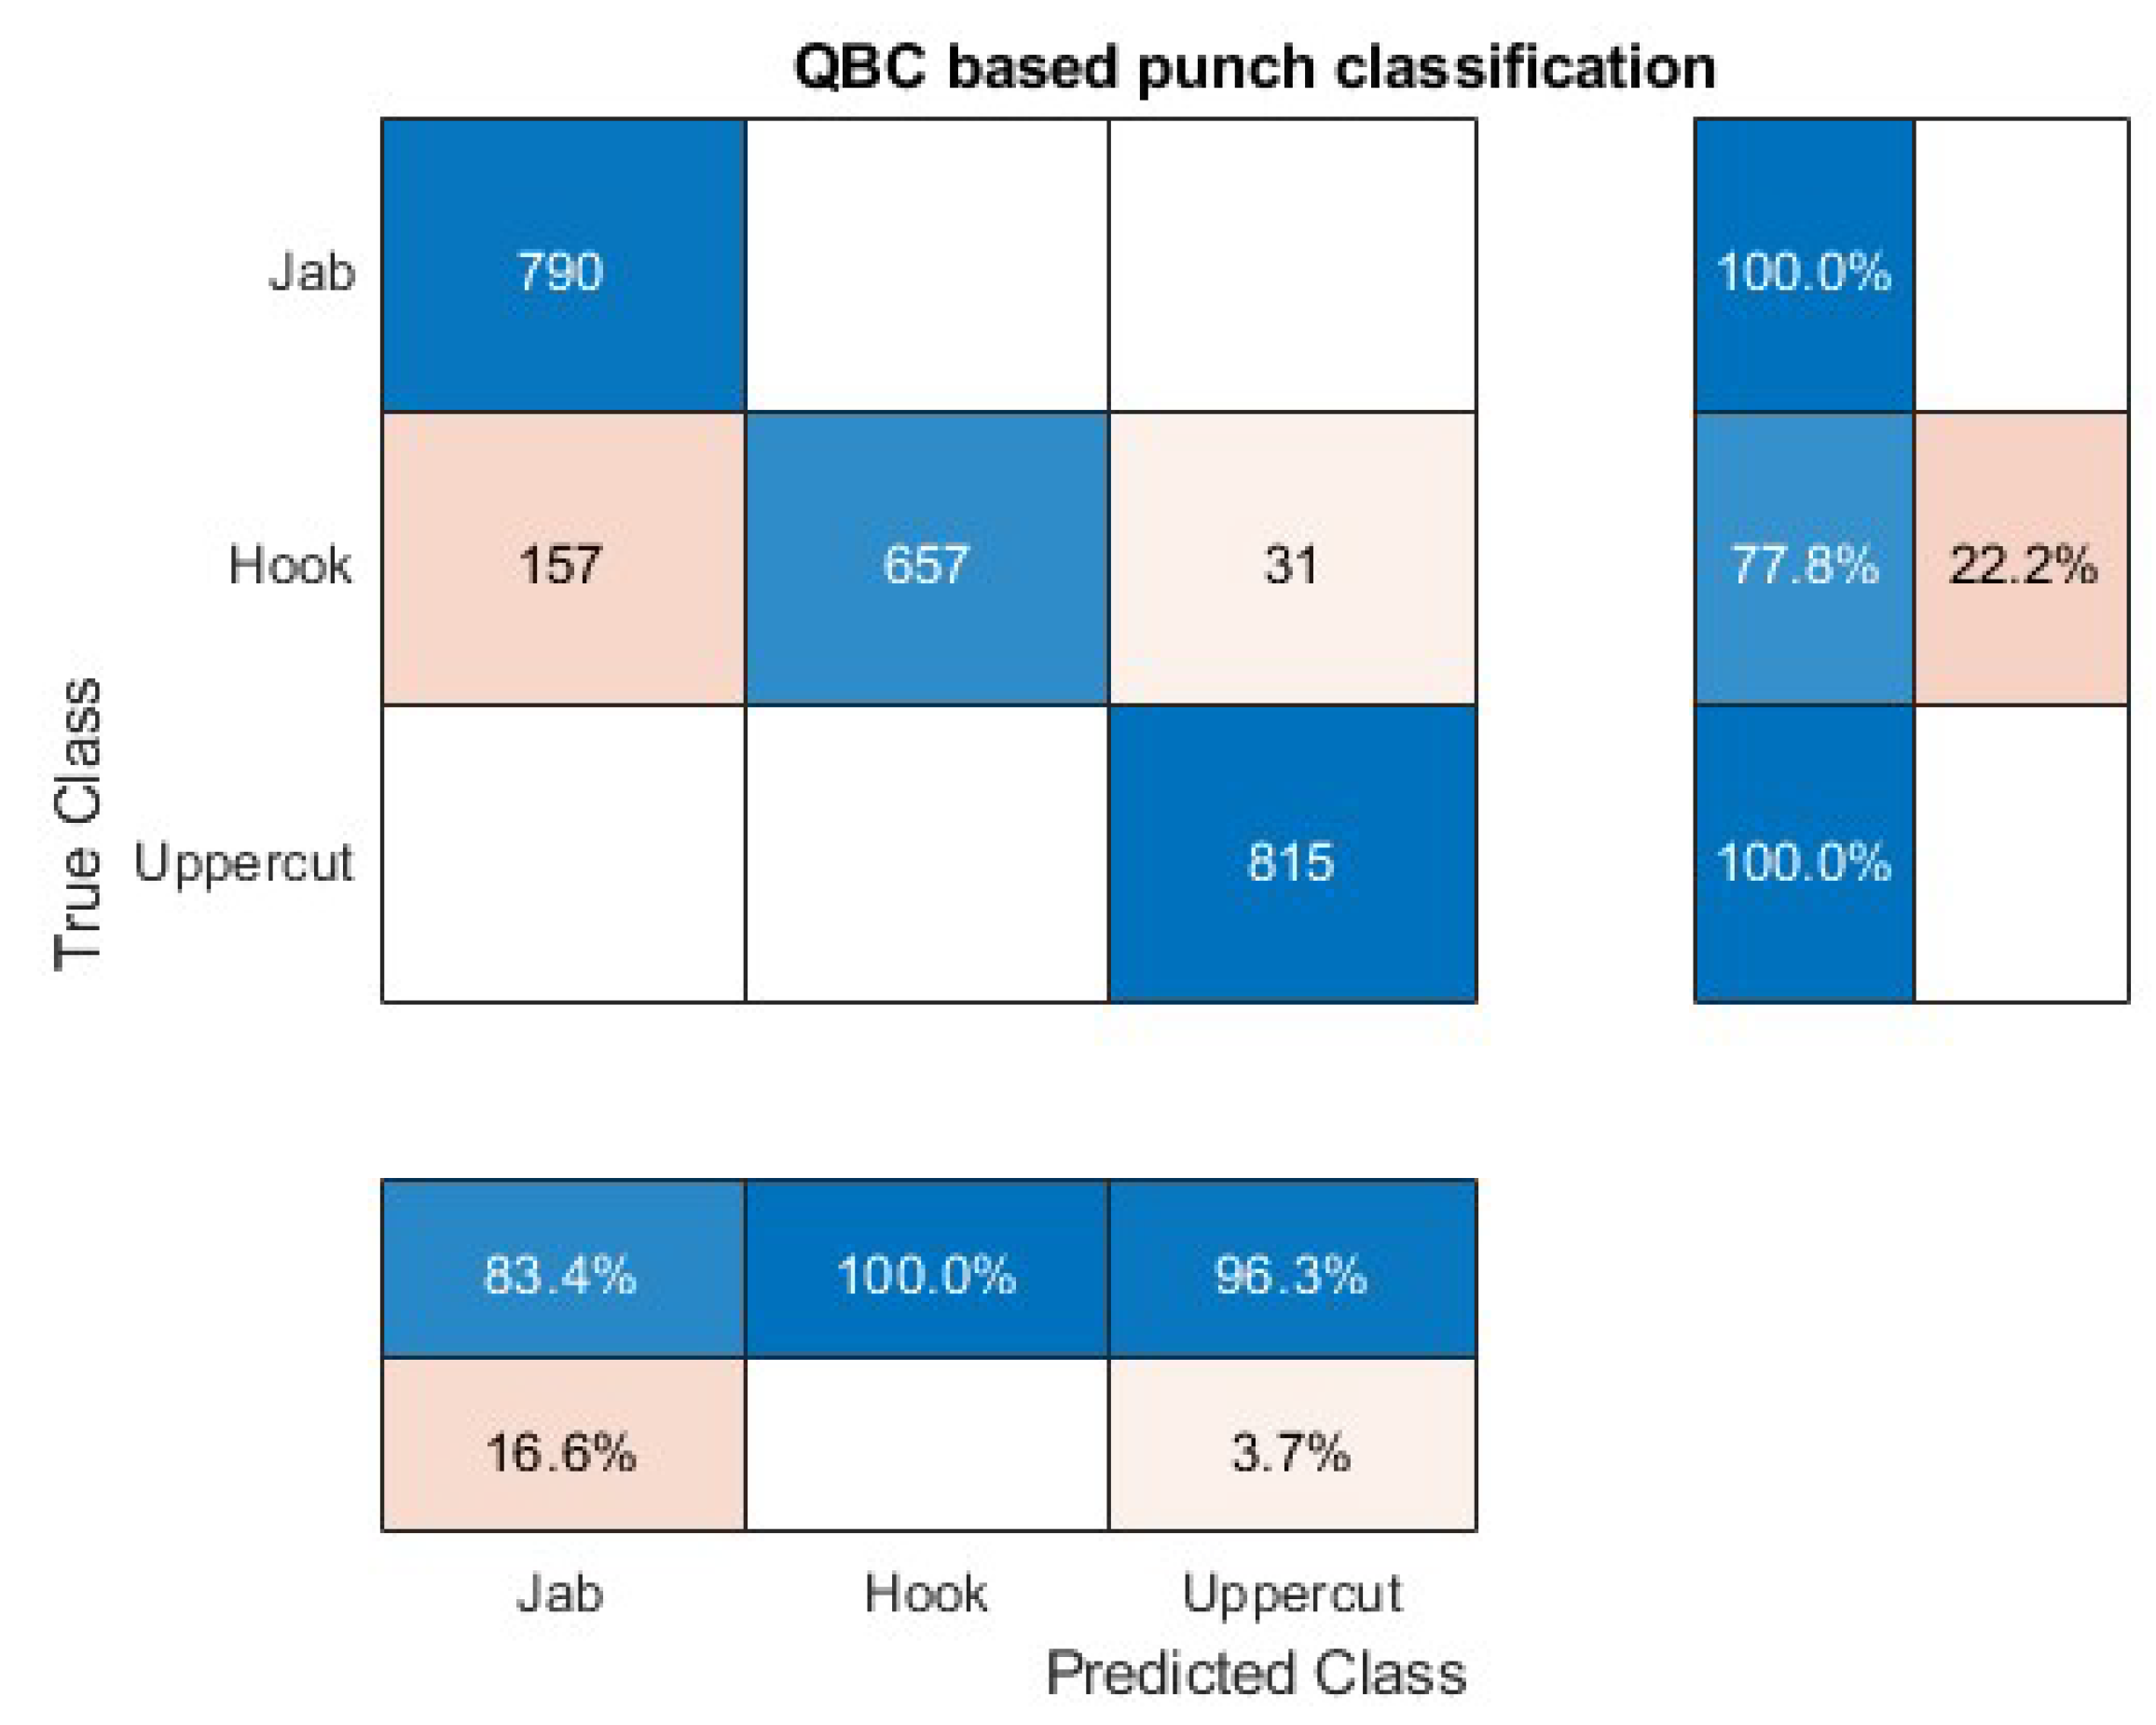
Figure 8.
Combined confusion matrix-Lead hand punch classification.
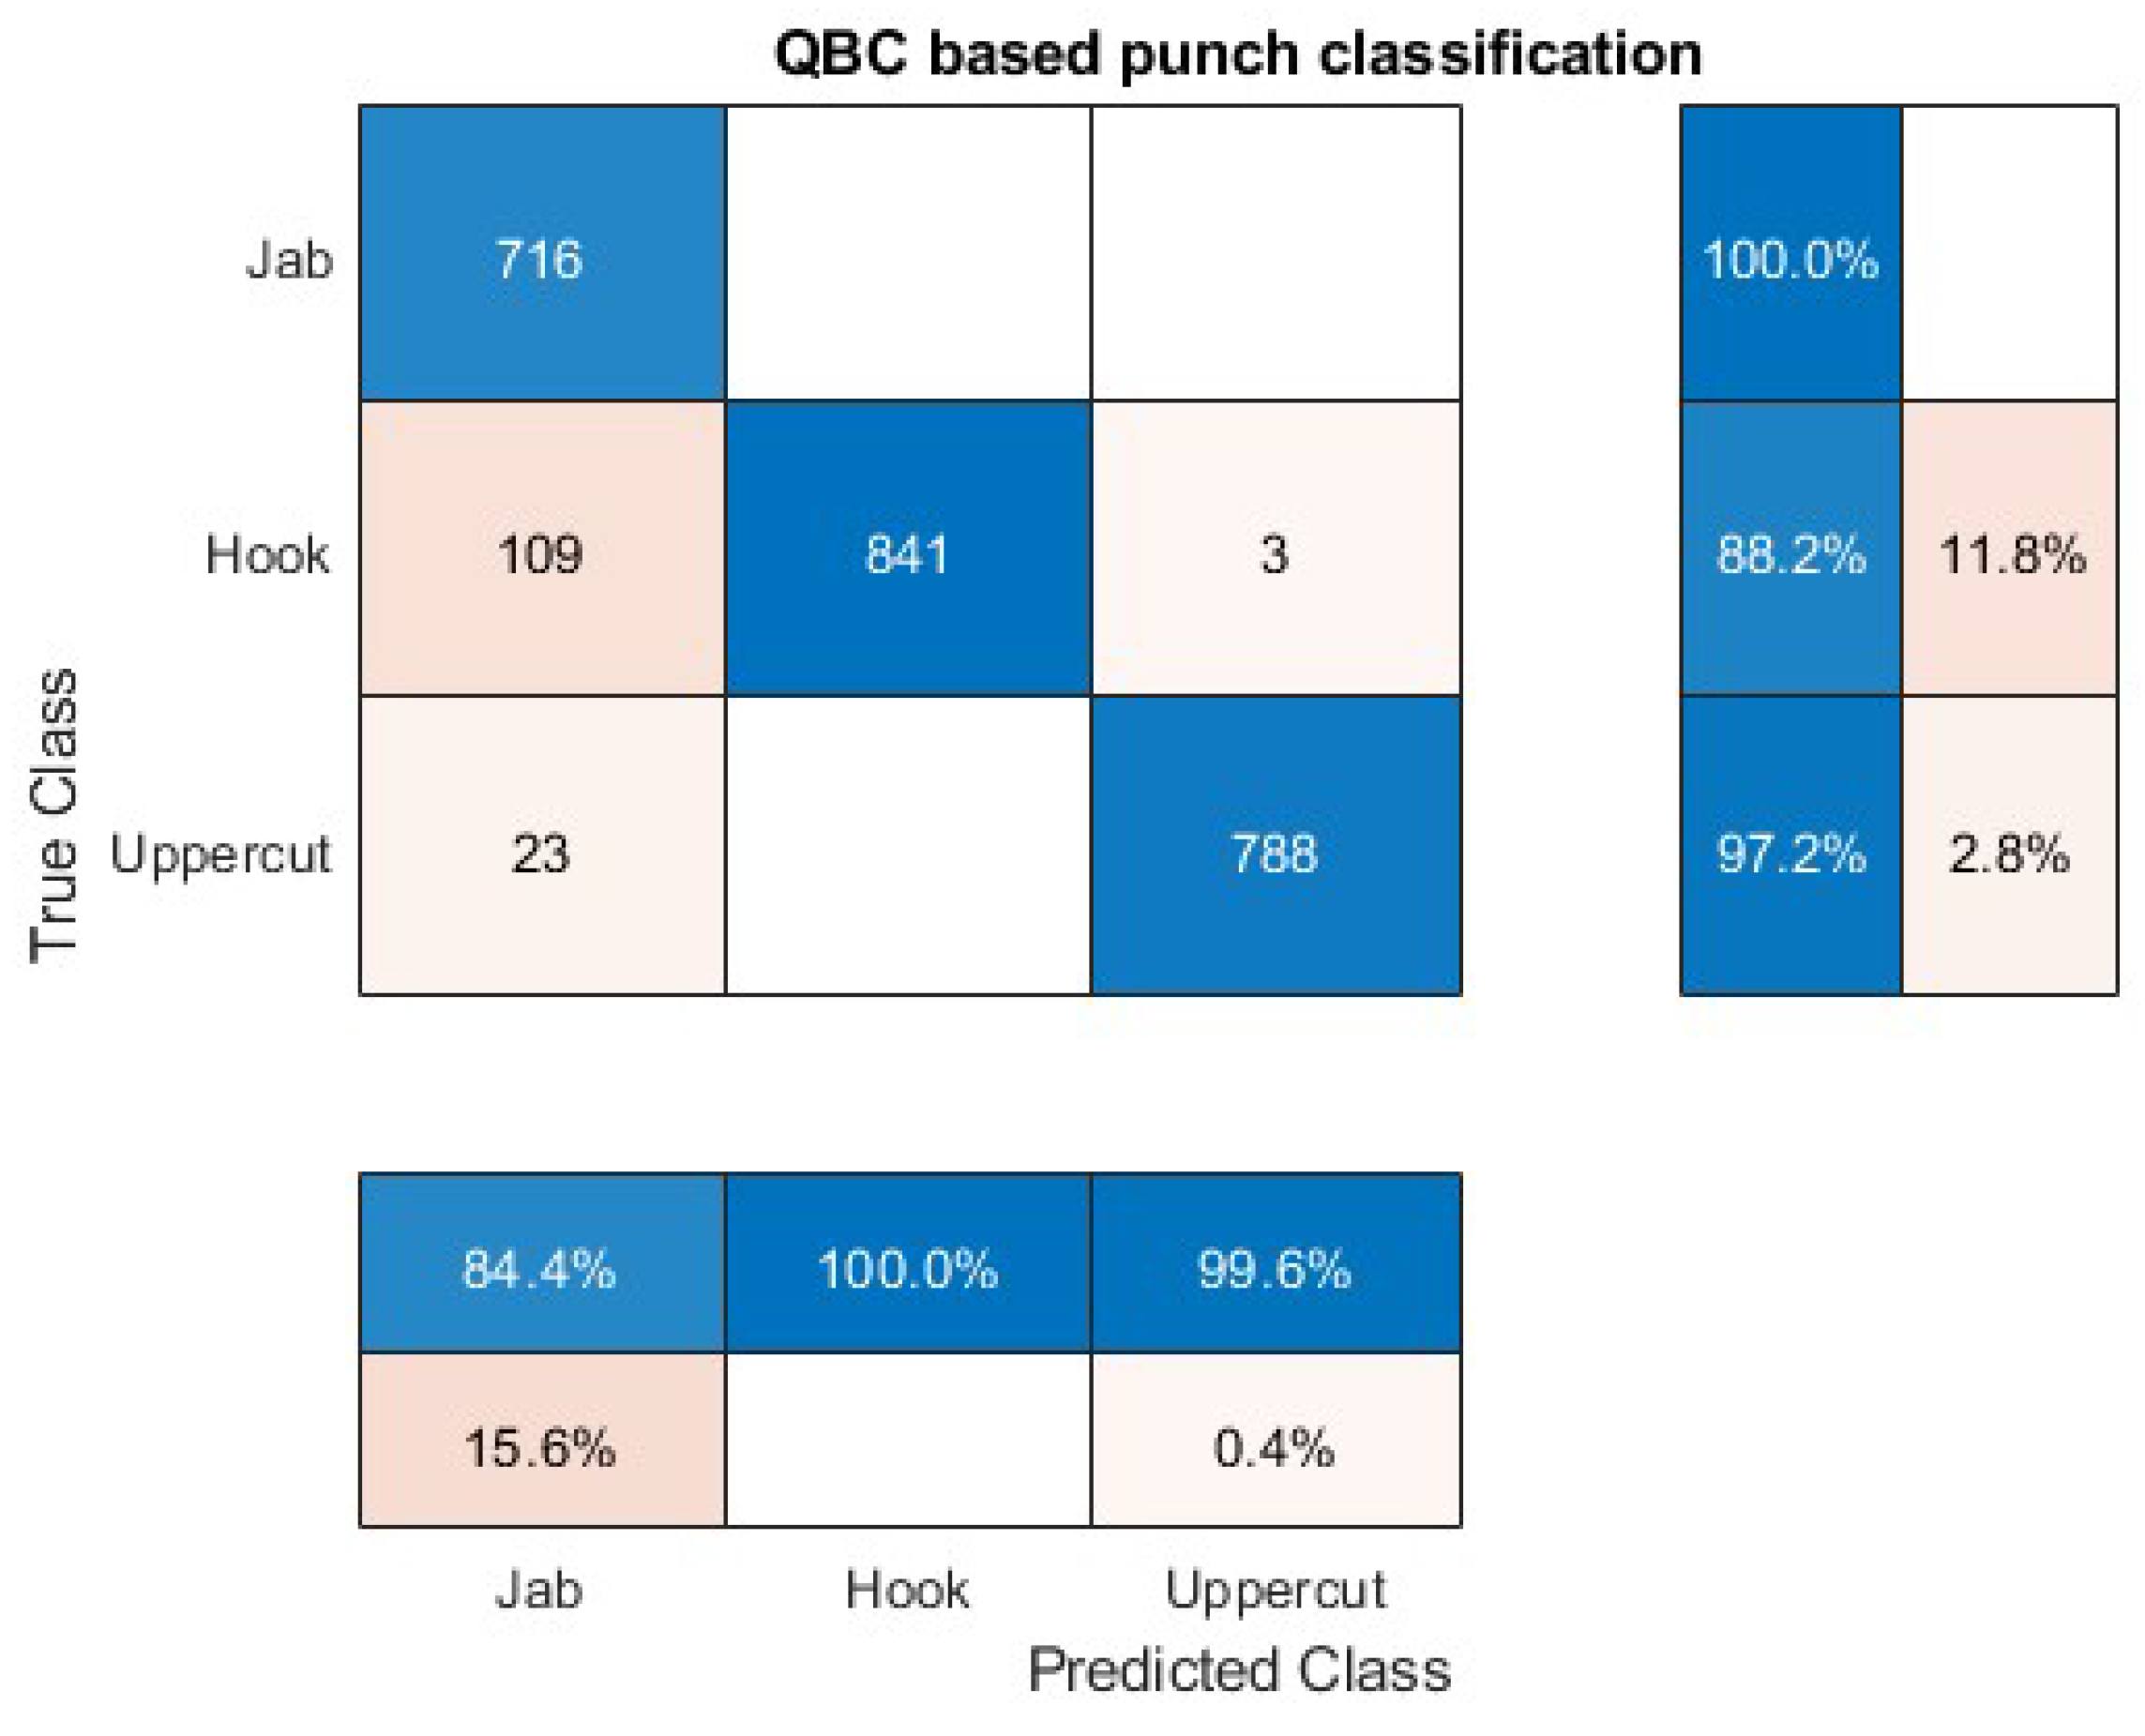
Figure 9.
confusion matrix-punch classification.
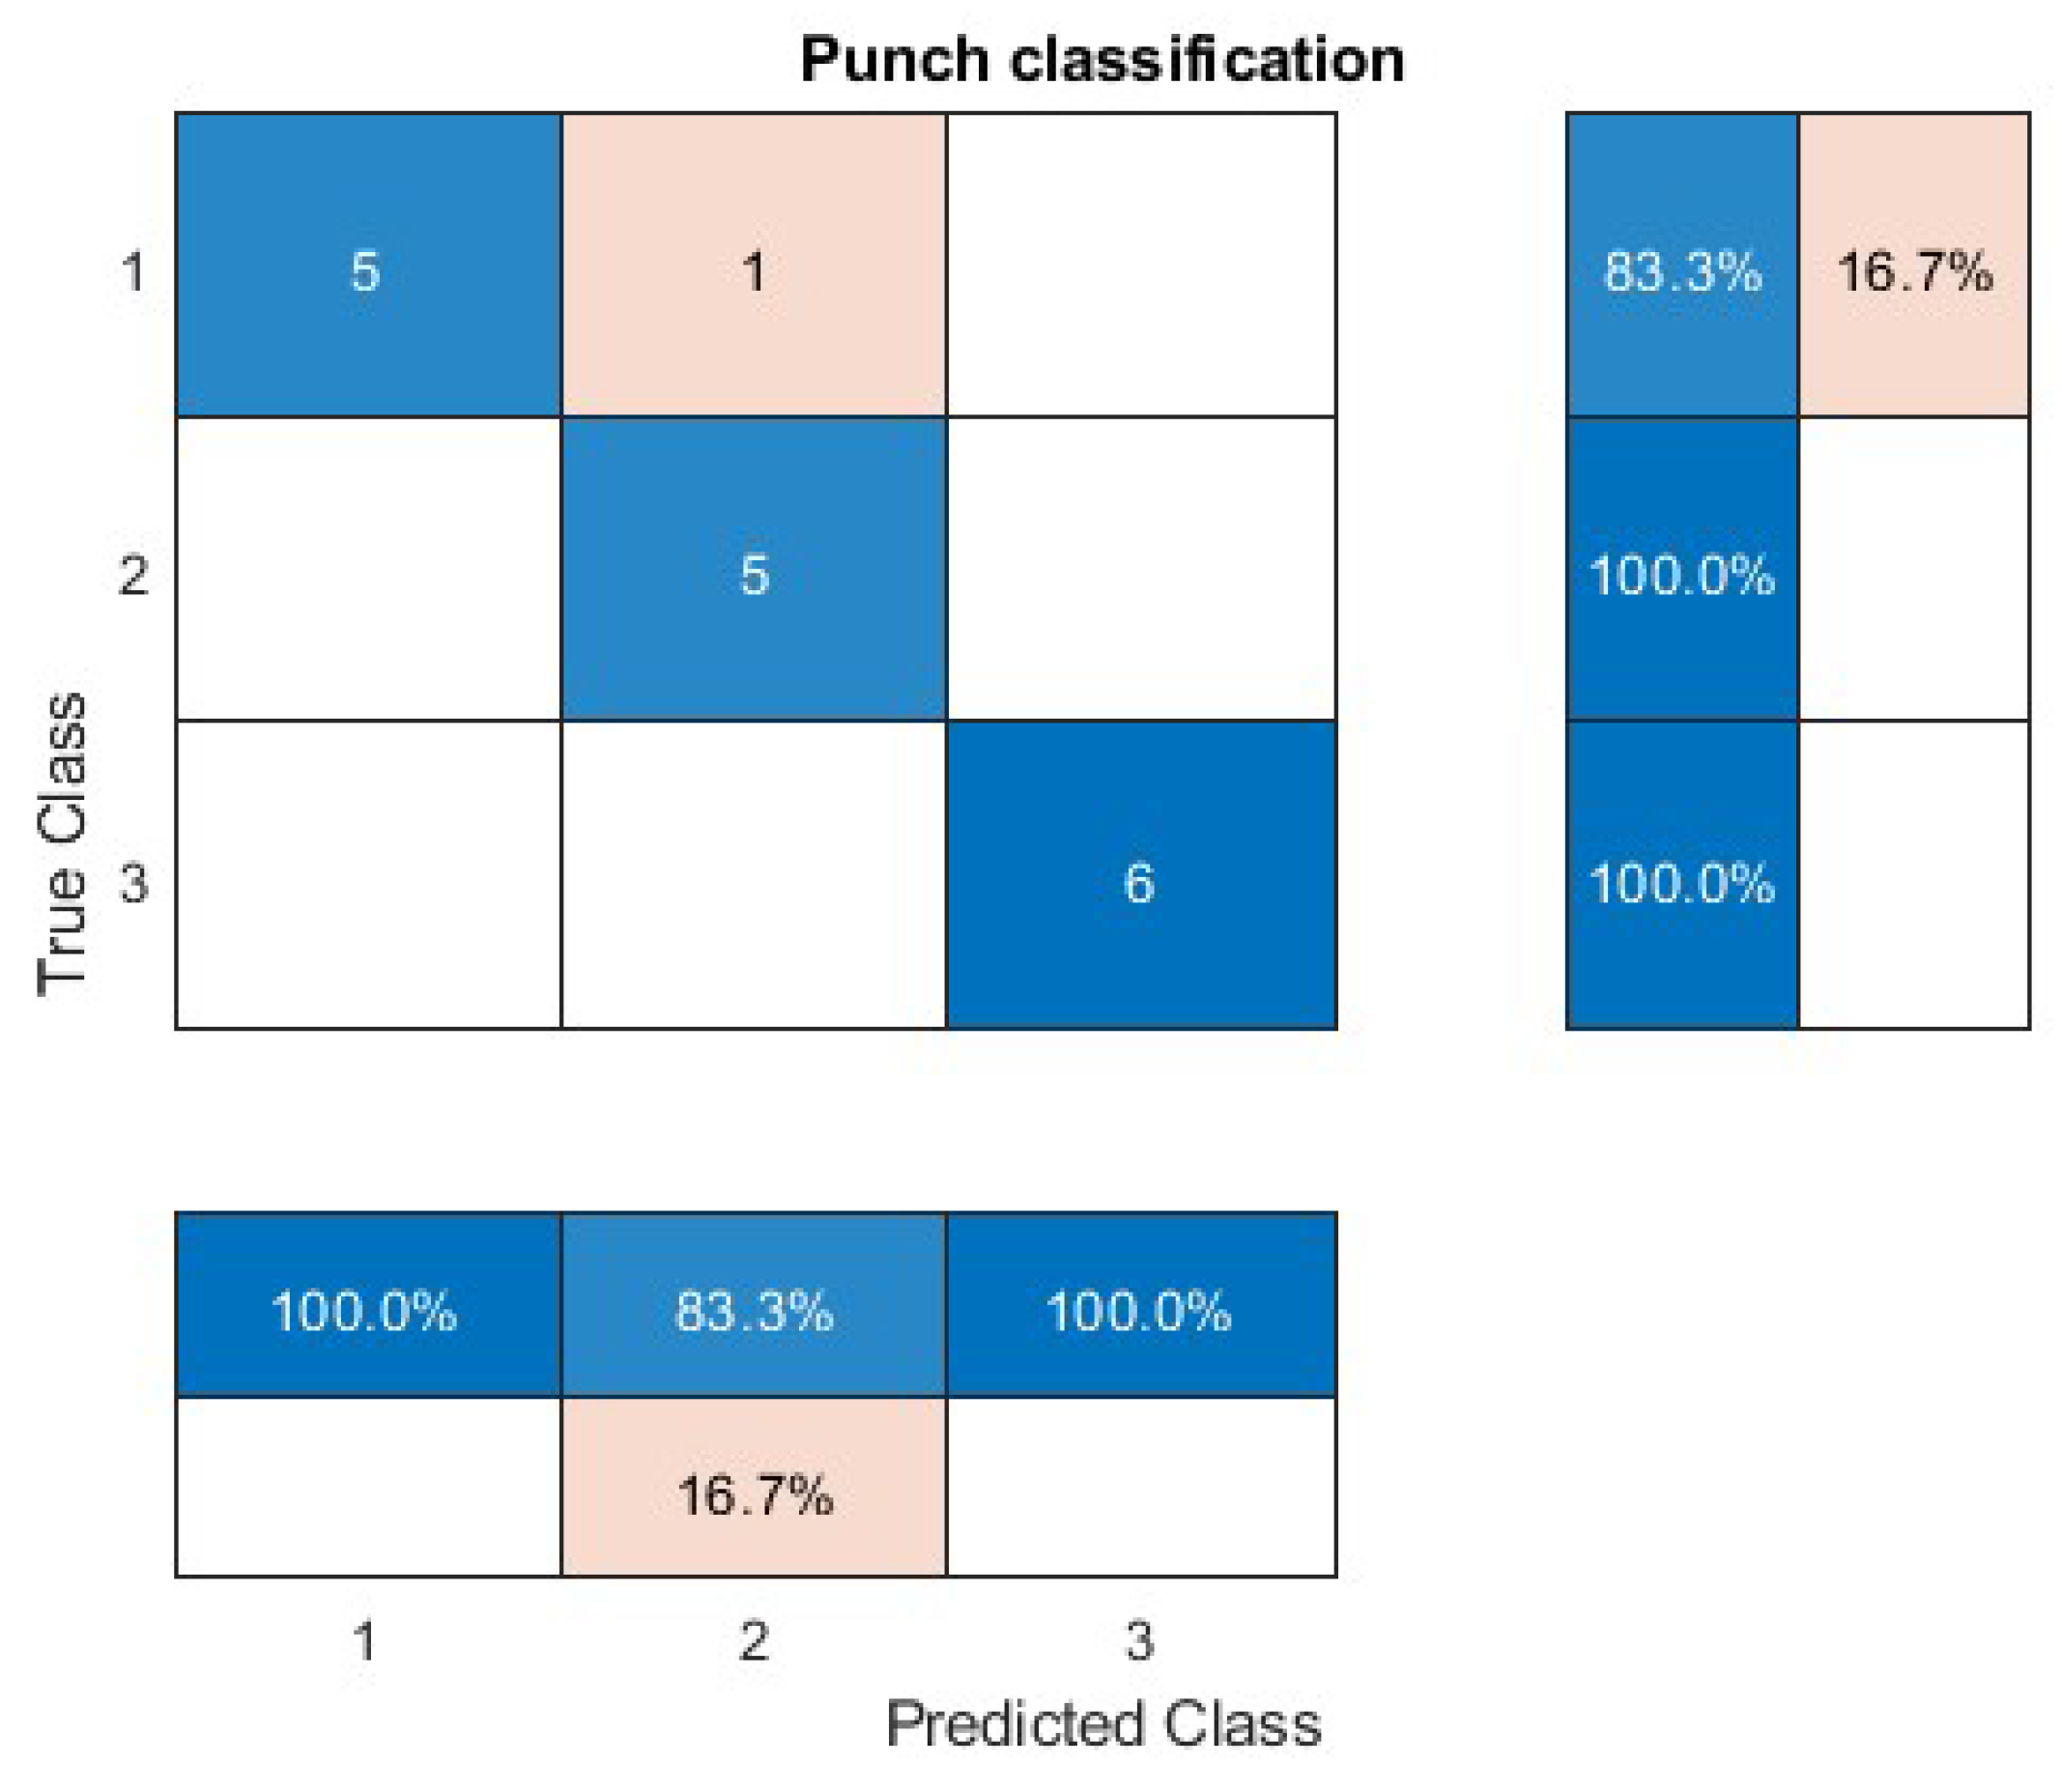
Figure 10.
Punch classification during shadow boxing.
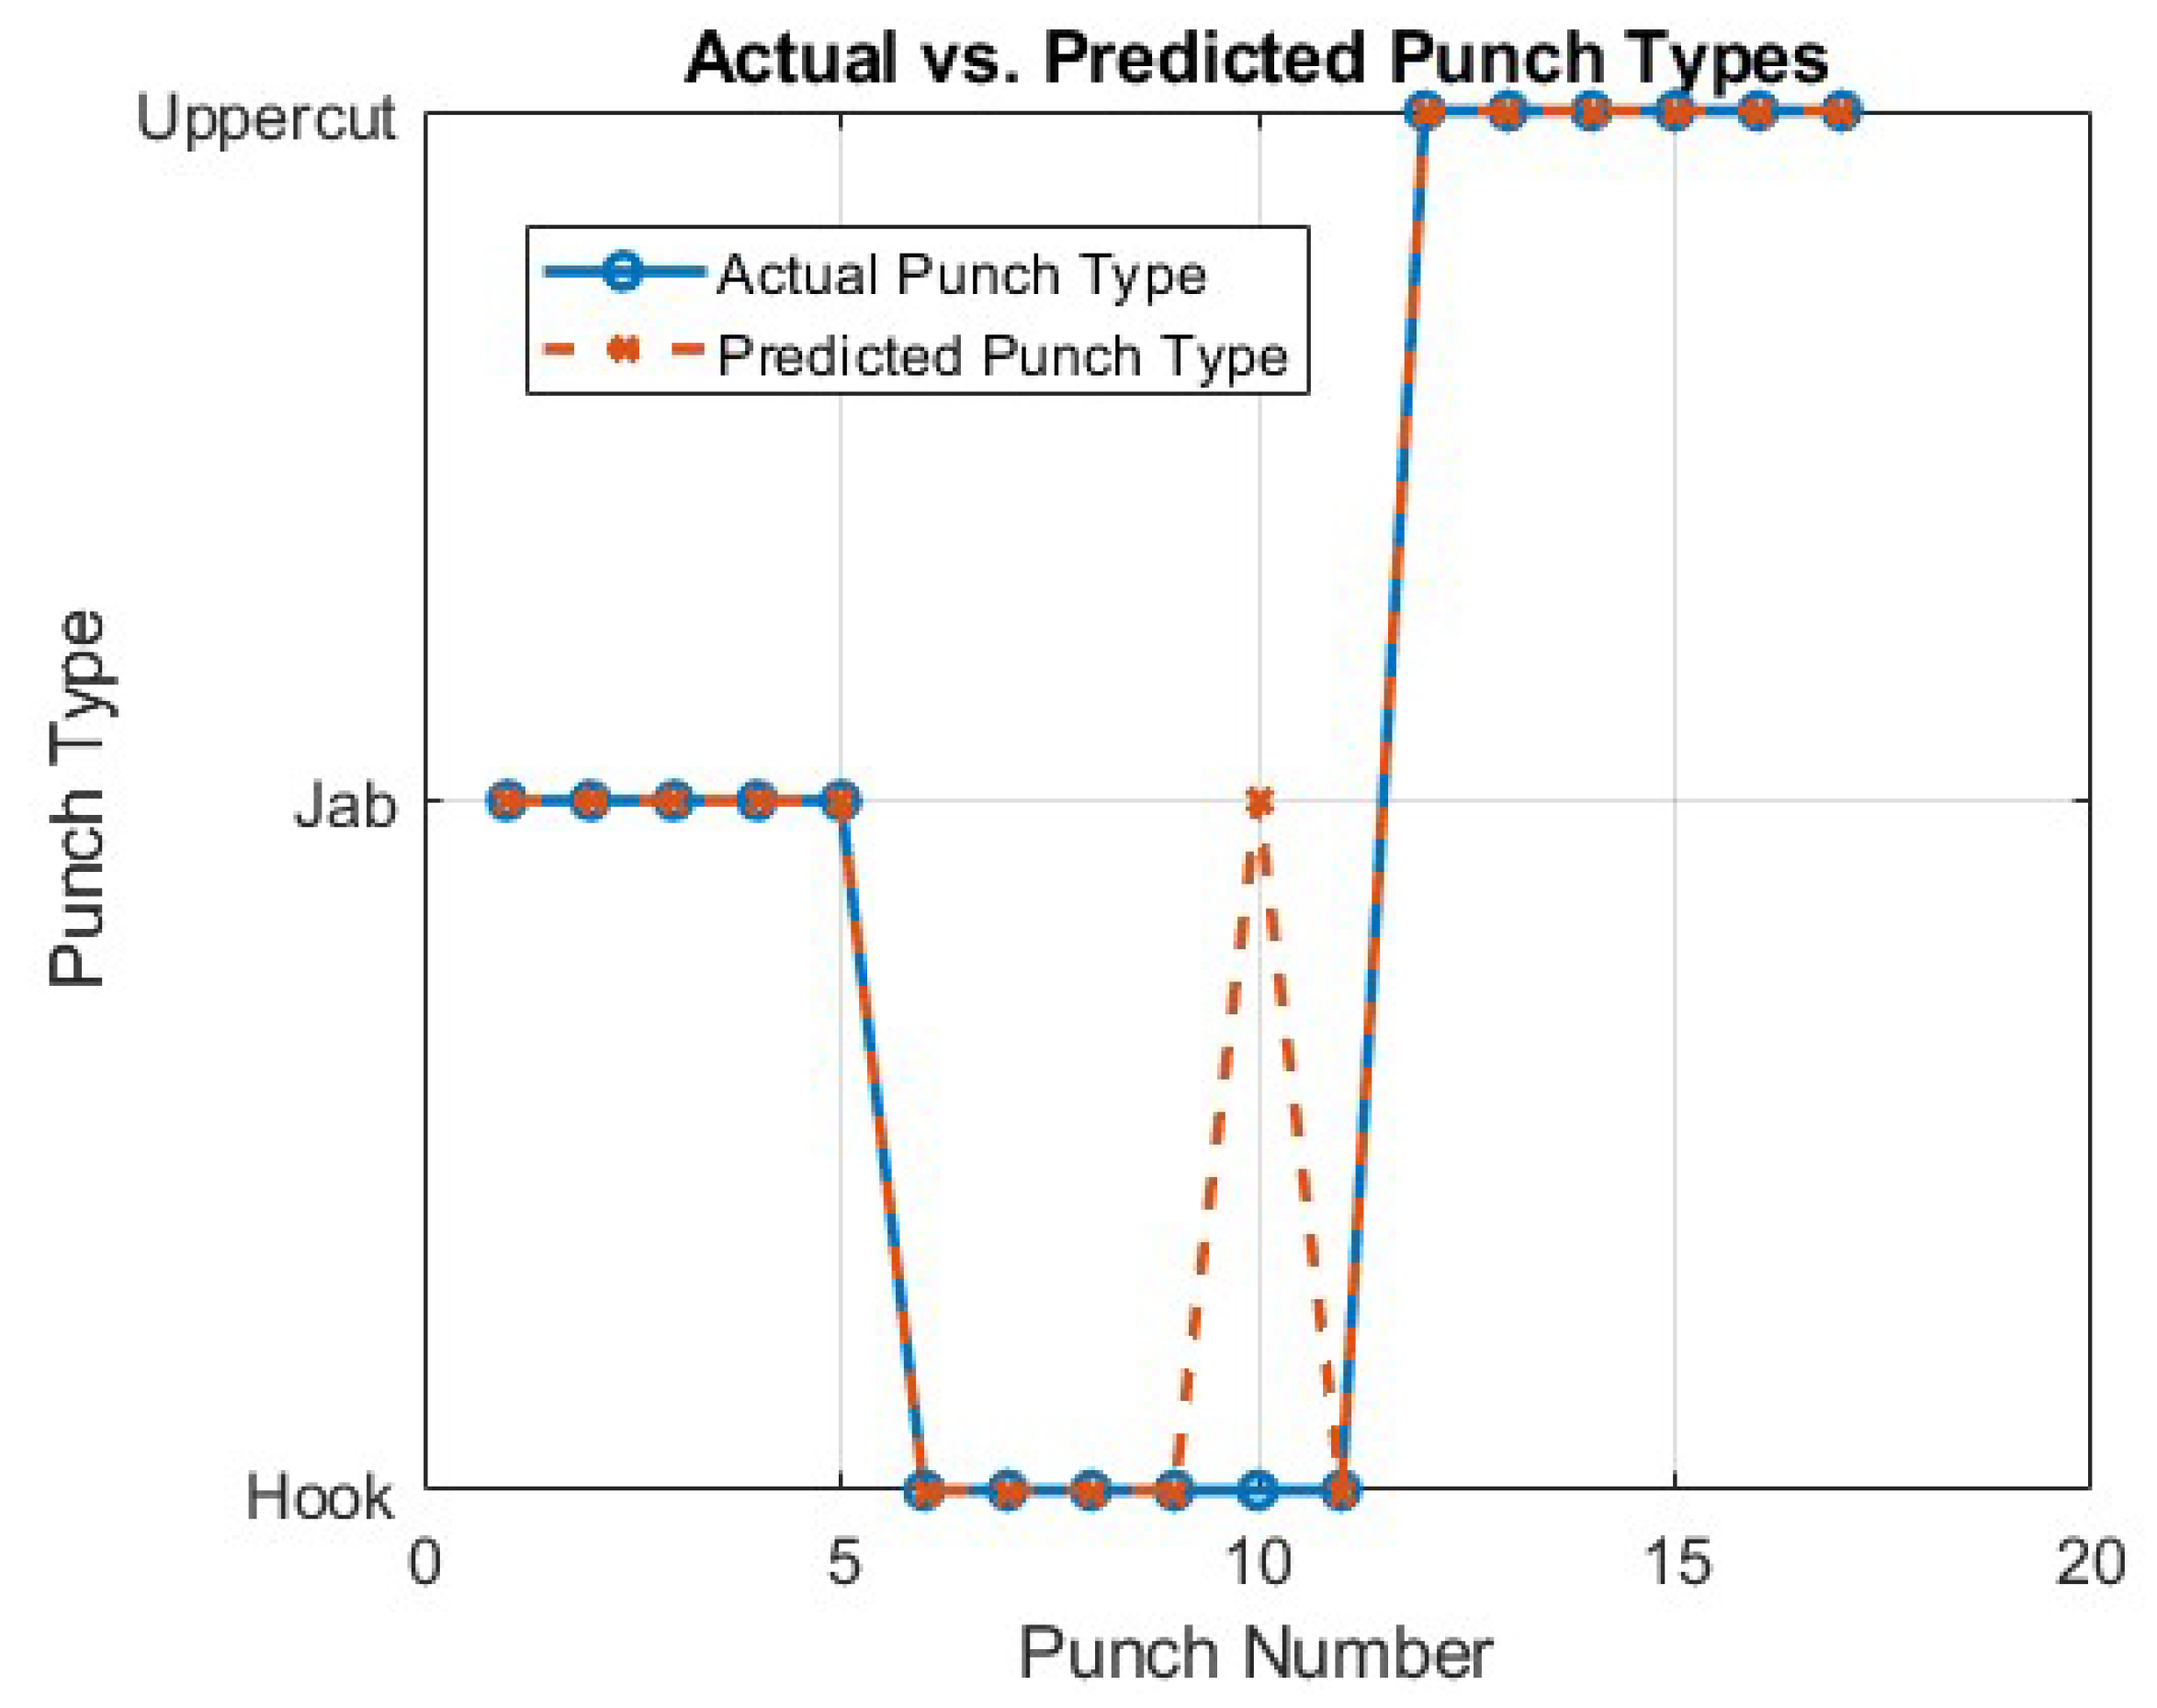
Figure 11.
Validation of jab punch with timestamp.
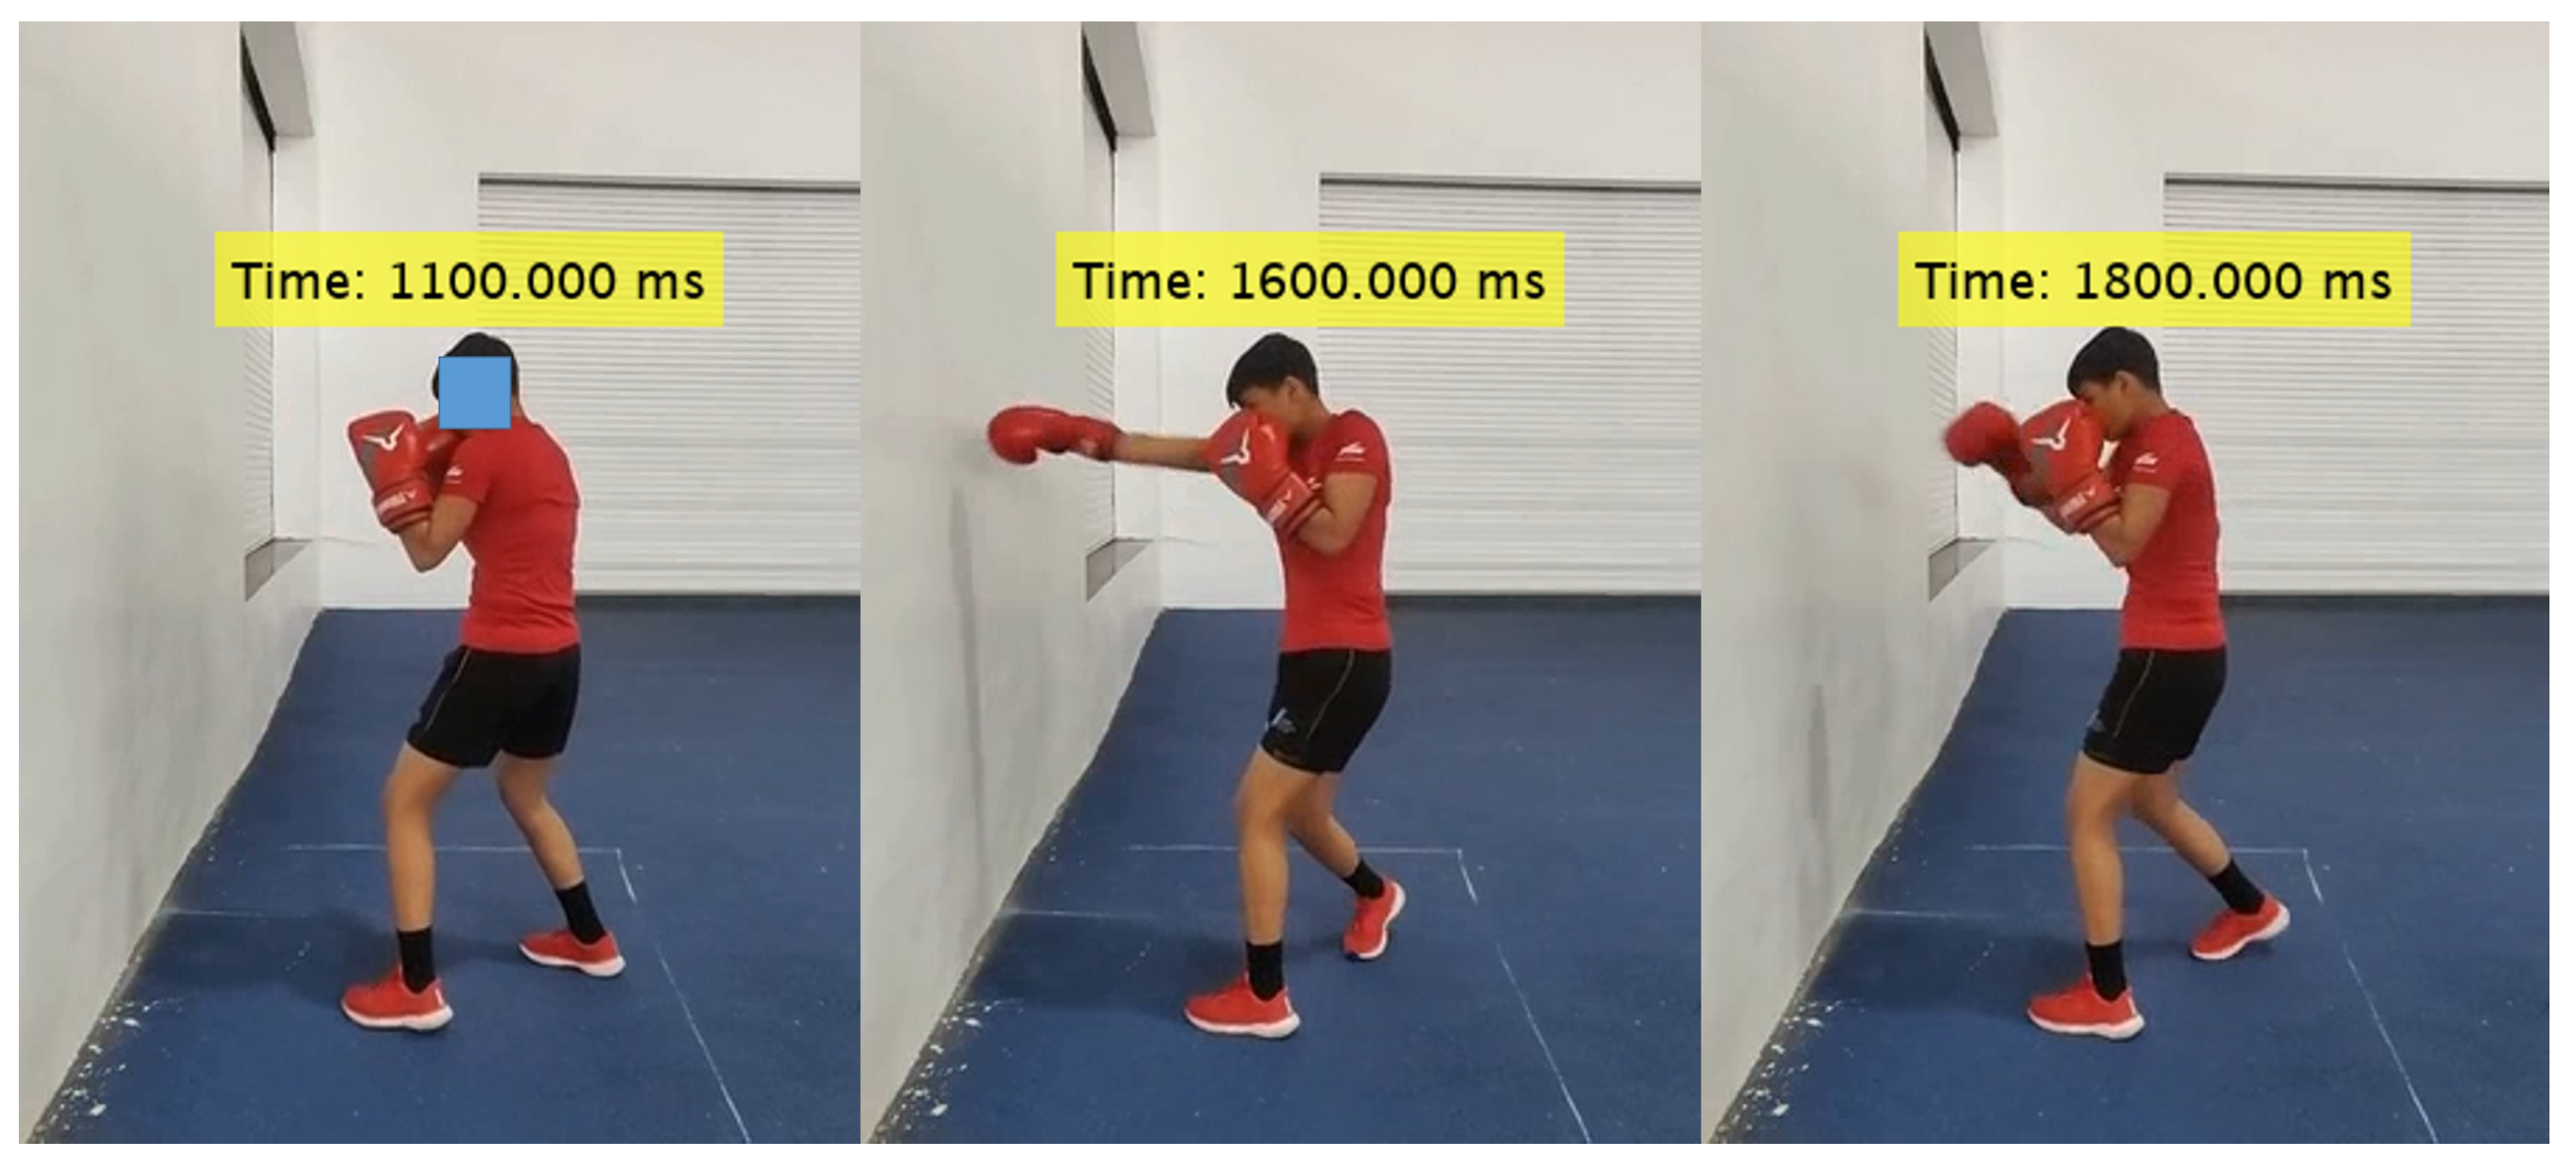
Figure 12.
Validation of hook punch with timestamp.
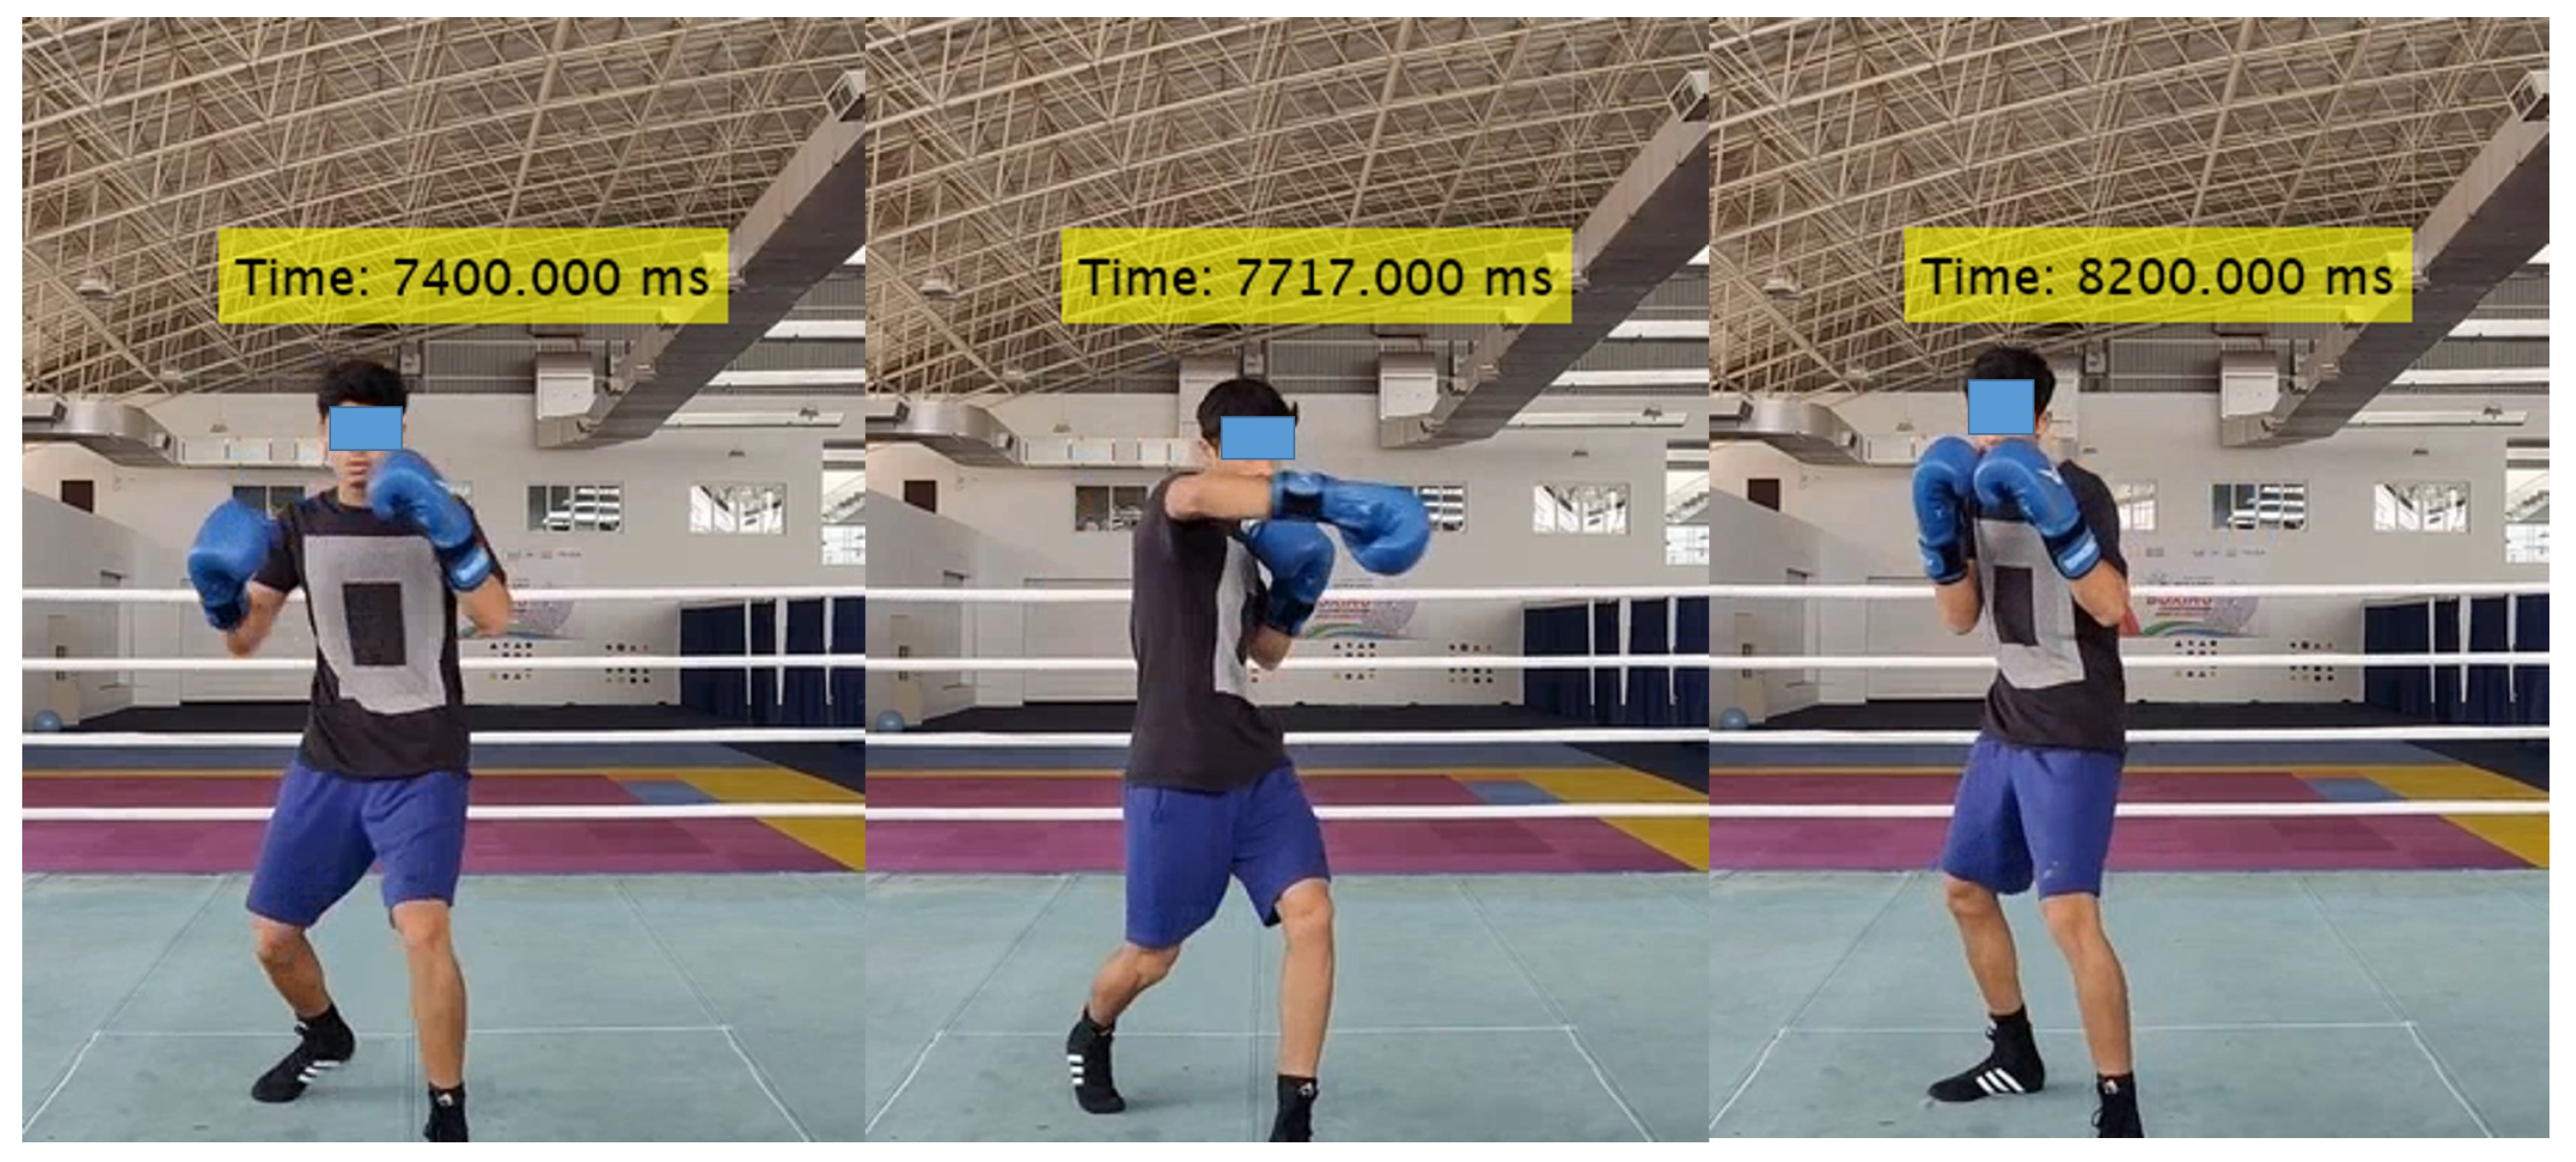
Figure 13.
Validation of hook punch with timestamp.
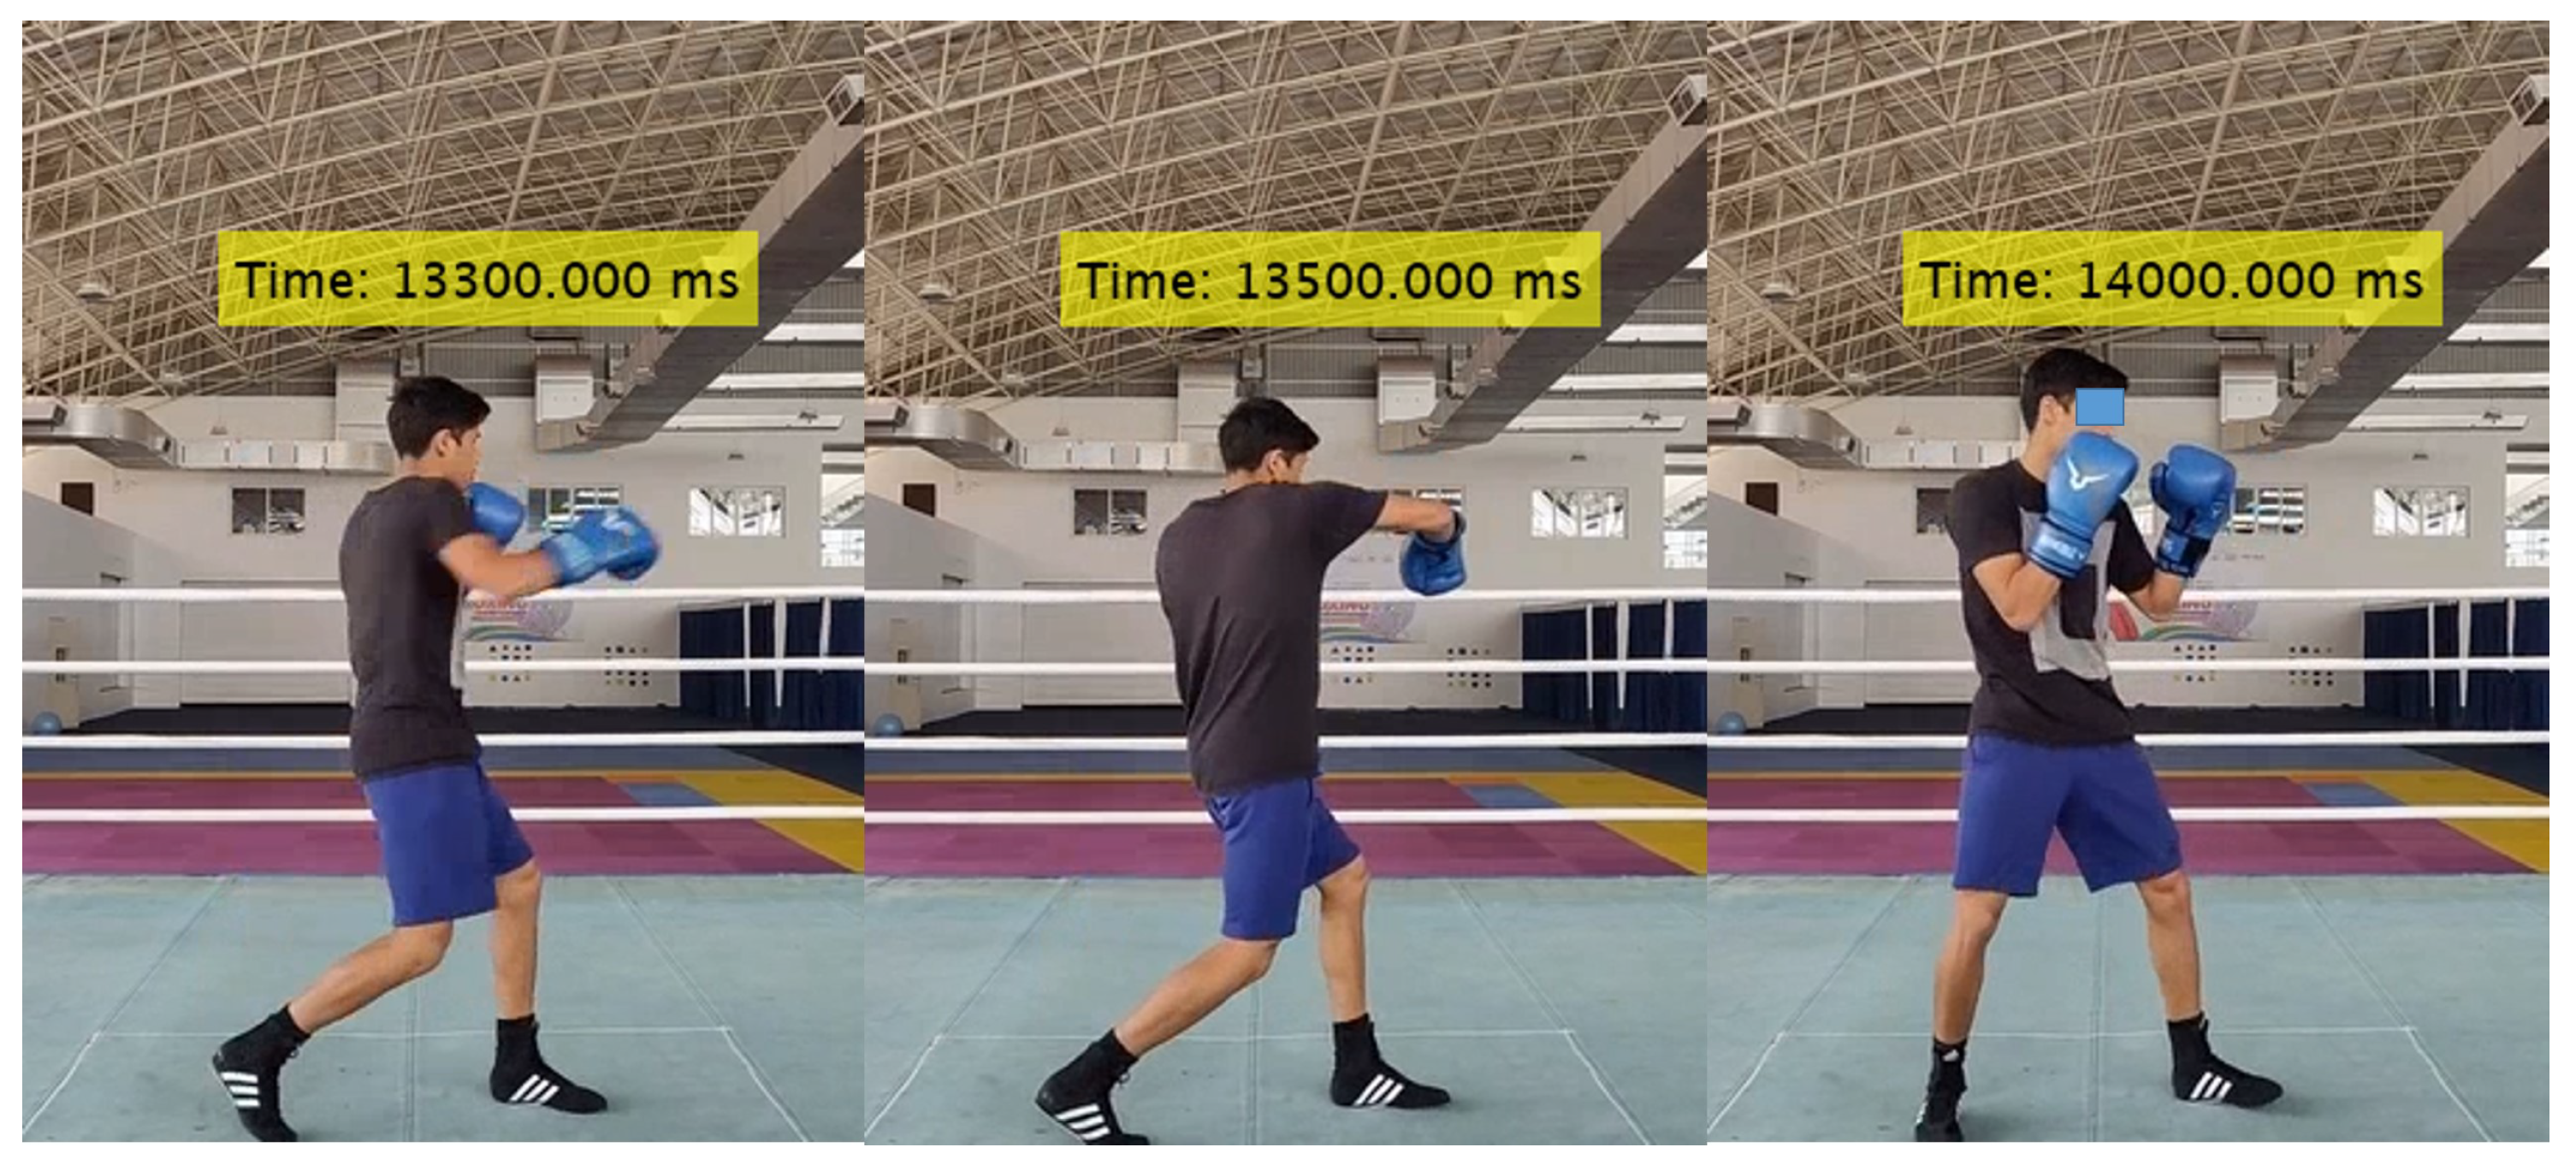
Figure 14.
Validation of uppercut punch with timestamp.
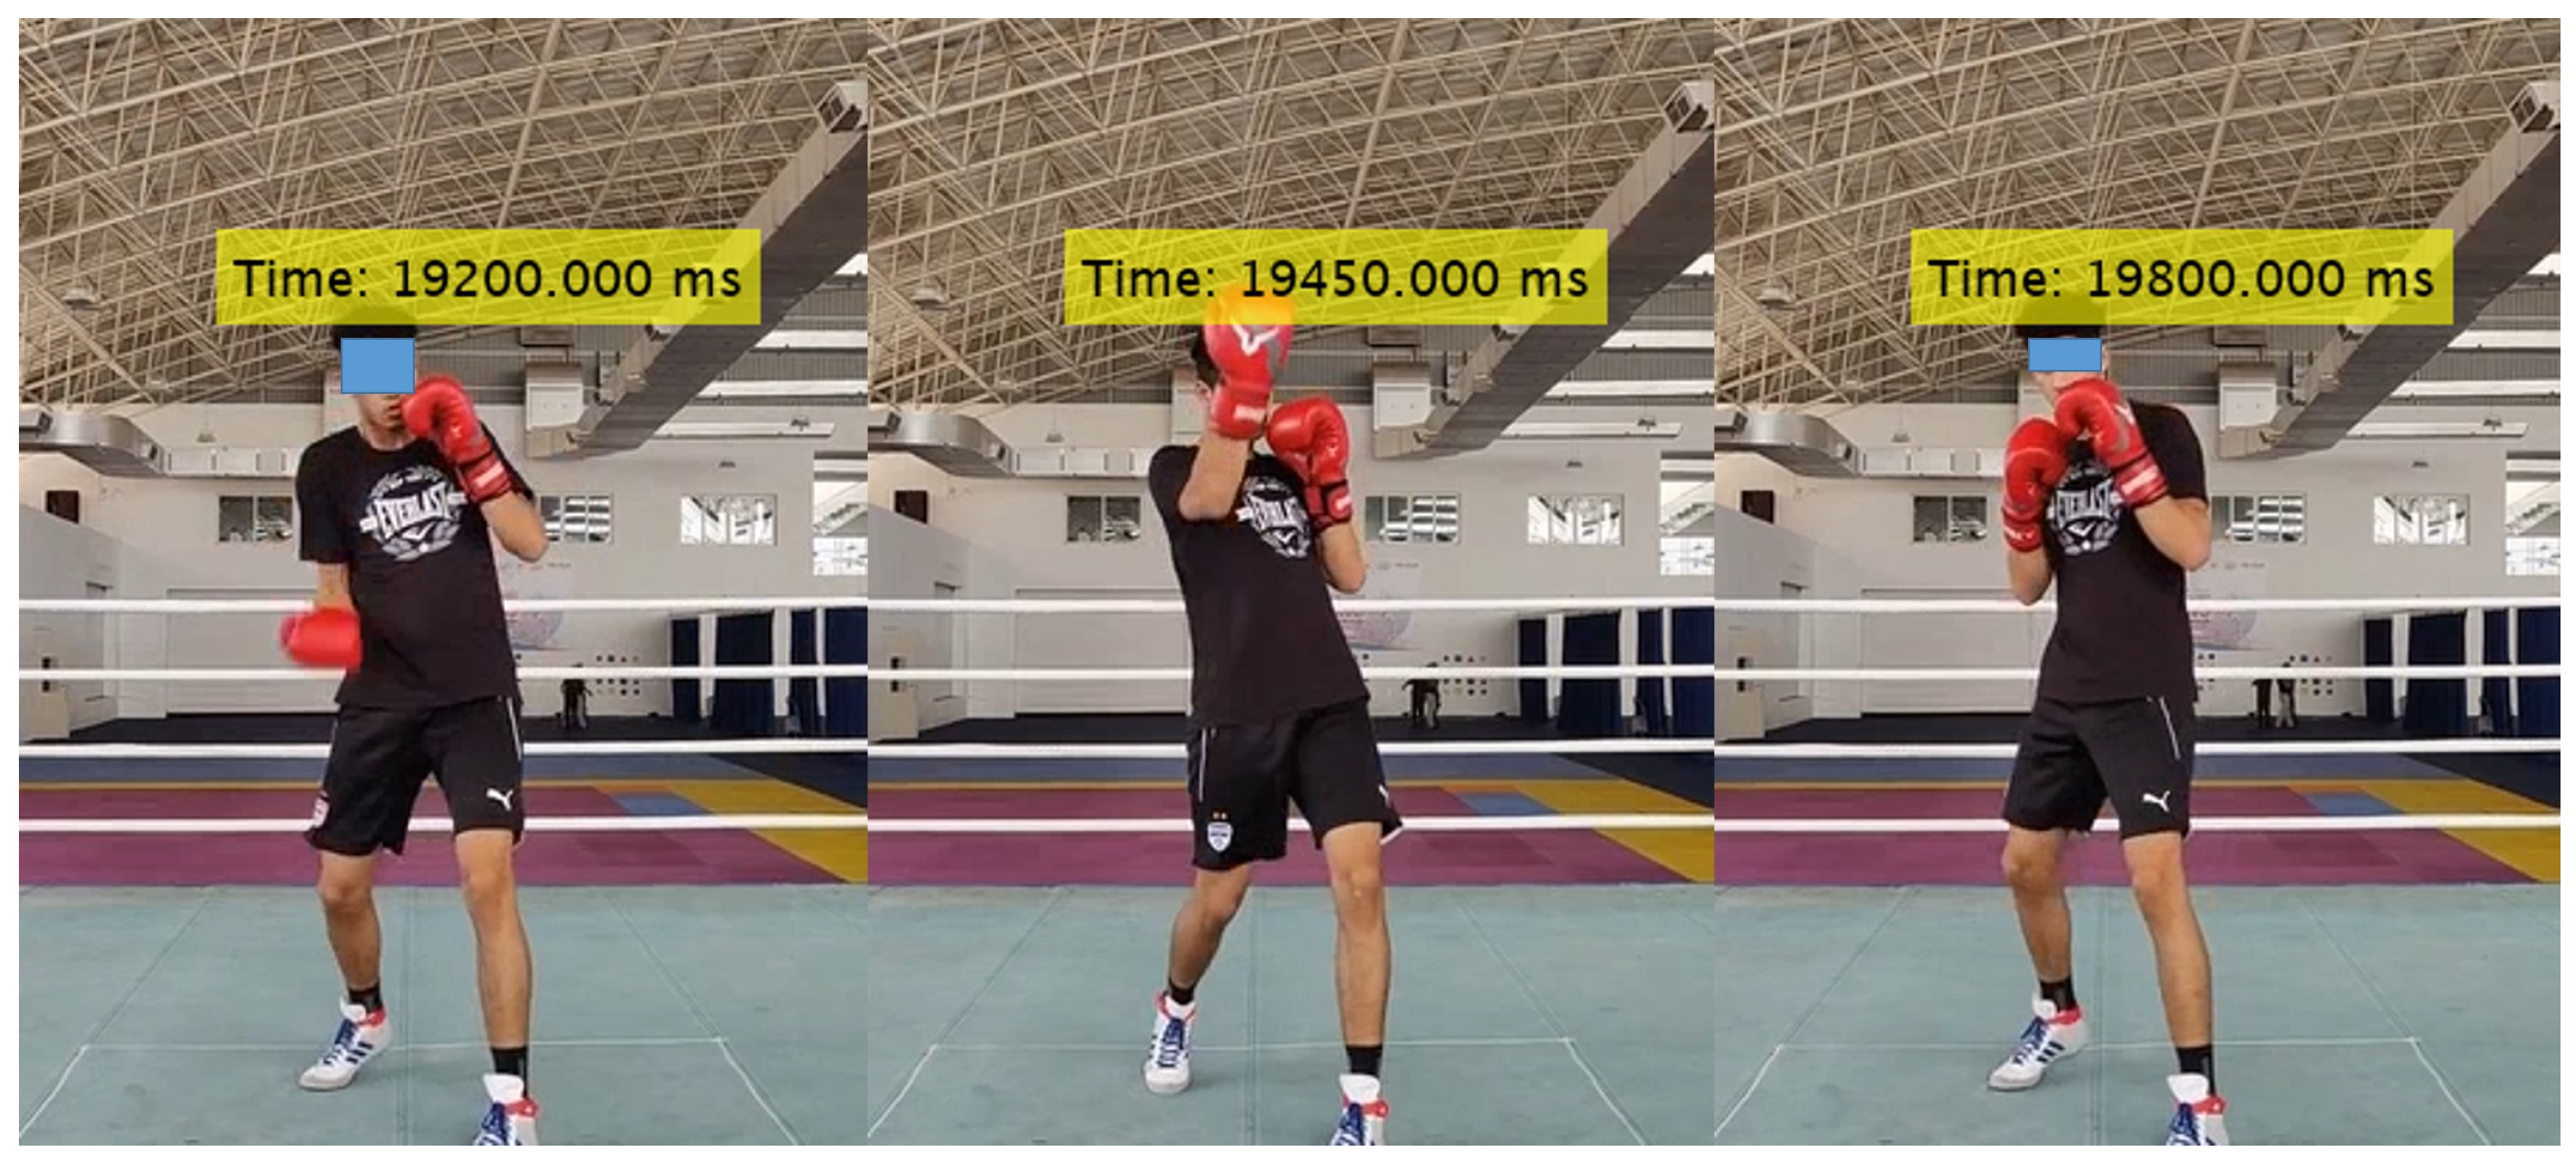

Table 1.
Literature review in computer vision .
| Reference | Sensor | Algorithm developed | Metrics | Accuracy | Limitation |
|---|---|---|---|---|---|
| [19] | Swissranger SR4000 time-of-flight(ToF) camera | multi-class SVM and Random Forest classifiers | classify straight, hook, and uppercut | 96.2% | Sensitivity to Lighting Conditions |
| [20] | Qualisys open 7 & kistler force plate | Visual3D software | 3D kinetics & kinematics of punch | - | Blind spots or occlusions |
| [4] | High resolution camera | YOLOv5 model | scoring accuracy & winner prediction | 63.33% & 70% | Accuracy is low |
| [21] | 4 no GoPro Hero8 cameras | Euclidean measure | contact between the boxers | - | Realtime processing |
Table 2.
Literature review in IoT wearable system.
| Reference | Sensor | Algorithm developed | Metrics | Accuracy | Limitation |
|---|---|---|---|---|---|
| [14] | 2 IMU sensors, ATMega328P | KNN, Random Forest and SVM | punch classification | 37.37%-59.16% | Training and labeling more data poses challenges |
| [18] | Smartphone-based Phyphox IMU app | 12-layer deep neural network with TFLearn | Punch classification | 79.2% | Limited data cause overfitting, hard to predict unknown user behavior |
| [15] | IMU sensor | Multilayer perceptron (MLP-NN) | Punch recognition | 91.89%(amateur) & 92.93%(elite) | Applied to practice sessions rather than real-time matches |
| [9] | SABELSense 9DOF IMU | LR,SVM,MLP-NN,RF,XGB | Classify strike type | MLP-NN(98%) | Discomfort during training |
| [22] | Arduino NodeMCU, vibration sensor, force sensor, and ,IMU | STATISTICA software™ Statistical analysis | Punching and kicking forces, punching location with reaction times | - | Applied to practice sessions rather than real-time matches. |
| [23] | Piezoresistive sensors, IMU, gimbal device, Kistler force plate and Vicon motion capture system | IBM SPSS Statistical analysis | Punch biomechanics | - | Limited movement of boxer, Isolated testing environment |
Table 3.
Accuracy metrics of the random forest model.
| Model | Accuracy | Precision | Recall | F1-Score |
|---|---|---|---|---|
| Random forest | 96% | 96% | 96% | 0.96 |
Table 4.
Punch recognition accuracy metrics with different percentages of the training dataset.
| Percentage of training data | Accuracy | Precision | Recall | F1-Score |
|---|---|---|---|---|
| 5% | 83.17% | 83.67% | 84.92% | 0.84 |
| 10% | 93.81% | 93.95% | 93.83% | 0.93 |
| 15% | 94.19% | 95.02% | 94.23% | 0.95 |
Table 5.
Punch classification accuracy metrics with different percentages of the training dataset.
| Percentage of training data | Accuracy | Precision | Recall | F1-Score |
|---|---|---|---|---|
| 5% | 79.67% | 81.17% | 85.08% | 0.83 |
| 10% | 90.86% | 91.44% | 91.80% | 0.91 |
| 15% | 93.24% | 94.29% | 93.62% | 0.94 |
Table 6.
Performance Metrics of the punch recognition.
| Subject | Hand | Accuracy | Precision | Recall | F1-score |
|---|---|---|---|---|---|
| 1 | Rear | 91.34% | 91.34% | 91.27% | 0.91 |
| Lead | 92.31% | 92.83% | 91.63% | 0.92 | |
| 2 | Rear | 92.58% | 91.97% | 91.06% | 0.92 |
| Lead | 91.58% | 92.35% | 90.40% | 0.91 | |
| Mixed | Rear | 91.41% | 91.68% | 90.11% | 0.91 |
| Lead | 91.91% | 92.62% | 90.97% | 0.92 |
Table 7.
Time duration of the punch.
| Punch count | Start time (sec) | End time (sec) |
|---|---|---|
| 1 | 1.1 | 1.8 |
| 2 | 2.0 | 2.7 |
| 3 | 2.9 | 4.5 |
| 4 | 4.7 | 5.4 |
| 5 | 5.6 | 6.3 |
| 6 | 7.4 | 8.2 |
| 7 | 8.9 | 9.6 |
| 8 | 10.4 | 11.2 |
| 9 | 13.3 | 14.0 |
| 10 | 14.6 | 15.3 |
| 11 | 16.1 | 16.8 |
| 12 | 17.6 | 18.3 |
| 13 | 19.2 | 19.8 |
| 14 | 20.7 | 21.2 |
| 15 | 24.2 | 24.9 |
| 16 | 25.8 | 26.4 |
| 17 | 27.3 | 28.0 |
Table 8.
Performance Metrics of the punch classification.
| Subject | Hand | Accuracy | Precision | Recall | F1-score |
|---|---|---|---|---|---|
| 1 | Rear | 97.46% | 97.75% | 97.51% | 0.98 |
| Lead | 93.87% | 94.60% | 94.16% | 0.94 | |
| 2 | Rear | 90.59% | 92.03% | 90.64% | 0.91 |
| Lead | 89.94% | 91.35% | 91.08% | 0.90 | |
| Mixed | Rear | 92.33% | 93.25% | 92.58% | 0.93 |
| Lead | 94.56% | 94.68% | 95.14% | 0.95 |
Table 9.
Literature comparison.
| Reference | Punch count for model training | Punch recognition | Punch classification | Start and end time of the punch |
|---|---|---|---|---|
| [27] | Jab-776, Hook-434, Uppercut-475, Backfist-139 | - | 🗸 | 🗸 |
| [15] | Lead and rear jab-6000, Lead and rear hook-6000, Lead and uppercut-6000 | - | 🗸 | - |
| [9] | Lead and rear jab-100, Lead and rear hook-100, Lead and uppercut-100 | - | 🗸 | - |
| [28] | Jab,hook,uppercut-2880 | - | 🗸 | - |
| [6] | Jab-120,hook-120,uppercut-120 | - | 🗸 | - |
| Our model | Lead and rear jab-36, Lead and rear hook-36, Lead and uppercut-36 | 🗸 | 🗸 | 🗸 |
Disclaimer/Publisher’s Note: The statements, opinions and data contained in all publications are solely those of the individual author(s) and contributor(s) and not of MDPI and/or the editor(s). MDPI and/or the editor(s) disclaim responsibility for any injury to people or property resulting from any ideas, methods, instructions or products referred to in the content. |
© 2024 by the authors. Licensee MDPI, Basel, Switzerland. This article is an open access article distributed under the terms and conditions of the Creative Commons Attribution (CC BY) license (http://creativecommons.org/licenses/by/4.0/).
Copyright: This open access article is published under a Creative Commons CC BY 4.0 license, which permit the free download, distribution, and reuse, provided that the author and preprint are cited in any reuse.


