
Submitted:
11 July 2024
Posted:
15 July 2024
You are already at the latest version
Abstract
Despite soccer popularity, comparatively little scientific information is available concerning the assessment of youth players’ physiological characteristics. The use of medical software integrating wearable sensors to provide accurate and objective data is necessary. In the present study, the objective assessment of physical performance of 128 adolescent soccer players at two timepoints (pre-season and end-season) has been performed. Participants completed a comprehensive test battery including stability, countermovement jumps (CMJ), plyometric jumps (PJ), agility, and quick feet tests. A single Inertial Measurement Unit (IMU) sensor provided quantitative data on various performance metrics. Principal Component Analysis (PCA) reduced the dataset to four principal components (PCs) explaining over 80% of the variance: power (PC1), balance (PC2), speed/agility (PC3), and stiffness (PC4). Paired samples t-test between the two timepoints showed no significant differences in the PCs between the two timepoints, indicating that the training program did not significantly alter the assessed physical attributes. However, subtle individual changes may still inform personalized training adjustments. The study highlights the importance of continuous monitoring and individualized training strategies to optimize athlete performance and reduce injury risk.
Keywords:
Soccer players performance
; objective physical measurements
; Inertial Measurement Units
; Principal Component Analysis
; wearable sensors
; medical software
1. Introduction
Soccer is widely recognized as the most popular sport in the world, with two hundred and eleven national associations [1]. Despite the global popularity of soccer, comparatively little scientific information is available concerning the physiological characteristics of the participants, especially in youth players [2].
Given the sport’s complexity, the performance of soccer players is influenced by various factors such as physical, psychological, tactical, and technical skills [3,4]. Among the physical factors, soccer players need to combine fundamental motor abilities such as balance, speed, strength, agility, power and endurance, before soccer-specific technical skills can be developed [2]. Subsequently, the development of objective physical fitness testing of youth soccer players has become more prevalent in recent years [4]. Furthermore, the objective evaluation of physical and cognitive demands on soccer players will allow a scientific approach to training [2].
The necessity of using technological tools to objectively assess physical performance is evident across literature [5,6,7,8,9,10]. In particular, an alternative to the traditional laboratory-based assessment is the use of wearable sensors that can assess performance without movement or space limitations and with simple set-up procedures [7,11,12,13,14,15,16]. Wearable sensors have widespread especially since the advent of Micro-Electro-Mechanical Systems (MEMS) technology, which enabled the manufacture of highly miniaturized, relatively low-cost and low-power sensors [17,18]. One of the most used wearable devices to objectively assess biomechanical movements are the Inertial Measurement Unit (IMU) sensors. IMUs comprise accelerometers, gyroscopes and magnetometer to measure raw accelerations and angular velocities during movements which allow the estimation of temporal, kinematic and dynamic parameters [17,19].
The usage of IMUs sensors during test batteries execution provides physical performance coaches with important quantitative information that can be used to improve athletes’ performance. Indeed, coaches and sport scientists can obtain individual athletes’ profiles with strengths and weaknesses. This information can be used by physical performance coaches to develop optimal short- and long-term training strategies by setting personalized objectives and reduce the risk of injuries [20,21]. Moreover, objective data are required to study the effectiveness of a training program and the readiness of the individual to return to normal training and match play following rehabilitation [21]. The results of a fitness test provide valuable feedback to the coach on both the usefulness of the intervention program and the responses of the individual athlete [22].
Given the variety of physical attributes that contribute to an athlete’s performance, understanding and interpreting the multivariate datasets obtained can be challenging for practitioners [23,24]. As some of the variables contained in the dataset may share similar information (i.e., collinearity), the adoption of techniques to reduce data dimensionality and multicollinearity is recommended [23,24,25]. Principal Component Analysis (PCA) is a technique to reduce data multicollinearity by identifying principal components (PCs) that explain the dataset variance [23,24,25,26]. PCs are composite variables obtained as a linear weighted combination of the observed variables, where all PCs are uncorrelated with each other and capture most of the information (i.e., variance) contained in the observed data [23]. The use of PCA can then overcame data multicollinearity, making datasets easier to be interpreted and allowing differences easier to be recognized [24,27].
Therefore, the aim of the present study is to propose a method for the objective assessment of the physical performance of young footballers using a single IMU sensor. PCA was then used to reduce the dimensionality of the data set. The calculated PCs were then used to compare the results at the beginning of the sport season with those at the end, to highlight areas of performance where changes occurred.
2. Materials and Methods
2.1. Participants and Design
The present study consists in the assessment of 128 adolescent soccer players (age: 13.8 ± 2.1; height: 165.3 ± 13.4 cm weight: 54.3 ± 13.1 kg) at two time points (T0 = pre-season and T1 = end-season), eight months apart. The participants were ranging from the under 12 to the under 19 categories of the Youth Sector of a professional club and voluntarily participated to the study. The inclusion criteria were as follows: (i) no injuries at the time of the evaluations and (ii) no injuries in the two weeks prior to the evaluations.
The study was conducted in accordance with the Declaration of Helsinki of 1964 and its latest amendments. Written informed consent was obtained from all participants and their parents.
2.2. Materials
The physical test battery was performed using euleria lab (Euleria srl, Rovereto (TN), Italy) Class IIa (MDR 2017/745) medical software. The performance module integrated in euleria lab objectively assess the physical performance using a position sensor integrated into a proprioceptive board and a single IMU. The IMU (Xsens DOT, Xsens Technologies B.V., Enschede, The Netherlands) is a small (36.30 x 30.35 x 10.80 mm) and lightweight (11.2 g) wearable sensor which integrates a 3D accelerometer (±16g full scale range), 3D gyroscope (±2000°/s full scale range) and 3D magnetometer (±8 Gauss full scale range). Data sampling rate used in this application is 60 Hz.
2.3. Procedure
Before starting the physical test battery, height (cm) and weight (kg) were measured and registered for each participant. Height was measured to the nearest 0.1 cm using a stadiometer and weight was measured to the nearest 0.1 kg using a calibrated analogue scale (light indoor clothing, no shoes). Body Mass Index (BMI, kg/m2) is then calculated dividing the body mass by the height (converted in m) squared.
The test battery integrated in euleria lab medical software consists in five different tests conducted in a systematic order. Before the test execution, the participants carried out a standardized 10-minute warm-up consisting of various running exercises with increasing intensity and low-intensity jump exercises. Given the non-grassy smooth surface on which the tests were conducted, participants were asked to wear sports shoes during the test session, to avoid slipping and injuries. After two non-registered practice trials, a single attempt for each task was performed and registered. One minute of rest was included between two consecutive trials and five minutes of rest were included between two different tests.
The test battery includes the following tests:
- Double leg (DL-ST) and single leg (SL-ST) stability test performed both with right (R-ST) and left (L-ST) foot
- Double leg (DL-CMJ) and single leg (SL-CMJ) counter movement jump test performed both with right (R-CMJ) and left (L-CMJ) foot
- Double leg plyometric jump (PJ) test
- Single leg agility test, named parkour (PK) test
- Quick feet (QF) test
In the case of single-leg tests, the previously defined dominant leg was tested first.
2.3.1. Stability Test
The stability test was performed on a proprioceptive board free to move in all directions (MFT Challenge Disc, TST – Trend Sport Trading, Grosshöflein, Austria). A position sensor is integrated in the board to detect its inclination, providing real-time feedback about the disc position in time. On the screen in front of the athlete, a target with a blue dot representing the disc inclination is shown.
Before starting the test, each participant was instructed to keep the blue dot as close as possible to the centre of the target. In the case of DL-ST, participants can place their feet at the distance they feel most comfortable with. In the case of SL-ST, the tested foot was positioned in the centre of the disc, while the other foot was not allowed to touch the board or the ground to stabilize.
The variable obtained from the stability test is named Level of Stability (LoS, arbitrary units, a.u.) and can assume values between 1 and 5 and is calculated as follows:
where i is the number of concentric circles in the target shown on the screen and samples is the number of samples collected by the disc’s position sensor during the test. The closer the values obtained are to 1, the better the stability performance.
2.3.2. Counter Movement Jumps Test
The CMJ test was performed with the participants wearing the IMU sensor at the flank level through an elastic band, to minimize the sensor’s movement during the jumps. In the case of the DL-CMJ, the sensor was placed on the dominant side, while in the case of the SL-CMJ, it was placed on the tested side.
Each participant was instructed on how to perform the CMJ correctly. They were asked to start from an upright position with their feet shoulder-width apart and to make a quick downward movement, bending at the hips and knees (counter movement phase). The counter movement phase had to be followed by an immediate and powerful upward movement (propulsive phase) and the landing phase. Participants were asked to maintain their hands on their hips throughout the CMJ to minimize the effect of arm swing on jump performance. For the SL-CMJ, participants were asked to perform the counter movement and propulsive phases using only the tested leg but were allowed to land with both feet to minimize the risk of injury.
The variables calculated through the data collected by the IMU were the vertical jump height (CMJVJH, cm) and the power developed during the jump (CMJPOW, W/kg) normalized by subject’s body mass, calculated as follows [28,29]:
where FT is the Flight Time (s) corresponding to the time between take-off and landing instants automatically detected by the euleria lab software, and g is the gravity acceleration (m/s2).
2.3.3. Plyometric Jump Test
The PJ test was performed with the participants wearing the IMU sensor at the flank level of the dominant side through an elastic band, to minimize the sensor’s movement during the jumps. Each participant was instructed on how to perform the PJ test correctly. They were asked to start from the same position as for the CMJ and were instructed to perform five consecutive vertical jumps with the aim of maximizing the jump height with the shortest possible contact time between two consecutive jumps. Participants were allowed to use their arms during the jump execution.
The variable calculated was the maximum vertical jump height (PJVJH, cm) calculated as in Equation (2), the minimum contact time (PJCT, ms) calculated as in Equation (3). Moreover, a stiffness parameter (PJST, a.u.) was calculated as the ratio between the maximum vertical jump height and the minimum contact time, and then converted to a.u. by multiplying it by the conversion factor (*10).
2.3.4. Agility Test
The agility test was performed creating a jumping coordination path using the Speedy Basic Jump Set (TST Trendsport, Grosshöflein, Austria). Participants wore the IMU sensor at the flank level of the dominant side through an elastic band which minimized the sensor’s movement during the test. Each participant was instructed to correctly perform the test by following the predefined jump path, consisting of single leg forward, backward, and lateral jumps as shown in Figure 1. Double jumps without overcoming an obstacle, twisting the hip, or touching the ground with the raised leg were not allowed. The dominant side was tested first, followed by the non-dominant side.
The variable obtained from the PK test is the time (in seconds) required to complete the jump path, which was automatically measured by the IMU sensor through the automatic detection of the first and last jump in the sequence.
2.3.5. Quick Feet Test
The QF test was performed positioning the hurdles of the Speedy Basic Jump Set (TST Trendsport, Grosshöflein, Austria) to create an obstacle as shown in Figure 2.
Participants wore the IMU sensor in the sagittal plane on the mid-thigh of the dominant side through an elastic band which minimized the sensor’s movement during the test. Each participant was instructed to correctly perform the test by stepping in and out from the obstacle until the completion of 15 repetitions. One repetition was finished when the starting leg returned to its initial position.
The variable obtained from the PK test is the time (in seconds) required to complete the 15 repetitions automatically measured by the IMU sensor through the automatic counting of the repetitions.
2.4. Statistical Analysis
Data was tested using parametric statistical analysis following a preliminary checking for normality and homogeneity of variances (using the Shapiro–Wilk’s and Levene’s test respectively). Descriptive statistics for each variable were calculated and expressed as mean ± standard deviation (SD).
PCA was performed to reduce the dimensionality of the dataset by composing correlated variables while retaining as much of the data set variability as possible. Variables within a given PC are correlated with each other, while the PCs themselves do not correlate and so explain distinct information. All data were centred and scaled before conducting the PCA [25]. The Kaiser-Meyer-Olkin (KMO) Test was used to verify the sampling adequacy of the data, with a value of 0.5 used as a threshold for acceptability [31]. The Bartlett’s Test of sphericity was also used to determine the suitability of the data for PCA, with significance accepted at an α level of p ≤ 0.05. Orthogonal rotation (varimax) was used to improve the identification and interpretation of factors [32]. Therefore, following the multi-faceted approach recommended by Hair et al. [32], the optimal number of principal components (PCs) to extract and interpret was determined. This approach involved examining the scree plot, analyzing eigenvalues, and assessing the cumulative variance explained by each PC [32].
Once variables were composed into PC via the PCA, a 2-tailed paired-samples t-test with α = 0.05 as level of significance was used to detect statistically significant differences between the PCs at two time points.
Statistical and data analysis were conducted using JASP (JASP Team 2023, Version 0.17.3) and MATLAB (v.2023a MathWorks, Natick, MA, USA).
3. Results
A total of 15 variables from 128 subjects were collected and analysed at two time points (T0 and T1). Descriptive statistics for each variable at the two time points are reported in Table 1 as mean ± SD.
According to the KMO test, two variables (PJCT and PJST) had measure of sampling adequacy (MSA) values lower than the acceptability threshold (MSA < 0.5). For this reason, PJCT and PJST were discarded for further analysis. The overall MSA was 0.694 and 0.663 for the T0 and T1 datasets, respectively. The Barlett’s Test of sphericity confirmed the suitability of the data (p < 0.001) for both the datasets.
Figure 3 shows the weight of each eigenvalue, the cumulative explained variability and the explained variability at the two timepoints (T0 and T1). In accordance with the recommendations suggested by Hair et al. [32], the first four PCs were extracted for both T0 and T1 datasets.
Numerical values of eigenvalues, variability explained, and cumulative variability explained for the firsts four PCs in the two time points are reported in Table 2.
Table 3 and Table 4 display the component loadings with a coefficient higher than 0.4 of the variables to the first four PCs at the T0 and T1 time point, respectively.
PC1 contains variables afferent to the CMJs parameters (both VJH and Power developed), PC2 groups the LoS parameters both from the DL and SL stability tests while in PC3 contributes the variables from the PK and QF tests. The last component (PC4) is only composed by PJVJH variable.
Once variables were composed into the four PCs, a 2-tailed paired-samples t-test was performed to compare the motor abilities at the two time points (T0 and T1). The results obtained didn’t show any statistically significant differences between the two time points (p-values > 0.05).
4. Discussions
The aim of the present study was to assess physical performance of adolescent soccer players through a comprehensive test battery at two different time points (pre and post sport season). The test battery consisted of stability tests, countermovement jumps (CMJ), plyometric jumps (PJ), agility tests, and quick feet tests. Fifteen quantitative variables were measured through inertial sensors (IMUs) embedded in proprioceptive boards and worn on the athletes’ body. IMU sensors offered significant advantages over traditional methods by providing measurable, objective and real-time data regarding athletes’ physical performance without space limitations or movement constraints. This technological approach allows precise measurements of physical variables, crucial in assessing the multifaceted physical abilities required for soccer performance, especially in youth players undergoing developmental stages. Descriptive statistics for all the variables at the two different time points were calculated and shown.
PCA was used to condense the multivariate dataset into fewer components, while retaining as much of the dataset variability as possible. In accordance with Hair et al. [32], four PCs explaining more than the 80% of the variance were obtained. Each PC represents a distinct set of physical attributes. The first PC explains the highest dataset variability (47.7% and 45.5% at T0 and T1, respectively) and contains the variables afferent to the vertical jump performances. Vertical jump height and power developed during CMJs appear to be the most influent variables in the dataset and can be referred to the power motor ability. The second PC groups the variables measured during the stability test and can be therefore associated to the balance motor ability. PC3 is correlated to speed and agility performance, while the last component, explaining approximately the 6% of the total variability, can be associated to stiffness ability.
The t-test indicated there were no significant differences in physical performance between the preseason (T0) and end-season (T1) evaluations. This finding suggests that the training program implemented during the season did not lead to significant improvements or declines in the assessed physical attributes. It is noteworthy that despite the lack of statistically significant differences, subtle changes in individual performance may still be relevant at the individual level for personalized training adjustments. The understanding of these changes is crucial for tailoring training programs to address individual strengths and weaknesses effectively. For instance, even minor improvements in physical parameters could enhance athlete’s overall performance or reduce the risk of injury. Conversely, the early identification of slight declines in these parameters allows coaches and sports scientists to intervene promptly with targeted interventions, such as corrective exercises or modifications in training intensity or volume. Monitoring the adjustments over time contributes to a comprehensive understanding of an athlete’s development trajectory and facilitates informed decision-making in sports coaching and athlete management.
Therefore, while the absence of significant group-level differences may suggest overall stability in physical performance, attending to subtle individual variations is essential for optimizing training strategies, enhancing performance outcomes, and promoting long-term athlete development.
Limitations and Considerations
Several factors could have influenced the outcomes of the study.
First, the relatively short timeframe (eight months) between evaluations may not have been sufficient to detect meaningful changes in physical performance. Longitudinal studies often span multiple seasons or years to capture significant developmental changes in athletes’ physical capabilities. In this study, while the timeframe provided insights into seasonal variations, it may not have fully captured the long-term effects of training adaptations and growth dynamics of adolescent players.
Additionally, factors such as individual variability in training adherence play a pivotal role in shaping performance outcomes. Athletes differ widely in their ability to consistently adhere to training programs due to varying levels of motivation, commitment, and external commitments (e.g., school workload, personal circumstances). This variability can influence the extent of physiological adaptations achieved within the study period. External factors influencing performance, such as environmental conditions (e.g., weather, playing surface), competitive schedules, and coaching methods, also contribute significantly to athletes’ physical responses. These factors introduce variability that may not be fully controlled, potentially influencing the consistency and magnitude of performance changes observed across participants.
Moreover, the specific characteristics of youth players’ growth and maturation are critical considerations in interpreting study outcomes. Adolescents undergo rapid physical and physiological changes during puberty, which can affect their motor skills, strength development, and overall athletic performance. Variations in biological maturity among participants can lead to disparities in baseline performance levels and responses to training stimuli, further complicating the interpretation of results.
Overall, while the study provides valuable insights into youth soccer players’ physical performance over a competitive season, these factors underscore the complexity and variability inherent in sports science research. Future studies should consider longitudinal studies with longer follow-up periods to capture potential developmental changes in youth soccer players’ physical abilities. Incorporating individual training histories and external influences more comprehensively and incorporating longitudinal assessments of growth and maturation to enhance the validity and applicability of findings in youth athlete development programs. Moreover, expanding the sample size and including diverse demographic groups could enhance the generalizability of findings across different populations of young athletes.
5. Conclusions
In conclusion, this study utilized wearable sensors and statistical methods to assess the physical performance of adolescent soccer players over a competitive season. The use of euleria lab (Euleria srl, Rovereto (TN), Italy) integrated with IMU sensors provided a robust framework for objective evaluation across various physical domains critical for soccer. While no significant changes were observed between preseason and end-season assessments, the comprehensive analysis using PCA underscored the multidimensional nature of physical performance in youth players. These findings contribute to the evolving understanding of athletic development and underscore the importance of tailored training strategies to optimize youth soccer performance. Future studies should use longer follow-up periods to capture developmental changes in youth soccer players and consider individual training histories, external influences, and growth assessments. Expanding the sample size and including diverse demographic groups could improve the generalizability of the findings.
Supplementary Materials
The article contains all the data produced or analyzed during this investigation as table(s), figure(s). Any further data requirements may be directed to the authors upon a reasonable request.
Author Contributions
Conceptualization, G.V. and V.C.; methodology, G.V. and F.P..; data collection, G.V. and F.P.; data analysis and interpretation, G.V.; writing—original draft preparation, G.V.; writing—review and editing, V.C. and M.G.; supervision, V.C.; project administration, V.C. All authors have read and agreed to the published version of the manuscript.
Funding
This research received no external funding.
Institutional Review Board Statement
The study was conducted in accordance with the Declaration of Helsinki and approved by the Ethics Committee of Politecnico di Milano (protocol code 10/2023, 8th March 2023).
Informed Consent Statement
Informed consent was obtained from all subjects involved in the study.
Acknowledgments
The authors would like to acknowledge David Tacconi, Marta Galeotti, Gabriele Cera and Paolo Errico for their valuable contribution to the project. Moreover, authors would like to thank the staff and the athletes of AC Trento 1921 involved in the project.
Conflicts of Interest
The authors declare no conflict of interest.
References
- Haugaasen, M.; Jordet, G. Developing football expertise: a football-specific research review. Int. Rev. Sport Exerc. Psychol. 2012, 5, 177–201. [Google Scholar] [CrossRef]
- Raven, P.B.; Gettman, L.R.; Pollock, M.L.; Cooper, K.H. A physiological evaluation of professional soccer players. Br. J. Sports Med. 1976, 10, 209–216. [Google Scholar] [CrossRef]
- Larkin, P.; O’connor, D. Talent identification and recruitment in youth soccer: Recruiter’s perceptions of the key attributes for player recruitment. PLOS ONE 2017, 12, e0175716. [Google Scholar] [CrossRef]
- Paul, D.J.; Nassis, G.P. Physical Fitness Testing in Youth Soccer: Issues and Considerations Regarding Reliability, Validity and Sensitivity. Pediatr. Exerc. Sci. 2015, 27, 301–313. [Google Scholar] [CrossRef] [PubMed]
- Pueo, B.; Jimenez-Olmedo, J.M. Application of motion capture technology for sport performance analysis (El uso de la tecnología de captura de movimiento para el análisis del rendimiento deportivo). Retos 2017, 241–247. [Google Scholar] [CrossRef]
- Omoregie, P.O. The Impact of Technology on Sport Performance. 2016.
- Li, R.T.; Kling, S.R.; Salata, M.J.; Cupp, S.A.; Sheehan, J.; Voos, J.E. Wearable Performance Devices in Sports Medicine. Sports Heal. A Multidiscip. Approach 2015, 8, 74–78. [Google Scholar] [CrossRef] [PubMed]
- Fliess-Douer, O.; Mason, B.; Katz, L.; So, C.R. Sport and Technology. In Training and Coaching the Paralympic Athlete; John Wiley & Sons, Ltd., 2016; pp. 150–171 ISBN 978-1-119-04514-4.
- Bădescu, D.; Zaharie, N.; Stoian, I.; Bădescu, M.; Stanciu, C. A Narrative Review of the Link between Sport and Technology. Sustainability 2022, 14, 16265. [Google Scholar] [CrossRef]
- Dellaserra, C.L.; Gao, Y.; Ransdell, L. Use of Integrated Technology in Team Sports. J. Strength Cond. Res. 2014, 28, 556–573. [Google Scholar] [CrossRef] [PubMed]
- Chambers, R.; Gabbett, T.J.; Cole, M.H.; Beard, A. The Use of Wearable Microsensors to Quantify Sport-Specific Movements. Sports Med. 2015, 45, 1065–1081. [Google Scholar] [CrossRef] [PubMed]
- Hood, S.; McBain, T.; Portas, M.; Spears, I. Measurement in Sports Biomechanics. Meas. Control. 2012, 45, 182–186. [Google Scholar] [CrossRef]
- Lee, J.B.; Ohgi, Y.; James, D.A. Sensor fusion: let's enhance the performance of performance enhancement. Procedia Eng. 2012, 34, 795–800. [Google Scholar] [CrossRef]
- Jr. , J.J.A.M.; Vieira, M.E.M.; Pires, M.B.; Jr., S.L.S. Sensor Fusion and Smart Sensor in Sports and Biomedical Applications. Sensors 2016, 16, 1569. [Google Scholar] [CrossRef]
- Baca, A. Innovative diagnostic methods in elite sport. Int. J. Perform. Anal. Sport 2006, 6, 148–156. [Google Scholar] [CrossRef]
- Knight, J.F.; Bristow, H.W.; Anastopoulou, S.; Baber, C.; Schwirtz, A.; Arvanitis, T.N. Uses of accelerometer data collected from a wearable system. Pers. Ubiquitous Comput. 2006, 11, 117–132. [Google Scholar] [CrossRef]
- Camomilla, V.; Bergamini, E.; Fantozzi, S.; Vannozzi, G. Trends Supporting the In-Field Use of Wearable Inertial Sensors for Sport Performance Evaluation: A Systematic Review. Sensors 2018, 18, 873. [Google Scholar] [CrossRef] [PubMed]
- Wagner, J.F. About Motion Measurement in Sports Based on Gyroscopes and Accelerometers—an Engineering Point of View. Gyroscopy Navig. 2018, 9, 1–18. [Google Scholar] [CrossRef]
- Waldron, M.; Harding, J.; Barrett, S.; Gray, A. A New Foot-Mounted Inertial Measurement System in Soccer: Reliability and Comparison to Global Positioning Systems for Velocity Measurements During Team Sport Actions. J. Hum. Kinet. 2021, 77, 37–50. [Google Scholar] [CrossRef] [PubMed]
- Figueiredo, D.H.; Figueiredo, D.H.; Dourado, A.C.; Claudio, L.; Stanganelli, R.; Gonçalves, H.R. Evaluation of Body Composition and Its Relationship with Physical Fitness in Professional Soccer Players at the Beginning of Pre-Season Evaluación de La Composición Corporal y Su Relación Com La Aptitud Física Em Futebolistas Professionales al Inicio de La Pré-Temporada. 2021.
- Svensson, M.; Drust, B. Testing soccer players. J. Sports Sci. 2005, 23, 601–618. [Google Scholar] [CrossRef] [PubMed]
- MacDougall, J.D.; Wenger, H.A.; Green, H.J. Physiological Testing of the High-Performance Athlete. Med. Sci. Sports Exerc. 1993, 25, 305. [Google Scholar] [CrossRef]
- Weaving, D.; Beggs, C.; Dalton-Barron, N.; Jones, B.; Abt, G. Visualizing the Complexity of the Athlete-Monitoring Cycle Through Principal-Component Analysis. Int. J. Sports Physiol. Perform. 2019, 14, 1304–1310. [Google Scholar] [CrossRef] [PubMed]
- McCormack, S.; Jones, B.; Scantlebury, S.; Collins, N.; Owen, C.; Till, K. Using Principal Component Analysis to Compare the Physical Qualities Between Academy and International Youth Rugby League Players. Int. J. Sports Physiol. Perform. 2021, 16, 1880–1887. [Google Scholar] [CrossRef] [PubMed]
- Weaving, D.; Dalton, N.E.; Black, C.; Darrall-Jones, J.; Phibbs, P.J.; Gray, M.; Jones, B.; Roe, G.A. The Same Story or a Unique Novel? Within-Participant Principal-Component Analysis of Measures of Training Load in Professional Rugby Union Skills Training. Int. J. Sports Physiol. Perform. 2018, 13, 1175–1181. [Google Scholar] [CrossRef] [PubMed]
- Williams, S.; Trewartha, G.; Cross, M.J.; Kemp, S.P.T.; Stokes, K.A. Monitoring What Matters: A Systematic Process for Selecting Training-Load Measures. Int. J. Sports Physiol. Perform. 2017, 12, S2-101. [Google Scholar] [CrossRef] [PubMed]
- Till, K.; Jones, B.L.; Cobley, S.; Morley, D.; O'Hara, J.; Chapman, C.; Cooke, C.; Beggs, C.B. Identifying Talent in Youth Sport: A Novel Methodology Using Higher-Dimensional Analysis. PLOS ONE 2016, 11, e0155047. [Google Scholar] [CrossRef] [PubMed]
- Bosco, C.; Luhtanen, P.; Komi, P.V. A Simple Method for Measurement of Mechanical Power in Jumping. Eur. J. Appl. Physiol. Occup. Physiol. 1983, 50, 273–282. [Google Scholar] [CrossRef] [PubMed]
- Sayers, S.P.; Harackiewicz, D.V.; Harman, E.A.; Frykman, P.N.; Rosenstein, M.T. Cross-validation of three jump power equations. Med. Sci. Sports Exerc. 1999, 31, 572–577. [Google Scholar] [CrossRef] [PubMed]
- Hildebrandt, C.; Müller, L.; Zisch, B.; Huber, R.; Fink, C.; Raschner, C. Functional assessments for decision-making regarding return to sports following ACL reconstruction. Part I: development of a new test battery. Knee Surgery, Sports Traumatol. Arthrosc. 2015, 23, 1273–1281. [Google Scholar] [CrossRef] [PubMed]
- Kaiser, H.F. An index of factorial simplicity. Psychometrika 1974, 39, 31–36. [Google Scholar] [CrossRef]
- Hair, J.; Black, W.; Babin, B.; Anderson, R. Multivariate Data Analysis: A Global Perspective; 2010; ISBN 978-0-13-515309-3.
Figure 1.
Hurdles positioning and jump coordination path to be followed for the agility test [30].
Figure 1.
Hurdles positioning and jump coordination path to be followed for the agility test [30].
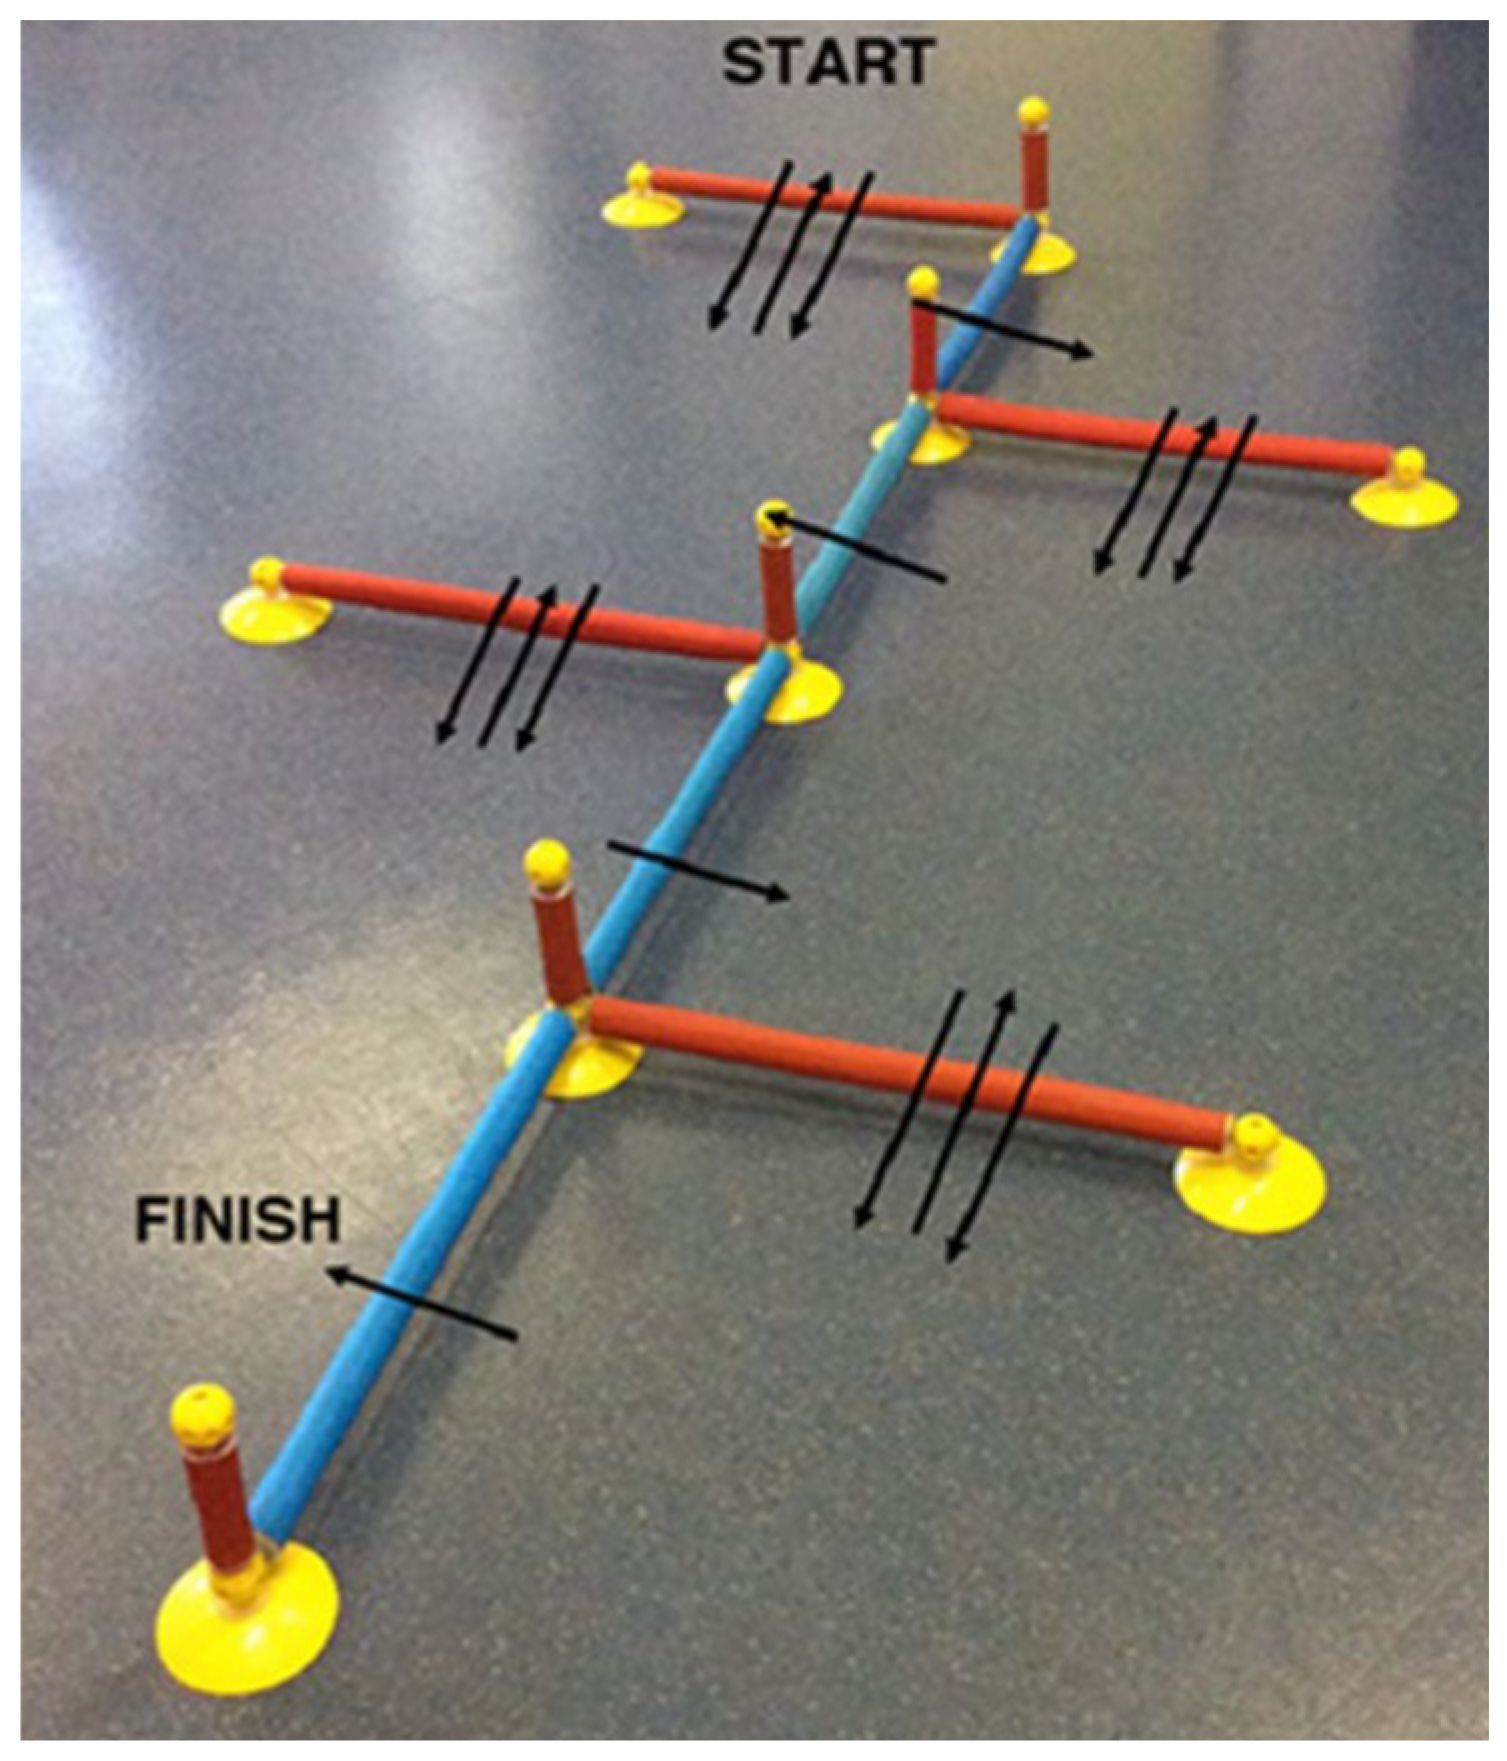
Figure 2.
Hurdles positioning to perform the QF test [30].
Figure 2.
Hurdles positioning to perform the QF test [30].
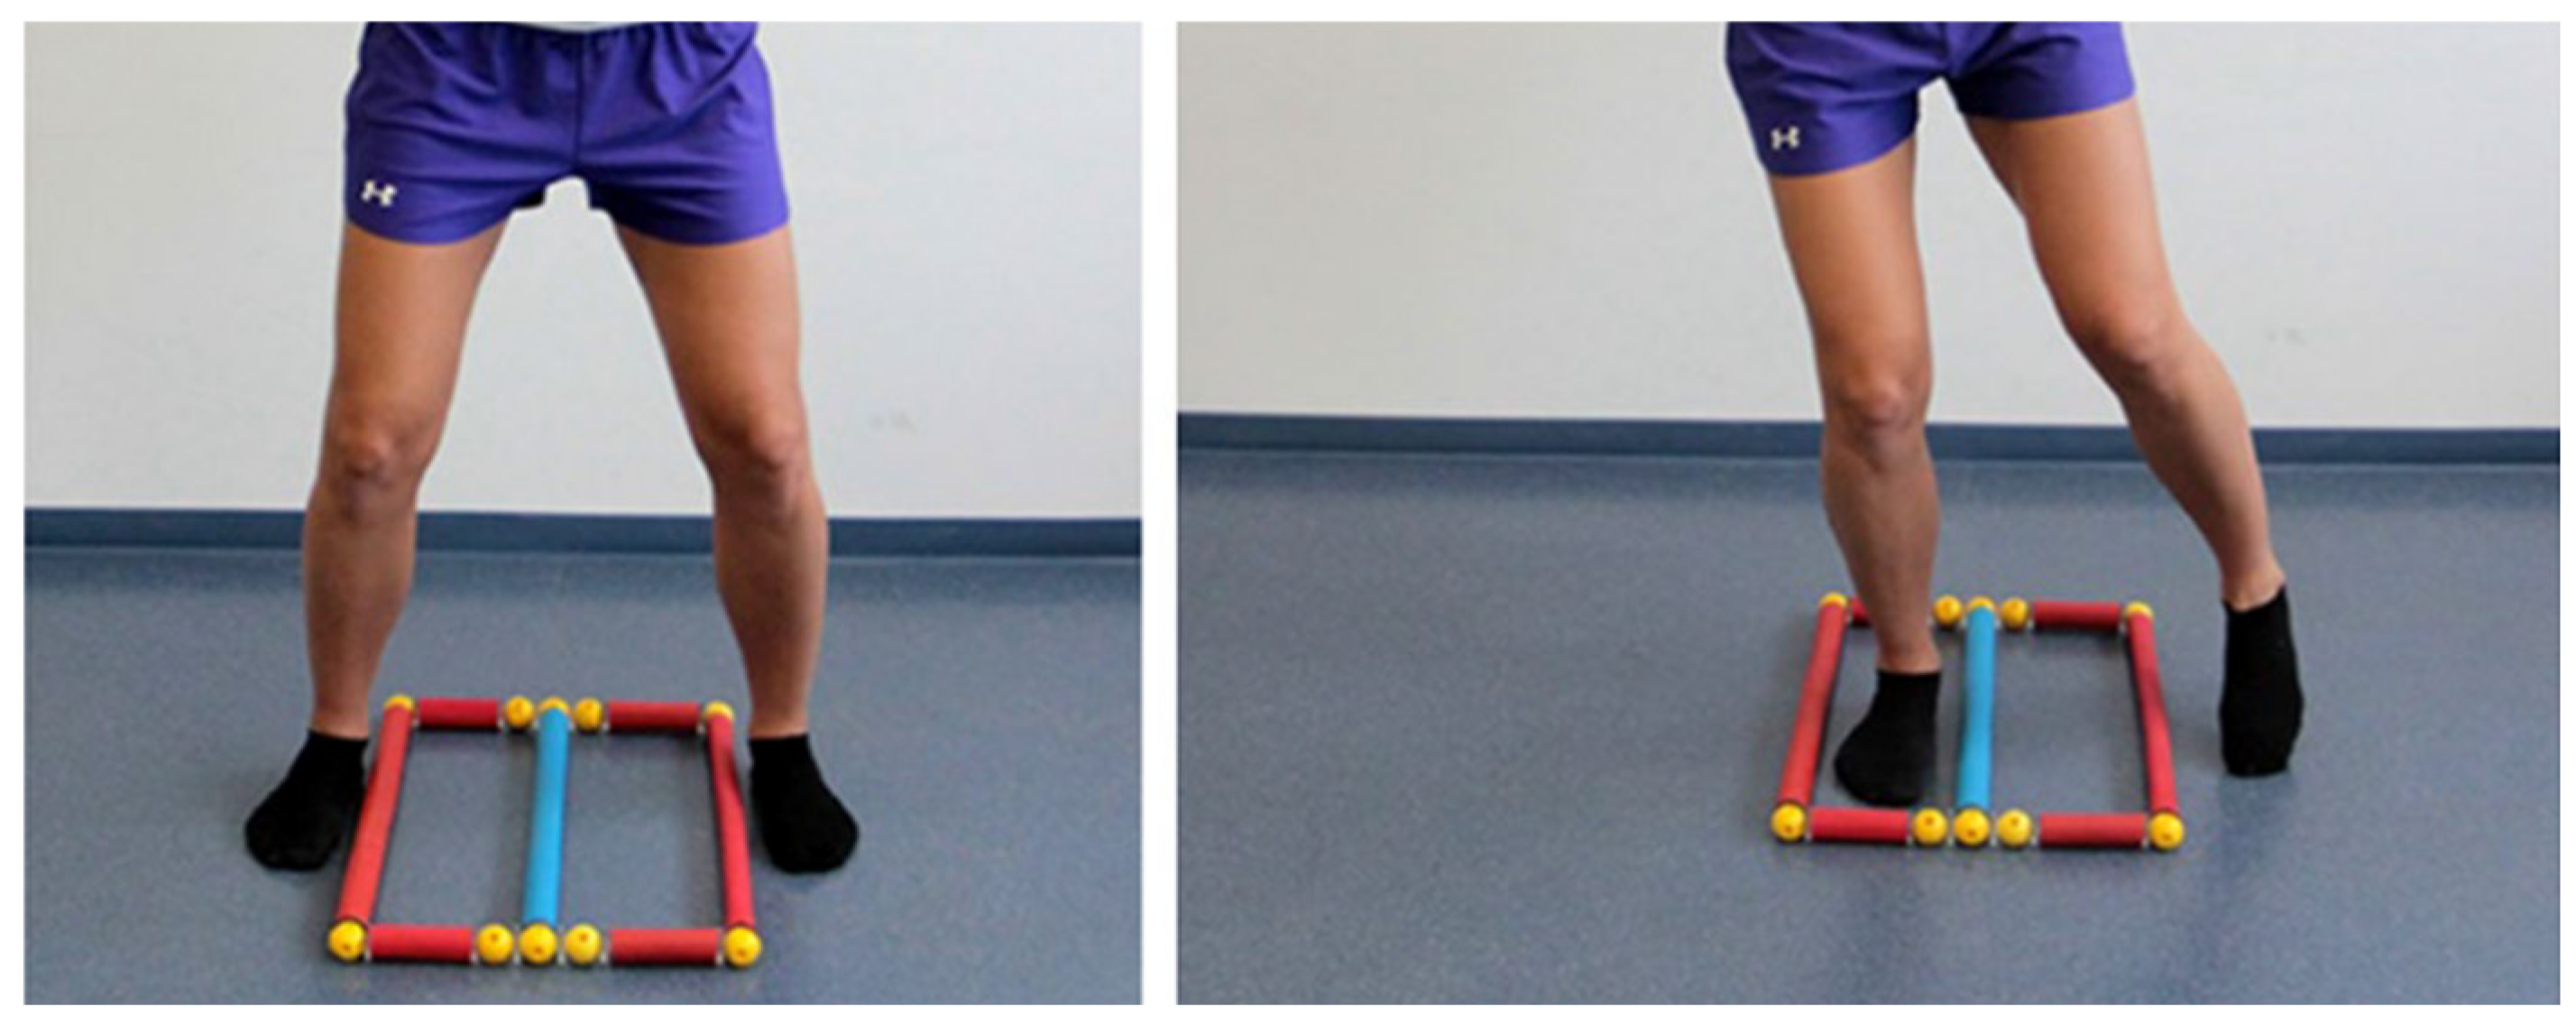
Figure 3.
Eigenvalues, Cumulative Explained Variability (in %) and Explained Variability (in %) at T0 (top) and T1 (bottom) for each PC.
Figure 3.
Eigenvalues, Cumulative Explained Variability (in %) and Explained Variability (in %) at T0 (top) and T1 (bottom) for each PC.
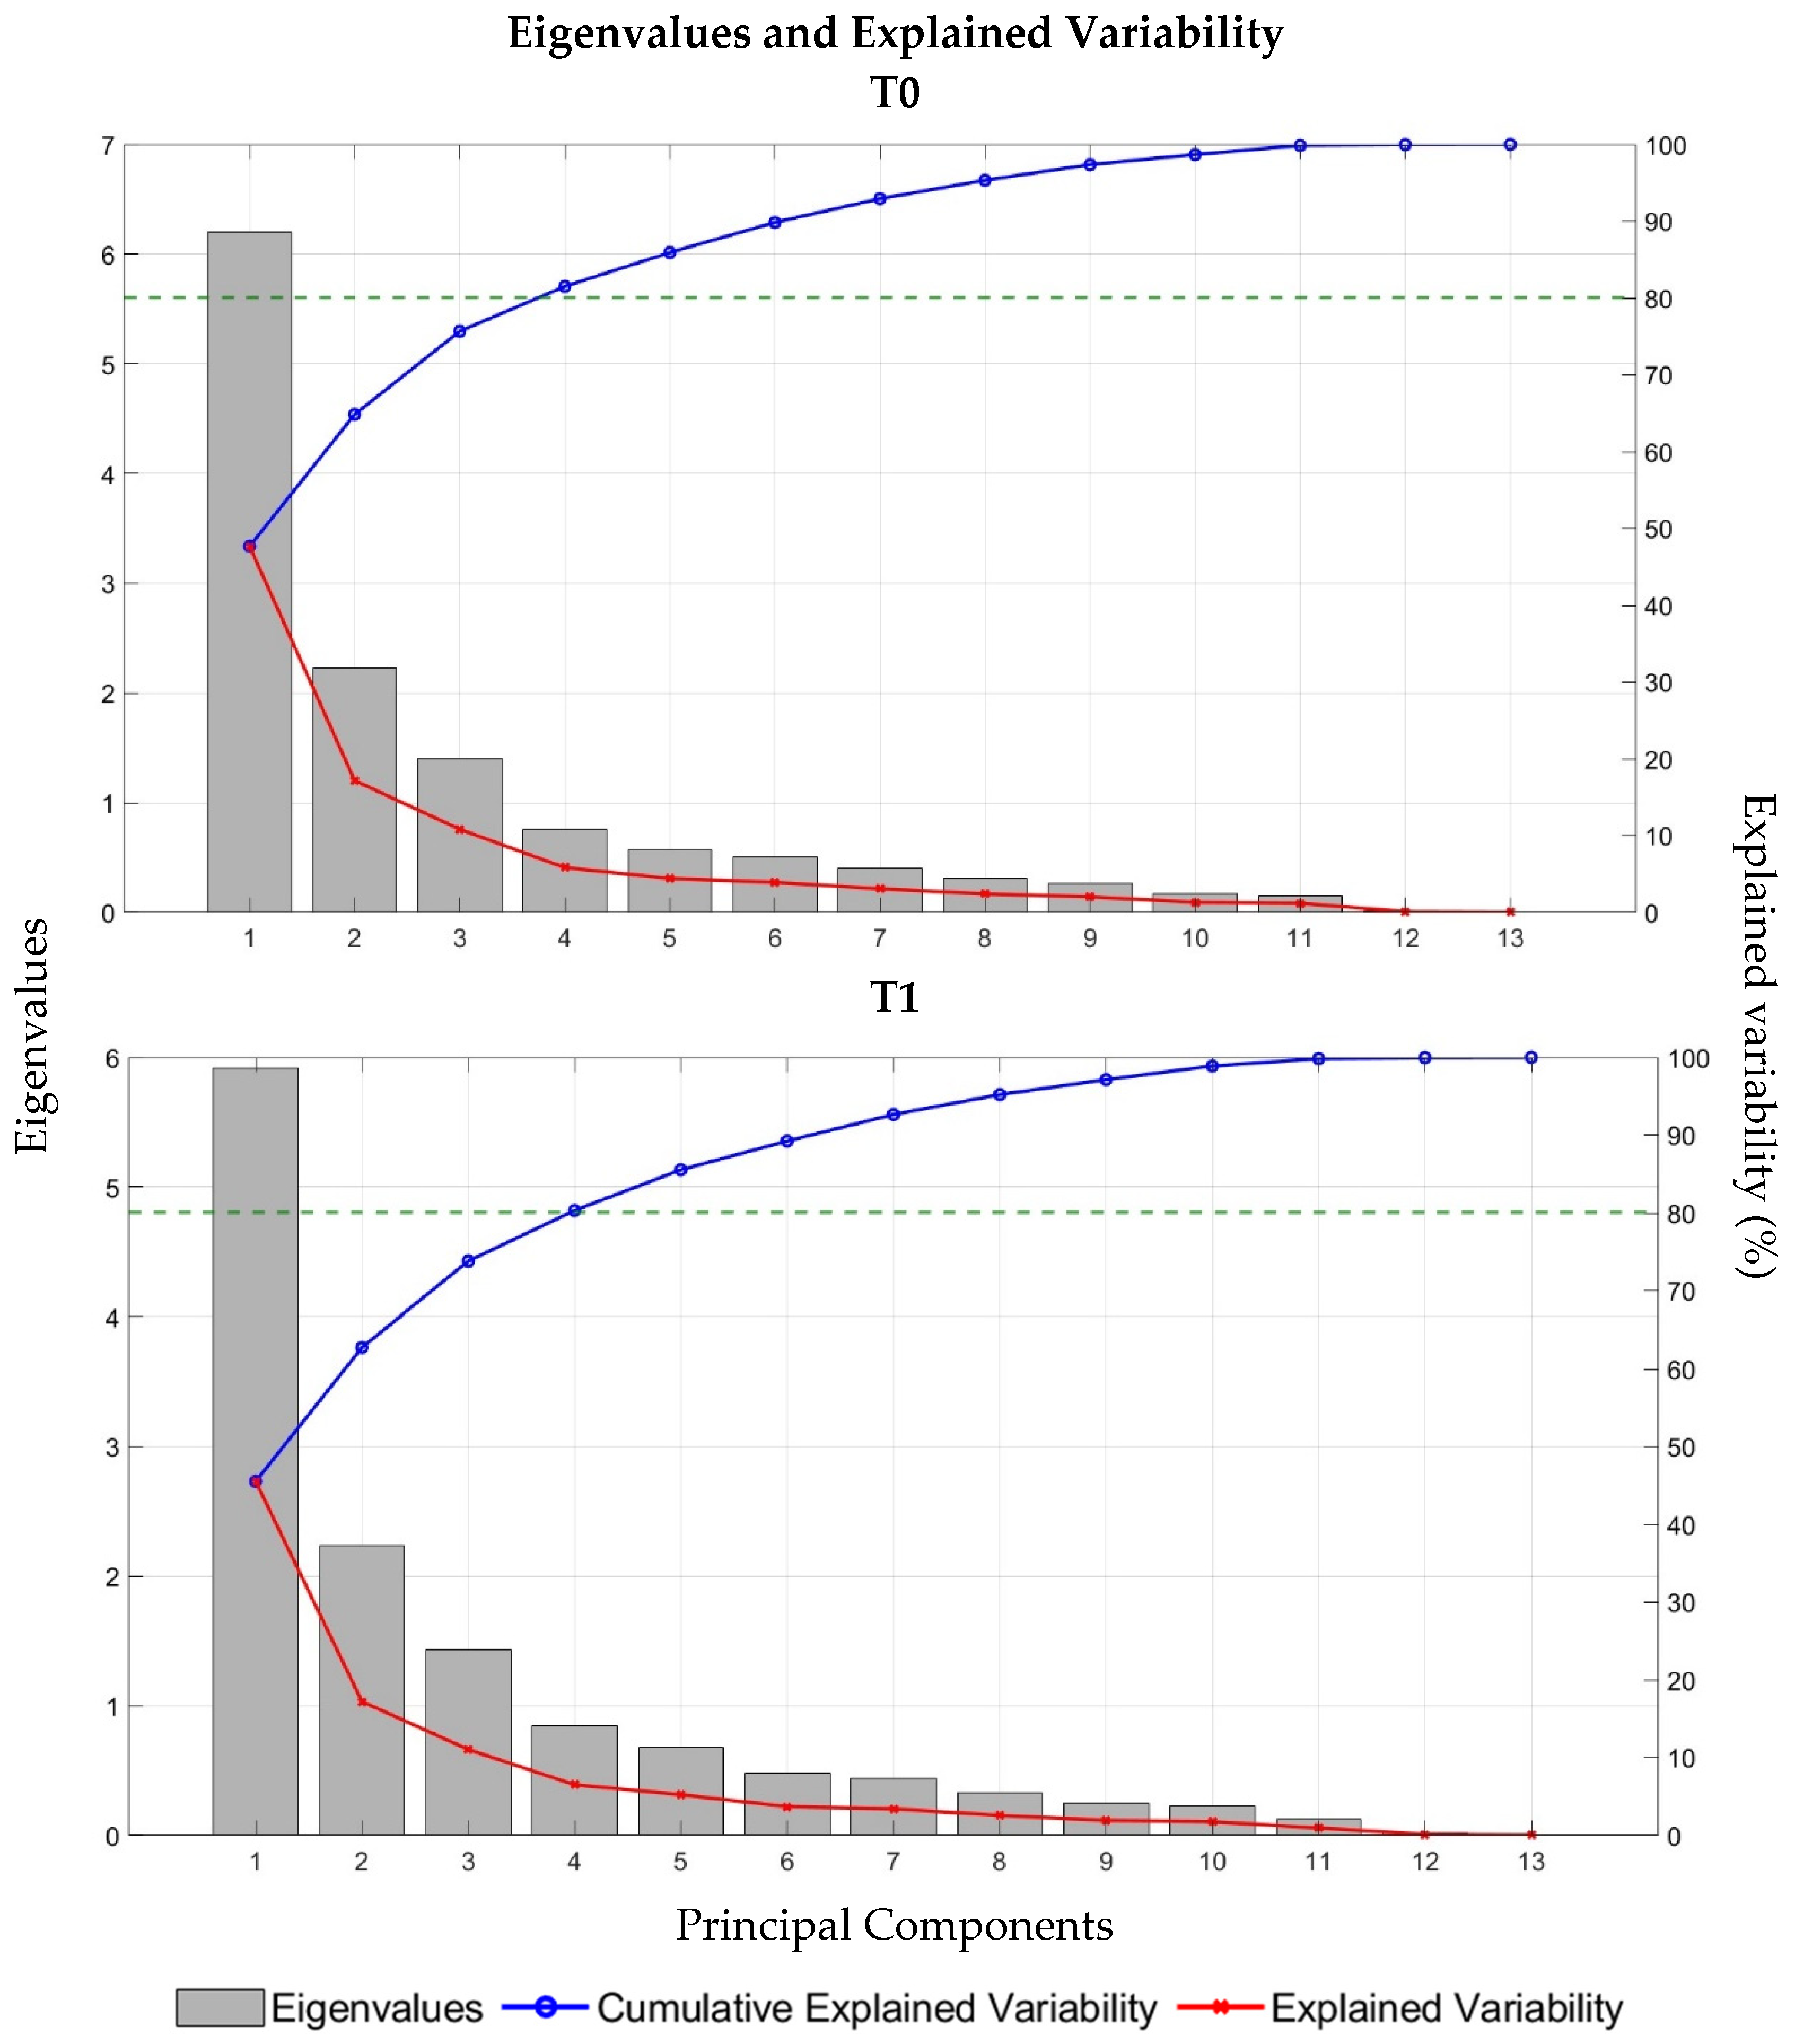

Table 1.
Descriptive statistics for each variable expressed as mean ± SD at the two time points (T0 = pre-season; T1 = end-season).
Table 1.
Descriptive statistics for each variable expressed as mean ± SD at the two time points (T0 = pre-season; T1 = end-season).
| Var | T0 | T1 |
|---|---|---|
| DL-LoS (a.u.) | 3.11 ± 0.68 | 2.76 ± 0.65 |
| R-LoS (a.u.) | 3.03 ± 0.59 | 2.72 ± 0.57 |
| L-LoS (a.u.) | 3.08 ± 0.59 | 2.81 ± 0.60 |
| DL-CMJVJH (cm) | 33.04 ± 6.05 | 35.02 ± 5.56 |
| R-CMJVJH (cm) | 18.99 ± 3.87 | 20.84 ± 4.29 |
| L-CMJVJH (cm) | 18.86 ± 4.26 | 21.28 ± 4.87 |
| DL-CMJPOW (W/kg) | 43.10 ± 7.68 | 45.68 ± 6.48 |
| R-CMJPOW (W/kg) | 26.81 ± 8.58 | 30.00 ± 7.82 |
| L-CMJPOW (W/kg) | 26.66 ± 8.92 | 30.49 ± 7.99 |
| PJVJH (cm) | 27.96 ± 8.14 | 31.03 ± 8.24 |
| PJCT (ms) | 184.23 ± 50.85 | 179.73 ± 44.58 |
| PJST (a.u.) | 1.55 ± 0.45 | 1.76 ± 0.42 |
| R-PK (s) | 6.09 ± 1.26 | 5.65 ± 0.69 |
| L-PK (s) | 6.15 ± 1.39 | 5.84 ± 0.84 |
| QF (s) | 9.00 ± 1.95 | 7.39 ± 1.23 |
Abbreviations: DL, double leg; R, right; L, left; LoS, level of stability; a.u., arbitrary units; CMJ, countermovement jump; VJH, vertical jump height; POW, power; PJ, plyometric jumps; CT, contact time; ST, stiffness; PK, parkour; QF, quick feet.
Table 2.
Component characteristics (eigenvalue, explained variability and cumulative variability) for the first four PC at the two time points, T0 and T1.
Table 2.
Component characteristics (eigenvalue, explained variability and cumulative variability) for the first four PC at the two time points, T0 and T1.
| PC | T0 | T1 | ||||
|---|---|---|---|---|---|---|
| Eigenvalue | Explained var. | Cumulative var. | Eigenvalue | Explained var. | Cumulative var. | |
| PC1 | 6.197 | 0.477 | 47.7% | 5.919 | 0.455 | 45.5% |
| PC2 | 2.232 | 0.172 | 64.8% | 2.238 | 0.172 | 62.7% |
| PC3 | 1.407 | 0.108 | 75.7% | 1.436 | 0.110 | 73.8% |
| PC4 | 0.759 | 0.058 | 81.5% | 0.847 | 0.065 | 80.3% |
Abbreviation: var., variability.
Table 3.
Component loadings of the variables to each PC at the T0 time point.
| Var | PC1 | PC2 | PC3 | PC4 |
|---|---|---|---|---|
| DL-LoS | 0.833 | |||
| R-LoS | 0.860 | |||
| L-LoS | 0.890 | |||
| DL-CMJVJH | 0.883 | |||
| R-CMJVJH | 0.839 | |||
| L-CMJVJH | 0.871 | |||
| DL-CMJPOW | 0.901 | |||
| R-CMJPOW | 0.847 | |||
| L-CMJPOW | 0.877 | |||
| PJVJH | 0.931 | |||
| R-PK | 0.880 | |||
| L-PK | 0.925 | |||
| QF | 0.640 |
Abbreviations: DL, double leg; R, right; L, left; LoS, level of stability; CMJ, countermovement jump; VJH, vertical jump height; POW, power; PJ, plyometric jumps; PK, parkour; QF, quick feet.
Table 4.
Component loadings of the variables to each PC at the T1 time point.
| Var | PC1 | PC2 | PC3 | PC4 |
|---|---|---|---|---|
| DL-LoS | 0.729 | |||
| R-LoS | 0.894 | |||
| L-LoS | 0.904 | |||
| DL-CMJVJH | 0.842 | |||
| R-CMJVJH | 0.881 | |||
| L-CMJVJH | 0.870 | |||
| DL-CMJPOW | 0.837 | |||
| R-CMJPOW | 0.872 | |||
| L-CMJPOW | 0.893 | |||
| PJVJH | 0.865 | |||
| R-PK | 0.870 | |||
| L-PK | 0.851 | |||
| QF | 0.635 |
Abbreviations: DL, double leg; R, right; L, left; LoS, level of stability; CMJ, countermovement jump; VJH, vertical jump height; POW, power; PJ, plyometric jumps; PK, parkour; QF, quick feet.
Disclaimer/Publisher’s Note: The statements, opinions and data contained in all publications are solely those of the individual author(s) and contributor(s) and not of MDPI and/or the editor(s). MDPI and/or the editor(s) disclaim responsibility for any injury to people or property resulting from any ideas, methods, instructions or products referred to in the content. |
© 2024 by the authors. Licensee MDPI, Basel, Switzerland. This article is an open access article distributed under the terms and conditions of the Creative Commons Attribution (CC BY) license (http://creativecommons.org/licenses/by/4.0/).
Copyright: This open access article is published under a Creative Commons CC BY 4.0 license, which permit the free download, distribution, and reuse, provided that the author and preprint are cited in any reuse.


