Submitted:
08 July 2024
Posted:
08 July 2024
You are already at the latest version
Abstract
The environmental aerosols in major South Asian cities were characterized using Aerosol Robotic Network datasets. Various types of aerosols were identified and classified. Industrial urban/vehicle emissions and biomass burning carbonaceous aerosols dominated during the winter, whereas dust aerosols dominated during the summer and pre-monsoon seasons, respectively. Moreover, mixed aerosol types existed throughout the year. An attempt has been made to detect carbonaceous aerosol CO2 using Zn-decorated ZnO nanocages, which can be converted into CH3OH and H2O via the use of H2 molecules. The adsorption of Zn on the nanocage of ZnO reduced the band width to 2.18 eV from 4.05 eV, with an increase in the room temperature sensitivity and a sensing response of −49.38% and −91.9%, respectively. The emergence of intermediate states near the Fermi level narrowed the bandgap. The negative electronegativity and electron affinity suggest the polar nature, high reactivity, and softness of the Zn-decorated ZnO CO2 complexes. Furthermore, a minimal recovery time of 2.249 × 10⁻¹¹ s was noticed at room temperature, highlighting the remarkable catalytic efficiency of the ZnO-Zn/CO2 system compared with that of previously published Ag-decorated ZnO nanocages. An increase in temperature has minimal effects on the sensing response, while the recovery time decreased notably. This research was conducted within the context of density functional theory.
Keywords:
ZnO Nano Catalyst
; CO2 Conversion
; Sensing
1. Introduction
The negative impacts of environmental aerosols on living organisms and on disrupting seasonal variations and rainfall have gained increasing attention in South Asia [1]. Atmospheric aerosols are generated and emitted through natural and anthropogenic events, such as soil erosion, combustion, agricultural processes (nitrogenous emissions, tillage operations, fertilizers, and pesticides), construction, urbanization, transportation, biomass burning, and industrialization [2]. Among these, the rapid growth of industry, urbanization, and vehicle transportation significantly increases the emission of environmental aerosols, which has a negative impact on living organisms [3]. As environmental aerosols emerge from different sources, they possess different shapes, sizes, and elemental compositions; therefore, their classification includes dust, biomass burning, urban/industrial, and mixed aerosols. These particles can be classified based on their size; sources of generation and transportation; and impacts on the climate [4]. Dust- and carbon-containing environmental aerosols absorb shorter wavelength radiation [4,5], affecting the global climate [6]. Higher concentrations of atmospheric aerosols contribute to cloud strength and prolong the life of clouds [7]. These environmental aerosol particles are generated directly from different sources and enter the atmosphere owing to incomplete combustion. Consequently, fossil fuels, such as COX, SOX, NOX, and hydrocarbons[8]., remain in the Earth’s atmosphere in various forms
Climate change occurs because of rising CO2 levels [9]. Since the 1950s, the amount of CO2 produced has doubled to 445 ppm by 2021 [10]. Excess CO2 concentrations of more than 40,000 ppm can lead to respiratory infections, pulmonary disorders, cardiac conditions, and lung cancer [11]. In 2022, anthropogenic activities were responsible for approximately 33.8 billion tons of annual CO2 emissions [12]. The conversion of carbonaceous aerosols, such as CO2, into valuable chemical stocks provides a solution to minimize their negative impact. Over the past two decades, scientists have begun developing heterogeneous catalysts for the conversion of CO2 to methanol as a byproduct. Fuels and chemicals can be produced using methanol as feedstock [13].
ZnO, an n-type metal oxide, has a hexagonal structure (a = b = 3.250 Å and c = 5.206 Å) with a bandwidth of 3.37 eV and a large surface area, thereby garnering the attention of researchers for its application in catalysis and gas sensors [14,15]. They can be synthesized in various forms, including nanowires, nanotubes, nanoribbons, and nanoparticles. The concept of nanocages based on a buckyball (C60) [16] has opened a new era of round-structured semiconductors.
As the climatic effects of each environmental type of aerosol differ from one another [17,18], it is necessary to classify and understand their impacts on the climate. Various clustering algorithms have been used for aerosol-type detection and measurement [17,19]. Numerous studies have explored aerosol optical depth (AOD) and the Angstrom exponent (AE) clustering technique [20].
Globally, limited research has been conducted on clustering techniques in South Asia [17,21]. Russell et al. utilized the extinction Angstrom exponent and adversarial autoencoder clustering methods to distinguish different aerosol types. Tiwari et al. classified major aerosols using the AOD versus AE clustering technique over the Indo-Gangetic Plain (IGP) in different seasons [53]. The characterization of environmental aerosols over the South Asian region and the sensing and conversion of secondary aerosols, i.e., CO2 gas, into beneficial byproducts are still limited.
For the first time, we conducted a comprehensive study on the characterization of environmental aerosol types using the cluster technique and retrieved Aerosol Robotic Network (AERONET) datasets for the period 2006–2014 from the most polluted selected cities in South Asia, namely, Karachi and Lahore (Pakistan), Jaipur and Kanpur (India), Dhaka (Bangladesh), and Kathmandu (Nepal). The classification was conducted by examining various aerosol properties, such as AOD and AE, to determine the dominant aerosol types. Additionally, a density functional theory (DFT)-based approach was adopted for the sensing and conversion of secondary aerosol CO2 to methanol using ZnO–Zn-decorated nanocages. The nanocage was designed with the formula (XY)n, where n = 12, X = metallic element, and Y = nonmetallic elements [22]. The (XY)12 nanocage forms an octahedron with eight hexagonal and six tetragonal faces [23]. ZnO nanocages are widely used in solar cells, optical sensitizers, sensors, photocatalysts, quantum devices, hydrogen storage, and biomedical nanomaterials because of their semiconductive, piezoelectric, and pyroelectric properties [24]. The low toxicity, high thermal stability, excellent chemical stability, biocompatibility, large specific surface area, high electron mobility, and excellent electrical characteristics of these materials render them superior [25]. In its pristine form, ZnO nanocages interact poorly with numerous gases, limiting their effectiveness as sensors [26]. Several modifications, including chemical functionalization, defect formation, and impurity addition, have been employed to address this problem. Among these techniques, surface decoration is widely used to increase metal oxide sensitivity [27,28]. In particular, surface decoration with noble metals decreases the resistance of pure nanomaterials while improving their sensing, catalytic, and optoelectronic properties. Furthermore, transition metals decoration increases free electron concentration, resulting strong hybridization with gas species, ultimately boosting the conductivity and gas adsorption capacity of the nanomaterial [29]. The wide range of radiation absorption [30] and large surface-to-volume ratio [31] of ZnO nanomaterials highlight their ability to perform environmental remediation, thereby serving as excellent substrates for pollutant elimination [32].
2. Instrumentation and Methodology
2.1. Study Area
South Asia (25.0°N, 76.4°E) covers the countries of Pakistan, Afghanistan, India, Bhutan, Nepal, the Maldives, Sri Lanka, and Bangladesh from east to west with ground-based AERONET stations. South Asia covers approximately 5.1 million km with 1.749 billion inhabitants [33]. The myriad of environmental aerosols in this region not only influences South Asia but also affects the global environment. Therefore, the sources and types of environmental aerosols should be traced [34].
Karachi (24.8°N, 67.0°E) is a populous Pakistani city situated 8 m above sea level with an arid and semiarid climate, dry/warm winters, and hot/humid summers [4]. Lahore (31.5°N, 74.3°E) is Pakistan’s second largest commercial zone at 210 m above sea level and has a semiarid climate characterized by hot summers, cool winters, and intense fog in January [4], covering an area of 404 km2. Jaipur (26.9°N, 75.8°E) is a semiarid Indian city that is situated 431 m above sea level and experiences hot summers, pleasant winters, and heavy monsoon rains [4]. Kanpur (26.5°N, 80.3°E) is a densely populated city in the middle of the IGP 142 m above sea level that experiences scorching long summers, winters with severe fog, and dust storms before the monsoon. In this region, aerosols are generated mostly by both natural and anthropogenic operations with significant seasonal fluctuations [35]. Kathmandu (27.7°N, 85.3°E) is Nepal’s capital and is nestled in the Himalayas. Its height is 1100–2700 m above sea level and experiences mildly cold nights, a winter temperature of approximately 10°C, and a summer temperature of 28–30°C. It has an approximate population of 1.6 million people within its area of 685 km2 [36]. Dhaka (23.8°N, 90.4°E), the capital of Bangladesh, has a population of more than 9 million people. It is a major transportation center that features high environmental aerosol emissions from natural and unnatural sources and is surrounded by four rivers covering an area of 305 km2. It experiences a tropical climate with four distinct seasons [37]. Figure 1 demonstrates study area map.
2.2. Instrumentation
AERONET is a remote-sensing device that operates on the ground and provides information on aerosol parameters at wavelengths of 340, 380, 440, 500, 670, 870, 940, and 1020 nm [38]. For longer (440 nm) and shorter wavelengths, the AERONET AODs have uncertainties on the order of ± 0.01 and ± 0.02, respectively [39]. The measurement errors were approximately 10% and 35%–100% for small and large particles, respectively [39]. Globally, 400 AERONET points have been installed. Its data exist in three formats: Level 1 for unscreened data, Level 1.5 for cloud-screened data [40], and Level 2.0 for precise data [39]. The data are published at www.aeronet.gsfc.nasa.gov]; both direct and indirect inversion products are freely accessible.
In this study, we retrieved Level 2.0 AOD and AE data parameters from direct versions for the period 2006–2014 to characterize the various types of environmental aerosols over selected cities in South Asia.
2.3. Computational Techniques and Description
DFT studies of the Zn-decorated ZnO nanocage were conducted using the HYBRID DFT + U technique within the Spanish initiative electronic simulations with thousands of atoms (SIESTA) [41,42]. Initially, a ZnO nanocage with 12 atoms per element was modeled and optimized using a 3 × 3 × 1 k-point grid. Similarly, cutoff energy of 200 Ry and a 6 × 6 × 6 k-point grid were employed for optoelectronic properties calculation [43]. In the conjugate gradient approximation method, an atomic force and self-consistency field of 10−-6 eV and 0.002 eV/Å, respectively, were utilized to achieve tight convergence. The bandgap energy is underestimated by the generalized gradient approximation (GGA) [44] and overestimated by the errors in local density (LDA), whereas HYBRID DFT misinterprets the Coulombic interaction in the d orbital in addition to the higher energy states applied to transition metals [45]. For the transition metals, a HYBRID DFT (75% GGA and 25% LDA) with a Hubbard parameter (U = 11) [46] was employed to accurately calculate the properties. All the geometries were optimized using GGA with exchange correlation by the authors, specifically the revised Perdew Burke Ernzehof [47]. For each atom of the ZnO nanocage, double zeta potential and pseudoatomic orbital basis set were utilized [41].
3. Results and Discussion
This study aimed to characterize aerosols types over selected cities in South Asia from 2006–2014 using their properties retrieved from AERONET based on an advanced clustering technique. Aerosol properties, such as AOD and AE, can be clustered to classify aerosols. Additionally, this study focused on the sensing and catalytic hydrogenation of carbonaceous aerosols, such as CO2 gas activated into methanol and H2O molecules, on the decorated surface of a ZnO–Zn nanocage and investigated the impact of these aerosols on the optoelectronic properties of the nanocluster.
3.1. Clustering Analysis
It is a tool used to categorize environmental aerosols into several classes/types to extract various aerosol properties using both direct and indirect AERONET data [19]. Environmental aerosols were classified by analyzing the scatter plots of AOD and AE [18]. In Jaipur, five major aerosols, namely, desert dust, biomass burning, maritime, and mixed aerosol types, were characterized by AOD versus AE clustering analysis based on the AERONET data [48].
3.1.1. AOD and AE
The AOD measures the amount of light absorption depending on the size, shape, and expansion of the aerosol concentration. Moreover, AE indicates the aerosol size [49]. The analysis of the variations in the relationship between AOD and AE provides a potential approach for categorizing and evaluating the impact of different factors on particulate and seasonal aerosol concentrations [50]. Figure 2(i–vi) shows the daily mean scatter plots drawn between AOD at a wavelength of 550 nm and AE at wavelengths of 440–870 nm over the selected cities in South Asia during the period of 2006–2014. The AOD and AE threshold values are in the range of 0.8–2.9 and 0.01–0.6, respectively, representing higher concentrations of coarse aerosol particles, that is, major dust (MD), with higher AODs and lower AE values. Industrial urban (IU)/vehicle emission (VE) and biomass burning (BB) were marked for each site in the range of 0.3–0.9 and 1.0–2.9, respectively. Compared with those at the other sites, Dhaka and Kathmandu had lower MD concentrations throughout the study period, whereas Karachi had an extremely low BB concentration. Lahore has higher AOD values and lower AE values, corresponding to the existence of MD (coarse-mode) aerosols that mostly originate from the desert areas of the IGP in the summer and before the monsoon. In addition, higher concentrations of IU/VE and BB were detected throughout the selected cities in South Asia during the winter and postmonsoon seasons. The remaining scattered and encircled points associated with a wide range of aerosols (AOD vs. AE) throughout all the seasons were classified as a mixture of these aerosols, resulting from natural and unnatural sources [51].

Table 1.
Threshold values for the aerosol classification using cluster methodology based on several studies.
Table 1.
Threshold values for the aerosol classification using cluster methodology based on several studies.
| Location | AOD | AE | Aerosol Type | References |
|---|---|---|---|---|
| South Asia | 0.8 – 2.9 | 0.01 – 0.6 | Major Dust (MD) | current study |
| 0.3 – 0.9 | 0.9 – 1.4 | Industrial Urban (IU)/VE | ||
| 0.9 – 2.9 | 1 – 1.4 | Biomass Burning (BB) | ||
| Nanjing | < 0.2 | 1.0 > | Clean continental | Kumar et al. (2018) [52] |
| < 0.2 | < 0.6 | Marine | Kumar et al. (2018) [52] | |
| > 0.3 | 1.0 > | Biomass Burning/Urban Industrial | Kumar et al. (2018) [52] | |
| 0.5 > | < 0.7 | Desert Dust | Kumar et al. (2018) [52] | |
| Varanasi | 0.7 >刘0.3 – 0.7刘0.3 – 1.0刘1.0 > | < 0.6刘< 0.9刘0.9 >刘1.0 > | Mostly Dust (MD)刘Polluted continental (PC)刘Anthropogenic Aerosol刘Biomass Burning (BB) | Tiwari et al. (2015) [53]. |
3.2. Geometrical Study of Pristine and Zn-Decorated ZnO Nanocages
A ZnO (ZnO)12 nanocage composed of 24 atoms was arranged in a tight octahedron composed of six tetragons and eight hexagons. The nanocage has two distinct bond lengths, consistent with the experimental values for ZnO nanocage bonds; that is, a bond length of 1.901 Å among two hexagon rings and a bond length of 1.972 Å are shared between a tetragon and hexagon ring [54]. The ZnO nanocage four- and six-membered rings exhibit angle variation from 90.907° to 87.043° and from 126.043° to 107.847°, respectively. The Zn atom was placed 2.8 Å above the center of the tetragonal ring. After optimization, the distance was decreased to 2.553 and 2.490 Å, as shown in Figure 3b. The ZnO–Zn nanocage exhibited a physiosorbed nature, indicating that it was the most stable configuration, as shown in Figure 3b. Previous studies reveal [55], an adsorption energy () of ~ −0.85 eV for Zn–ZnO nanocage, suggesting an exothermic process [27]. The high instability in the highest occupied molecular orbital (HOMO) region of the ZnO nanocage significantly lowers the bandgap of the pristine ZnO nanocage to 2.18 eV from 4.05 eV with Zn adsorption, as depicted in Table 2.
CO2 a stable molecule with strong C=O bonds and an energy of 7.8 eV, renders its reduction more difficult than that with C–C and CO bonds, with energies of 3.48 and 3.38 eV, respectively. During photocatalytic reduction, high energy is required to break the C=O bond. In this study, CO2 was efficiently activated using Zn as the nanocatalyst, resulting in the conversion of CO2 to methanol. Initially, CO2 was placed 2.915 Å above the ZnO–Zn surface, which decreased to 2.616 Å after optimization, indicating the physisorption of CO2, as shown in Figure 3c. The angle varies in the range of 180°–175.52°. The binding energy of CO2 with the Zn-decorated ZnO nanocage confirms CO2 activation. Subsequently, activated CO2 was surrounded by 3H2 molecules to observe their interactions. The 3H2 molecules interact with activated CO2 and produce CH3OH and H2O from the catalyst (ZnO–Zn) through the chemical reaction [CO2 + 6e− + 6H+ → CH3OH + H2O], as illustrated in Figure 3d. The negative of −0.85 eV confirms the thermodynamic favorability of the process [56]. The computed of −2.22 eV suggested that the desorption energy of the resulting CH3OH + H2O from the ZnO–Zn surface was more negative than that in previously published results [56]. Thus, an exothermic reaction process occurred due to ZnO nanocage catalytic activity which produce methanol and water molecules.
Figure 4a,b show the iterations versus the energy and cell volume of the optimized pristine and Zn-decorated ZnO nanocages. During the optimization of the entire reaction, the cell volume and free energy vary until a stable state configuration is achieved. As such, the system aims to reduce its free energy and attain a stable position [57]. The introduction of additional reactants enhanced the highly negative [56,58] value of the free energy, implying that activated CO2 gas reacted with 3H2 gas molecules and ultimately separated from the surface of the ZnO–Zn nanocage after the formation of CH3OH and H2O molecules with a desorption energy of −2.22 eV, as indicated by the decrease in the cell volume (Figure 4c,d).
3.3. Adsorption Energies for CO2 Gas and Complex on the ZnO–Zn Nanocage
The adsorption energies for the entire chemical pathway of the Zn-decorated ZnO nanocage, CO2 adsorption, and 3H2 gas interaction with activated CO2 were calculated using the following equation [59]:
where indicates the total energy of the whole complex. CO2 adsorption is catalyzed by ZnO–Zn, and a negative indicates an exothermic process [60]. The adsorption energies for all the configurations were calculated; the results are tabulated in Table 2. A more negative adsorption energy indicates greater structural stability [61].
3.4. Molecular-Level Analysis of Orbitals
The energy difference is determined by , as expressed in Equation 2 [62], which indicates the kinetic stability and chemical reactivity of the system.
where and represent the lowest unoccupied molecular orbital (LUMO) and (HOMO), respectively. Molecules with a lower have higher polarizability and degree of chemical reactivity and lower kinetic stability [63].
The values for all the reactive species are depicted in Figure 6a–d. An of 4.05 eV for pristine ZnO is shown in Figure 6a: consistent with the literature [64]. The bandgap of the pristine ZnO nanocage was not significantly affected by CO2 adsorption, resulting in its low response for CO2 sensing. Initially, CO2 is placed 2.65 Å above the pristine ZnO nanocage. The distance and bandgap increase, indicating the inertness of the ZnO nanocage toward CO2 detection, as portrayed in Figure 5a–c and Table 2.
Zn adsorption on the pristine (ZnO)12 nanocage decreases to 2.18 eV, suggesting improved conductivity. Moreover, shifts in the E(HOMO) and E(LUMO) levels are observed. The effect of 3H2 molecules on the electronic properties was examined. Furthermore, decreases to 1.87 eV owing to the formation of intermediate states near the Fermi level, as depicted in Figure 6d.
Figure 7 presents the PDOS for all the compositions. The conduction band of pristine ZnO is mainly composed of O-2p and Zn-3d states, whereas the valence band is concentrated within Zn-4 s and O-2p orbitals. Zn incorporation in pristine ZnO strengthens the contribution of the Zn-4 s and O-2p states to the valance and conduction bands near the Fermi level, as depicted in Figure 7b. The HOMO energy ultimately improves the optical characteristics of the nanomaterial and accelerates the transfer of electrons between the valence and conduction bands [65].
Figure 7c shows the PDOS for the ZnO–Zn/CO2 complex, where new intermediate energy levels are formed between the LUMO and HOMO of ZnO–Zn owing to the addition of O-2p and O-2 s energy levels. Moreover, the addition of 3H2 molecules to the preadsorbed CO2 gas complex eliminates the O–O bond and promotes the synthesis of CH3OH and H2O by overlapping the O-2 s, H-1 s, and C-2 s energy levels. The binding energies of the resulting products demonstrated that the reaction was promoted at room temperature. Consequently, the ZnO–Zn nanocage has the potential to directly transform CO2 gas into electrical signals, highlighting its potential application in CO2 sensors [66].
3.5. ZnO–Zn Nanocage Sensitivity
The sensitivity, as expressed in Equation 3, is the difference between the initial measured in the clean cluster (A) and after the adsorption of CO2 on the ZnO–Zn surface () [67].
An extremely low sensitivity of 1.98% toward CO2 is observed for pristine ZnO, which considerably increased to 49.38% after Zn decoration, as tabulated in Table 2.
3.6. Conductivity of the ZnO–Zn Nanocage
The conductivity changes with the variations in [68]. The pristine ZnO nanocage has low conductivity, which increases with the surface decoration of the ZnO nanocage with Zn. Equation 4 expresses the electrical conductivity in terms of [69].
where A is a constant (electrons/), K is the Boltzmann constant, and σ is the conductivity. Han et al. experimentally explored the trend in the sensing response, conductivity, and recovery time of a nanocage toward CO2, which was very low in the absence of a transition metal [70].
The sensing response was calculated using Equation 5:
where , , and represent the sensing response as a percentage, the conductivity of the pristine ZnO nanocage, and the conductivity of the CO2 gas adsorbed on the ZnO nanocage, respectively. The surface decoration of ZnO with Zn significantly enhances the sensing response at various temperatures, as shown in Table 3.
3.7. Recovery Time
The recovery time refers to the time taken to return to the baseline value and can be calculated using the following equation [55]:
where , , and represent the attempt frequency, temperature, and Boltzmann constant, respectively (≃ 8.61 × 10⁻⁵ eV). Table 3 presents the calculated recovery times for CO2 sensing on the ZnO–Zn nanocage at the selected temperatures. At the optimal room temperature, ZnO–Zn has a high sensing response of -91.9% with a swift recovery time of 2.249 × 10⁻¹¹ s. The Zn-decorated nanocage exhibited an improved sensing response and recovery time compared with those of the Ag-decorated ZnO nanocage, which exhibited efficient catalytic performance, as published previously [71]. Kumar et al. reported the maximum response for a metal-decorated ZnO nanocage at 323 K [55,72]. The recovery time decreases at temperatures above the normal temperature.
3.8. Optical Property Calculations of the Zn-Decorated ZnO Nanocage
Figure 8 shows the optical absorption spectra of all the complexes. The ZnO nanocage exhibits absorption onset at 4.05 eV in the UV range, which agrees with the experimental findings [73]. After Zn decoration, the optical spectrum absorption improved owing to bandgap engineering. When CO2 and H2 gas molecules interact with the decorated ZnO nanocage, the absorption in the electromagnetic spectrum is further enhanced, as shown in Figure 8. Unusually, CO2 complexes absorb high amounts of CO2 because of their dipole motion, as they absorb infrared waves from the Earth’s surface, resulting in a greenhouse effect [74,75].
The optical conductivity, as shown in Figure 9, is in accordance with previously reported absorption spectra and experimental data [76], in which CO2 complexes have excellent optical conductivity from the visible to the ultraviolet region (4.50–1.63 eV) of the solar spectrum. C has the potential to direct photoexcited electrons on the catalyst surface, separate photoelectrons and holes, and decrease the rate of electron–hole pair recombination, thereby enhancing the overall conductivity [77]. Under visible-light irradiation, the ZnO–Zn nanocage exhibited greater photocatalytic absorption and optical conductivity than did the pristine ZnO nanocage.
3.9. Quantum-Molecular Explanation
The quantum chemical characteristics of the pristine and other complexes shown in Table 4 provide insights into the chemical reactivity of the gas molecules [78]. The formulae used in calculating the electronegativity, chemical potential, ionization energy, electron affinity, chemical hardness and softness, electrophilicity index, and charge transfer between the substrate and adsorbate were adopted from previous work [79].
The Zn-decorated ZnO nanocage functions as an electron donor to CO2, as confirmed by the negative values of ΔN in Table 4 [80]. The lower ionization energy of the decorated ZnO/CO2 confirms that more energy is needed for the complex to become a cation than for pristine ZnO/CO2. The CO2 complex has a high negative electron affinity [81], indicating its highly reactive and energy-releasing nature. Furthermore, the high electron affinity of these materials suggested that they had an electrophilic structure that produced stable negative ions. The polar characteristics of the obtained product, as shown by the negative electronegativity values, suggest higher softness and lower hardness and electrophilicity indices [78], as tabulated in Table 4. A decrease in the hardness lowers the resistance of the species to the loss of electrons owing to a narrow bandgap. Moreover, the reduced electrophilic index after CO2 adsorption diminishes the charge transfer from the decorated surface, thereby forming methanol and H2O upon interaction with 3H2 molecules.
4. Conclusion
AERONET datasets were utilized to characterize aerosols in major South Asian cities by identifying MD particles in the summer and pre-monsoon seasons, IU/VE and BB particles in the winter and post-monsoon seasons, and a mixture of these particles throughout the year via AOD and AE clustering. Moreover, the structural, adsorption, and optoelectronic properties of the Zn-decorated ZnO nanocage used for sensing carbonaceous aerosols, particularly CO2 in the presence of 3H2 molecules, were investigated using DFT. CO2 activation tuned the optoelectronic properties of the Zn-decorated ZnO and produced methanol and water. Besides, the more negative values of the adsorption energies (−0.85 and −0.14 eV) and desorption energy of −2.22 eV quickly increased the nanocluster sensitivity from 1.98% to 49.38%. At ambient temperature (300 K), the nanocage displayed a robust sensing response of 91.9% with a short recovery time of 2.249 × 10⁻¹¹ s for CO2 detection, significantly surpassing that of Ag-decorated ZnO nanocages. Moreover, high temperatures had a minimal effect on the sensing response but considerably increased the recovery time before detection. The negative electronegativity values suggested the polar nature of the nanocage with increased softness and decreased hardness, whereas a higher negative electron affinity increased the reactivity and energy in the CO2 complex. Therefore, this study offers a groundbreaking approach for CO2 activation and conversion into crucial products using ZnO-based nanocatalyst.
Author Contributions
Shabeer Ahmad Mian, Sheraz Ahmad and Akbar Hussain, modeled the geometry to execute the project and performed a simulation study to obtain all possible data for this study. Sheraz Ahmad, Akbar Hussain, and Shabeer Ahmad Mian analyzed the data, drew the figures, and wrote the manuscript. Sheraz Ahmad, Akbar Hussain and Shabeer Ahmad Mian revised the data and added different temperature-sensing responses and recovery times to the manuscript. Professor Dr. Gul Rahman, Ejaz Ahmed, Muhammad Saleem Khan and Professor Dr. Joonkyung Jang assisted with grammatical correction, research theme, and revision and finalization of the manuscript for its submission to journal.
Data Availability Statement
All the available data in which most of it is presented in the tables, simulation and environmental data for this work will be provided upon request.
Conflicts of Interest
The authors declare no competing financial interests but acknowledge competing non-financial interests.
References
- Bibi, H.; Alam, K.; Blaschke, T.; Bibi, S.; Iqbal, M.J. Long-term (2007–2013) analysis of aerosol optical properties over four locations in the Indo-Gangetic plains. Applied optics 2016, 55, 6199–6211. [Google Scholar] [CrossRef]
- Bibi, H.; Alam, K.; Chishtie, F.; Bibi, S.; Shahid, I.; Blaschke, T. Intercomparison of MODIS, MISR, OMI, and CALIPSO aerosol optical depth retrievals for four locations on the Indo-Gangetic plains and validation against AERONET data. Atmospheric Environment 2015, 111, 113–126. [Google Scholar] [CrossRef]
- Al-Dabbas, M.A.; Abbas, M.A.; Al-Khafaji, R.M. Dust storms loads analyses—Iraq. Arabian Journal of Geosciences 2012, 5, 121–131. [Google Scholar] [CrossRef]
- Bibi, H.; Alam, K.; Bibi, S. In-depth discrimination of aerosol types using multiple clustering techniques over four locations in Indo-Gangetic plains. Atmospheric Research 2016, 181, 106–114. [Google Scholar] [CrossRef]
- Higurashi, A.; Nakajima, T. Detection of aerosol types over the East China Sea near Japan from four-channel satellite data. Geophysical research letters 2002, 29, 17–11. [Google Scholar] [CrossRef]
- Arola, A.; Schuster, G.; Myhre, G.; Kazadzis, S.; Dey, S.; Tripathi, S. Inferring absorbing organic carbon content from AERONET data. Atmospheric Chemistry and Physics 2011, 11, 215–225. [Google Scholar] [CrossRef]
- Alam, K.; Trautmann, T.; Blaschke, T.; Majid, H. Aerosol optical and radiative properties during summer and winter seasons over Lahore and Karachi. Atmospheric Environment 2012, 50, 234–245. [Google Scholar] [CrossRef]
- Hickey, A.J.; Ganderton, D. Pharmaceutical process engineering; CRC Press: 2016.
- Kabir, M.; Habiba, U.E.; Khan, W.; Shah, A.; Rahim, S.; Farooqi, Z.U.R.; Iqbal, M.Z.; Shafiq, M. Climate change due to increasing concentration of carbon dioxide and its impacts on environment in 21st century; A mini review. Journal of King Saud University-Science 2023, 2, 102693. [Google Scholar] [CrossRef]
- Kalair, A.; Abas, N.; Saleem, M.S.; Kalair, A.R.; Khan, N. Role of energy storage systems in energy transition from fossil fuels to renewables. Energy Storage 2021, 3, 135. [Google Scholar] [CrossRef]
- Di Gilio, A.; Palmisani, J.; Pulimeno, M.; Cerino, F.; Cacace, M.; Miani, A.; de Gennaro, G. CO2 concentration monitoring inside educational buildings as a strategic tool to reduce the risk of Sars-CoV-2 airborne transmission. Environmental research 2021, 202, 111560. [Google Scholar] [CrossRef]
- Chen, H.; Ju, P.; Zhu, Q.; Xu, X.; Wu, N.; Gao, Y.; Feng, X.; Tian, J.; Niu, S.; Zhang, Y. Carbon and nitrogen cycling on the Qinghai–Tibetan Plateau. Nature Reviews Earth Environment 2022, 3, 701–716. [Google Scholar] [CrossRef]
- Ahmad, K.; Upadhyayula, S. Influence of reduction temperature on the formation of intermetallic Pd2Ga phase and its catalytic activity in CO2 hydrogenation to methanol. Greenhouse Gases: Science Technology 2019, 9, 529–538. [Google Scholar] [CrossRef]
- Liangruksa, M.; Sukpoonprom, P.; Junkaew, A.; Photaram, W.; Siriwong, C. Gas sensing properties of palladium-modified zinc oxide nanofilms: A DFT study. Applied Surface Science 2021, 544, 148868. [Google Scholar] [CrossRef]
- Ismail, M.; Taha, K.; Modwi, A.; Khezami, L. ZnO nanoparticles: Surface and X-ray profile analysis. Ovonic Res 2018, 14, 381–393. [Google Scholar]
- Hu, H.; Sun, L.; Gao, Y.; Wang, T.; Huang, Y.; Lv, C.; Zhang, Y.-F.; Huang, Q.; Chen, X.; Wu, H. Synthesis of ZnO nanoparticle-anchored biochar composites for the selective removal of perrhenate, a surrogate for pertechnetate, from radioactive effluents. Journal of hazardous materials 2020, 387, 121670. [Google Scholar] [CrossRef]
- Bibi, H.; Alam, K.; Bibi, S. In-depth discrimination of aerosol types using multiple clustering techniques over four locations in Indo-Gangetic plains. Atmospheric Research 2016, 181, 106–114. [Google Scholar] [CrossRef]
- Kumar, K.R.; Yin, Y.; Sivakumar, V.; Kang, N.; Yu, X.; Diao, Y.; Adesina, A.J.; Reddy, R. Aerosol climatology and discrimination of aerosol types retrieved from MODIS, MISR and OMI over Durban (29.88 S, 31.02 E), South Africa. Atmospheric Environment 2015, 117, 9–18. [Google Scholar] [CrossRef]
- Omar, A.H.; Won, J.G.; Winker, D.M.; Yoon, S.C.; Dubovik, O.; McCormick, M.P. Development of global aerosol models using cluster analysis of Aerosol Robotic Network (AERONET) measurements. Journal of Geophysical Research: Atmospheres 2005, 110. [Google Scholar] [CrossRef]
- Pathak, B.; Bhuyan, P.K.; Gogoi, M.; Bhuyan, K. Seasonal heterogeneity in aerosol types over Dibrugarh-North-Eastern India. Atmospheric environment 2012, 47, 307–315. [Google Scholar] [CrossRef]
- Kedia, S.; Ramachandran, S.; Holben, B.N.; Tripathi, S. Quantification of aerosol type, and sources of aerosols over the Indo-Gangetic Plain. Atmospheric Environment 2014, 98, 607–619. [Google Scholar] [CrossRef]
- Xu, S.-h.; Zhang, M.-y.; Zhao, Y.-y.; Chen, B.-g.; Zhang, J.; Sun, C.-C. Stability and property of planar (BN) x clusters. Chemical physics letters 2006, 423, 212–214. [Google Scholar] [CrossRef]
- Barcaro, G.; Monti, S.; Sementa, L.; Carravetta, V. Modeling nucleation and growth of ZnO nanoparticles in a low temperature plasma by reactive dynamics. Journal of Chemical Theory Computation 2019, 15, 2010–2021. [Google Scholar] [CrossRef]
- Cao, H.; Liu, Z.; Liu, T.; Duo, S.; Huang, L.; Yi, S.; Cai, L. Well-organized assembly of ZnO hollow cages and their derived Ag/ZnO composites with enhanced photocatalytic property. Materials Characterization 2020, 160, 110125. [Google Scholar] [CrossRef]
- Tohidi, S.; Tohidi, T.; Mohammadabad, P.H. CuO-decorated ZnO nanotube–based sensor for detecting CO gas: a first-principles study. Journal of Molecular Modeling 2021, 27, 1–8. [Google Scholar] [CrossRef]
- Xu, W.; Cao, H.; Chen, H.; Yang, Y.; Sarkar, A. Sensing the cathinone drug concentration in the human body by using zinc oxide nanostructures: a DFT study. Structural Chemistry 2021, 32, 63–68. [Google Scholar] [CrossRef]
- Cheng, J.; Hu, D.; Yao, A.; Gao, Y.; Asadi, H.; Nanostructures. A computational study on the Pd-decorated ZnO nanocluster for H2 gas sensing: A comparison with experimental results. Physica E: Low-dimensional Systems Nanostructures 2020, 124, 114237. [Google Scholar] [CrossRef]
- Kovalenko Mariya, B.O. , Dzikovskyi Viktor, Bovhyra Rostyslav. A DFT study for adsorption of CO and H2 on Pt-doped ZnO nanocluster. Applied Sciences 2020, 2, 1–9. [Google Scholar]
- Mian, S.A.; Hussain, A.; Basit, A.; Rahman, G.; Ahmed, E.; Jang, J. Molecular modeling and simulation of transition metal–doped molybdenum disulfide biomarkers in exhaled gases for early detection of lung cancer. Journal of Molecular Modeling 2023, 29, 225. [Google Scholar] [CrossRef]
- Islam, F.; Shohag, S.; Uddin, M.J.; Islam, M.R.; Nafady, M.H.; Akter, A.; Mitra, S.; Roy, A.; Emran, T.B.; Cavalu, S. Exploring the journey of zinc oxide nanoparticles (ZnO-NPs) toward biomedical applications. Materials 2022, 15, 2160. [Google Scholar] [CrossRef]
- Gupta, S.K.; Mohan, S.; Valdez, M.; Lozano, K.; Mao, Y. Enhanced sensitivity of caterpillar-like ZnO nanostructure towards amine vapor sensing. Materials Research Bulletin 2021, 142, 111419. [Google Scholar] [CrossRef]
- Abdullah, F.; Bakar, N.A.; Bakar, M.A. Current advancements on the fabrication, modification, and industrial application of zinc oxide as photocatalyst in the removal of organic and inorganic contaminants in aquatic systems. Journal of hazardous materials 2022, 424, 127416. [Google Scholar] [CrossRef]
- Mage, D.; Ozolins, G.; Peterson, P.; Webster, A.; Orthofer, R.; Vandeweerd, V.; Gwynne, M. Urban air pollution in megacities of the world. Atmospheric Environment 1996, 30, 681–686. [Google Scholar] [CrossRef]
- Tripathi, S.; Dey, S.; Tare, V.; Satheesh, S. Aerosol black carbon radiative forcing at an industrial city in northern India. Geophysical Research Letters 2005, 32. [Google Scholar] [CrossRef]
- Srivastava, A.K.; Singh, S.; Tiwari, S.; Bisht, D. Contribution of anthropogenic aerosols in direct radiative forcing and atmospheric heating rate over Delhi in the Indo-Gangetic Basin. Environmental Science and Pollution Research 2012, 19, 1144–1158. [Google Scholar] [CrossRef]
- Thapa, R.B.; Murayama, Y. Urban growth modeling of Kathmandu metropolitan region, Nepal. Computers, Environment and Urban Systems 2011, 35, 25–34. [Google Scholar] [CrossRef]
- Begum, B.A.; Kim, E.; Biswas, S.K.; Hopke, P.K. Investigation of sources of atmospheric aerosol at urban and semi-urban areas in Bangladesh. Atmospheric Environment 2004, 38, 3025–3038. [Google Scholar] [CrossRef]
- Dubovik, O.; Smirnov, A.; Holben, B.; King, M.; Kaufman, Y.; Eck, T.; Slutsker, I. Accuracy assessments of aerosol optical properties retrieved from Aerosol Robotic Network (AERONET) Sun and sky radiance measurements. Journal of Geophysical Research: Atmospheres 2000, 105, 9791–9806. [Google Scholar] [CrossRef]
- Alam, K.; Trautmann, T.; Blaschke, T. Aerosol optical properties and radiative forcing over mega-city Karachi. Atmospheric Research 2011, 101, 773–782. [Google Scholar] [CrossRef]
- Smirnov, A.; Holben, B.; Eck, T.; Dubovik, O.; Slutsker, I. Cloud-screening and quality control algorithms for the AERONET database. Remote sensing of environment 2000, 73, 337–349. [Google Scholar] [CrossRef]
- Rauf, A.; Adil, M.; Mian, S.A.; Rahman, G.; Ahmed, E.; Mohy Ud Din, Z.; Qun, W. Tuning the optoelectronic properties of hematite with rhodium doping for photoelectrochemical water splitting using density functional theory approach. Scientific Reports 2021, 11, 1–11. [Google Scholar] [CrossRef]
- Opoku, F.; Govender, K.K.; van Sittert, C.G.C.E.; Govender, P.P. Recent progress in the development of semiconductor-based photocatalyst materials for applications in photocatalytic water splitting and degradation of pollutants. Advanced Sustainable Systems 2017, 1, 1700006. [Google Scholar] [CrossRef]
- Ilyas, M.; Hussain, A.; Rauf, A.; Rahman, I.U.; Naveed, A.; Basit, M.A.; Rabbani, F.; Khan, S.U.; Ahmed, E.; Hussain, M. Tailoring the antifouling agent titanium dioxide in the visible range of solar spectrum for photoelectrochemical activity with hybrid DFT & DFT+ U approach. Materials Today Communications 2021, 27, 102366. [Google Scholar]
- Mamoun, S.; Merad, A.; Guilbert, L. Energy band gap and optical properties of lithium niobate from ab initio calculations. Computational Materials Science 2013, 79, 125–131. [Google Scholar] [CrossRef]
- Kaltsoyannis, N.; McGrady, J.; Harvey, J.; I, a.o.d.f.t.i.i.c. DFT computation of relative spin-state energetics of transition metal compounds. Principles 2004, 5, 151–184. [Google Scholar]
- Zhang, P.; Luo, W.; Crespi, V.H.; Cohen, M.L.; Louie, S.G. Doping effects on the electronic and structural properties of CoO 2: An LSDA+ U study. Physical Review B 2004, 70, 085108. [Google Scholar] [CrossRef]
- Adamo, C.; Barone, V. Physically motivated density functionals with improved performances: The modified Perdew–Burke–Ernzerhof model. The Journal of chemical physics 2002, 116, 5933–5940. [Google Scholar] [CrossRef]
- Verma, S.; Prakash, D.; Ricaud, P.; Payra, S.; Attié, J.-L.; Soni, M. A new classification of aerosol sources and types as measured over Jaipur, India. Aerosol Air Quality Research 2015, 15, 985–993. [Google Scholar] [CrossRef]
- Forster, P.; Ramaswamy, V.; Artaxo, P.; Berntsen, T.; Betts, R.; Fahey, D.W.; Haywood, J.; Lean, J.; Lowe, D.C.; Myhre, G. Changes in atmospheric constituents and in radiative forcing. Chapter 2. In Climate Change 2007. The Physical Science Basis, 2007.
- Wang, Z.; Liu, D.; Wang, Z.; Wang, Y.; Khatri, P.; Zhou, J.; Takamura, T.; Shi, G. Seasonal characteristics of aerosol optical properties at the SKYNET Hefei site (31.90 N, 117.17 E) from 2007 to 2013. Journal of Geophysical Research: Atmospheres 2014, 119, 6128–6139. [Google Scholar] [CrossRef]
- Yu, X.; Kumar, K.R.; Lü, R.; Ma, J. Changes in column aerosol optical properties during extreme haze-fog episodes in January 2013 over urban Beijing. Environmental Pollution 2016, 210, 217–226. [Google Scholar] [CrossRef]
- Kumar, A. Global warming, climate change and greenhouse gas mitigation. In Biofuels: Greenhouse gas mitigation and global warming, Springer: 2018; Vol. 2, pp. 1–16.
- Tiwari, S.; Srivastava, A.; Singh, A.; Singh, S. Identification of aerosol types over Indo-Gangetic Basin: implications to optical properties and associated radiative forcing. Environmental Science Pollution Research 2015, 22, 12246–12260. [Google Scholar] [CrossRef]
- Yari, S.; Mahdavian, L.; Dehghanpour, N. Computational Investigation for the Removal of Hydrocarbon Sulfur Compounds by Zinc Oxide Nano-Cage (Zn12O12-NC). Polycyclic Aromatic Compounds 2023, 43, 370–383. [Google Scholar] [CrossRef]
- Cheng, J.; Hu, D.; Yao, A.; Gao, Y.; Asadi, H. A computational study on the Pd-decorated ZnO nanocluster for H2 gas sensing: A comparison with experimental results. Physica E: Low-dimensional Systems Nanostructures 2020, 124, 114237. [Google Scholar] [CrossRef]
- Sonam; Garg, S. ; Goel, N. Density functional study on electrochemical reduction of carbon dioxide to C1 products using zinc oxide catalyst. Theoretical Chemistry Accounts 2023, 142, 31. [Google Scholar] [CrossRef]
- Zhu, L.; Li, L.; Wen, J.; Zeng, Y.-R. Structural stability and ionic transport property of NaMPO4 (M= V, Cr, Mn, Fe, Co, Ni) as cathode material for Na-ion batteries. Journal of Power Sources 2019, 438, 227016. [Google Scholar] [CrossRef]
- Shanmugam, R.; Thamaraichelvan, A.; Viswanathan, B. Methanol formation by catalytic hydrogenation of CO 2 on a nitrogen doped zinc oxide surface: an evaluative study on the mechanistic pathway by density functional theory. RSC advances 2015, 5, 60524–60533. [Google Scholar] [CrossRef]
- Kovalenko, M.; Bovgyra, O.; Dzikovskyi, V.; Bovhyra, R. A DFT study for adsorption of CO and H2 on Pt-doped ZnO nanocluster. SN Applied Sciences 2020, 2, 790. [Google Scholar] [CrossRef]
- Cretu, V.; Postica, V.; Mishra, A.; Hoppe, M.; Tiginyanu, I.; Mishra, Y.; Chow, L.; De Leeuw, N.H.; Adelung, R.; Lupan, O. Synthesis, characterization and DFT studies of zinc-doped copper oxide nanocrystals for gas sensing applications. Journal of Materials Chemistry A 2016, 4, 6527–6539. [Google Scholar] [CrossRef]
- Abdel-Fattah, T.M.; Mahmoud, M.E. Selective extraction of toxic heavy metal oxyanions and cations by a novel silica gel phase functionalized by vitamin B4. Chemical engineering journal 2011, 172, 177–183. [Google Scholar] [CrossRef]
- Politzer, P.; Wiener, J.; Seminario, J. Density Functional Calculations of Heats of Reaction in Recent Developments and Applications of Modern Density Functional Theory. Amsterdam, The Netherlands: Elsevier: 1996; pp 139-277.
- Fukui, K. Role of frontier orbitals in chemical reactions. science 1982, 218, 747–754. [Google Scholar] [CrossRef]
- Hadipour, N.L.; Ahmadi Peyghan, A.; Soleymanabadi, H. Theoretical study on the Al-doped ZnO nanoclusters for CO chemical sensors. The Journal of Physical Chemistry C 2015, 119, 6398–6404. [Google Scholar] [CrossRef]
- Hussain, A.; Rauf, A.; Ahmed, E.; Khan, M.S.; Mian, S.A.; Jang, J. Modulating Optoelectronic and Elastic Properties of Anatase TiO2 for Photoelectrochemical Water Splitting. Molecules 2023, 28, 3252. [Google Scholar] [CrossRef] [PubMed]
- Baei, M.T.; Tabar, M.B.; Hashemian, S. Zn12O12 fullerene-like cage as a potential sensor for SO2 detection. Adsorption Science Technology 2013, 31, 469–476. [Google Scholar] [CrossRef]
- Aslanzadeh, S. Transition metal doped ZnO nanoclusters for carbon monoxide detection: DFT studies. Journal of molecular modeling 2016, 22, 160. [Google Scholar] [CrossRef] [PubMed]
- Peyghan, A.A.; Noei, M. The alkali and alkaline earth metal doped ZnO nanotubes: DFT studies. Physica B: Condensed Matter 2014, 432, 105–110. [Google Scholar] [CrossRef]
- Cheng, J.; Hu, D.; Yao, A.; Gao, Y.; Asadi, H. A computational study on the Pd-decorated ZnO nanocluster for H2 gas sensing: A comparison with experimental results. Physica E: Low-dimensional Systems Nanostructures 2020, 124, 114237. [Google Scholar] [CrossRef]
- Han, J.; Mantas, P.; Senos, A. Effect of Al and Mn doping on the electrical conductivity of ZnO. Journal of the European Ceramic Society 2001, 21, 1883–1886. [Google Scholar] [CrossRef]
- Ahmad, S.; Hussain, A.; Mian, S.A.; Rahman, G.; Ali, S.; Jang, J. Sensing and conversion of carbon dioxide to methanol using Ag-decorated zinc oxide nanocatalyst. Materials Advances 2024, 5, 1119–1129. [Google Scholar] [CrossRef]
- Kumar, M.; Singh Bhati, V.; Ranwa, S.; Singh, J. Pd/ZnO nanorods based sensor for highly selective detection of extremely low concentration hydrogen. Scientific reports 2017, 7, 1–9. [Google Scholar] [CrossRef] [PubMed]
- Peng, Y.-H.; Huang, G.-F.; Huang, W.-Q. Visible-light absorption and photocatalytic activity of Cr-doped TiO2 nanocrystal films. Advanced Powder Technology 2012, 23, 8–12. [Google Scholar] [CrossRef]
- Anderson, T.R.; Hawkins, E.; Jones, P.D. CO2, the greenhouse effect and global warming: from the pioneering work of Arrhenius and Callendar to today's Earth System Models. Endeavour 2016, 40, 178–187. [Google Scholar] [CrossRef]
- Ren, M.; Zhang, Y.; Wang, X.; Qiu, H. Catalytic hydrogenation of CO2 to methanol: A review. Catalysts 2022, 12, 403. [Google Scholar] [CrossRef]
- Bae, S.Y.; Na, C.W.; Kang, J.H.; Park, J. Comparative structure and optical properties of Ga-, In-, and Sn-doped ZnO nanowires synthesized via thermal evaporation. The Journal of Physical Chemistry B 2005, 109, 2526–2531. [Google Scholar] [CrossRef] [PubMed]
- Tang, J.; Wang, P.; Mickley, L.J.; Xia, X.; Liao, H.; Yue, X.; Sun, L.; Xia, J. Positive relationship between liquid cloud droplet effective radius and aerosol optical depth over Eastern China from satellite data. Atmospheric Environment 2014, 84, 244–253. [Google Scholar] [CrossRef]
- Mian, S.A.; Khan, S.U.; Hussain, A.; Rauf, A.; Ahmed, E.; Jang, J. Molecular Modelling of Optical Biosensor Phosphorene-Thioguanine for Optimal Drug Delivery in Leukemia Treatment. Cancers 2022, 14, 545. [Google Scholar] [CrossRef] [PubMed]
- Khan, E.; Tandon, P.; Maurya, R.; Kumar, P. A theoretical study on molecular structure, chemical reactivity and molecular docking studies on dalbergin and methyldalbergin. Journal of Molecular Structure 2019, 1183, 100–106. [Google Scholar]
- Zhang, X.; Yu, L.; Wu, X.; Hu, W. Experimental sensing and density functional theory study of H2S and SOF2 adsorption on Au-modified graphene. Advanced Science 2015, 2, 1500101. [Google Scholar] [CrossRef]
- Freund, H.-J.; Messmer, R. On the bonding and reactivity of CO2 on metal surfaces. Surface science 1986, 172, 1–30. [Google Scholar] [CrossRef]
Figure 1.
Environmental study area map of the South Asian Countries.
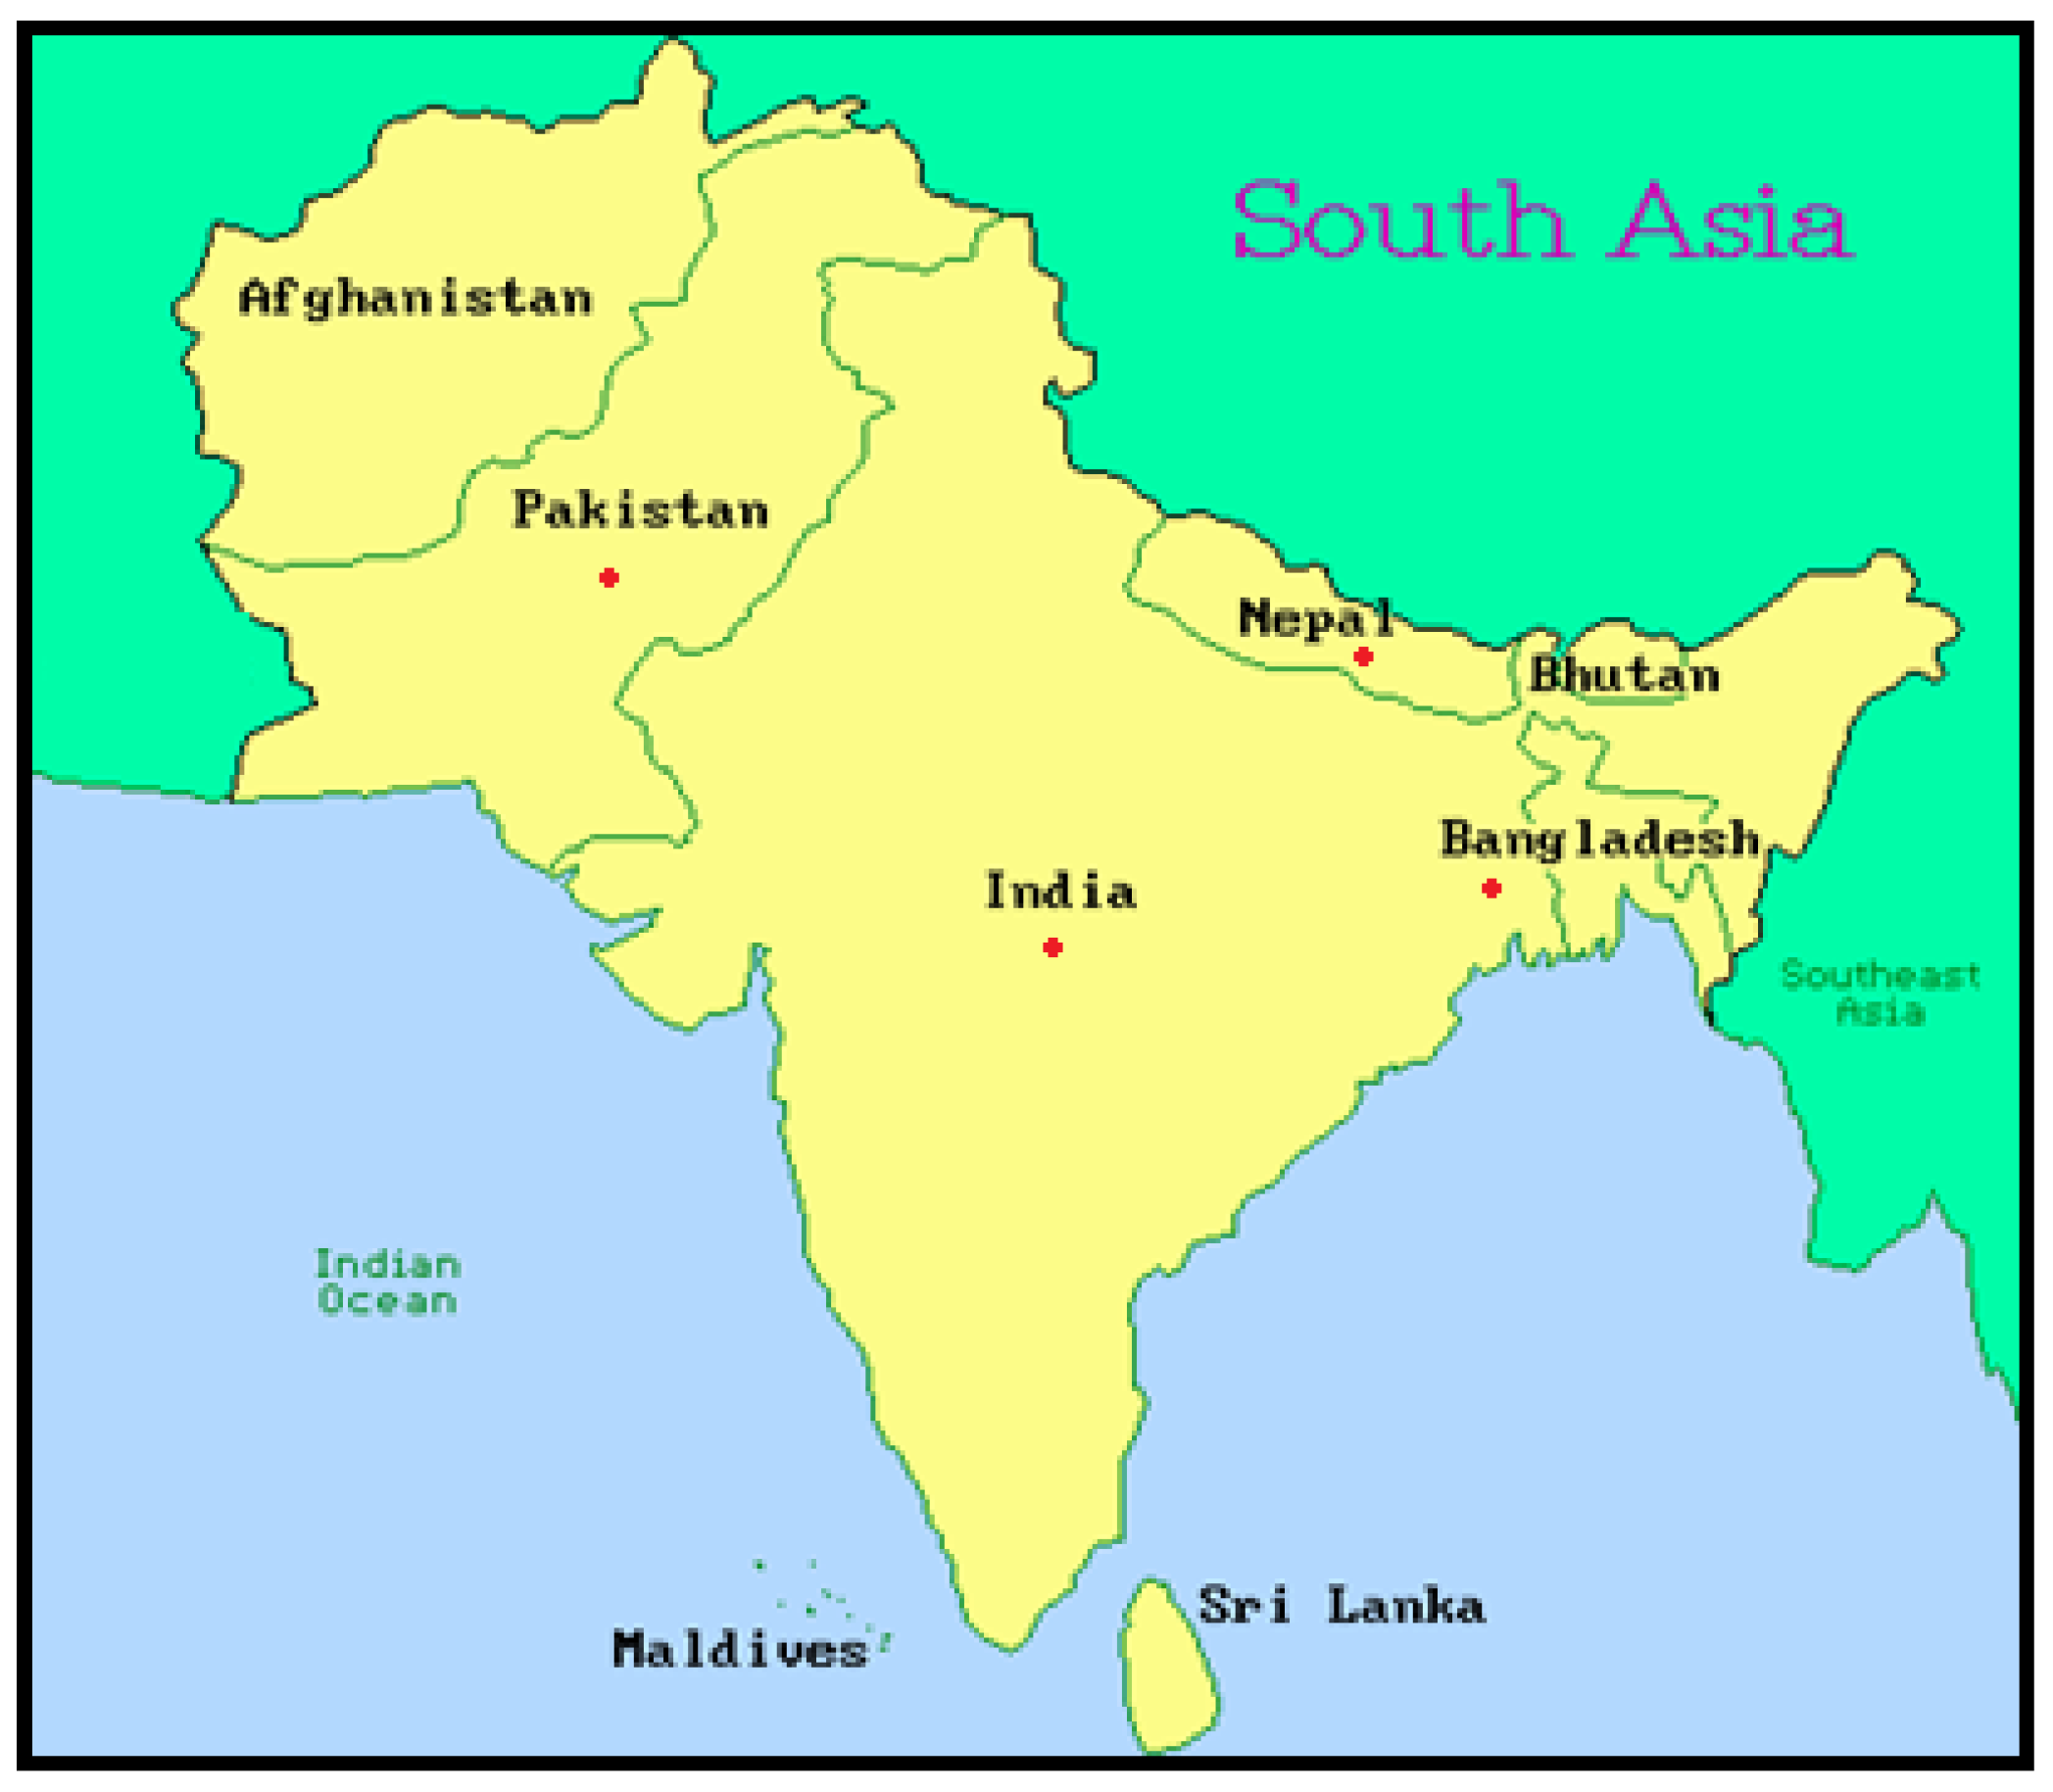
Figure 2.
Different types of environmental aerosols i.e., industrial urban vehicle, biomass and major dust over the selected cities of South Asia: (i) Karachi, (ii) Lahore, (iii) Jaipur, (iv) Kanpur, (v) Dhaka, and (vi) Kathmandu. Red, blue and green colors are used for visibility of the figure only.
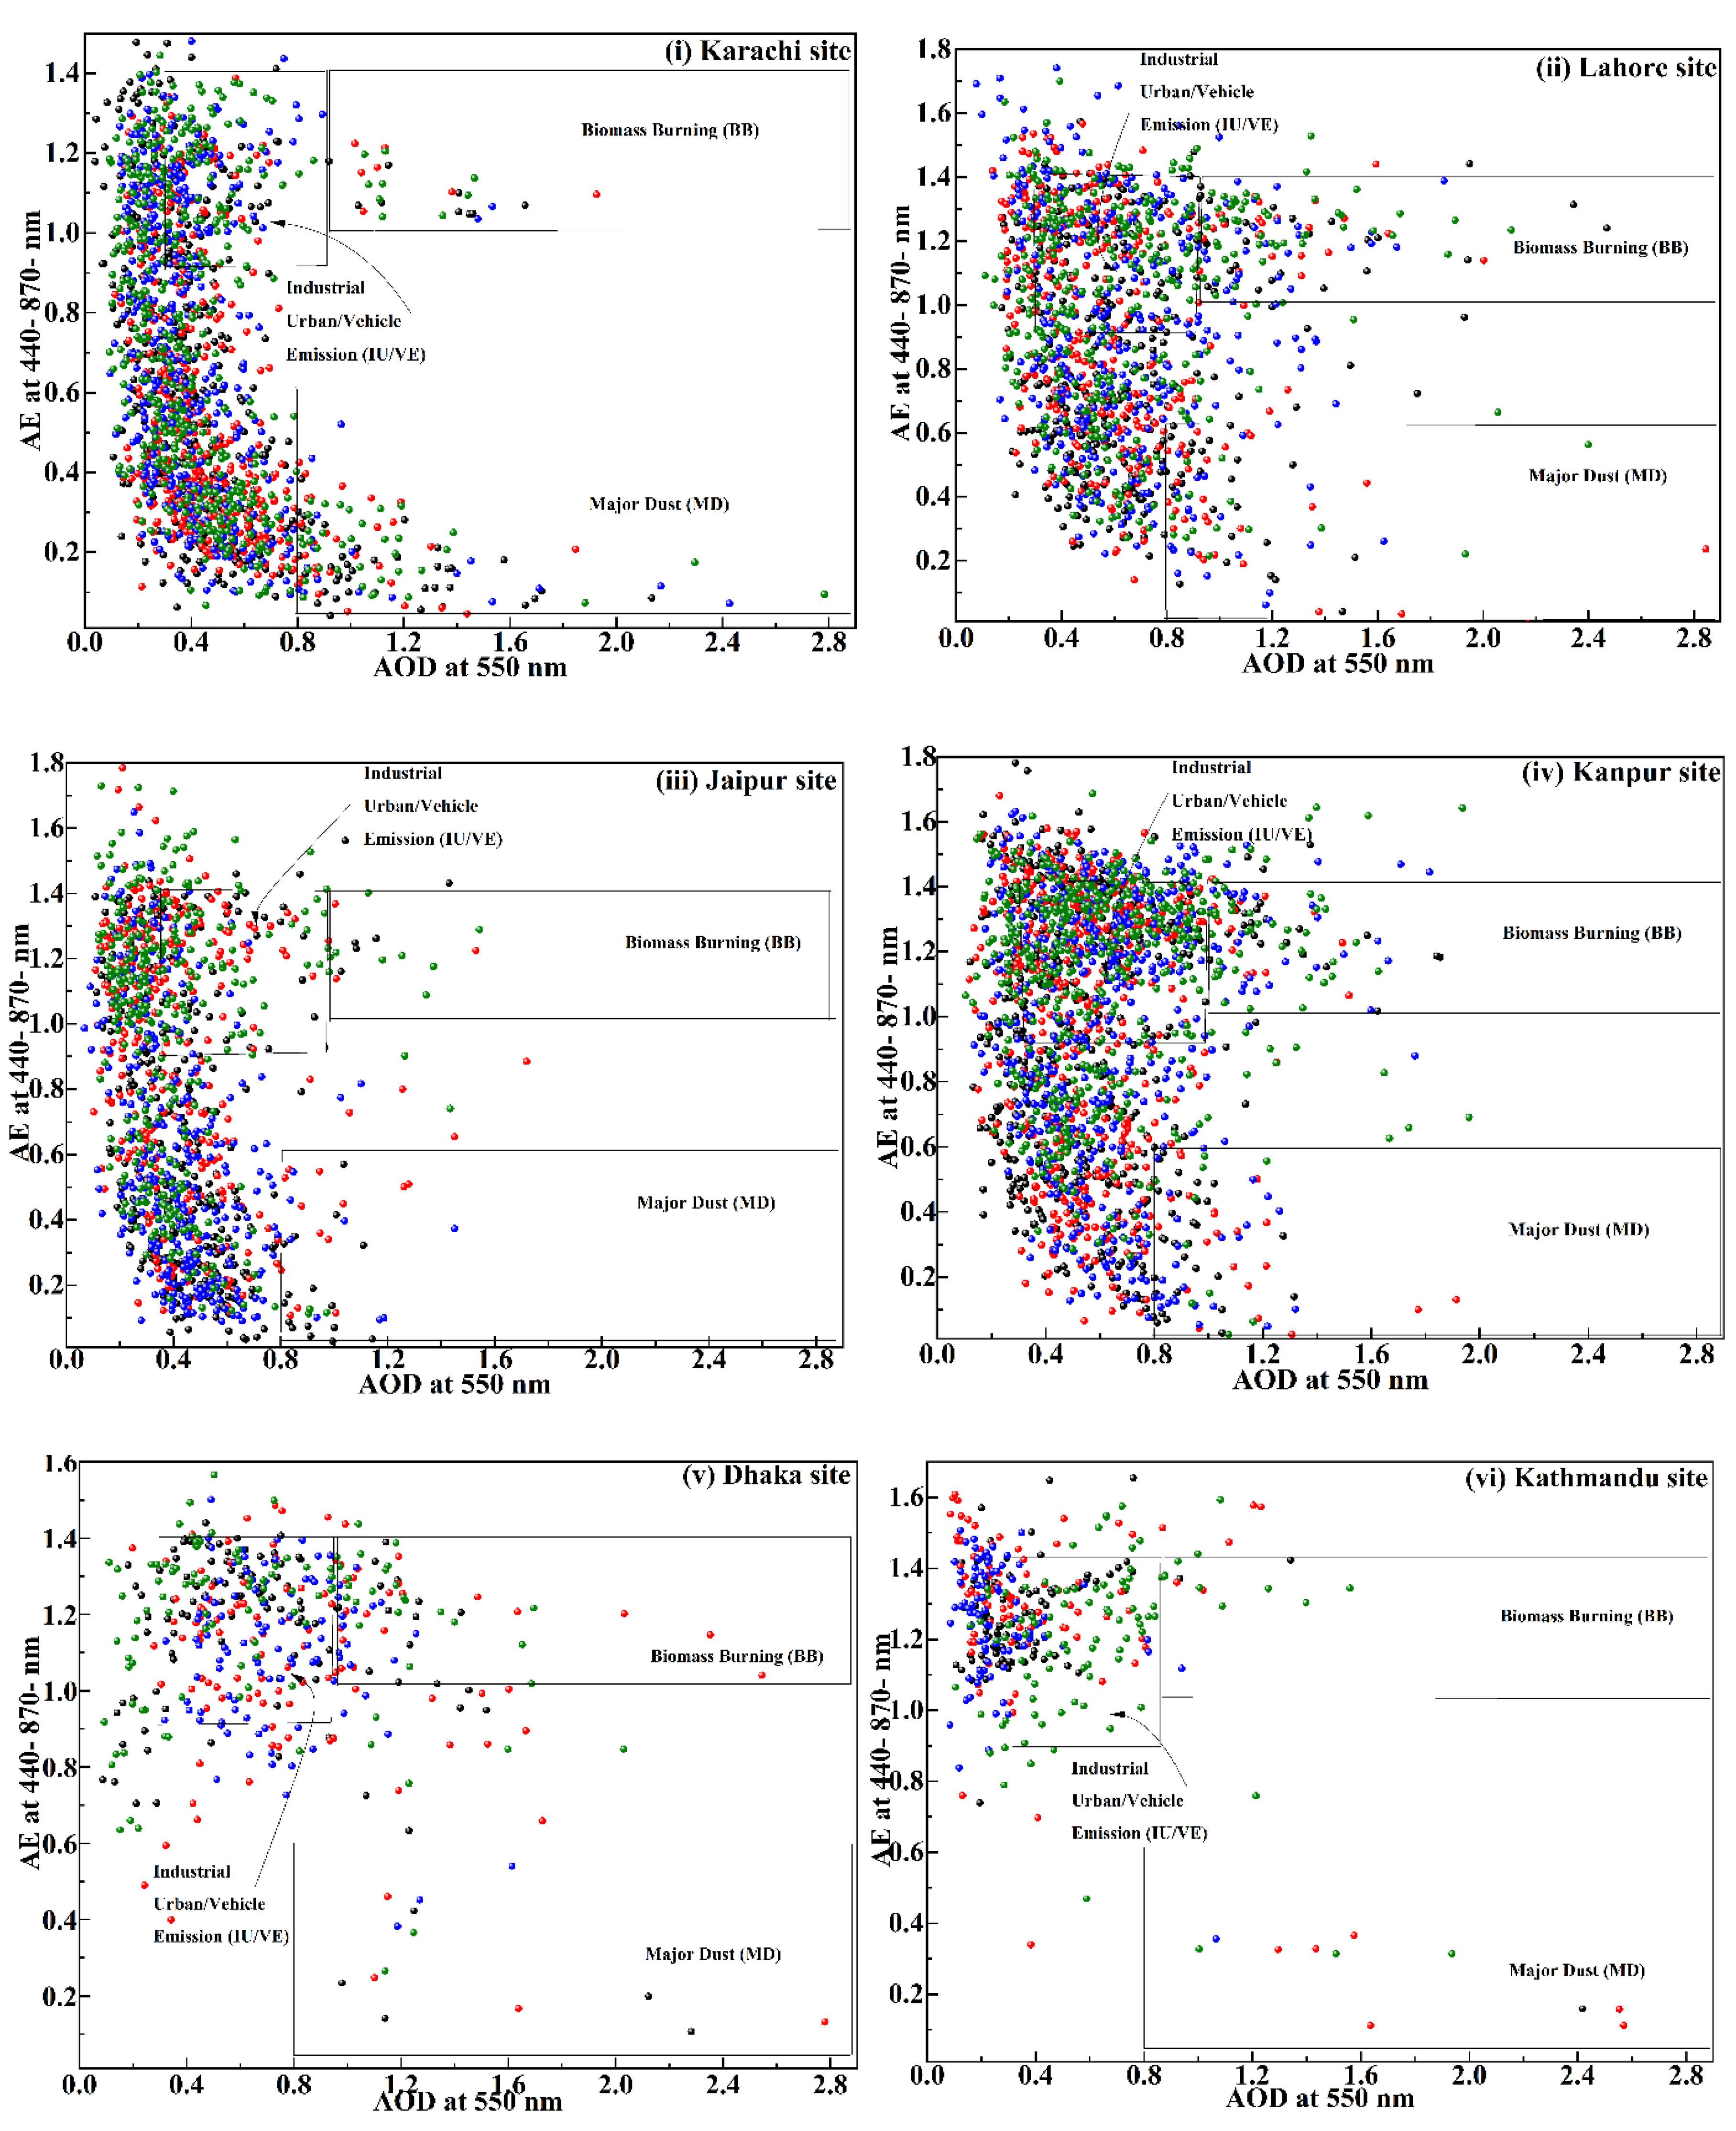
Figure 3.
(a) Pristine ZnO, (b) Zn–ZnO top view, (c) CO2 gas complex interaction with the Zn–ZnO nanocage, and (d) Methanol (CH3OH) + water (H2O) as byproduct.
Figure 3.
(a) Pristine ZnO, (b) Zn–ZnO top view, (c) CO2 gas complex interaction with the Zn–ZnO nanocage, and (d) Methanol (CH3OH) + water (H2O) as byproduct.
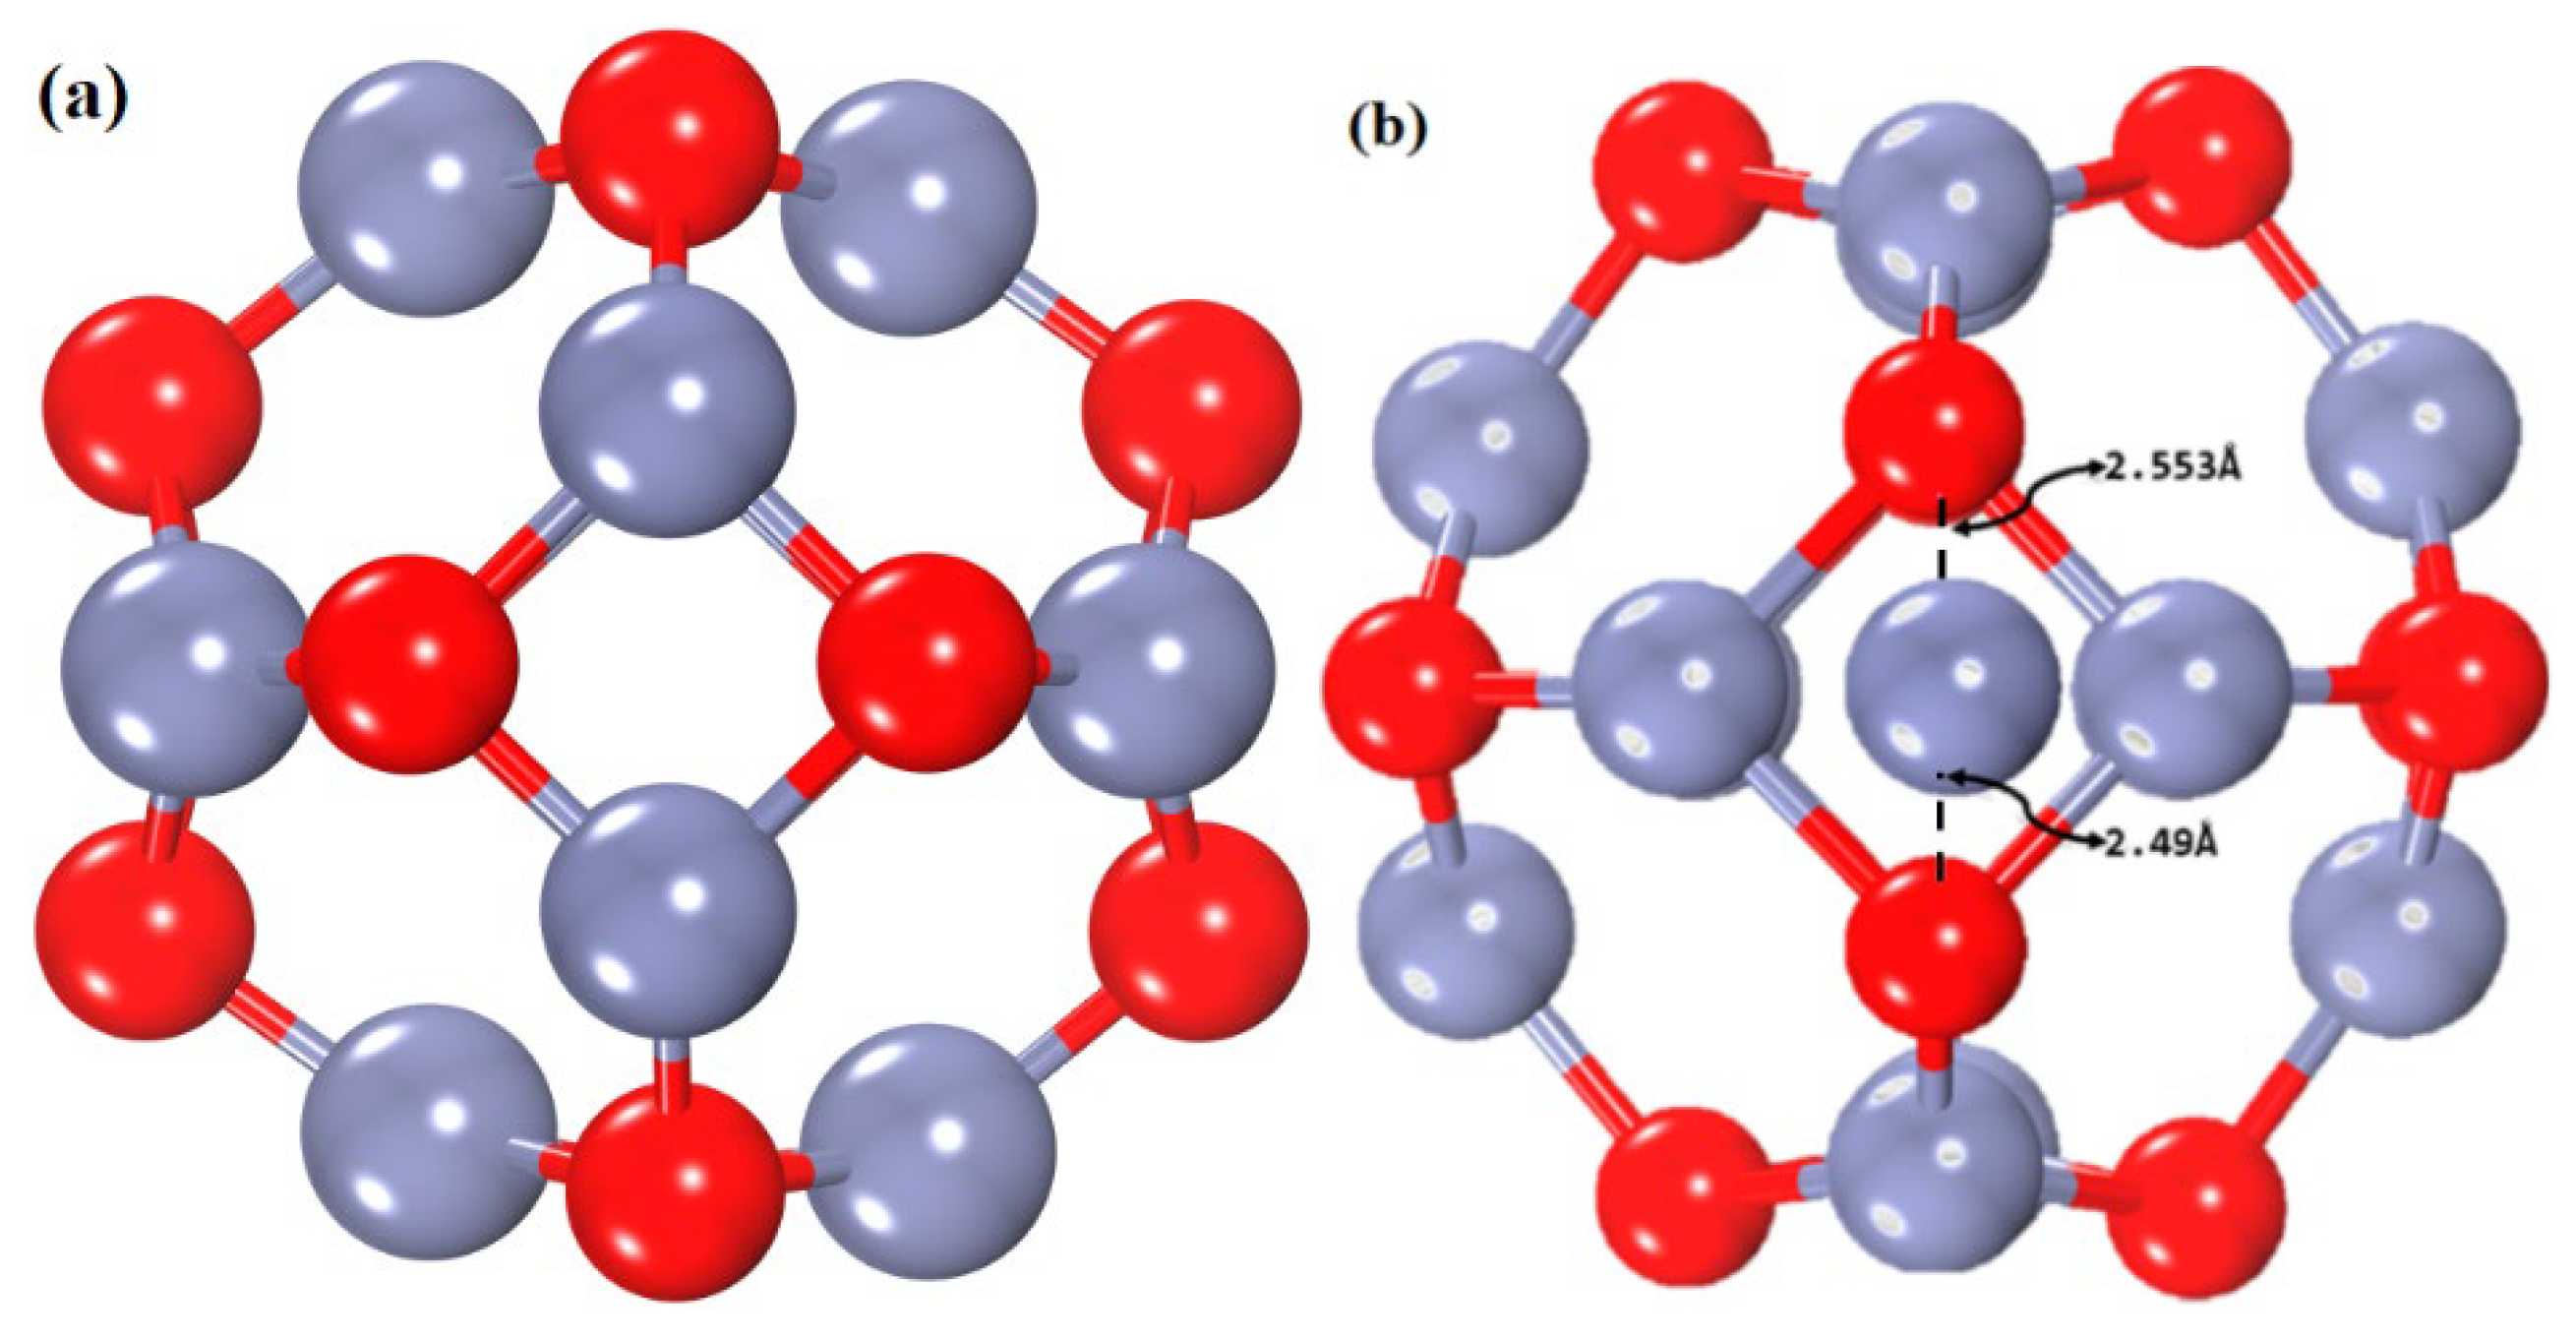
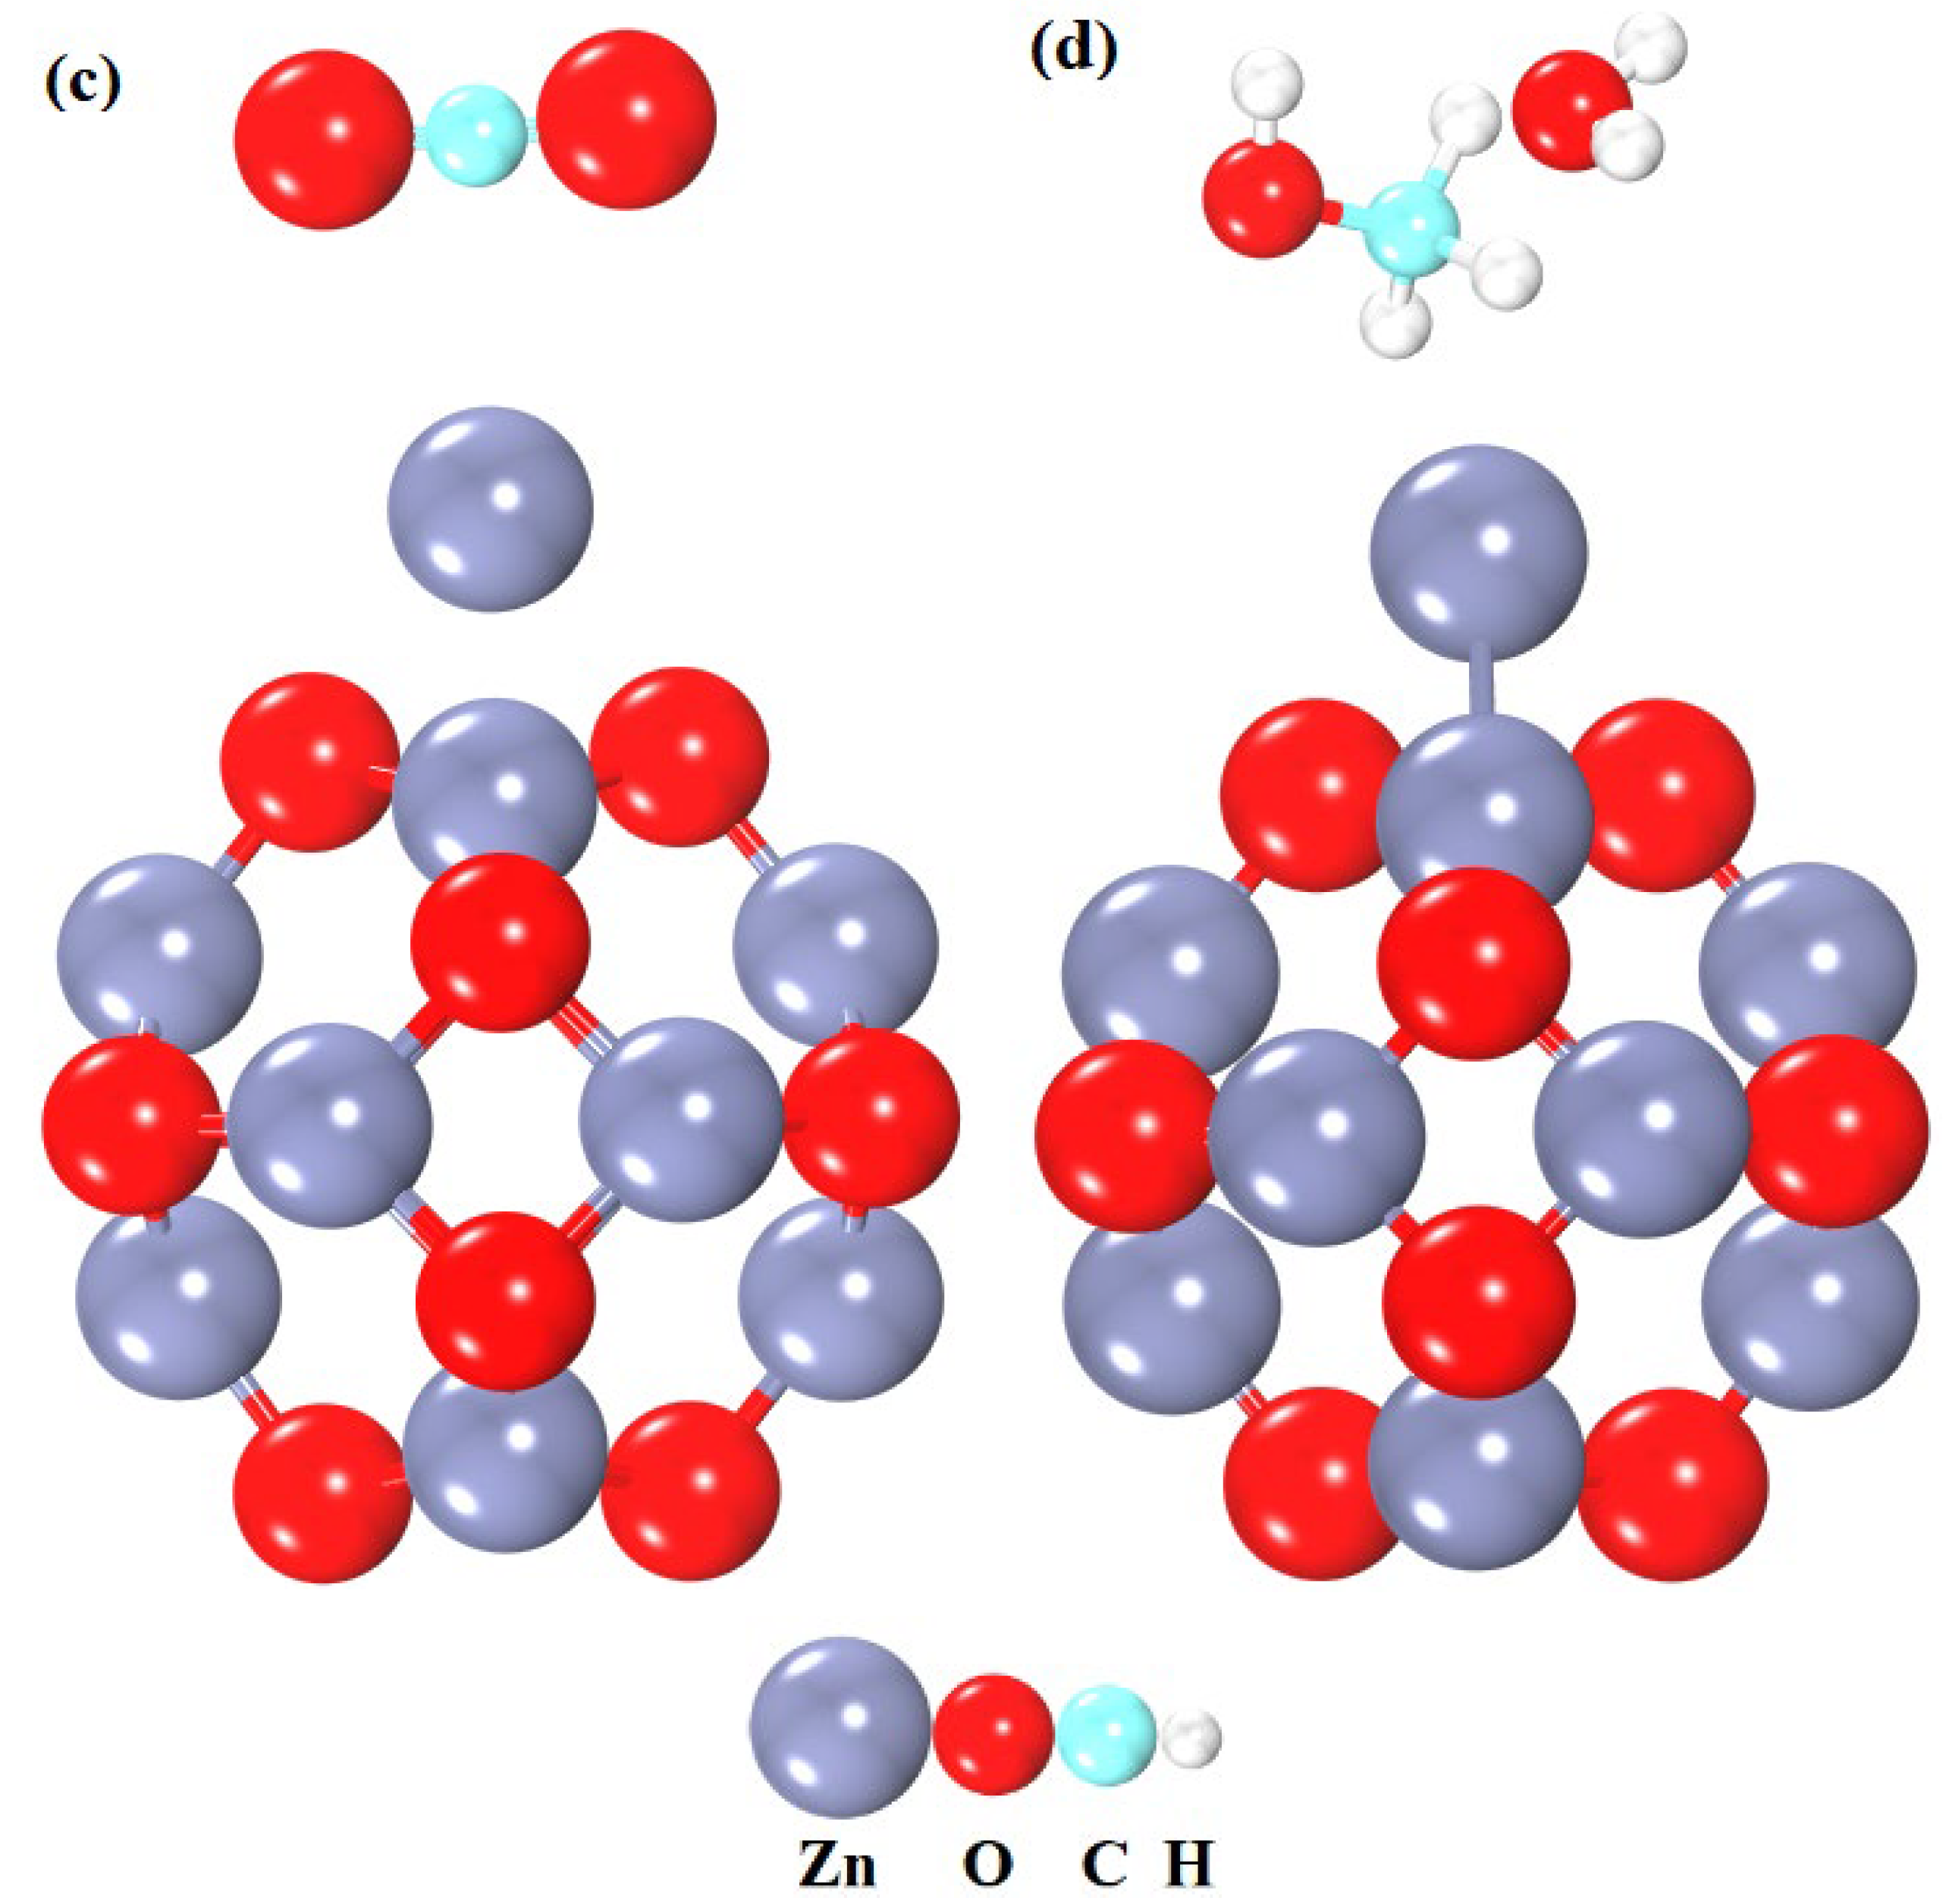
Figure 4.
Cell volume vs free energy (a–d) of the complete reaction pathway versus the number of iterations of pristine and Zn-decorated ZnO nanocage.
Figure 4.
Cell volume vs free energy (a–d) of the complete reaction pathway versus the number of iterations of pristine and Zn-decorated ZnO nanocage.
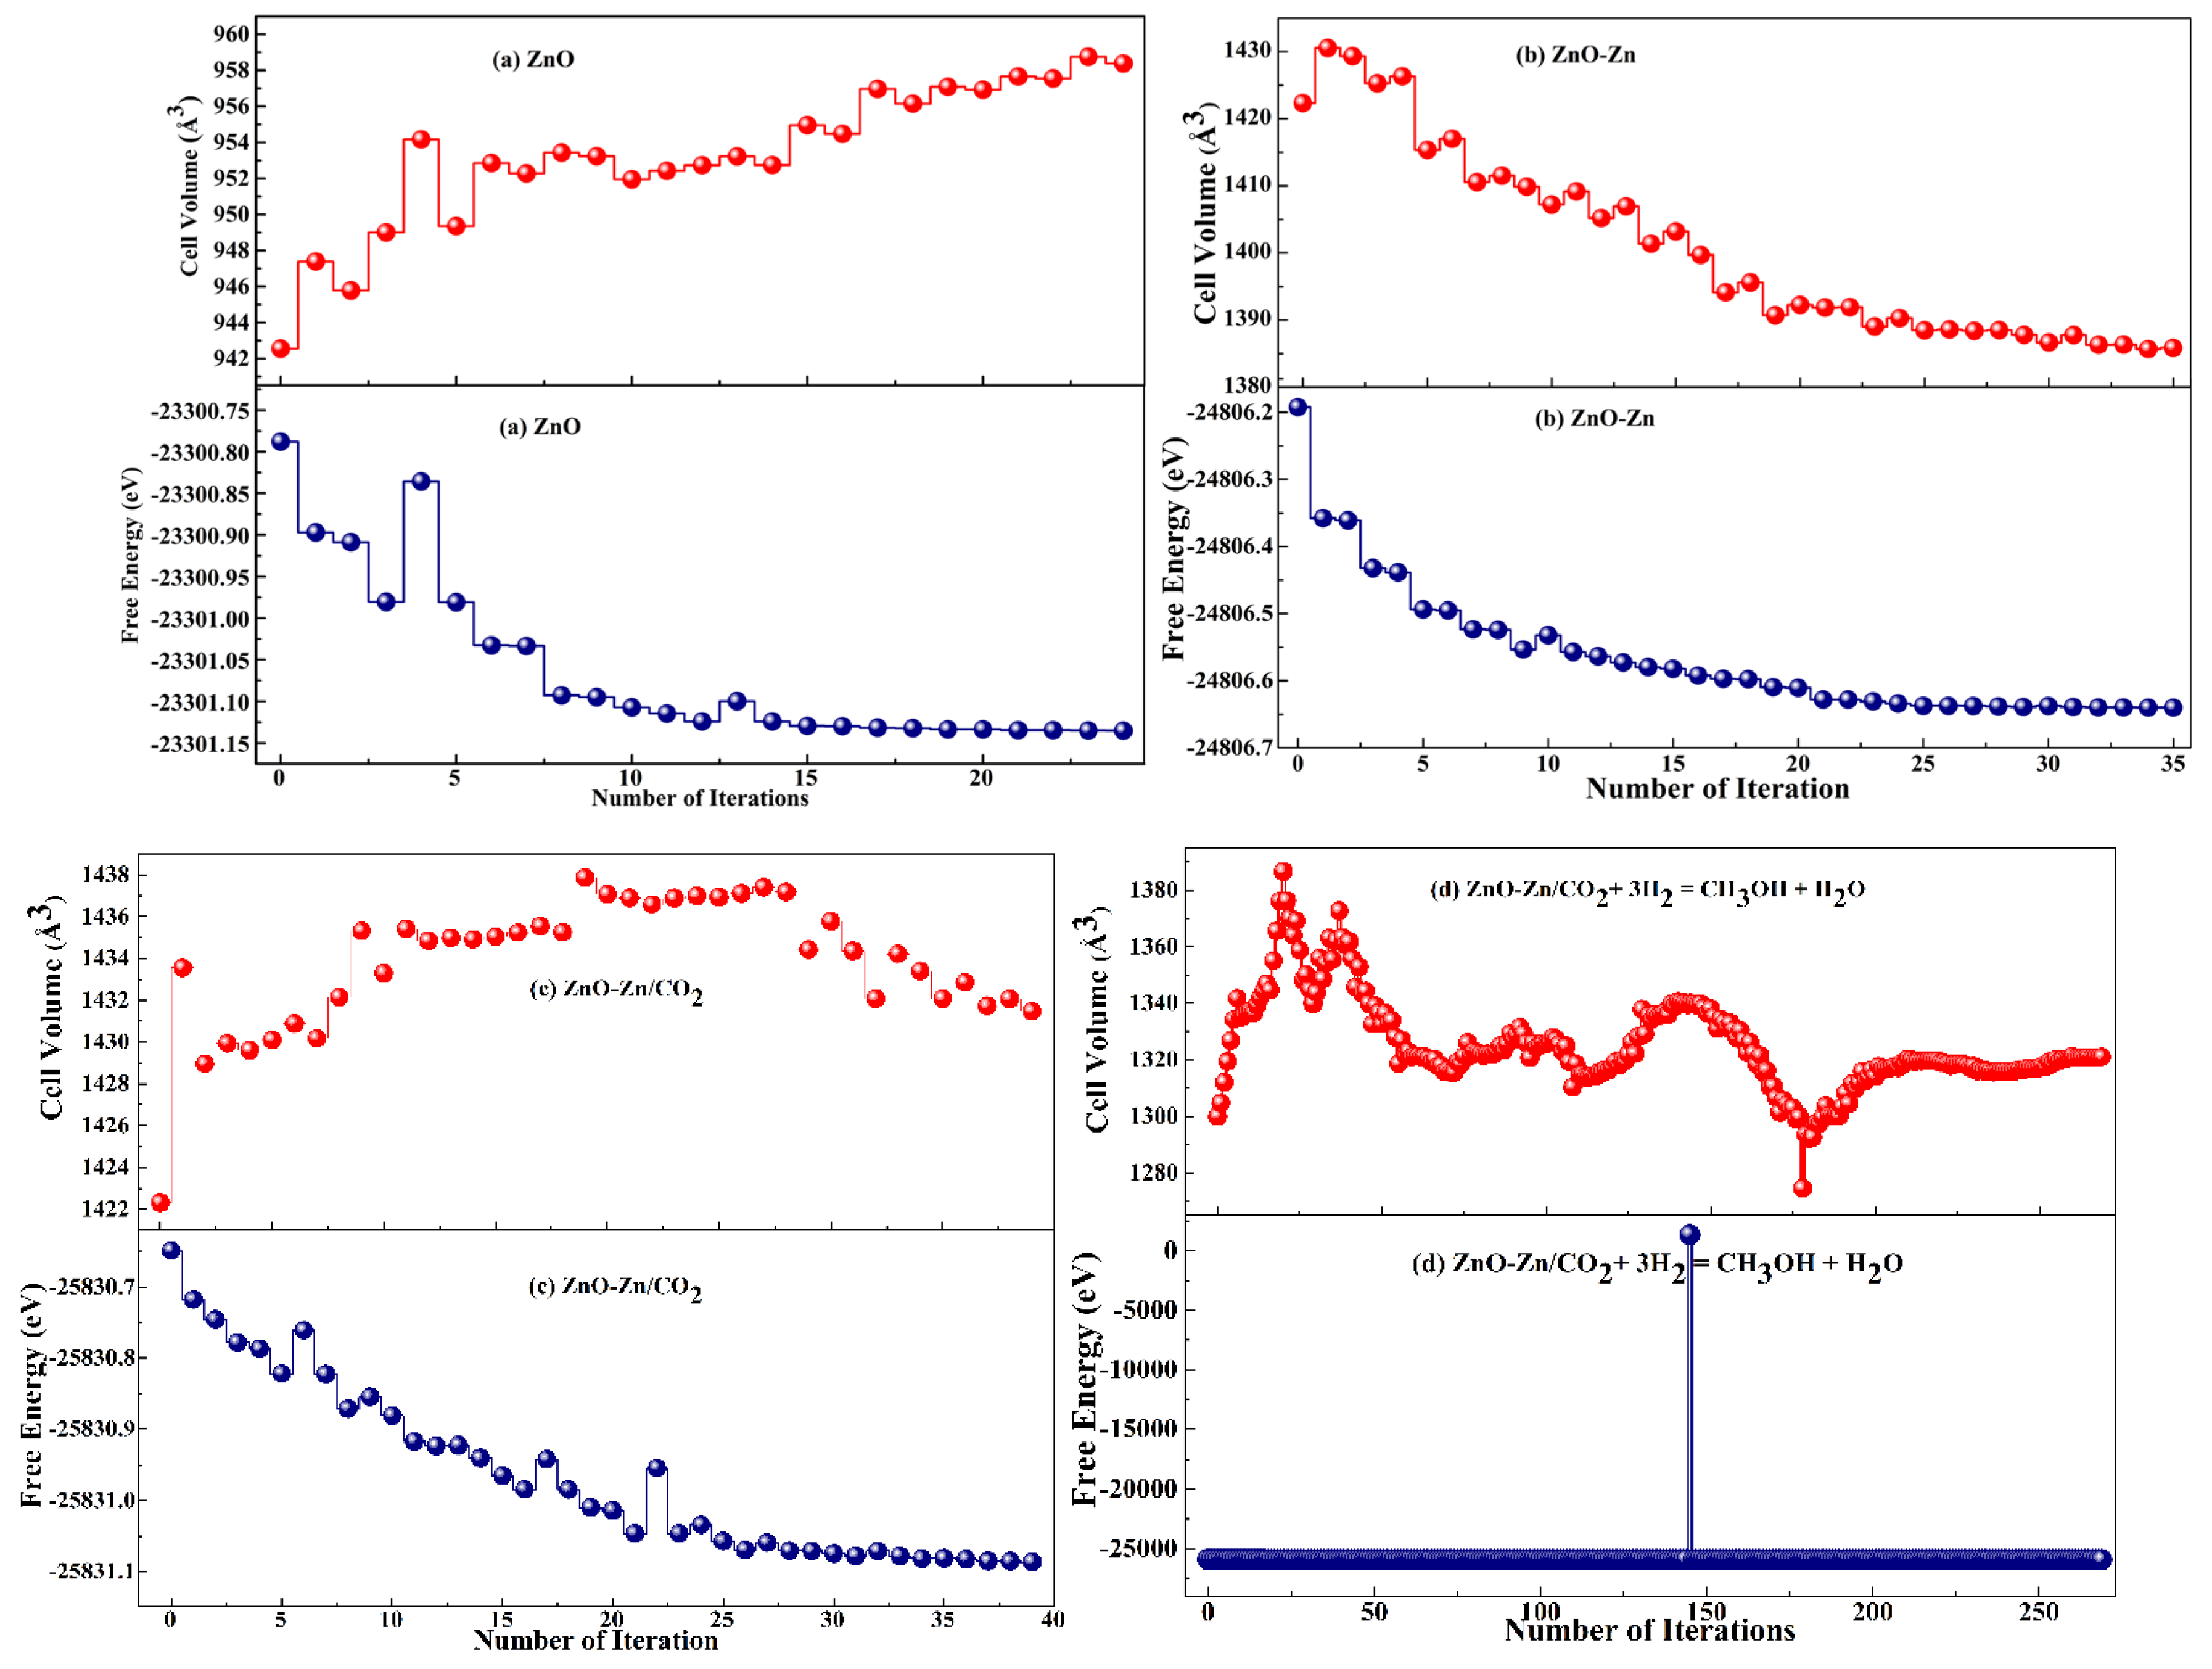
Figure 5.
Bandgap and projected density of states (PDOS) for the interaction of CO2 with the pristine ZnO nanocage (a–c).
Figure 5.
Bandgap and projected density of states (PDOS) for the interaction of CO2 with the pristine ZnO nanocage (a–c).
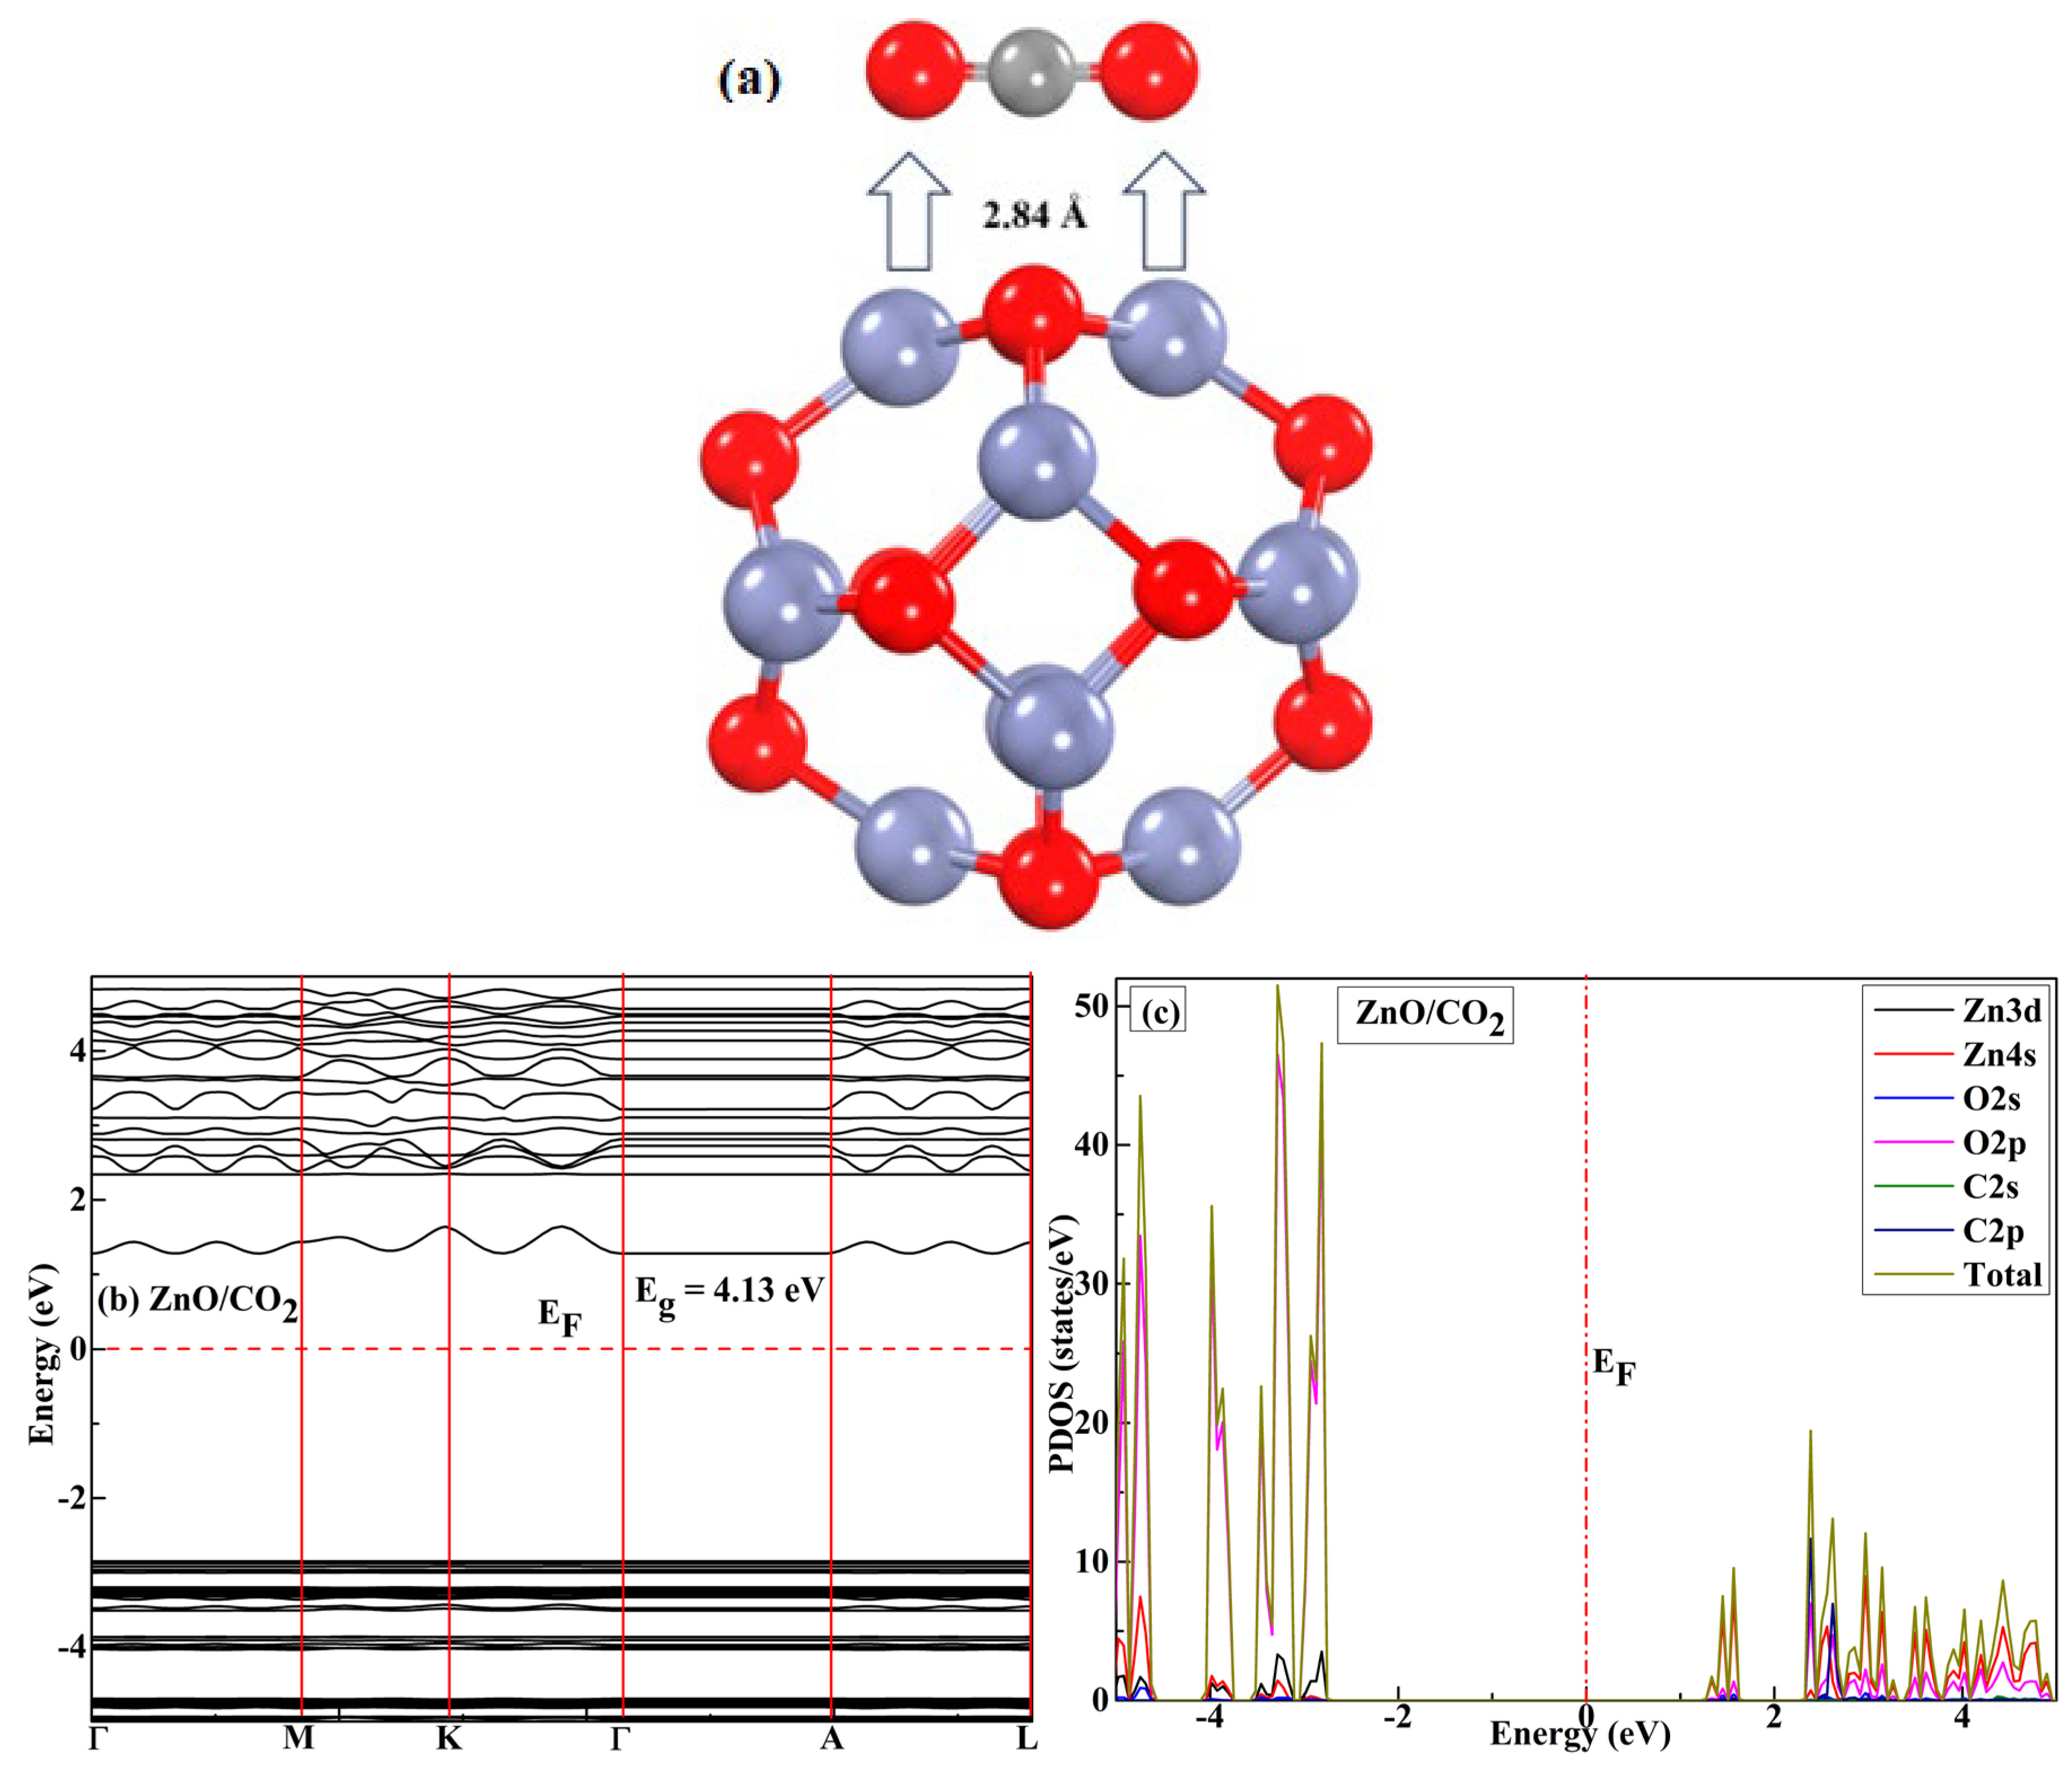
Figure 6.
Band structures of (a) pristine and (b) Zn-decorated ZnO nanocages and (c, d) CO2 gas complex adsorbed on the ZnO–Zn nanocage.
Figure 6.
Band structures of (a) pristine and (b) Zn-decorated ZnO nanocages and (c, d) CO2 gas complex adsorbed on the ZnO–Zn nanocage.
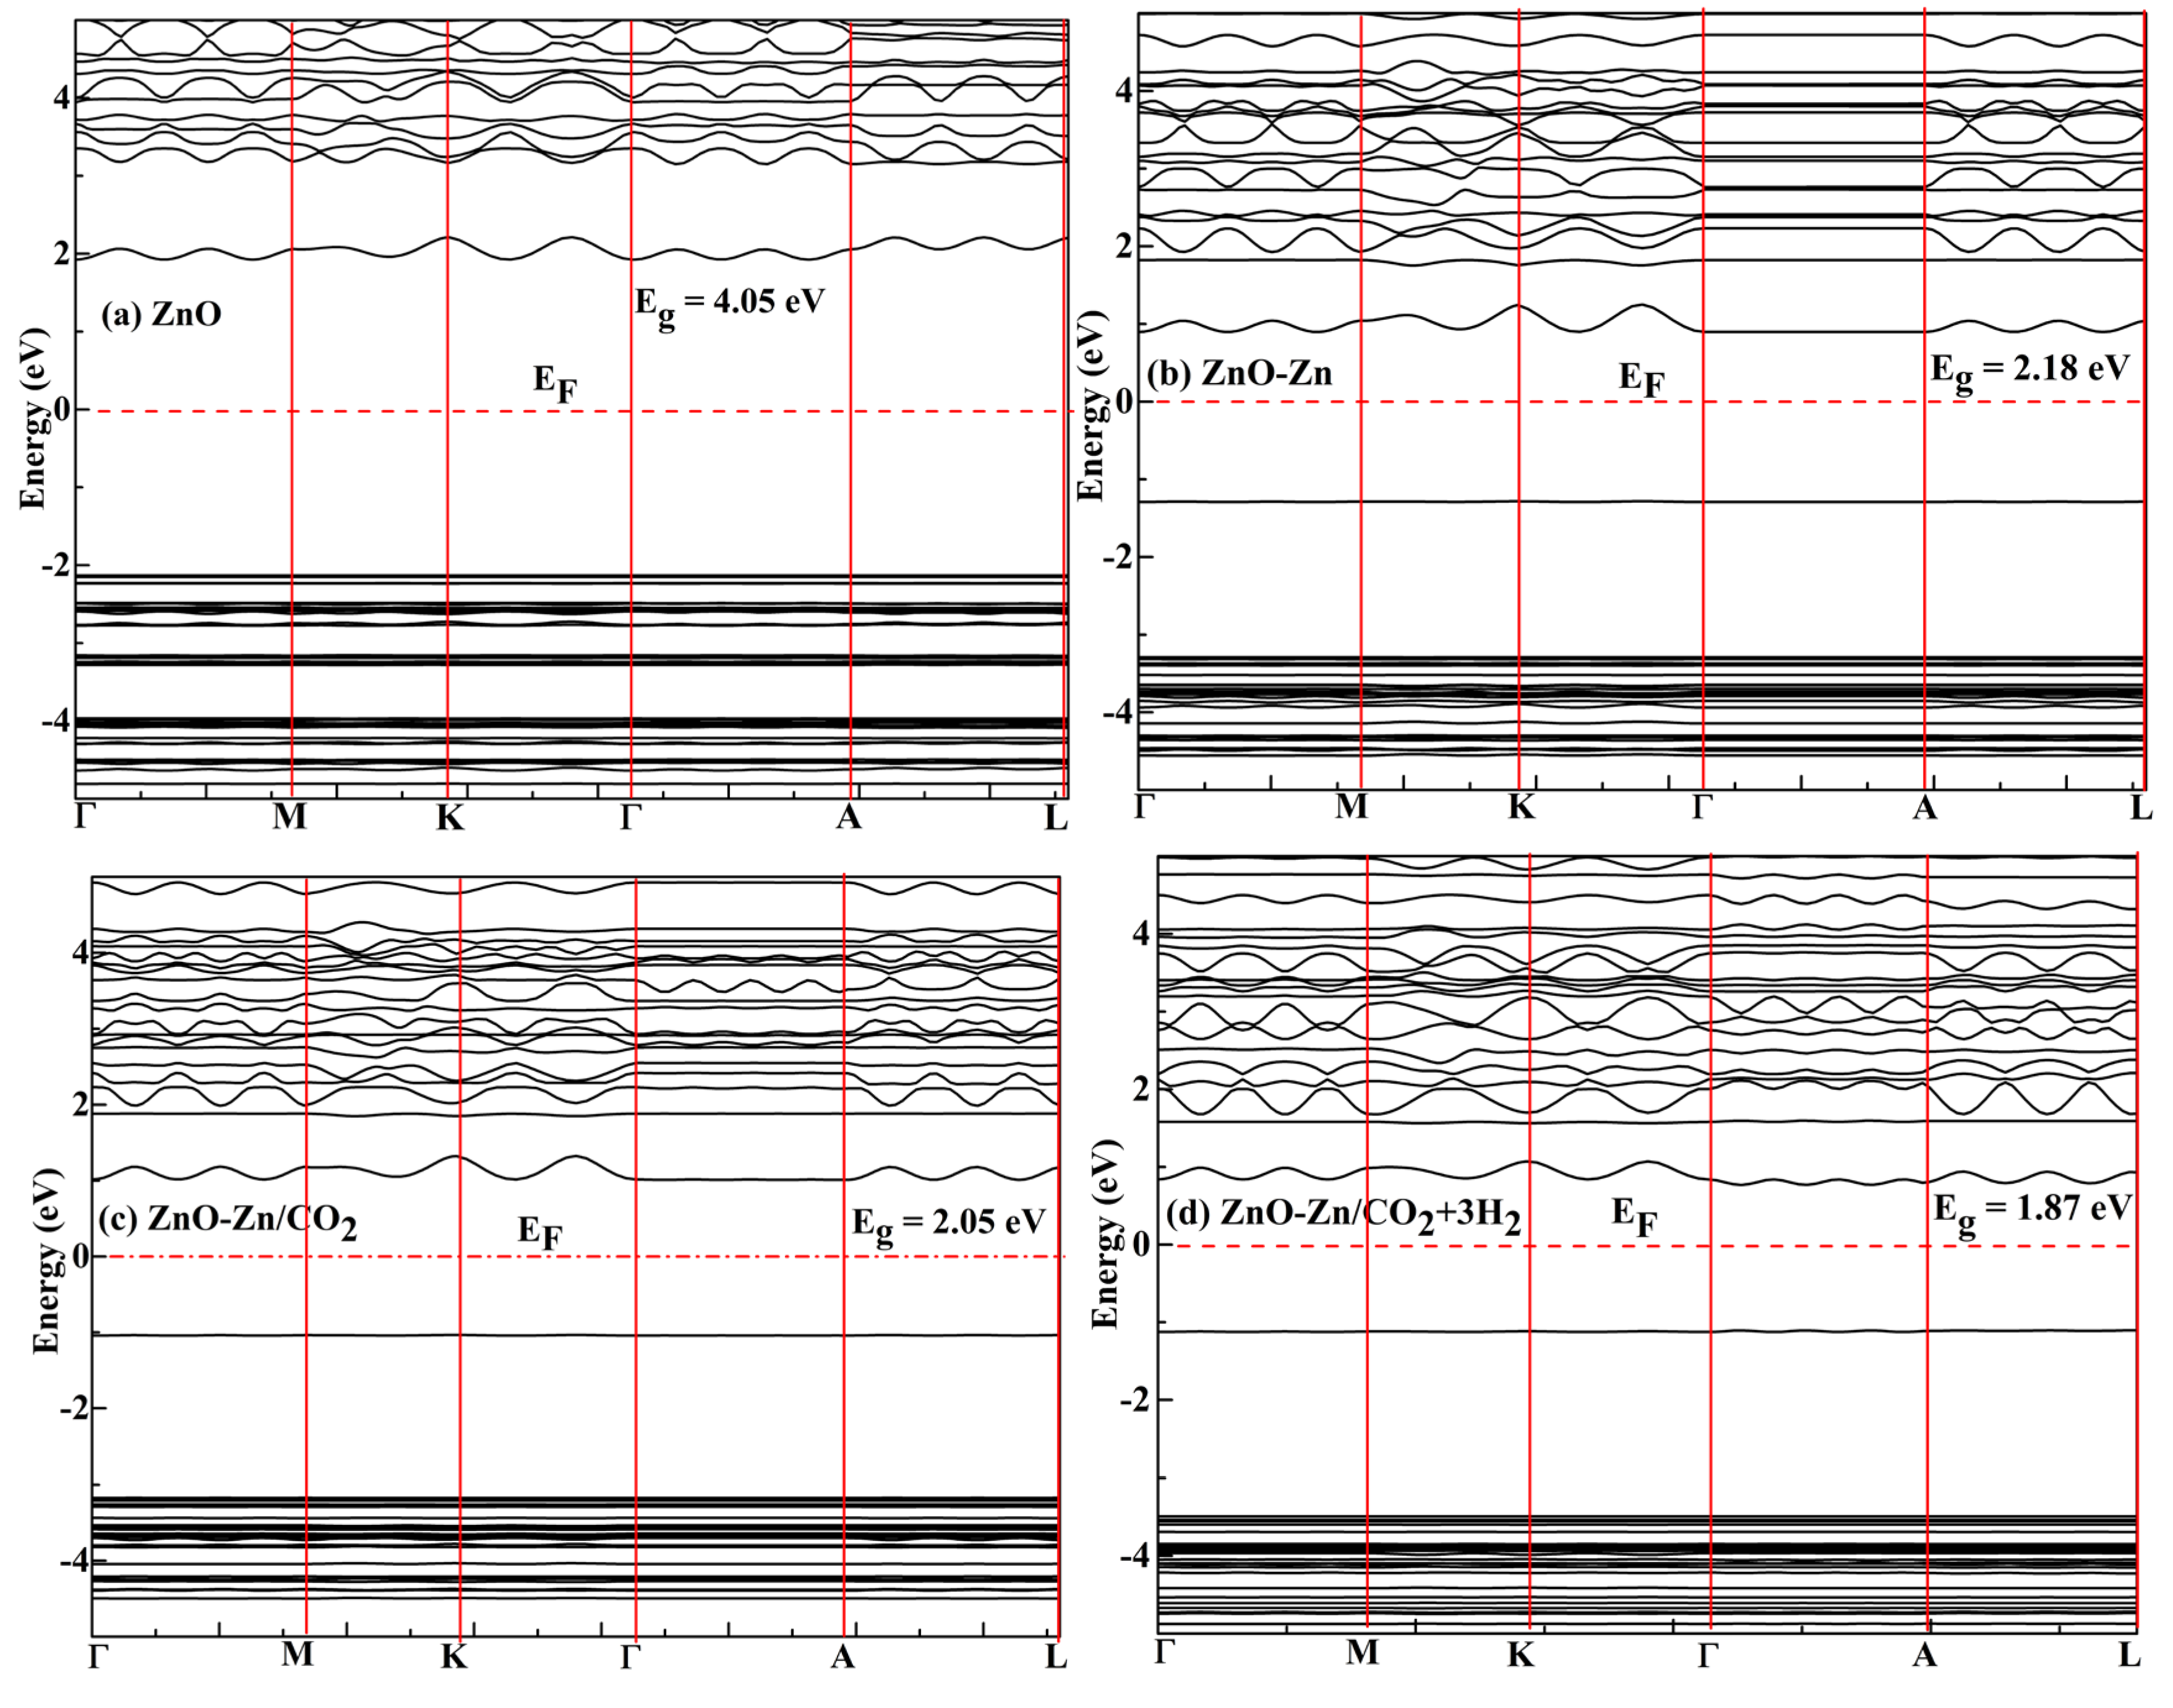
Figure 7.
PDOS of the (a) pristine and (b) Zn-decorated ZnO nanocage and (c, d) CO2 and complexes adsorbed by the ZnO–Zn nanocage.
Figure 7.
PDOS of the (a) pristine and (b) Zn-decorated ZnO nanocage and (c, d) CO2 and complexes adsorbed by the ZnO–Zn nanocage.
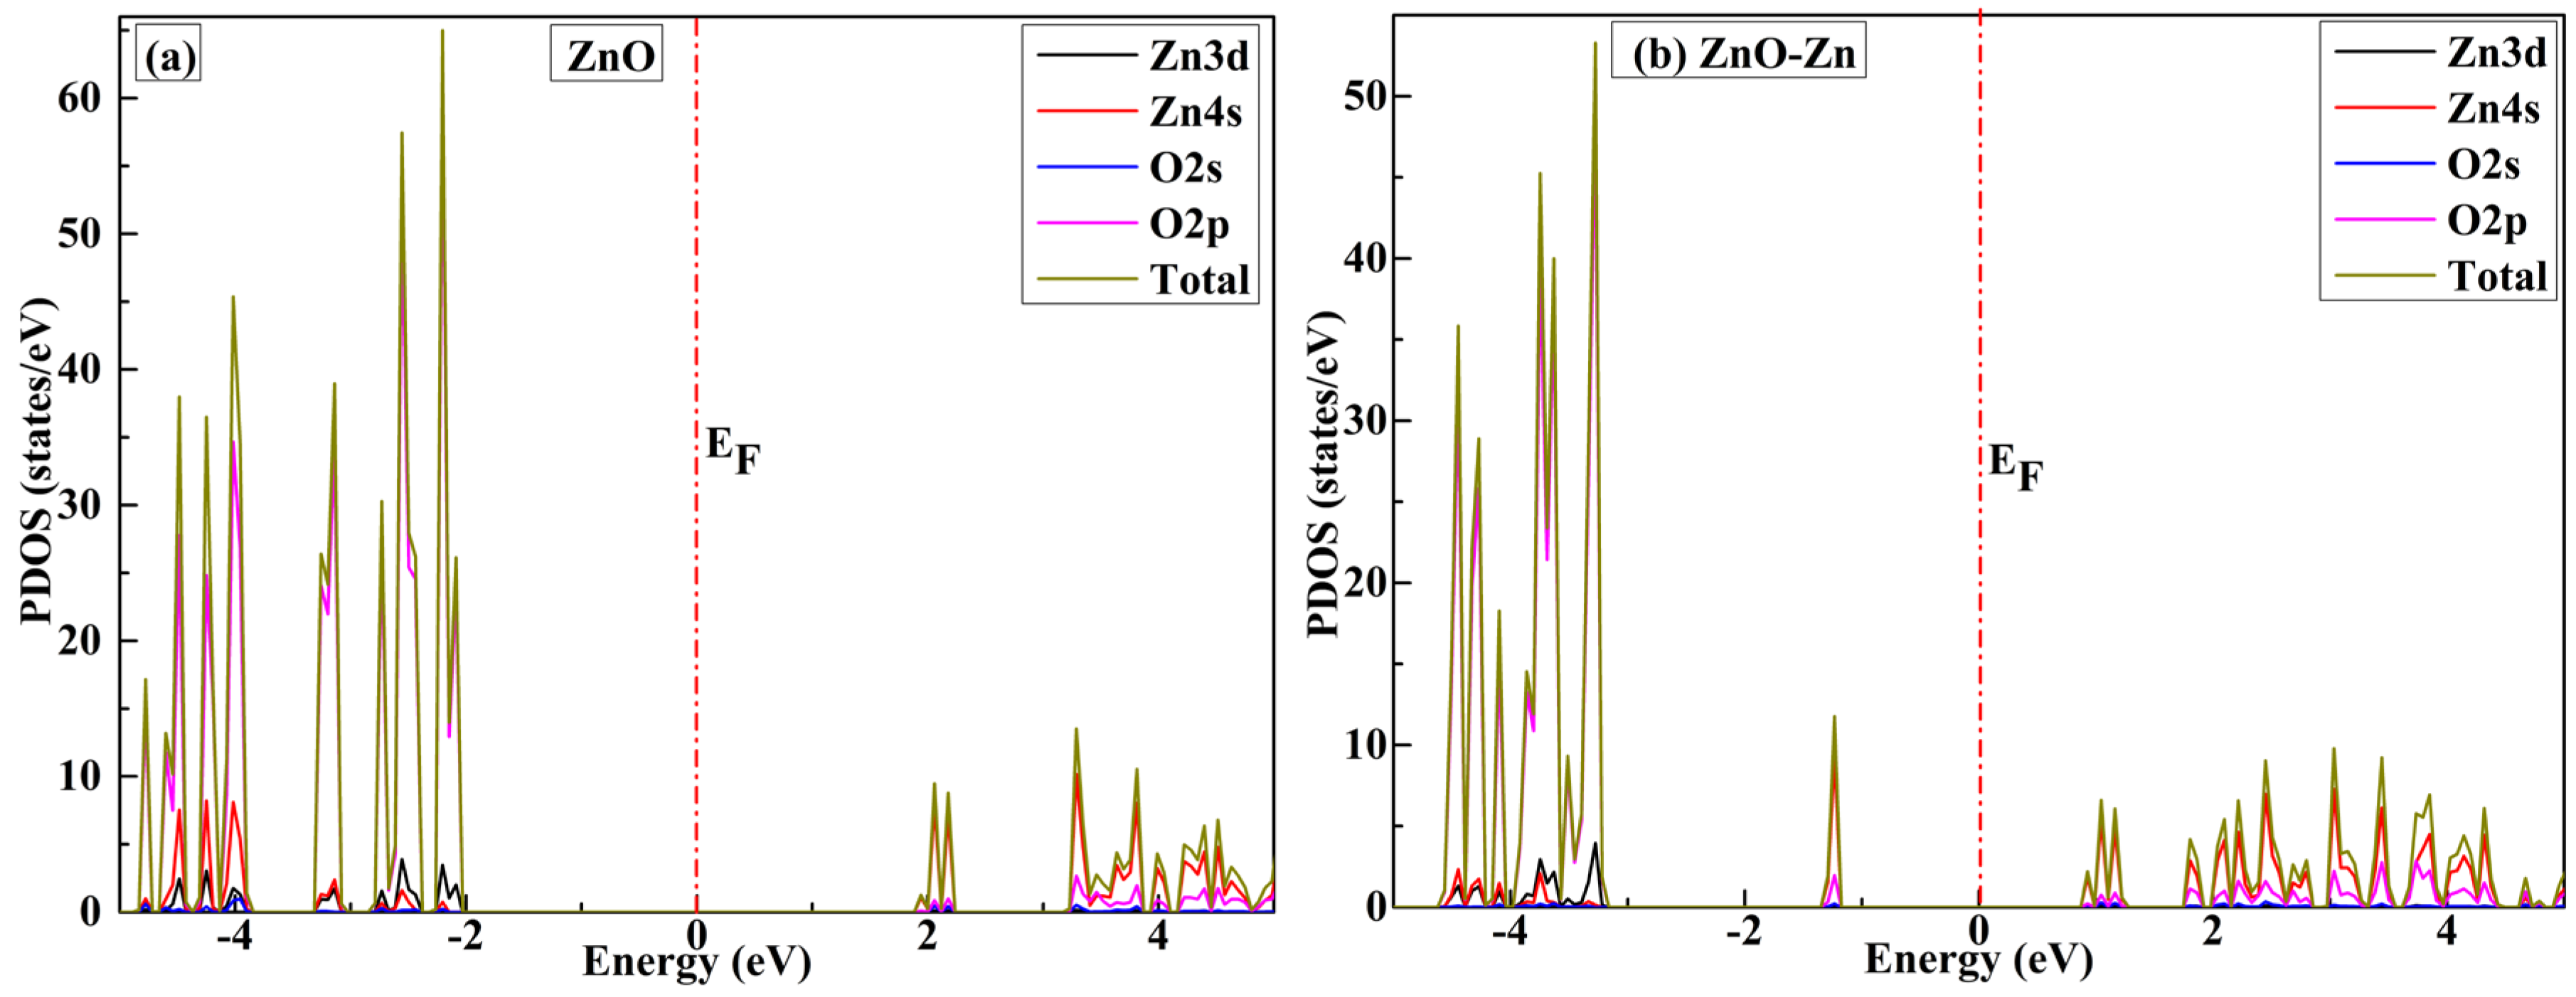
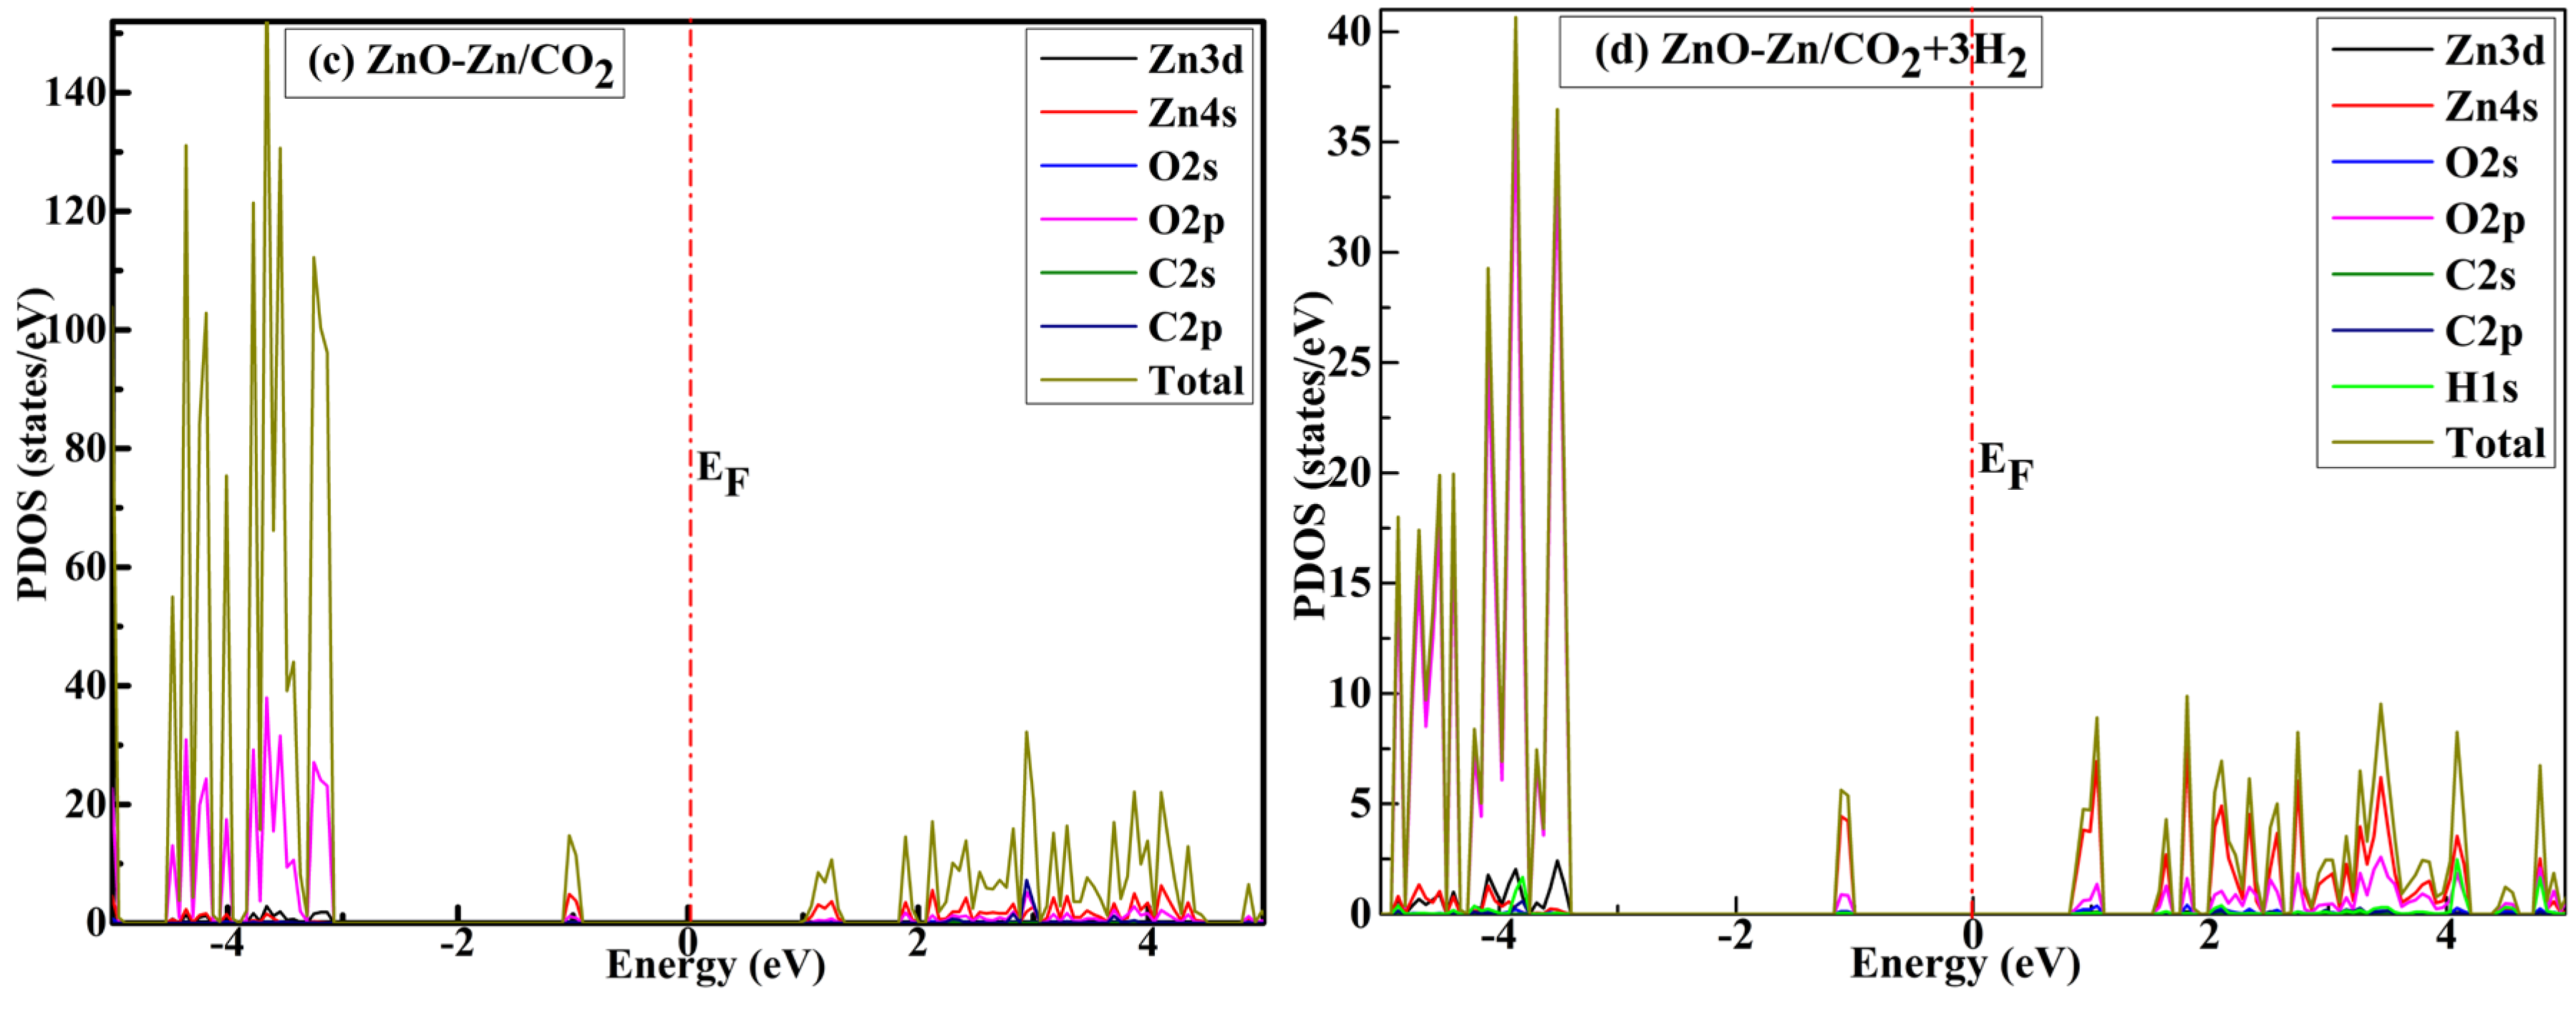
Figure 8.
Improved optical absorption of the Zn-decorated ZnO nanocage after CO2 and complex adsorption, as obtained using the HYBRID DFT + U method.
Figure 8.
Improved optical absorption of the Zn-decorated ZnO nanocage after CO2 and complex adsorption, as obtained using the HYBRID DFT + U method.
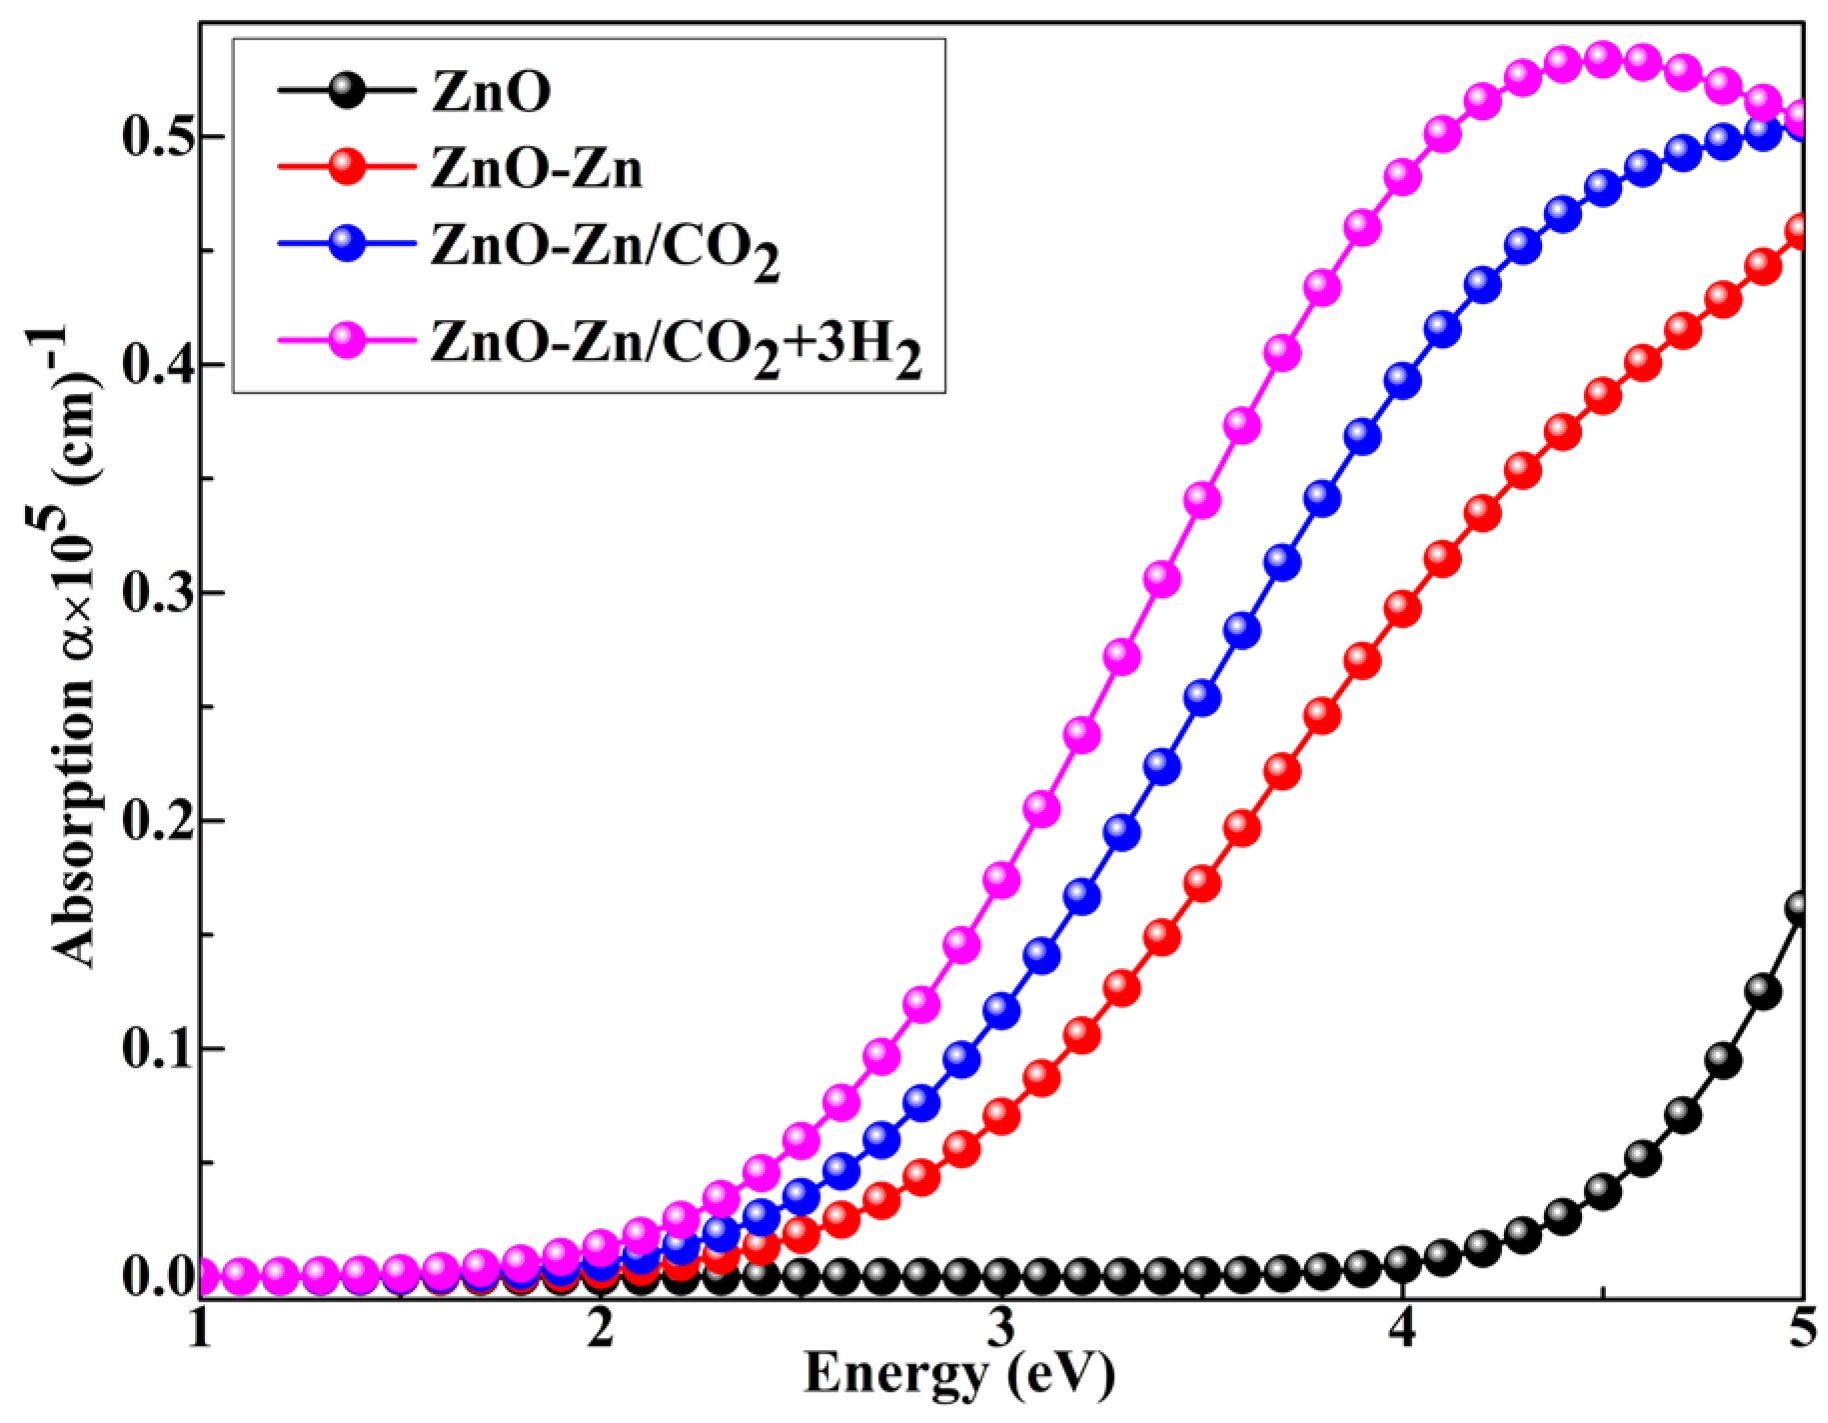
Figure 9.
Improvement in the optical conductivity of the Zn-decorated ZnO nanocage after CO2 complex adsorption, as obtained using the HYBRID DFT + U method.
Figure 9.
Improvement in the optical conductivity of the Zn-decorated ZnO nanocage after CO2 complex adsorption, as obtained using the HYBRID DFT + U method.
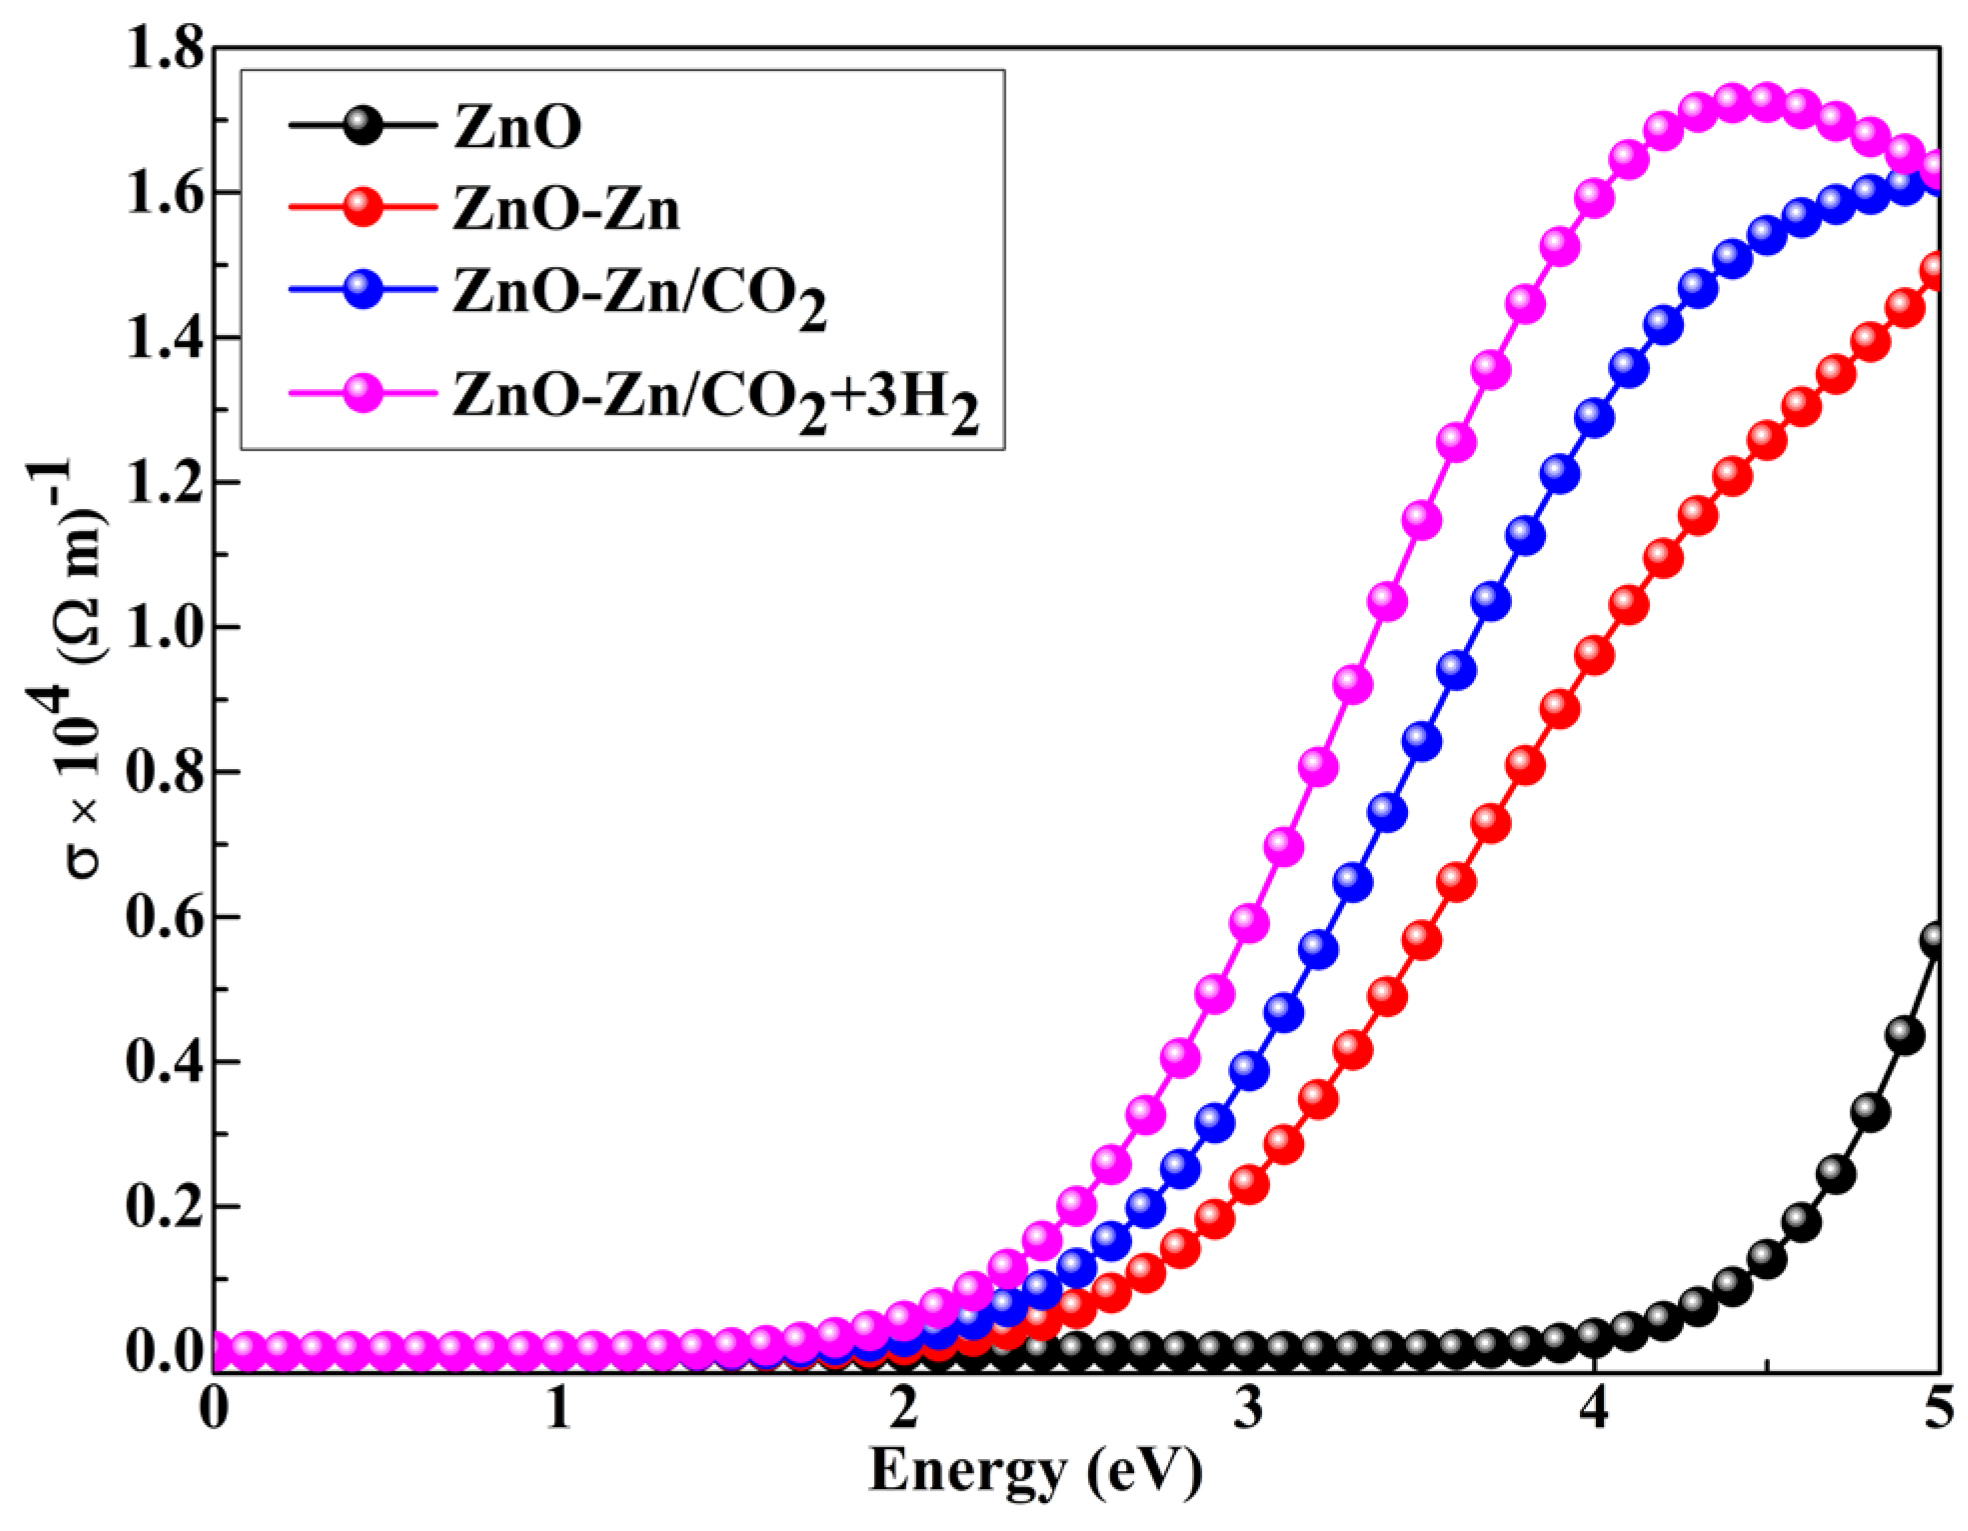
Table 2.
Bandgap energy (, eV), adsorption energy (, eV), and sensitivity (S, %) of the pristine ZnO nanocage, Zn-decorated ZnO nanocage, and complex compositions of the ZnO nanocage.
Table 2.
Bandgap energy (, eV), adsorption energy (, eV), and sensitivity (S, %) of the pristine ZnO nanocage, Zn-decorated ZnO nanocage, and complex compositions of the ZnO nanocage.
| System | sensitivity (%) | |||||
|---|---|---|---|---|---|---|
| ZnO | - | 1.92 | -2.13 | 4.05 | - | - |
| ZnO/CO2 | - | 1.28 | -2.85 | 4.13 | - | - |
| ZnO-Zn | -0.85 | 0.89 | -1.29 | 2.18 | 46 | - |
| ZnO-Zn/CO2 | -0.14 | 1.01 | -1.04 | 2.05 | 50 | -49.38 |
| ZnO-Zn/CO2 + 3H2 | -0.081 | 0.77 | -1.10 | 1.87 | 55 | - |
Table 3.
Temperature (K), sensing response (Sr %), and recovery time (tr, s) after CO2 adsorption on the Zn-decorated (ZnO)12 nanocage.
Table 3.
Temperature (K), sensing response (Sr %), and recovery time (tr, s) after CO2 adsorption on the Zn-decorated (ZnO)12 nanocage.
| System | Temperature | Sensing Response | Recovery time |
|---|---|---|---|
| ZnO-Zn/CO2 | 300 | ||
| 320 | |||
| 340 | |||
| 360 | |||
| 380 | |||
| 400 |
Table 4.
The ionization potential, electron affinity, Mulliken electronegativity, softness, hardness, chemical potential, and electrophilic index (all in eV) were calculated, as was the charge transfer of the different complexes.
Table 4.
The ionization potential, electron affinity, Mulliken electronegativity, softness, hardness, chemical potential, and electrophilic index (all in eV) were calculated, as was the charge transfer of the different complexes.
| Chemical characteristics | ZnO | ZnO/CO2 | ZnO-Zn | ZnO-Zn/CO2 | ZnO-Zn/CO2+3H2 |
|---|---|---|---|---|---|
| Ionization Energy I (eV) | 2.13 | 2.85 | 1.30 | 1.0351 | 1.1053 |
| Electron affinity A | -1.92 | -1.28 | -0.90 | -1.0112 | -0.773 |
| Chemical hardness η | 2.03 | 2.07 | 1.095 | 1.0232 | 0.948 |
| Chemical softness s (eV)-1 | 0.25 | 0.242 | 0.50 | 0.489 | 0.5343 |
| Electronegativity χ (eV) | 0.105 | 0.785 | 0.198 | 0.01195 | 0.169 |
| Chemical-potential µ (eV) | -0.105 | -0.785 | -0.198 | -0.01195 | -0.169 |
| Electrophilic-index ԝ (eV) | 0.011 | 0.64 | 0.0214 | 7.3054 x 10-05 | 0.0134 |
| Charge transfer (ΔN) | - | - | - | -0.046 | 0.0296 |
Disclaimer/Publisher’s Note: The statements, opinions and data contained in all publications are solely those of the individual author(s) and contributor(s) and not of MDPI and/or the editor(s). MDPI and/or the editor(s) disclaim responsibility for any injury to people or property resulting from any ideas, methods, instructions or products referred to in the content. |
© 2024 by the authors. Licensee MDPI, Basel, Switzerland. This article is an open access article distributed under the terms and conditions of the Creative Commons Attribution (CC BY) license (https://creativecommons.org/licenses/by/4.0/).
Copyright: This open access article is published under a Creative Commons CC BY 4.0 license, which permit the free download, distribution, and reuse, provided that the author and preprint are cited in any reuse.


