
Submitted:
04 July 2024
Posted:
08 July 2024
You are already at the latest version
Abstract
High-power output and high conversion efficiency are crucial in the study of microfluidic microbial fuel cells (MFCs). In our previous work, we attempted various methods to increase the power density of the MFCs, but nutrient consumption was limited to the bottom (electrode) layer of the microfluidic channel due to the diffusion limitations. In this work, long-term experiments were conducted on a new 4-electrode microfluidic MFC design, which grew Geobacter sulfurreducens biofilms on upward- and downward-facing electrodes in the microchannel. It was discovered that inoculation and growth of the electroactive biofilm did not proceed as fast as the downward facing anode, which we hypothesize is due to gravity effects that negatively impacted bacterial settling on that surface. Rotating the device during the growth phase resulted in uniform and strong outputs from both sides, yielding individual power densities of 4.03 and 4.13 W m-2, which was increased to nearly double when the top- and bottom-side electrodes were operated in parallel as a single 4-electrode MFC. Similarly, acetate consumption could be doubled with the 4-electrodes operated in parallel.
Keywords:
microfluidics
; microbial fuel cells
; electrogenic bacteria
; Geobacter sulfurreducens
; bioelectrochemical systems
; bioelectrochemistry
; power density
; conversion efficiency
1. Introduction
Bioelectrochemical systems (BESs), which combine biology and electrochemistry, play a key role in producing electricity or synthesizing chemicals.[1] As a novel technology, BESs have various applications, including wastewater treatment, [2-8] electricity production, [9-12] environment remediation, [13-15] chemical synthesis, [16, 17] and biosensors. [18, 19] Common BESs include microbial fuel cells (MFCs) [20-22] and microbial electrolysis cells (MECs). [23, 24] In MFCs, chemical energy is converted into molecular products, such as hydrogen and methane. [16] In all BESs, electrogenic bacteria are indispensable. These usually form anaerobic electroactive biofilms (EAB) which grow on the anode. Geobacter sulfurreducens, is the most well-studied electrogenic bacteria, which form anode-adhered EABs. [24, 25] Anode-adhered EABs catalyze the oxidation of organic molecules, producing electrons as shown for acetate in equation 1.
CH3COO-+H2O→CO2+7H++8e-
After their production, electrons are externally transferred through the EAB until they reach the anode via conductive pili and external cytochrome enzymes. After injection into the anode, electrons enter an external electrical circuit which is connected to the cathode. The current flowing through the external circuit do work before finally being consumed in a reduction reaction at the cathode. Ferricyanide is often used as the catholyte during reactor development because its fast reduction kinetics eliminate reaction bottlenecks and the performance of the anode-adhered EAB can be studied (equation 2).
Fe(CN)63-+e-→Fe(CN)64-
Typically, an ion transport membrane is placed between the anode and cathode chambers, which selectively transport certain ions while separating the other solution constituents. Typically, this is a proton exchange membrane that enables H+ produced in equation 1 at the anode to participate in oxygen reduction reactions at the cathode in equation 2. It should be mentioned that anion exchange membranes have recently been demonstrated to produce among the highest power densities (approximately 9 W m-2) by admitting OH- to the anode chamber to counteract EAB acidification. [26]
After years of continuous MFC development, the emergence of small MFCs have been demonstrated to provide high power densities with diverse applications such as portable and even implantable energy sources, [27, 28] as well as others. [29] Among such small devices, microfluidic MFCs have many advantages, including laminar flow [30-32] reduced sample volume and low-cost. Recently, the problem of gas diffusion through typical microfluidic fabrication material, polydimethyl siloxane, was solved. [20] Since then, our group has exploited highly predictable flow properties around EABs in microchannels and constant replenishment of reagents, to minimize boundary layers, [33] to counteract the common problem of power overshoot, [34] and to optimize of operational conditions and protocol. These works have culminated in demonstrations of among the highest power- and current-densities ever recorded in miniaturized MFCs. [21, 35] Other authors have also been able to exploit microfluidic MFCs with simulations, adding deeper potential for optimization of outputs and comprehension of fundamental mechanism. [36, 37]
While microfluidic channels benefit from high surface area to volume ratios, until now, microfluidic MFCs have generally fallen short of fully exploiting this, using instead just a fraction of the available wall space to mount electrodes. This limits coulombic efficiency (CE) because diffusion limitations prevent complete transport of nutrient molecules from reaching the EAB. In this study, a new 4-electrode microfluidic MFC design was tested with the goal to maximize the reactive surface area available within the device. After overcoming challenges in achieving uniform EAB performance on both anodes, we connected electrodes in different configurations and analyzed their power, internal resistance and columbic efficiencies at different EAB ages and flow rates. It is demonstrated that under optimal conditions the 4-electrode setup significantly outperformances its 2-electrode microfluidic MFC counterpart.
2. Methods and experiments
2.1. Fabrication of 4-electrode microfluidic MFC
The 4-electrode microfluidic microbial fuel cell (MFC) was constructed using 2 identical microchannel layers, each containing 2 embedded graphite electrodes, as shown in Figure 1. This is the same process described previously, [20] except two electrode-containing microfluidic layers are fabricated and bonded together instead of one layer being sealed with a passive glass layer. To maintain the same channel height as for the previous work, both electrode-containing microfluidic layers were 80 µm thick, resulting in a channel height of 160 µm in total. To summarize the fabrication process in this work, each electrode-containing microfluidic layer was fabricated from polydimethylsiloxane (PDMS) (Sylgard184, Dow Corning, Canada) with two embedded graphite electrodes in a side-by-side configuration, rather than face-to-face preferred by some authors. [38] This was accomplished by first placing the electrodes in contact with the channel feature of the photoresist mould, and then by casting PDMS against the assembly, so that the electrodes became embedded after solidification. This was followed by bonding the two layers together (Figure 1a,b). In this work we used so-called bridge electrodes, which reduced the potential for leaking and enabled flexible placement of the electrode within the channel as described previously. [35] The device was designed to have the two electrodes on each electrode-containing microfluidic layer placed 4 mm apart (Figure 1c), resulting in an electrode/channel contact of 10 mm (downstream) by 4 mm (laterally). To avoid air intrusion, glass was bonded on the top and bottom of the assembled device and epoxy was applied to all tubing and exposed PDMS surfaces as seen in Figure 1d.
2.2. Preparation of G. sulfurreducens electrogenic bacteria and medium solution
The nutrient solution was prepared by dissolving the following chemicals in 1 L of distilled water: 1.5 g NH4Cl, 0.6 g NaH2PO4, 0.1 g KCl, 2.5 g NaHCO3, 0.82 g CH3COONa (10 mM), 0.1 g L-cysteine hydrochloride, 10 mL vitamin supplement ATCC® MD-VS™, and 10 mL trace mineral supplement ATCC® MD-TMS™. The fumarate solution, used as the electron acceptor for electrogenic bacteria, was prepared by adding 1.6 g Na2C4H2O4 (40 mM) in 200 mL nutrient solution described above. Before adding the fumarate and vitamin/trace mineral supplements, the solution containing all the chemicals mentioned above was autoclaved at 110°C and 20 PSI for 15 min. After cooling down to room temperature, we added the sterilized vitamin/trace mineral supplements into solution and added fumarate into 200 mL solution. The pH was adjusted to 7. The nutrient medium was then moved to the anaerobic glove box, and oxygen in solution was removed overnight. In addition, 50 mM potassium ferricyanide (K3[Fe(CN)6]) was prepared as the electron acceptor for the microfluidic MFC. It was dissolved in a 0.1 M phosphate-buffered saline (PBS) solution consisting of 75.4 mM sodium phosphate dibasic (Na2HPO4) and 24.6 mM sodium phosphate monobasic (NaH2PO4) in distilled water. All chemicals were obtained from Sigma-Aldrich (Canada). [20]
Frozen beads containing G. sulfurreducens (strain PCA, ATCC 51573) were removed from -80 °C storage temperature by growing in a fumarate-containing nutrient medium. After 7-10 days in an anaerobic glove box, subcultures were ready for inoculation into the microfluidic MFC. This was conducted in parallel with a coflowing with ferricyanide as catholyte using two separate syringe pumps (New Era Pump Systems Inc, Farmingdale, NY 11735, US), one for the anolyte and one for the catholyte. After 24 hours, the inoculum was replaced by a sterile acetate source without any fumarate. The flow rate of acetate solution is defined as QAc and ferricyanide is defined as QFe.
2.3. Calculations
The anodes and cathodes were electically connected through an external resistor box to close the circuit between them. According to Ohm’s law, the current (I) passing between the anode and cathode, through the external resistor (Rext), can be calculated by the potential (U) across the external resistor and the external resistor value (Rext) set on resistor box (equation 3):
The power (P) can be calculated as follows (equation 4):
P = UI
A potentiostat (PARSTAT MC, Princeton Applied Research, Oak Ridge, USA) was connected across the Rext to conduct standard measurements, the most basic among them to measure the cell potential. It should be noted that this system did not have a reference electrode, therefore the counter and reference leads to the potentiostat where both connected to the cathode, and the working lead was connected to the anode. This setup was also used to generate polarization curves (U versus I) by applying linear scan voltammetry (LSV) or by switching external resistor values (known as the constant resistance-technique). The scan rates used were no higher than 2 mV s-1. Using equation 4, power density curves were generated and the maximum power point was determined. The external resistance (and equivalently the current) which provides the maximum power, is obtained when Rext=Rint. [20] Therefore, the optimal Rint was obtained from equation 3 after given the current and voltage values at the maximum power point.
Power and current were normalized to compare with other systems, especially at different size-scales (equation 5).
where N is a normalization constant that can be calculated in different ways to account for the system limitations. In some systems where the anode area is not limiting (e.g., macro-systems using brush anodes), it has been shown that the membrane area between the anode and cathode compartments should be used for normalization. [39] Preliminary studies on microfluidic MFCs have shown that electrolyte contact between anode and cathode compartments is limiting, [21] therefore, we normalize by the microchannel cross-section, using N=1.6 mm2 in equation 5, as done previously. [21, 35]
In addition, the consumed concentration of acetate (Δ[Ac]) is calculated as follows (equation 6):
Here, I is the raw current and is the flow rate of acetate. F=96,485 C mol−1, n is the number of electrons produced per molecule of acetate that is oxidized. This is usually taken as 8, based on equation 1, however, recently it has been shown that at high [Ac] (e.g., >5 mM) n may be reduced by as much as 10% due to adjustments in bacterial metabolism to support biomass growth. [40] Unless otherwise stated, we use n=8 in this work.
2.4. MFC configurations
Different electrical configurations were tested for the 4-electrode microfluidic MFC. First, we consider each pair of electrodes in separate layers in Figure 1a and 1b as a different MFC (MFCa and MFCb). By connecting both anode and cathode pairs in MFCa and MFCb, we could also obtain a parallel-stacked MFC (MFCa||b). These configurations are shown in Figure 2.
2.5. SEM Imaging and image analysis
Scanning electron microscopy (SEM) was conducted to observe the morphology, thickness, and distribution of the biofilm attached to the surface of the anode. First, a fixation solution (2.5% glutaraldehyde (C5H8O2) in phosphate buffer) was flowed through the channel at a flow rate of 0.5 mL h-1 for 2 h in a fume hood. Then, both anode electrodes were cut out from the device and then soaked in the same fixation solution overnight. The next day, the electrodes were rinsed 3 times for 5 min in 0.1 M cacodylate buffer (Na(CH3)2AsO2), then post-fixed in 1% osmium tetroxide (OsO₄) for 90 min, and washed again 3 times for 5 min in cacodylate buffer. Subsequently, they were dehydrated through a graded ethanol series (30%, 50%, 70%, 90%, 95%, 100%) 10 min each, followed by two washes in 100% ethanol for 20 min. The electrodes were then dried with CO2 in a critical point dryer (Ladd Research Industries #2800, Essex Junction, VT, US) for 45 min and mounted on aluminum stub (#75260, EMS) using aluminum-backed carbon tabs (#77828-08, EMS). Finally, the stubs were gold-sputtered using a SEM 950x/350s sputter coater and top-view SEM image were obtained (JEOL 6360LV, JEOL Ltd., Tokyo, Japan). Cross-section SEM images were collected next, by plunging electrodes into liquid N2 for 2 min, cracking with tweezers, followed by immersion into 100% ethanol to avoid moisture condensation on the specimen. The previous steps were repeated, starting with critical point drying, for observing the side view and obtaining the thickness of biofilm. Image analysis of SEM images was used to obtain EAV thickness using software (ImageJ, National Institutes of Health, USA).
2.6. Computational fluid dynamics simulations
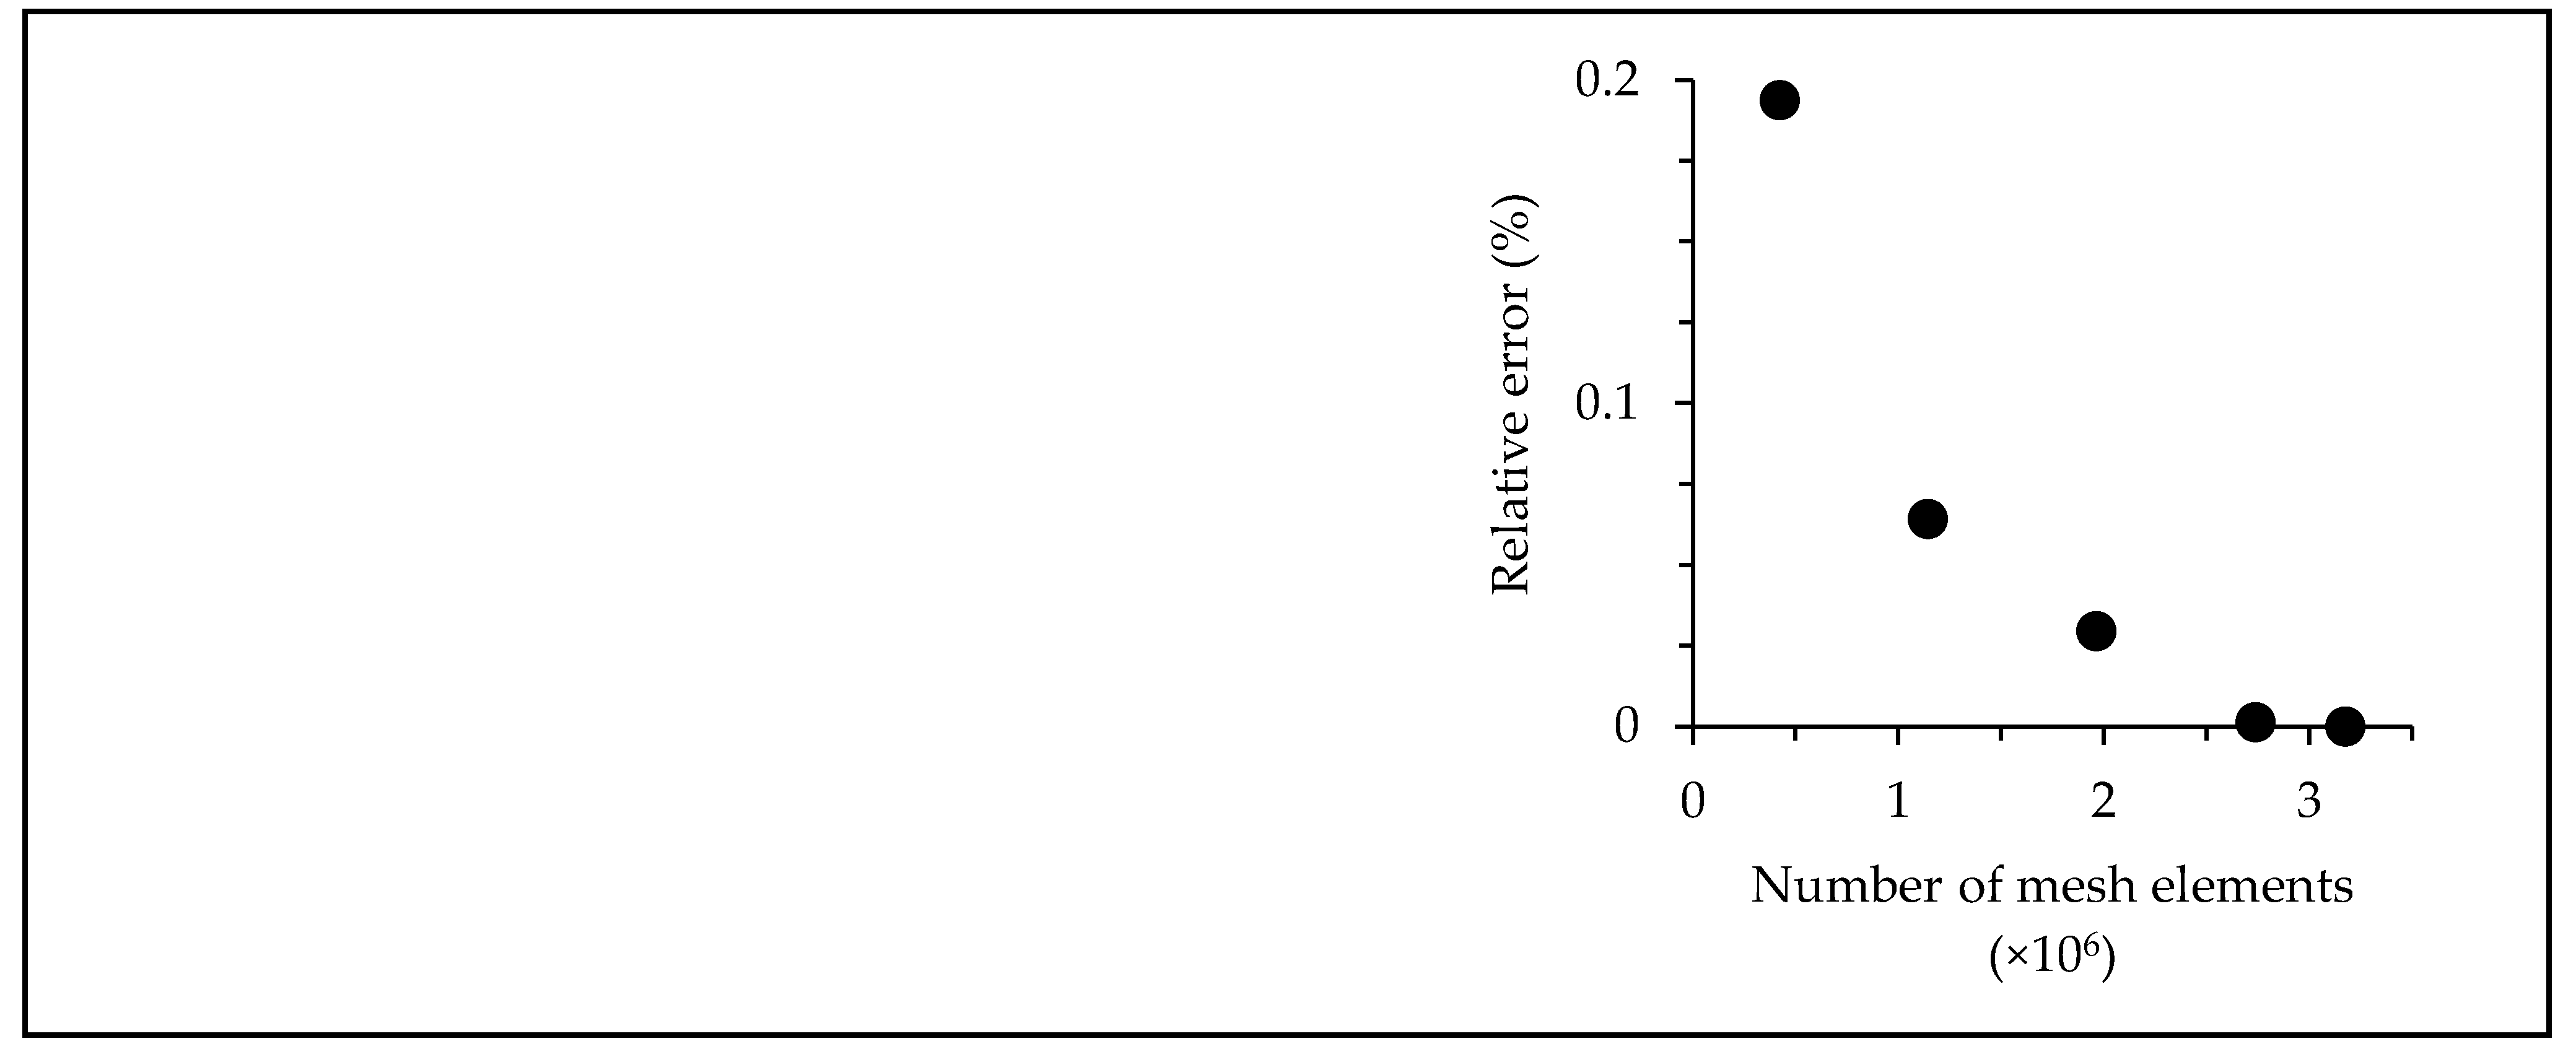
A three-dimensional computation fluid dynamics model (COMSOL, Inc., Stockholm, Sweden) was used to monitor the conversion at electrode surfaces in 2- and 4-electode MFCs at 25oC. The model included physics for electrochemical processes at the electrode, enabling generation of simulated polarization curves, and sensitivity analysis of polarization losses from including ohmic, mass transfer, and charge transfer limitations. The model consisted of three domains: (1) a solid anode-adhered EAB anode (2) an electrolyte region, and (3) a solid cathode. A physics-controlled meshing technique was employed to optimize mesh geometry. We used a “finer” mesh which included approximately 2.7 x10⁶ mesh elements and obtained relative mesh error of 1.3 ×10⁻³ % and was converging to 0% error compared to the maximum mesh density that the software could provide.

Table 1.
Summary of mesh independence analysis results.
| Pre-set mesh density | Number of mesh elements | Relative error (%) |
| Coarse | 421,983 | 0.19379 |
| Normal | 1,142,143 | 0.06420 |
| Fine | 1,964,457 | 0.02939 |
| Finer | 2,738,854 | 0.00130 |
| >Extra fine | 3,173,758 | 0 |
3. Results and Discussion
3.1. Growth of G. sulfurreducens in 4-electrode MFC
G. sulfurreducens were inoculated into the system with MFCa and MFCb being electrically separated via a connection to a separate external resistor (initially Rext=100 kΩ for both). This enabled separate monitoring of the growth and maturation process on the top (MFCa) and bottom (MFCb) sides (Figure 3a). We found that both MFCs matured to a stable voltage after 9 days, however MFCb (bottom side) produced significantly stronger voltage and current (Figure 3b). The better performance of the bottom MFC allowed for the application of lower Rext values, thus promoting further increases in current (equation 3) and power (equation 4).
The resistors were gradually reduced for both MFCs as the system matured, according to Table 2. At the end of the first growth analysis window (ca. 15 days) the bottom MFC (MFCb) produced significantly higher current (29.7 μA) compared to the current from the top MFC (MFCa; 11.6 μA). We repeated preliminary growth 5 times in separately fabricated 4-electrode MFCs under the same conditions (flow rates and concentrations). In each case the bottom MFC produced stronger output than the top MFC, leading to the hypothesis that gravity played a role in EAB growth efficiency. The reader is directed to the Supporting Information where polarization and power density curves from two such replicates are presented after between 2-3 weeks of culture, all showing higher performance of the bottom MFC, independent of measurement conditions: flow rate or measurement technique (the constant resistance technique or by LSV). To investigate the hypothesis that gravity was the reason for the preferential growth on the bottom MFC and not, for example, asymmetries the top and bottom side fabrication or world-to-chip connections, we flipped the device after about 2 weeks, placing the initially bottom-side MFC (MFCb) on the top side, and vice-versa and left the device to acclimate to the new conditions. Data after about 3 weeks total growth time shows that the difference in current between both MFCs had decreased, mainly due to the increase in current from MFCa to nearly 20 μA (Figure 3c), with nearly no impact on MFCb. We electrically connected the two MFCs into the MFCa||b (parallel) configuration and allowed the system to grow until approximately 2 months at an external resistance of Rext=10 kΩ (Figure 3c). After electrical separation, both currents were approximately the same (with Rext=10 kΩ for both MFCa and MFCb), indicating that the culture under flipped conditions helped to normalize performance of both MFCs. To investigate if these improvements in the MFCa were permanent or reversible, we flipped the device a second time. Long-term measurements of the individual MFCs outputs were stable in time indicating that the system had previously reached full optimized maturity and gravity no longer played a role (Figure 3d).
3.2. Power and current outputs at different ages
To assess if the maximum power for the a 4-electrode MFC was significantly improved over the 2-electrode MCFs, we collected LSV curves, after final maturity had been achieved. We collected polarization and power density curves of MFCa, MFCb, MFCa||b after about 10 weeks. As seen from Figure 4, the power density (PA as normalized by channel cross-section) for MFCa and MFCb when electrically separated during LSV tests were nearly identical (PA=4 W m-2). This demonstrates the crucial role of inverting the MFC within the first 3 weeks of initial growth. Unsurprisingly, when the polarization and power density curves were collected for the MFCa||b (using a potentiostat to conduct LSV), the measured maximum power density had nearly doubled to PA=7.09 W m-2. Based on the maximum power points for each power density plot, the internal resistance (Rint) for MFCa, MFCb, were each calculated to be approximately Rint=15 kΩ, while Rint for MFCa||b was nearly half this value.
Another objective for the 4-electrode MFC was to increase the acetate conversion efficiency. We analyzed Figure 4 based on the maximum current produced. At a flow rate of 4 mL h-1 and Rext corresponding to the respective Rint values, the maximum current density was 8.49, 9.29, 18.23 A m-2 for MFCa, MFCb, and MFCa||b, respectively. Using equation 4 we calculated the change in acetate concentration as Δ[Ac]=0.102 mM for MFCa||b compared to half of that value for either MFCa or MFCb individually. While this only represents about a 1% change in concentration, this is significantly higher than previous works using similar flow rates. [20] It should be noted that a significant overshoot in the Figure 4 data indicates that the measurements scan rate might have been too high for the MFCs to respond properly, resulting in artificially low currents on the high current side of the power and polarization density curves. [34] We show power density and polarization curves for lower flow rates (QAc=0.4 mL h-1, QFe=0.2 mL h-1) in the Supporting information (Section S2).
3.3. Flow effect on MFC performance
After demonstrating how to avoid disparities between the performance of top and bottom MFCs, resulting in a near doubling of current and power densities the 4-electrode MFC (MFCa||b), we investigated the impact of experimental parameters on these outputs, notably the flow rate. It is well-known, that outputs can be further increased with flow rates, however, high flow rates also reduce hydraulic retention time in the MFC. This limits interaction time between the acetate solution and the anode-adhered EAB. Therefore, for high acetate conversion, acetate flow rate (QAc) should be reduced, as predicted by equation 6. We evaluated performance of the mature system (˃ 10 weeks) under flow rates ranging from 0.1 to 20 mL h-1. The resulting power densities are plotted in the Figure 5a for MFCa||b and individual electrode pairs comprising MFCa and MFCb (note the semi-log plot). The figure shows a rapid increased in PA versus QAc at low flow rates and became stable at high flow rates. On the other hand, when normalizing power and current by QAc, the opposite trends were observed (data not shown). That is, flow rate normalized power, previously referred to as volumetric consumption rate (VCR)-normalized power, PVCR, [21] (also known as normalized energy recovery, NER [41]) was increased to PVCR=7 mW L-1 d at QAc=0.1 mL h-1 for MFCa||b. Flow rate-normalized current, is nothing more than Δ[Ac], [21] represented by equation 6. We calculated Δ[Ac] and confirmed that it increased with the same trend of PVCR when reducing QAc, reaching Δ[Ac]=2.27 mM at QAc=0.1 mL h-1 for the MFCa||b. In other words, the conversion was 22.6%, or approximately twice that of individual electrodes pairs (in MFCa and MFCb). These results are highlighted in Figure 5b. We note that recent studies show that the electron generation may be lower than 8 per molecule of acetate at high concentrations due to a shift in the metabolism which recycles about 10% of electrons from acetate oxidation for biomass synthesis. [40] If this were true in the present case, then acetate conversion would be 25%. We also note that in the present study, the flow rate ratio between the acetate anolyte and ferricyanide catholyte solutions was 2:1. This was required to avoid catholyte cross-over to the anode-adhered EAB, indicating a device malfunction (likely partial blockage in the downstream line of the catholyte side). Eliminating this problem would reduce the QAc required for accurate co-flow interface between the two compartments, thereby increasing Δ[Ac].
3.4. Simulated concentration profiles
We conducted simulations to visualize the effect of the second pair of electrodes on the concentration profile in the microfluidic MFCa||b. Figure 6 shows the simulated concentration profile in the channel cross-section along portion of the y-direction (co-linear with the flow direction along the downstream direction) in the vicinity of the anode-adhered EAB(s). The thickness of the EABs were set at 20 µm, based on SEM imaging as discussed in the next section. The simulation results in Figure 6a revealed that in certain regions of the 4-electrode device (MFCa||b) acetate consumption was nearly five times higher than in Figure 6b for a 2-electrode device (e.g., MFCa). Specifically, the expanded electrode surface area on both the top and bottom of the 4-electrode device facilitates Ac capture by biofilms in two segregated locations, thereby increasing electron production.
3.5. SEM imaging
Following the completion of the experiment, we measured obtained SEM images to observe and measure the biofilm formation on the surface of the top and bottom anodes, as shown in Figure 7a and 7b. These images show tightly packed EABs with some fissures, though it should be noted that the fixation and dehydration processes may have changed the qualitative appearance of the EABs. Additionally, SEM cross-sections were obtained, which provided a measure of the EAB thickness. Two representative images are shown in Figure 7c and 7d, which were measured to be 19 and 26 µm, respectively.
3.6. Discussion
This paper presents the results of a newly designed 4-electrode microfluidic microbial fuel cell (MFC). The objective of this design was to enhance the conversion efficiency of acetate and improve power outputs by embedding two anodes and two cathodes on the top and bottom of the microchannel. We first highlight the interesting discovery that gravity appears to significantly influence EAB maturation based on the repeatable discrepancy in growth rates between upward and downward facing anodes. This effect has been observed in non-electroactive biofilms under low laminar flow rates, [42] and appears to have a correlation to observations that planktonic bacteria show less virulence and resistance to medication in microgravity situations. [43, 44] We believe that this observation is the first one applied to electroactive biofilms. Electroactive bacteria as sensors for real-time respirometry can also prove useful for making generalized insights into biofilm growth on inverted surfaces. In any case, this effect can have important implications for space deployment of MFC systems. And this overlooked point may actually be worse for terrestrial MFCs where negative gravitational fields are generated on downward facing electrodes, like in our system. This appears not to be a major issue for brush electrodes, which show growth on the bristle top and bottom side, likely due to the short distance between the two sides. [45, 46] However, this subject should be investigated further in the case that large, unconnected downward facing electrodes are used. For example, this should include a test of our hypothesis, based on literature reports on non-electroactive biofilms, that increased shear flow can compensate for growth-inhibition in low or negative gravity. [42] Microfluidic studies are poised to contribute to such inquiries do to the ability to generate highly controlled shear forces on chip. In the meantime, on Earth, one can oppose the negative effects on EAB growth rates on downward-facing electrodes by simply flipping the entire system during inoculation.
After overcoming gravitational effects, uniform behaviour was permanently achieved on both anode-adhered EABs, independent of their orientation after full maturation. In this state, the power output and acetate conversion of the parallel connected (MFCa||b) doubled to 7.1 W m-2 and 22%, respectively.
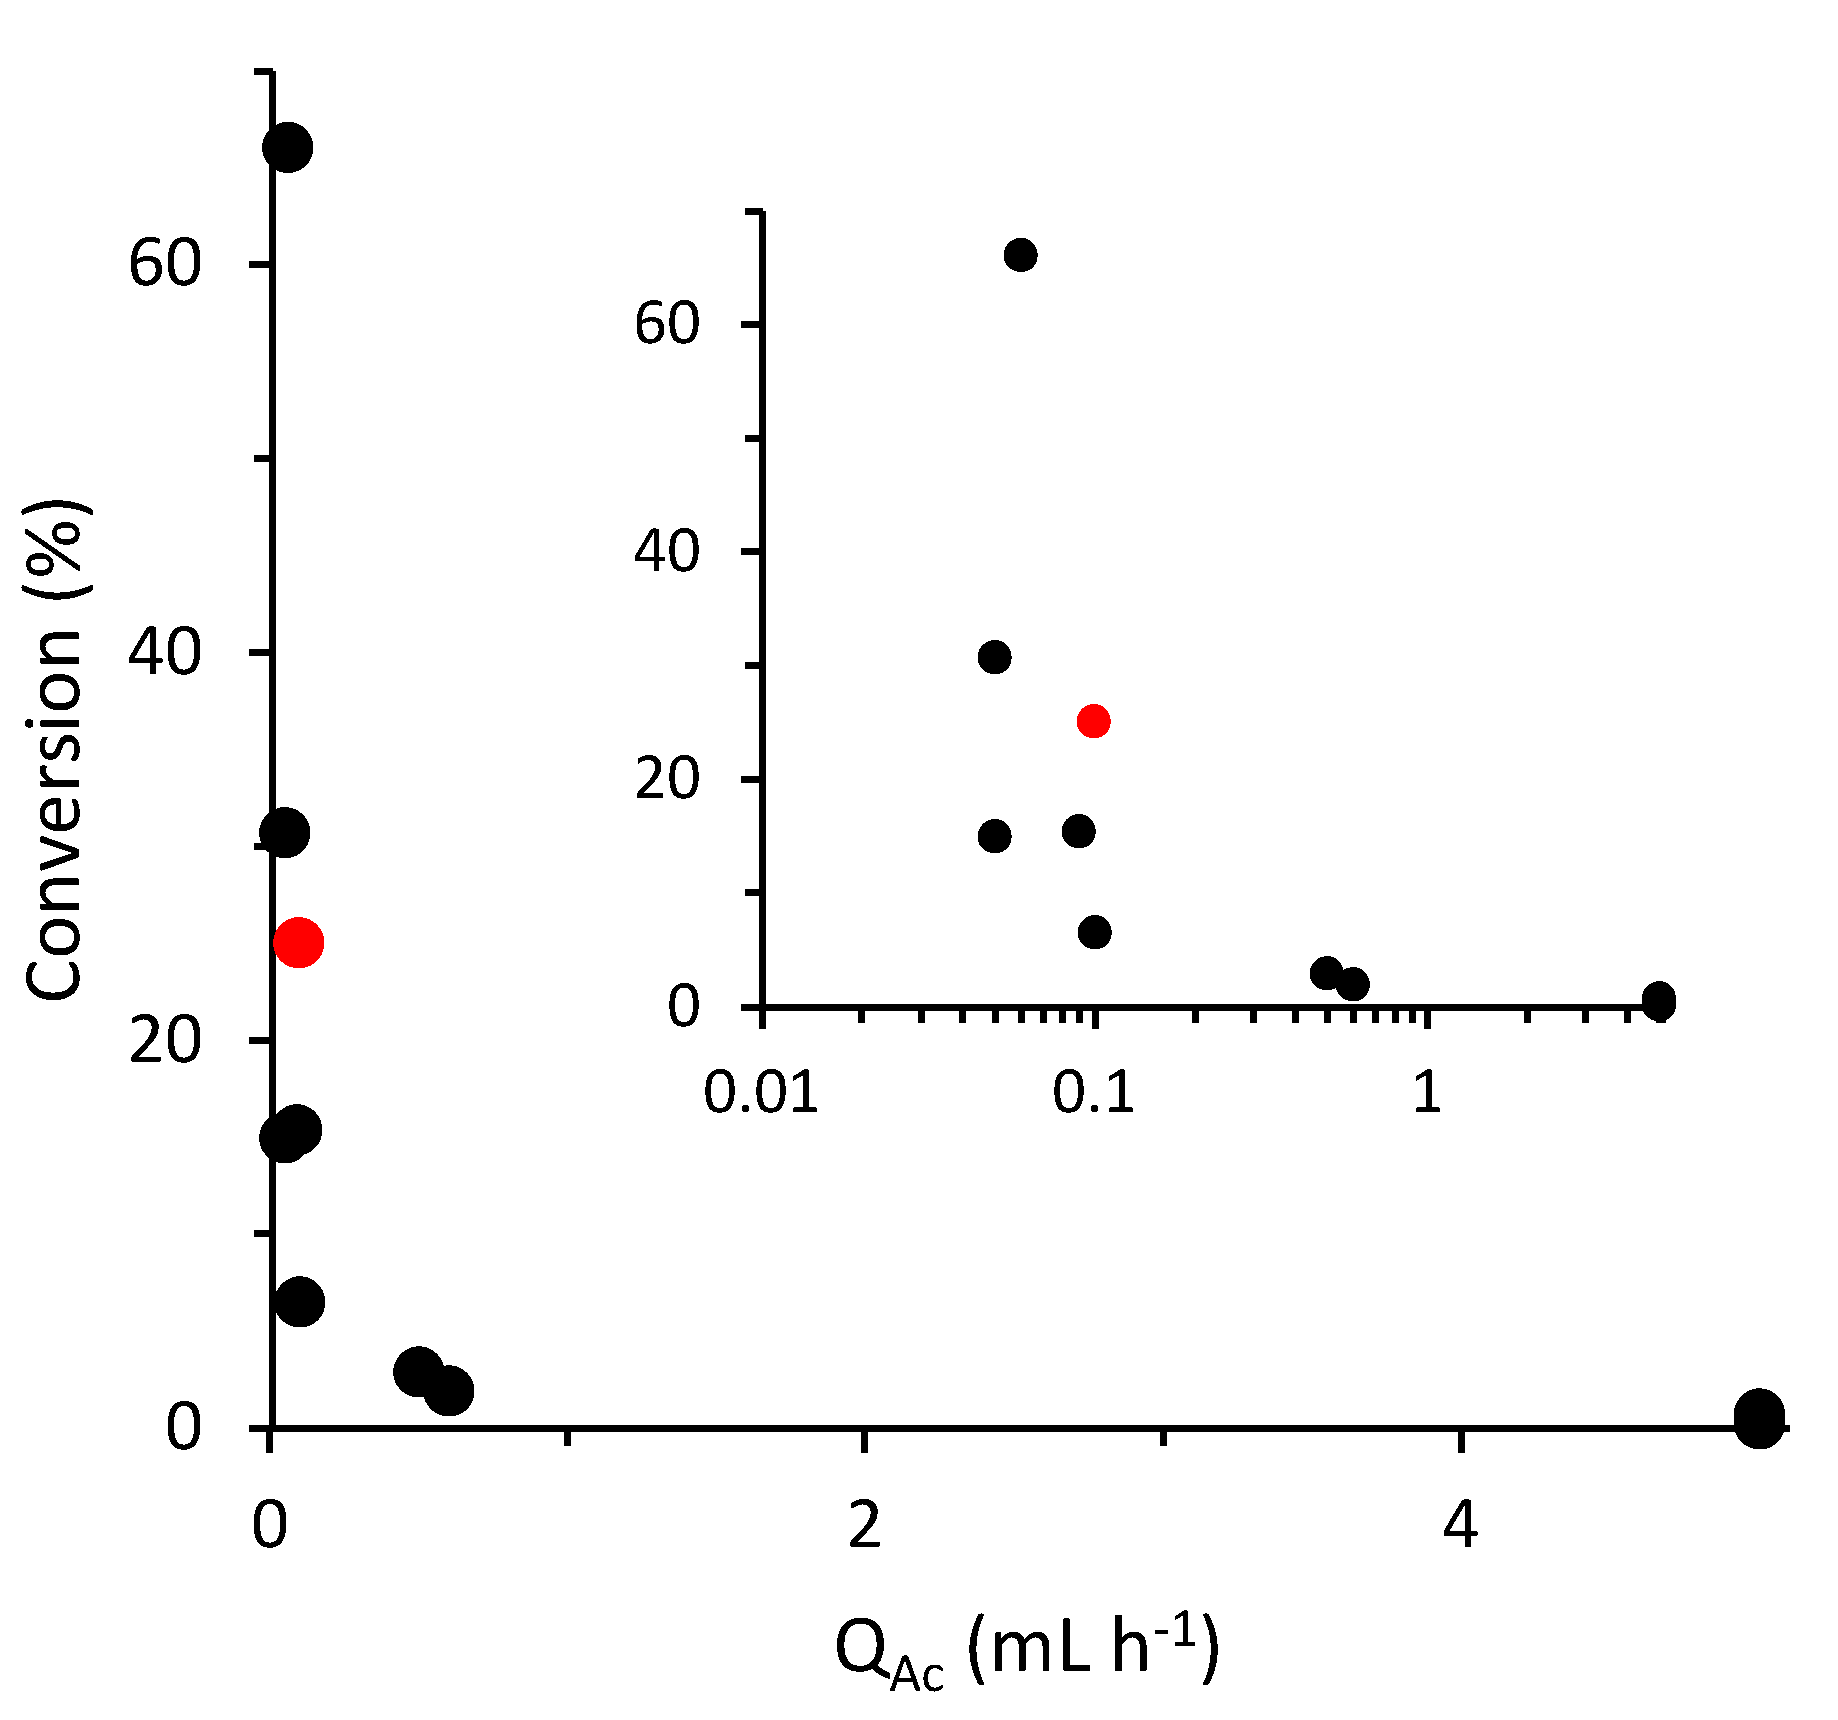
While we successfully proved the concept of a 4-electrode MFC, we note that there is room for improvement. We sampled a range of literature reports on acetate-fed microfluidic MFCs and plotted the conversion percentage based on reported current outputs and flow rates (Figure 8). [21, 22, 34, 47-52] From this figure we see that the output obtained with the current 4-electrode system was nearly the highest in the literature. Examining some of the better performing systems can give guidance on future implementations of a 4-electrode MFC. Previously, we demonstrated the major limitations of the current design, which relates to the width of the microchannel. At positions near the far electrode edges where the electric field is diminished, acetate consumption becomes rapidly reduced.[21] Thus, while the 4-electrode MFC can double the current and power outputs, reducing the electrode and channel widths is key to improving overall conversion (see Supporting Information for more details, including simulation results confirming that for the present situation). For example, previous work in our group has focused on reducing the electrode width to eliminate portions of the anode that are far from the cathode.[21] In the same work, we showed that optimizations in the channel structure could stabilize the co-flow interface, which, together, resulted in a 2-electrode MFC generated the highest power density at the time. [21] A stable co-flow interface could also help overcome the present problem whereby we were forced to use QAc˃QFe to avoid ferricyanide cross-over to the anode side, which reduced the Δ[Ac] (equation 6). In another recent paper with a 2-electrode MFC, electrode placement away from the channel wall (eliminating contact with low flow velocity anolyte solution) resulted in an MFC with the highest recorded current density of 63 A m-2,35 or about 9 times higher than we obtained for MFCb when subjected to a similar flow rate of QAc=4 mL h-1 (Figure 4). In yet another paper with a 2-electrode design with electrode separation of less than 1 mm, acetate conversion was over 30 %. It stands to reason that outputs from each of these examples could be doubled using a 4-electrode MFC and combining the critical innovations in each could provide a synergistic effect. We note that membrane microfluidic MFCs typically use anodes and cathodes in a face-to-face orientation, leaving no room for a second pair of facing electrodes as shown for the side-by-side electrode orientation used here. In such a case, exceptional conversion efficiency has been noted at very low flow rates, for example more than 65% by Choi et al.[47] However, the lack of membrane and the ability to closely place anode and cathodes in side-by-side MFCs may be able to surpass this benchmark in future systems.
4. Conclusions
A comparison of 2- and 4-electrode microbial fuel cell configurations is presented. In the 4-electrode design, individual electrode pairs (forming individual MFCs) are placed on the top and the bottom of the main flow channel. It was discovered that gravity plays a critical role in the efficacy of inoculation and initial EAB growth. This effect negatively impacts the (top side) downward facing electrodes. Apart from having implications for microgravity applications, such as in MFC deployment in space, this can be important for terrestrial MFC applications, particularly for downward-facing electrodes which experience a negative gravitational field compared to upward-facing electrodes. A methodology for permanently overcoming this problem resulted in normalized outputs from top- and bottom-side MFCs as well as power outputs and acetate conversion rates that were doubled when they were connected in parallel (i.e., a single 4-electrode MFC) reaching 7.1 W m-2 and 22% conversion. These very high values were obtained without any special adjustments to the channel geometry or flow considerations, which can both further enhance outputs in future work.
Author Contributions
Linlin Liu: data curation, formal analysis, investigation, validation, writing – review & editing. Haleh Baghernavehsi: simulation, validation. Jesse Greener: conceptualization, formal analysis, funding acquisition, methodology, project administration, resources, supervision, writing – review & editing.
Acknowledgement
The authors wish to acknowledge funding agencies Natural Sciences and Engineering Research Council of Canada (NSERC) and Sentinelle Nord for their financial. They also wish to thank Alexandre Bastien from IBIS of Université Laval for his help with SEM image acquisition and analysis.
Conflicts of Interest
The authors declare that they have no known competing financial or personal relationships that could have appeared to influence the work reported in this paper.
References
- Angelaalincy, M.J.; Navanietha Krishnaraj, R.; Shakambari, G.; Ashokkumar, B.; Kathiresan, S.; Varalakshmi, P. Biofilm engineering approaches for improving the performance of microbial fuel cells and bioelectrochemical systems. Frontiers in Energy Research 2018, 6, 63. [Google Scholar] [CrossRef]
- Arun, S.; Sinharoy, A.; Pakshirajan, K.; Lens, P.N. Algae based microbial fuel cells for wastewater treatment and recovery of value-added products. Renewable and Sustainable Energy Reviews 2020, 132, 110041. [Google Scholar] [CrossRef]
- Asim, A.Y.; Mohamad, N.; Khalid, U.; Tabassum, P.; Akil, A.; Lokhat, D.; Siti, H. A glimpse into the microbial fuel cells for wastewater treatment with energy generation. Desalination and Water Treatment 2021, 214, 379–389. [Google Scholar]
- Gul, H.; Raza, W.; Lee, J.; Azam, M.; Ashraf, M.; Kim, K.-H. Progress in microbial fuel cell technology for wastewater treatment and energy harvesting. Chemosphere 2021, 281, 130828. [Google Scholar] [CrossRef] [PubMed]
- Khandaker, S.; Das, S.; Hossain, M.T.; Islam, A.; Miah, M.R.; Awual, M.R. Sustainable approach for wastewater treatment using microbial fuel cells and green energy generation–A comprehensive review. Journal of molecular liquids 2021, 344, 117795. [Google Scholar] [CrossRef]
- Munoz-Cupa, C.; Hu, Y.; Xu, C.; Bassi, A. An overview of microbial fuel cell usage in wastewater treatment, resource recovery and energy production. Science of the Total Environment 2021, 754, 142429. [Google Scholar] [CrossRef]
- Gude, V.G. Integrating bioelectrochemical systems for sustainable wastewater treatment. Clean Technologies and Environmental Policy 2018, 20, 911–924. [Google Scholar] [CrossRef]
- Varjani, S. Prospective review on bioelectrochemical systems for wastewater treatment: Achievements, hindrances and role in sustainable environment. Science of The Total Environment 2022, 841, 156691. [Google Scholar] [CrossRef]
- Huang, S.; Zhang, J.; Pi, J.; Gong, L.; Zhu, G. Long-term electricity generation and denitrification performance of MFCs with different exchange membranes and electrode materials. Bioelectrochemistry 2021, 140, 107748. [Google Scholar] [CrossRef]
- Li, T.; Cai, Y.; Yang, X.-L.; Wu, Y.; Yang, Y.-L.; Song, H.-L. Microbial fuel cell-membrane bioreactor integrated system for wastewater treatment and bioelectricity production: overview. Journal of Environmental Engineering 2020, 146, 04019092. [Google Scholar] [CrossRef]
- Mohyudin, S.; Farooq, R.; Jubeen, F.; Rasheed, T.; Fatima, M.; Sher, F. Microbial fuel cells a state-of-the-art technology for wastewater treatment and bioelectricity generation. Environ Res 2022, 204 (Pt D), 112387. [Google Scholar] [CrossRef] [PubMed]
- Saran, C.; Purchase, D.; Saratale, G.D.; Saratale, R.G.; Ferreira, L.F.R.; Bilal, M.; Iqbal, H.M.; Hussain, C.M.; Mulla, S.I.; Bharagava, R.N. Microbial fuel cell: A green eco-friendly agent for tannery wastewater treatment and simultaneous bioelectricity/power generation. Chemosphere 2023, 312, 137072. [Google Scholar] [CrossRef] [PubMed]
- Cecconet, D.; Sabba, F.; Devecseri, M.; Callegari, A.; Capodaglio, A.G. In situ groundwater remediation with bioelectrochemical systems: A critical review and future perspectives. Environment international 2020, 137, 105550. [Google Scholar] [CrossRef] [PubMed]
- Fernando, E.Y.; Keshavarz, T.; Kyazze, G. The use of bioelectrochemical systems in environmental remediation of xenobiotics: a review. Journal of Chemical Technology & Biotechnology 2019, 94, 2070–2080. [Google Scholar]
- Syed, Z.; Sogani, M.; Dongre, A.; Kumar, A.; Sonu, K.; Sharma, G.; Gupta, A.B. Bioelectrochemical systems for environmental remediation of estrogens: A review and way forward. Science of the Total Environment 2021, 780, 146544. [Google Scholar] [CrossRef] [PubMed]
- Heidrich, E.; Dolfing, J.; Scott, K.; Edwards, S.; Jones, C.; Curtis, T. Production of hydrogen from domestic wastewater in a pilot-scale microbial electrolysis cell. Applied microbiology and biotechnology 2013, 97, 6979–6989. [Google Scholar] [CrossRef] [PubMed]
- Zhao, Q.; An, J.; Wang, X.; Li, N. In-situ hydrogen peroxide synthesis with environmental applications in bioelectrochemical systems: a state-of-the-art review. International Journal of Hydrogen Energy 2021, 46, 3204–3219. [Google Scholar] [CrossRef]
- Sevda, S.; Garlapati, V.K.; Naha, S.; Sharma, M.; Ray, S.G.; Sreekrishnan, T.R.; Goswami, P. Biosensing capabilities of bioelectrochemical systems towards sustainable water streams: Technological implications and future prospects. Journal of bioscience and bioengineering 2020, 129, 647–656. [Google Scholar] [CrossRef] [PubMed]
- Xu, L.; Yu, W.; Graham, N.; Zhao, Y. Revisiting the bioelectrochemical system based biosensor for organic sensing and the prospect on constructed wetland-microbial fuel cell. Chemosphere 2021, 264, 128532. [Google Scholar] [CrossRef]
- Amirdehi, M.A.; Khodaparastasgarabad, N.; Landari, H.; Zarabadi, M.P.; Miled, A.; Greener, J. A high-performance membraneless microfluidic microbial fuel cell for stable, long-term benchtop operation under strong flow. ChemElectroChem 2020, 7, 2227–2235. [Google Scholar] [CrossRef]
- Khodaparastasgarabad, N.; Sonawane, J.M.; Baghernavehsi, H.; Gong, L.; Liu, L.; Greener, J. Microfluidic membraneless microbial fuel cells: new protocols for record power densities. Lab Chip 2023, 23, 4201–4212. [Google Scholar] [CrossRef] [PubMed]
- Gong, L.; Amirdehi, M.A.; Sonawane, J.M.; Jia, N.; de Oliveira, L.T.; Greener, J. Mainstreaming microfluidic microbial fuel cells: a biocompatible membrane grown in situ improves performance and versatility. Lab on a Chip 2022, 22, 1905–1916. [Google Scholar] [CrossRef] [PubMed]
- Zarabadi, M.P.; Couture, M.; Charette, S.J.; Greener, J. A generalized kinetic framework applied to whole-cell bioelectrocatalysis in bioflow reactors clarifies performance enhancements for geobacter sulfurreducens biofilms. ChemElectroChem 2019, 6, 2715–2718. [Google Scholar] [CrossRef]
- Zarabadi, M.P.; Charette, S.J.; Greener, J. Flow-Based Deacidification of Geobacter sulfurreducens Biofilms Depends on Nutrient Conditions: a Microfluidic Bioelectrochemical Study. ChemElectroChem 2018, 5, 3645–3653. [Google Scholar] [CrossRef]
- Jung, S.; Regan, J.M. Comparison of anode bacterial communities and performance in microbial fuel cells with different electron donors. Appl Microbiol Biotechnol 2007, 77, 393–402. [Google Scholar] [CrossRef]
- Rossi, R.; Logan, B.E. Using an anion exchange membrane for effective hydroxide ion transport enables high power densities in microbial fuel cells. Chemical Engineering Journal 2021, 422. [Google Scholar] [CrossRef]
- Shirkosh, M.; Hojjat, Y.; Mardanpour, M.M. Evaluation and optimization of the Zn-based microfluidic microbial fuel cells to power various electronic devices. Biosensors and Bioelectronics: X 2022, 12. [Google Scholar] [CrossRef]
- Justin, G.A.; Zhang, Y.; Sun, M.; Sclabassi, R. Biofuel cells: a possible power source for implantable electronic devices. In The 26th Annual International Conference of the IEEE Engineering in Medicine and Biology Society, 2004; IEEE: Vol. 2, pp 4096-4099. [Google Scholar]
- Lee, C.H.; Ha, H.; Ahn, Y.; Liu, H. Performance of single-layer paper-based co-laminar flow microbial fuel cells. Journal of Power Sources 2023, 580, 233456. [Google Scholar] [CrossRef]
- Yang, W.; Lee, K.K.; Choi, S. A laminar-flow based microbial fuel cell array. Sensors and Actuators B: Chemical 2017, 243, 292–297. [Google Scholar] [CrossRef]
- Cheng, W.L.; Erbay, C.; Sadr, R.; Han, A. Dynamic flow characteristics and design principles of laminar flow microbial fuel cells. Micromachines 2018, 9, 479. [Google Scholar] [CrossRef]
- Cho, H.-M.; Ha, H.; Ahn, Y. Co-laminar Microfluidic Microbial Fuel Cell Integrated with Electrophoretically Deposited Carbon Nanotube Flow-Over Electrode. ACS Sustainable Chemistry & Engineering 2022, 10, 1839–1846. [Google Scholar]
- Gong, L.; Khodaparastasgarabad, N.; Hall, D.M.; Greener, J. A new angle to control concentration profiles at electroactive biofilm interfaces: Investigating a microfluidic perpendicular flow approach. Electrochimica Acta 2022, 431, 141071. [Google Scholar] [CrossRef]
- Amirdehi, M.A.; Gong, L.; Khodaparastasgarabad, N.; Sonawane, J.M.; Logan, B.E.; Greener, J. Hydrodynamic interventions and measurement protocols to quantify and mitigate power overshoot in microbial fuel cells using microfluidics. Electrochimica Acta 2022, 405, 139771. [Google Scholar] [CrossRef]
- Sonawane, J.M.; Greener, J. Multiparameter optimization of microbial fuel cell outputs using linear sweep voltammetry and microfluidics. Journal of Power Sources 2024, 607, 234589. [Google Scholar] [CrossRef]
- Massaglia, G.; Gerosa, M.; Agostino, V.; Cingolani, A.; Sacco, A.; Saracco, G.; Margaria, V.; Quaglio, M. Fluid dynamic modeling for microbial fuel cell based biosensor optimization. Fuel Cells 2017, 17, 627–634. [Google Scholar] [CrossRef]
- Mardanpour, M.M.; Yaghmaei, S.; Kalantar, M. Modeling of microfluidic microbial fuel cells using quantitative bacterial transport parameters. Journal of Power Sources 2017, 342, 1017–1031. [Google Scholar] [CrossRef]
- Yang, Y.; Ye, D.; Li, J.; Zhu, X.; Liao, Q.; Zhang, B. Microfluidic microbial fuel cells: from membrane to membrane free. Journal of Power Sources 2016, 324, 113–125. [Google Scholar] [CrossRef]
- Rossi, R.; Logan, B.E. Unraveling the contributions of internal resistance components in two-chamber microbial fuel cells using the electrode potential slope analysis. Electrochimica Acta 2020, 348, 136291. [Google Scholar] [CrossRef]
- Zhao, J.; Zarabadi, M.; Hall, D.; Dahal, S.; Greener, J.; Yang, L. Unification of cell-scale metabolic activity with biofilm behavior by integration of advanced flow and reactive-transport modeling and microfluidic experiments. bioRxiv, 2024; 2024.2001. 2025.577134. [Google Scholar]
- Ge, Z.; Li, J.; Xiao, L.; Tong, Y.; He, Z. Recovery of electrical energy in microbial fuel cells: brief review. Environmental Science & Technology Letters 2014, 1, 137–141. [Google Scholar]
- Yang, Y. Effect of gravitational deposition on biofilm formation and development. Biofilms 2006, 1–9. [Google Scholar] [CrossRef]
- Lynch, S.; Brodie, E.; Matin, A. Role and regulation of σs in general resistance conferred by low-shear simulated microgravity in Escherichia coli. Journal of bacteriology 2004, 186, 8207–8212. [Google Scholar] [CrossRef] [PubMed]
- Wilson, J.W.; Ramamurthy, R.; Porwollik, S.; McClelland, M.; Hammond, T.; Allen, P.; Ott, C.M.; Pierson, D.L.; Nickerson, C.A. Microarray analysis identifies Salmonella genes belonging to the low-shear modeled microgravity regulon. Proceedings of the National Academy of Sciences 2002, 99, 13807–13812. [Google Scholar] [CrossRef] [PubMed]
- Logan, B.; Cheng, S.; Watson, V.; Estadt, G. Graphite fiber brush anodes for increased power production in air-cathode microbial fuel cells. Environmental science & technology 2007, 41, 3341–3346. [Google Scholar]
- Bian, B.; Yu, N.; Akbari, A.; Shi, L.; Zhou, X.; Xie, C.; Saikaly, P.E.; Logan, B.E. Using a non-precious metal catalyst for long-term enhancement of methane production in a zero-gap microbial electrosynthesis cell. Water Research 2024, 259, 121815. [Google Scholar] [CrossRef] [PubMed]
- Choi, S.; Chae, J. Optimal biofilm formation and power generation in a micro-sized microbial fuel cell (MFC). Sensors and Actuators A: Physical 2013, 195, 206–212. [Google Scholar] [CrossRef]
- Choi, S.; Lee, H.-S.; Yang, Y.; Parameswaran, P.; Torres, C.I.; Rittmann, B.E.; Chae, J. A μL-scale micromachined microbial fuel cell having high power density. Lab on a Chip 2011, 11, 1110–1117. [Google Scholar] [CrossRef] [PubMed]
- Li, Z.; Venkataraman, A.; Rosenbaum, M.A.; Angenent, L.T. A Laminar-Flow Microfluidic Device for Quantitative Analysis of Microbial Electrochemical Activity. ChemSusChem 2012, 5, 1119–1123. [Google Scholar] [CrossRef] [PubMed]
- Ye, D.; Yang, Y.; Li, J.; Zhu, X.; Liao, Q.; Deng, B.; Chen, R. Performance of a microfluidic microbial fuel cell based on graphite electrodes. international journal of hydrogen energy 2013, 38, 15710–15715. [Google Scholar] [CrossRef]
- Yang, Y.; Ye, D.; Li, J.; Zhu, X.; Liao, Q.; Zhang, B. Biofilm distribution and performance of microfluidic microbial fuel cells with different microchannel geometries. International Journal of Hydrogen Energy 2015, 40, 11983–11988. [Google Scholar] [CrossRef]
- Li, F.; Zheng, Z.; Yang, B.; Zhang, X.; Li, Z.; Lei, L. A laminar-flow based microfluidic microbial three-electrode cell for biosensing. Electrochimica Acta 2016, 199, 45–50. [Google Scholar] [CrossRef]
Figure 1.
Fabrication of a double-sided microfluidic MFC with 4 embedded electrodes as viewed from the x-y plane (top view). (a,b) Fabrication of the both electrode-containing microchannel layers embedded with two graphite electrodes: (i) Two graphite electrodes (dark grey) placed face-down on photolithographic microchannel mould (blue). (ii) A PDMS and cross-linker solution (yellow) poured into the mould. (iii) Access holes punched in the PDMS microchannel layer in (a). Schematic (c) and photo (d) of final device (with all dimensions in mm).
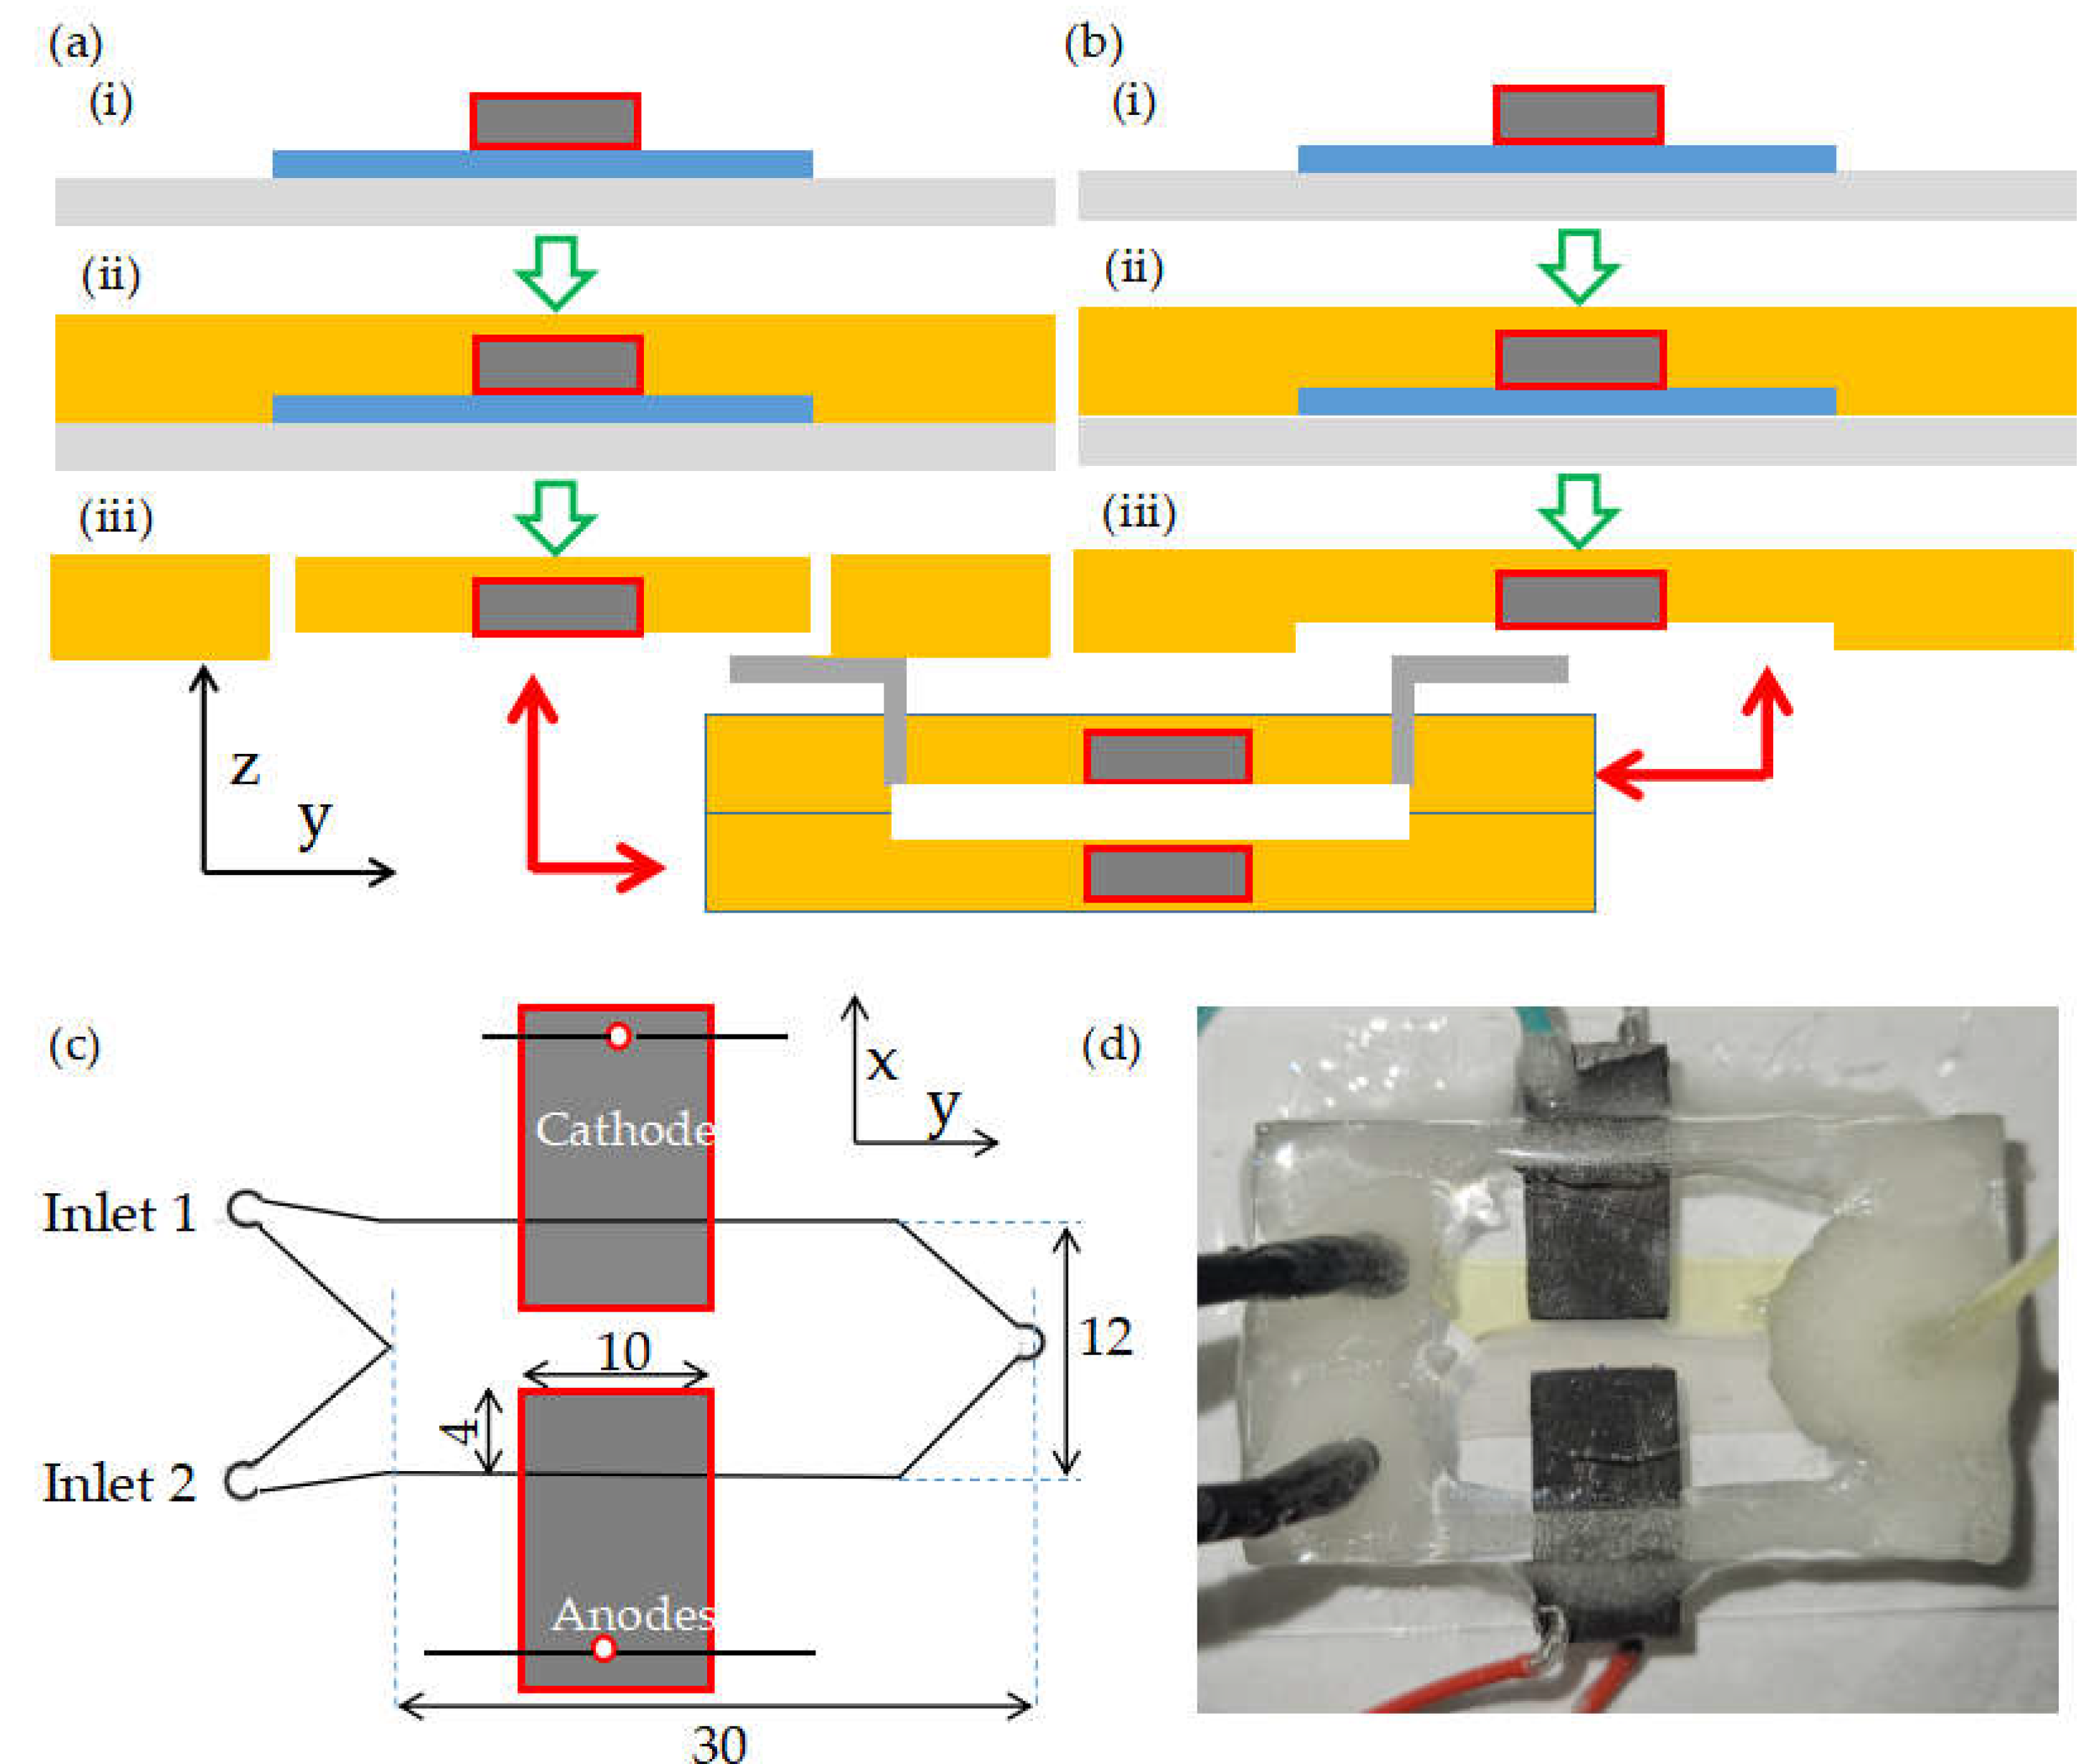
Figure 2.
MFCa, MFCb, and MFCa||b in the 4-electrode MFC showing top cathode and anodes (TopCE, TopAE) and top and bottom anodes (BotCE and BotAE).
Figure 2.
MFCa, MFCb, and MFCa||b in the 4-electrode MFC showing top cathode and anodes (TopCE, TopAE) and top and bottom anodes (BotCE and BotAE).
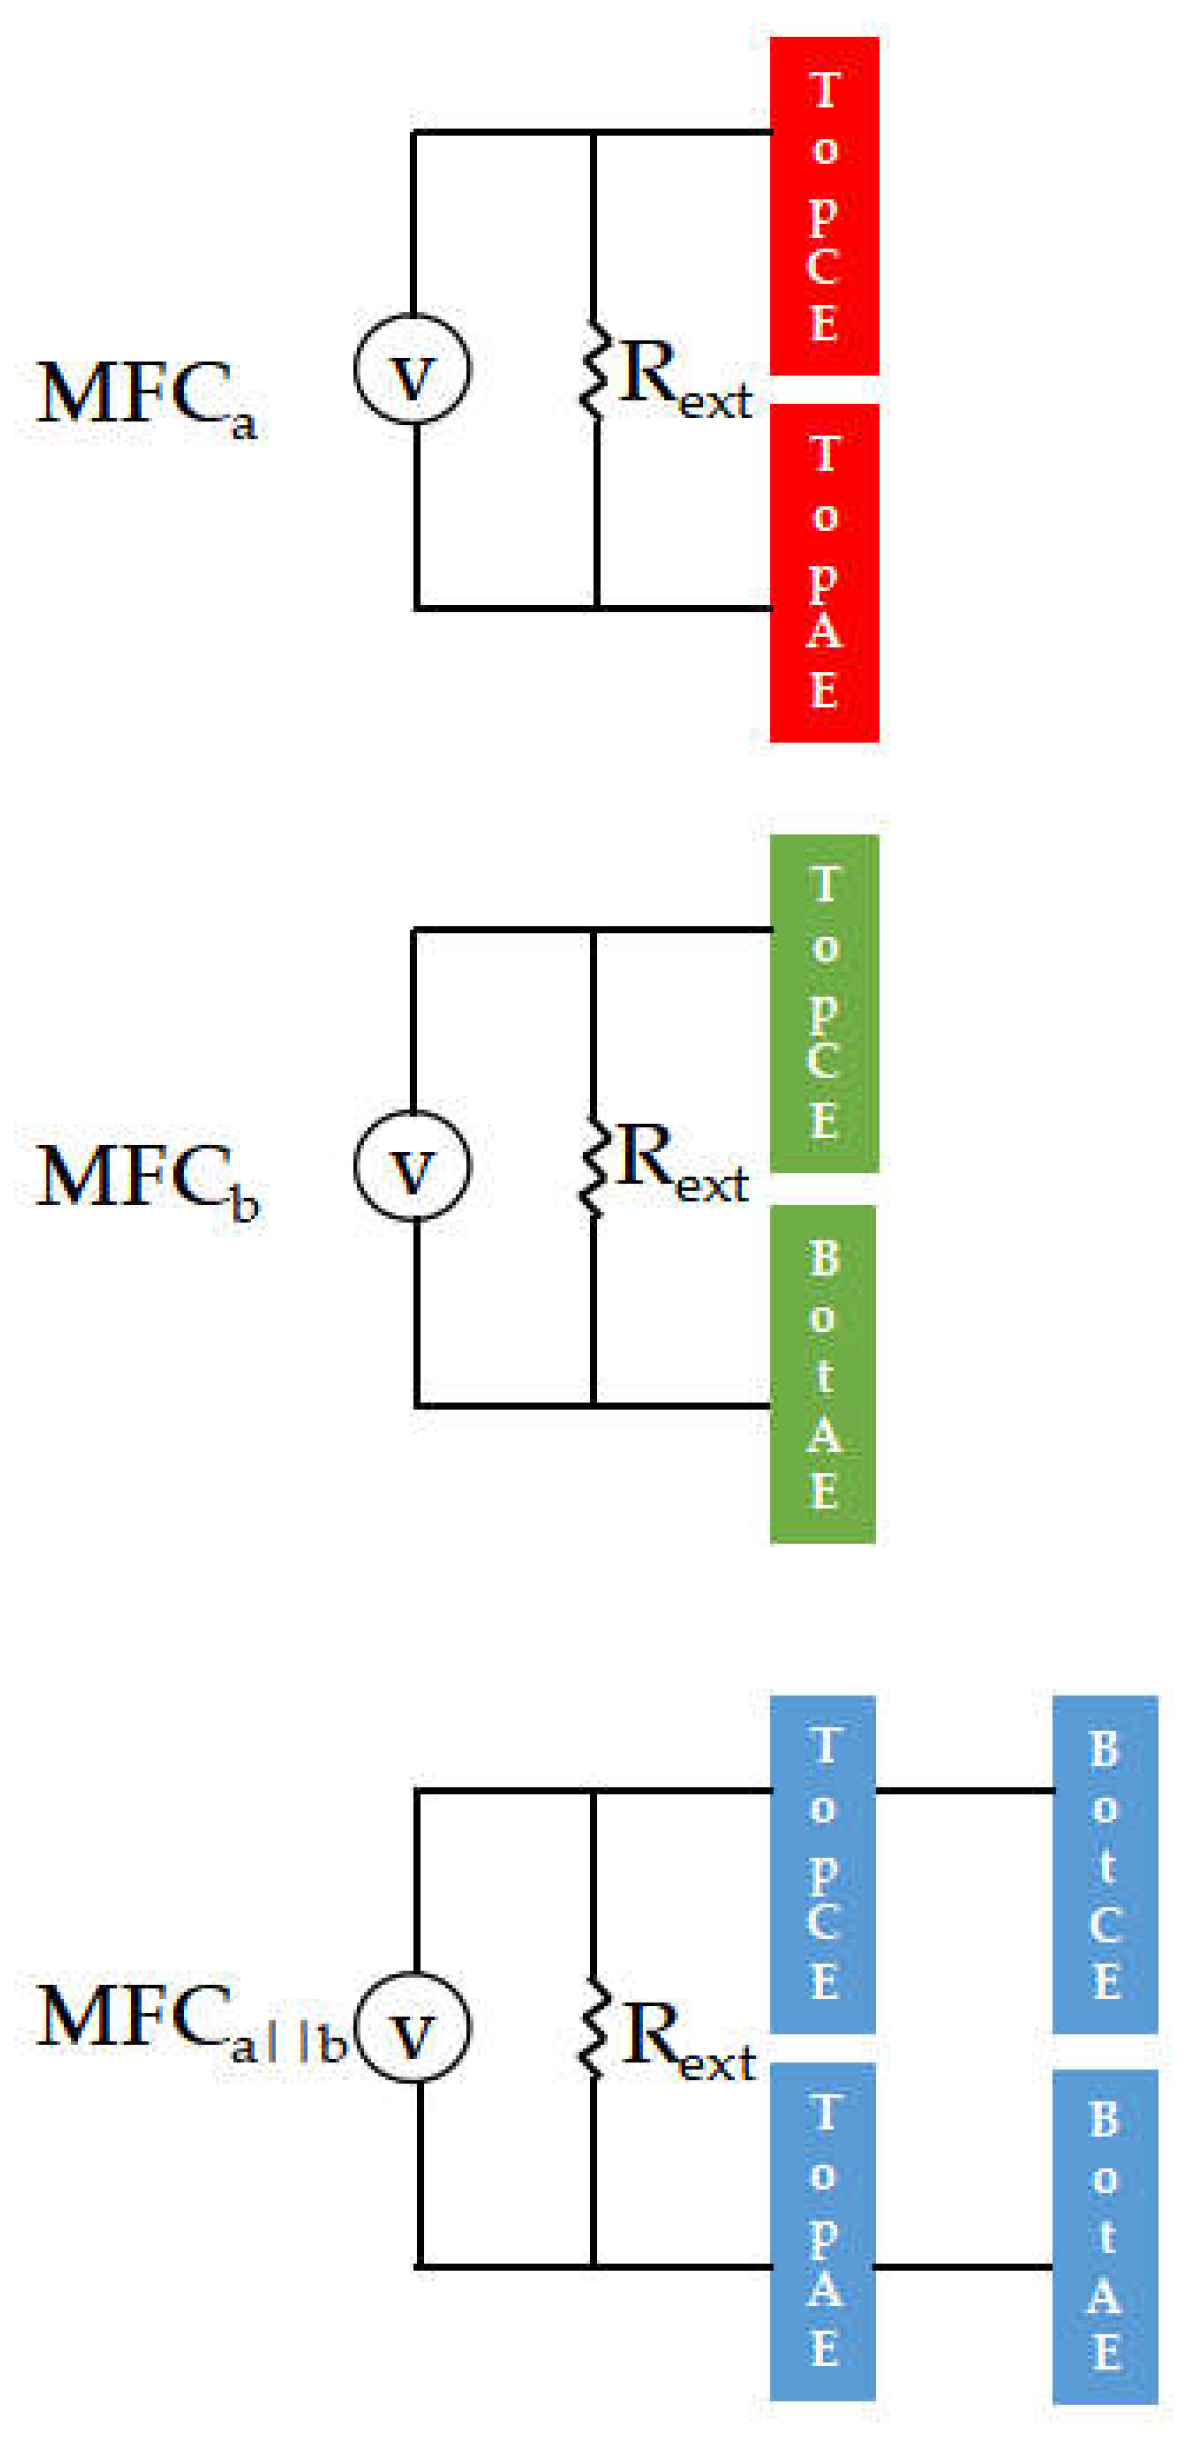
Figure 3.
(a) Schematic for MFC orientation with MFCa (red) being initially on the top and MFCb (green) being initially on the bottom. The white space between MFCa and MFCb represents the channel space and the black rectangles represent electrodes. Note, from the z-y plane, only 2 of the 4 electrodes are visible. Inlet and outlet tubing is connected through the MFCa layer. (b) Growth curves with MFCa (red) and MFCb (green) starting with external resistances of Rext=100 kΩ, but MFCa is switched to 50 kΩ at 13 days (black arrow). Rotating arrows near 14 days mark the time that the device is flipped as shown in (a). (c) Mid-stage mature phase after initially flipping in (a). External resistances are Rext=30 kΩ for the MFCa and Rext=20 kΩ for the MFCb. (d) Current output from MFCa||b (black) until MFCa (red) and MFCb (green) are electrically separated (black arrow) and flipped back to the original orientation (orange arrow). At all stages, flow rates for acetate and ferricyanide were QAc = 0.4 mL h-1, QFe = 0.2 mL h-1, respectively.
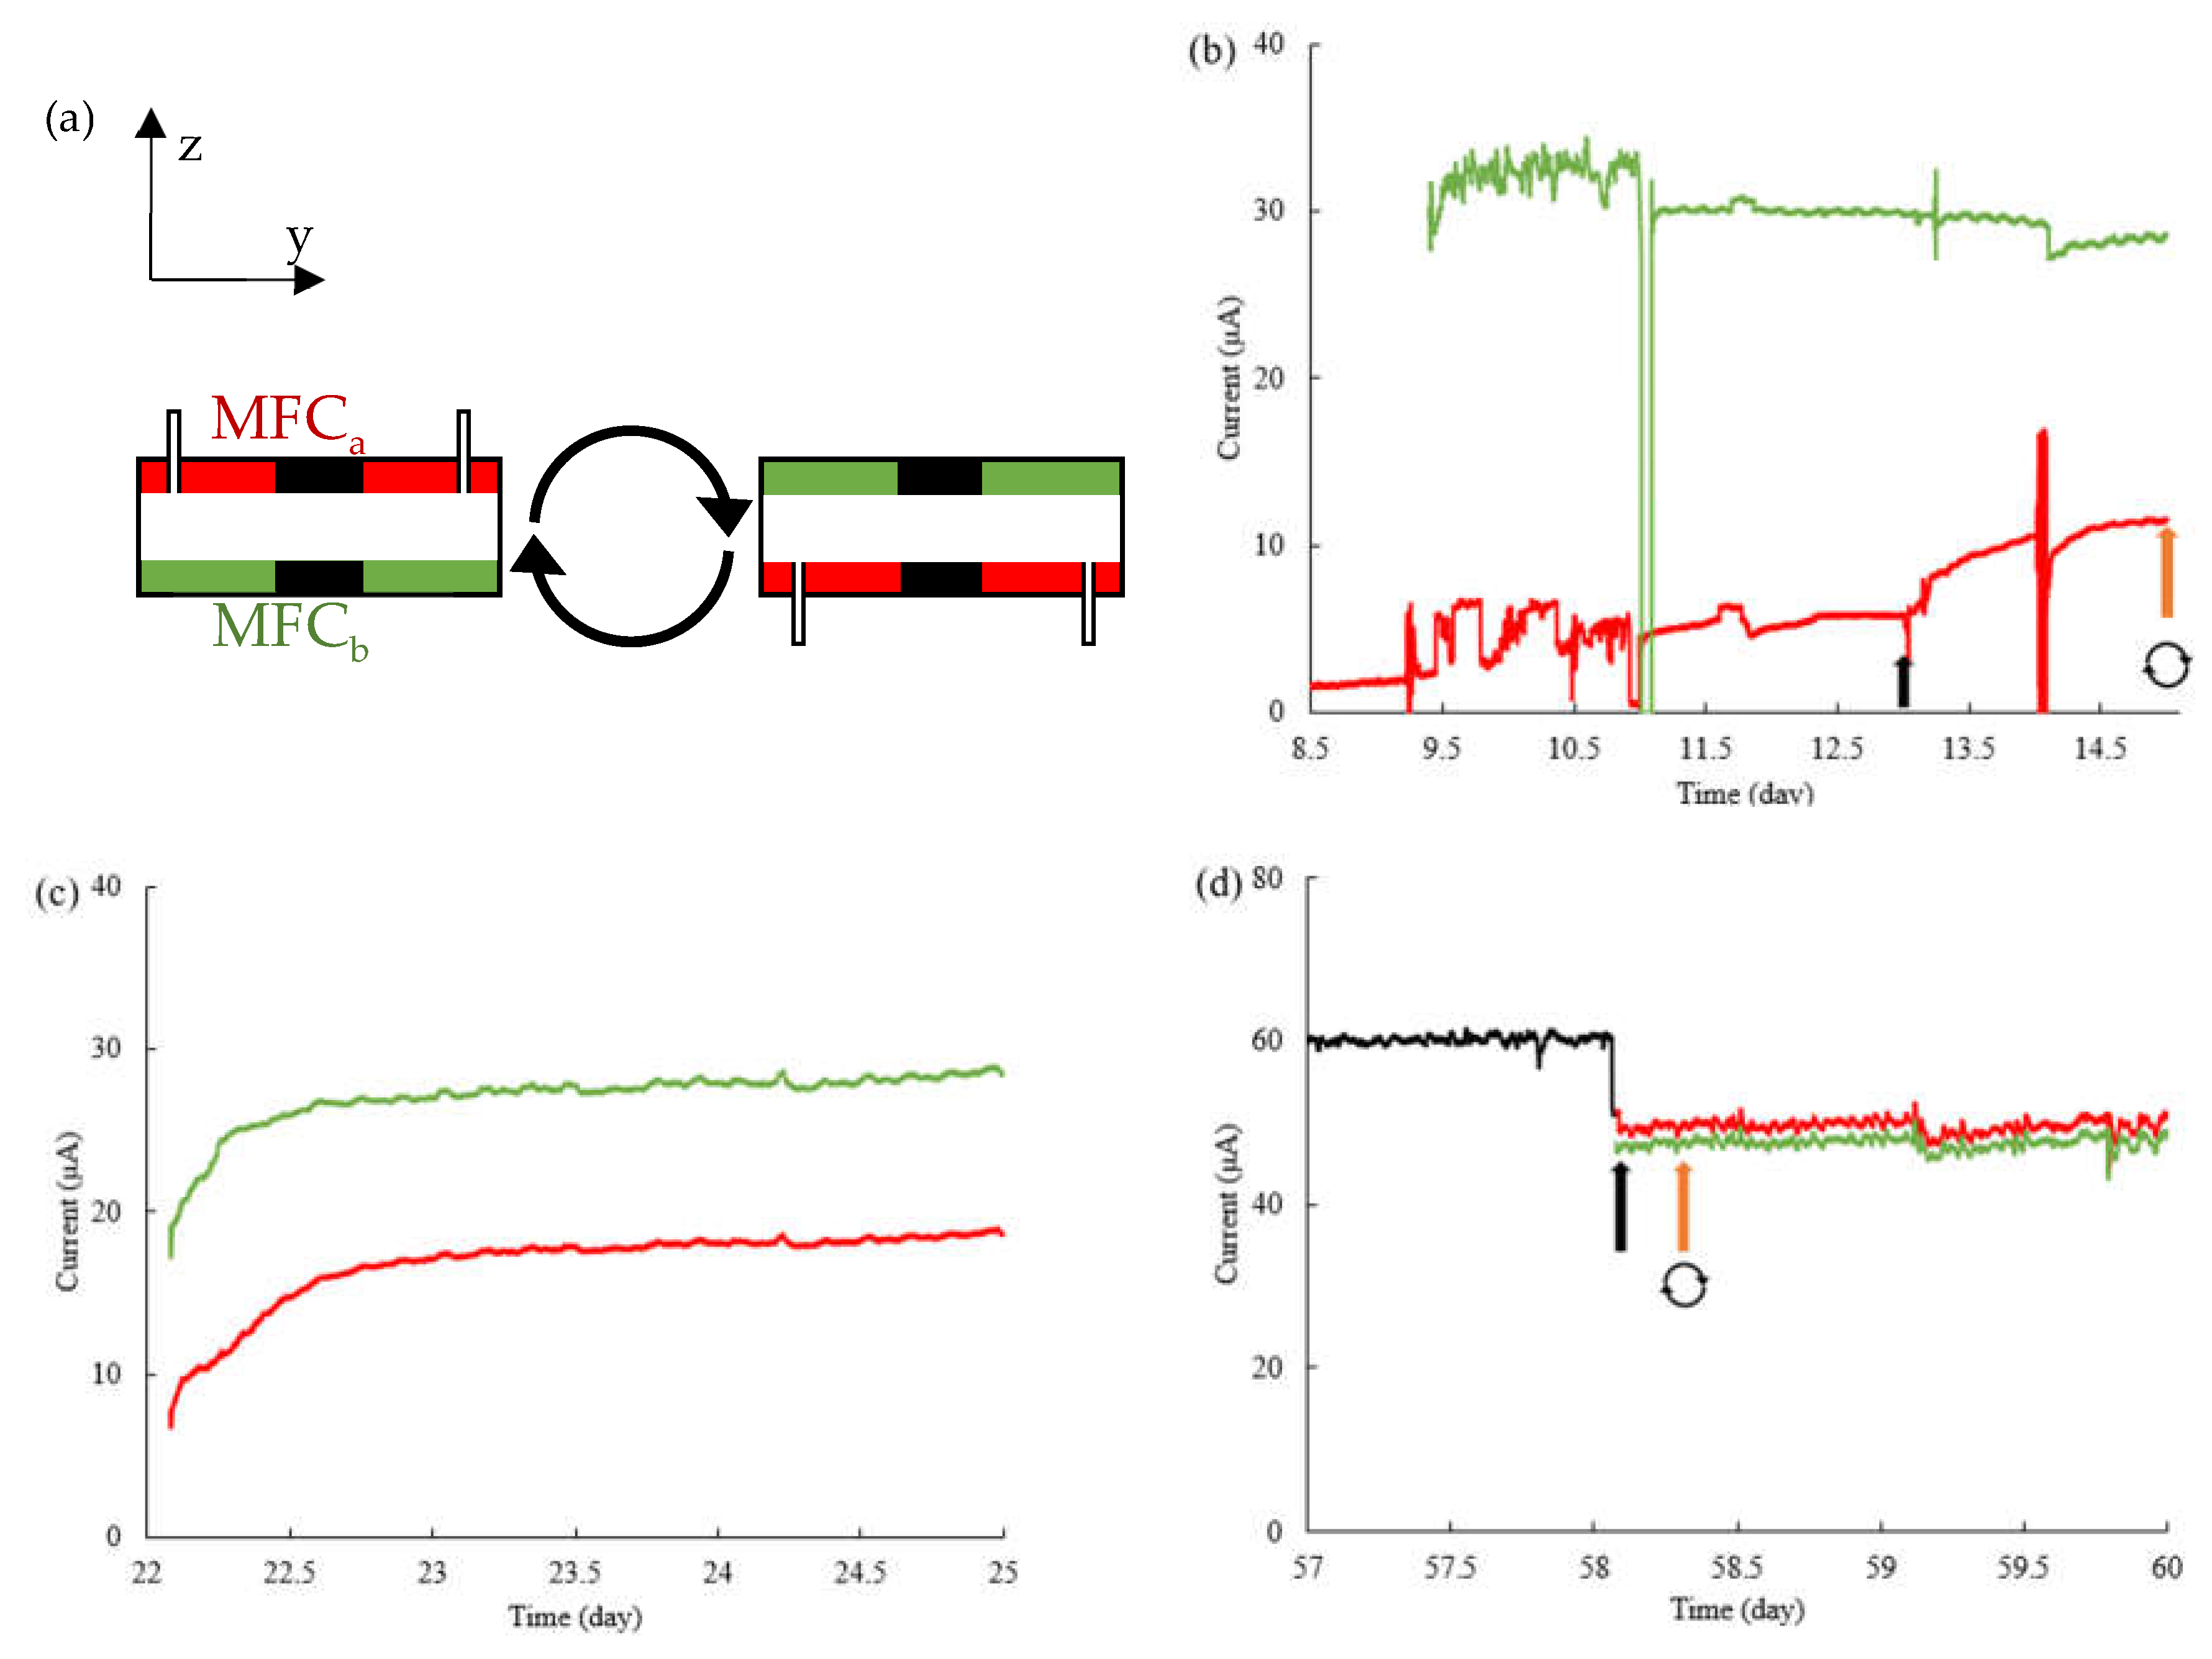
Figure 4.
Polarization curves (solid line) and power density (dash line) of MFCa (green), MFCb (red) and MFCa||b (blue) at biofilm age of 68 days (QAc=4 mL h-1, QFe=2 mL h-1, scan rate: 2 mV s-1).
Figure 4.
Polarization curves (solid line) and power density (dash line) of MFCa (green), MFCb (red) and MFCa||b (blue) at biofilm age of 68 days (QAc=4 mL h-1, QFe=2 mL h-1, scan rate: 2 mV s-1).
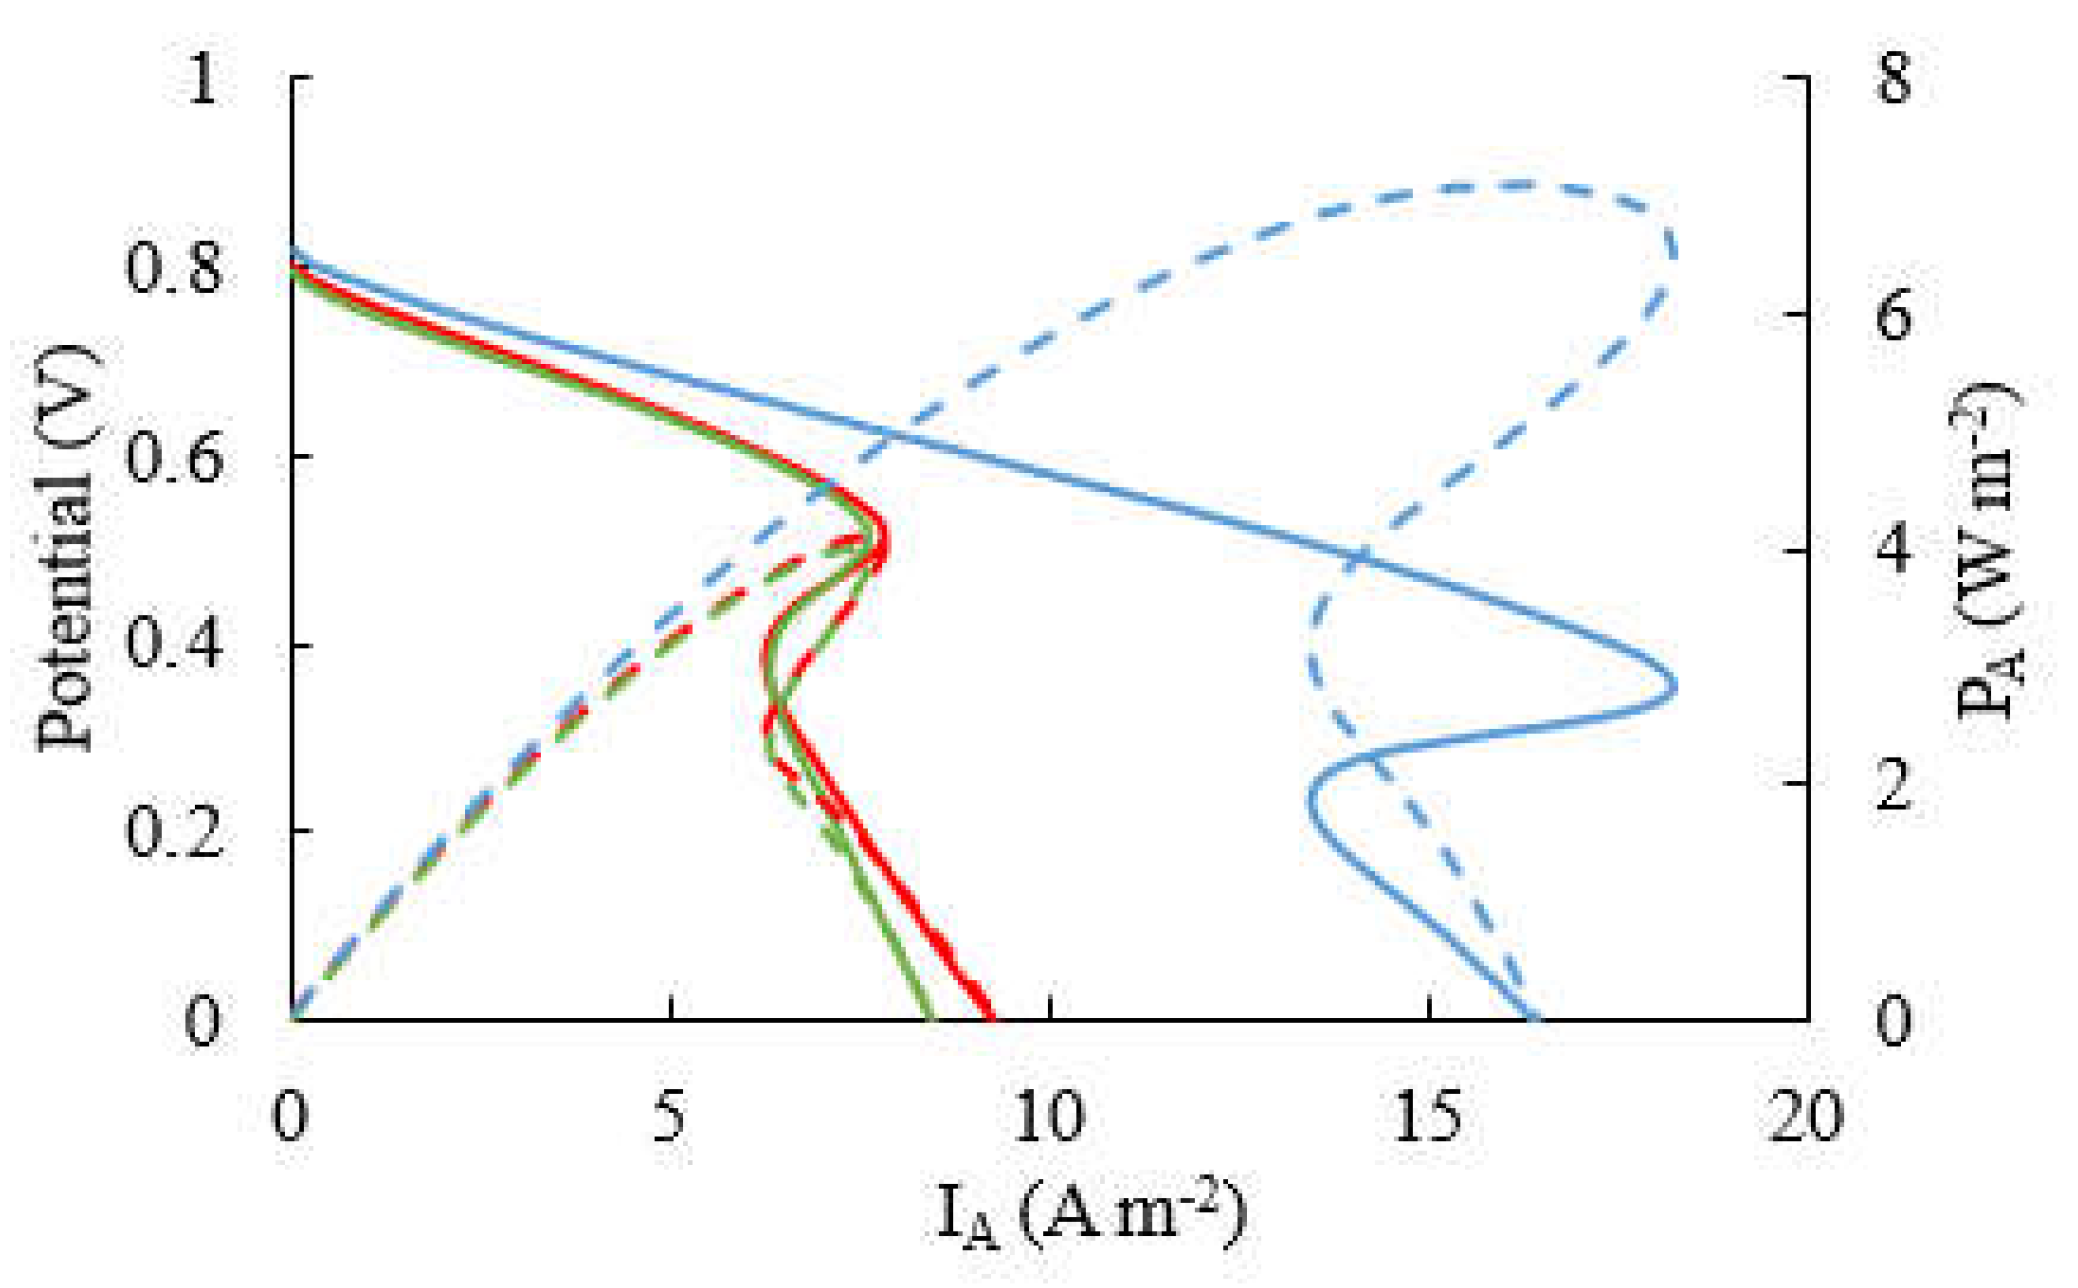
Figure 5.
(a) Change in acetate concentration (Δ[Ac]; solid circles) and power density (PA; open squares) changing with flow rate of acetate for MFCa at Rext =d 20 kΩ (green), MFCb at Rext = 15 kΩ (red), and MFCa||b at Rext = 15 kΩ (blue). (b) The calculated Δ[Ac] at QAc = 0.1 mL h-1 for MFCa, MFCb, MFCa||b.
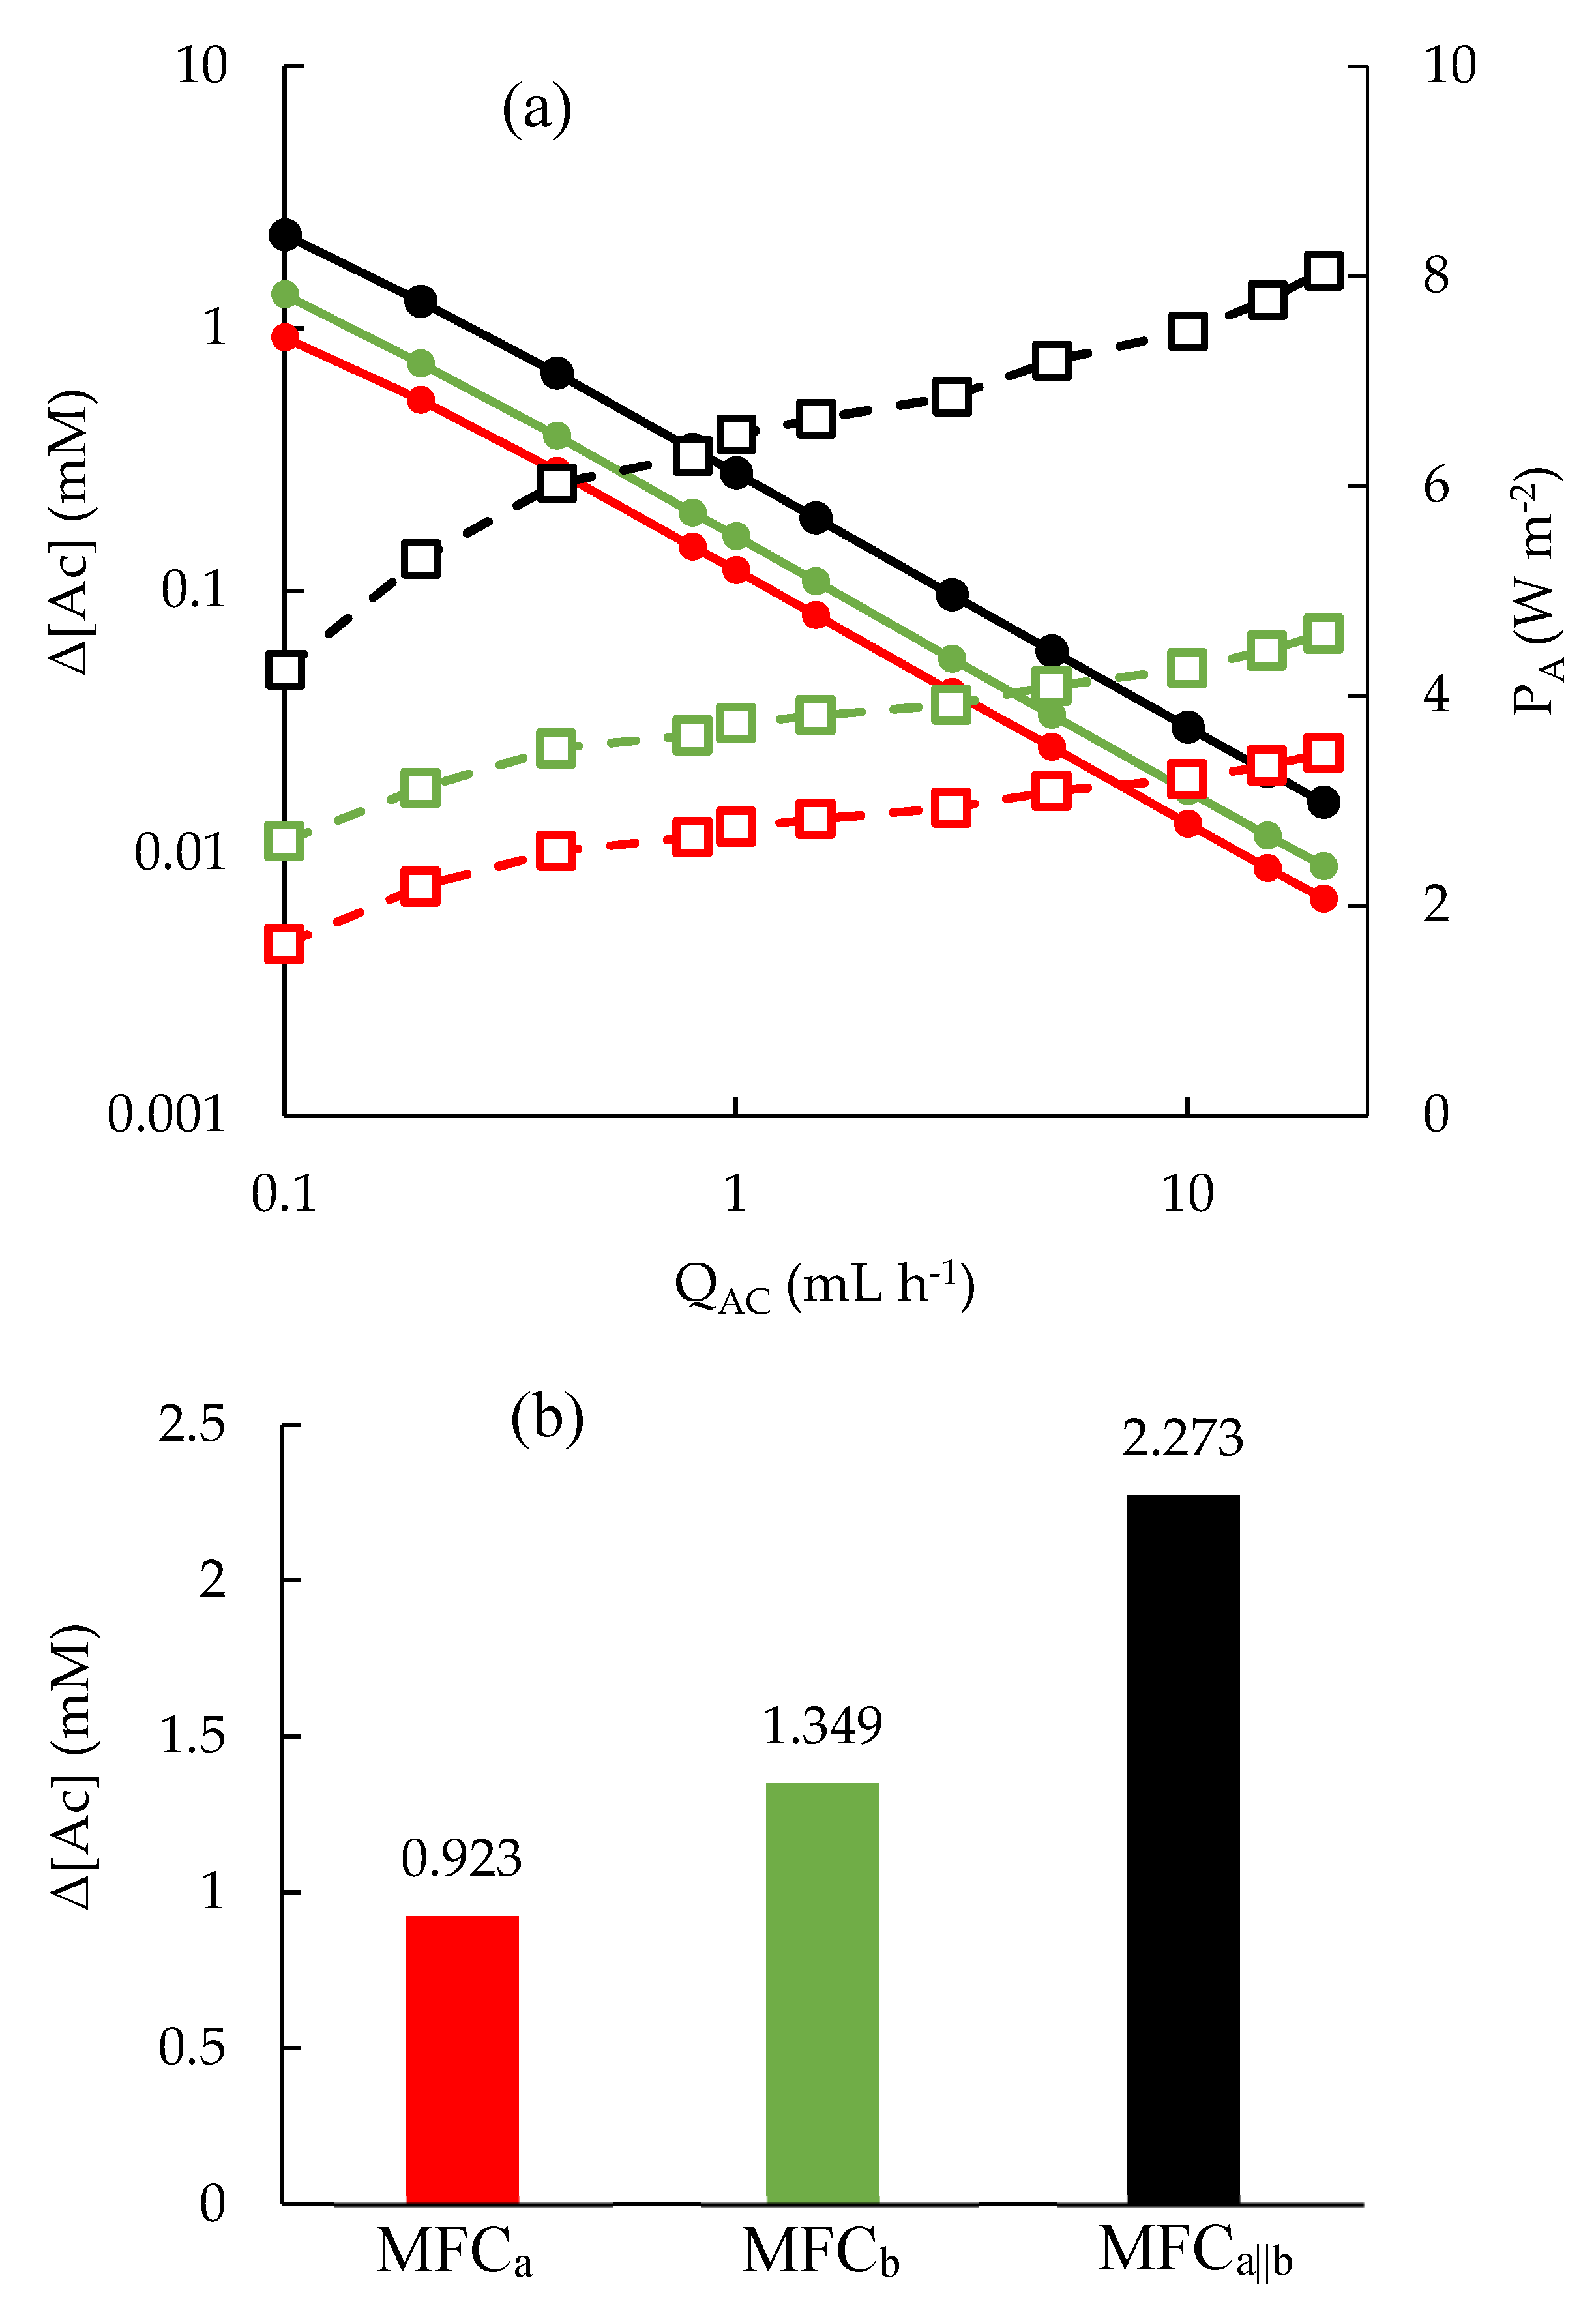
Figure 6.
Simulation of acetate consumption in the anode compartment showing a preference for consumption near the edge closest to the cathode in (a) 4-electrode MFC (MFCa||b) and (b) a 2-electrode device (e.g., MFCb after 2 months). Both are cross-sections in the x-z plane. Dark red and royal blue represent 10 mM and 0 mM acetate, respectively.
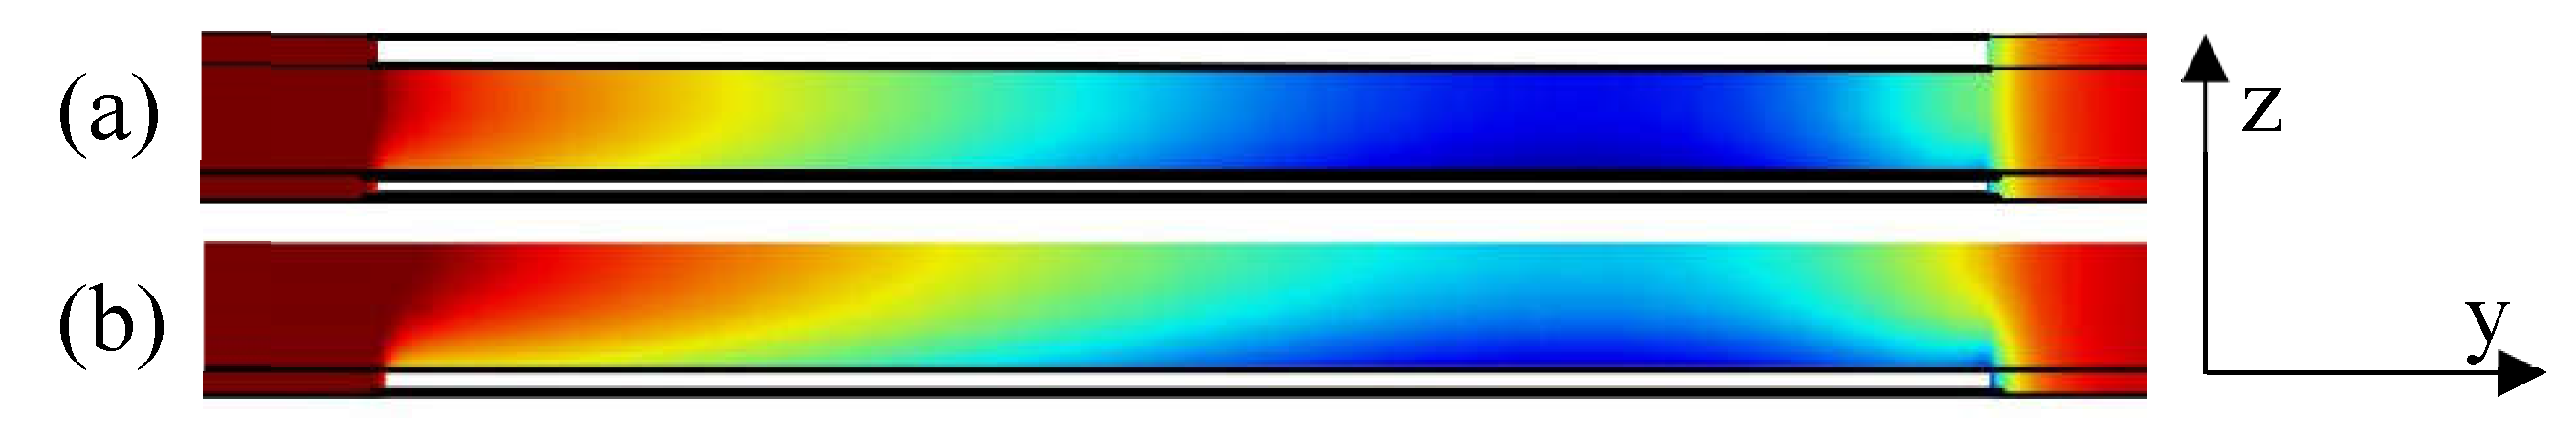
Figure 7.
SEM images of the biofilm on the surface of the top anode (a) and the bottom anode (b). Side view of the biofilm in the middle of the top anode (c) and the bottom anode (d).
Figure 7.
SEM images of the biofilm on the surface of the top anode (a) and the bottom anode (b). Side view of the biofilm in the middle of the top anode (c) and the bottom anode (d).
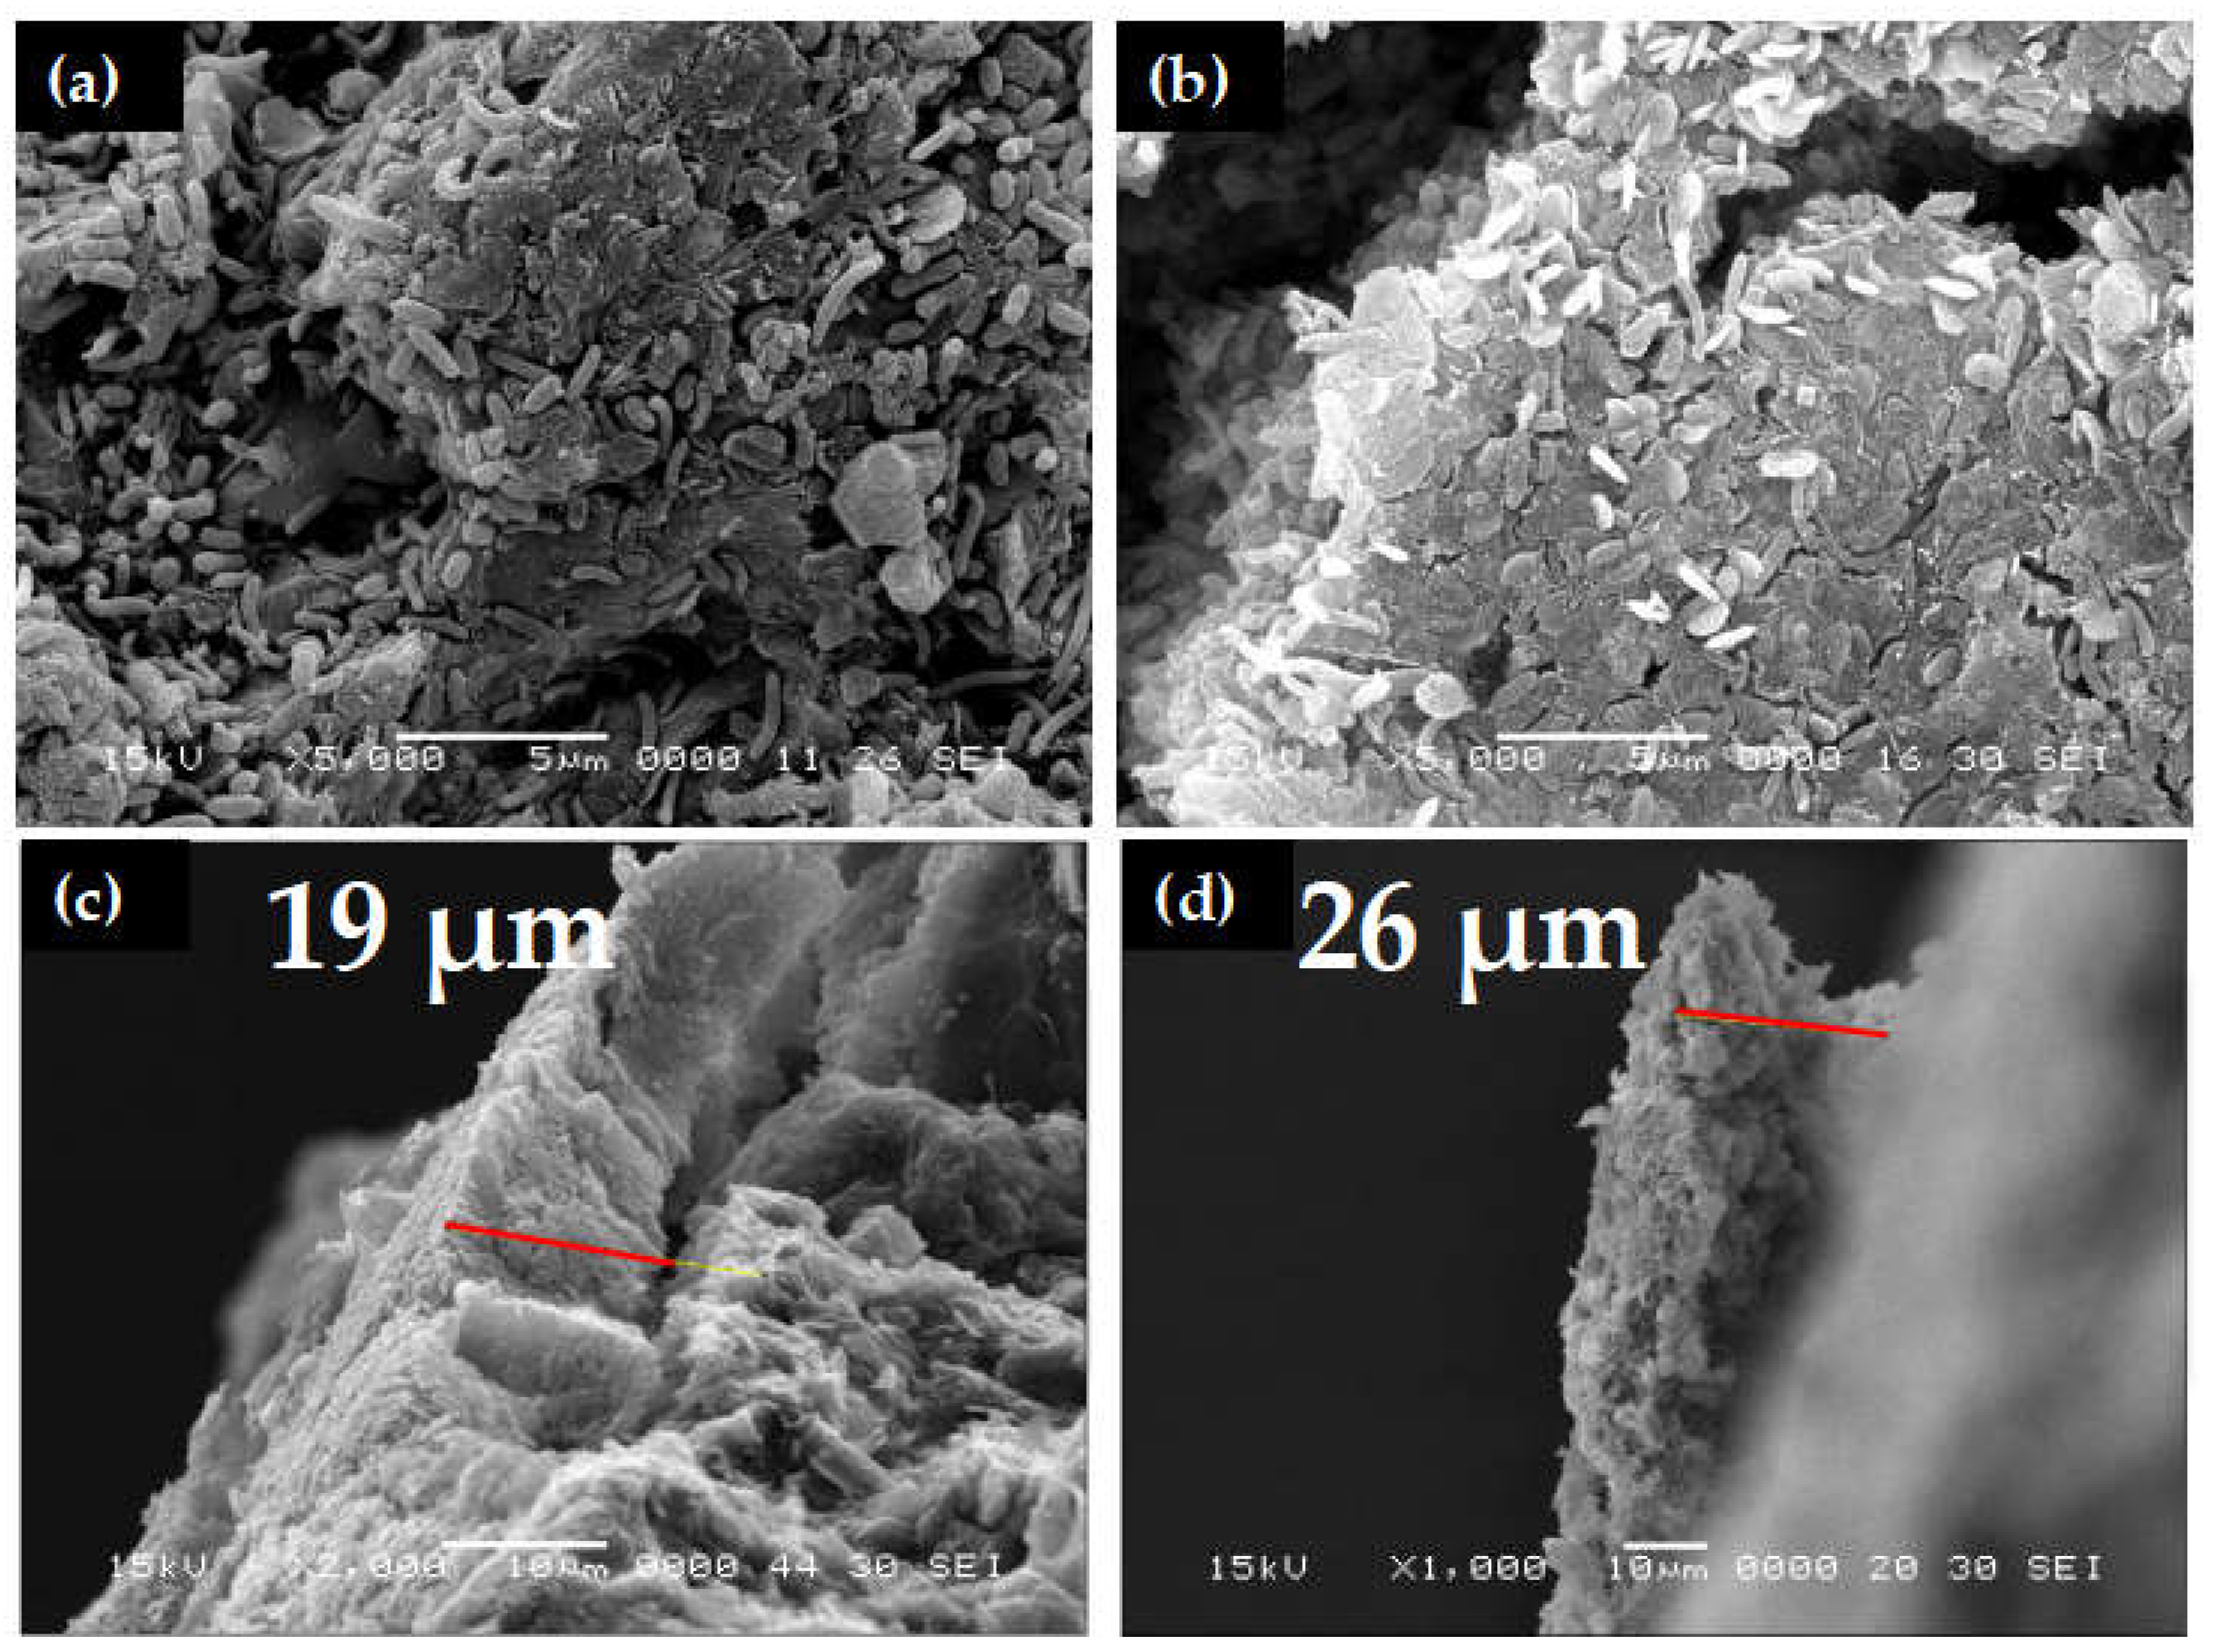
Figure 8.
Literature values (black) and present value (red) of acetate conversion by a microfluidc MFC as a function of acetate flow rate (QAc) based on reported currents. For display purposes, the inset is plotted on a semi-log scale with axis titles being shared with the main figure.
Figure 8.
Literature values (black) and present value (red) of acetate conversion by a microfluidc MFC as a function of acetate flow rate (QAc) based on reported currents. For display purposes, the inset is plotted on a semi-log scale with axis titles being shared with the main figure.
Disclaimer/Publisher’s Note: The statements, opinions and data contained in all publications are solely those of the individual author(s) and contributor(s) and not of MDPI and/or the editor(s). MDPI and/or the editor(s) disclaim responsibility for any injury to people or property resulting from any ideas, methods, instructions or products referred to in the content. |
© 2024 by the authors. Licensee MDPI, Basel, Switzerland. This article is an open access article distributed under the terms and conditions of the Creative Commons Attribution (CC BY) license (http://creativecommons.org/licenses/by/4.0/).
Copyright: This open access article is published under a Creative Commons CC BY 4.0 license, which permit the free download, distribution, and reuse, provided that the author and preprint are cited in any reuse.


