Submitted:
03 July 2024
Posted:
04 July 2024
You are already at the latest version
Abstract
A field study was conducted at the Eastern Mediterranean Agricultural Research Institute, Adana, Turkey, during the 2022/23 cropping seasons to examine the impact of Mepiquat chloride dosage applied at different intervals to optimize growth, yield characteristics enhancement and improve fiber quality attributes of cotton. The study employed a split-split plot design with three replications. The results revealed that differences among treatments were not statistically significant for most parameters investigated. The observed discrepancies indicated that all treatments tested in 2012 delayed cotton development, whereas in 2023, they led to premium fibers. In 2023, the fiber percentage was highest in the control treatment, and in 2022, it was highest at 400 mL·ha-1. Across all years, the Selin variety exhibited the highest fiber percentage when Mepiquat chloride was applied at the bolling stage. The shoot-root ratio was highest at 400 mL·ha-1 during harvest in 2022 and at 0 mL·ha-1 during the reproductive stage in 2023. Overall, the results demonstrated that the application of Mepiquat chloride altered the physiological characteristics of the cotton plants, leading to bottom-up effects on cotton performance. This implies that the effectiveness of Mepiquat chloride in cotton production to alleviate drought stress is influenced by weather-related conditions.
Keywords:
Mepiquat chloride
; application time
; cotton
; shoot-root ratio
; fiber percent
; maturity index
1. Introduction
Cotton (Gossypium spp.) is an upright, perennial plant exhibiting a hermaphroditic growth habit, mainly grown as cash crop for millions of farmers worldwide [1]. Indeed, the precise centers of origin of cotton remain uncertain [2]. It is broadly adapted across temperate, subtropical, and tropical environments, but growth and production face significant challenges due to the impacts of climate change [3]. Recent evidence and predictions indicate an increase in climate hazards, notably heat stress, drought, and extreme rainfall, in some of the highest cotton-producing countries, primarily China, India, USA, Brazil, Pakistan and Turkey [4]. Climate risks are not only posing a threat to the cotton value chain; extreme weather events impact the well-being of worker throughout the pro-duction cycle [5].
The growth and development of cotton are intricately influenced by temperature, as it regulates the rates of respiration, photosynthesis, flowering and fruit production [6]. The duration of temperature effects varies with the phenological periods, physio-morphological and genetic structure of the cotton plant [7]. Temperature increases have been linked to early blooming of plants [8], which in turn can subsequently hamper productivity and threaten food security [9]. This effect may be exacerbated when extreme temperatures coincide with shifting in rainfall patterns [10,11].
Cotton farmers encounter challenges in selecting the best management strategies to address the adverse effects of climate change, especially amidst rising production costs and unpredictable crop returns [12]. This difficulty arises despite the availability of various technologies, including the use of tolerant varieties, irrigation, optimal planting densities, and synthetic growth regulators, which have been developed and disseminated to mitigate the impacts of climate change [4,13,14]. Among these techniques, the enactment of plant growth regulators holds paramount momentousness. They not only influence the vegetative growth, yield, and fiber quality of cotton but also contribute to maintaining a vigorous crop stand, enhancing radiation-use efficiency, harmonizing plant canopy structure, better comfort of harvest, optimizing the source-sink relationship by regulating hormonal balance, and reducing the need for labor-intensive tasks, thereby mitigating costs [15,16,17]. Despite its importance, the effectiveness of plant growth regulators, such as Mepiquat Chloride, depends on several factors, including variety selection, crop management practices, environmental conditions, application dosage, methods and timing [18,19].
Nevertheless, the majority of cotton cultivation occurs in arid and semiarid regions at present. Therefore, determining the optimal dosage and timing of PGRs to enhance yield in newly developed high-yield and high-quality cotton varieties in Turkey is crucial. Consequently, this study hypothesized that the application of PGRs can improve cotton yield in areas impacted by the adverse effects of climate change. Thus, the present study was undertaken to explore the beneficial effects of Mepiquat Chloride on the canopy architecture, yield and fiber quality of two cotton cultivars in the Mediterranean zone of Turkey.
2. Materials and Methods
2.1. Description of the Study Site
The experiments were conducted on a field of Eastern Mediterranean Agricultural Research Institute (36° 5123 N, 35° 2048 E), Adana, Mediterranean region, Turkey, in 2022 and 2023. The average temperature during the growing season was 23.91°C in 2022, with an average wind speed of 2.38 km/h and a mean rainfall of 170.20 mm (Figure 1). In contrast, in 2023, the average temperature rose to 24.23°C, with an average wind speed of 2.45 km/h and a mean rainfall of 172.80 mm (Figure 2).
2.2. Experimental Design, Treatments and Field Management
The experiment was conducted in field plots measuring 30 m × 30 cm, each containing 4 lines, settled in a split-split plot design with 3 replications. The main-plots consisted of two cotton varieties: Sezener and Selin. The sub-plots represented the application times, which were set at squaring stage (60 days after planting) and during boll development (78 days after planting). The sub-sub plots included four dosages of Mepiquat Chloride, which were sprayed at 0 mL·ha-1 (T0), 400 mL·ha-1 (T1), 400+400 mL·ha-1 (T2) and 800 mL·ha-1 (T3). The planting configuration involved a spacing of 70 cm between rows and 20 cm within rows, subsequent in a plant density of 142,857 plants ha−1. Cotton was sown subsequent to wheat harvesting. The Mepiquat Chloride used in the study was provided by the Institute. Additionally, other agronomic practices, including weeding, irrigation, and insecticide, were implemented throughout the growing season. The cotton plants were harvested upon reaching physiological maturity.
2.3. Data Collection
- i.
- Canopy architecture
Three (3) plants from each plot were selected randomly and brought to Ondokuz Mayıs University for measurements. The samples were collected at three different growth stages (i.e. vegetative, reproductive and harvest). The collected samples were dived into to their above- and belowground parts at the boundary between the root and stem, and then dried in a forced-air-circulation oven at 65°C for 72 hours. The dried biomass was weighed using electronic 0.001 g weighing balance and averaged to assess their shoot-root biomass ratios.
- ii.
- Fiber percent
Seed cotton was handpicked from the two inner rows (4.2 m2) of each plot and cautiously labeled. The collected seed cotton was then sun-dried for a month and weighed using an electronic weighing balance, and subsequently, was ginned to separate fiber, seeds and trash. Fiber percentage was calculated using the following formula:
[100 × fiber weight (g)] / [weight of seed cotton (g)]
- iii.
- Fiber quality
The ginned cotton from each plot was sent to the quality analysis department of the Eastern Mediterranean Agricultural Research Institute for high-volume instrument (HVI-900, USTER) analysis of fiber properties, typically, maturity index (%).
2.4. Statistical Analysis
The collected data were analyzed using SPSS 17. computer software, and trial data were subjected to analysis of variance (ANOVA) fitting for the experimental design. Significant differences between treatment means were determined using the Duncan multiple comparison procedure at a significance level of P ≤ 0.05 [20]. Tables and graphs were drawn with Microsoft Excel 2019.
3. Results
3.1. Analysis of Variance (ANOVA)
The results of variance analysis showed that the effects of concentration, variety, application time, application time × variety, variety × concentration, application time x variety and concentration × application time × variety on fiber percent and maturity index were not statistically significant (P ≤ 0.05) (Table 1).
3.2. Outcome of Mepiquat Chloride on Shoot-Root Ratio at Different Growth Stages
In 2022, when Mepiquat chloride was applied, the findings that the shoot-root ratio of cotton varieties was higher in reproductive stage, measuring 6.28, compared to 6.00 during the harvest stage and 5.82 during the vegetative stage. The Sezener variety achieved a significantly (p ≤ 0.05) highest shoot-root ratio of 6.57, outperforming the Selin variety at the reproductive stage (Table 1 and Figure 4). The best timing for Mepiquat chloride application was at bolling, resulting in the highest shoot-root ratio of 6.54 (Figure 4). The shoot-root ratio for all Mepiquat chloride concentrations across both varieties varied significantly (p ≤ 0.05) at harvest stage (Table 1). However, the highest shoot-root ratio of 6.76 was recorded at harvest stage under 400 mL·ha-1, while the lowest shoot-root ratio of 5.08 was observed at the harvest stage with 0 mL·ha-1 (Figure 3).
In 2023, when cotton varieties were sprayed with Mepiquat chloride, the shoot-root ratio at the reproductive stage was highest at 13.93, compared to 7.93 at the harvest stage and 6.19 at the vegetative stage. The Selin variety exhibited a superior shoot-root ratio of 14.65 at reproductive stage, outstripping the Sezener variety (Figure 6). The application timing also influenced outcomes, with the highest shoot-root ratio of 14.63 recorded when Mepiquat chloride was sprayed at squaring (Figure 6). Although there were no significant differences (p ≤ 0.05) in the shoot-root ratio across all Mepiquat chloride concentrations including the control, the application of 400+400 mL·ha-1 at the vegetative stage resulted the lowest shoot-root ratio of 5.57, while the highest ratio of 14.32 was registered at the reproductive stage with 0 mL·ha-1 (Table 1 and Figure 5).
3.3. Outcome of Mepiquat Chloride on fiber percent
In 2022, the application of Mepiquat Chloride at squaring stage and the Selin variety resulted in the highest fiber percent, with 61.53% and 61.49%, respectively (Figure 7). Conversely, Sezener variety had a lower fiber percent (55.06%) with the application of 400 mL·ha-1 at bolling stage (Table 2). Fascinatingly, the control treatment (0 mL·ha-1) recorded the highest fiber percent (64.60%) in the Selin variety when Mepiquat Chloride was applied at squaring stage (Table 2).
In 2023, the highest fiber percent (72.70%) was detected with the application of Mepiquat Chloride at bolling stage (Figure 7). The Selin variety consistently outperformed the Sezener variety in fiber percent, reaching 73.18% compared to 71.06% (Figure 7). Additionally, the lowest fiber percent (68.42%) in the Sezener variety was recorded with Mepiquat Chloride spritzing at 400+400 mL·ha-1 at bolling stage, while the control treatment (0 mL·ha-1) yielded the highest fiber percent (76.36%) in the Selin variety at bolling stage (Table 3).
3.4. Outcome of Mepiquat Chloride on maturity index
In 2022, the highest maturity index (84.17%) was recognized when Mepiquat Chloride was applied at bolling stage (Figure 8). The Sezener variety recorded the highest maturity index (84.13%), exceeding the Selin variety (84.00%) (Figure 8). Additionally, the findings discovered the lowest maturity index (83.33%) in the Selin variety with control treatment (0 mL·ha-1) (Table 4).
In 2023, the mean maturity index of two cotton varieties did not vary significantly, with both recording 84.87% (Figure 8). Application time of Mepiquat Chloride showed discrepancies in maturity index, with the highest percentage (87.93%) found at squaring stage, and the lowest percentage (87.75%) achieved at bolling stage (Figure 8). Spraying Mepiquat Chloride at a concentration of 400+400 mL·ha-1 during the squaring stage led to the highest maturity index (88.65%), whereas applying it at 0 mL·ha-1 resulted in the lowest maturity index (86.89%) for the Sezener variety (Table 5).
4. Discussion
Shoot-root ratio is the quotient of the dry mass of the shoots over the dry mass of the roots produced during a given growth period. It is a morphological character that used for the assessment of gas exchange rates, transpiration and osmotic rates, cell wall elasticity, water-use efficiency and finally photosynthesis rate [21,22]. A low shoot-root ratio indicates a prevalence of roots compared to leaf surface area, signifying that the plant is not likely to suffer from an excessive-water stress, and vice versa. In 2022, a higher shoot-root ratio was detected when Mepiquat chloride was sprayed at bolling compared to the squaring stage (Figure 4). Delaying defoliation enhanced attributes such as plant height, carbon assimilation, and the allocation of photosynthates towards cotton bolls development, resulting to greater dry above-ground biomass. These findings align with the preceding research as conveyed by [15,23].
However, shoot-root ratio did not show a consistent trend with the varying Mepiquat chloride concentrations tested (Figure 3 and Figure 5). For instance, in 2023, the highest shoot-root ratio was recorded with the control treatment (0 mL·ha-1) when plants were sampled at the reproductive stage (Figure 5). In contrast, in 2022, the control treatment (0 mL·ha-1) resulted in the lowest shoot-root ratio across all growth stages (Figure 3). This discrepancy might be credited to the variability in weather conditions at the study site between the two years, as summarized in Figure 1 and Figure 2. Furthermore, in 2023, all Mepiquat chloride concentrations led to a lower shoot-root ratio compared to the control treatment (0 mL·ha-1) at reproductive stage (Figure 5). Additionally, at the same growth stage in 2022, the application of Mepiquat chloride at 400+400 mL·ha-1 resulted in the lowest shoot-root ratio (Figure 3). The decline in the accrual of the shoot-root ratio with the varying concentrations might be attributed to reduced plant height, internode length, number of nodes, height to node ratio and disruption in the source-to-sink relationship. The findings corroborate previous studies [24,25,26,27,28].
The results of the present study indicate that the concentrations and timing of Mepiquat chloride application did not substantially impact on fiber percentage. Timeliness of application, precise concentrations, and their interaction with cultural practices have shown a noteworthy influence on crop response and the potential for successful Mepiquat chloride use. Across the two years of study, the highest fiber percentage varied with application timing; in 2022, it was noted at the squaring stage, while in 2023, it was recorded at the bolling stage. This variation might be due to the fact that the effectiveness of concentrations depends on cultural practices, environmental conditions and geographical factors, suggesting that there is a specific range over which a chemical works best. These findings are in conformity with observations obtained by [29,30,31].
Mepiquat chloride has shown unpredictable results, as some early studies have documented its effects on yield and yield components variably: some found increased yields [15,26,32,33], while others reported both increases and decreases in different tests [34,35]. Additionally, some studies noted little effect on yield [17,36,37,38,39] or even reduced yield [40,41]. The decline in fiber percent with Mepiquat chloride application could be attributed to reduced chlorophyll synthesis in plants, which is essential for carbon assimilation, carbohydrate synthesis, and protein and sugar formation [42].
Our results designate that the highest fiber percentage was found with the control treatment (0 mL·ha-1). The reason for the increase fiber percent might be due to the presence of abundant roots, which can effectively seek out, absorb, and transport water and dissolved minerals from the soil to the plant for photosynthesis. The increase in fiber percentage with the control treatment aligns with findings from earlier research by [18]. Additionally, each variety reacted slightly differently to the application of Mepiquat chloride on fiber percent. The differences could be ascribed to heterogeneity in plant genetic characteristics for moisture requirement, which prevents excessive evapotranspiration and, as a result, differencing in fiber percent [43]. The genotypic discrepancy in fiber percent in response to Mepiquat Chloride application has been documented by prior researchers [42,44,45].
Cotton fiber quality refers to the quality of cotton fibers required for the textile industry. Maturity Index, expressed as a percentage, serves as a measure of micronaire, strength, and elongation in a cotton sample [46]. This index is a key parameter for assessing the degree of cell wall thickness, which in turn affects various aspects of the spinning process, yarn evenness, yarn appearance, fabric drape, and yarn brightness [47,48]. Maturity index is categorized as follows: low if ≤75%, immature: 75 to 85%, mature/premium: 86 to 95% and very mature ≥95% [49]. These classes exemplify that higher percentages indicate better suitability for producing high-quality yarn and fabric for textile applications.
The maturity index varied significantly over the two years, being low in 2022 and in the premium range in 2023 (Table 4 and Table 5). The maturity index did not differ significantly among Mepiquat chloride concentrations when averaged across years (Table 1), with low values being recorded in control treatment (0 mL·ha-1). This might be due to favorable effect of Mepiquat chloride, which played greater role in reducing excessively vegetative growth by inhibiting the synthesis of gibberellin hormone. This inhibition resulted in earlier maturity due to enhanced partitioning of assimilates into upper canopy bolls, which subsequently matured more rapidly [50,51,52,53,54].
Furthermore, our results noted no consistent trends among the Mepiquat chloride concentrations on maturity index. For example, the application of 400+400 mL·ha-1 at squaring stage in Sezener variety fell within the premium range in 2023 but was in the immature range in 2022 (Table 4 and Table 5). These inconsistencies among varieties, application timing and concentrations might be due to variations in weather and/ or environment conditions across the two years. Our findings are in consonance with earlier researchers [8,14].
5. Conclusions
The results designated that the efficiency of Mepiquat chloride applied at different scheduling times depends on the weather-related conditions of a particular area. Our findings revealed an inconsistent trend for the shoot-root ratio, fiber percent, maturity index across all treatments, counting variety, application timing, and concentration over the years examined. Besides, in 2022, our discoveries showed that all Mepiquat chloride concentrations and their application times align within the immature range for cotton fibers, suggesting that these differences are unlikely to encourage net returns. In view of a financial perspective, relying solely on Mepiquat chloride application may lead to economic losses. Hence, further research is affirmed to probe the benefits of integrating various fertilizer sources, meteorological data and Mepiquat chloride within the cotton agro- ecology zone of Tanzania, which is significantly affected by the negative impacts of climate change.
Author Contributions
Conceptualization: M.M. and O.K.; Methodology, M.M. and O.K.; Software, M.S.H.; Validation, M.M. and M.S.H.; formal analysis, M.S.H.; investigation, M.M., O.K. and M.S.H.; resources, M.M.; data curation, M.M. and O.K.; writing—original draft, M.M.; writing—review and editing, M.M.; visualization, M.M.; supervision, O.K.; project administration, O.K.; funding acquisition, O.K. All authors have read and agreed to the published version of the manuscript.
Funding
This research was funded by Office of Scientific Research Projects “Bilimsel Araştırma Projeleri” (BAP) of Ondokuz Mayis University (OMÜ), grant number BAP2022-23. This work would never be fruitful without their financial support.
Data Availability Statement
The original contributions outlined in this study are encapsulated within the article, further inquiries can be directed to the corresponding author.
Acknowledgments
The authors would like to extend their sincere appreciation to all affiliates of the Eastern Medi-terranean Agricultural Research Institute for their guidance and advice provided to me during implementation of the field work and fiber quality testing. My thanks to Dr. Abdullha CIL (Institute Director) for accepting the research by providing land, field equipment’s, cotton seeds, High Volume Instrument (HVI) machine and working with me to this end.
Conflicts of Interest
The authors declare that for this manuscript, they possess no existing financial or familiar personal conflict of interest. The funders had no role in the design of the study; in the collection, analyses, or interpretation of data; in the writing of the manuscript; or in the decision to publish the results.
References
- K. Priyanka, M. S. Rekha, K. Lakshman, and C. S. Rao, “Effect of plant growth regulators on growth and yield of HDPS cotton,” Journal of Cotton Research and Development, vol. 36, no. 1, pp. 65–70, 2022.
- Huckell, L.W. Plant Remains from the PinaleñO Cotton Cache, Arizona. KIVA 1993, 59, 147–203. [Google Scholar] [CrossRef]
- Fatima, S.; Aslam, R.; Shahzadi, K.; Awan, H.; Nadeem, M.; Shabir, M.; Shafiq, Y.; Hamid, M. Effect of Drought Stress at Growth and Development of Pea (Pisum sativum L.). Asian J. Res. Crop. Sci. 2024, 9, 76–80. [Google Scholar] [CrossRef]
- S. Çelik, “Assessing Drought Tolerance in a Large Number of Upland Cotton Plants (Gossypium hirsutum L.) under Different Irrigation Regimes at the Seedling Stage,” Life, vol. 13, no. 10, p. 2067, Oct. 2023. [CrossRef]
- M. Kossivi Soviadan, E. Mitowanou Koffi-Tessio, A. Anibueze Enete, N. Jackson Nweze, and M. K. Soviadan, “Impact of Climate Change on Cotton Production: Case of Savannah Region, Northern Togo,” Agricultural Sciences, Scientific research, vol. 10, no. 07, pp. 927–947, 1974. [CrossRef]
- Farooq, A., Shakeel, S. Ahmad, T. M. Khan, and I. Afzal, “Evaluation of breeding potential of cotton germplasm of Pakistan origin for fiber quality traits under heat stress,” Int J Agric Biol, vol. 23, no. 2, 2020. [CrossRef]
- R. Ekinci, S. Basbağ, E. Karademir, and Ç. Karademir, “THE EFFECTS OF HIGH TEMPERATURE STRESS ON SOME AGRONOMIC CHARACTERS IN COTTON,” Pak. J. Bot, vol. 49, no. 2, pp. 503–508, 2017.
- Mertoğlu, K.; Evrenosoğlu, Y.; Polat, M. Combined effects of ethephon and mepiquat chloride on late blooming, fruit set, and phytochemical characteristics of Black Diamond plum. Turk. J. Agric. For. 2019, 43, 544–553. [Google Scholar] [CrossRef]
- Jans, Y.; von Bloh, W.; Schaphoff, S.; Müller, C. Global cotton production under climate change – Implications for yield and water consumption. Hydrol. Earth Syst. Sci. 2021, 25, 2027–2044. [Google Scholar] [CrossRef]
- Wu, F.; Yang, B.; Guo, S.; Huang, W.; Lei, Y.; Xiong, S.; Han, Y.; Wang, Z.; Feng, L.; Li, X.; et al. Adopting different cotton cropping systems may regulate the spatiotemporal variation in soil moisture and affect the growth, WUE and yield of cotton. Ind. Crop. Prod. 2022, 186. [Google Scholar] [CrossRef]
- Effects of Drought Stress on Crop Production and Productivity. Int. J. Res. Stud. Agric. Sci. 2020, 6. [CrossRef]
- Çinar, V.M.; ÜNAY, A. Pamuğun (Gossypium hirsutum l. ) Erken Uygulanan Chlormequat Chloride’e Tepkisi. 2021, 18, 127–131. [Google Scholar] [CrossRef]
- Jia, Y.; Yang, B.; Han, Y.; Wang, G.; Su, T.; Li, X.; Lei, Y.; Zhi, X.; Xiong, S.; Xin, M.; et al. Enhanced Cotton Yield and Fiber Quality by Optimizing Irrigation Amount and Frequency in Arid Areas of Northwest China. Agronomy 2024, 14, 266. [Google Scholar] [CrossRef]
- Murtza, K.; Ishfaq, M.; Akbar, N.; Hussain, S.; Anjum, S.A.; Bukhari, N.A.; AlGarawi, A.M.; Hatamleh, A.A. Effect of Mepiquat Chloride on Phenology, Yield and Quality of Cotton as a Function of Application Time Using Different Sowing Techniques. Agronomy 2022, 12, 1200. [Google Scholar] [CrossRef]
- Priyadrashini, M.; Santoshkumar, G.; Nagabushanam, U.; Reddy, K.P.C. Growth and Yield Attributes of Bt Cotton (Gossypium hirusutum L.) Attributed to Plant Growth Regulators and Defoliants under High Density Planting System. Int. J. Environ. Clim. Chang. 2023, 13, 2252–2260. [Google Scholar] [CrossRef]
- Cao, Z.; Wang, X.; Gao, Y. Effect of Plant Growth Regulators on Cotton Seedling Root Growth Parameters and Enzyme Activity. Plants 2022, 11, 2964. [Google Scholar] [CrossRef] [PubMed]
- T. V Reddy, B. R. Patel, P. Chaudhary, and M. Chaudhary, “Effect of mepiquat chloride on yield attributes, yield and economics of Bt cotton under high density planting system,” The Pharma Innovation Journal, vol. 10, no. 12, pp. 1503–1507, 2021, [Online]. Available: http://www.thepharmajournal.com.
- Arekhi, E.; Bezdi, K.G.; Norozei, H.A.; Faghani, E. The Effect of Growth Regulators on Biochemical Properties, Yield, and Fiber Quality of Different Cultivars of cotton (Gossypium Hirsutum) Under Different Irrigation Intervals. J. Plant Growth Regul. 2023, 42, 5574–5586. [Google Scholar] [CrossRef]
- Hu, T.; Liu, Z.; Jin, D.; Chen, Y.; Zhang, X.; Chen, D. Effects of Growth Regulator and Planting Density on Cotton Yield and N, P, and K Accumulation in Direct-Seeded Cotton. Agronomy 2023, 13, 501. [Google Scholar] [CrossRef]
- Gomez Arturo, A. and Gomez Kwanchai A., Statistical Procedures for Agricultural Research, 2nd ed. New York: John Wiley and Sons Co, 1984.
- Hessini, K.; Martínez, J.P.; Gandour, M.; Albouchi, A.; Soltani, A.; Abdelly, C. Effect of water stress on growth, osmotic adjustment, cell wall elasticity and water-use efficiency in Spartina alterniflora. Environ. Exp. Bot. 2009, 67, 312–319. [Google Scholar] [CrossRef]
- P. Bernier, M. Lamhamedi, and D. G. Simpson, “Shoot:root ratio is of limited use in evaluating the quality of container conifer stock,” Tree Planters’ Notes, vol. 46, no. 3, pp. 102–106, Jan. 1995.
- K. Singh, P. Rathore, K. Singh, and S. Mishra, “Manipulations of source sink relationships through mepiquat chloride for enhancing cotton productivity and monetary returns in north western India,” Indian Journal of Cotton Research and Development, vol. 31, no. 1, pp. 62–68, Feb. 2017.
- Kenanoğlu, B.B.; Mertoğlu, K.; Durul, M.S.; Korkmaz, N.; Çolak, A.M. Maternal Environment and Priming Agents Effect Germination and Seedling Quality in Pitaya under Salt Stress. Horticulturae 2023, 9, 1170. [Google Scholar] [CrossRef]
- Collins, G.D.; Edmisten, K.L.; Wells, R.; Whitaker, J.R. The Effects of Mepiquat Chloride Applied to Cotton at Early Bloom and Physiological Cutout. J. Cotton Sci. 2017, 21, 183–189. [Google Scholar] [CrossRef]
- Sawan, Z.M. "Plant Density; Plant Growth Retardants: Its Direct and Residual Effects On Cotton Yield and Fiber Properties". Int. J. Environ. Sci. Nat. Resour. 2017, 5. [Google Scholar] [CrossRef]
- Kaul, A.; Deol, J.S.; Brar, A.S. Response of different Bt cotton (Gossypium hirsutum L.) hybrids to canopy modification practices. J. Appl. Nat. Sci. 2016, 8, 1188–1197. [Google Scholar] [CrossRef]
- Zhang, Q.-C.; Deng, X.-X.; Wang, J.-G. The effects of mepiquat chloride (DPC) on the soluble protein content and the activities of protective enzymes in cotton in response to aphid feeding and on the activities of detoxifying enzymes in aphids. BMC Plant Biol. 2022, 22, 1–15. [Google Scholar] [CrossRef]
- Samples, C.; Dodds, D.; Catchot, A.; Golden, B.; Gore, J.; Varco, J. Determining Optimum Plant Growth Regulator Application Rates in Response to Fruiting Structure and Flower Bud Removal. J. Cotton Sci. 2015, 19, 359–367. [Google Scholar] [CrossRef]
- F. Killi, L. Efe, and S. Mustafayev, “Genetic and Environmental Variability in Yield, Yield Components and Lint Quality Traits of Cotton,” Int J Agric Biol, vol. 7, pp. 1007–1010, Jun. 2005.
- D. M. Oosterhuis, K. Kosmidou, and J. T. Cothren, “Managing Cotton Growth and Development with Plant Growth Regulators,” in Proceedings of the World Cotton Research Conference -2, Athens - Greece, Sep. 1998, pp. 46–68.
- O. S. Khetre, V. Shinde, B. Asewar, and M. Iab, “Response of growth and yield of Bt cotton to planting densities as influenced by growth regulators,” International Journal of Chemical Studies, vol. 6, no. 4, pp. 485–488, Jun. 2018.
- Mondino, M.H.; A Peterlin, O.; Garay, F. RESPONSE OF LATE-PLANTED COTTON TO THE APPLICATION OF A GROWTH REGULATOR (Chlorocholine chloride, CYCOCEL 75). Exp. Agric. 2004, 40, 381–387. [Google Scholar] [CrossRef]
- C. York, “Cotton Cultivar Response to Mepiquat Chloride,” Agron J, vol. 75, no. 4, pp. 663–667, Jul. 1983.
- Kaur, S.; Singh, K.; Deol, J.S.; Malik, S.; Kaur, N. Effect of plant growth regulators and defoliants on growth and productivity of american cotton (Gossypium hirsutum L.). Agric. Res. J. 2021, 58, 650–656. [Google Scholar] [CrossRef]
- K. Priyanka, M. S. Rekha, K. Lakshman, and R. CH. Sujani, “Influence of plant growth regulators in cotton under HDPS.,” The Pharma Innovation International Journal, vol. 10, no. 7, pp. 329–357, 2021.
- R. Gobi, V. Vaiyapuri, Vinoth Kumar SR, and Murugan G, “Effects of Nutrients and Plant Growth Regulators on Yield and Quality Characters of Cotton,” J Pharmacogn Phytochem, vol. 8, no. 2, pp. 391–393, 2019.
- Stuart, B.L.; Isbell, V.R.; Wendt, C.W.; Abernathy, J.R. Modification of Cotton Water Relations and Growth with Mepiquat Chloride1. Agron. J. 1984, 76, 651–655. [Google Scholar] [CrossRef]
- Abbas, H.; Wahid, M.A.; Sattar, A.; Tung, S.A.; Saleem, M.F.; Irshad, S.; Alkahtani, J.; Elshikh, M.S.; Cheema, M.; Li, Y. Foliar application of mepiquat chloride and nitrogen improves yield and fiber quality traits of cotton (Gossypium hirsutum L.). PLOS ONE 2022, 17, e0268907. [Google Scholar] [CrossRef] [PubMed]
- Zhao, W.; Yan, Q.; Yang, H.; Yang, X.; Wang, L.; Chen, B.; Meng, Y.; Zhou, Z. Effects of mepiquat chloride on yield and main properties of cottonseed under different plant densities. J. Cotton Res. 2019, 2, 1–10. [Google Scholar] [CrossRef]
- O. Çopur, U. Demirel, and M. Karakuş, “Effects of Several Plant Growth Regulators on the Yield and Fiber Quality of Cotton (Gossypium hirsutum L.),” Not Bot Horti Agrobot Cluj Napoca, vol. 38, no. 3, pp. 104–110, 2010. [CrossRef]
- S. Sravanthi, M. S. Rekha, B. Venkateswarlu, Rao Ch. Sujani, and K. Jayalalitha, “Effect of Defoliants on Percent Defoliation and Yield of American Cotton (Gossypium Hirsutum),” Research on Crops, vol. 23, no. 2, pp. 458–465, 2022.
- S. Khamdullaev, S. Nabiev, A. Azimov, J. Shavkiev, and U. Yuldashov, “Combining Ability of Yield and Yield Components in Upland Cotton (G. hirsutum L.) Genotypes Under Normal and Water-Deficit Conditions,” Plant Cell Biotechnol Mol Biol, vol. 22, no. 35 & 36, pp. 176–186, May 2021.
- R. Vistro et al., “Effect of KCl Priming on Wheat Seed Germination and Early Seedling Growth,” International Journal of Agricultural Technology, vol. 13, no. 3, pp. 353–362, 2017.
- L. M. Verhalen, B. E. Greenhagen, and R. W. Thacker, “Lint Yield, Lint Percentage, and Fiber Quality Response in Bollgard, Roundup Ready, and Bollgard/Roundup Ready Cotton,” J Cotton Sci, vol. 7, no. 2, pp. 23–38, 2003, [Online]. Available: http://journal.cotton.
- Yasar, S.; Karademir, E. DETERMINATION OF THE FACTORS LIMITING COTTON FIBER QUALITY IN TURKEY. Spring 2021, 185, 85–99. [Google Scholar] [CrossRef]
- S. Shahat, H. Arafa, and M. Sief, “Comparative Study on Egyptian cotton Fiber Maturity Measurements Using Direct and Indirect Methods,” IOSR Journal of Polymer and Textile Engineering, vol. 9, no. 3, pp. 1–9, Aug. 2022. [CrossRef]
- Watts, D.B.; Runion, G.B.; Nannenga, K.W.S.; Torbert, H.A. Enhanced-Efficiency Fertilizer Effects on Cotton Yield and Quality in the Coastal Plains. Agron. J. 2014, 106, 745–752. [Google Scholar] [CrossRef]
- S. Shahat, H. Arafa, and M. Sief, “Impact of fiber maturity levels on fineness, maturity, strength and elongation measurements in Egyptian cotton,” IOSR Journal of Polymer and Textile Engineering, vol. 9, no. 4, pp. 13–23, Aug. 2022. [CrossRef]
- Qi, H.-K.; DU, M.-W.; Meng, L.; Xie, L.-W.; Eneji, A.E.; Xu, D.-Y.; Tian, X.-L.; Li, Z.-H. Cotton maturity and responses to harvest aids following chemical topping with mepiquat chloride during bloom period. J. Integr. Agric. 2022, 21, 2577–2587. [Google Scholar] [CrossRef]
- K. Singh, P. Rathore, and K. Singh, “Dose and Time Dependent Efficacy Alteration of Different Defoliants on Seed Cotton Yield,” J Environ Biol, vol. 36, no. 4, pp. 891–895, Sep. 2015.
- Echer, F.R.; Rosolem, C.A. Plant growth regulator losses in cotton as affected by adjuvants and rain. Cienc. Rural. 2012, 42, 2138–2144. [Google Scholar] [CrossRef]
- D. M. Oosterhuis, J. T. Cothren, J. A. Landivar, J. A. Hickey, and A. Steger, “Late-Season Applications of PGR-LV to Remediate Fruit Shed and Enhance Maturity and Yield,” in Beltwide Cotton Production Conference, C. P. Dugger and A. D. Richter, Eds., New Orleans, LA, Jan. 1997, p. 1399.
- J. T. Cothren, J. A. Landivar, and D. M. Oosterhui, “Mid-Flowering Application of PGR-IV to Enhance Cotton Maturity and Yield,” in Beltwide Cotton Production Conference, C. P. Dugger and D. A. Richter, Eds., Nashville, TN, Jan. 1996, p. 1149.
Figure 1.
Mean monthly rainfall, wind speed and temperature for 2022 cropping season.
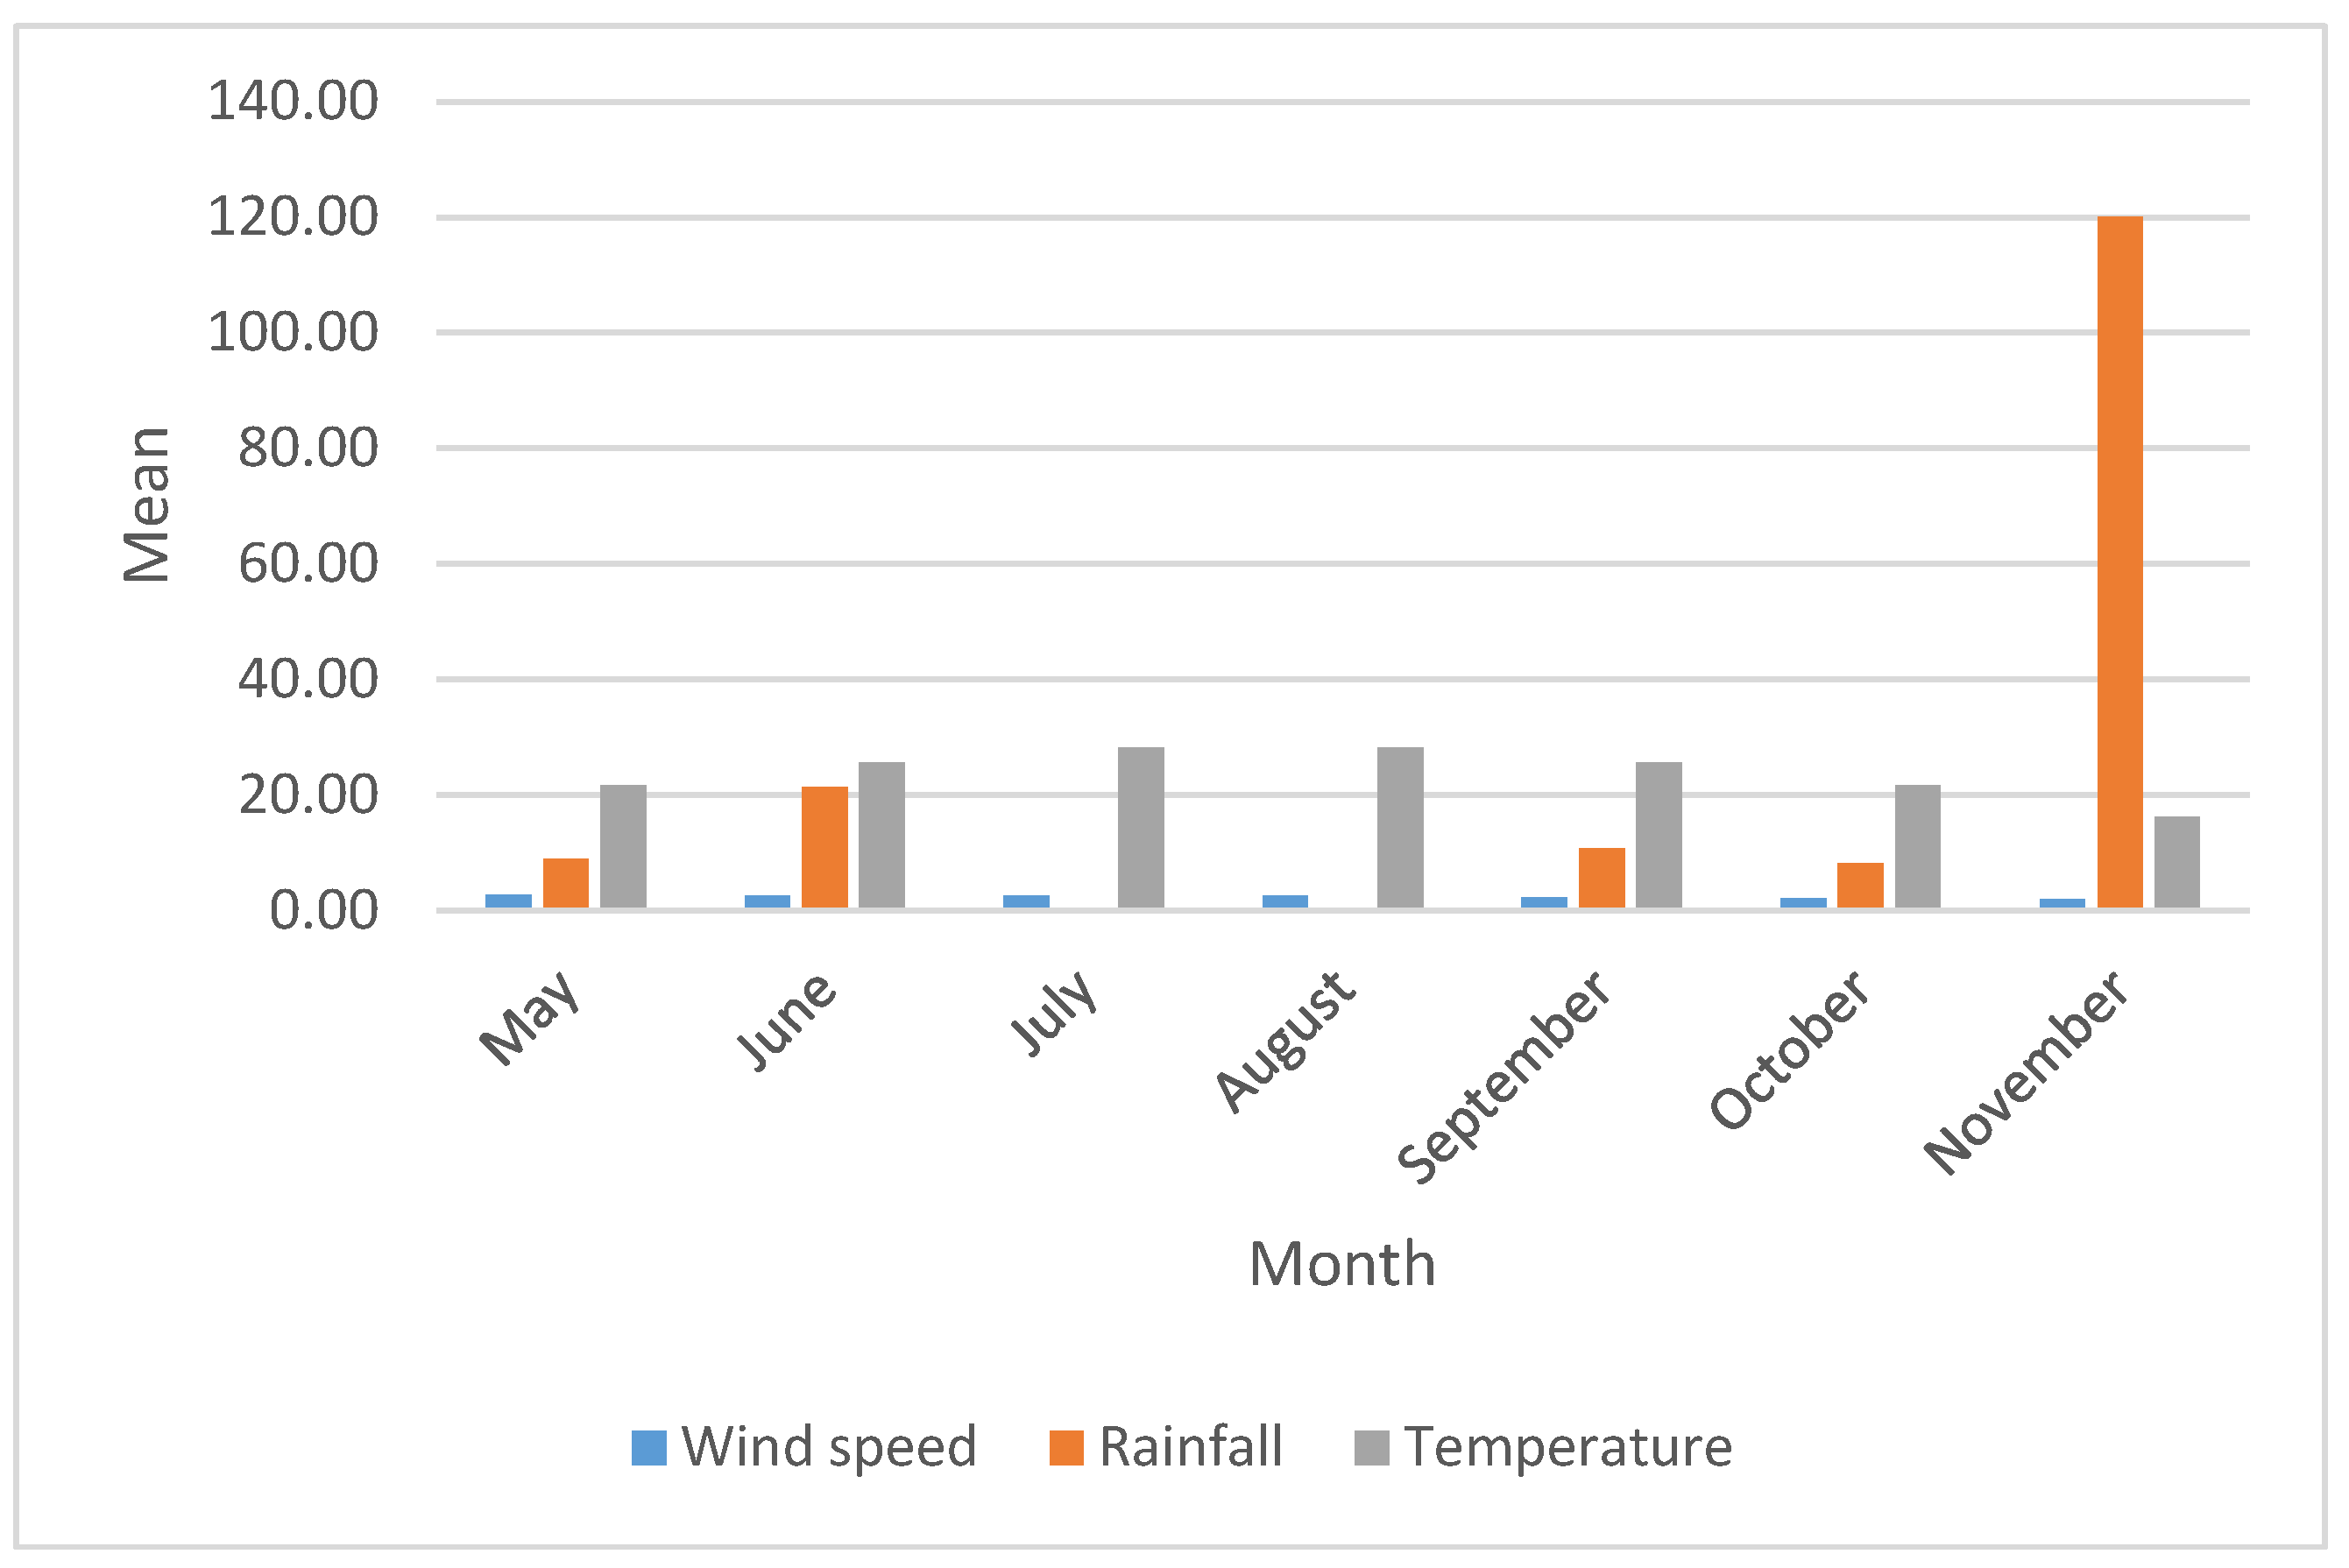
Figure 2.
Mean monthly rainfall, wind speed and temperature for 2023 cropping season.
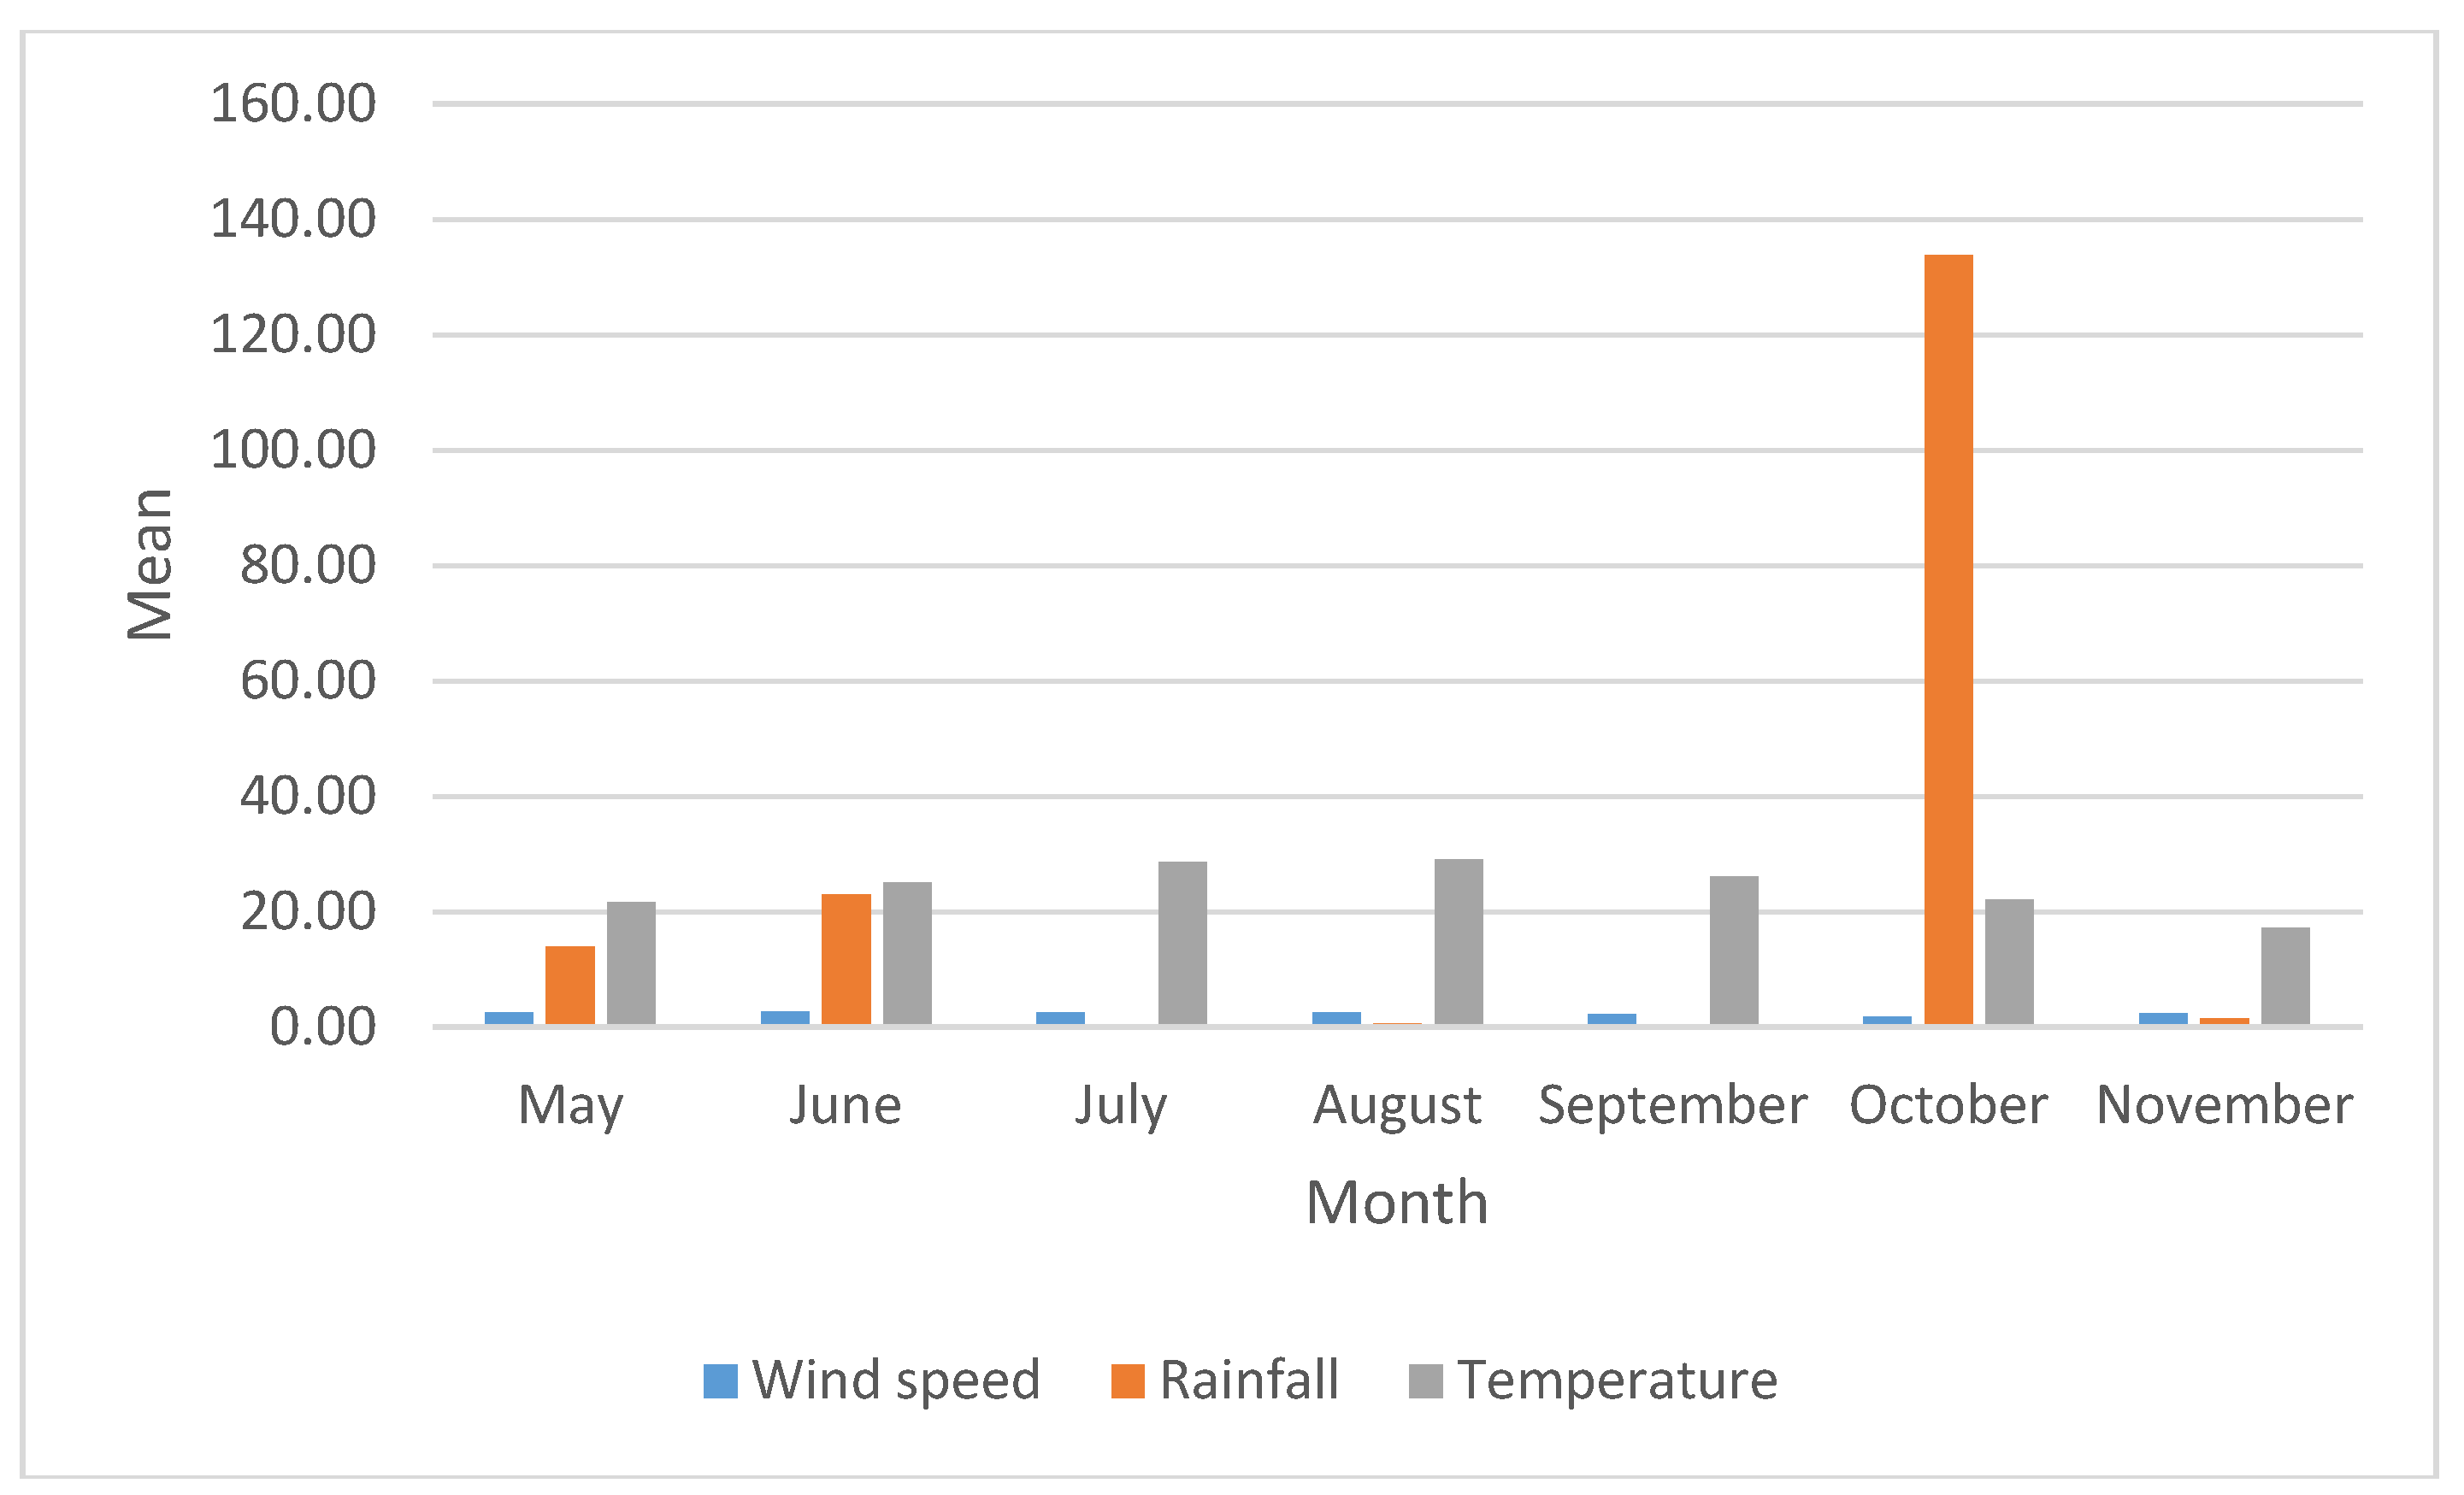
Figure 3.
Effect of Mepiquat Chloride concentrations on shoot-root ratio at different growth stages in 2022.
Figure 3.
Effect of Mepiquat Chloride concentrations on shoot-root ratio at different growth stages in 2022.
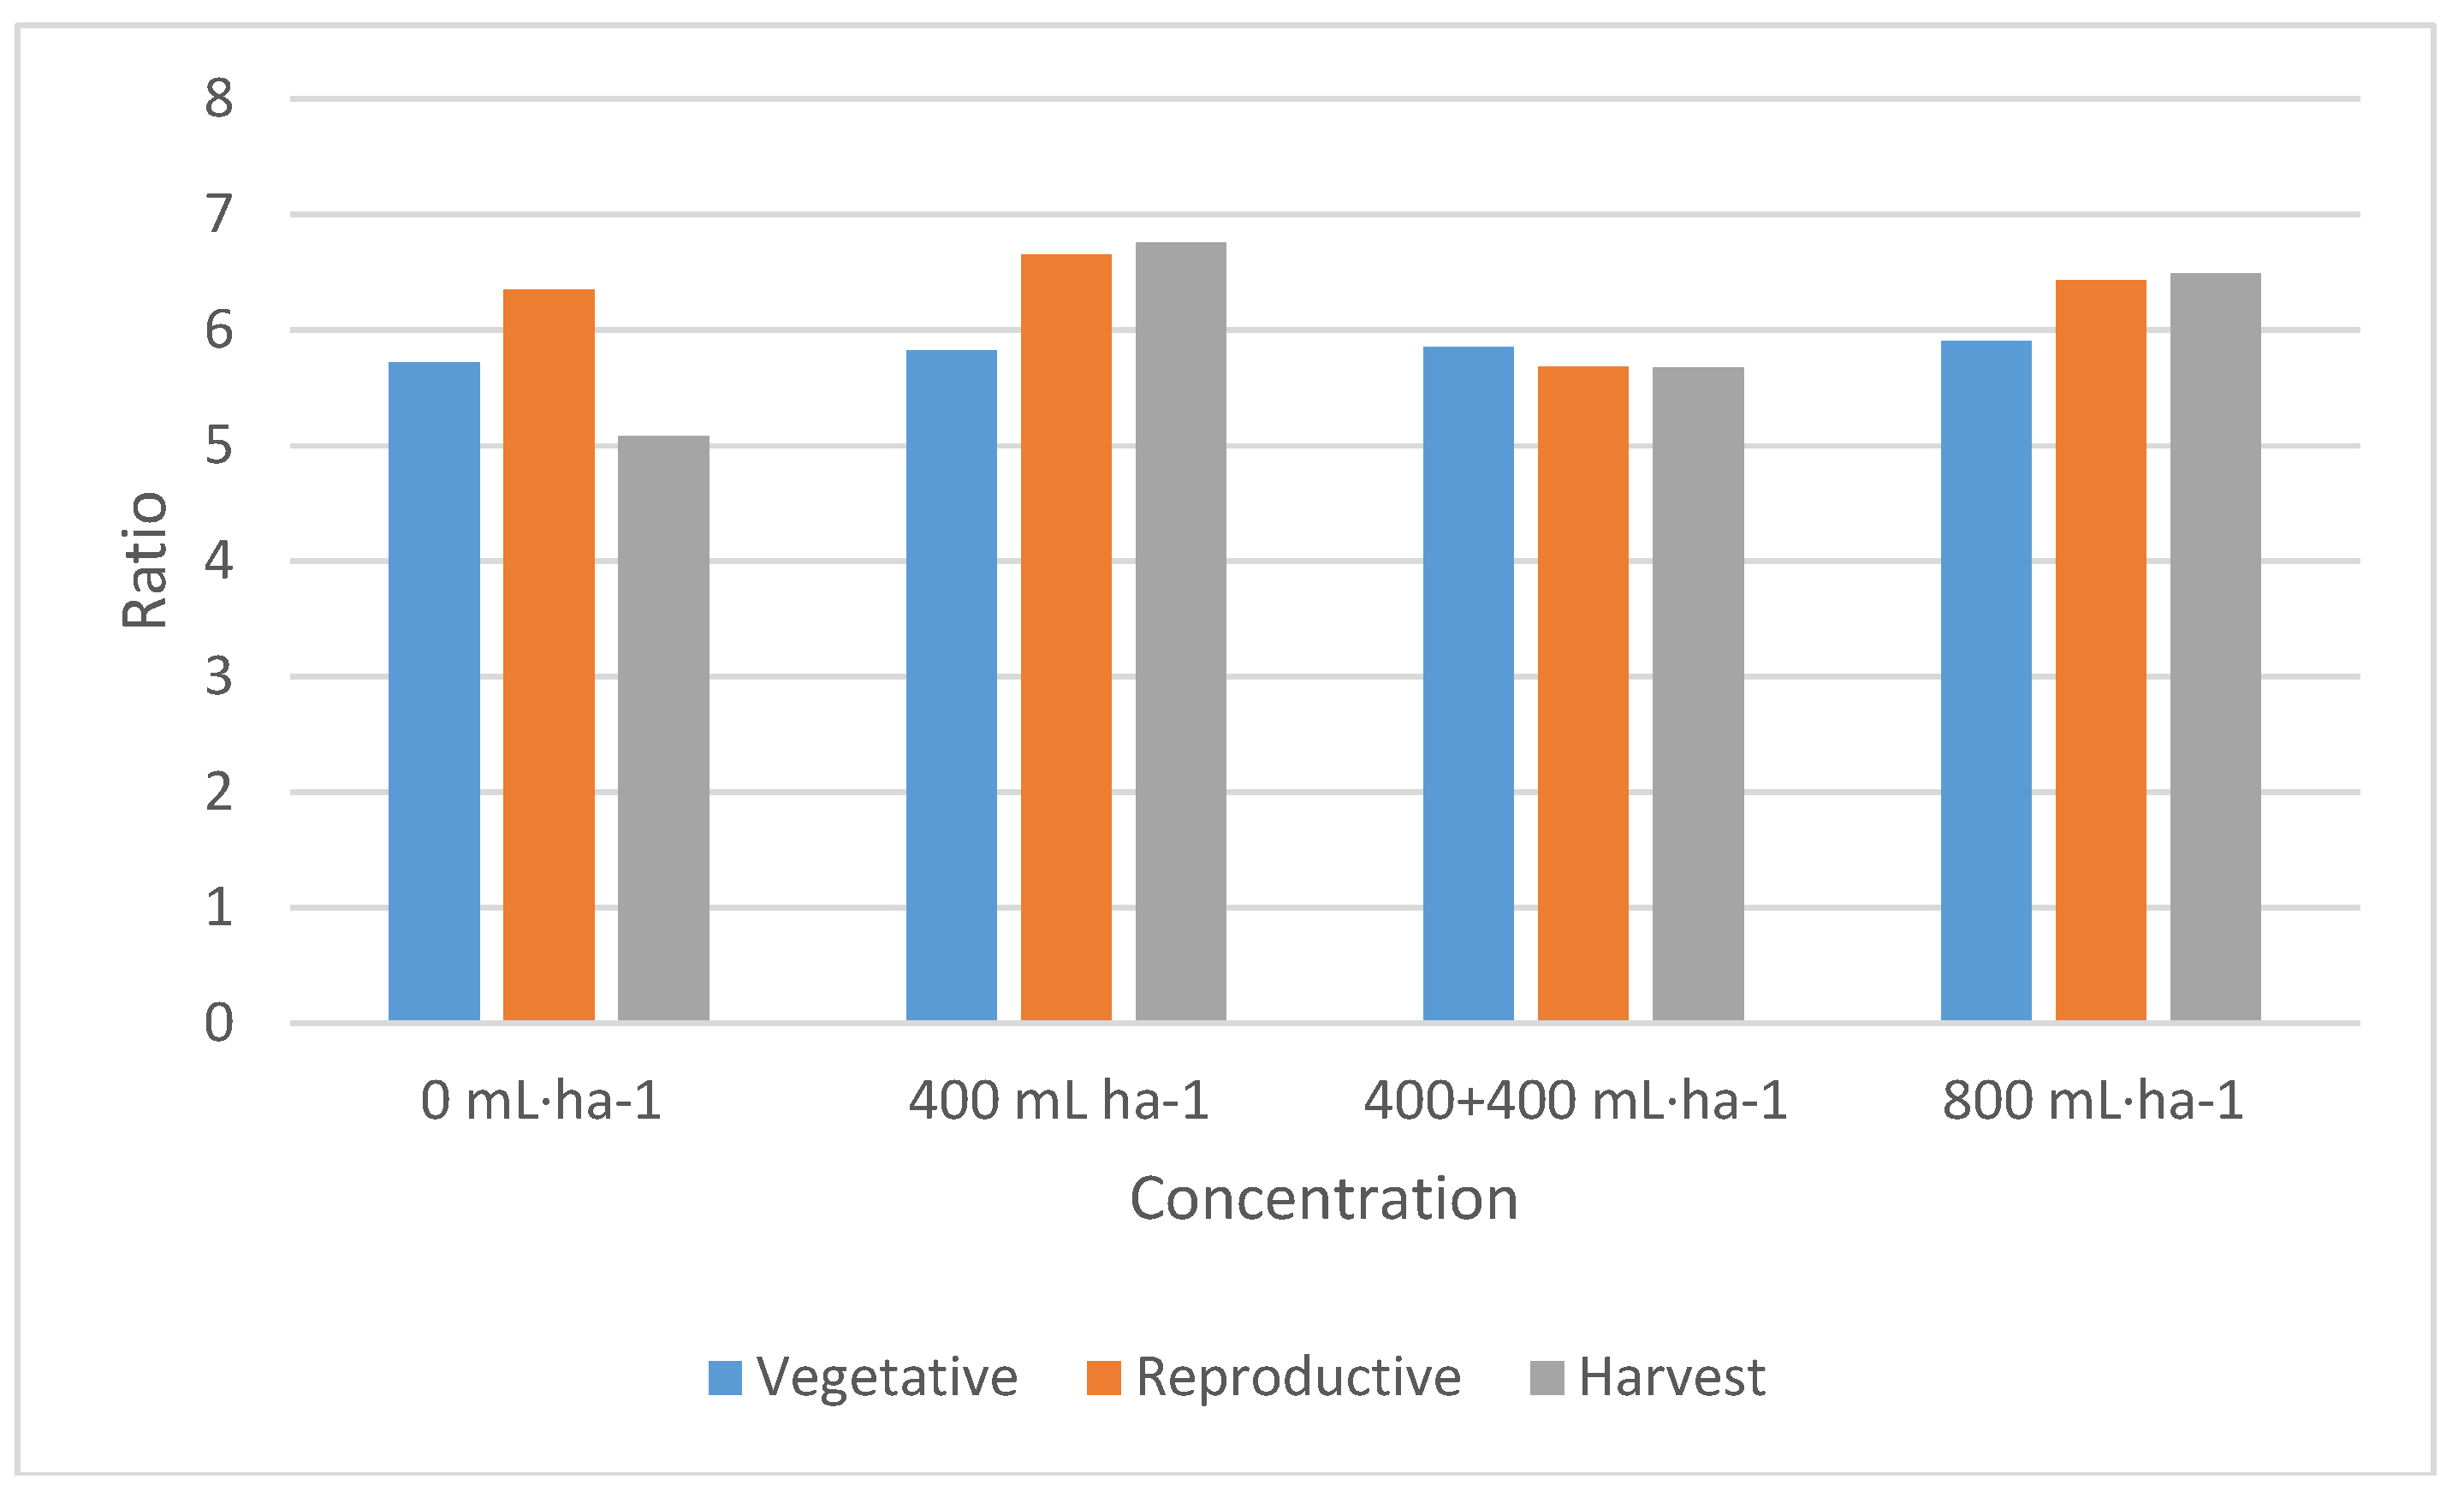
Figure 4.
Effect of different Mepiquat Chloride application timing on shoot-root ratio of cotton varieties at different growth stages in 2022.
Figure 4.
Effect of different Mepiquat Chloride application timing on shoot-root ratio of cotton varieties at different growth stages in 2022.
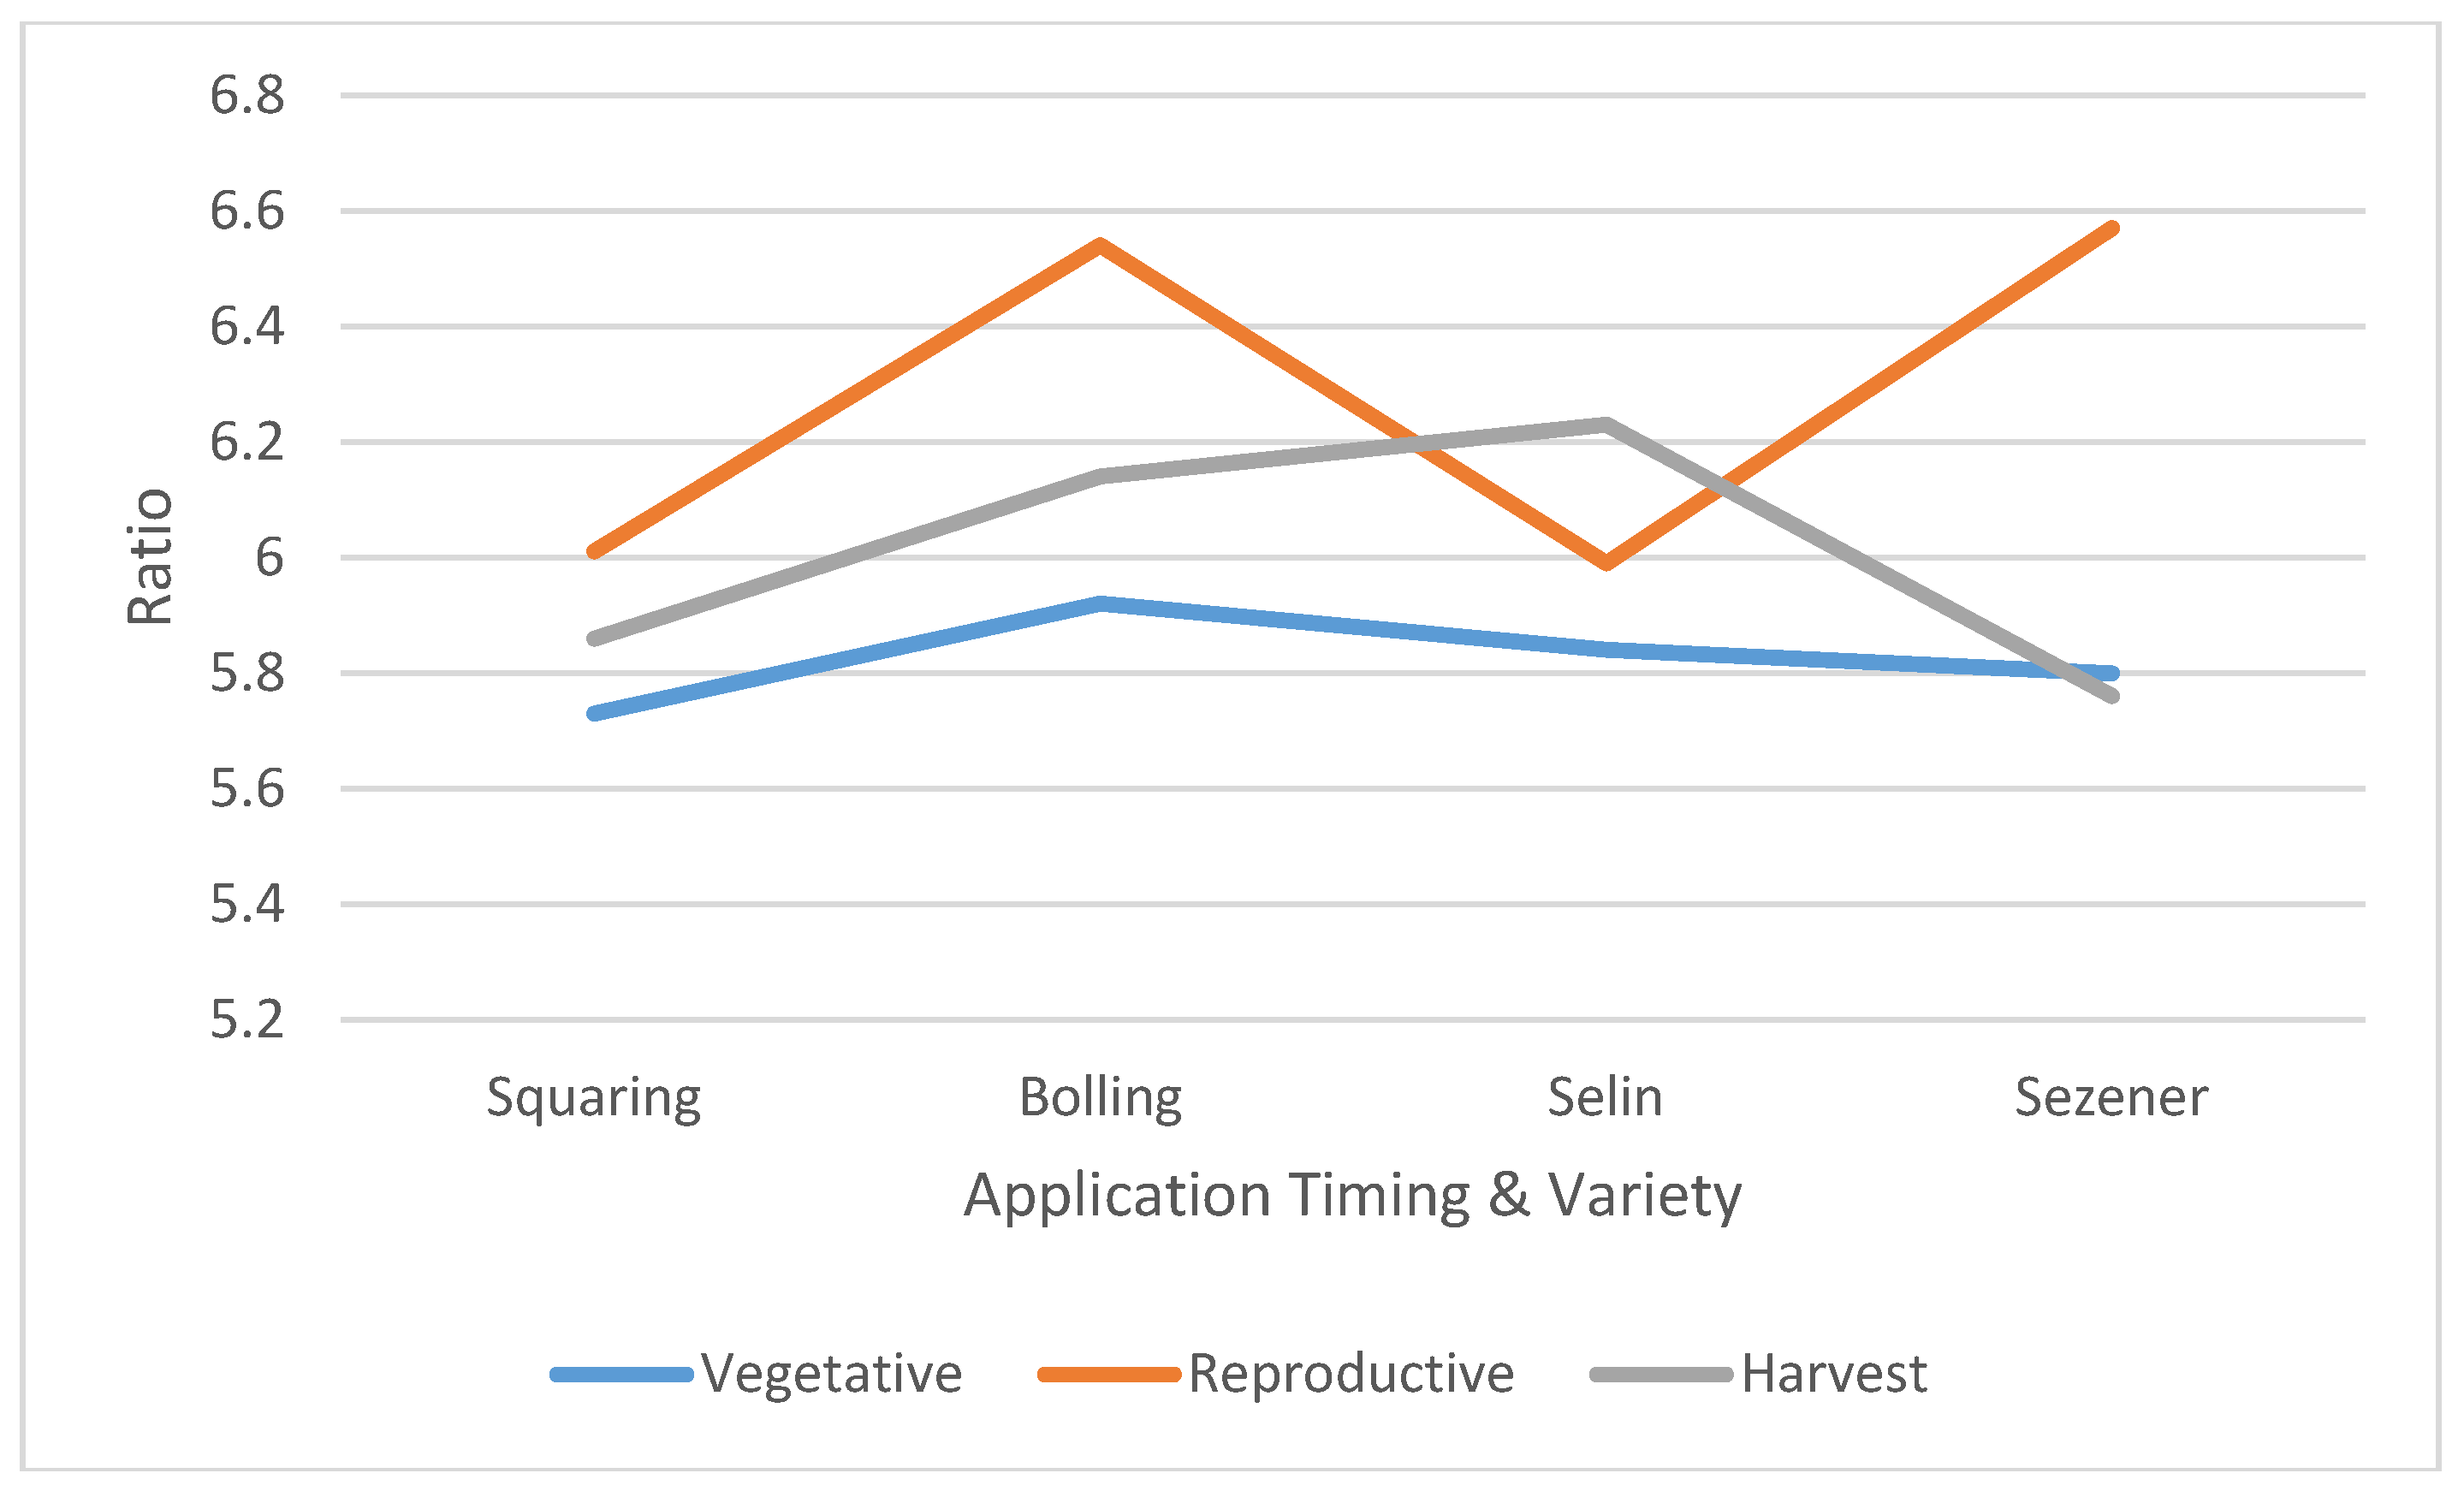
Figure 5.
Effect of Mepiquat Chloride concentrations on shoot-root ratio at different growth stages in 2023.
Figure 5.
Effect of Mepiquat Chloride concentrations on shoot-root ratio at different growth stages in 2023.
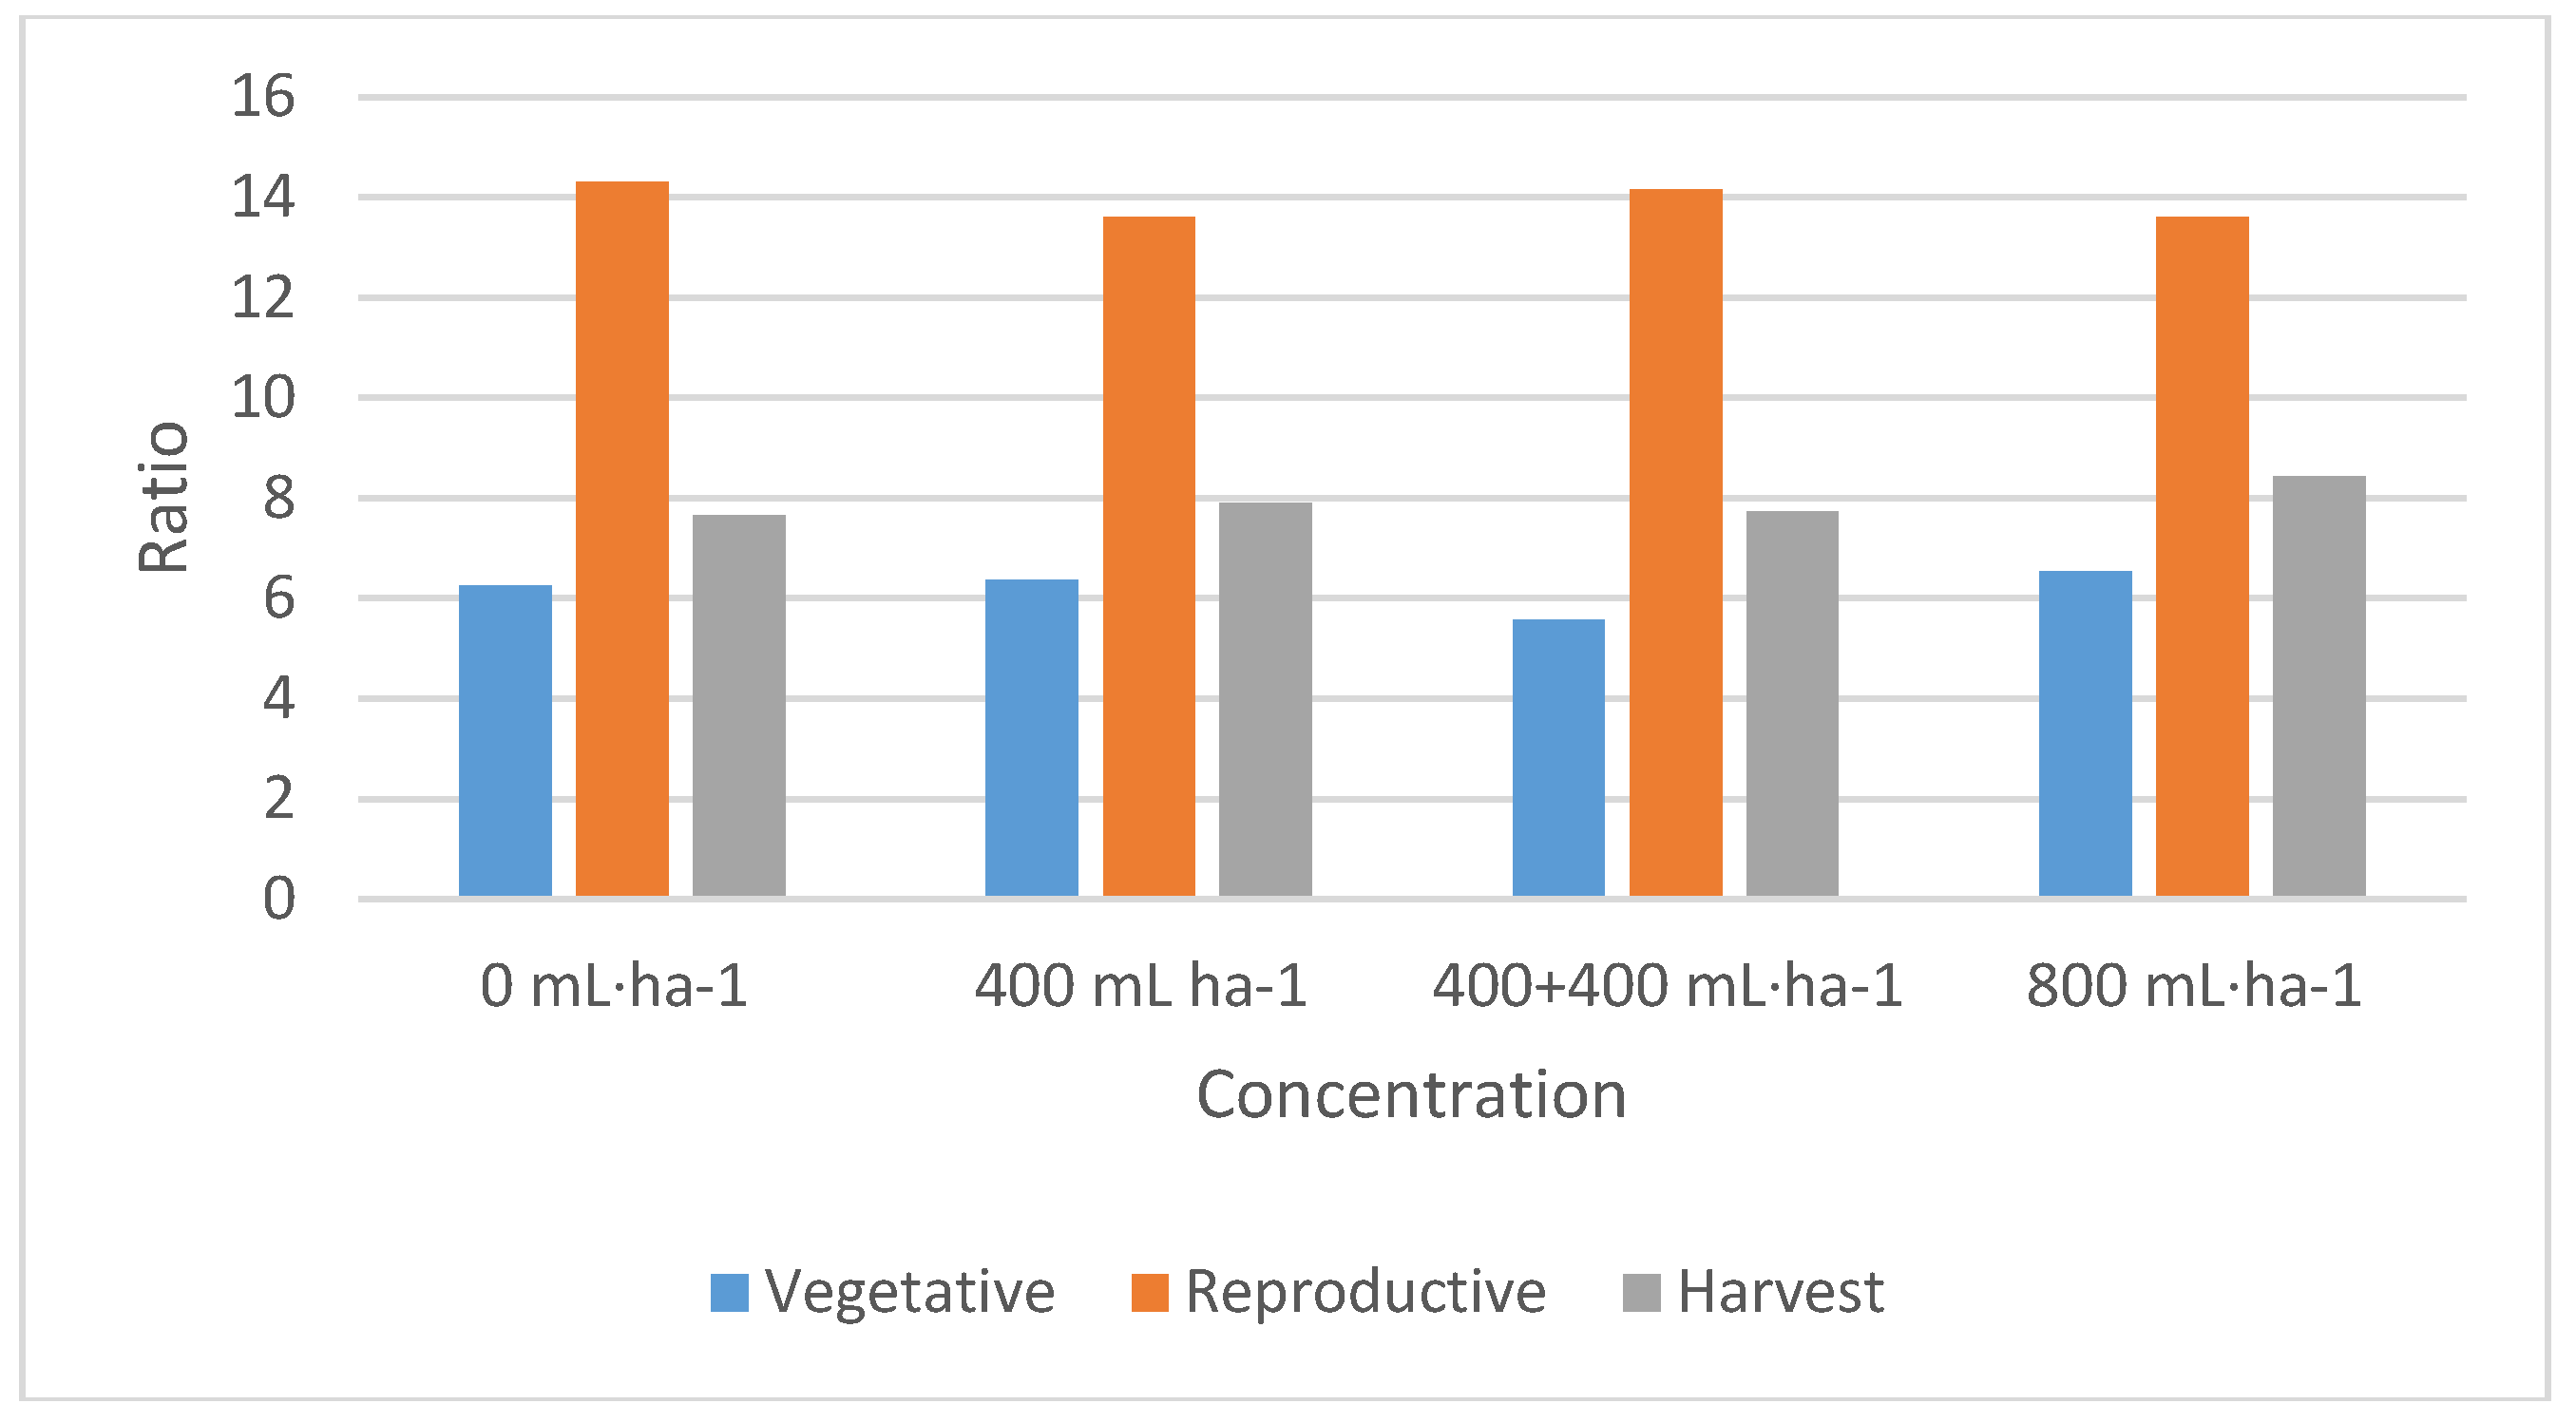
Figure 6.
Effect of different Mepiquat Chloride application timing on shoot-root ratio of cotton varieties at different growth stages in 2023.
Figure 6.
Effect of different Mepiquat Chloride application timing on shoot-root ratio of cotton varieties at different growth stages in 2023.
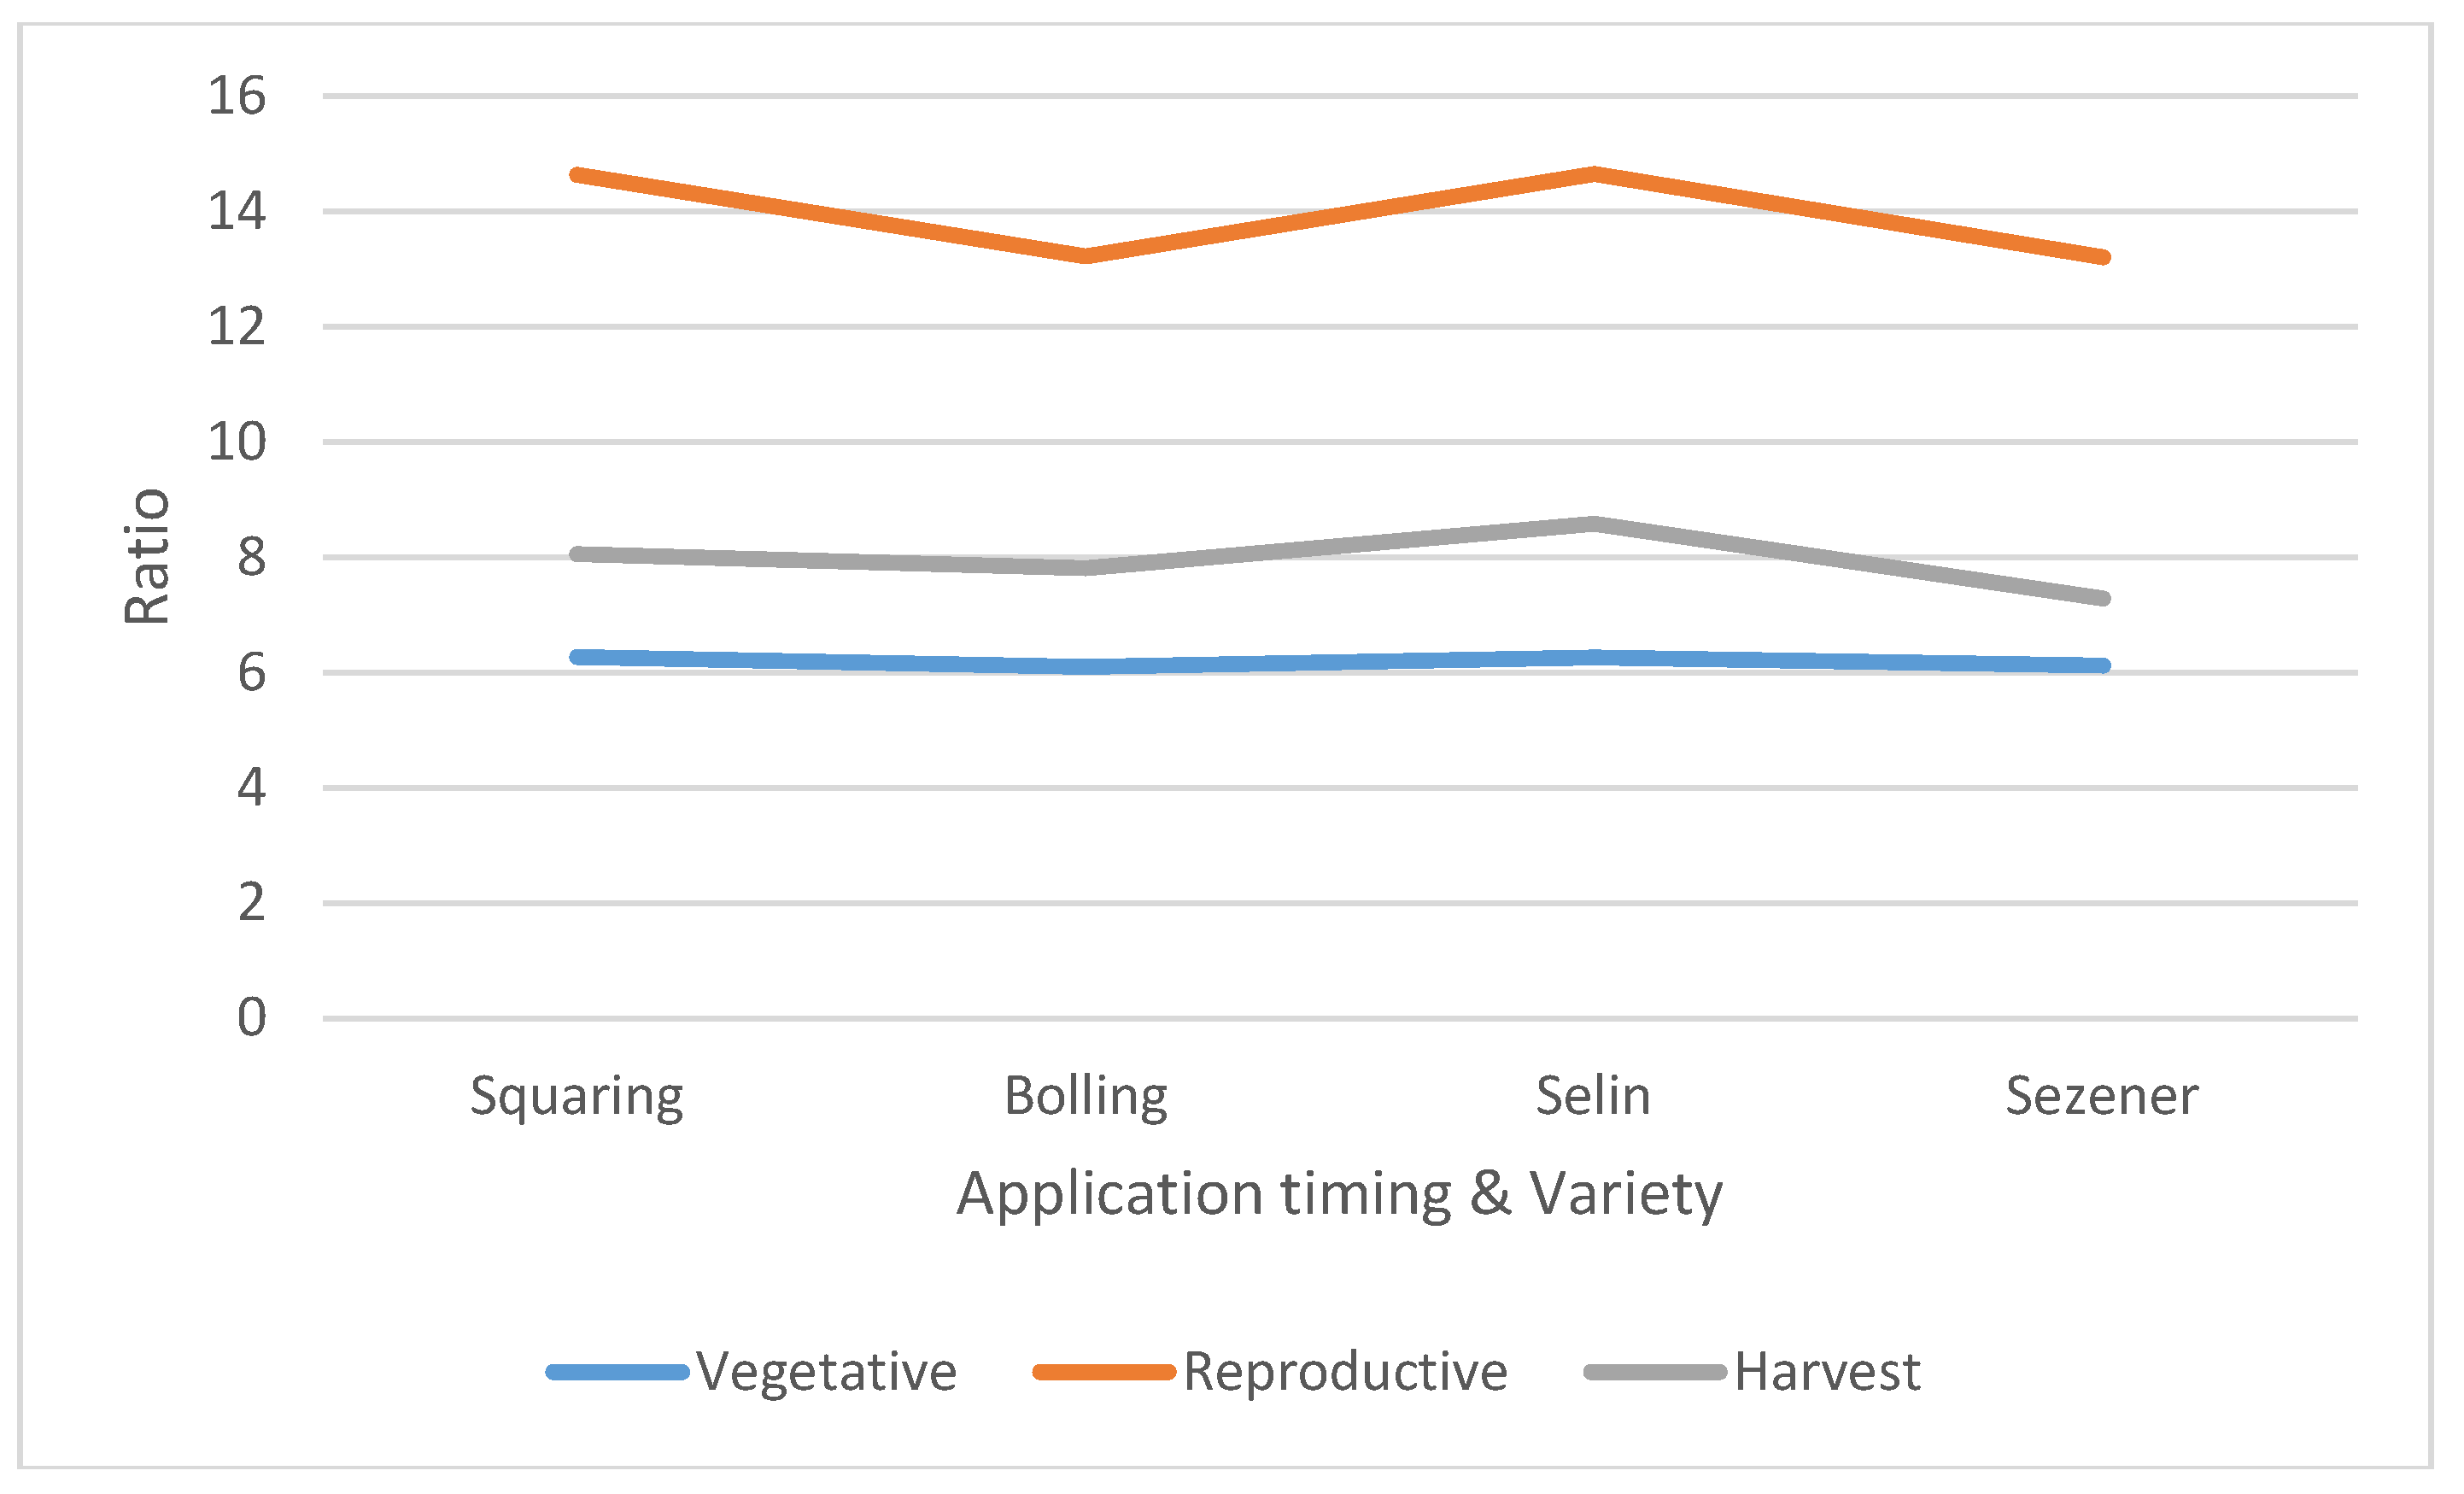
Figure 7.
Effect of Mepiquat Chloride application on fiber percent of different cotton varieties under different application intervals (2022– 2023).
Figure 7.
Effect of Mepiquat Chloride application on fiber percent of different cotton varieties under different application intervals (2022– 2023).
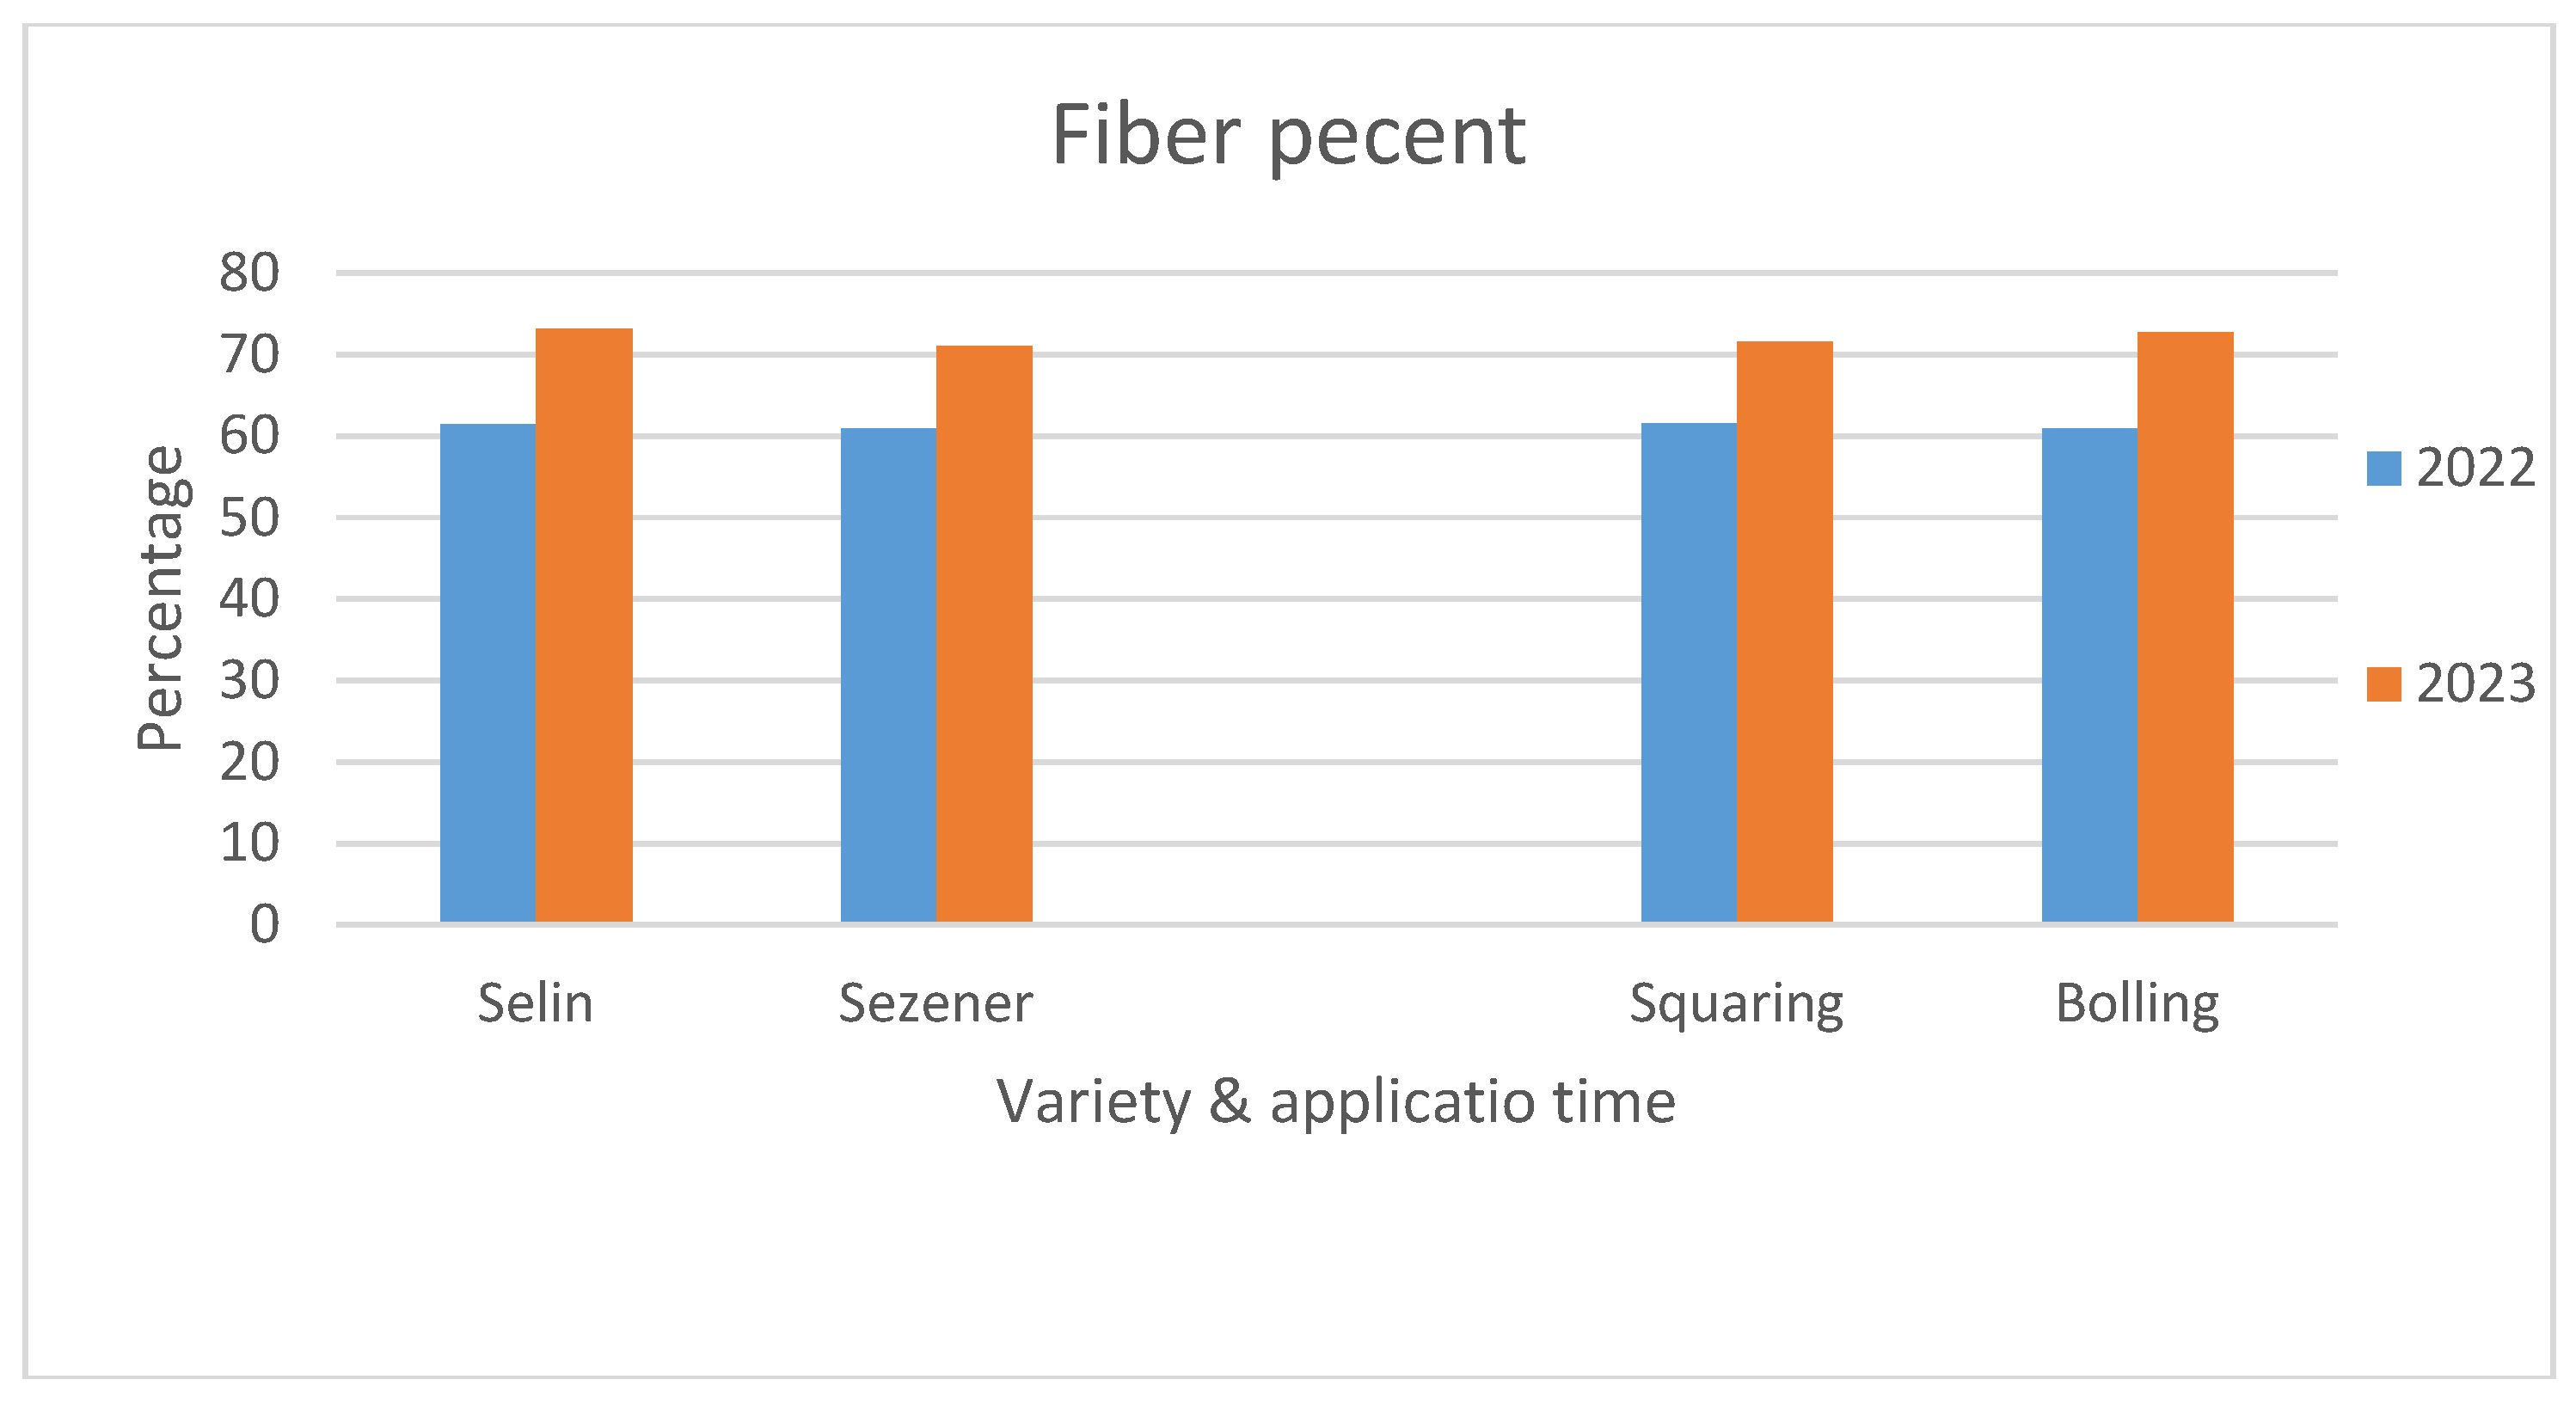
Figure 8.
Effect of Mepiquat Chloride application on maturity index of different cotton varieties under different application intervals (2022– 2023).
Figure 8.
Effect of Mepiquat Chloride application on maturity index of different cotton varieties under different application intervals (2022– 2023).
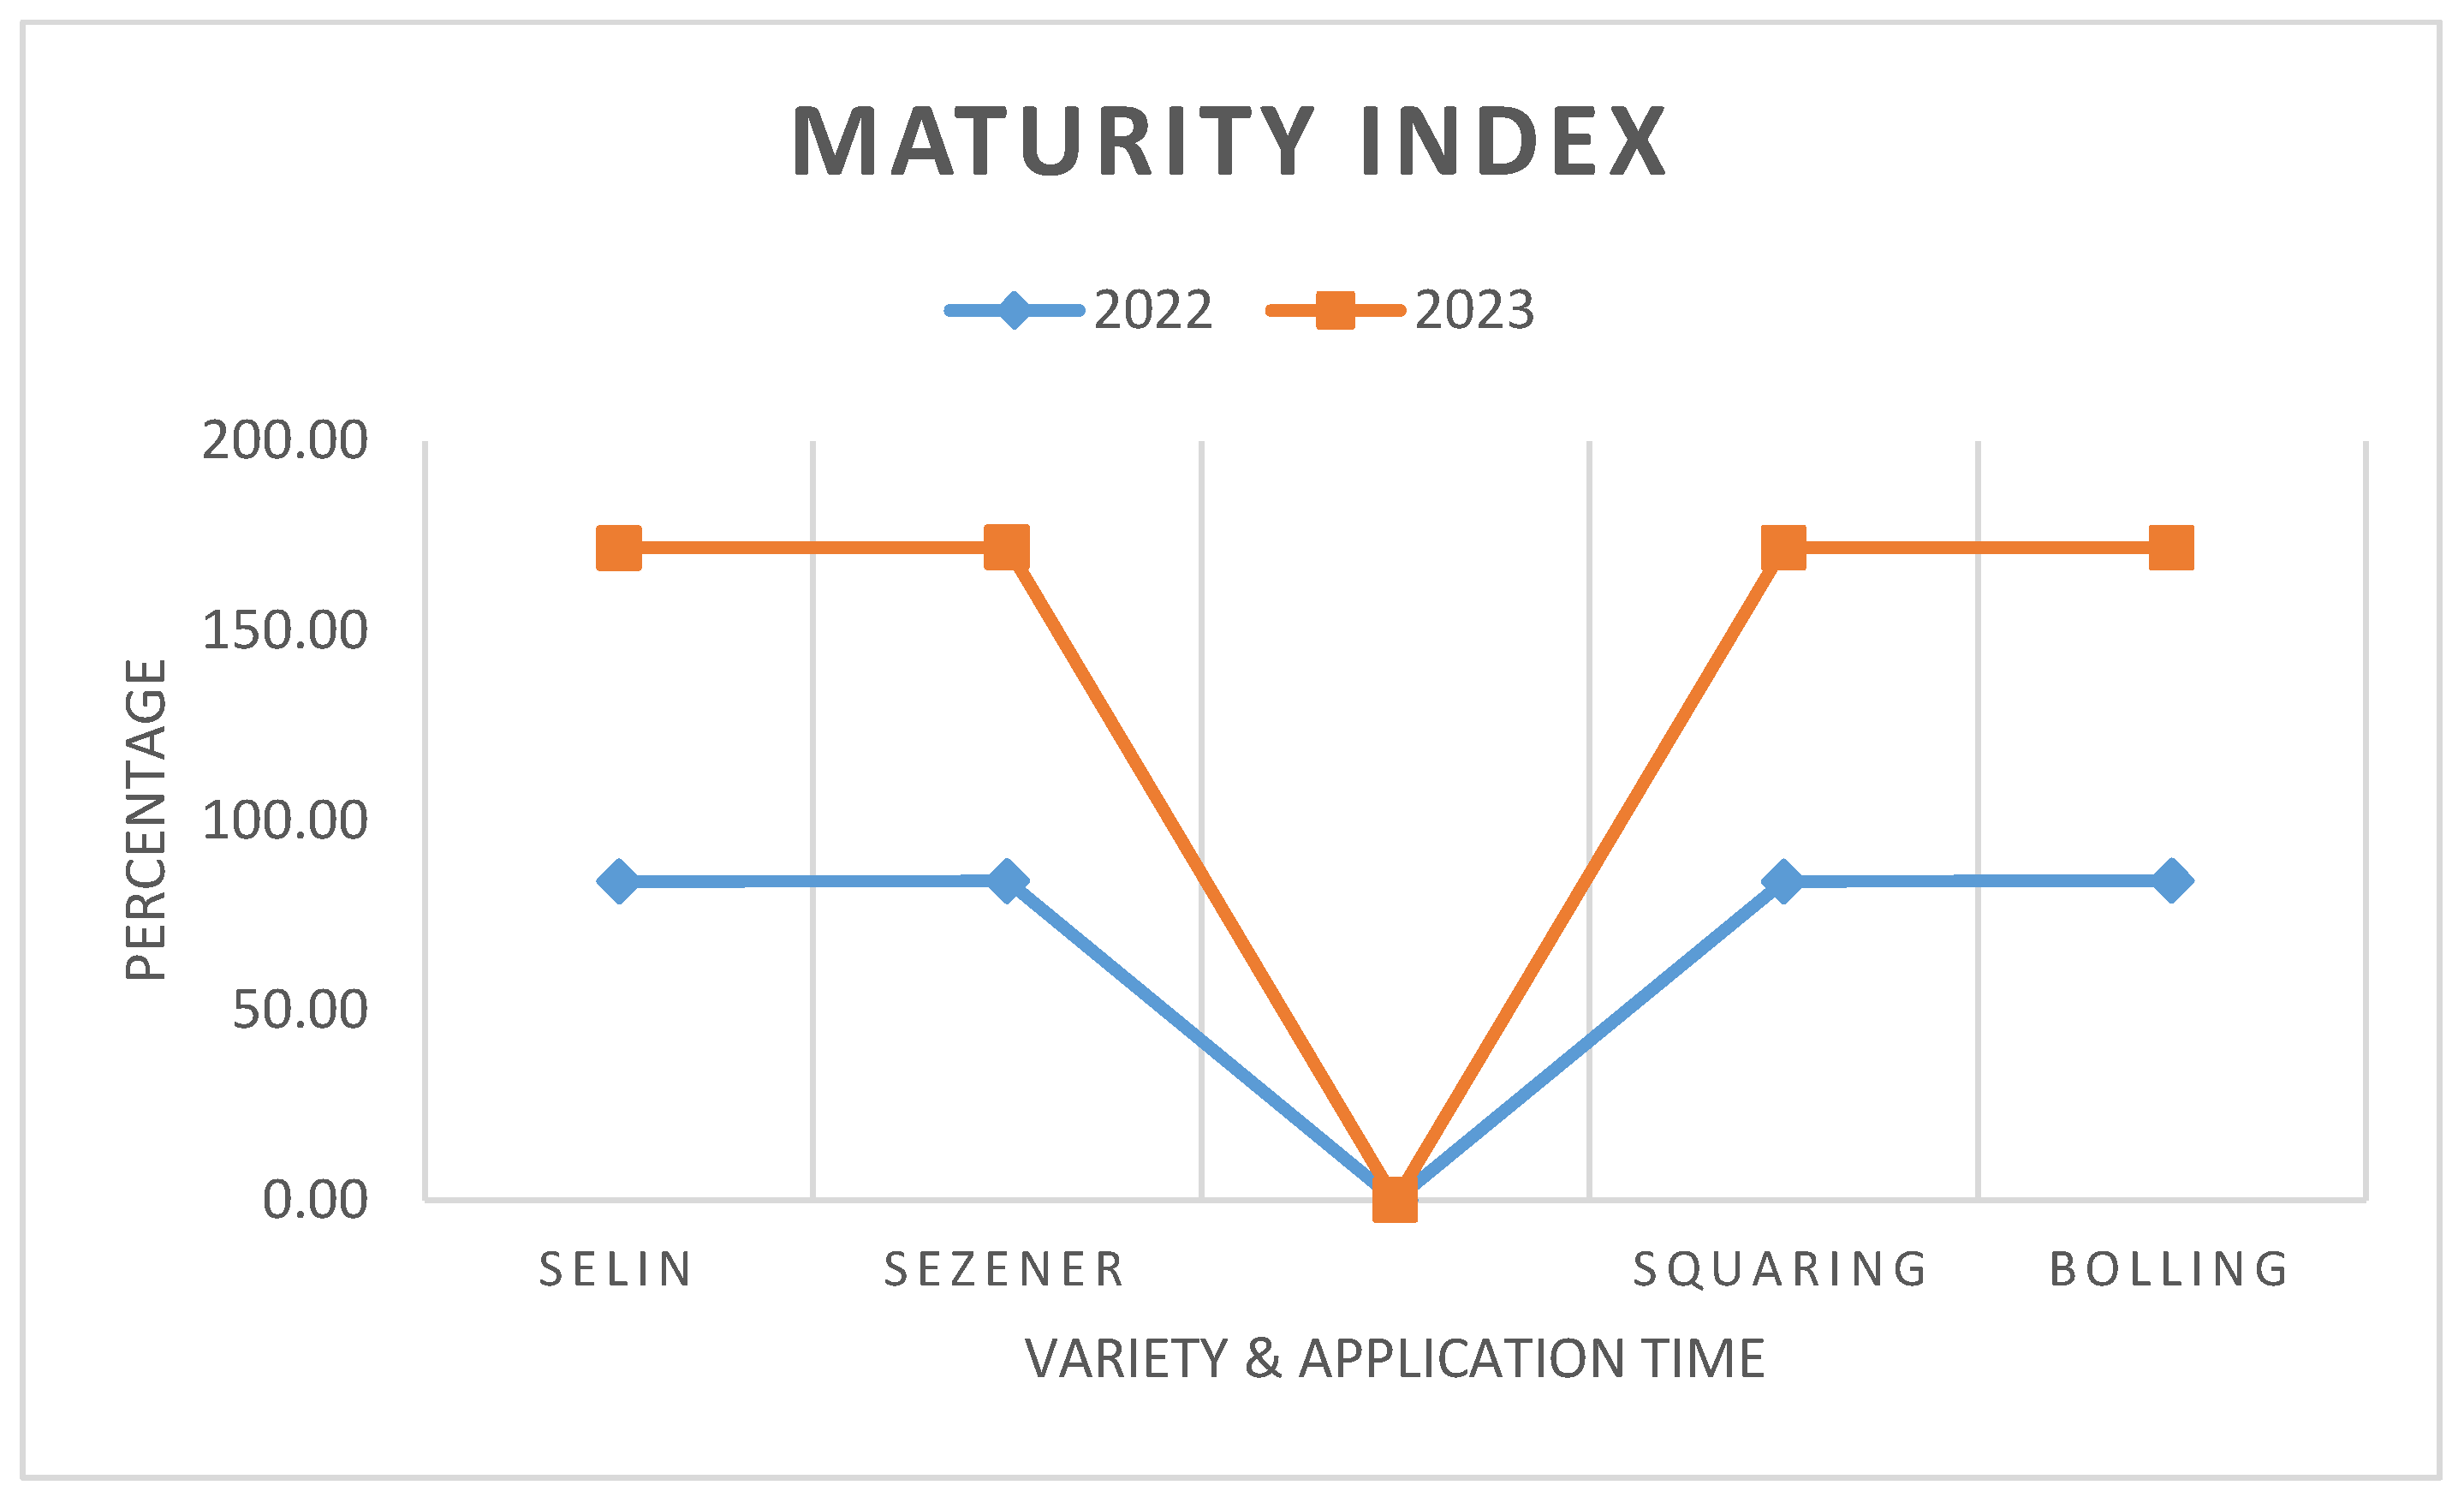

Table 1.
Variance Analysis of Shoot-Root Ratio, Fiber Percent and Maturity Index of different cotton varieties influenced by Mepiquat Chloride (2022–2023).
Table 1.
Variance Analysis of Shoot-Root Ratio, Fiber Percent and Maturity Index of different cotton varieties influenced by Mepiquat Chloride (2022–2023).
| Shoot-to-root ratio | Fiber Percent (%) | Maturity Index (%) | |||||||||
| Source of Variation | df | 2022 | 2023 | 2022 | 2023 | 2022 | 2023 | ||||
| Vegetative | Reproductive | Harvest | Vegetative | Reproductive | Harvest | ||||||
| Conc | 3 | ns | ns | * | ns | ns | ns | ns | ns | ns | ns |
| App. T | 1 | ns | ns | ns | ns | ns | ns | ns | ns | ns | ns |
| Var | 1 | ns | * | ns | ns | ns | ns | ns | ns | ns | ns |
| App. T X Conc | 3 | ns | ns | ns | ns | ns | ns | ns | ns | ns | ns |
| Var X Conc | 3 | ns | ns | ns | ns | ns | ns | ns | ns | ns | ns |
| App. T X Var | 1 | ns | ns | ns | ns | ns | ns | ns | ns | ns | ns |
| Conc X App. T X Var | 3 | ns | ns | ns | ns | ns | ns | ns | ns | ns | ns |
The significance levels * and ns represent p ≤ .05 and p > .05, respectively. Conc = Concentration, App. T = Application Time, Var = Variety, ns = not statistically significant, df = Degrees of freedom.
Table 2.
Interaction of different Mepiquat chloride concentrations and scheduling time on fiber percent of cotton varieties (2022).
Table 2.
Interaction of different Mepiquat chloride concentrations and scheduling time on fiber percent of cotton varieties (2022).
| Sources of variations | Fiber percent (%) | ||||
| Variety | Application Time | T0 | T1 | T2 | T3 |
| Selin | Squaring | 64.60 ± 1.11 | 61.73 ± 2.06 | 60.31 ± 1.21 | 58.29 ± 3.00 |
| Bolling | 60.77 ± 2.64 | 66.29 ± 4.16 | 55.66 ± 3.12 | 64.30 ± 4.22 | |
| Sezener | Squaring | 62.76 ± 4.10 | 60.39 ± 3.06 | 59.61 ± 4.19 | 64.52 ± 2.62 |
| Bolling | 62.05 ± 4.34 | 55.06 ± 1.19 | 60.65 ± 2.56 | 62.11 ± 1.97 | |
| Grand Mean | 61.194 | ||||
| SE | 5.311 | ||||
| CV (%) | 8.678 | ||||
Values represent mean ± SD. T0 = 0 mL·ha-1, T1 = 400 mL·ha-1, T2 = 400+400 mL·ha-1, T3 = 800 mL·ha-1, SD = standard deviation, CV Coefficient of variation.
Table 3.
Interaction of different Mepiquat chloride concentrations and scheduling time on fiber percent of cotton varieties (2023).
Table 3.
Interaction of different Mepiquat chloride concentrations and scheduling time on fiber percent of cotton varieties (2023).
| Sources of variations | Fiber percent (%) | ||||
| Variety | Application Time | T0 | T1 | T2 | T3 |
| Selin | Squaring | 71.65 ± 3.16 | 70.54 ± 0.92 | 72.26 ± 0.77 | 72.86 ± 2.13 |
| Bolling | 76.36 ± 0.78 | 74.74 ± 2.66 | 74.57 ± 1.36 | 72.48 ± 2.28 | |
| Sezener | Squaring | 71.62 ± 3.66 | 70.19 ± 2.59 | 73.87 ± 1.76 | 69.34 ± 1.87 |
| Bolling | 72.49 ± 1.06 | 72.67 ± 4.03 | 68.42 ± 1.26 | 69.88 ± 1.05 | |
| Grand Mean | 72.122 | ||||
| SE | 3.774 | ||||
| CV (%) | 5.233 | ||||
Values represent mean ± SD. T0 = 0 mL·ha-1, T1 = 400 mL·ha-1, T2 = 400+400 mL·ha-1, T3 = 800 mL·ha-1, SD = standard deviation, CV Coefficient of variation.
Table 4.
Interaction of different Mepiquat chloride concentrations and scheduling time on maturity index of cotton varieties (2022).
Table 4.
Interaction of different Mepiquat chloride concentrations and scheduling time on maturity index of cotton varieties (2022).
| Sources of variations | Maturity Index (%) | ||||
| Variety | Application Time | T0 | T1 | T2 | T3 |
| Selin | Squaring | 83.33 ± 0.33 | 83.67 ± 0.33 | 84.00 ± 0.58 | 84.33 ± 0.33 |
| Bolling | 83.67 ± 0.21 | 84.33 ± 0.33 | 84.33 ± 0.33 | 84.00 ± 0.58 | |
| Sezener | Squaring | 84.00 ± 0.58 | 84.33 ± 0.33 | 83.67 ± 0.33 | 84.33 ± 0.33 |
| Bolling | 84.33 ± 0.67 | 84.17 ± 0.17 | 84.00 ± 0.58 | 84.33 ± 0.33 | |
| Grand Mean | 84.063 | ||||
| SE | 0.665 | ||||
| CV (%) | 0.792 | ||||
Values represent mean ± SD. T0 = 0 mL·ha-1, T1 = 400 mL·ha-1, T2 = 400+400 mL·ha-1, T3 = 800 mL·ha-1, SD = standard deviation, CV Coefficient of variation.
Table 5.
Interaction of different Mepiquat chloride concentrations and scheduling time on maturity index of cotton varieties (2023).
Table 5.
Interaction of different Mepiquat chloride concentrations and scheduling time on maturity index of cotton varieties (2023).
| Sources of variations | Maturity Index (%) | ||||
| Variety | Application Time | T0 | T1 | T2 | T3 |
| Selin | Squaring | 87.88 ± 0.17 | 87.50 ± 0.51 | 88.02 ± 0.24 | 87.95 ± 0.10 |
| Bolling | 87.96 ± 0.28 | 88.00 ± 0.21 | 87.32 ± 0.36 | 88.06 ± 0.04 | |
| Sezener | Squaring | 87.37 ± 0.66 | 88.25 ± 0.59 | 88.65 ± 0.42 | 87.79 ± 0.37 |
| Bolling | 86.89 ± 0.68 | 87.94 ± 0.35 | 87.79 ± 0.41 | 88.07 ± 0.62 | |
| Grand Mean | 87.840 | ||||
| SE | 0.725 | ||||
| CV (%) | 0.825 | ||||
Values represent mean ± SD. T0 = 0 mL·ha-1, T1 = 400 mL·ha-1, T2 = 400+400 mL·ha-1, T3 = 800 mL·ha-1, SD = standard deviation, CV Coefficient of variation.
Disclaimer/Publisher’s Note: The statements, opinions and data contained in all publications are solely those of the individual author(s) and contributor(s) and not of MDPI and/or the editor(s). MDPI and/or the editor(s) disclaim responsibility for any injury to people or property resulting from any ideas, methods, instructions or products referred to in the content. |
© 2024 by the authors. Licensee MDPI, Basel, Switzerland. This article is an open access article distributed under the terms and conditions of the Creative Commons Attribution (CC BY) license (http://creativecommons.org/licenses/by/4.0/).
Copyright: This open access article is published under a Creative Commons CC BY 4.0 license, which permit the free download, distribution, and reuse, provided that the author and preprint are cited in any reuse.


