
Submitted:
26 February 2025
Posted:
27 February 2025
You are already at the latest version
Abstract
Many engineering problems are characterized by points of discontinuity in the first derivative of the phase variables. Such complicated discrete-continuous problems are called hybrid or event-continuous systems. The specification and computer analysis of the designated class of systems are illustrated by the common problem of a servo drive with the PWM controller. A mathematical model from the class of Cauchy problems with non-linear control logic is presented to resolve the task discussed. The designed model is performed in two stages: the mathematical model specification (modelling) and implementation (simulation). Two approaches to make a model specification are considered, the first one is the traditional structural technique, and the advanced method is based on the finite state machine paradigm. Structural and finite state software models are built in progressive simulation tools, such as Matlab, SimInTech, Ptolemy II and ISMA. Computer implementation of the software models of hybrid systems is performed using platform built-in libraries with numerical methods and algorithms for correct event detection. The results of computational experiments for transient processes of phase variables are qualitatively identical, that proves the adequacy of the models discussed. Quantitative errors, caused by using different integration techniques and event detection algorithms, are acceptable. The algorithm for asymptotic event detection, suggested by the Russian platform ISMA developers, is considered in detail. This technique demonstrates the best results by the one-sidedness criterion, which is explained by using the author’s algorithm for the integration step determining and the event function dynamics monitoring in the vicinity of the event limits.
Keywords:
hybrid systems
; event detection
; numerical integration
; algorithm for correct event detection
; Harel diagrams
; statechart
; event-continuous systems
; event-discrete systems
; state machine behavior
; event function
1. Introduction
The PWM controllers are widely used in advanced industrial systems for efficient engine controlling [1, 2]. Objective designing and adequate stable planning the functioning modes of controlling systems for servo drives within the Industry 4.0 technologies is impossible without applying computer modelling and simulation. The article considers modelling the dynamics of driving gears with the pulse-width modulation (PWM) controllers using Russian and foreign software tools. Traditionally, the presented illustrative example of the servo drive with the PWM controller is defined as a continuous system with a software model in the form of the schematic diagram in Matlab/Simulink [3] and SimInTech [4] platforms. On the other hand, the same control object is considered as an event-driven continuous or hybrid system, defined by the advanced finite state machine formalism as statecharts or the Harel diagrams [5]. Such a specification is performed using ISMA [6] and Ptolemy II [7] tools. The conclusion about software models with the specification applied to be appropriate in terms of the domain-driven adequacy is made. Efficient simulating and computer analysis of the hybrid systems requires not only specific integration techniques, considering discontinuities in the right side of the differential equation, as well as modes stiffness [8, 9], but also original event detection methods, which are responsible for correct mode switching [10]. The developed algorithm for asymptotic detection in ISMA is presented.
Applying Matlab, SimInTech, Ptolemy II and ISMA libraries with numerical schemes and algorithms for event detection in numerical analysis of the illustrative example model of the servo drive with the PWM controller is discussed. The general computational algorithm for the finite state machine approach to hybrid systems studying is presented.
2. Problem formulation
Event-driven systems
An event-driven system is a multi-mode dynamic system with continuous (С) or discrete (D) behavior, and modes of the system are determined by certain events (E).
Event-driven discrete or event-discrete systems (ED) are defined by the state vector , , is a set of non-negative integer numbers; – a set of Boolean values; – a set of real numbers. The discrete behavior of the event system is determined by the mapping , .
Event-continuous systems (EC), defined in a time interval , are specified by the state vector and determined by the mapping , m – the number of system modes.
The modes of the EC system are defined by the state vector with local behaviors , , which range of permissible values is defined on a set of continuously differentiable event functions [8, 10] , , and these values exist in the half-interval in a local region , , which is the range of permissible values for the local states vector.
An event mode function [10] works in such a way, that the corresponding predicate of the mode behavior , , is true () in the entire half-interval of the mode solution . Therefore, the moment , when the next event , , occurs and the mode behavior changes, is determined by the moment of time, when the predicate changes its value from to .
Let’s change phase variables and constrain the mapping by the class of ordinary differential equations systems in the Cauchy form. Then local modes are presented as
where ; is a non-linear vector function, satisfying the Lipschitz conditions in a local mode; – the initial conditions vector for the local mode.
The sequence of continuous system modes generates a cause-and-effect chain of events
that are defined on a solution of (1) with initial conditions . The set of discrete behaviors is determined by the non-empty set of event functions , . In moments , when the next event occurs, the right hand side of equation (1) meets discontinuity points. The Lipschitz conditions are broke at discontinuity points. In this case, taking into account discontinuities of phase variables, obtaining the only solution requires the Caratheodory conditions to be satisfied [8]. As a result, the global behavior of the entire event-continuous system is determined by solving the Cauchy problem with constraints of the event function
where ; is a piecewise continuous vector function, satisfying the Caratheodory conditions [8]; , – a continuously differentiable event vector function (event function).
Designing multi-mode event-continuous systems (2) is based on the advanced finite state specification of the model (2) in the form of the Harel diagrams or statecharts [5,11]. The event-continuous system behavior changing from , , to a new one , , , taking into account equations (1) – (2), will be determined by a new predicate
On the analogy of graph theory [12], let a pair of behaviors be adjacent behaviors of an event system, if the following condition is met: , . If a non-empty set of behaviors C is presented as vertices or nodes, a non-empty set of predicates is presented as a set of directed edges, connecting adjacent nodes , then a directed graph is a chart of discrete behavior. Finally, considering the fact, that both continuous and discrete behaviors take places in corresponding states , , the directed graph can be called a statechart or a Harel diagram.
In the modern traditional terminology, event-continuous systems are usually called hybrid systems (HS) [8,13,14]. The study of hybrid systems is based on numerical analysis of the equations (2) by the advanced tools with libraries for numerical integration and event detection algorithms to identify discrete moments of mode switching [8,10,15].
Servo drive model
The model of a basic servo drive with symmetrical pulse width modulation can be described as event-continuous system (1) by the following set of equations [16]
where is the angular velocity with the initial value ; is the speed reinforcing coefficient; is the control action or setpoint; is the damping ratio; is the angle of rotation with the initial value ; is the PWM function.
Let the PWM modulating signal be defined as
then
where
The function from (6) is given as
where is the PWM coefficient, is the reference signal.
The sawtooth wave signal is given as
It's clear from (6) – (8), that
only take three values: -1, 0 and +1. Accordingly, the right side of the first equation in (4) changes depending on conditions (7), (8). The mathematical model (4) – (8) can be presented as an event-continuous or hybrid system, identified by the directed graph with three nodes (states) , and directed edges (transitions from a state to another one), in this case, can be determined by the predicates , in accordance to equations (7), (8). A hybrid system specification in the form of a statechart is a widely used advanced universal method to describe an event-continuous system [13]. The specification by the finite state machine with predicates, defining transitions, is implemented and developed in many advanced frameworks and platforms [7,14]. In Figure 1 the Harel diagram for a hybrid system, defined by (4) – (8) with the following predicates , and , is presented:
Below we will present computer models of the servo drive, built in various tool environments. The following parameter values were used: ; ; , . The system of differential equations (4) has zero initial conditions.
3. Model specification in simulation environments
Model in ISMA
The source of the reference sawtooth signal in ISMA software [6] is implemented as an integrator with a reset in the following form
where is the upper saturation limit of integrator at which the output signal is reset to 0, .
A software model for a servo drive with a PWM controller (4) – (8) by the ISMA language [8,17] in the form of structural and text specification (STS) is presented in Figure 2.
The textual part of the specification (the "PWM" unit in Figure 2) in LISMA language is illustrated in Figure 3 and, up to the operation signs (lines 1 - 4), replicates the mathematical notation of the Cauchy problem for the system of differential equations in the form (4). Zero initial conditions for the ordinary differential equations system (4) are set by default.
Lines 1 – 4 define the initial state init, which determines the initial function and the system of differential-algebraic equations (4), (5). Lines 6 – 8 present the chart with three states , with corresponding transition predicates (8), indicated in square brackets, and actions (is) or behaviors, that were obtained by the resolving the system of differential equations (4), which was delivered to each state from the initial state init with the determined value.
Model in Simulink
The model implementation by schematic diagrams in MATLAB/Simulink [3] is presented in Figure 4 and Figure 5. The main structural scheme in Figure 4 is adjusted to equations (4) – (5) and the parameters values. In addition to built-in units from the platform libraries, the model includes a PWM macro-structure with the input , defined in (5), and the output modulating signal , defined by the structure, associated to expressions (6) – (9).
The presented approach to built schematic diagrams using the ‘input-output’ paradigm, unlike the advanced state machine specification, doesn’t allow applying relevant description and, consequently, a new technique for hybrid systems analysis, based on the paradigm with states, predicates and event functions. As a result, designing the PWM submodel becomes more complicated, since the specification of logical and arithmetical expressions (6) – (9) traditionally can be represented much easier not by the diagram, but by the expression, a symbol string including operands and logical and/or arithmetical operations. Applying expressions to hybrid systems definition and specification is used not only in the LISMA language, as was shown earlier, but also is accepted in the advanced software platforms for hybrid computer modelling and simulation [7, 14, 18, 19, etс.]. It should be noticed, that even if the advanced platform implies designing continuous processes as in (4), the expressions, in case there are some of them, are presented via text units with symbol form for logical and arithmetical formulas as in (6) – (9), rather than by structural submodels [7, 20].
Model in SimInTech
A software model for a servo drive with PWM, applying statecharts of the finite state machine, is presented in Figure 6. The PWM model was built as a compound representation of the finite state machine statecharts with instantaneous determining the following state and calculating the state function values in the form of conditionally executing submodels.
The schematic diagram of the PWM submodel is presented in Figure 7. It includes the following structures: calculating transition predicates P1, P2, P3 (the left part in figure 7); the statechart with 3 states designed as controlled submodels (the right part in Figure 7). The behaviors in states are determined by the numerical solution of the corresponding schematic diagram. The transition from the current state to another is defined by the specific transition unit (denoted at each state submodel on the right side).The transition unit generates the output of the state submodel, which can be connected to the input of another state submodel. The transition unit input gets a logical value, which is obtained by the calculating the transition predicate. The calculating can be conducted both inside and outside the state submodel. The data, obtained by the block diagram in each state, are sent to the unit for data selecting from the active state (DATA SELECTOR).
STATE1 is a submodel for . The schematic diagram of this state is presented in Figure 8. Submodels for other states look similar.
This specification, combining two approaches, state machine and structural paradigms, is the most unsuccessful. It includes both all the disadvantages and contradictions of the structural approach applied in MATLAB/Simulink, that were discussed earlier, and confusion, associated with the finite state machine model. The SimInTech developers, aiming at applying advanced trends in hybrid systems definition, i.e. finite state machine paradigm, include the PWM finite state unit into the top level structure, corresponding to the system of equations (4). But this quite inefficient option is the only implementation of the declared finite state approach. The following process of the PWM submodel designing is carried out using structural techniques and the ‘input-output’ paradigm instead of the directed graph approach. The developers unsuccessfully try to construct the state of the directed graph using schematic diagram, but inputs and ouptuts of the structural diagram, when the output has functional dependency on the input, are not equivalent to the edges with predicates of the digraph. As a result, instead of a compact and transparent digraph, i.e. the Harel diagram (Figure 1), the model in SimInTech is presented as a lengthy tedious structure, including inexplicit embedded submodels (6 units), which hardly can be allied to the finite state paradigm. Therefore, the structural approach is not applied to hybrid systems definition. And that explains the fact, that for hybrid systems describing and analysis in Matlab, the Stateflow tool is used [21].
Model in Ptolemy II
The specification for the servo drive in Ptolemy II [7] also combining two approaches. Top-level structural model, shown in Figure 9, include two integrators for first and second equations form (4). Sawtooth signal formed by Generator block and the PWM modulating signal (5) are sent to the input of Statechart block, which generates a control action.
The Statechart block is shown in figure 10. It replicates the Harel diagram according to Figure 1.
The transition predicates (8) named guard and defined according to (9). The blocks for three states , describe the rules for generating the output signal f, as shown in Figure 11.
The output f is calculated according to formula (6). The first part of expression in Figure 11 defines the function sign in accordance with (7). Hereinafter the ternary operator (like as C programming language) is used. The second part of expression corresponds to function from (8). The modulus of x is obtained using a ternary operation (x>=0?x:-x). The result is multiplied by Kp and compared with the sawtooth signal.
4. Event detection algorithms in ISMA
Let’s consider the algorithms for obtaining the event mode function as in (2), implemented in the ISMA software tool. The LISMA grammar [17] is presented in the extended Backus–Naur form for the top-dawn parsers generator ANTLR4 [22]. The fragment of the grammar for conditional expressions in the software model is the following:
conditionalExpression:
conditionalOrExpression;conditionalOrExpression: conditionalAndExpression (
'||' conditionalAndExpression )*;conditionalAndExpression:
conditionalNotExpression: ( '&&' conditionalNotExpression: )*;conditionalNotExpression:
relationalExpression | '!' relationalExpressionrelationalExpression:
inequalityExpression | '(' conditionalExpression ')'
In accordance to the rules in (11), the software model includes conditions for the transition to a state . For example, the condition expression for the predicate from the system (9) is written down in square brackets in the line 6 (Figure 3). Taking into account the condition (3), let’s find the predicate for the state in the following form:
where J is the adjacent states for the state .
Based on the syntactic tree, which was built while analyzing the software model, and its semantic attributes, the syntactic trees for the predicates in every state of the system are constructed in the ISMA. An n-ary tree is built with the root corresponding to the conjunction operation. The root has n descendant nodes, where n is the number of adjacent states for the current mode of the hybrid system. All outgoing branches contain a vertex, corresponding to the logical negation (inversion). This vertex is the root of the syntactic tree, built for the predicate . Next, the syntactic tree is modified in a way that inversion operations are applied only to inequalities (11). De Morgan's rules for transforming logical expressions are applied here. The syntactic tree is top-down traversed, and for every node the transformations are applied according to the following recursive rules (Algorithm 1):
Algorithm 1. The mode behavior predicate transformation.
Step 1. If the tree node matches the inequality (inequalityExpression), the traverse is stopped. If the inversion operation indicator was set, the inequality sign is replaced by the opposite one.
Step 2. If the tree node matches the logical negation operation (‘!’), the inversion operation indicator is set to the descendant vertex. Resetting the indicator reverses the inversion, if negations are consecutive. The current node is excluded from the tree, the connection between a parent node and descendant one is built.
Step 3. If the tree node matches the conjunction operation (‘&&’) and the inversion operation indicator is set, the conjunction operation is replaced by the disjunction (‘||’). A new vertex with logical negation (‘!’) is added to all outgoing branches. The inversion indicator is reset.
Step 4. If the tree node matches the disjunction operation (‘||’) and the inversion indicator is set, the disjunction is replaced by the conjunction (‘&&’). A new vertex with logical negation (‘!’) is added to all outgoing branches. The inversion indicator is reset.
Computation expressions for event functions are formed based on the trees. More specifically, these structures define the rules for determining an integration step based on the event functions dynamics.
Let’s build and transform a syntactic tree for the mode behavior predicate , corresponding to the state (figure 1) of the servo drive with the PWM controller model. Applying equations (12), we get . Let inequalities be denoted as:
then . The basic syntactic tree is shown in Figure 12, a. After the transforming process, according to the Algorithm 1, the tree presented in Figure 12, b is formed, where
The following algorithms are connected with the integration step determining, which is dependent on event functions dynamics. Let the mode behavior predicate for the state be like , i.e. the syntactic tree consists of the only inequality . And the nth step of numerical resolving the Cauchy problem (2) is performed, the value for the right side of the differential equation is calculated. Besides, the value of the next integration step is determined by the numerical integration algorithm. Then, according to the theorem of calculating the integration step for asymptotic approaching to the mode limit [8], the integration step can be limited by the value, determined by the following algorithm.
Algorithm 2. Determining an integration step for one-sided events detection.
Step 1. Calculate .
Step 2. Calculate .
Step 3. Calculate .
Step 4. Calculate .
Step 5. If , let and go to the next integration step.
Step 6. Calculate the ‘event step size’ as .
Step 7. Compute the step size and go to the next integration step.
In Step 5 the event function derivative is determined. As the event function approaches the event surface, is positive, and, as it moves away from the boundary , becomes negative. Then, once the event function course has been determined, no additional constraints on the integration step value have to be imposed, if the event function moves away from the mode surface.
The process of partial derivatives calculating (steps 2 and 3) is quite a resource-intensive task. If computing algorithms are based on explicit numerical schemes, the finite difference approximation is applied:
where and – the Cauchy problem solution and the event function value, obtained at the previous step.
Let be the value of the integration step determined by the discussed algorithm. In general, as it was shown earlier, the condition for the system staying to the might be a complex logical function depending on the set of inequalities , where and . If each of the inequalities has the form , the Algorithm 2 allows to obtain a set of values for the integration step .
Let the syntactic tree be built using Algorithm 1. Then the value of the integration step can be determined at each stage of the calculating the mode behavior by the following recursive Algorithm 3, while traversing the tree nodes.
Algorithm 3. Determining the integration step in case of a set of event functions.
Step 1. If the tree node matches an inequality (inequalityExpression), the tree traversing is stopped. The integration step value, obtained by the Algorithm 2, is returned.
Step 2. If the tree node matches the conjunction operation (‘&&’), the algorithm for the step determining is called for descendant nodes. The minimal value from all those calculated is returned.
Step 3. If the tree node matches the disjunction operation (‘||’), the algorithm for the step determining is called for descendant nodes. The maximum value from all those calculated is returned.
The Algorithm 2 is justified by the requirement of the event function for the mode behavior having negative value. Using the Algorithm 3, it may turn out that event functions, evaluated at the step 1, are non-negative. It means, that at the current moment the corresponding predicate does not cause changing the system state, therefore there is no need to call the Algorithm 2. In this case, the Algorithm 3 does not limit the step value.
Let’s illustrate the Algorithm processing while calculating the ‘event’ step in the state 1 of the servo drive with the PWM controller model. There are the following conditions: , , . The event functions, corresponding to the conditions, are , , . Then the step value is determined by the formula .
5. Calculation and Simulation
The second stage in computer modelling is implementing software models, designed at the first stage of specification. Applying various integration techniques and developed event detection algorithms, included into the libraries with numerical methods in the considered simulation platforms, for numerical computing (4) – (8) resulted in qualitatively identical solutions for phase variables and , as presented in Figure 13.
Figure 13.
Transient processes of the computational experiment.
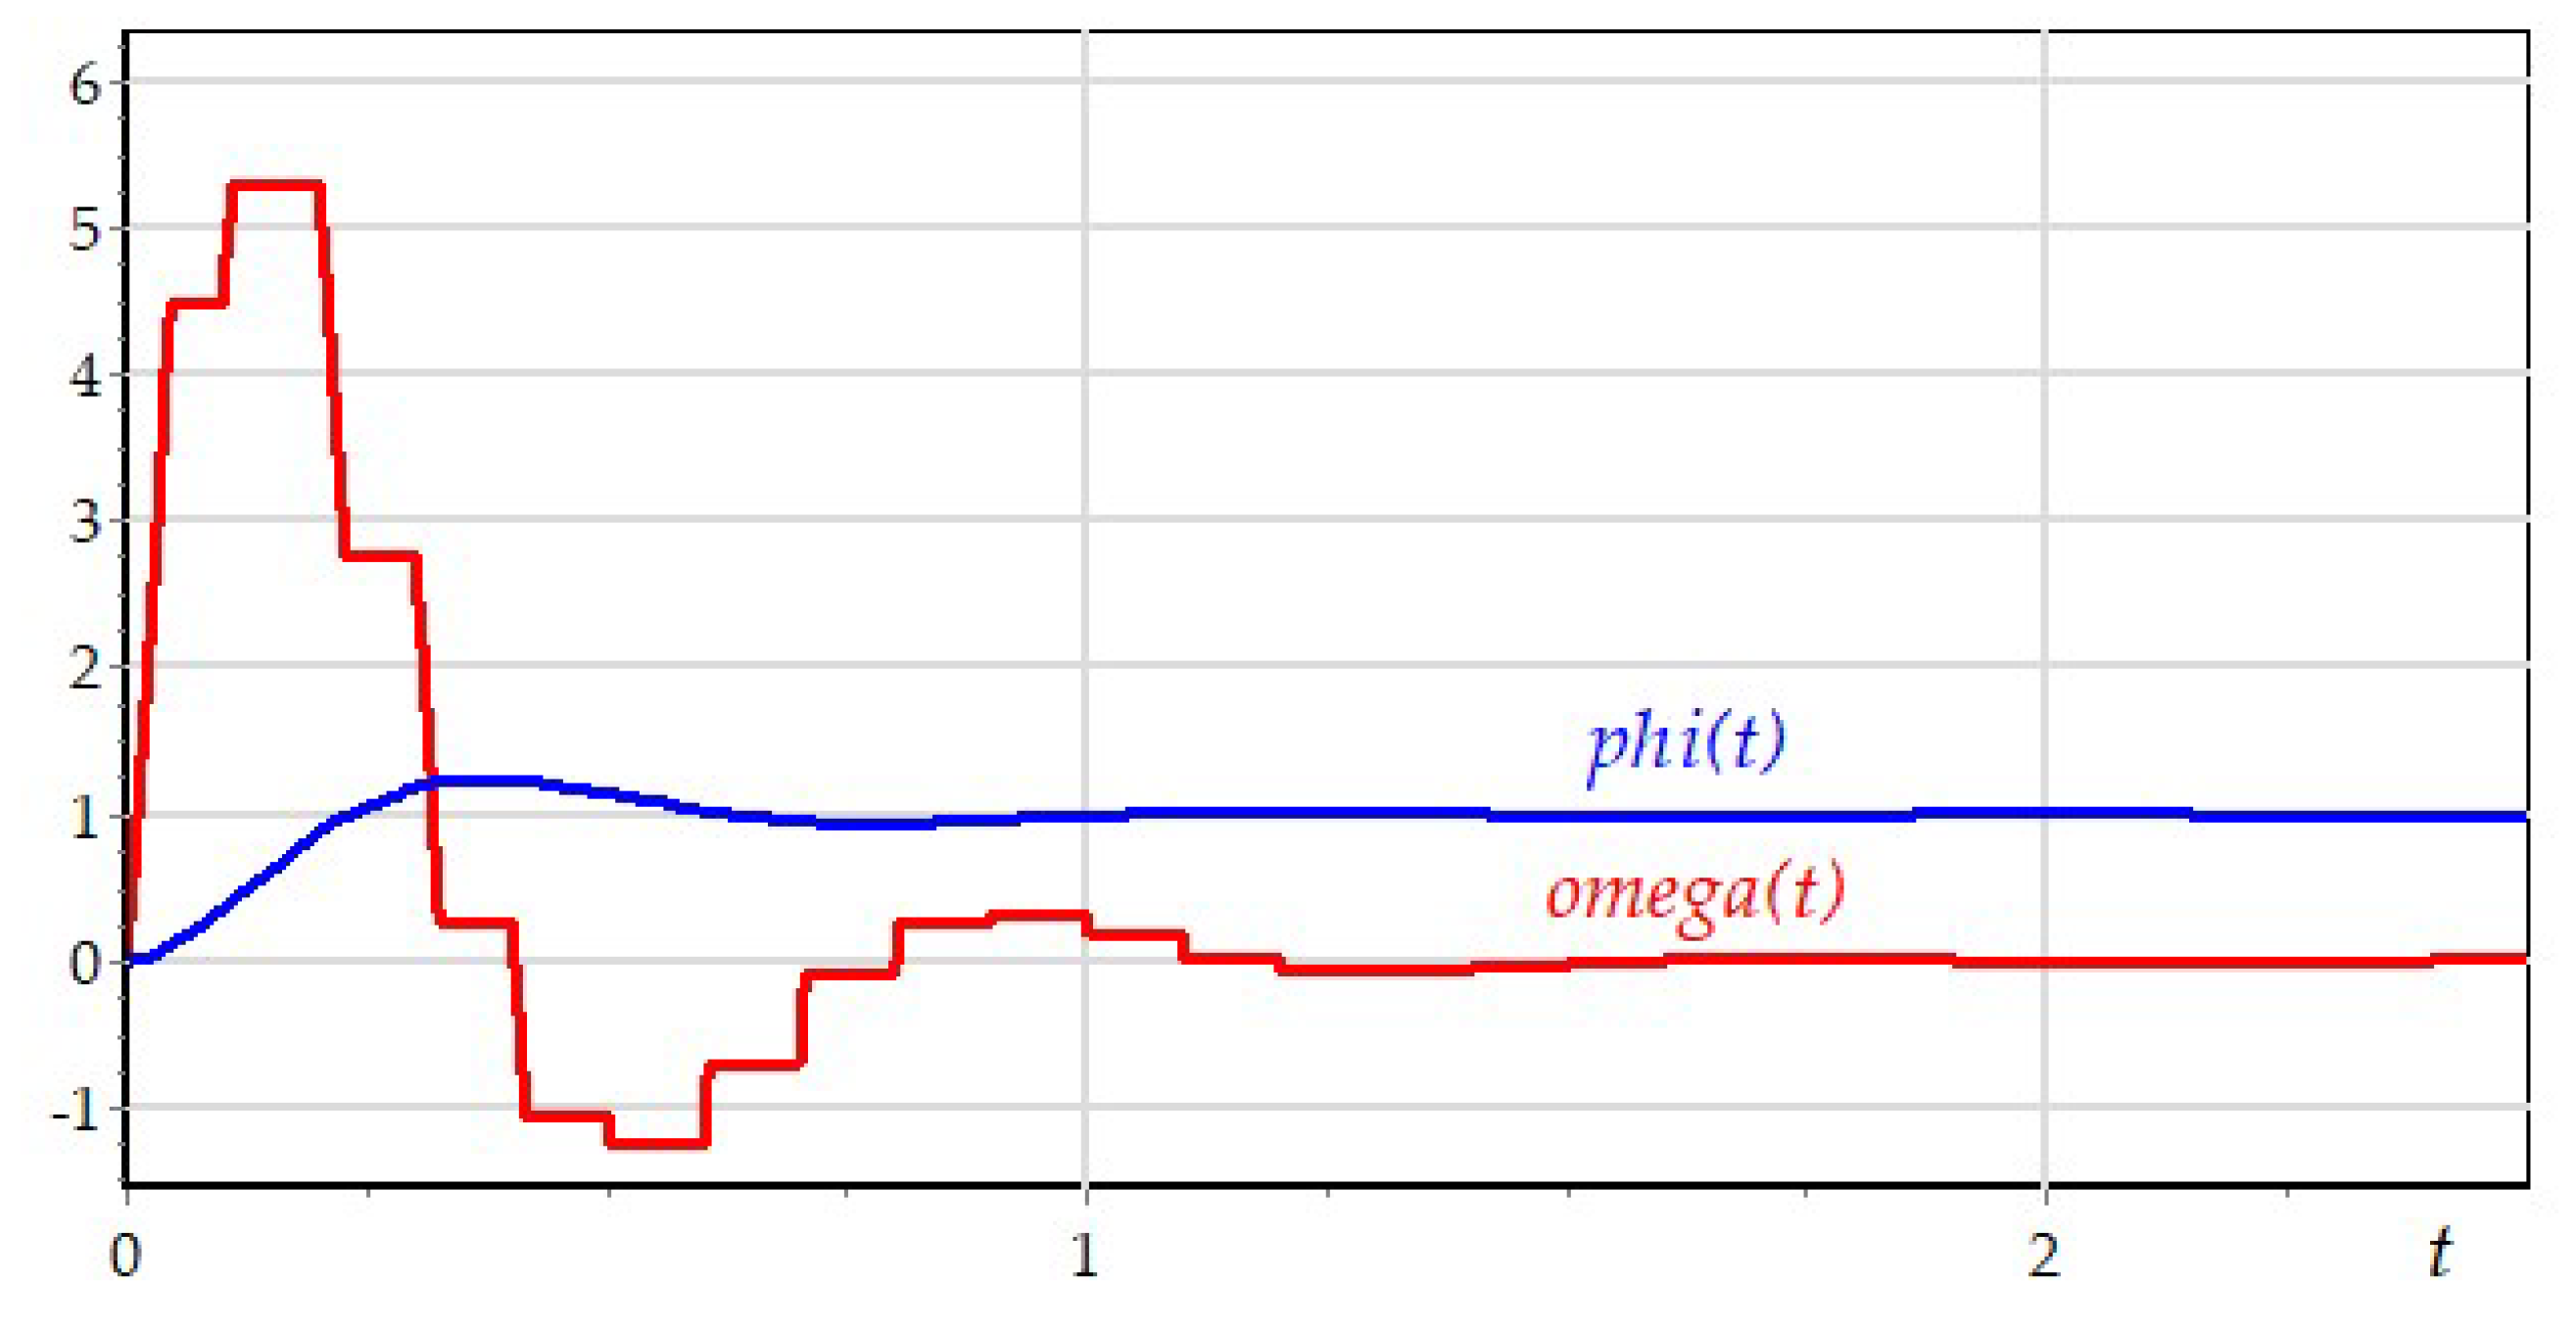
The STEKS (5,4) technique [23] combined with the algorithm for asymptotic event detection, the parameter [8], was used for calculations in ISMA. The adaptive algorithm ARK [24] and the invented technique for intersections detecting [15] with the step value refining for the signal sources and discrete units were applied in SimInTech. The integration method ode45 (Dormand-Prince) [3, 9] with the algorithm for switching detection for all of the model units [25] was applied in MATLAB. The integration technique Explicit RK23 Solver [13] with double-sided event detecting was used in Ptolemy II.
Let’s evaluate the accuracy of the problem solutions in ISMA, SimInTech, MATLAB and Ptolemy II, taking into account using original libraries with numerical techniques and detection algorithms. Before the experiments, the exact moments of events generating and corresponding values of phase variables and for the initial system of equations (4) were obtained by the analytical fitting the initial conditions. The summary data on the calculating error for the first and seventh events are presented in Table 1, where is the exact time of the event , is the obtained time, – the exact value of the angular velocity, – the calculated value of the angular velocity, – the exact value of the angle of rotation, – the calculated value of the angle of rotation. Computing was carried out with the given accuracy , that is commensurable with the error of the integration techniques applied.
The model in MATLAB demonstrates the most accurate results. But it does not comply with the condition of the event one-sidedness [10], as it is presented in the table. The values of phase variables in detection points are calculated with the comparable accuracy using tools in SimInTech and ISMA. The largest calculating error is obtained in Ptolemy II by the double-sided detection method [13]. The detection technique in ISMA differs from the others mentioned, since it meets the requirement of one-sidedness [8, 10], and the integration step is calculated in accordance to the condition of asymptotic approaching to the mode limit. The algorithm is based on linear extrapolation of the event function and limiting the event function dynamics at the next step, the function can change its value not more than in times [8]. As a result, the discreteness of the system behavior representation in the vicinity of the mode limits is increasing. The accuracy of this representation is defined by the minimal value of the integration step, which in this case is equal to .
Let’s analyze the dynamics of event functions. Figure 14 demonstrates the graphs of event functions , that determine mode shifting in the interval . At first, the system is in the state 1 (), then, in , the transition to the mode (state) is made, after that, in , the system returns to . The further transitions and state changing are not considered, although two more shifting can be seen in figure 14.
There are three event functions for the first state: , , . The system is in the state in the interval , but the event function does not affect the mode shifting, since . This graph is not presented in the figure above. As a result, the integration step calculating is dependent on the dynamics of the functions and . The Figure 15 shows the enlarged fragment of the graph in the vicinity of the moment .
to , when the condition is not met.
Since the event function changes faster than , the algorithm for the integration step determining uses the value for asymptotic approaching to the mode limit. The step decreasing, while approaching to the mode limit, is shown in figure 15. As soon as , the condition from (9) is met, the system switch to the mode . After the transition, the integration step is increased, but the detection algorithm does not limit its value: the step can be limited only by the numerical integration method.
The third state has the resulting condition for the mode , where the function is obtained from the condition of the integrator reset (figure 2). The graphs of this event function are presented in Figure 14 and Figure 16. The enlarged fragment of the graph in the vicinity of the moment also demonstrates the step decreasing while approaching to the mode limit. After the modes switching, the event function changes its value instantly, since the variable saw is reset to 0. The condition from (9) is met, and the system switches to the mode .
6. Conclusion
The analysis of software platforms for simulating event systems is performed. The model of a simple servo drive with the PWM controller was tested. The system is considered as a hybrid dynamic system with event-driven continuous processes, which implies applying corresponding techniques for the model definition and numerical analysis. The specification of such systems in advanced international practice is based on the finite state machine paradigm with the handy domain-driven graphical interpretation in the form of the Harel diagrams or statecharts. Two of the considered simulation platforms, ISMA and Ptolemy II, comply with the finite state methodology, having appropriate, as close to natural mathematical as possible, description for the event-continuous processes. SimInTech can use three variants of the specification of finite state machines: structural, specification in the form of a statechart with a text description of operations, text description using the operator “case”. Different description methods may be suitable for different types of systems. But the clean structural paradigm, as the engineering practice demonstrates, is intended for continuous processes specification and is very limited in case of applying to define multi-mode hybrid systems. Numerical experiments with software models show qualitatively identical results. Quantitative differences are connected with applying certain integration techniques and detection algorithms. The presented results demonstrate the smallest error of the model in MATLAB and the relatively large one of the model in Ptolemy II. ISMA and SimInTech have the intermediate results in the comparative analysis of the calculation errors. It should be noticed, that the ISMA model is the only one, that complies with the requirement of the event one-sidedness due to the developed algorithm for asymptotic detection, applied to determining the optimal integration step value, considering the event functions dynamics (Algorithm 1 – Algorithm 3). This property is the necessary condition for the model results adequacy in simulating physical processes with the requirement of non-negativity of phase variables, for example processes of chemical kinetics.
Author Contributions
Conceptualization, Y.S. and D.D.; methodology, Y.S.; software, K.T. and D.D.; validation, D.D., V.A., N.G. and D.D.; formal analysis, D.D.; investigation, N.G.; resources, V.A.; data curation, N.G.; writing—original draft preparation, D.D., Y.S., and N.G.; writing—review and editing, K.T., Y.S., K.S. and A.A.; visualization, K.T.; supervision, Y.S.; project administration, D.D.; funding acquisition, Y.S. All authors have read and agreed to the published version of the manuscript.
Data Availability Statement
No new data were created or analyzed in this study. Data sharing is not applicable to this article.
Conflicts of Interest
The authors declare no conflicts of interest.
References
- Banerjee, S.; Verghese, G.C. (Eds.) Nonlinear Phenomena in Power Electronics; Wiley-IEEE Press: New York, USA, 2001. [Google Scholar] [CrossRef]
- Cendoya, M.; Toccaceli, G. Application of Statecharts in Buck-Boost DC-DC Converter Simulation. WSEAS Transactions on Electronics, 2021, vol. 12, 81–88. [CrossRef]
- Matlab product page on the official website of MathWorks. Available online: https://www.mathworks.com/products/matlab.html (accessed on 15 April 2024).
- SimInTech product page on the official website of 3V Service. Available online: https://en.simintech.ru/ (accessed on 15 April 2024).
- Harel, D. Statecharts: a Visual Formalism for Complex Systems. Science of Computer Programming, 1987, vol. 8(3), pp. 231–274. [CrossRef]
- Shornikov, Yu.V.; Bessonov, A.V. The Core Components of ”ISMA 2015” Software [Komponenty Jadra Programmnogo Kompleksa “ISMA 2015”] (in Russian). Certificate of State Registration of Computer Programs # 2015617235 [Svidetel'stvo o Gosudarstvennoj Registracii Programmy dlja JeVM # 2015617235]. Federal Service For Intellectual Property (Rospatent), Moscow, 2015, 1p.
- Ptolemy II product page on the official website of The University of California, Berkeley. Available online: https://ptolemy.berkeley.edu/ptolemyII/index.htm (accessed on 15 April 2024).
- Novikov, E.A.; Shornikov, Yu.V. Modeling of Stiff Hybrid Systems [Modelirovaniye Zhestkikh Gibridnykh Sistem] (in Russian); Lan: St. Petersburg, Russia [Lan': Sankt-Peterburg, Rossija], 2019; 420 p, ISBN 978-5-8114-3523-4. [Google Scholar]
- Hairer, E.; Nørsett, S.P.; Wanner, G. Solving Ordinary Differential Equations I: Nonstiff Problems; Springer-Verlag: Berlin, Germany, 1993; 528 p, ISBN 978-3642051630. [Google Scholar]
- Esposito, J.; Kumar, V.; Pappas, G. Accurate Event Detection for Simulating Hybrid Systems. Hybrid Systems: Computation and Control (HSCC), 2001, Volume LNCS 2034, pp. 204–217. [CrossRef]
- Karpov, Yu.G. State Machine Theory [Teorija Avtomatov] (in Russian); Piter: Moscow, Russia [Piter: Moskva, Rossija], 2002; 206 p, ISBN 5-318-00537-3. [Google Scholar]
- Kasyanov, V.N.; Evstigneev, V.A. Graphs in Programming: Processing, Visualization and Application [Grafy v Programmirovanii: Obrabotka, Vizualizacija i Primenenie] (in Russian); BHV-Peterburg: St. Petersburg, Russia [BHV-Peterburg: Sankt-Peterburg, Rossija], 2003; 1104 p, ISBN 5-94157-184-4. [Google Scholar]
- Lee, E.A.; Zheng, H. Operational Semantics of Hybrid Systems. Hybrid Systems: Computation and Control: 8th International Workshop, HSCC, LNCS 3414, Zurich, Switzerland, March 9-11, 2005.
- Moraleda, A.U.; Villalba, C.M. Modeling and Simulation in Engineering Using Modelica; UNED Editorial: Madrid, Spain, 2018; ISBN 978-84-362-7365-6. [Google Scholar]
- Timofeev, K.A. Module for Intersection Event Detection Block for the SimInTech Software Package (SimInTech Intersection Detection Block) [Modul' Bloka Detekcii Sobytij Peresechenija Programmnogo Kompleksa SimInTech (Blok Detekcii Peresechenij SimInTech)] (in Russian). Certificate of State Registration of Computer Programs # 2024619776 [Svidetel'stvo o Gosudarstvennoj Registracii Programmy dlja JeVM # 2024619776]. Federal Service For Intellectual Property, Moscow, 2024, 1p.
- Blaze, E.S.; Brodovsky, V.N.; Vvedensky, V.A.; et al. Servo Drives: In 3 volumes [Sledyashhie Privody] (in Russian); Ed. B.K. Chemodanov; Publishing house of BMSTU: Moscow, Russia [Izdatel'stvo MGTU im. N. Je. Baumana: Moskva, Rossija], 2003; ISBN 5-7038-1384-0. [Google Scholar]
- Shornikov, Yu.V.; Bessonov, A.V. The Component for Specification of Hybrid Systems in LISMA PDE Language [Komponenta Specifikacii Modelej Gibridnyh Sistem na Yazyke “LISMA_PDE"] (in Russian). Certificate of State Registration of Computer Programs # 2015617191 [Svidetel'stvo o Gosudarstvennoj Registracii Programmy dlja JeVM # 2015617191]. Federal Service For Intellectual Property (Rospatent), Moscow, 2015, 1p.
- OpenModelica product page on the official website of Open Source Modelica Consortium (OSMC). Available online: https://openmodelica.org/ (accessed on 15 April 2024).
- JuliaSim product page on the official website of JuliaHub. Available online: https://info.juliahub.com/products/juliasim (accessed on 15 April 2024).
- HyVisual product page on the official website of The University of California, Berkeley. Available online: https://ptolemy.berkeley.edu/hyvisual/ (accessed on 15 April 2024).
- Stateflow product page on the official website of MathWorks. Available online: https://www.mathworks.com/products/stateflow.html (accessed on 15 April 2024).
- Antlr product page. Available online: https://www.antlr.org/ (accessed on 15 April 2024).
- Novikov, E.A. Explicit Methods for Stiff Systems [Javnye Metody dlja Zhestkih Sistem] (in Russian); Nauka: Novosibirsk, Russia [Nauka: Novosibirsk, Rossija], 1997; 192 p, ISBN 5-02-031245-2. [Google Scholar]
- Skvortsov, L.M. Construction and Analysis of Explicit Adaptive Onestep Methods for Numerical Solution of Stiff Problems [Postroyeniye i Analiz Yavnykh Adaptivnykh Odnoshagovykh Metodov Chislennogo Resheniya Zhestkikh Zadach] (in Russian), Journal of Computational Mathematics and Mathematical Physics [Zhurnal Vychislitel'noy Matematiki I Matematicheskoy Fiziki], 2020, Vol. 60, pt. 7, p. 1111–1125. [CrossRef]
- Shornikov, Yu.V.; Novikov, E.A.; Dostovalov, D.N.; Myssak, M.S. Visual Modeling of Dynamical Systems by Instrumental Facilities. 7 IFAC Conference on Manufacturing Modelling, Management, and Control (MIM'2013), St. Petersburg, IFAC, 2013; Manufacturing modelling, management, and control, vol. 7, pt. 1, p. 2185–2190. [CrossRef]
Figure 1.
A statechart for servo drive model.
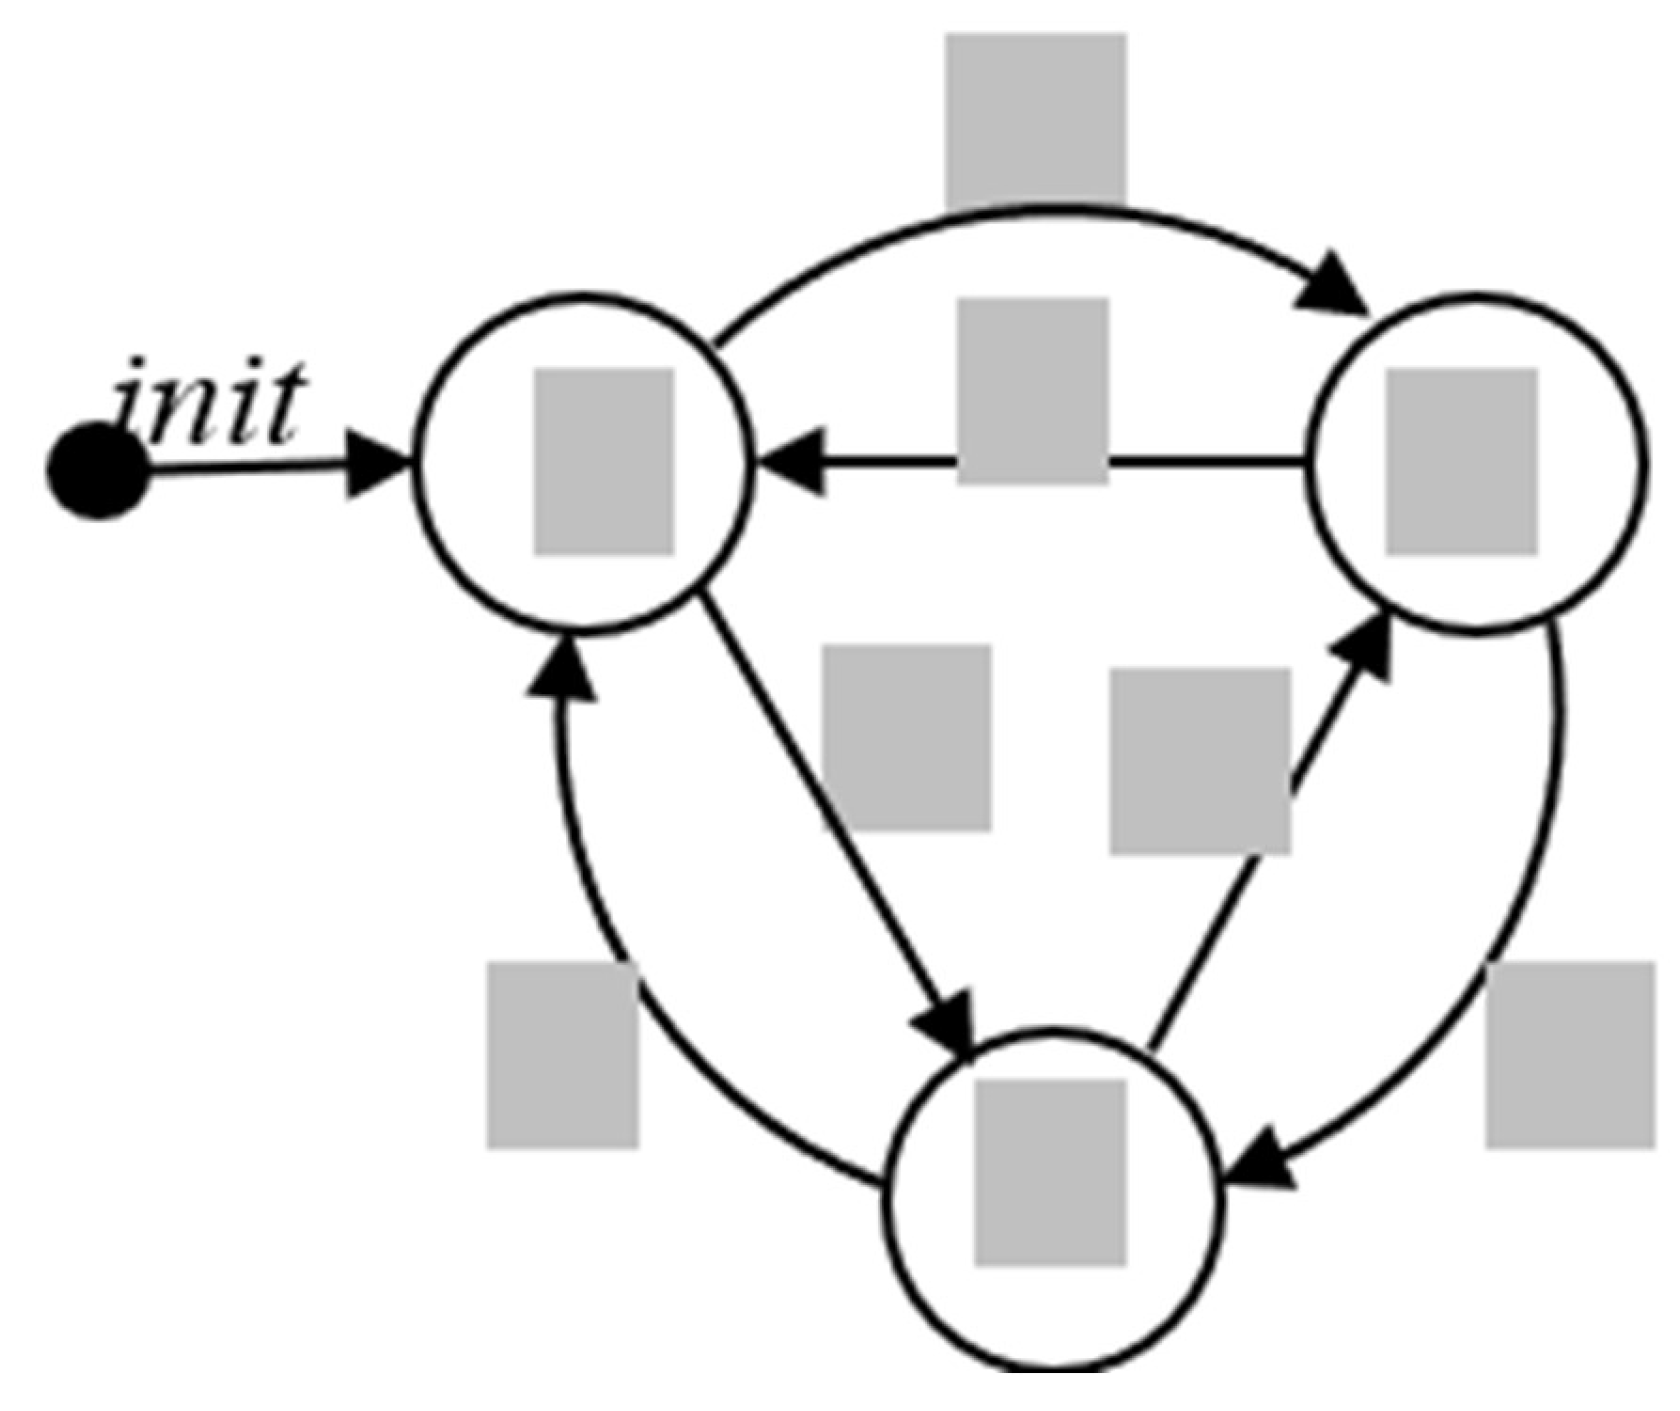
Figure 2.
The structural part of software model (4)-(8) in ISMA.
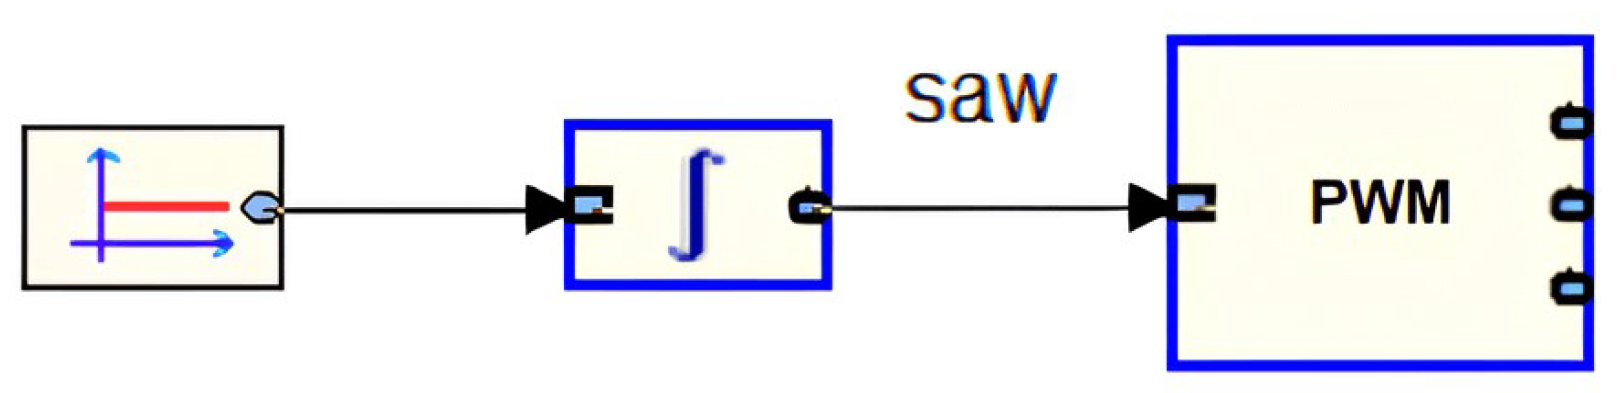
Figure 3.
The textual part of the software model (4)-(8) in LISMA language.
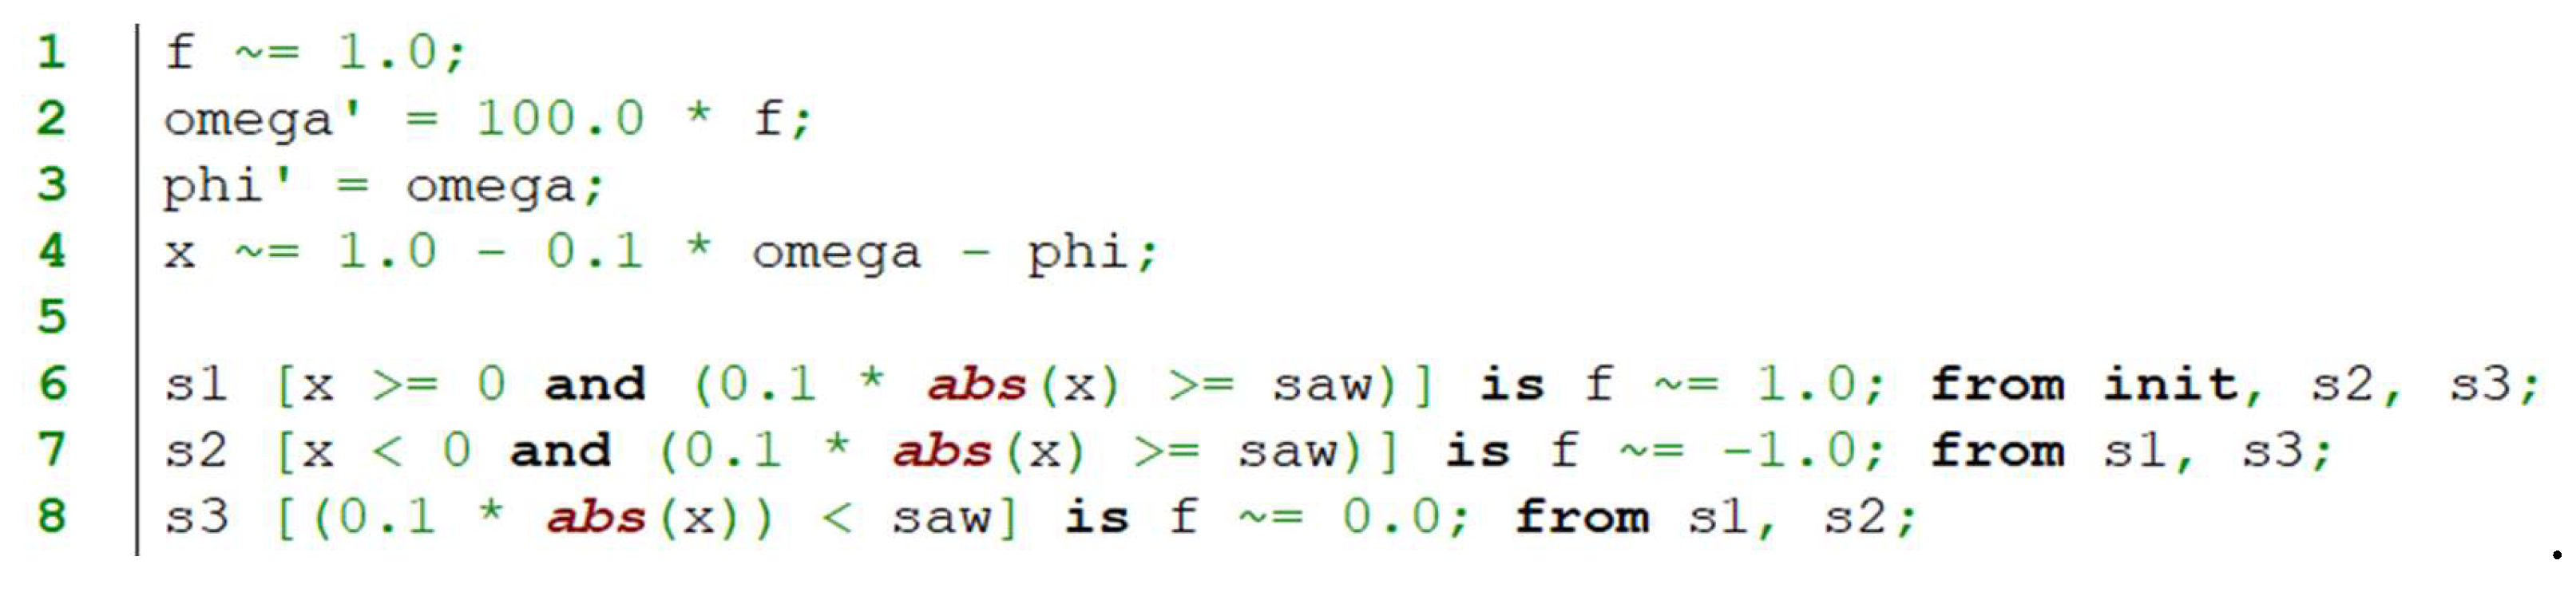
Figure 4.
The schematic diagram in MATLAB/Simulink.
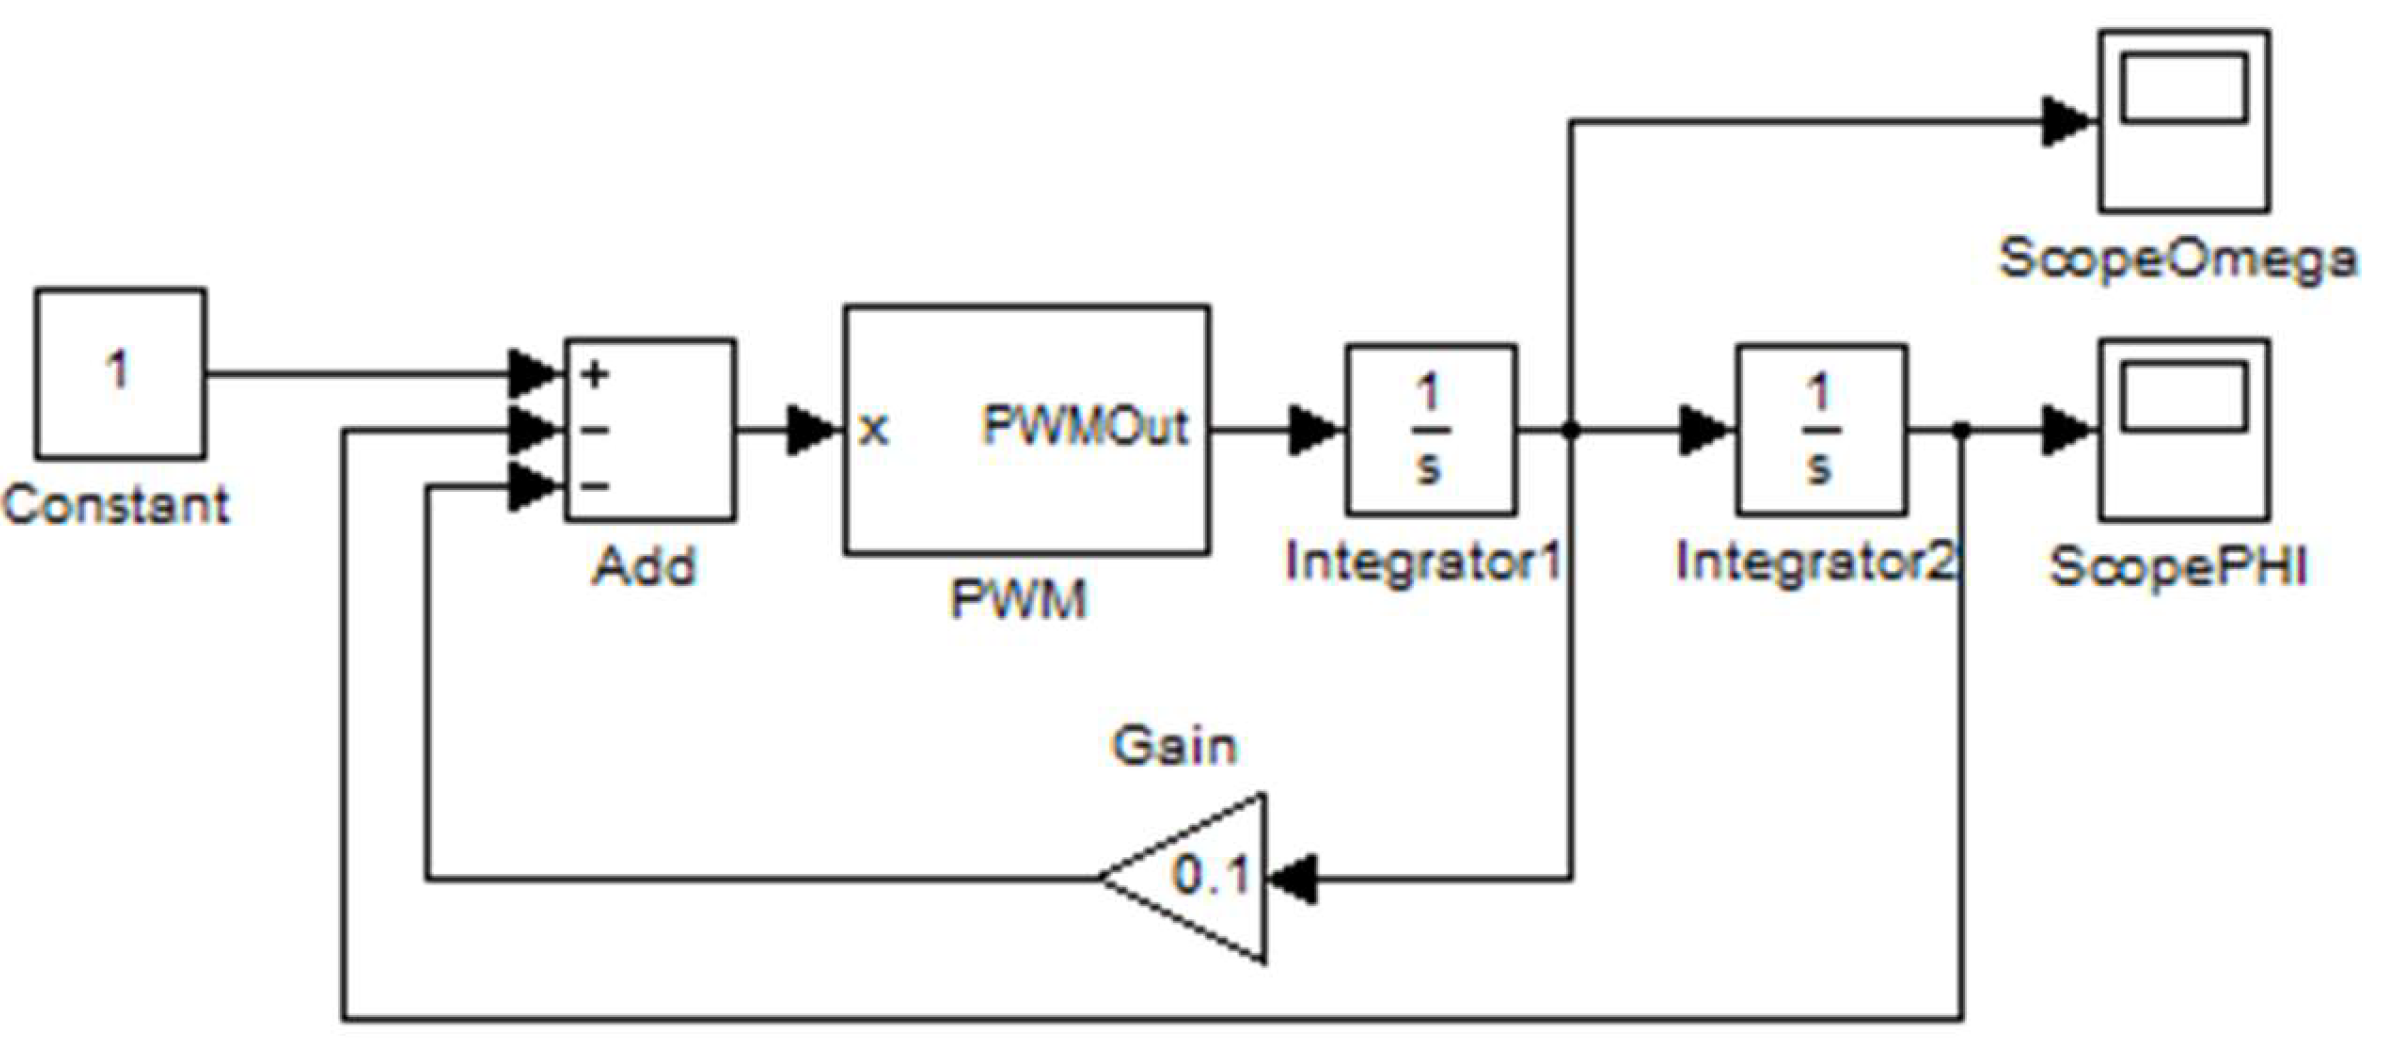
Figure 5.
The PWM macro-unit structure diagram.
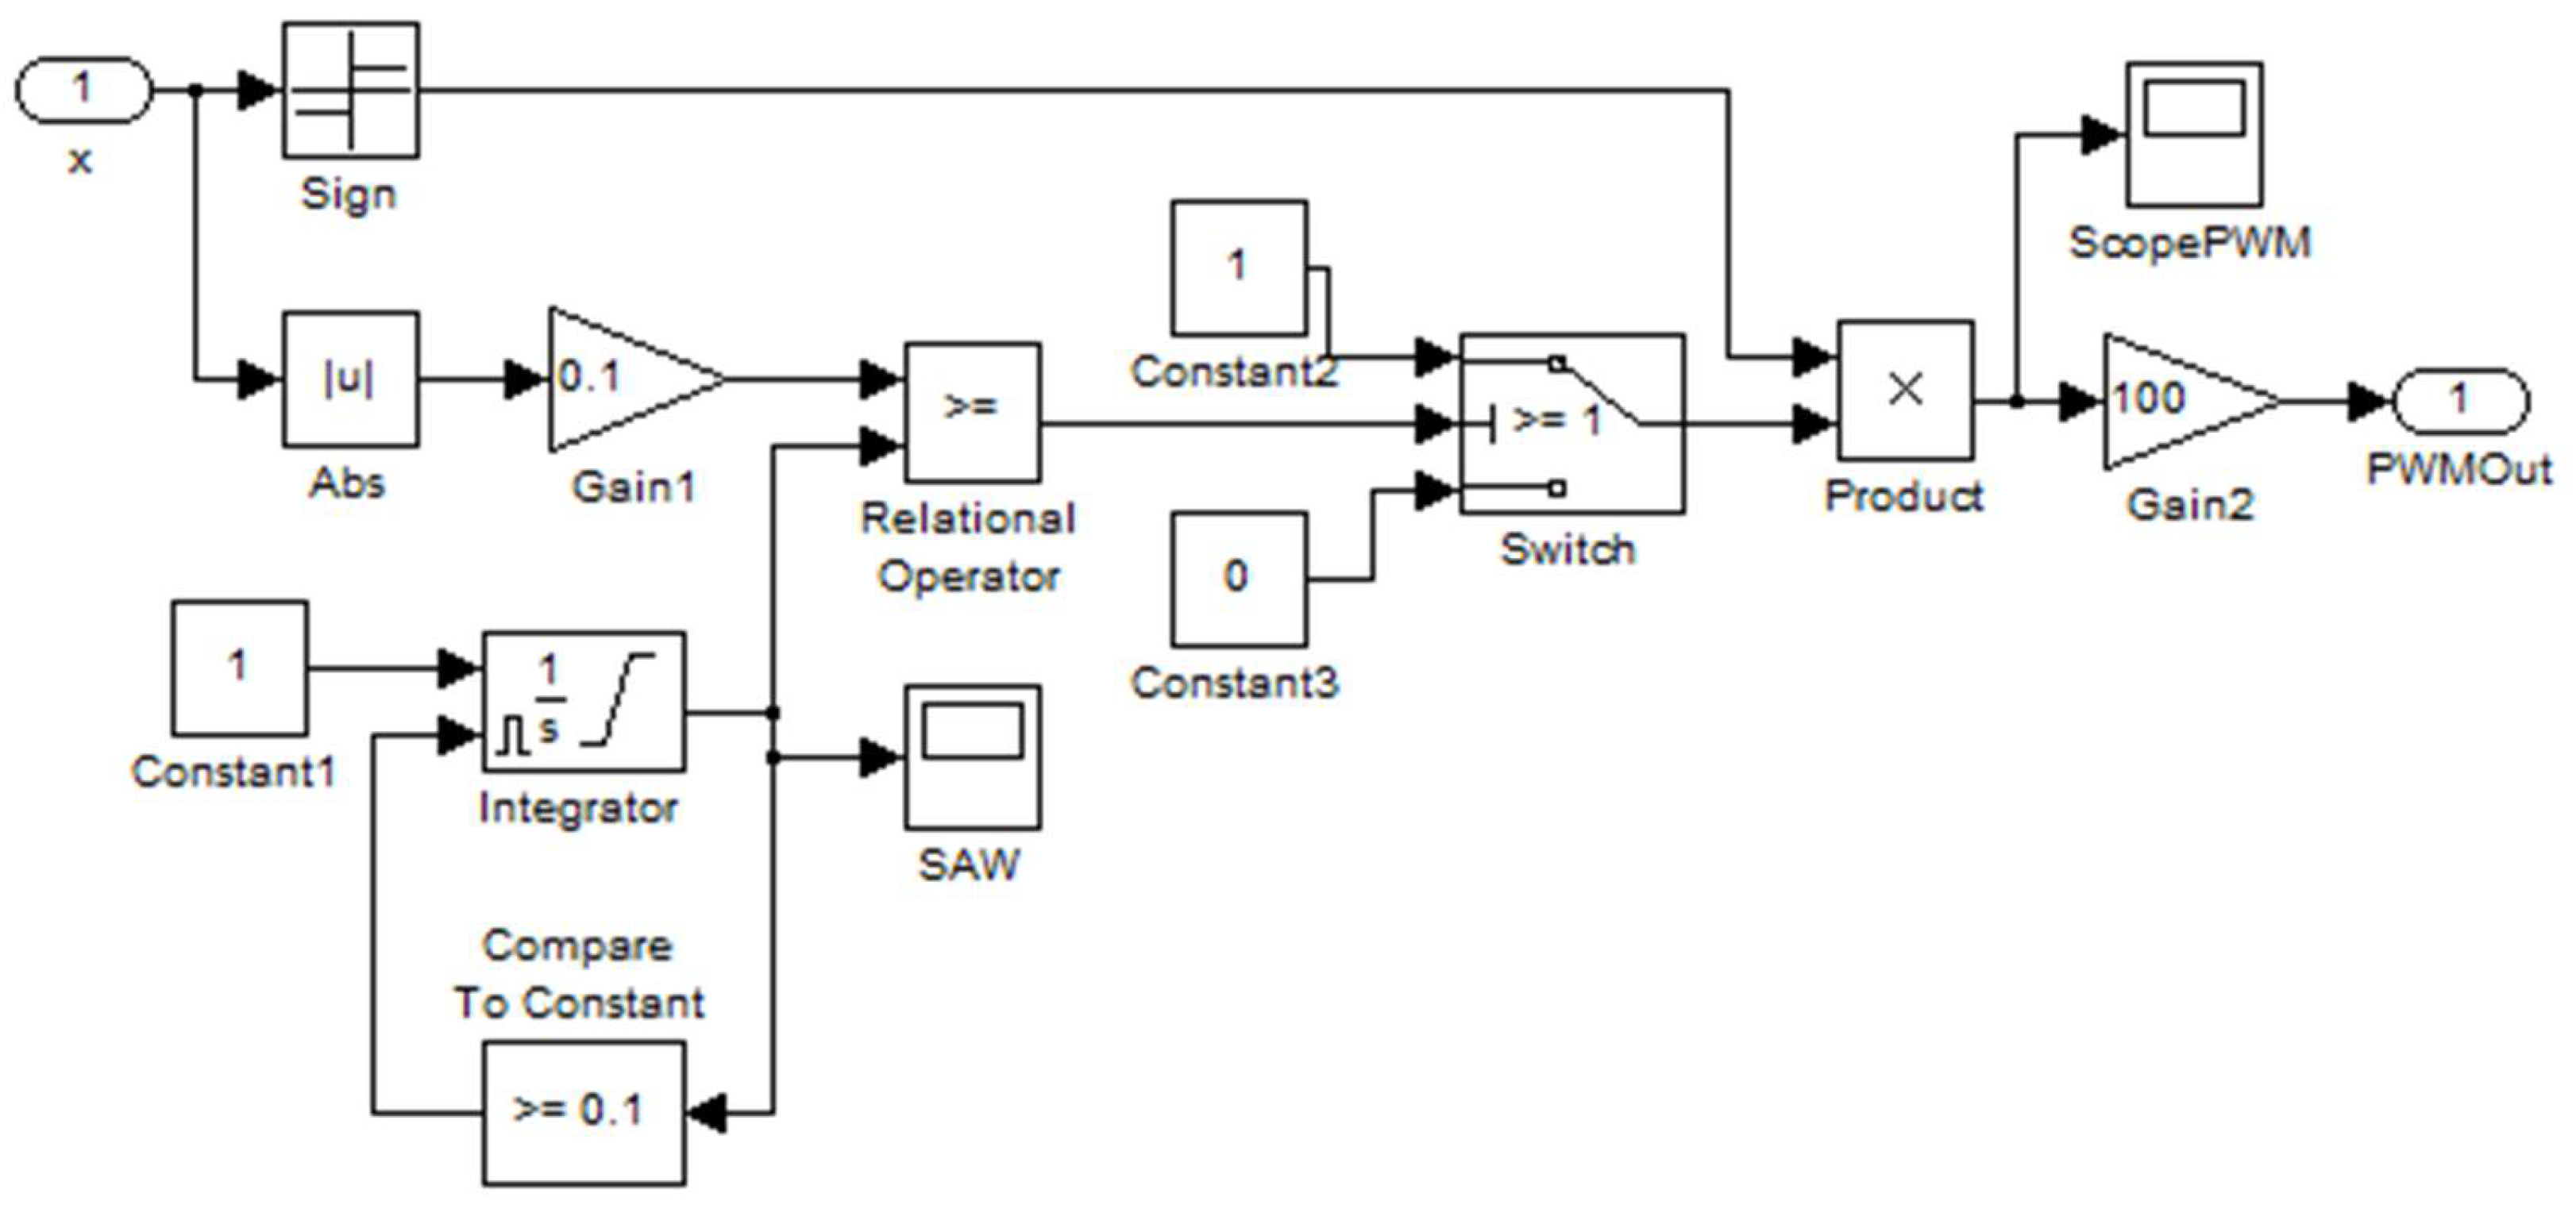
Figure 6.
The block diagram of a PWM servo drive using statecharts.
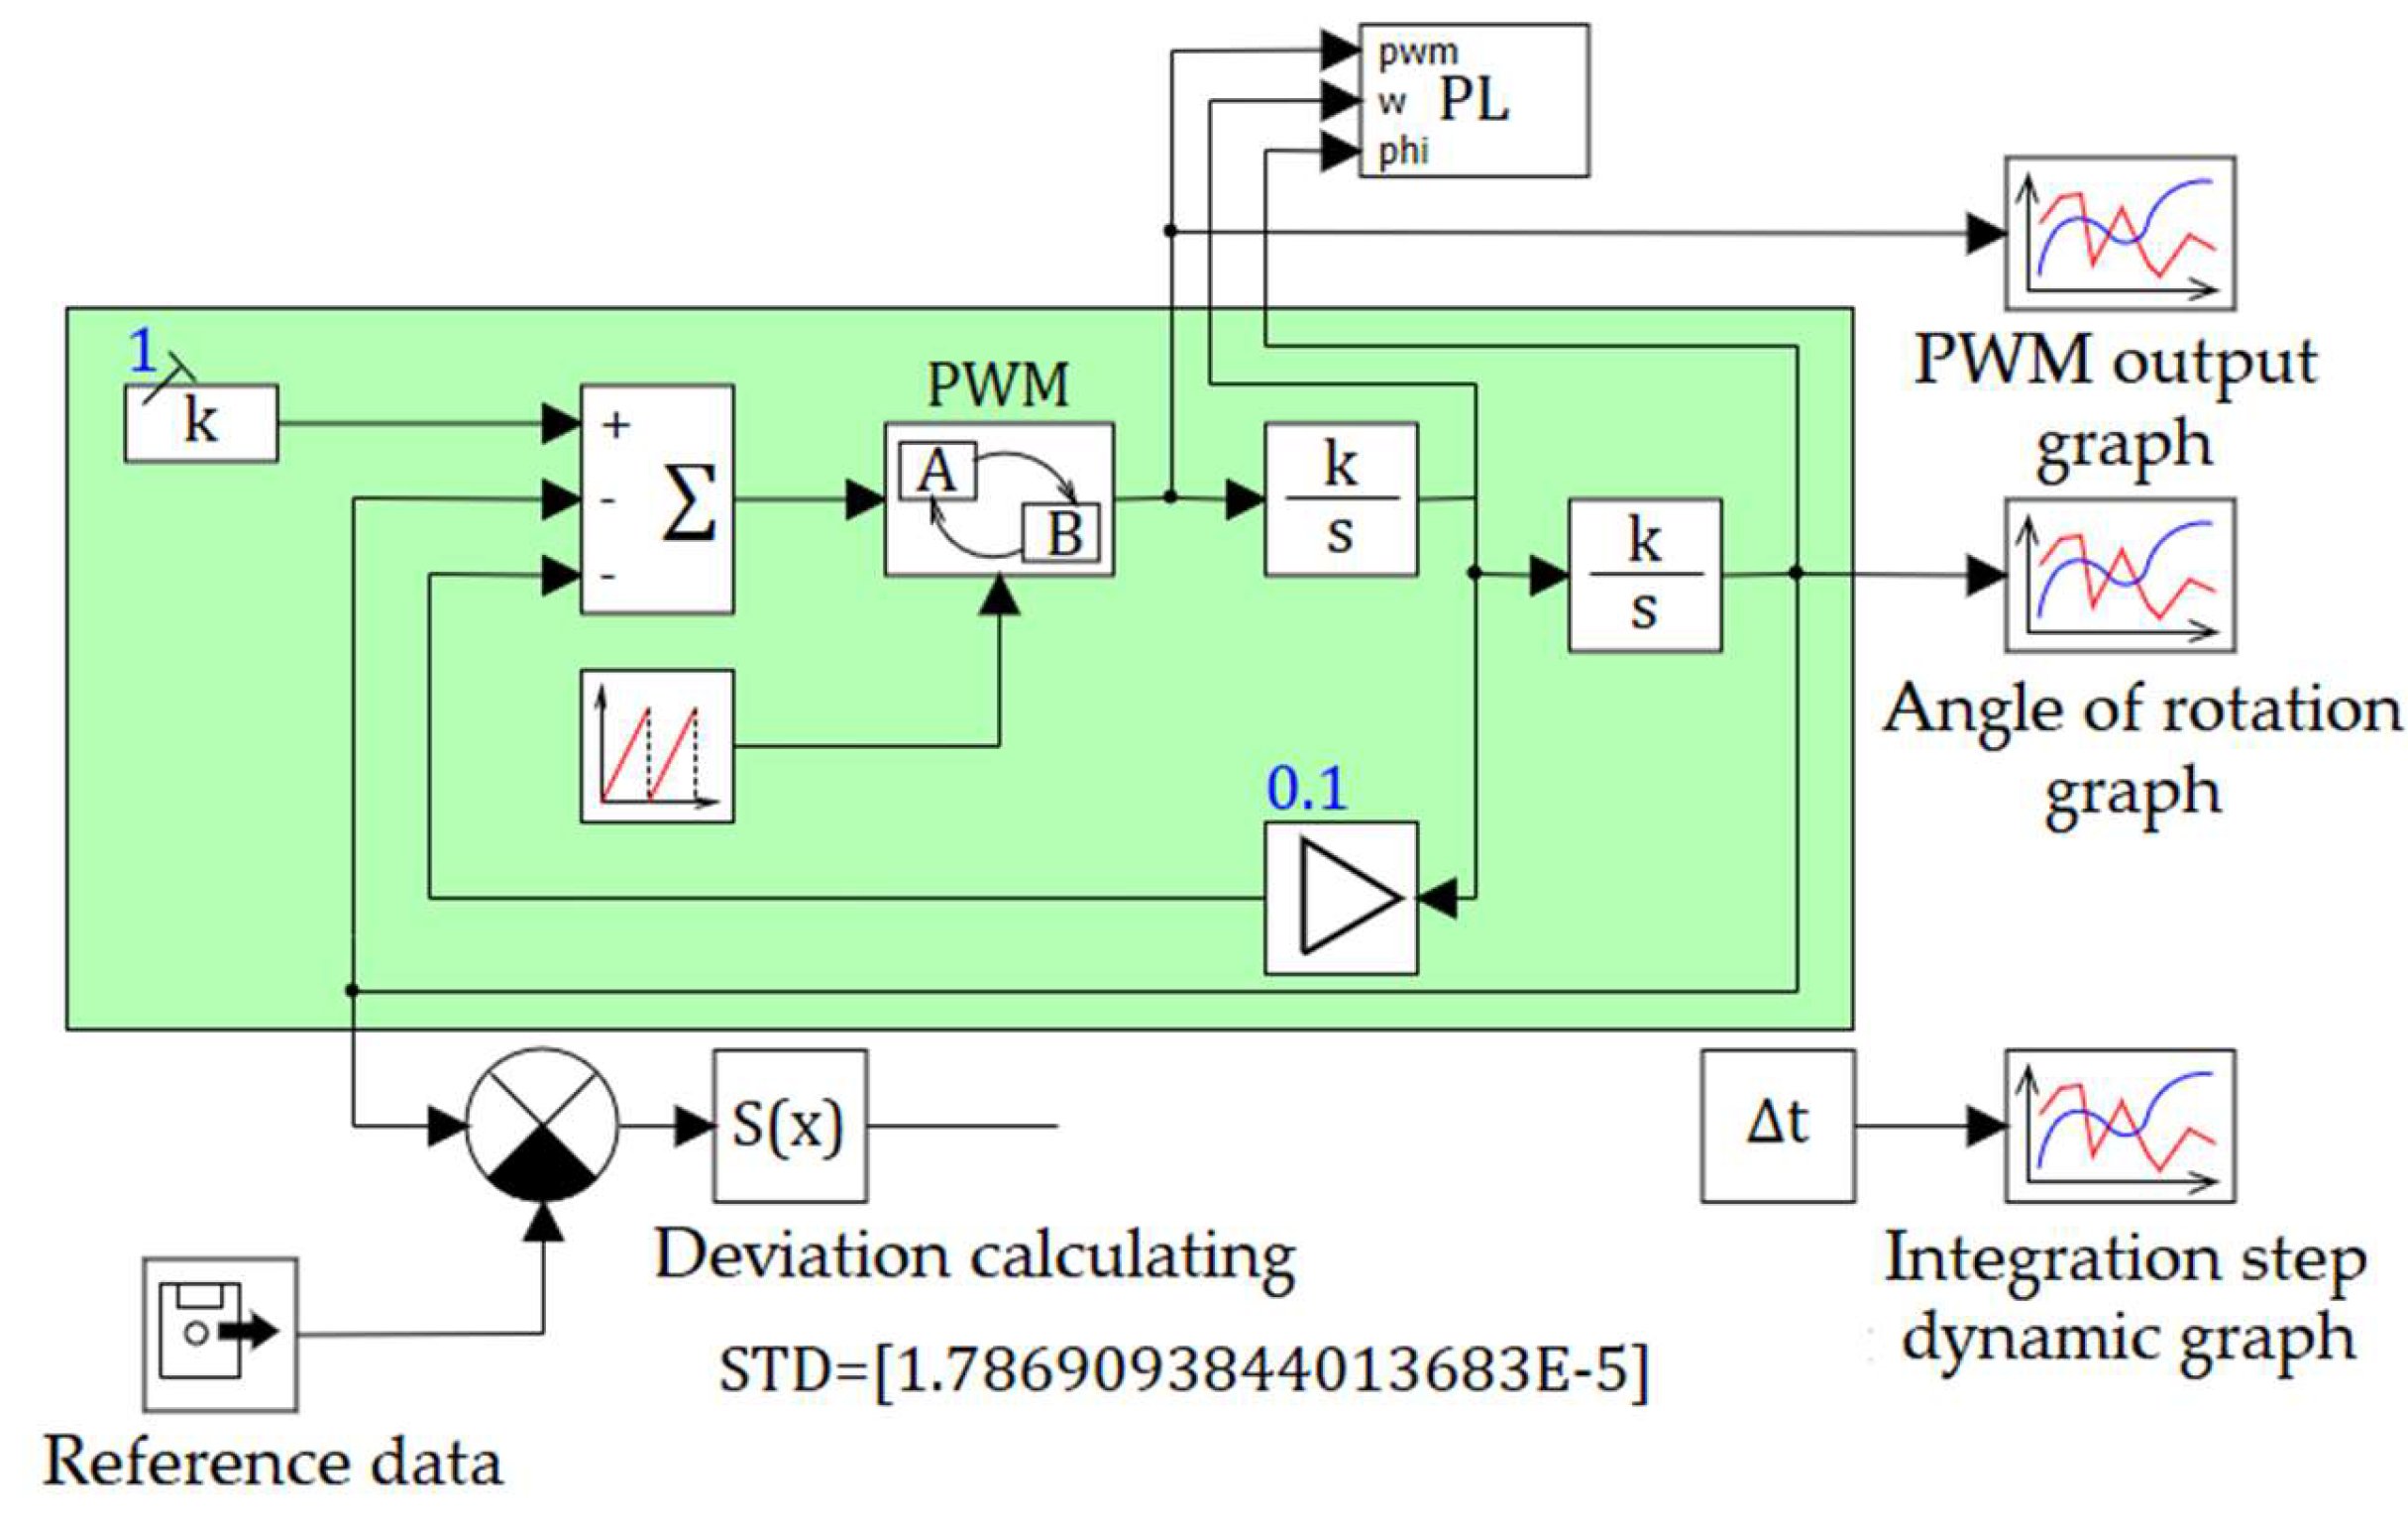
Figure 7.
The structure of the PWM submodel using statecharts.
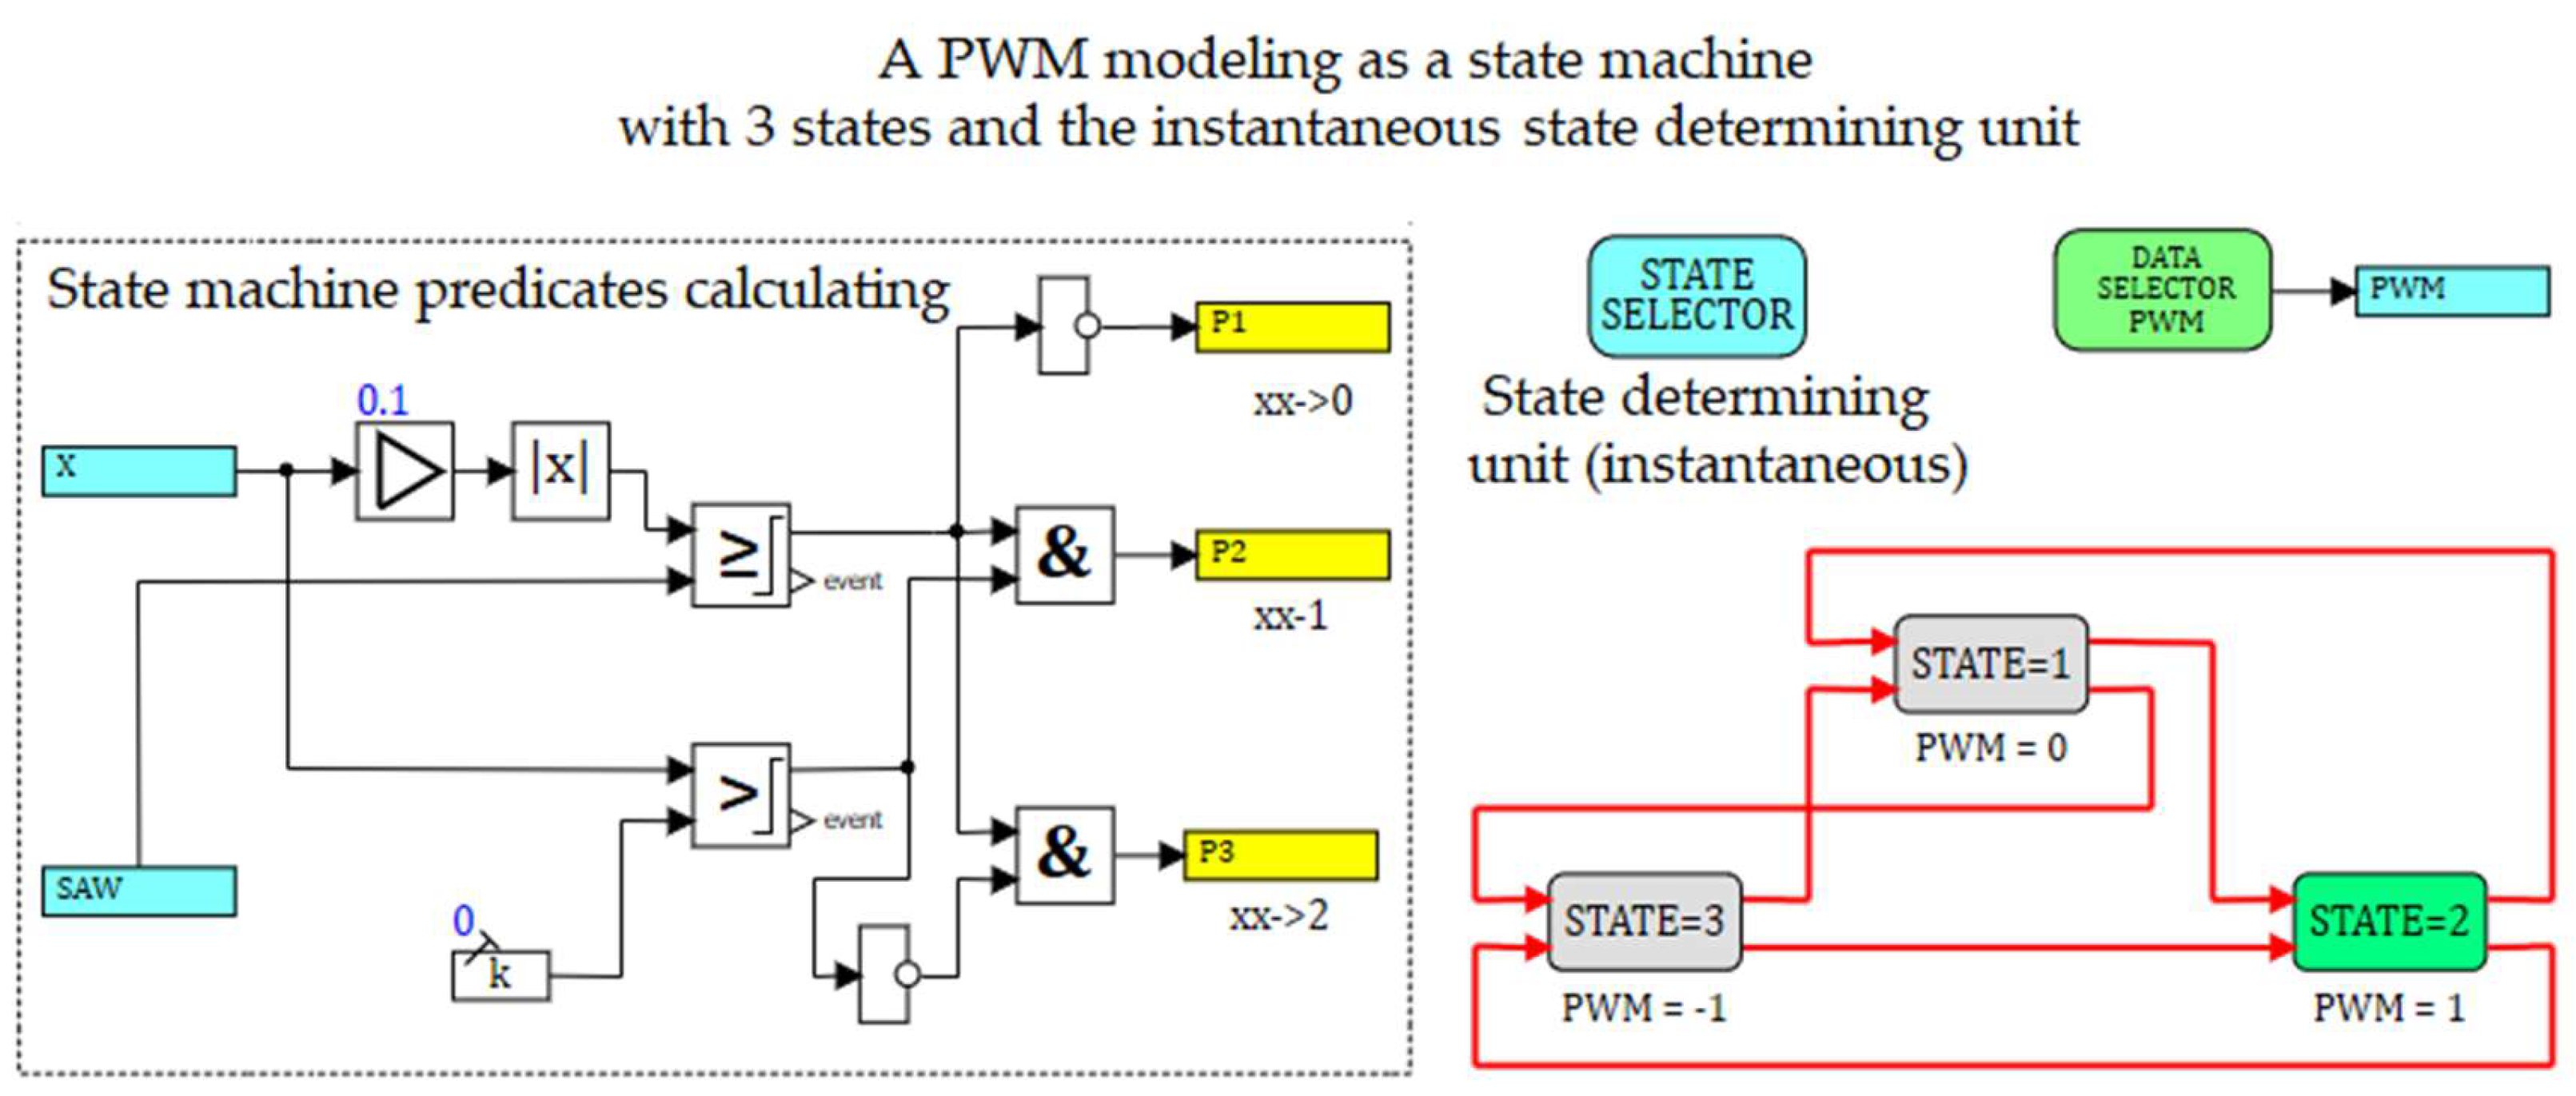
Figure 8.
The block diagram of the STATE1 state.
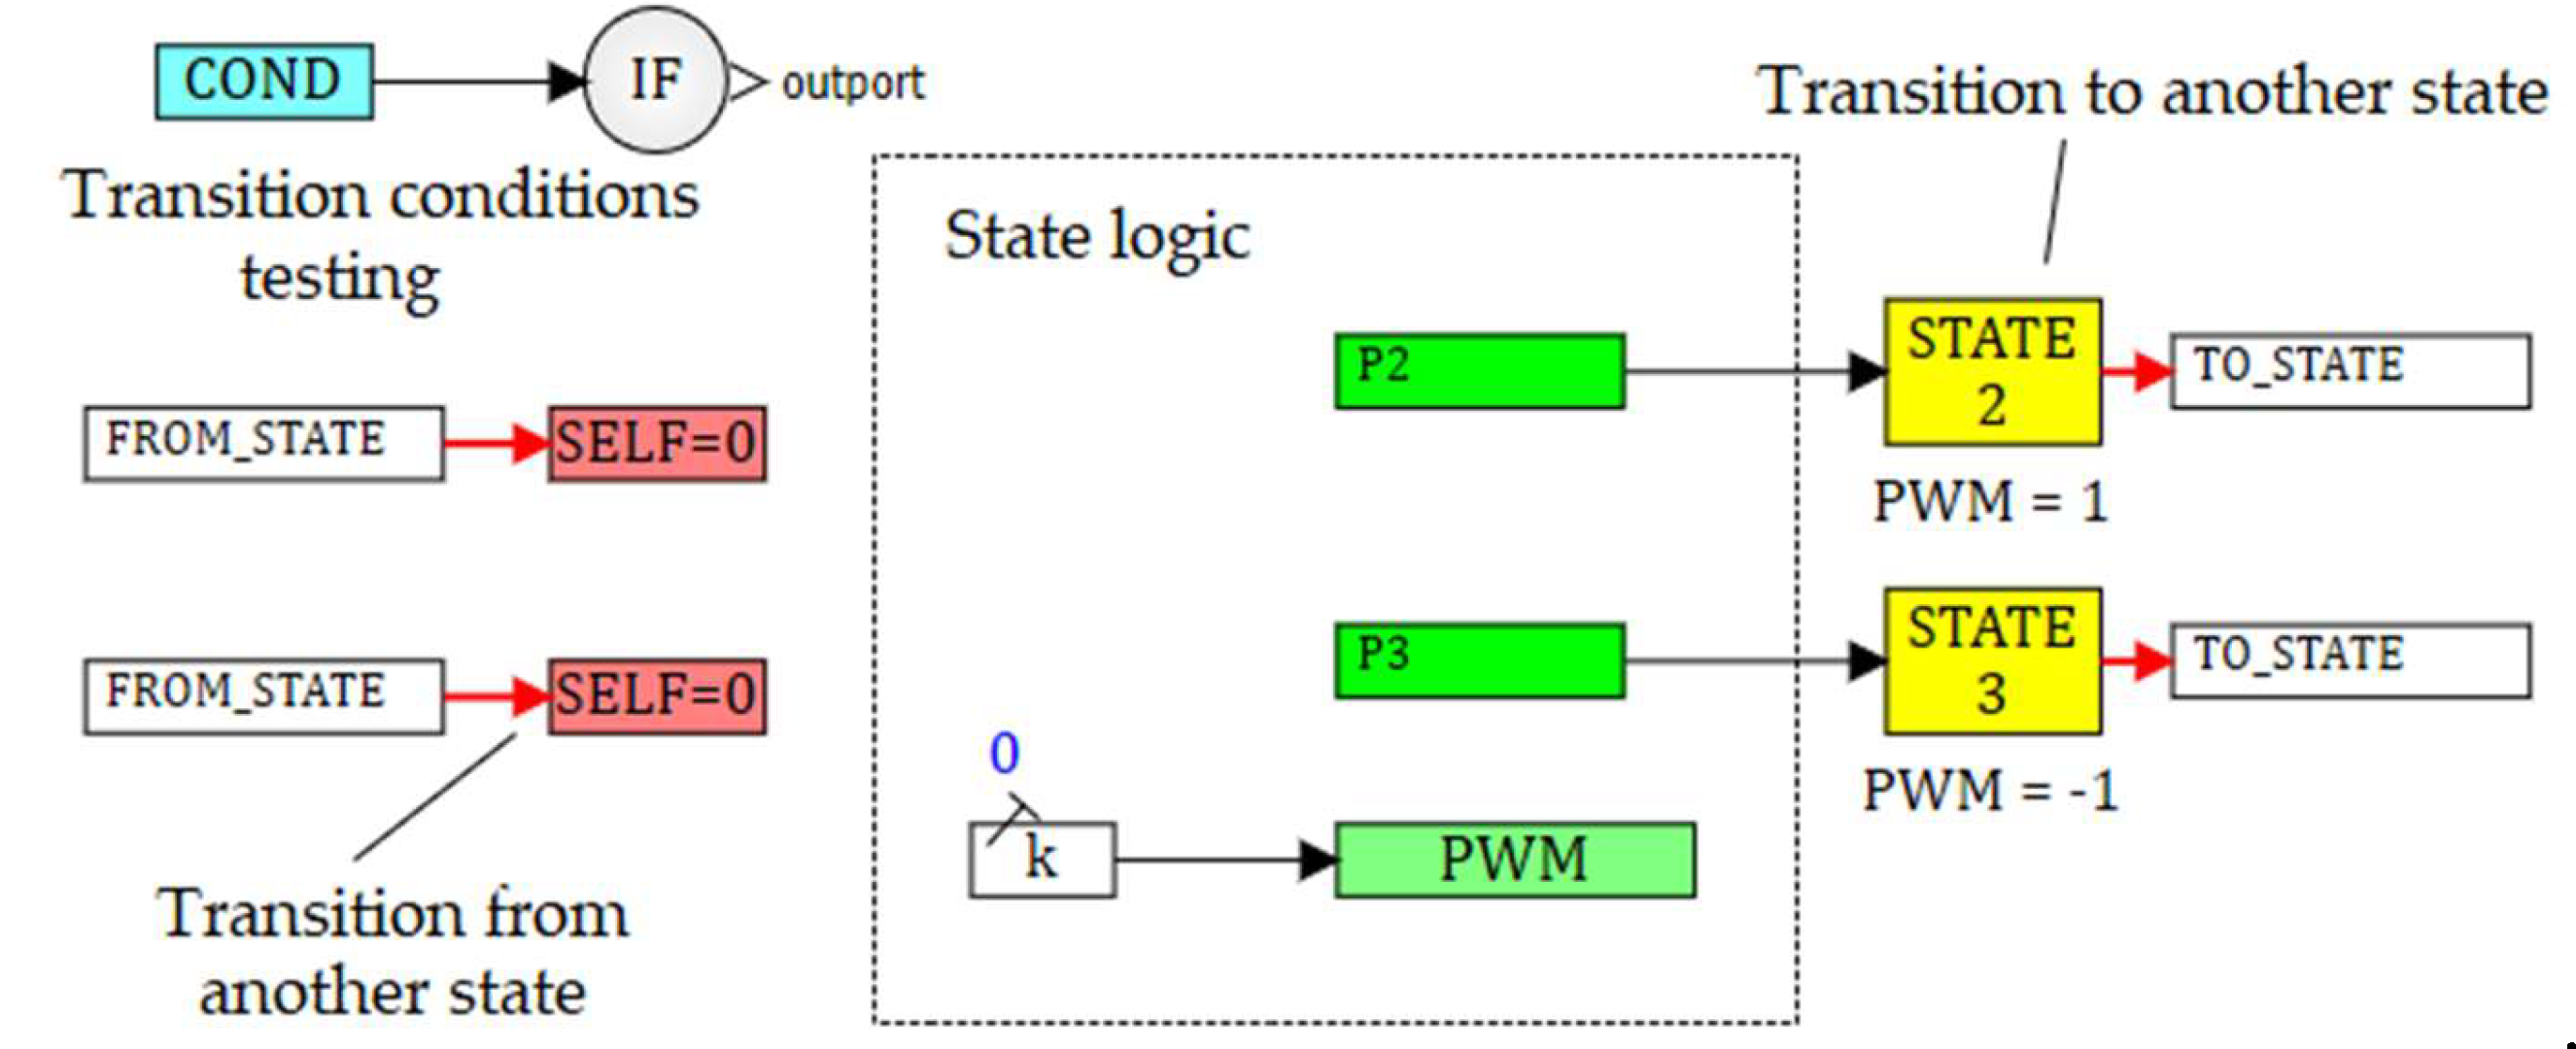
Figure 9.
The continuous model (4)-(8) with the PWM controller in the form of a finite state machine.
Figure 9.
The continuous model (4)-(8) with the PWM controller in the form of a finite state machine.
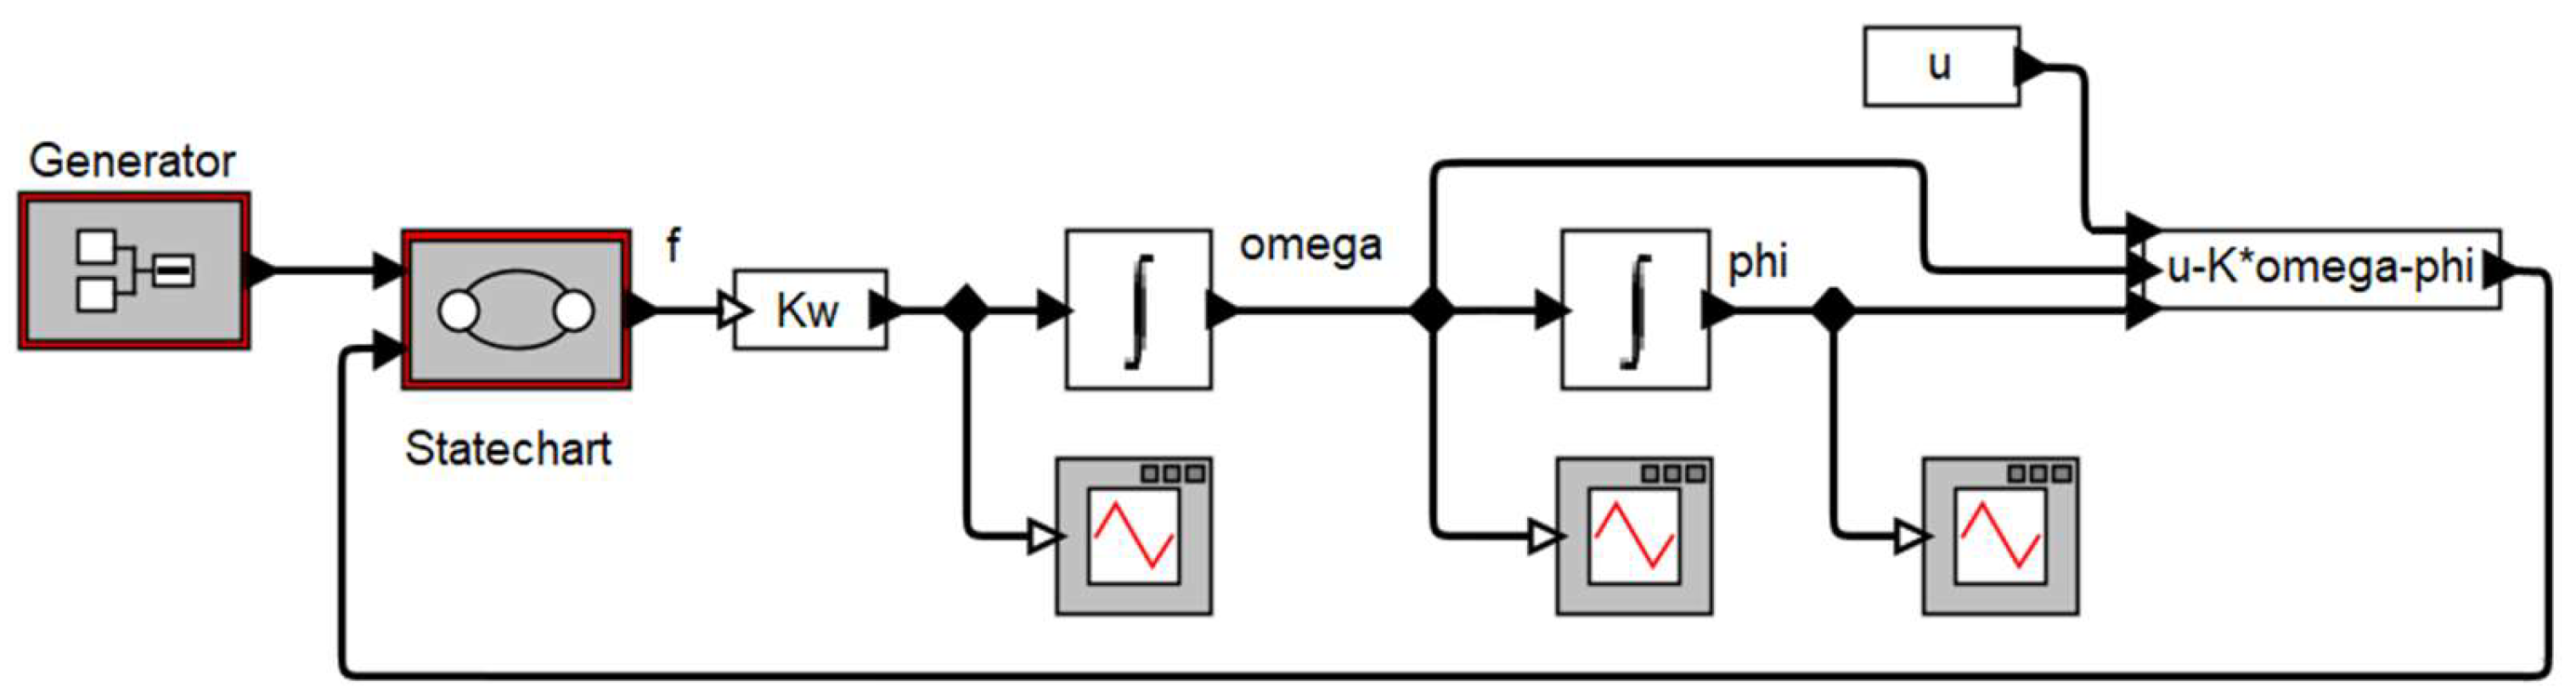
Figure 10.
The Harel diagram in Ptolemy II.
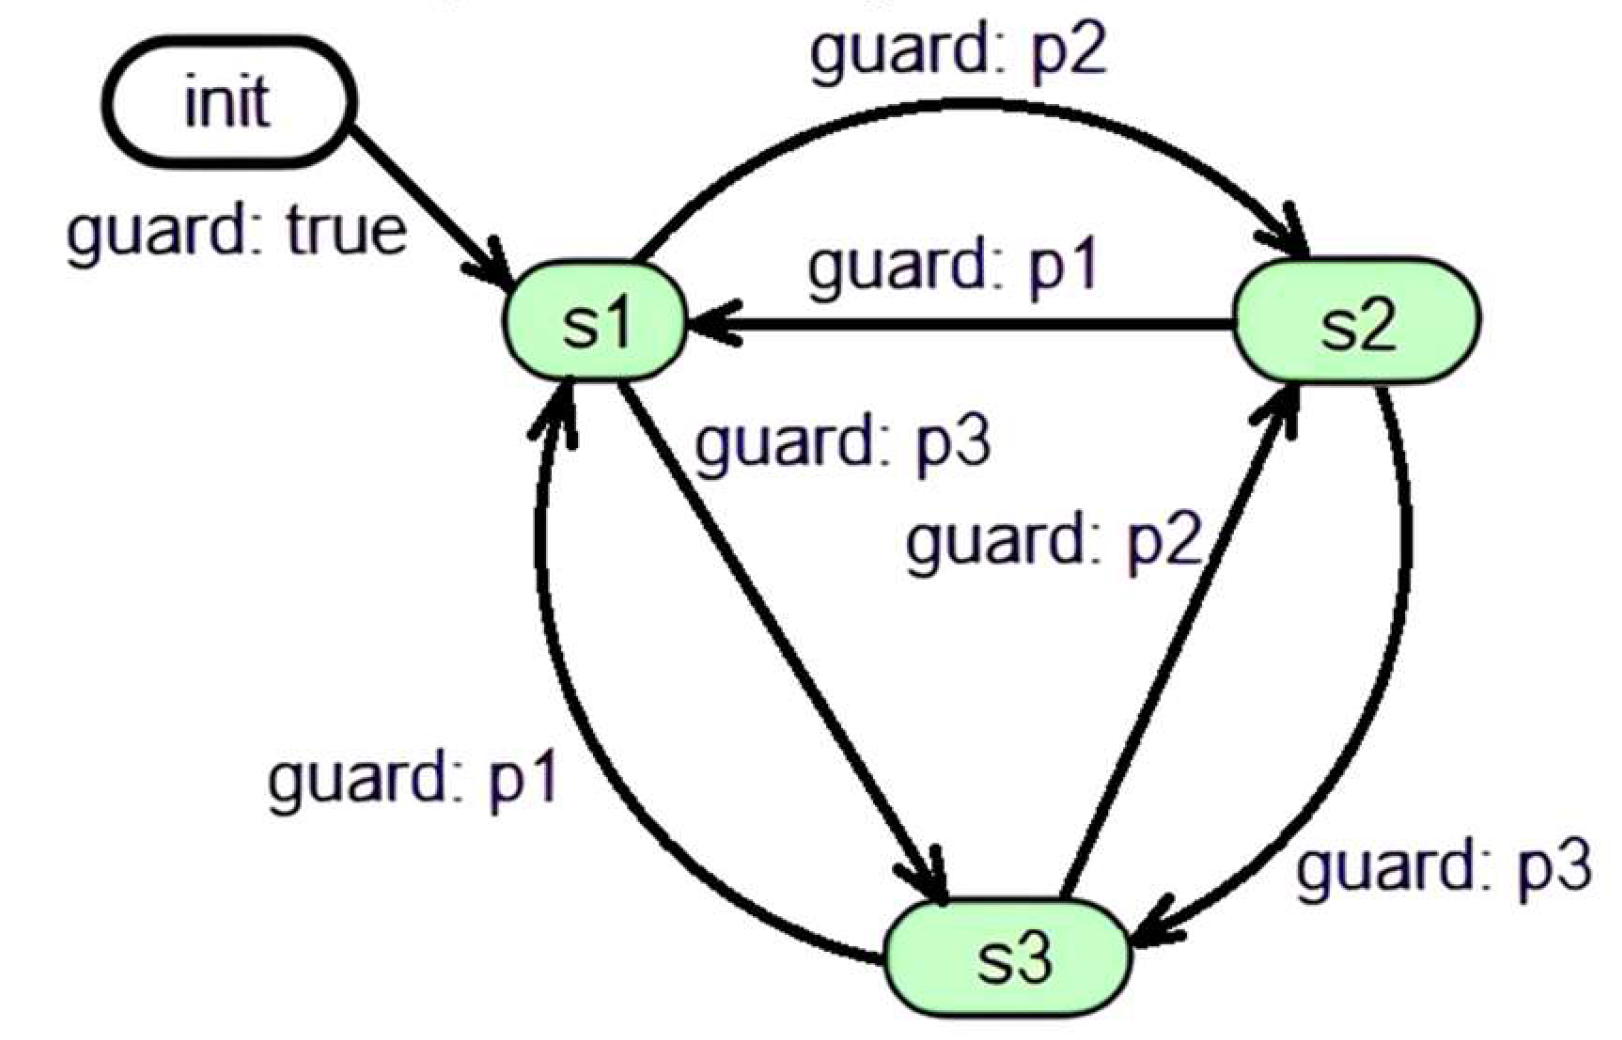
Figure 11.
An example of a state description (for the state st3).
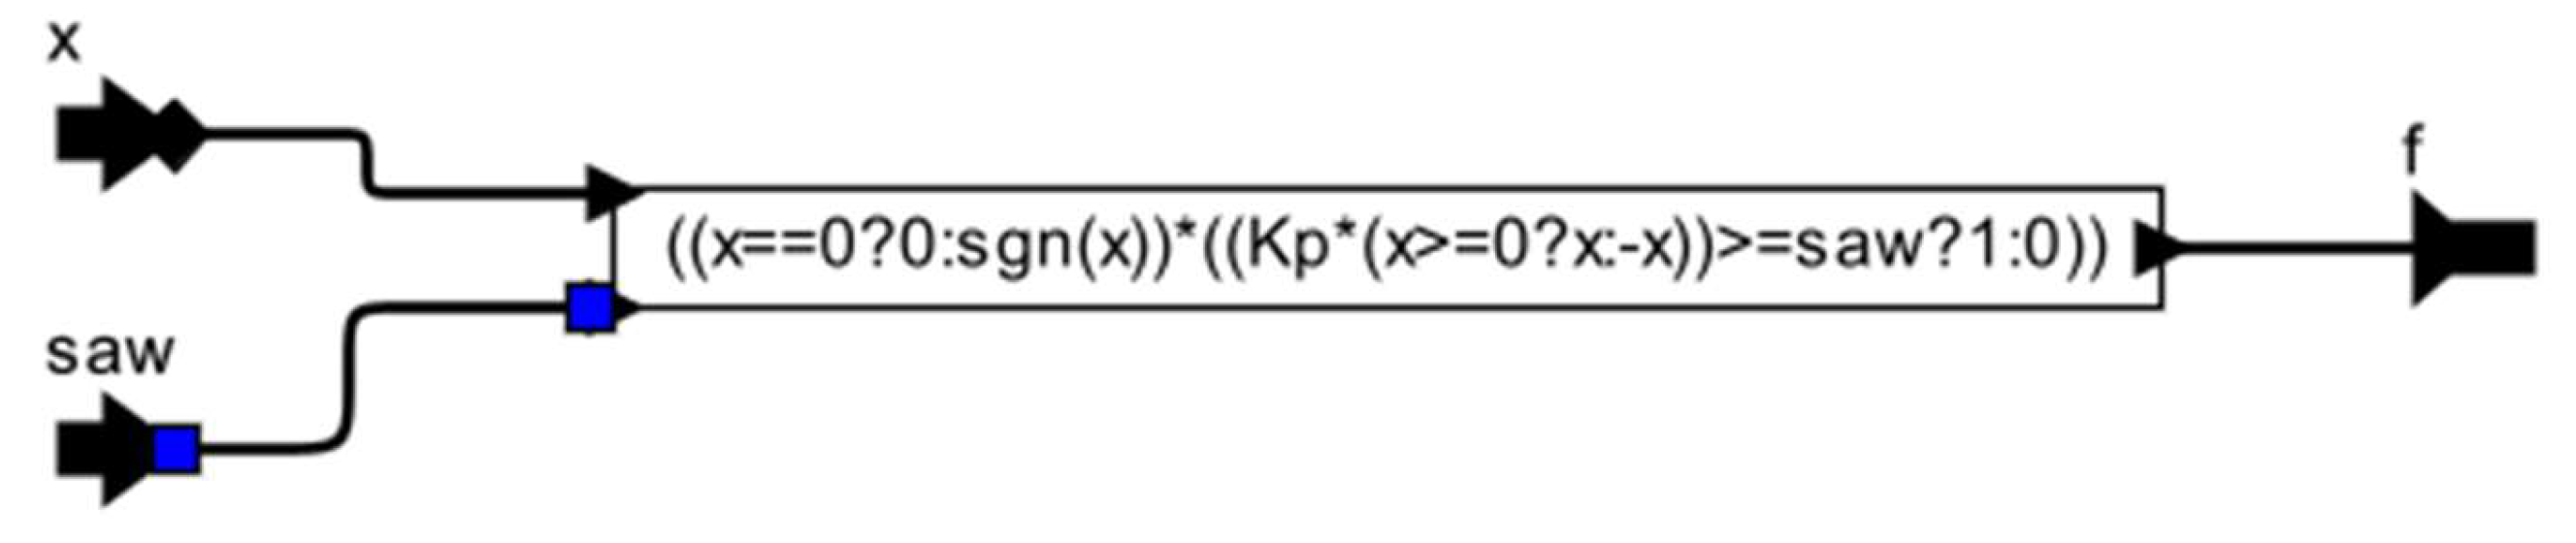
Figure 12.
Syntactic trees for the mode behavior predicate.
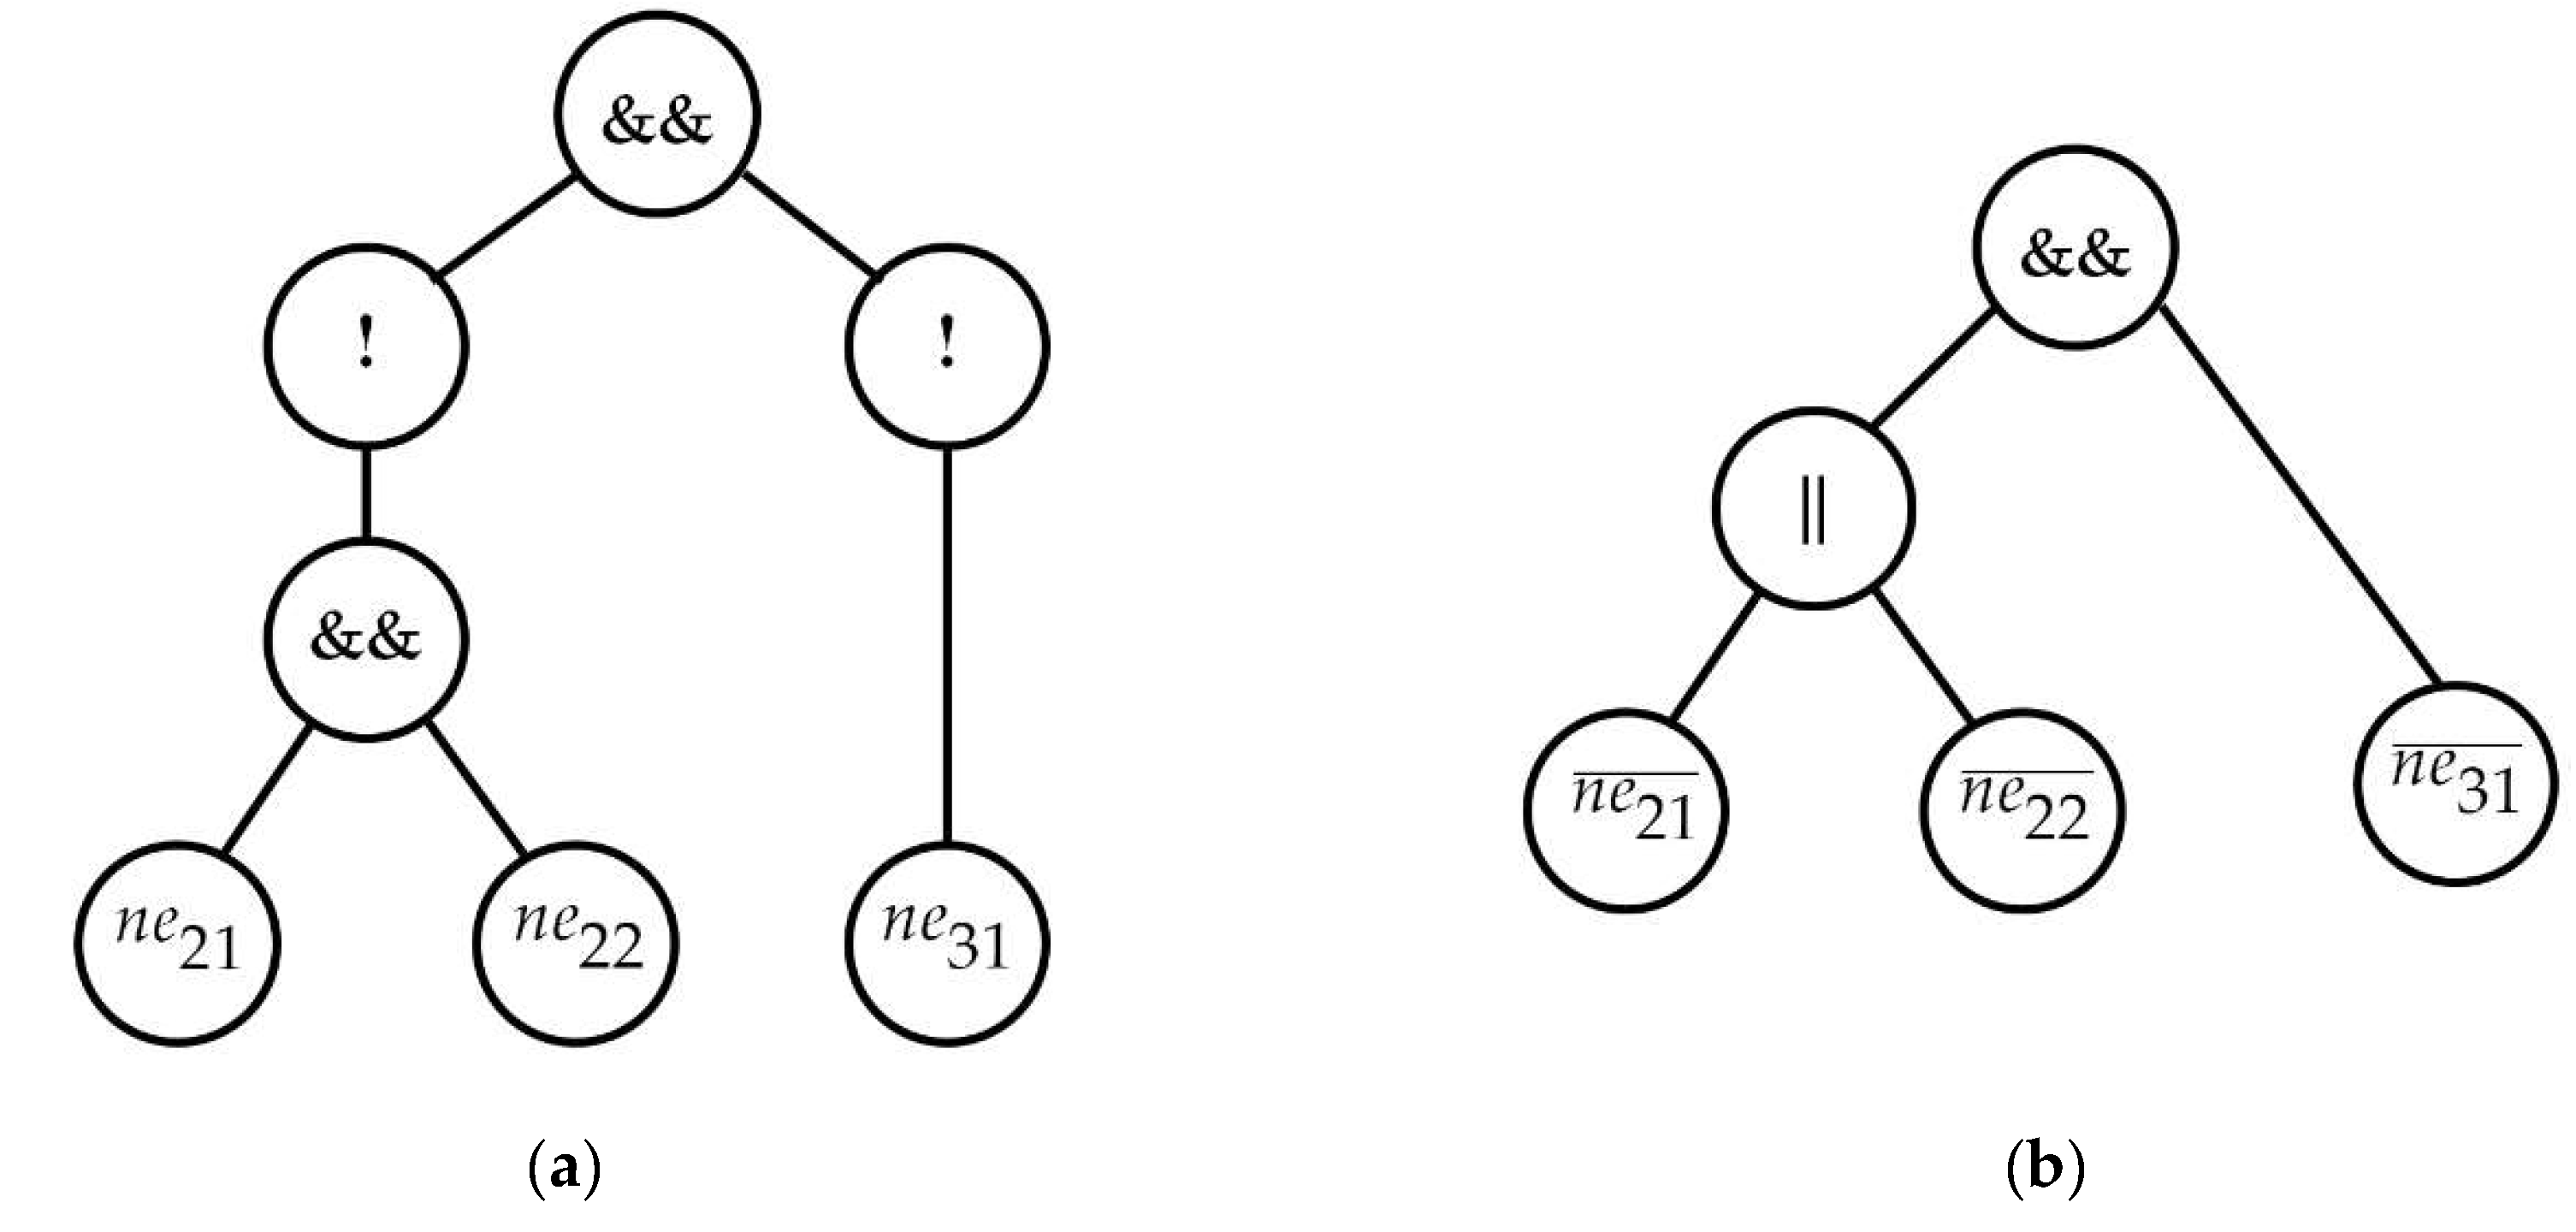
| (a) | (b) |
Figure 14.
Event functions dynamics.
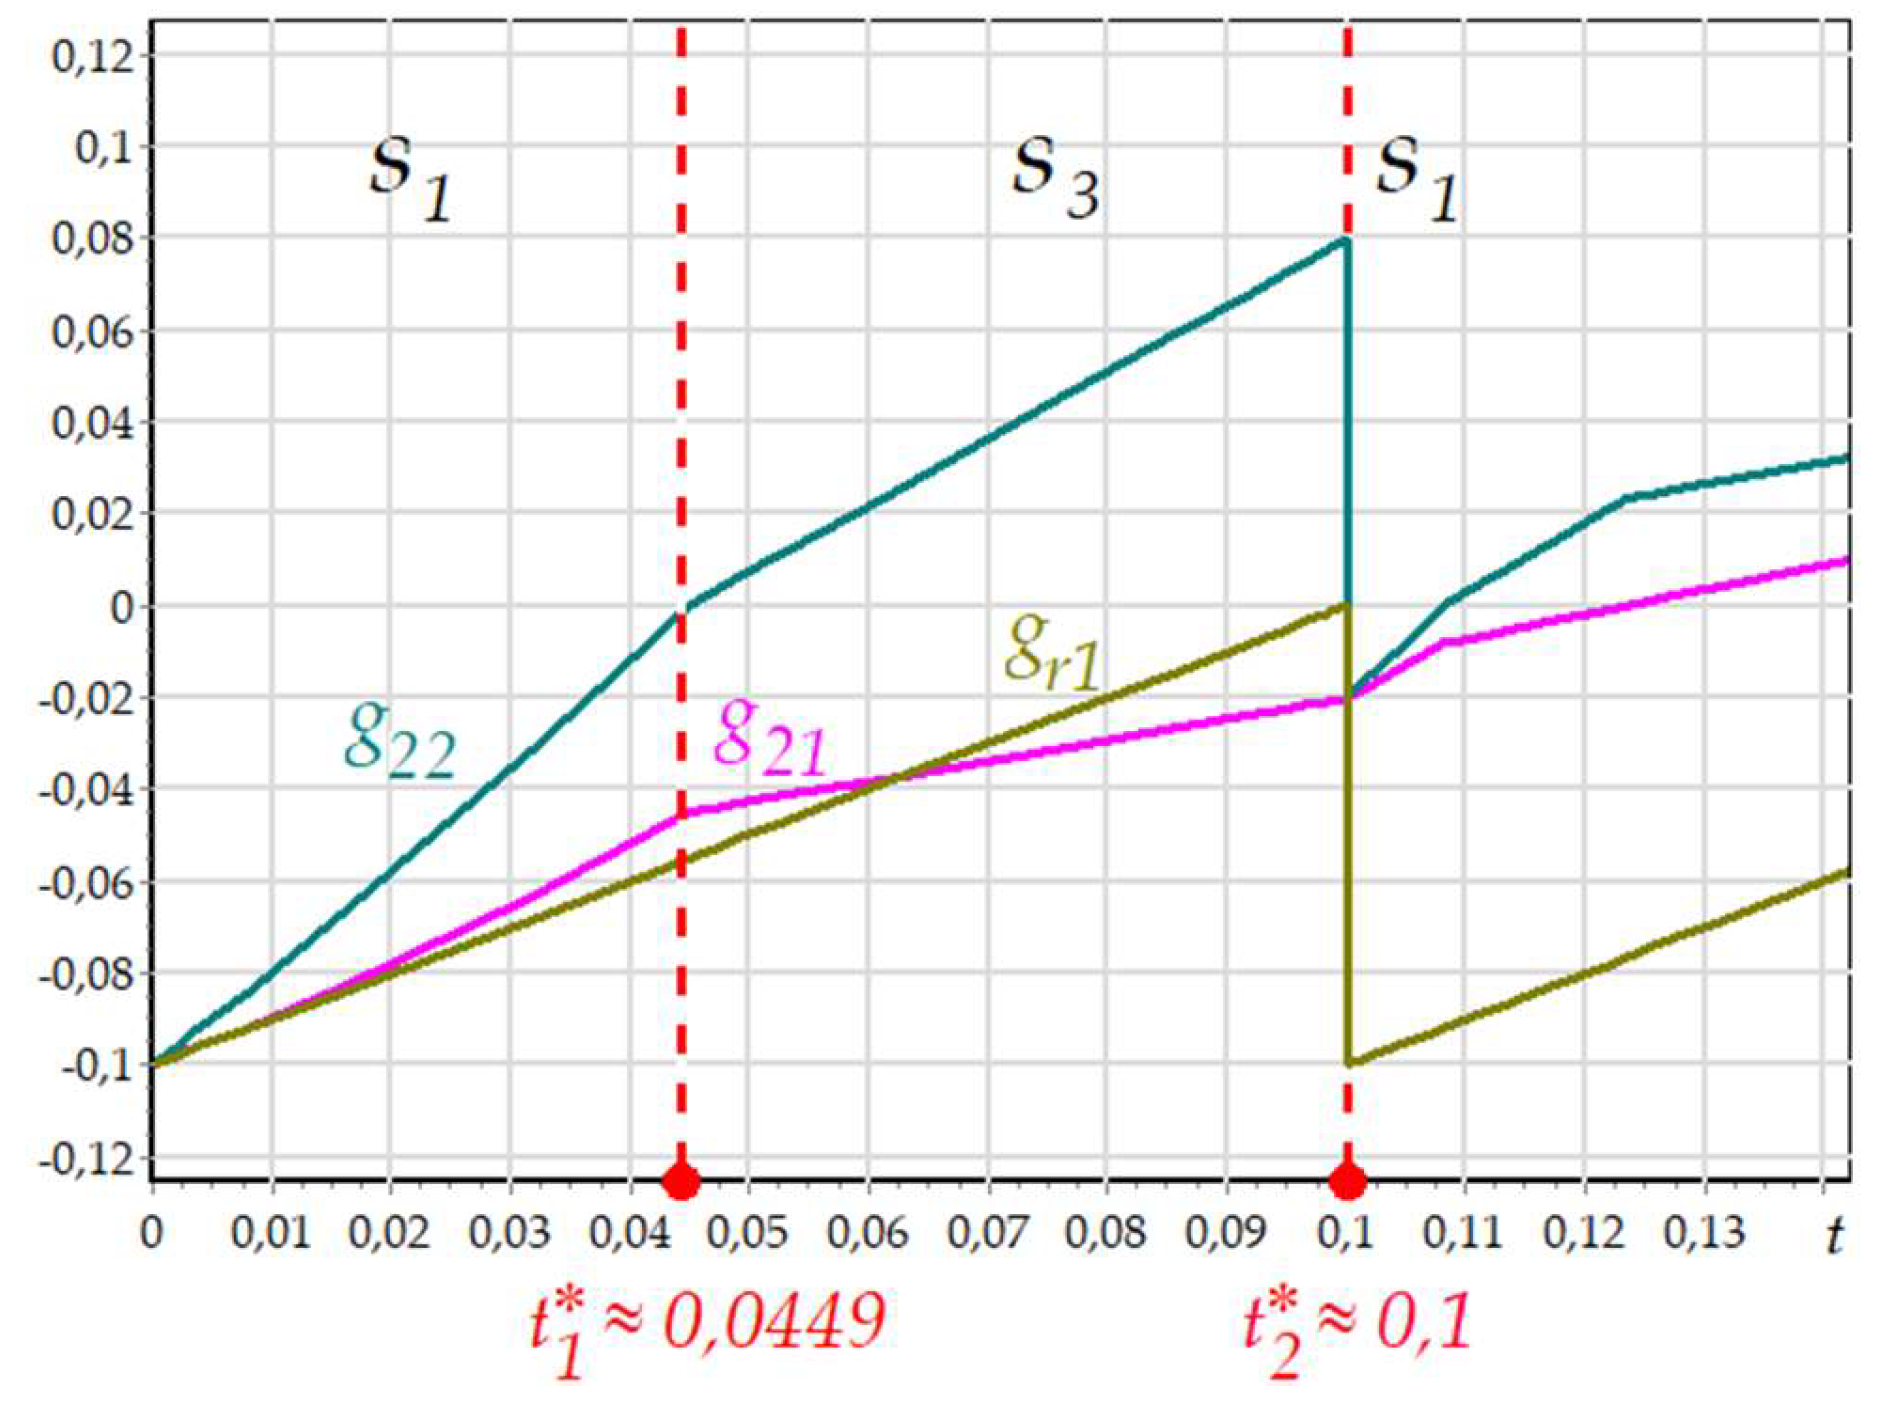
Figure 15.
Transition from
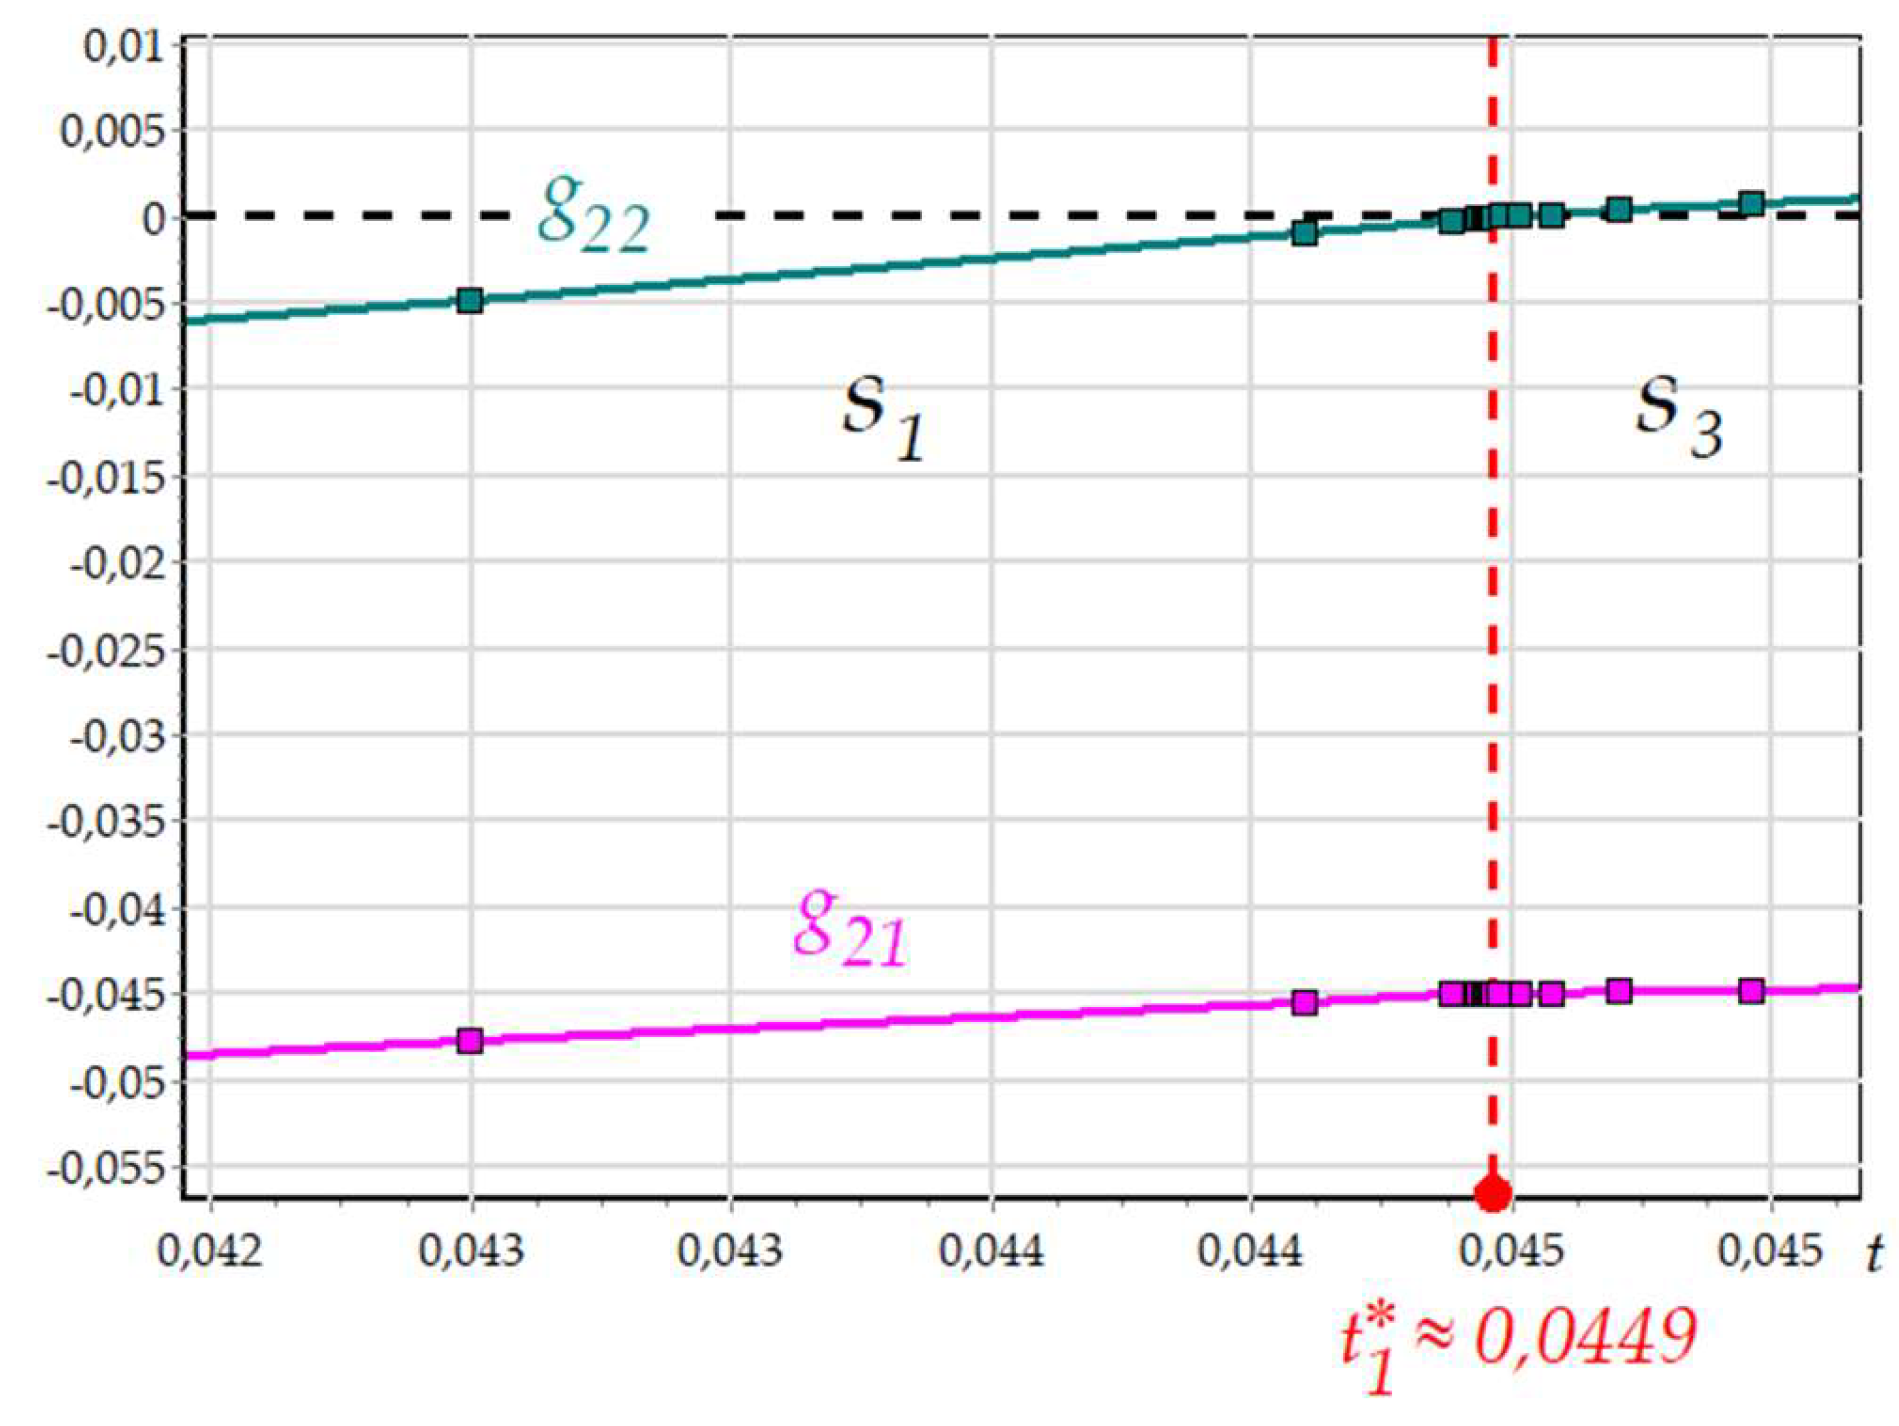
Figure 16.
Transition from to , when the condition is not met.
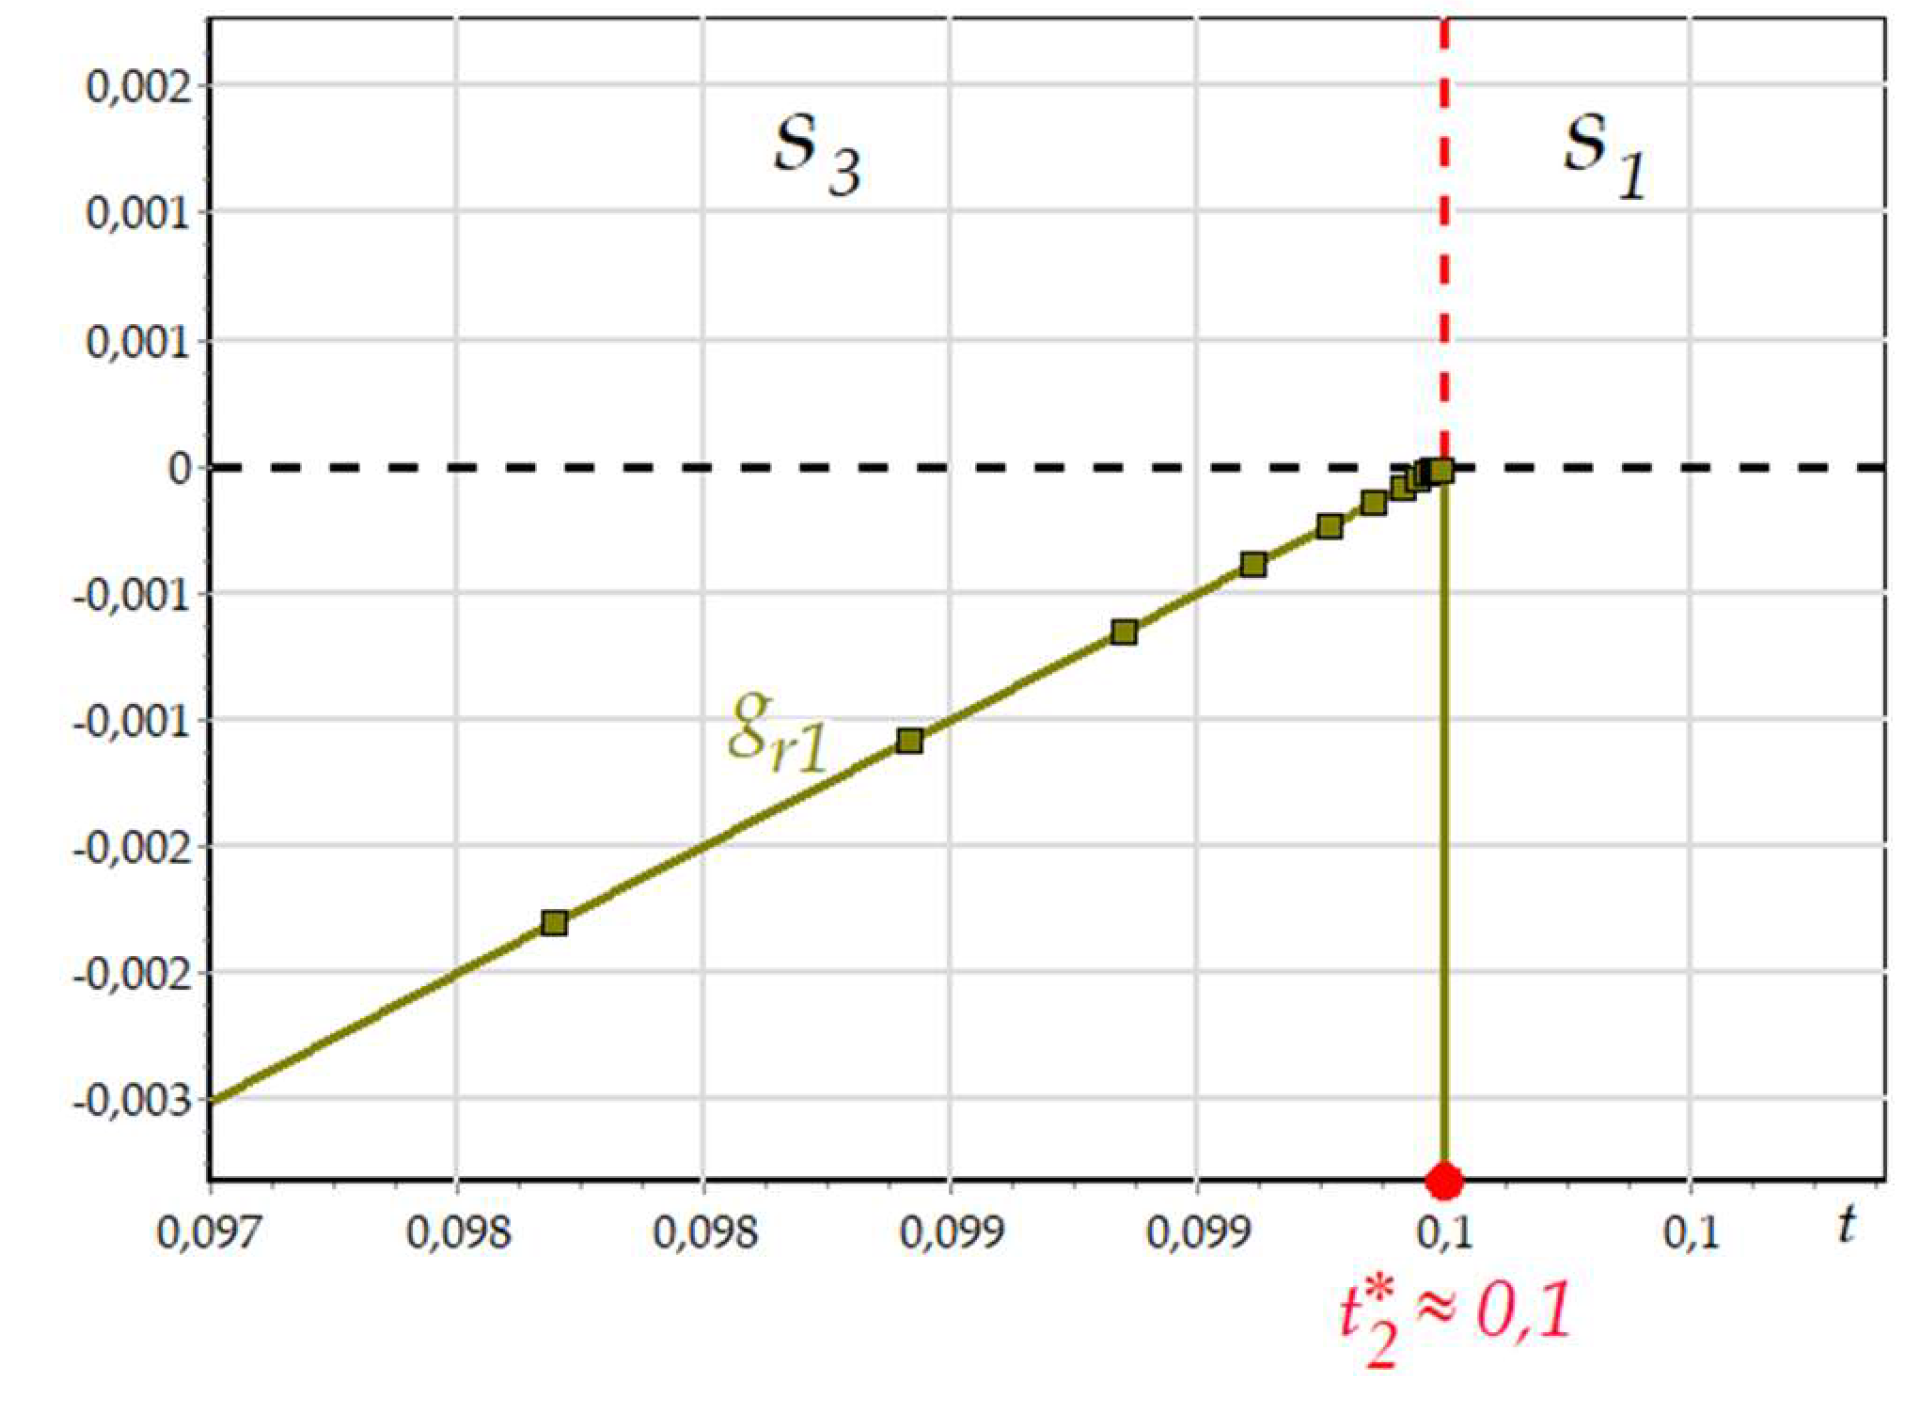

Table 1.
Summary data on calculating error.
| Platform | Time | Angular velocity | Angle of rotation | |||
|---|---|---|---|---|---|---|
| ISMA | 1.5⸱10-6 | 1.3⸱10-5 | 1.5⸱10-4 | 8.4⸱10-5 | 6.5⸱10-6 | 7.1⸱10-5 |
| SimInTech | 9.5⸱10-6 | 7.4⸱10-6 | 2.0⸱10-4 | 2.7⸱10-5 | 4.3⸱10-5 | 1.7⸱10-5 |
| MATLAB | -2.2⸱10-11 | -1.6⸱10-10 | -2.2⸱10-9 | 2.0⸱10-10 | -4.3⸱10-10 | -2.3⸱10-9 |
| Ptolemy II | 4.0⸱10-5 | 2.1⸱10-4 | 2.5⸱10-4 | 3.5⸱10-4 | 1.8⸱10-4 | 1.4⸱10-4 |
Disclaimer/Publisher’s Note: The statements, opinions and data contained in all publications are solely those of the individual author(s) and contributor(s) and not of MDPI and/or the editor(s). MDPI and/or the editor(s) disclaim responsibility for any injury to people or property resulting from any ideas, methods, instructions or products referred to in the content. |
© 2025 by the authors. Licensee MDPI, Basel, Switzerland. This article is an open access article distributed under the terms and conditions of the Creative Commons Attribution (CC BY) license (http://creativecommons.org/licenses/by/4.0/).
Copyright: This open access article is published under a Creative Commons CC BY 4.0 license, which permit the free download, distribution, and reuse, provided that the author and preprint are cited in any reuse.


