Submitted:
28 June 2024
Posted:
02 July 2024
You are already at the latest version
Abstract
Twelve clinically healthy and sexually mature New Zealand White rabbits were studied. The non-contrast imaging included T1-weighted and T2-weighted spin echo and gradient echo sequences in transverse, sagittal and dorsal planes. Transverse MRI (Т2-weighted image) through L1 demonstrated only the right kidney. The transverse T2-weighted image through L2 showed both kidneys. The cranial part of the urinary bladder on T1-weighted transverse scans through L4 was flexed to the left. The T2-weighted sagittal image 30 mm to the right of the median plane showed the right kidney, the right ureter and the urinary bladder. The T2-weighted sagittal image 30 mm to the left of the median plane showed part of the left kidney, the left ureter and the urinary bladder. The T2-weighted sagittal image 45 mm to the left of the median plane presented the lateral part of the left kidney. The dorsal MRI image (Т2-weighted sequence) through the horizontal plane 30 mm ventral to the spine demonstrated the whole organs. The data will be useful in imaging anatomy and diagnostic studies of various pathologies of the excretory system in rabbits and other mammalian species.
Keywords:
rabbit
; MRI
; urinary system
; anatomy
1. Introduction
The rabbit kidney is unipapillary, with renal pelvis recesses (dorsal and ventral) in the medullary part. So far, the rabbit is the only known mammal whose renal tubules may be separated on kidney MR slices while their epithelium remains intact, therefore it may be used in in vitro studies of kidney morphology. The right kidney can be palpated in the thoracolumbar region and is located cranially to the left one. In some individuals, the adipose capsule is thickened, causing ventral displacement of the kidneys. The thin-walled urinary bladder is situated in the ventrocaudal part of the abdominal cavity [1,2].
The excretory radiography of the normal urinary tract provides anatomotopographical and functional data about kidneys, ureters and urinary bladder of New Zealand White rabbits. It is established that the right kidney is located between the transverse planes from T13 to L2 vertebrae, while the left one: between L2 and L4. Anatomical landmarks for evaluation of morphotopographical features of kidneys and the urinary bladder in rabbits is their association with the length and localization of the second and fifth lumbar vertebrae [3,4].
The kidneys are paired retroperitoneally located parenchymal organs surrounded by adipose tissue. The left kidney is more mobile than the right one. They are located in the dorsal abdominal cavity due to the retroperitoneal fascia development preventing their ventral migration. In dogs, the right kidney is cranial to the left one and is situated between transverse planes through Т13—L2, whereas the left one—between planes through L1–L3. In cats, the right kidney is cranial (L1–L3) to the left one, which remains caudal to (L2–L4) or at the level of the right kidney, both being bilaterally symmetrical. The imaging anatomical shape and topography of kidneys is determined versus the length of L2. The canine kidney on dorsoventral radiological view is 2.5 to 3.5 times the length of L2, whereas the feline kidney—2 to 3 times the length of L2. Therefore, the length of L2 is an important anatomical landmark in evaluation of kidney length in domestic animals [5,6,7].
The urinary bladder of female dogs and cats has a longer and narrower neck unlike male dogs, which is the reason for the closer location of the urinary bladder to the pelvic rim in males. The urethra is radiologically invisible, so its visualization requires positive contrast within the urethral lumen. The contrast attenuation of kidneys is low during the first 20 seconds (vascular phase) of contrast application, and then radiopacification occurs within one hour from the cortex towards the renal pelvis. The renal pelvis and its peripheral projections are radiopaque and with distinct borders after the vascular phase of excretory urography. The renal pelvis is funnel-shaped with developed dorsal and ventral recesses that exhibit central brightenings from interlobal vessels’ topography. The ureter is a tubular finding becoming narrower in caudal direction and joining the trigonum vesicae. The radiological image of the ureter is segmented due to ureteral wall’s smooth muscle peristalsis, responsible for urine evacuation in caudal direction [5].
Renal shape, size and topography in humans and carnivores are altered in a number of diseases, e.g., inflammations, hydronephrosis, nephrolithiasis, compensatory hypertrophy, infarct, dysplasia, hypoplasia, cysts, ectopia, reflux and neoplasia. The enlargement of the right kidney causes ventral displacement of the descending part of the duodenum and the ascending colon. The larger size of the left kidney displaces ventrally the descending colon and adjacent jejunal loops. The image of kidneys may be normally changed by gas collections’ reflux secondary from caudal urinary tract. The excretory system of the kidneys and ureters (hydroureter, ureterocele) changes vigorously its shape and size in case of obstruction with concrements. The urinary bladder size normally changes depending on the amount of urine, it is also increased in urethral urolithiasis. After urine evacuation, the urinary bladder is radiologically invisible. Solid findings of increased radiopacity within the urinary bladder lumen are observed in presence of calculi, and the thickness of its wall changes in presence of intramural lesions [5,8].
In rabbits, diseases affecting kidneys are widespread (renal agenesis, asymptomatic congenital kidney cysts, bacterial infections, renal abscesses, staphylococcal nephritis, pyelonephritis, renal amyloidosis, urolithiasis and tumors). The application of diagnostic imaging methods for their diagnosis e.g., retrograde excretory urography and computed tomography excretory urography yield results. The normal rabbit kidneys are available for examination. In healthy rabbits, retrograde excretory urography and computed tomography excretory urography provide detailed image of kidney parenchyma and urinary tract. The computed tomography excretory urography predominates to retrograde excretory urography for evaluation of kidney parenchyma morphology. Therefore, this technique should be considered in rabbits with signs of intraparenchymal lesions [9,10,11].
The rabbit is commonly used as animal species in laboratory research, and is approved as a suitable experimental model in kidney research with respect to human donor kidney transplantation. Ultrasound, computed tomography and contrast radiography of kidneys in healthy rabbits provide topographical, morphometric and radiographic data on kidney morphology. For ultrasound examination, the animal is positioned in both supine and lateral recumbency. The kidneys are examined in longitudinal and transverse planes. For computed tomography exam without contrast medium, the rabbits are in ventral recumbency. The right kidney is slightly cranial to the left one by its length and separated from the stomach by the right liver lobe. Both kidneys appear as dense soft tissue findings with distinct borders in relation to adjacent organs. In the longitudinal plane, hypoechoic oval areas (renal pelvis recesses) are observed within the kidney medulla separated by hyperechoic peripelvic columns. The kidney papilla is hyperechoic [12].
MRI of anatomical and physiological features of kidneys was used for obtaining anatomic images, for monitoring of renal function (perfusion, glomerular filtration, interstitial diffusion, tissue oxygenation) and evaluation of anatomic interrelationships of macroscopic compartments of kidneys (cortex, medulla, sinus). MRI allows for a relatively high-quality, contrast and defined tissue and organ imaging in comparison to computed tomography (CT). The multiplanar MRI image acquisition is not associated with body exposure to ionized radiation. MRI presents relatively precise data regarding staging of human kidney tumors [13,14,15,16].
Pig animal models are commonly used because the structure of porcine kidneys is similar to that of human kidneys. At the same time, rabbits are also used as animal model in a number of human medical urological research studies: MRI, lithotripsy and partial nephrectomy. They are excellent laboratory biological models as they are easy to handle, not expensive and with well-acknowledged pathophysiological characteristics. Therefore, anatomical studies in rabbits are an important part of modern experimental medicine [17,18,19].
Spin-echo T1-weighted MRI demonstrates corticomedullary differentiation of normal human kidney. The image of the kidney cortex is relatively hyper intense than that of the medulla due to the larger amount of extracellular fluid in the latter. The lack of corticomedullary differentiation on T1-weighted images is a non-specific sign of kidney pathology. The rat is a biological model for investigation of human kidneys. In this animal species, the kidney cortical and medullary MR structures are comparable to human ones. The hydration status of rats influences the intensity of cortical and medullary MR signal. The structure of the renal cortex and the inner medulla are similar to those of men. The rat kidney possesses two additional layers located between the cortex and the inner medulla: outer and inner areas of the outer medulla. The outer area is visualized with the highest signal intensity on T1-weighted images, but with lower signal intensity on T2-weighted scans. This MR pattern is similar to that of adipose tissue: high signal intensity on T1-weighted and lower on T2-weighted scans, regardless of the fact that the area contains little fat. This signal pattern is attributed to the structure, blood supply and presence of a little amount of interstitial fluid in this area. The inner area of the outer medulla is hypointense on T1-weighted scans compared to the other medullary layers, and exhibits relatively higher signal intensity on T2-weighted scans. This layer contains the distal straight tubules and collecting ducts, resulting in hydration of the area on T2-weighted images. The differences in human and rat kidneys are related to MR imaging of the corticomedullary junction. The differentiation between rat renal cortex and medulla is similar to that of men only following hydration of the examined rats. The lack of image of the corticomedullary junction in patients with chronic renal failure is due to the fact that remaining nephrons are in a constant state of relative diuresis like hydrated rats. Therefore, the lack of differentiation between cortex and medulla on T1-weighted MRI images is a non-specific finding in men, presumably due to different kidney diseases or hydration of the patient [20].
MRI provides information about kidneys and ureters through spatial anatomic resolution. The MRI protocol combines morphological and functional evaluation of kidneys without nephrotoxicity. The only disadvantage of MRI in comparison to CT is the lower quality of uroliths’ image. In men, MRI is performed in dorsal recumbency with flexed stifle joints. MRI examination is done in consequent dorsal planes with phase-encoding from left to the right. It provides exact data on corticomedullary differentiation of renal parenchyma on T1-weighted scans. The normal renal fibrous and adipose capsules are identified relatively hardly. The fibrous capsule is visualized remarkably in inflammations of the kidney parenchyma [21,22].
Experimentally, urethral stenosis in rabbits has been studied with regard to its use as animal model for demonstration of clinical signs and subsequent morphological evaluation of altered tissues. MR urography is a modern imaging technique for examination of the entire urinary tract. The transverse MRI of urinary organs has replaced excretory urography as gold standard for detection of urinary pathological changes in clinical practice. MRI is relatively sensitive for visualization of obstructive lesions derived from neoplastic tissue and not from calculi [23,24,25,26,27].
On T1-weighted scans of human kidney parenchyma, the hyper intense cortical area is distinguished from the hypo intense medulla. On T2-weighted scans, the distinction of both areas is less pronounced, and the cortex appears hypo intense against the medulla. The veins are visualized as tubular structures without endoluminal signal (signal-absent image). The fibrous capsule is imaged as a hypo intense thin linear finding on both T1- and T2-weighted sequences. The high spatial resolution and tissue contrast of kidney MRI images provide detailed information on the anatomy of kidneys and urinary tract [28].
T1-weighted MR of normal kidneys in chinchillas give images with anatomical contrast. Kidney findings are more hypo intense than peripheral soft tissues. The renal cortex, medulla and pelvis are clearly visualized. The right kidney image is relatively hyper intense than that of the left kidney. On T2-weighted scans, the renal cortex appears relatively hypo intense than the hyper intense medulla. Among kidney structures, the signal of the pelvis is relatively the most intense [7,29].
Renal MRI comprises evaluation of the parenchyma, the renal blood supply and the collecting system. The non-enhanced imaging include axial T1-weighted breath-hold gradient-echo (GRE), coronal or axial T2-weighted breath-hold half-Fourier single-shot fast spin-echo (FSE) and frequency-selective breath-hold fat-suppressed 3D T1-weighted GRE sequences. MRI is a reliable technique for obtaining urological images with respect to surgical decision-making [30].
Two MR urography imaging protocols are acknowledged—static and dynamic. The static protocol, also known as uro-resonance in T2 (hydrography) employs T2-weighted sequences with long relaxation time of urine. The latter allows obtaining a hyper intense image of the urinary tract. The static uro-resonance is efficient in investigation of kidney collecting systems. This protocol does not require application of contrast. With the dynamic protocol, contrast medium is applied for evaluation of excretory renal function [31,32].
The purpose of MRI is the visualization of the kidney parenchyma and collecting system, of ureters and the urinary bladder with respect to the investigation of imaging anatomy of these organs for diagnostics and therapy of diseases and abnormalities in this region.
2. Materials and Methods
Twelve New Zealand White rabbits were included in the study. The animals were clinically healthy and sexually mature (8 months of age), weighing 2.8-3.2 kg. Anatomical MRI was performed in compliance with Permit No 377 of 6 March 2024 from the Animal Ethics Committee of the Bulgarian Food and Safety Agency, the provisions of the Animal Protection Act in Bulgaria (promulgated in State Gazette No 13/8 February 2008) and the European Convention for the Protection of Vertebrate Animals Used for Experimental and Other Scientific Purposes (ETS No 123, OJ L 222, 24 August 1999, p. 31–37). Food was withdrawn 4 to 6 hours prior to the MRI. Good body hydration status was essential for obtaining precise MRI data of urinary organs. The rabbits were housed at 25 °С under 12:12 h light:dark cycle [33,34,35].
MRI is based on the different water contents of body soft tissues associated with cell types and the occurring intracellular and extracellular processes. The scanner’s magnetic field aligns the nuclear magnetisation of hydrogen atoms in water environment inside and outside the cells (intra- and extracellular), then applies a radiofrequency signal to change the alignment of magnetisation by producing a rotating magnetic field by hydrogen nuclei. The reversed radiofrequency fields cause the protons to relax and restore their normal state and emit a radiofrequency signal, which is detected by the scanner and is used for image construction. The tissues regain their equilibrium for different time intervals. Thus, the change in scanning parameters creates images with various contrast. The main advantage of MRI compared to computed tomography consists in better contrast resolution of images, which is used for morphological differentiation of particular structural elements. Scanning sequences may be selected in order to demonstrate specific features of tissues, such as water content. On T2-weighted scans, the tissues containing fluids are brighter or more intense. T1-weighted scans produce an opposite tissue contrast. The pathologically altered tissues often are prone to develop edema, therefore the application of T2-weighted sequences is more appropriate. The T2-weighted sequences are often used for examination of the kidney collecting system and the urinary bladder as they contain fluids, which give hyper intense images [36].
MRI was performed using a tunnel MR scanner (1.5 T, Magnetom Essenza, version of software—Tim+Dot, Siemens Healthcare, USA, Whole body imaging; Dot®, The Siemens MRI software, Ferndale, MI 48220). The animals were positioned horizontally in supine position on a flat table, as the lumbar region was positioned in the isocenter of the magnet. The examinations were performed with a superconductive magnet at 1.5 T using surface coils, r-weighted spin-echo sequences (time to repeat/time to echo (TR/TE) = 450/20, matrix = 256 and between 4–6 averages). Dorsal, sagittal and transversal scans were with a slice thickness of 2 mm [34,35,37].
The study was performed under the following research imaging protocol: a magnetic field strength of 1.5 T; a superconducting type magnet; the diameter of the magnetic cylinder at 70 cm; 4 Channel Special-Purpose coil elements; matrix 256×256; pixel 1 mm2; transversal, sagittal and dorsal anatomical images weighted in T1 (TE 120 ms, flip angle 90°), and T2 spin echo and gradient echo sequences (TR 2000 ms, TE 100 ms, flip angle 90°); 2D acquisition schemes were applied for the sequences; FOV was 50 cm3 (with mean values 250/250), in all directions; SNR was 20 dB; echo time (TE) was 14 ms for T1 and 90 ms for T2; the repetition time (TR) was 500 ms for T1 and 4000 ms for T2; the voxel size was 10 mm3; the abdomen and pelvis was scanned with a full urinary bladder. The size of the voxel was increased to identify the number of tissue components of the organs. At the same time, the number of nuclei increased parallel to the SNR [16,34,35,38].
The rabbits were anesthetized with 15 mg/kg Zoletil® 50 (Virbac, Carros, France) (IM) (tiletamine hydrochloride 125 mg and zolazepam hydrochloride 125 mg in 5 mL of the solution) (Virbac, France). Anesthesia was potentiated with a Ketaminol® 10 solution (Intervet, Unterschleißheim, Germany) (IM) (Ketamine hydrochloride 100 mg/mL and Benzethonium chloride 0.1 mg/mL), in a dose of 0.5 mL/kg [34,35].
The rabbits were examined with caudally extended hip joints and flexed stifle joints. Immediately before the examination, a spasmolytic drug (Ketonal, Lek Pharmaceuticals d.d., Verovškova 57, Ljubljana, Slovenia, 100 mg/2 mL solution for injection, 1 mg/kg i.m.) was applied to block intestinal peristalsis and diaphragmatic breathing which may deteriorate image quality produced by the 1.5 Tesla MR scanner [39,40].
Transverse abdominal sections were obtained between the planes through the 10th thoracic and the last lumbar vertebrae. Sagittal sections were performed in planes located at 15, 30 and 45 mm to the left and to the right of the median plane. The dorsal sections were obtained in planes ventral to the spine at distances of 15, 30, 45 and 60 mm [34,35].
The non-contrast imaging included axial T1-weighted and T2-weighted spin echo and gradient echo sequences in transverse, sagittal and dorsal planes [30,34,35].
MR urography was performed in presence of static fluid in the collecting part of urinary organs to obtain a panoramic view of the entire urinary collecting system without application of intravenous contrast [41].
The used images were collected adequately and precisely from all twelve studied animals. The most quality ones were presented.
MRI slices were aligned on the following bones and soft tissue objects: bone anatomical landmarks—on transverse sections, depending on the topography of the slices to the corresponding vertebra; on dorsal sections; depending on the topography of the slices to the spine; on sagittal sections depending on the topography of the slices to the median plane. Soft tissue anatomical landmarks on transverse, dorsal and sagittal sections were the liver, stomach, small and large intestines, mesenterial root, mesentery, adipose tissue, diaphragm and abdominal wall [34,35].
The current study has been approved by permit for the use of animals in experiments No. 377, issued by the Ethics Committee of the Ministry of Agriculture and Food, Bulgarian Animal Safety Agency, with opinion No. 293 of 29.02.2024, Sofia, Bulgaria.
3. Results
3.1. Transverse MRI
Transverse MRI (Т2-weighted sequence) of organs at the level of the first lumbar vertebra (L1) visualized only the signal characteristics of the right kidney (Figure 1). The latter had an oval, dorsoventrally flattened shape. The renal pelvis was hyper intense and oval. Its borders with the inner part of the medulla were wavy due to the presence of kidney recesses and the irregular relief of crista renalis. The inner part of the medulla was hyper intense compared to the relatively hypo intense image of the outer medulla. The corticomedullary definition was sharply distinguished and outlined the transition between the hyper intense medulla and relatively hypo intense cortex. The fibrous capsule of the right kidney appeared as a thin linear finding. Its intensity was intermediate, compared to the hypo intense cortex and the hyper intense renal adipose capsule. Peripherally and on the right, the right kidney was separated from the hypo intense ventrolaterally located pars descendens duodeni by the adipose capsule. The latter touched the caudate lobe of the liver (Figure 1). Ventromedial to the right kidney was the hypo intense image of the ascending duodenum, whereas the relatively hypo intense image of the caecum was situated ventrally. Dorsal to the right kidney were the hypo intense signals of psoas muscles and longissimus muscle. The left kidney image was not visible, to the left, the heterogeneous hyper intense image of the descending colon, as well as the non-homogeneous hyper intense images of the jejunum and mesentery were visualized (Figure 1).
Transverse MRI (Т2-weighted sequence) through L2 showed both kidneys: the cranial part of the left one and the middle part of the right one. The hyper intense hilus of the right kidney with the beginning of the ureter, dorsolateral to the hypo intense signal of the ascending duodenum, were seen dorsomedially (Figure 2). The descending colon was visualized ventrally to the beginning of the left ureter. The dorsal and ventral kidney recesses appeared as hypo intense oval findings between the kidney pelvis and the medulla. The corticomedullary definition at the left kidney was well represented. The left kidney image had an almost triangular transverse profile, surrounded by the hyper intense adipose capsule separating it from the spleen—the latter being lateral to the renal finding. The proximal end of the ureter was seen as hypo intense tubular finding at the ventromedial border of the left kidney. The distance between images of the left kidney and medially located hypo intense image of the abdominal aorta was significantly greater than the distance from the right kidney and medially located hypointense caudal vena cava (Figure 2). The root of the mesentery appeared ventral to the aorta and caudal vena cava and medial to both kidneys as a heterogeneous hyper intense finding with irregular borders. The heterogeneous hyper intense images of the descending colon and jejunum with mesentery and the large hypo intense caecal image were visualized ventral to the left kidney. The difference in signals of the left kidney inner and outer medullary parts was similar to the pattern of the right kidney. The fibrous capsule of the left kidney appeared as a thickened linear hypo intense finding in comparison with the capsule of the contralateral kidney (Figure 2).
The transverse section of the middle abdominal region (T2-weighted sequences) at L3 demonstrated the caudal part of the right kidney and the middle part of the left kidney. This section displayed clearly the different shape of their transverse images. The right kidney shape was oval and dorsalventrally flattened, whereas the left kidney was pyramidal. The hyper intense image of the left renal pelvis was also almost triangular while that of the right one remained oval. The contact between the lateral part of the right kidney and the caudate lobe of the liver was outlined by the hypo intense linear image of the fibrous capsule. The anatomical relation between the lateral part of the left kidney and the spleen was also well-defined by the hypo intense linear fibrous capsule. The liver image was relatively hyper intense, followed in descending order the image intensity of the spleen, the renal cortex and medulla. The descending duodenum was ventral to the right kidney and the liver. The descending colon remained ventromedial to the left kidney. Hypo intense signals of psoas muscles and longissimus muscles appeared dorsally to both kidneys (Figure 3).
In the transverse plane through L4 (T1-weighted sequence), the filled cranial part of the urinary bladder demonstrated flexion to the left with localization of the organ in the left caudal abdomen with exception of the bladder neck. Therefore, the other abdominal organs in this part of the abdomen were displaced to its right part, where the ileum, the ascending colon, the caecum, jejunal loops and the attached mesentery were visualized. Dorsally, only the hyper intense images of duodenal parts were situated, appearing as heterogeneous hyper intense findings in comparison to the urinary bladder image. Cranially, a part of the urachus was seen, again hyper intense vs the urinary bladder. The transverse hypo intense images of the caudal vena cava and the abdominal aorta were visualized ventral to the body of L4 and dorsomedial to the urinary bladder. The urinary bladder image was dorsoventrally flattened and oval, with heterogeneous and relatively hypo intense lumen in relation to the MR features of the other abdominal organs. The T1-weighted sequence of the urinary bladder defined distinctly its borders from the adjacent soft tissues. The lumen of the studied organ was relatively hyper intense vs its hypo intense wall. The images of the dorsolaterally positioned muscles (sartorius, spinal, longissimus, biceps and gluteus muscles) were relatively hypo intense than that of the bladder. On this section, ureter findings were not presented (Figure 4).
The transverse section of the abdominal cavity through L5 (T1-weighted sequence) showed the heterogeneous hypo intense image of the urinary bladder body, compared to the images of the other peripheral organs. The bladder wall was observed as a clear hypo intense band with oval borders. The oval and dorsoventrally flattened urinary bladder was visualized in the left caudal part of the abdominal cavity. The hypo intense image of the ventral median ligament of urinary bladder appeared cranioventrally to bladder body (Figure 5).
On the transverse section through L6 (T1-weighted sequence), the caudal part of the urinary bladder was located in the left part of the caudal abdomen. The bladder lumen was relatively hyper intense in relation to its wall, which appeared as a thickened linear hypo intense finding. Dorsomedial to the urinary bladder, a hyper intense longitudinally oval finding showing the entry of ureters in the bladder wall. The transverse image of the abdominal aorta had an increased signal intensity compared to that of the caudal vena cava. The urinary bladder neck was not visible (Figure 6).
3.2. Sagittal MRI
Sagittal T2-weighted image of the abdominal cavity 30 mm to the right of the median plane showed the almost entire right kidney (in the dorsal lumbar area) and the right ureter and the urinary bladder as well. The right kidney demonstrated its specific bean shape, and the renal hilus was seen as a hypo intense dorsomedially located structure. The renal pelvis was clearly outlined as a hyper intense finding of irregular borders. Peripherally to it, the hypo intense dorsal and ventral recesses were visualized. The corticomedullary definition was clearly demarcated as an intense irregular finding of transient intensity, situated between the hyper intense medulla and the relatively hypo intense cortex. The renal adipose capsule was hyper intense and the fibrous capsule—hypo intense. The craniolateral border of the right kidney touched the heterogeneous hypo signal liver. The inner and outer areas of the kidney medulla were not distinguished. Caudoventrally to the hyper intense adipose capsule of the right kidney appeared the hyper intense tubular right ureter whose lumen was more intense than its walls. The hyper intense signal of the urinary bladder body was observed in the caudal abdomen, clearly delineated from the adjacent soft tissues. The latter comprised the heterogeneous images with varying signal intensity of the transverse colon, the transverse duodenum, the caecum, the jejunum and the mesentery. The urinary bladder neck was not observed (Figure 7).
The sagittal T2-weighted image obtained 30 mm to the left of the median plane demonstrated the incomplete image of the left kidney (its lateral part) located in the lumbar area, the left ureter and the urinary bladder. The adipose capsule of the left kidney was clearly defined and hyper intense. The fibrous capsule was linear, hypo intense, with irregular outer and inner borders. The renal pelvis signal was hyper intense with indistinct peripheral outlines. The transition between the inner and outer medulla was not observed. The corticomedullary definition was marked. Similarly to the findings for the right kidney, the cortex and the medulla of the left one had various signal characteristics. Cranioventrally, the left kidney communicated with the spleen and the stomach, whose signal was heterogeneous and hyper intense. The left ureter was visualized as hyper intense tubular finding in the segment between the transverse colon and the urinary bladder. The bladder lumen appeared relatively hypo intense than its hyper intense wall. It was located in the caudal abdomen, and was with irregular shape and indistinct borders. The urinary bladder neck was not found on this section (Figure 8).
The T2-weighted sagittal image of abdominal organs 15 mm to the right of the median plane showed the characteristic findings of the right kidney and the urinary bladder. The adipose and fibrous capsules of the kidney were clearly distinguished. The corticomedullary junction, although well delineated, had irregular outlines. The inner and outer areas of the kidney medulla had signals of different intensity: hypo intense outer and hyper intense inner medullary parts. The most intense signal characteristics were exposed by the renal pelvis. The image of the inner medulla was relatively hyper intense, separated radially by hypo intense linear findings. The cranial border of the right kidney touched the liver. The right ureter was not visualized. The urinary bladder signal was the most intense in relation to the other findings and appeared in the caudal abdomen. Its outer borders were irregular, and the bladder neck was not found (Figure 9).
The T2-weighted sagittal image of abdominal organs 45 mm to the left of the median plane visualized the images of the lateral part of the left kidney, whereas the same section on the right side did not display any kidney signal. The left kidney was presented as a small heterogeneous relatively hyper intense finding with poorly delineated pelvis and parenchymal parts. The kidney was located caudoventrally to the hypo intense parts of the spleen and the stomach. A segment of the hyper intense left ureter appeared in the dorsal part of the abdomen caudal to the heterogeneous hyper intense mesenterial root and caudodorsal to the tubular image of the transverse colon. The signals of the urinary bladder apex, urachal remnant and body were of high intensity compared to the hypo intense caudally located bladder neck. The bladder wall appeared as a hypo intense band of irregular borders (Figure 10).
3.2. Dorsal MRI
The T2-weighted image of the abdominal cavity (dorsal section; 15 mm ventral to the vertebral column) demonstrated the intense heterogeneous signal of the right kidney along with the hypo intense dorsal recessus. Only the dorsal part of the left renal cortex was visible. The signal of the adipose capsule was the most intense, marking the anatomical contrast between the right kidney and the caudate lobe of the liver and between the left kidney and the spleen. Medial to both kidneys appeared the hypo intense heterogeneous images of both iliopsoas muscles. The hyper intense longitudinally oval urinary bladder remained in the caudal left abdomen. Neither bladder neck nor urachal remnant were visualized (Figure 11).
The T2-weighted dorsal image of abdominal organs 30 mm ventral to the vertebral column demonstrated the image of the entire organs. The heterogeneous hyper intense right kidney was cranial to the image of the left one. The right kidney remained close to the median plane and the tubular signals of the caudal vena cava and the abdominal aorta, whereas the left kidney was visualized relatively laterally. Renal hiluses and the entry of both ureters appeared as hypo intense findings at the medial renal border. The adipose capsule was well defined and hyper intense compared to the barely visible hypo intense linear image of the fibrous capsule. The two medullary areas were visible with specifically different signal intensity. The corticomedullary definition was observed as a transition between the hyper intense medulla and the relatively hypo intense cortex. The transition between the dorsal and ventral recesses demonstrated a hypo intense image. The renal pelvis signal was more intense as compared to the other renal structures. The contact between the right kidney and the caudate lobe of the liver was visualized as hypo intense non-homogeneous finding. The contact between the left kidney and spleen was displayed as a significantly smaller heterogeneous hypo intense finding. The urinary bladder remained in the left caudal abdomen and presented a hyper intense longitudinally oval image. The bladder neck and urachal remnant were not observed. The signal of the urinary bladder possessed the same features as those described for the section 15 mm ventral to the vertebral column (Figure 12).
The dorsal section of T2-weighted images of the studied abdominal organs (45 mm ventral to the vertebral column) presented the entire left kidney. Its heterogeneous relatively hyper intense finding was in contact with the spleen craniolaterally, whereas the heterogeneous hyper intense stomach was craniomedial to the left kidney. The renal cortex signal was less intense than that of the medulla. It was with distinct outer relatively hypo intense part and hyper intense inner part. The medullary image was heterogeneous due to the radial hypo intense findings. The renal pelvis and the corticomedullary junction, the adipose and fibrous capsule were visualized. The hypo intense left renal hilus was located in the craniomedial part of the kidney. The ventral recessus was hypo intense. The entry of the left ureter appeared as a tubular findings with hypo intense lumen, caudomedial to the left kidney. Close to (medially) the kidney was the hypo intense signal of the ascending duodenum. The hypo intense image of the abdominal aorta remained medially to the left kidney. Only the ventral heterogeneous intense signal of the right kidney that touched cranially the liver was displayed. The hyper intense adipose and hypo intense fibrous capsule of the right kidney were scarcely presented, and medially to the kidney appeared the hypo intense caudal vena cava. Caudal to both kidneys, the images of the heterogeneous mesenterial root, parts of jejunum and transverse colon were found. The urinary bladder was the most intense, located in the caudoventral left part of the abdominal cavity. Its shape was elongated and oval; the large caecum was to its right side. The bladder neck signal was hypo intense in relation to that of the bladder body (Figure 13).
The T2-weighted images of the kidneys, ureters and the urinary bladder (dorsal section; 60 mm ventral to the spine) demonstrated the relatively hypo intense finding of the ventral left kidney; the right one presented no finding. The hyper intense adipose capsule and the hypo intense fibrous capsule were scarcely defined. The left hilus and ureter appeared as hypo intense luminal structures, caudomedial to the kidney parenchyma. There were no signals from the renal pelvis and renal medulla. The hyper intense image of the urinary bladder visualized its ventral part, along with the hypo intense bladder neck (Figure 14).
4. Discussion
The present MRI study provides information about kidneys and ureters allowing for anatomic imaging resolution of organs. Similarly to the MRI study in humans, the animals were in dorsal recumbency with flexed stifle joints. The MRI scans were performed in transverse, sagittal and dorsal planes. The normal kidney fibrous and adipose capsule in rabbits were defined relatively easily unlike humans, where the fibrous capsule was visualized significantly better in kidney parenchyma inflammations [21,22,30].
On T2-weighted sequences, the distinction between the renal cortex and medulla was more definitive contrary to previously published data [28]. The kidney fibrous capsule appeared as a thin linear hypo intense finding, in line with reports in men [28].
The present study yielded information in support of the fact that the contrast on T2-weighted MRI images of rabbit kidneys is anatomical, similarly to that of T1-weighted sequences in chinchillas [7]. The intensity of observed kidney findings was heterogeneous compared to the peripheral soft tissues [7]. The right kidney was visualized as a finding of soft tissue intensity, touching the hypo intense liver appearing cranially. The left kidney image was ventrocaudal and less well-defined vs the adjacent soft tissues than the right one, contrary to what was reported for chinchillas [7]. On T2-weighted MRI sequences, the shape of kidneys of New Zealand White rabbits was similar to that of chinchillas [7]. The observed hypo intense findings within the kidney medulla presented a pseudopapillary pattern of the rabbit pyelocaliceal system as compared to the multipapillary pattern of the renal parenchyma of chinchilla’s kidney cortex [7].
Transverse MRI (Т2-weighted sequence) at the perpendicular plane through L1 visualized only findings from the right kidney. The image was well defined, and of good morphological informative value. The central part in the kidney soft tissue finding was that of the renal pelvis, whose image was hyper intense due to the selection of T2-weighted sequence. That enhances the signal characteristics of fluid collections (here, urine). Towards the periphery of the renal finding, the intensity of studied structures (inner and outer medulla; cortex) decreased due to reduced tissue hydration. The corticomedullary definition was visible—a sign for intact renal parenchyma.
The transverse T2-weighted image through L2 showed images from both kidneys, the right one was closer to the median plane (caudal vena cava and abdominal aorta) than the left one. The different definition and informative value of images of the two kidneys confirmed the cranial localization of the right kidney in relation to the left one. The hilus and the beginning of the right ureter appeared at the dorsomedial border of the kidney, whereas at the left kidney they appeared at the ventromedial part—an important sign about bilateral difference in the rabbit renal topography. The hypo intense kidney recesses were visualized in the dorsal and ventral part of kidneys, close to the renal pelvis. The anatomical contact between the right kidney and the caudate liver lobe, as well as that between the left kidney and the spleen were demarcated. The sharp transition of the image signal from low towards high intensity of studied tissues was due to the different amount of interstitial fluids. The adipose capsule image between contacting surfaces of various signal intensity was not found, and only the linear hypo intense fibrous capsule was presented. The shape of the renal pelvis and that of the respective kidney was similar for both kidneys. The kidney shape was distinguished with bilateral difference (oval right and triangular left kidney), which is a species-specific image morphological trait.
The results from transverse MRI scans through L3 (T2-weighted sequence) provided a categorical evidence for the cranial position of the right kidney. The different signal intensity of the individual kidney structures on T2-weighted images was due to the amount of tissue fluids in the specific area. Thus, the hyper intense signal of the renal pelvis and the hypo intense image of the cortex was attributed to the low amount of fluid collection in the renal cortex. As the medulla was concerned, the observed hyper intense image of the inner medulla in relation to the outer area was also due to the higher fluid content (degree of hydration) in the inner part. There were no images of large areas of the right and left ureters because of the ureteral wall peristalsis and the constantly changing lumen of these tubular findings. The observed segmented image of the beginning of ureters was hypo intense due to the wavy motility pattern of the wall and the lack of urine in the ureteral segment.
The obtained results confirmed the hypothesis about the bilateral topography of the rabbit kidneys, demonstrating convincingly their retroperitoneal localization [5]. The caudoventral location of the left kidney found by the performed MRI scans presented the left kidney as more mobile [5]. Similarly to findings in dogs [28], the right kidney of rabbits was cranially located [5]. Unlike cats, both kidneys of rabbits did not show bilateral symmetry [5]. The study was designed to present the image MR characteristics of the studied rabbit organs, and not their morphometric features [5].
From the two existing MR urography protocols—static and dynamic [40], our study applied the static one in order to use T2-weighted sequences with long relaxation time of urine. This allowed obtaining hyper intense images of the urinary tract and renal parenchymal structures, which were with higher degree of hydration. The investigation of the kidneys, the ureters and the urinary bladder in the rabbit does not require prior application of contrast, therefore imaging is not dependent on the excretory phase in the dynamic protocol, and depends only on the presence of urine in the collecting system and ureters [31,32].
The results from transverse MRI of the urinary bladder through L4 (T2-weighted sequence) confirmed its localization to the left. The flexion of the bladder in this direction is caused by the large caecum situated in the caudal right part of the abdominal cavity. The image of the urinary bladder lumen was relatively hyper intense unlike that of its wall (hypo intense), and at the same time, it is hypo intense in relation to adjacent abdominal organs due to the option of T1-weighted sequence.
The image of part of the ventral ligament of the urinary bladder appeared on the transverse section through L5 as a relatively hypo intense soft tissue finding due to its layer structure.
The ureters were visualized on transverse MRI sections through L6. Only the hyper intense terminal parts of ureters were observed at the site of their entry in the dorsocaudal part of the urinary bladder. The hyper intense ureteral image was due to the superimposition of hyper intense soft tissue images originating from the end of ureters and the urinary bladder wall.
The urinary bladder of the rabbit has an elongated neck, that is why the MR image of this organ was detected in the caudal part of the abdominal cavity. The renal pelvis of the rabbit was hyper intense, as its peripheral recesses were hypo intense unlike findings reported in dogs via computed tomography [5]. The right kidney pelvis shape was oval and that of the left one—almost triangular without images with enlightings, which differed from the specific features described in dogs [5].
The sagittal T2-weighted MRI (30 mm lateral and right to the median plane) demonstrated only the image of the right kidney, due to the relatively close location of the right kidney to the median plane compared to that of the left kidney, which remained more aside. The image of the right kidney was completely defined and informative, and its different parts showed a various degree of heterogeneity and intensity. The image of the right ureter was caudal to the caudal end of the right kidney, with hyper intense signal characteristics without clear distinction between the lumen and the ureteral walls. Therefore, the right ureter was not filled with urine at the time of MR scanning due to the caudal tissue motility wave that moved urine towards the urinary bladder. The difference in the intensity of the renal image (hypo intense) and the renal pelvis image (hyper intense) was due to the option of T2-weighted sequence—indicating fluid findings. The lack of urine in the renal sinus was the cause for the hypo intense signal. Compared to the transverse section, the different parts of the medulla on the sagittal one had no defined signal intensity. The renal cortex demonstrated a lower relative intensity with respect to the medulla on the sagittal section than on the transverse one. The homogeneous character of tissue intensity of the cortex was due to the difficult differentiation of its granulosa part. Opposing to the cortex, the medulla was heterogeneous and hyper intense because of the unclear distinction of its two areas and the increased degree of hydration. The kidney fibrous capsule and the renal sinus were the structures with the lowest image intensity, consequently to their low fluid content.
The hyper intense and homogeneous T2-weighted image of the urinary bladder lumen was detected in the caudal abdomen; the bladder flexion to the left was not observed due to the sagittal imaging method.
The sagittal T2-weighted MRI (30 mm left to the median plane) of organs demonstrated only the lateral part of the left kidney. The kidney possessed a heterogeneous intensity and partial definition of the different kidney parts due to the specific sequence option. Unlike the kidney finding, the abdominal part of the left ureter was visualized as a hyper intense tubular finding caudoventral to the left kidney. The hyper intense urinary bladder wall was due to the soft tissue character of the finding contrasting to its relatively hypo intense lumen.
On sagittal T2-weighted MRI (15 mm right to the median plane), the characteristics of the right kidney were similar to those of carnivores as the hypo intense linear radial findings in the inner medulla were concerned. Therefore, it may be affirmed that the hyper intense image of the renal papilla of rabbits is divided into pseudopapillary parts similarly to kidneys of carnivores and small ruminants [42]. Probably, this is an image of distal continuation of the outer medullary area and the cortex in the direction of the renal pelvis. The rabbit renal pelvis demonstrates hypo intense image of the dorsal and ventral recesses like carnivores, in which the dorsal and ventral recesses are separated by distal continuations of the renal parenchyma and the interlobar vessels passing in this region [42]. Therefore, the results from sagittal MRI proved that the kidney medullary part of rabbits has a pseudopapillary pattern.
Sagittal T2-weighted MRI (45 mm left to the median plane) visualized part of the heterogeneous intense signal of the left kidney, which was of unsatisfactory tissue informative value. The scan with same parameters but right to the median plane showed no kidney image, which is a proof for the closer location of the right kidney to the median plane and the larger distance between left kidney and median plane. The difference in the image intensity of the urinary bladder lumen and its neck was due to the relatively smaller lumen of the neck and its thicker walls, which produced the relative hypointensity of the bladder neck in relation to the bladder body.
Dorsal MRI in the horizontal plane 30 mm ventral to spine (Т2 weighted image), demonstrated sufficiently definitively the MR characteristics of the studied organs. The results confirmed the cranial and medial localization of the right kidney in relation to the left one. The hypo intense findings of renal hiluses in this study were observed in the middle of the medial kidney borders, being concave structures with approximately equal shape. In our opinion, the good definition of the corticomedullary junction is a sign of intactness of the renal findings.
The image differentiation of the different kidney medullary parts is entirely informative, evidencing without doubt the bilayer character of the medulla. The hypo intense images of the dorsal and ventral recesses enhanced the contrast of the renal pelvis image. The right kidney-liver and left-kidney-spleen contacts were distinct hypo intense linear findings, corresponding to parts of the fibrous kidney capsule. The results found that for those scan parameters, the urinary bladder also demonstrated flexion to the left and had an elongated oval shape.
MRI of the normal rabbit kidney visualized successfully the corticomedullary junction on T2-weighted sequence, with relatively hypo intense image of the kidney cortex vs that of the kidney medulla, due to the larger amount of extracellular medullary fluid. Thus, the obtained T2-weighted images were of high informative value and definitive. In our opinion, the lack of corticomedullary differentiation on T2-weighted scans was a non-specific sign of kidney anomaly unlike T1-weighted images [20].
Similarly, to the use of rats as a biological model for investigation of the human kidneys, we suggest the rabbits as an appropriate model because the hydration status of rabbits also influenced the intensity of the MR signal of renal cortical and medullary parts. Like rats, rabbits possess two differentiated kidney medullary parts of various signal intensity. However, in rabbits, contrary to rats, the outer medullary area produces a signal of lower intensity compared to the inner area on T2-weighted scans [20]. Therefore, the hyper intense signal of the outer medulla is due to the structure, blood supply and few amount of interstitial fluid. The inner medullary area showed a higher signal intensity on T2-weighted sequence because of the localization of distal straight tubules and collecting ducts, which results in hydration of the area [20]. We believe that the definitive image of the renal corticomedullary junction on T2-weighted MR scans is a reliable marker for the normal function of the organ.
This MRI study added to the application of the method for obtaining anatomical images of the kidneys and the topographical relationships of their different macroscopically structural parts (cortex, medulla and sinus). MRI is a definitive and informative method of higher-grade allowing quality and contrast imaging of the urinary tract organs [13,14,15,16].
The results from the performed MRI study supported the assumption that the rabbit is an appropriate animal model for kidney research [12,17,18,19].
Contrary to the theory that the rabbit kidney is unipapillary, the present study demonstrated image morphological traits that define the kidney of the studied animal species as pseudopapillary because of the distinction of radial hypo- and hyper intense areas in the medullary area [1]. The presence of images of the dorsal and ventral kidney recesses was confirmed [1]. Our study provided detailed MR imaging data in support of the thesis about the cranial localization of the right kidney [1]. The adipose capsule of the right kidney was more developed than that of the left one, but did not cause ventral displacement of kidney borders [1].
Dorsal MRI section 15 mm ventral to the spine (Т2-weighted sequence) proved the dorsal localization of the right kidney vs the left one, as only the right kidney image was present.
Dorsal MRI sections 45 mm and 60 mm ventral to the spine (Т2-weighted sequence) defined the localization of the left kidney as ventrocaudal and lateral, compared to that of the right kidney. This was evidenced by the absence of image of the right kidney on these sections.
Due to the fact that kidney diseases are often encountered in rabbits: kidney agenesis, asymptomatic congenital renal cysts, bacterial infections, staphylococcal nephritis, pyelonephritis, renal amyloidosis, urolithiasis and neoplasms, we presented detailed and informative data on MRI specific features of normal urinary organs [9,10,11]. Dissimilar to previous studies [9,10,11], reporting that only one of the kidneys in healthy rabbits was available for examination due to anatomical limitations, we succeeded to achieve informative MR access to both kidneys.
The results from the MRI examination of the kidney, ureters and urinary bladder in the rabbit enrich the morphological imaging knowledge about the diseases and abnormalities of these organs, such as inflammation, hydronephrosis, compensatory hypertrophy, infarction, dysplasia, hypoplasia, cysts, ectopy, reflux and neoplastic lesions, hydroureter, as well as urethral urolithiasis, resulting in increased in urinary bladder size [5,8,43].
Institutional Review Board Statement
The current study has been approved by permit for the use of animals in experiments No. 377, issued by the Ethics Committee of the Ministry of Agriculture and Food, Bulgarian Animal Safety Agency, with opinion No. 293 of 29.02.2024, Sofia, Bulgaria.
Conflicts of Interest
The authors declare no conflicts of interest.
References
- Barone, R.; Pavaux, C.; Blin, P.; Cuq, P. 1973. Atlas d’anatomie du lapin: pref. de P. Mornet. Paris, Masson, Paris, France, 1973, pp. 173–174.
- Barone, R.; Chapitre, V. Splanchnologie II. In: Anatomie comparée des mammifères domestiques., Troisième edition, Barone, R., Ed.; Editions Vigot, Paris, France, 2001; Tome quatrième, pp. 843–859.
- Dimitrov, R.; Chaprazov, T. An anatomic and contrast enhanced radiographic investigation of the rabbit kidneys, ureters and urinary bladder. Rev. Méd. Vét. 2012, 163, 469–474. [Google Scholar]
- Balikçi Dorotea, S.; Banzato,T. ; Bellini, L.; Contiero, B.; Zotti, A. Radiographic anatomy of Dwarf Rabbit abdomen with normal measurements. Bulg. J. Vet. Med. 2016, 19, 96–107. [Google Scholar] [CrossRef]
- Biller, D.S. Imaging of the Urinary Tract: What Modality is My Best Choice? In: WSAVA-Annual Congress, São Paulo, Brazil, July 21–24; World Small Animal Veterinary Association, WSAVA, 2009.
- Dilek, Ö.G.; Erden, H.; Turan, E.; Dimitrov, R.; Stamatova-Yovcheva, K.; Karakurum, E. The qualitative and quantitative assessment of the renal cortex of the clinically healthy rabbits. Ankara Univ Vet Fak Derg 2020, 67, 381–386. [Google Scholar] [CrossRef]
- Karakurum, E.; Dimitrov, R.; Stamatova-Yovcheva, K.; Erşen, M.; Dilek, Ö.G. . Anatomical Computed Tomography and Magnetic Resonance Imaging Architecture of the Kidneys in the Chinchilla (Chinchilla lanigera). Indian J. Anim. Res. 2022. [Google Scholar] [CrossRef]
- Brisbane, W.; Bailey, M.; Sorensen, M. An overview of kidney stone imaging techniques. Nat Rev Urol 2016, 13, 654–662. [Google Scholar] [CrossRef]
- Smith, M.V. Urinogenital diseases. In: Textbook of rabbit medicine. 2nd ed.; Harcourt-Brown, F., Ed.; Elsevier. Reed Educational and Professional Publishing Ltd.: Oxford, Great Britain, 2002, Chapter 14, pp. 335–351.
- Lindsey, J.; Fox, R. Inherited diseases and variations. In The Biology of the Laboratory Rabbit, 2nd ed.; Manning, P., Ringler, D., Newcomer, C. Eds.; Academic Press, Massachusetts, USA, 1994, pp 293–313.
- Vilalta, L.; Altuzarra, R.; Espada, Y.; Dominguez, E.; Novellas, R.; Martorell, J. Description and comparison of excretory urography performed during radiography and computed tomo-graphy for evaluation of the urinary system in healthy New Zealand White rabbits (Oryctolagus cuniculus). Am. J. Vet. Res. 2017, 78, 472–481. [Google Scholar] [CrossRef]
- EL-Ghazali, HM.; Ammar, SMS. ; Mohamed, SKA.; Gomaa, M.; Ibrahim, SME. Topographic and morphometric study on the kidneys of Balady rabbit enhanced by ultrasonographic, radiographic and computed tomography scan. Int. J. Vet. Sci. Med. 2022, 11, 28–36. [Google Scholar] [CrossRef]
- Cochairman, P. Magnetic Resonance Imaging of the Abdomen and Pelvis. JAMA 1989, 261, 420–433. [Google Scholar] [CrossRef]
- Nikolaidis, P.; Gabriel, H.; Khong, K.; Brusco, M.; Hammond, N.; Yagmai, V.; Casalino, D.; Hoff, F.; Patel, S.; Miller, Frank. Computed Tomography and Magnetic Resonance Imaging Features of Lesions of the Renal Medulla and Sinus. Curr Probl Diagn Radiol 2008, 37, 262–278. [Google Scholar] [CrossRef] [PubMed]
- Zhang, J.; Rusinek, H.; Chandarana, H.; Lee, V. Functional MRI of the kidneys. J Magn Reson Imaging 2013, 37, 282–293. [Google Scholar] [CrossRef]
- Ryu, J.; Kim, B.; Kim, S.; Seo, J.; Kim, JS. Detection of Parenchymal Abnormalities in Experimentally Induced Acute Pyelonephritis in Rabbits Using Contrast-Enhanced Ultrasonography, CT, and MRI. J Korean Soc Radiol 2016, 75, 487–494. [Google Scholar] [CrossRef]
- Uthamanthil, R.; Hachem, R.; Gagea, M.; Reitzel, R.; Borne, A.; Tinkey, P. Urinary Catheterization of Male Rabbits: A New Technique and a Review of Urogenital Anatomy. JAALAS 2013, 52, 180–185. [Google Scholar] [PubMed]
- Santos-Sousa, C.A.; Stocco, A.V.; Mencalha, R.; Jorge, S.F.; Abidu-Figueiredo, M. Morphometry and vascularization of the rabbit kidneys (Oryctolagus cuniculus). Int. J. Morphol. 2015, 33, 1293–1298. [Google Scholar] [CrossRef]
- Buys-GoncAlves, G.; De Souza, D.; Sampaio, F.; Pereira-Sampaio, M. Anatomical relationship between the kidney collecting system and the intrarenal arteries in the sheep: contribution for a new urological model. The Anat Rec 2016, 299, 405–411. [Google Scholar] [CrossRef]
- Morehouse, H.; Levee, E.; States, L.; Zimmerman, Jill. ; Newhouse, J.; Amis, E., Jr. MRI Anatomy of the Rat kidney at 1.5 T in different states. Magn Reson Imaging 1995, 13, 81–88. [Google Scholar] [CrossRef] [PubMed]
- Olivetti, L.; Grazioli, L.; Voltini, G. Urinary System: Normal Radiologic Anatomy. In Imaging of Urogenital Diseases; Grazioli, L., Olivetti, L., Eds.; Springer: Milano, Italy, 2009 Chapter 2, pp. 11–33. [Google Scholar]
- Taupitz, M.; Kubik-Huch, R.A. The Kidneys and Upper Urinary Tract. Radiology Key. Fastest Radiology Insight Engine, 2015. https://radiologykey.com/the-kidneys-and-upper-urinary-tract/.
- Laissy, JP.; Idée, JM.; Fernandez, P.; Floquet, M.; Vrtovsnik, F.; Schouman-Claeys, E. Magnetic Resonance Imaging in Acute and Chronic Kidney Diseases: Present Status. Nephron Clin Pract 2006, 103, 50–57. [Google Scholar] [CrossRef]
- Gerst, S.; Hricak, H. Radiology of the urinary tract. In: Smith and Tanagho’s General Urology, 18th ed.; McAninch, J.W., Lue, T.F. Eds. McGraw Hill, San Francisco, USA. 2013; Chapter 6, pp. 75–95.
- Chung, A.; Schieda, N.; Shanbhogue, A.; Dilauro, M.; Rosenkrantz, A.; Siegelman, E. MRI Evaluation of the Urothelial Tract: Pitfalls and Solutions. AJR 2016, 207, 108–116. [Google Scholar] [CrossRef]
- Mackiewicz, A.; Klekiel, T.; Kurowiak, J.; Piasecki, T.; Bedzinski, R. Determination of Stent Load Conditions in New Zealand White Rabbit Urethra. MDPI, J. Funct. Biomater. 2020, 11, 70. [Google Scholar] [CrossRef] [PubMed]
- Abou El-Ghar, M.; Farg, H.; Sharaf, D.; El-Diasty, T. CT and MRI in Urinary Tract Infections: A Spectrum of Different Imaging Findings. Medicina 2021, 57, 32. [Google Scholar] [CrossRef]
- Voltini, G.; Olivetti, L. 2015. Urinary System 10. In: Atlas of Imaging Anatomy; Olivetti, L. Ed.; Springer Cham Heidelberg New York Dordrecht London, pp. 175–190. [CrossRef]
- Dilek, G.; Dimitrov, R.; Stamatova-Yovcheva, K. The role of imaging anatomy in the contemporary anatomical studies of domestic rabbits in veterinary and agricultural science. BJAS 2019, 25, 575–580. [Google Scholar]
- Israel, G. MRI of the Kidney and Urinary Tract. J. Magn. Reson. Imaging 2006, 24, 725–734. [Google Scholar] [CrossRef]
- Hormann, M.; Brugger, P.; Balassy, C.; Witzani, L.; Prayer, D. Fetal MRI of the urinary system. Eur. J. Radiol. 2006, 57, 303–311. [Google Scholar] [CrossRef] [PubMed]
- Vallejo, J.; De Valencia, C.; Rodríguez, D.; Barragán, C. Magnetic Resonance Urography (Mru) At 3 Tesla, Technique, Clinical Applications. Rev. Colomb. Radiol. 2016, 27, 4378–4386. [Google Scholar]
- Mohammad, S.A.; Rawash, L.M.; AbouZeid, A.A. Imaging of urinary tract in children in different clinical scenarios: a guide for general radiologists. Egypt J Radiol Nucl 2021, 52, 205. [Google Scholar] [CrossRef]
- Dimitrov, R. MRI anatomical investigation of rabbit prostate gland. Bulg. J. Vet. Med. 2021, 26, 483–495. [Google Scholar] [CrossRef]
- Dimitrov, R.; Stamatova-Yovcheva, K. MRI Anatomical Investigation of Rabbit Bulbourethral Glands. MDPI Animals 2023, 13, 1519. [Google Scholar] [CrossRef] [PubMed]
- Hiorns, M. Imaging of the urinary tract: the role of CT and MRI. Pediatr Nephrol 2011, 26, 59–68. [Google Scholar] [CrossRef] [PubMed]
- Dalla Palma, L.; Bazzocchi, M.; Cressa, C.; Tommasini, G. Radiological anatomy of the kidney revisited. Br J Radiol 1990, 63, 680–690. [Google Scholar] [CrossRef]
- Nikken, J.; Krestin, G. MRI of the kidney-state of the art. Eur Radiol. 2007, 17, 2780–2793. [Google Scholar] [CrossRef] [PubMed]
- Villeirs, G.; Verstraetea, L.; De Neve, W.; De Meerleer, G. Magnetic resonance imaging anatomy of the prostate and periprostatic area: a guide for radiotherapists. Radiat. Oncol 2005, 76, 99–106. [Google Scholar] [CrossRef]
- Artemov, D. MR Imaging. In: Handbook of Small Animal ImagingPreclinical Imaging, Therapy, and Applications, 1st ed.; Kagadis, G.; Ford, N.; Karnabatidis, D.; Loudos, G. Imprint CRC Press, Boca Raton, Florida, USA, 2019, pp. 151–170.
- Tonolini, M.; Ippolito, S. Cross-sectional imaging of complicated urinary infections affecting the lower tract and male genital organs. Insights Imaging 2016, 7, 689–711. [Google Scholar] [CrossRef]
- König, H.; Mairel, J.; Liebich, H. Urinary system. In: Veterinry Anatomy of Domestic Animals. Textbook and color atlas; König, H., Liebich, H. Eds.; Schattauer GmbH, Hölderlinstraße 3, Stuttgard, Germany, 2004; Chapter 9, pp. 365–379.
- Alfredo, B.; Gaeta, M.; Minutoli, F.; Salamone, I.; Magno, C.; Scribano, E.; Pandolfo, I. MR Urography of the Ureter. AJR 2002, 179, 1307–1316. [Google Scholar]
Figure 1.
MRI imaging anatomy of organs from the middle abdominal region (transverse section at the L1 level); R-right; L-left; D-dorsal; V-ventral; (T2-weighted sequence). (C) caecum; (DC) descending colon; (black cross) jejunum; (SP) spleen; (lm) longissimus muscle; (sm) psoas muscles; (rm) root of mesentery; (white star) abdominal aorta; (white cross) caudal vena cava; (black star) renal cortex; (black horizontal arrows) renal medulla; (black line) renal medulla; (black horizontal arrowhead) fibrous capsule; (black point) corticomedullary junction; (c) renal adipose capsule; (CL) caudate lobe; (DD) descending duodenum; (AD) ascending duodenum; (white perpendicular arrow) abdominal wall. Line=10mm.
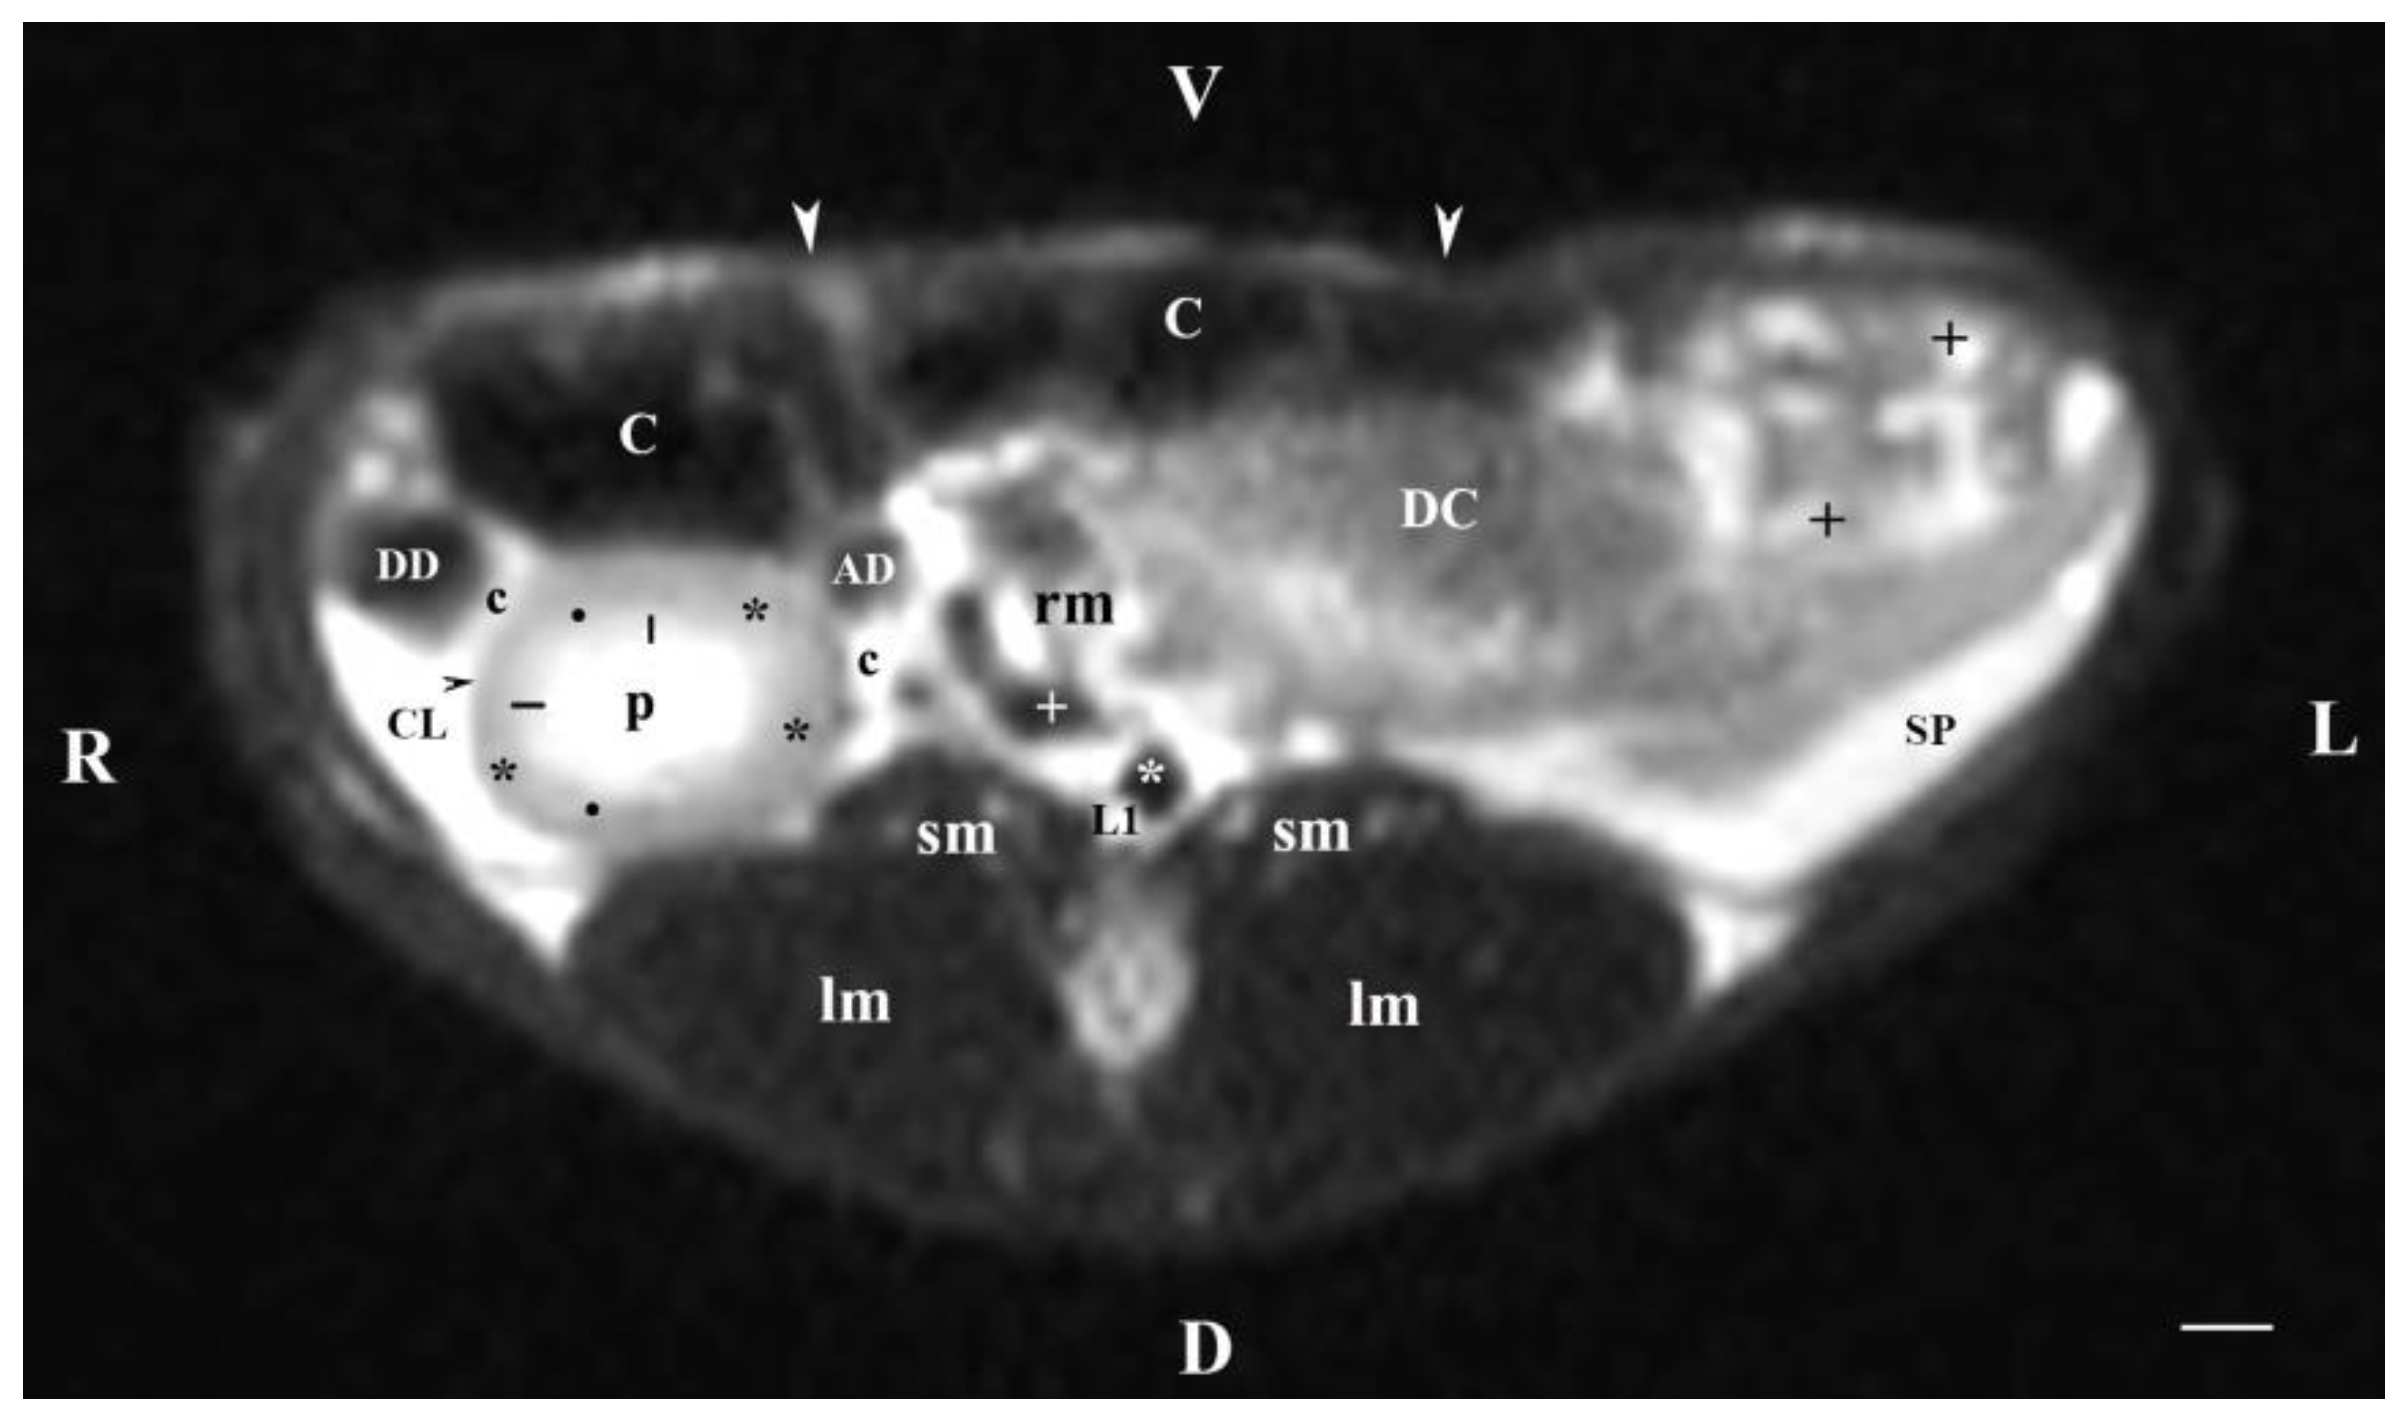
Figure 2.
MRI imaging anatomy of organs from the middle abdominal region (transverse section at the L2 level); R-right; L-left; D-dorsal; V-ventral; (T2-weighted sequence). (C) caecum; (DC) descending colon; (black cross) jejunum; (SP) spleen; (lm) longissimus muscle; (sm) psoas muscles; (rm) root of mesentery; (white star) abdominal aorta; (white cross) caudal vena cava; (black star) renal cortex; (p) renal pelvis; (black horizontal arrow and black point) right renal corticomedullary junction; (black perpendicular arrowhead) external medullary part; (white oblique arrow) commencement of the left ureter; (CL) caudate lobe; (DD) descending duodenum; (AD) ascending duodenum, (c) adipose capsule; (oblique black arrowhead) dorsal and ventral renal recess; (oblique black arrow) renal hilus and commencement of the right ureter; (white perpendicular arrowhead) abdominal wall. Line=10mm.
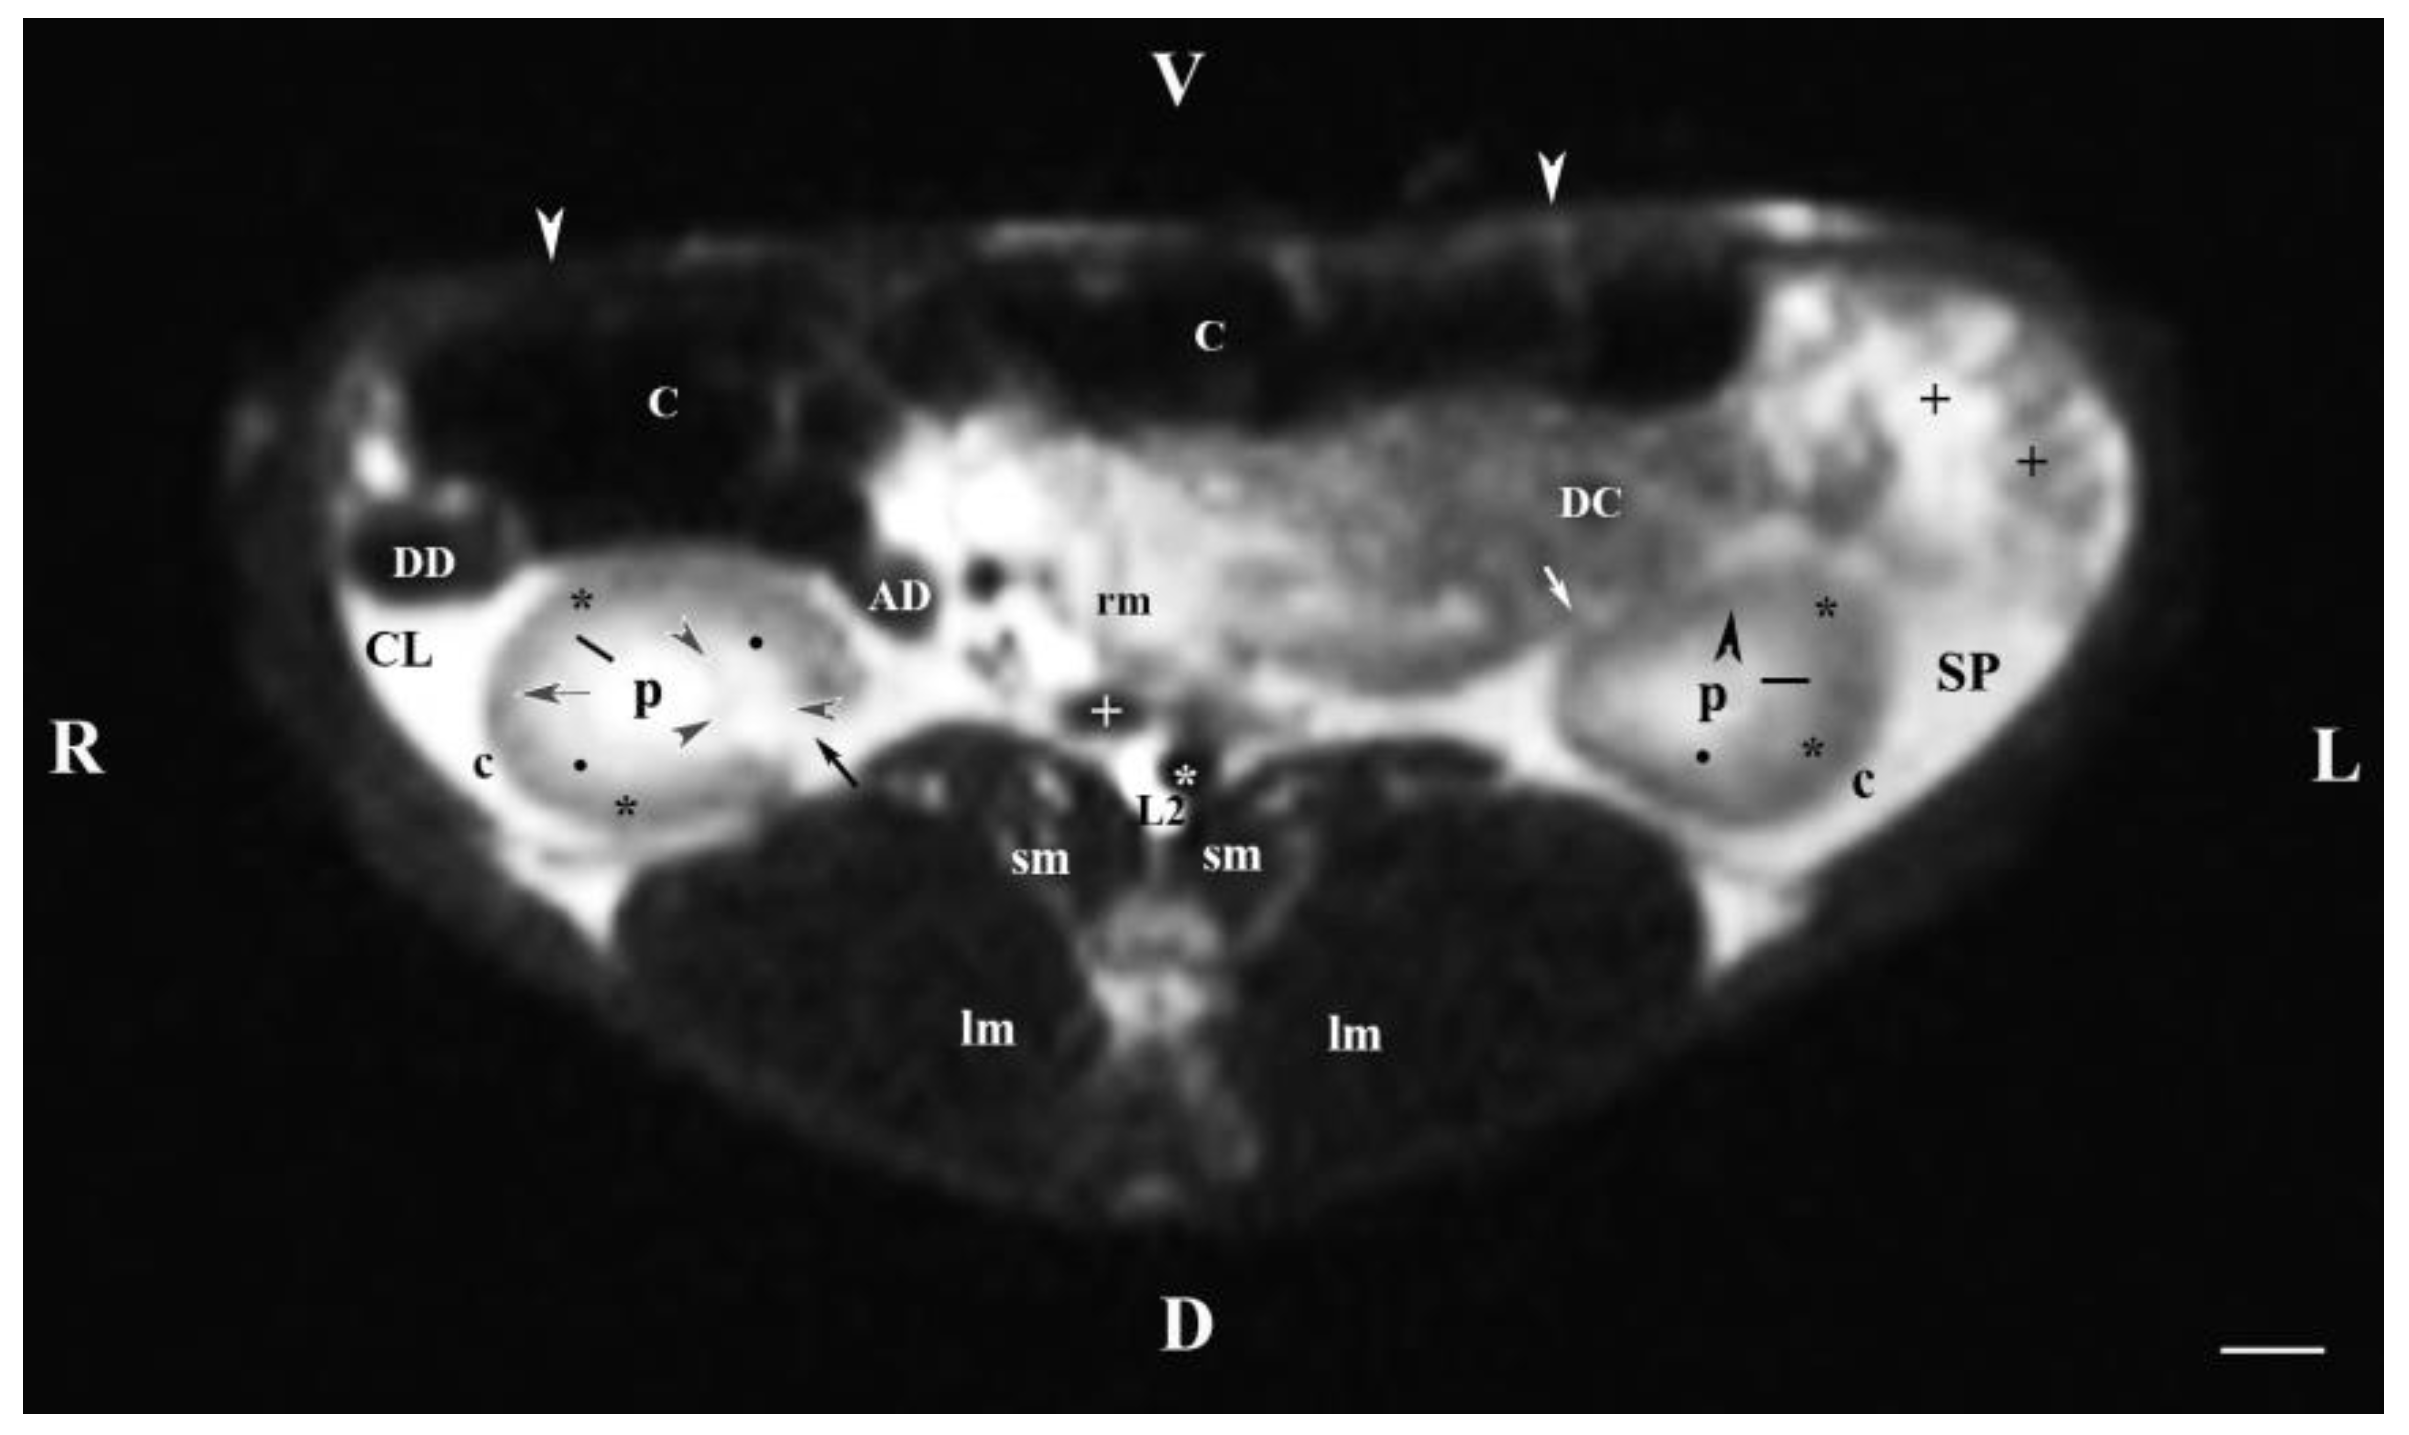
Figure 3.
MRI imaging anatomy of organs from the middle abdominal region (transverse section at the L3 level); R-right; L-left; D-dorsal; V-ventral; (T2-weighted sequence). (C) caecum; (DC) descending colon; (black cross) jejunum; (SP) spleen; (lm) longissimus muscle; (sm) psoas muscles; (rm) root of mesenterium; (white star) abdominal aorta; (white cross) caudal vena cava; (black star) renal cortex; (p) renal pelvis; (black horizontal arrowhead) external medullary part (black point) renal corticomedullar junction; (black line) renal medulla; (oblique black arrowhead) dorsal and ventral renal recessus; (black oblique arrow) commencement of the left ureter; (CL) caudate lobe; (DD) descending duodenum; (AD) ascending duodenum, (c) adipose capsule; (white perpendicular arrow) abdominal wall. Line=10mm.
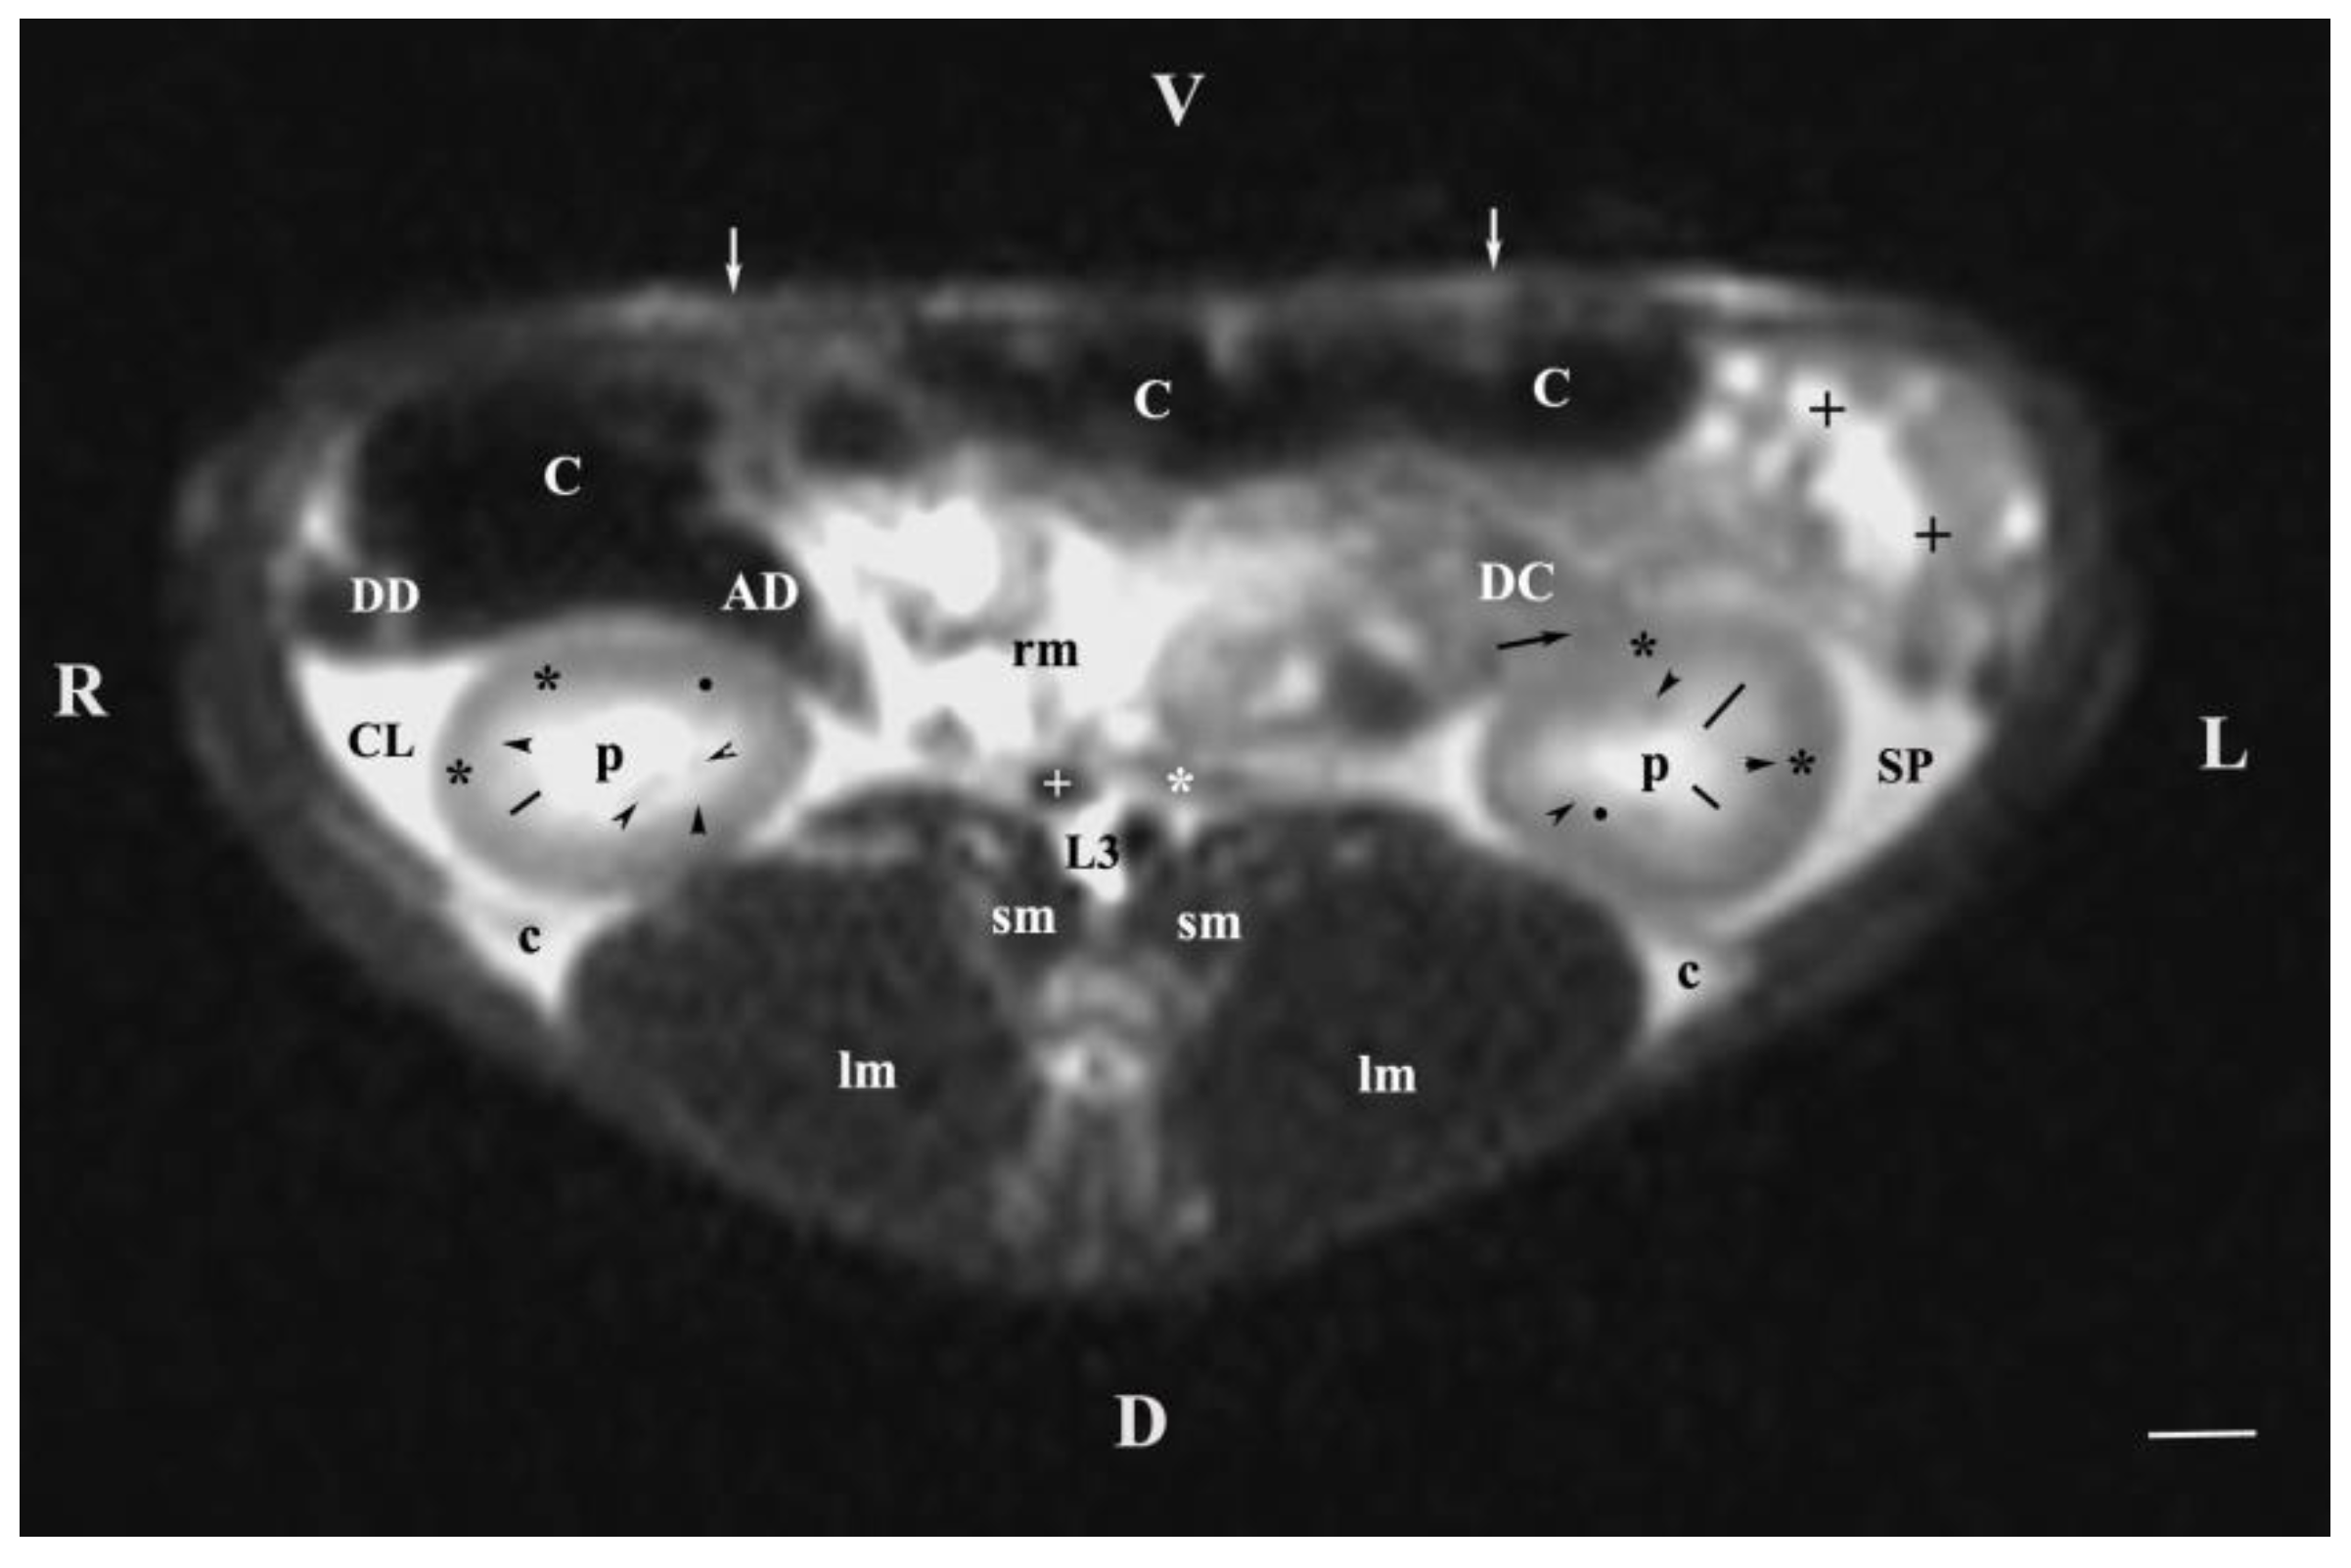
Figure 4.
MRI imaging anatomy of organs from the middle abdominal region (transverse section at the L4 level); R-right; L-left; D-dorsal; V-ventral; (T1-weighted sequence). (UB) urinary bladder; (+) jejunum; (*) mesenterium; (C) caecum; (black horizontal arrow) ileum; (black horizontal arrowhead) ascending colon; (black vertical arrowhead) duodenum; (A) adipose tissue; (s) sartorius muscle; (sm) psoas muscles; (lm) longissimus muscle; (gm) gluteus muscle; (bm) biceps femoral muscle; (white horizontal arrows) abdominal wall; (white cross) caudal vena cava; (white star) abdominal aorta; (u) urachus and median ligament of urinary bladder. Line=10mm.
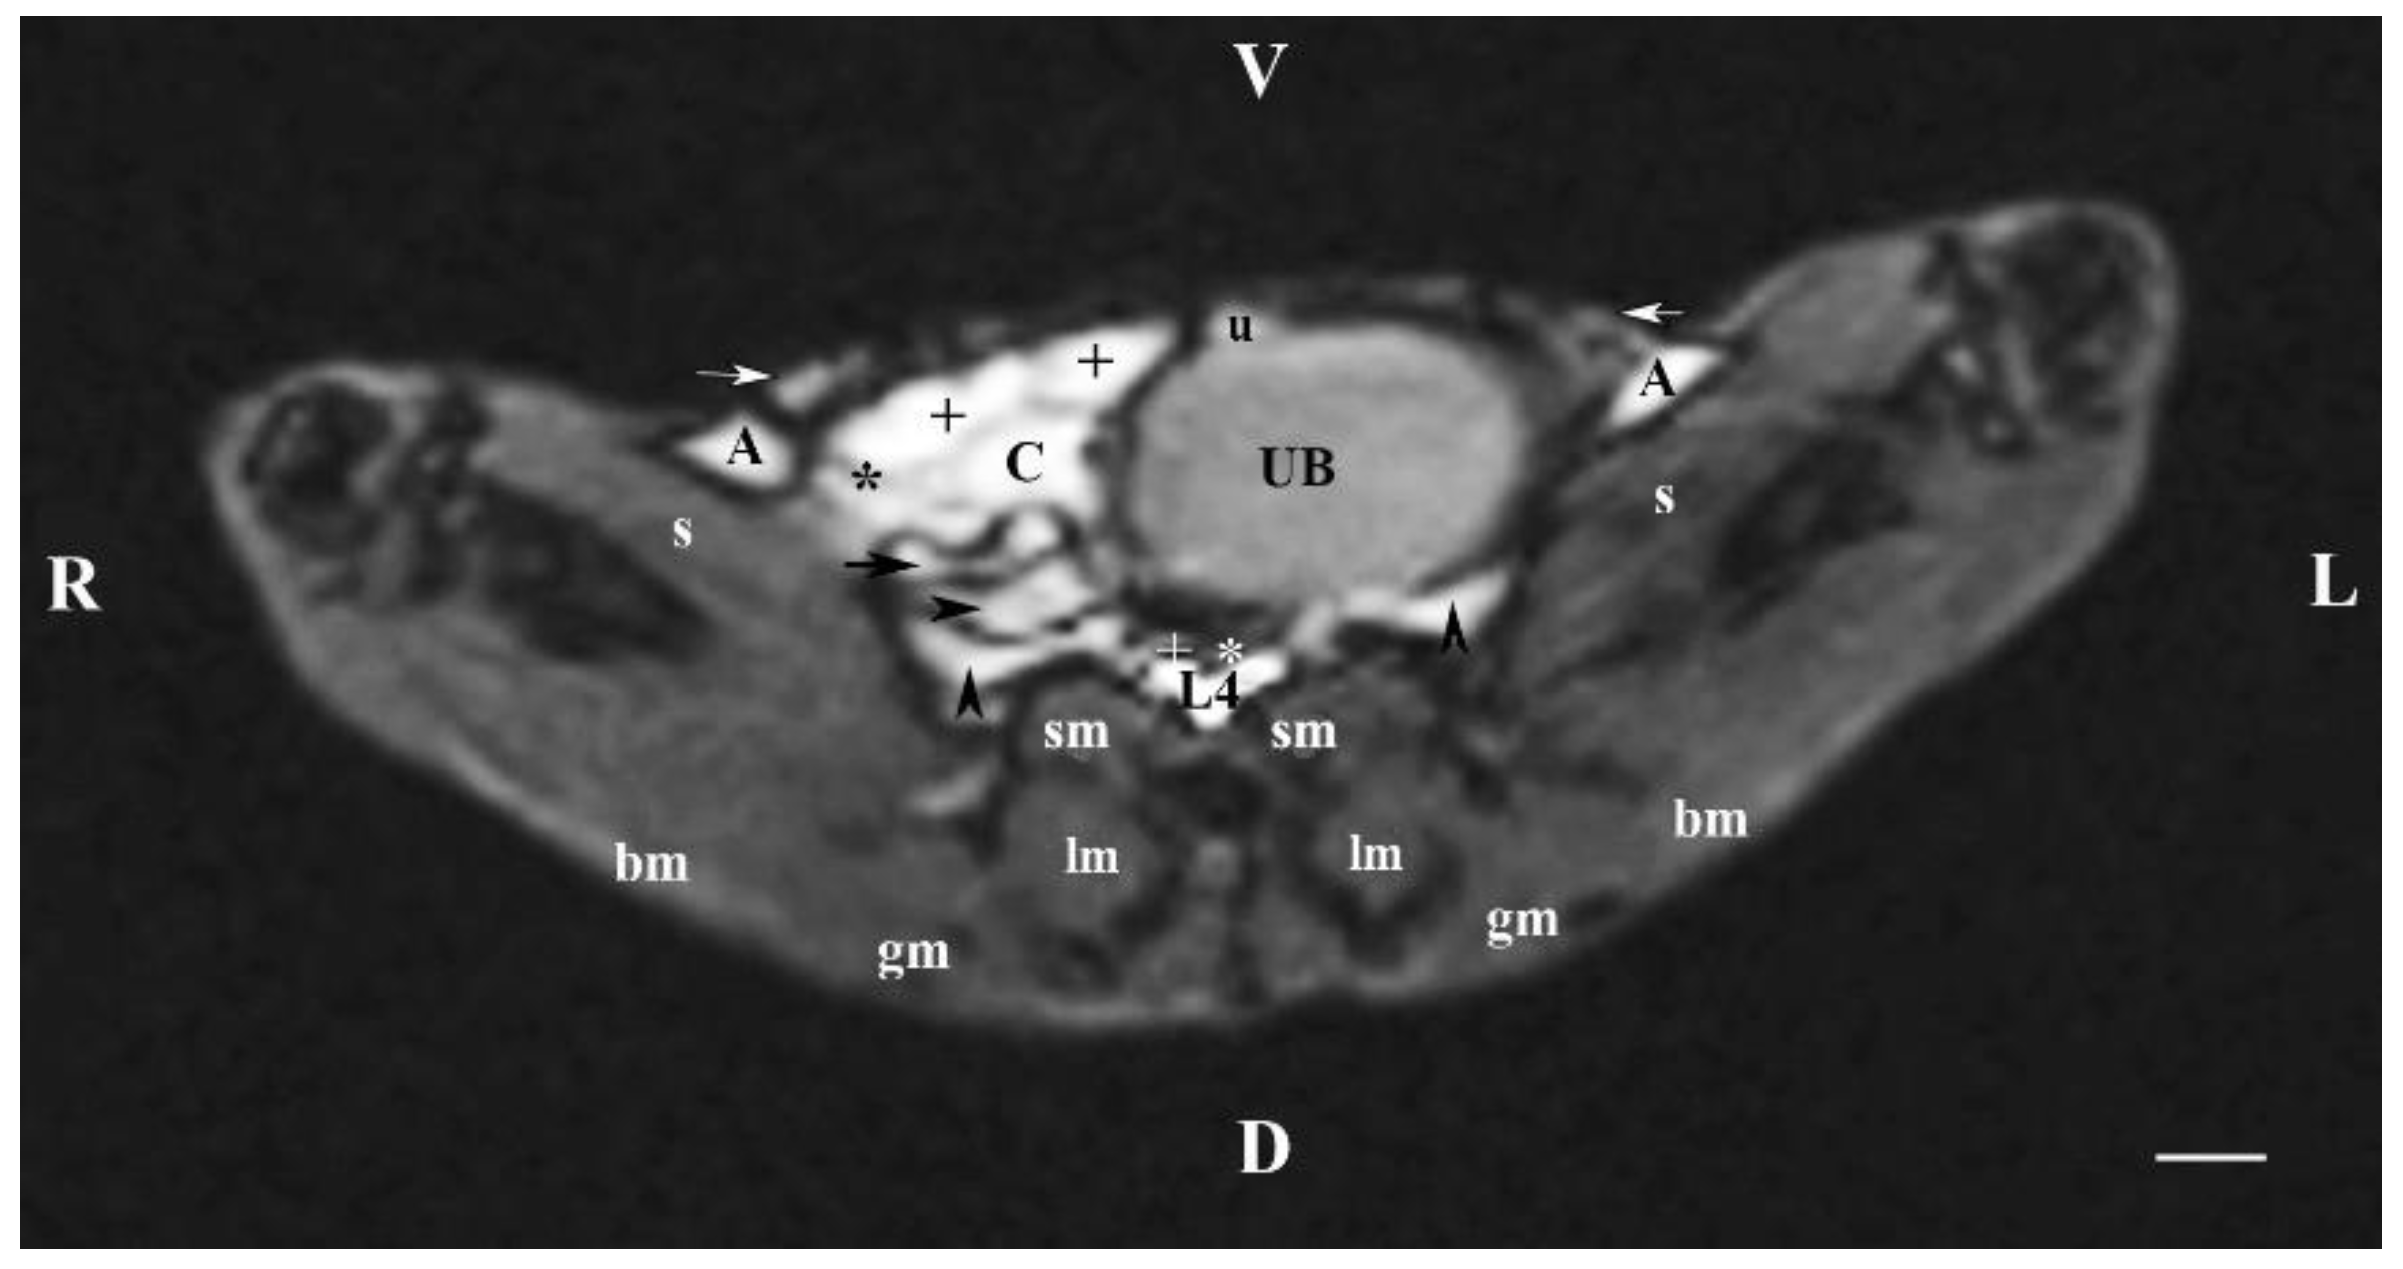
Figure 5.
MRI imaging anatomy of organs from the middle abdominal region (transverse section at the L5 level); R-right; L-left; D-dorsal; V-ventral; (T1-weighted sequence). (UB) urinary bladder; (white horizontal arrowhead) urinary bladder wall; (+) jejunum with mesenterium; (C) caecum; (black horizontal arrow) ileum; (black horizontal arrowhead) ascending colon; (black vertical arrowhead) descending duodenum; (A) adipose tissue; (s) sartorius muscle; (sm) psoas muscles; (lm) longissimus muscle; (gm) gluteus muscle; (bm) biceps femoral muscle; (white horizontal arrows) abdominal wall; (white cross) caudal vena cava; (white star) abdominal aorta; (u) urachus and median ligament of urinary bladder. Line=10mm.
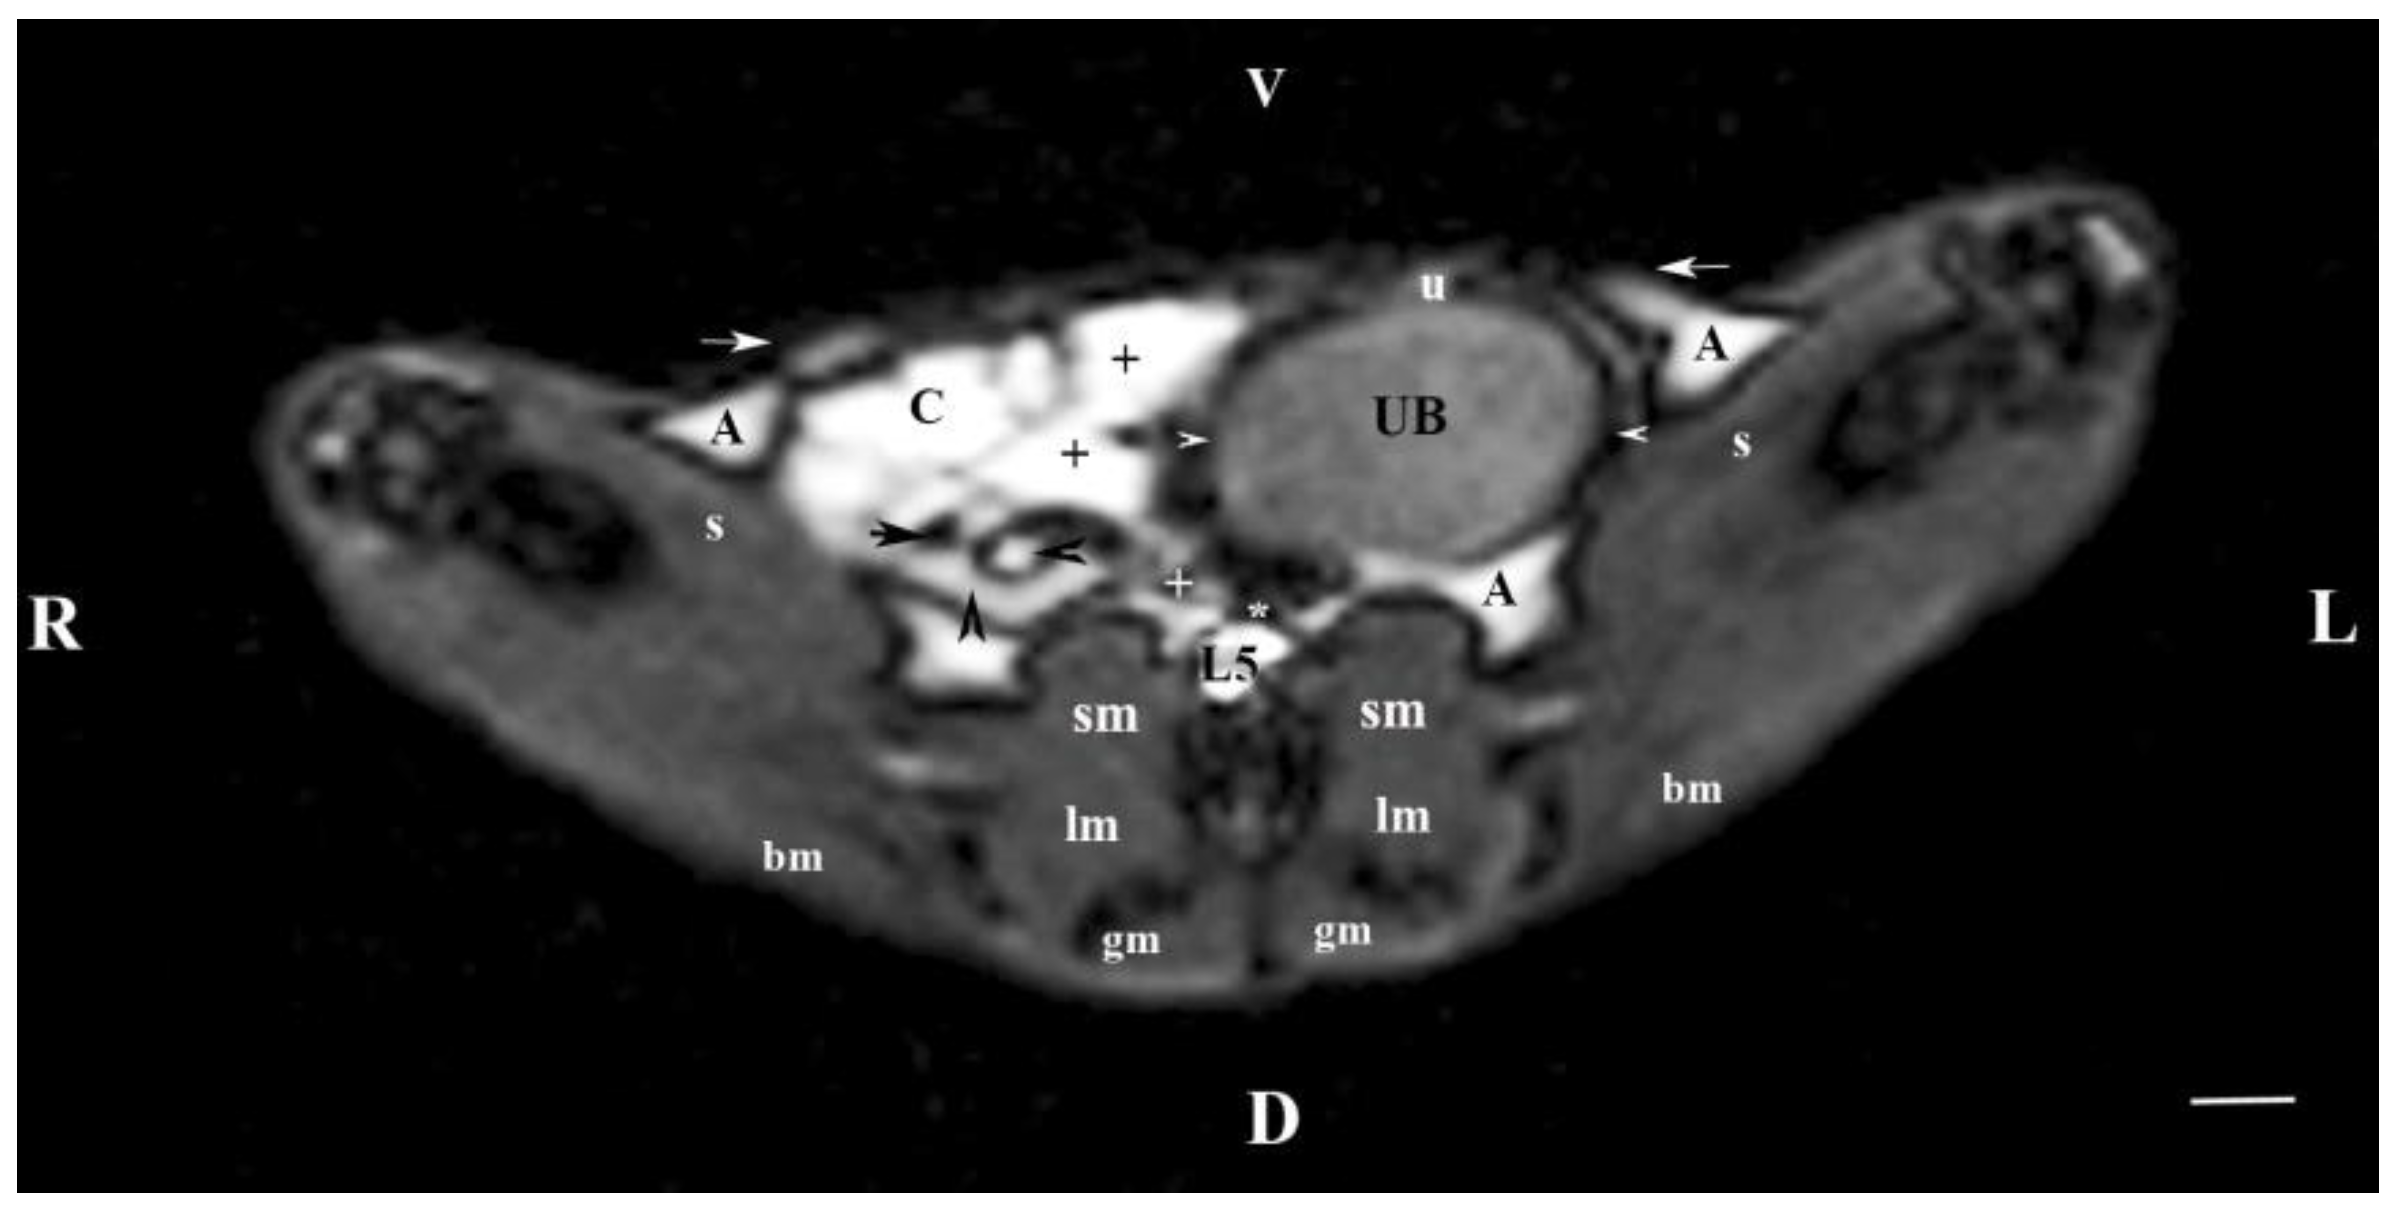
Figure 6.
MRI imaging anatomy of organs from the middle abdominal region (transverse section at the L6 level); R-right; L-left; D-dorsal; V-ventral; (T1-weighted sequence). (UB) urinary bladder; (black point) infusion of ureters; (+) jejunum with mesenterium; (C) caecum; (black horizontal arrow) ileum; (black horizontal arrowhead) ascending colon; (black vertical arrowhead) descending duodenum; (A) adipose tissue; (s) sartorius muscle; (sm) psoas muscles; (lm) longissimus muscle; (gm) gluteus muscle; (bm) biceps femoral muscle; (white horizontal arrows) abdominal wall; (white cross) caudal vena cava; (black star) abdominal aorta; (m) mesenterium. Line=10mm.
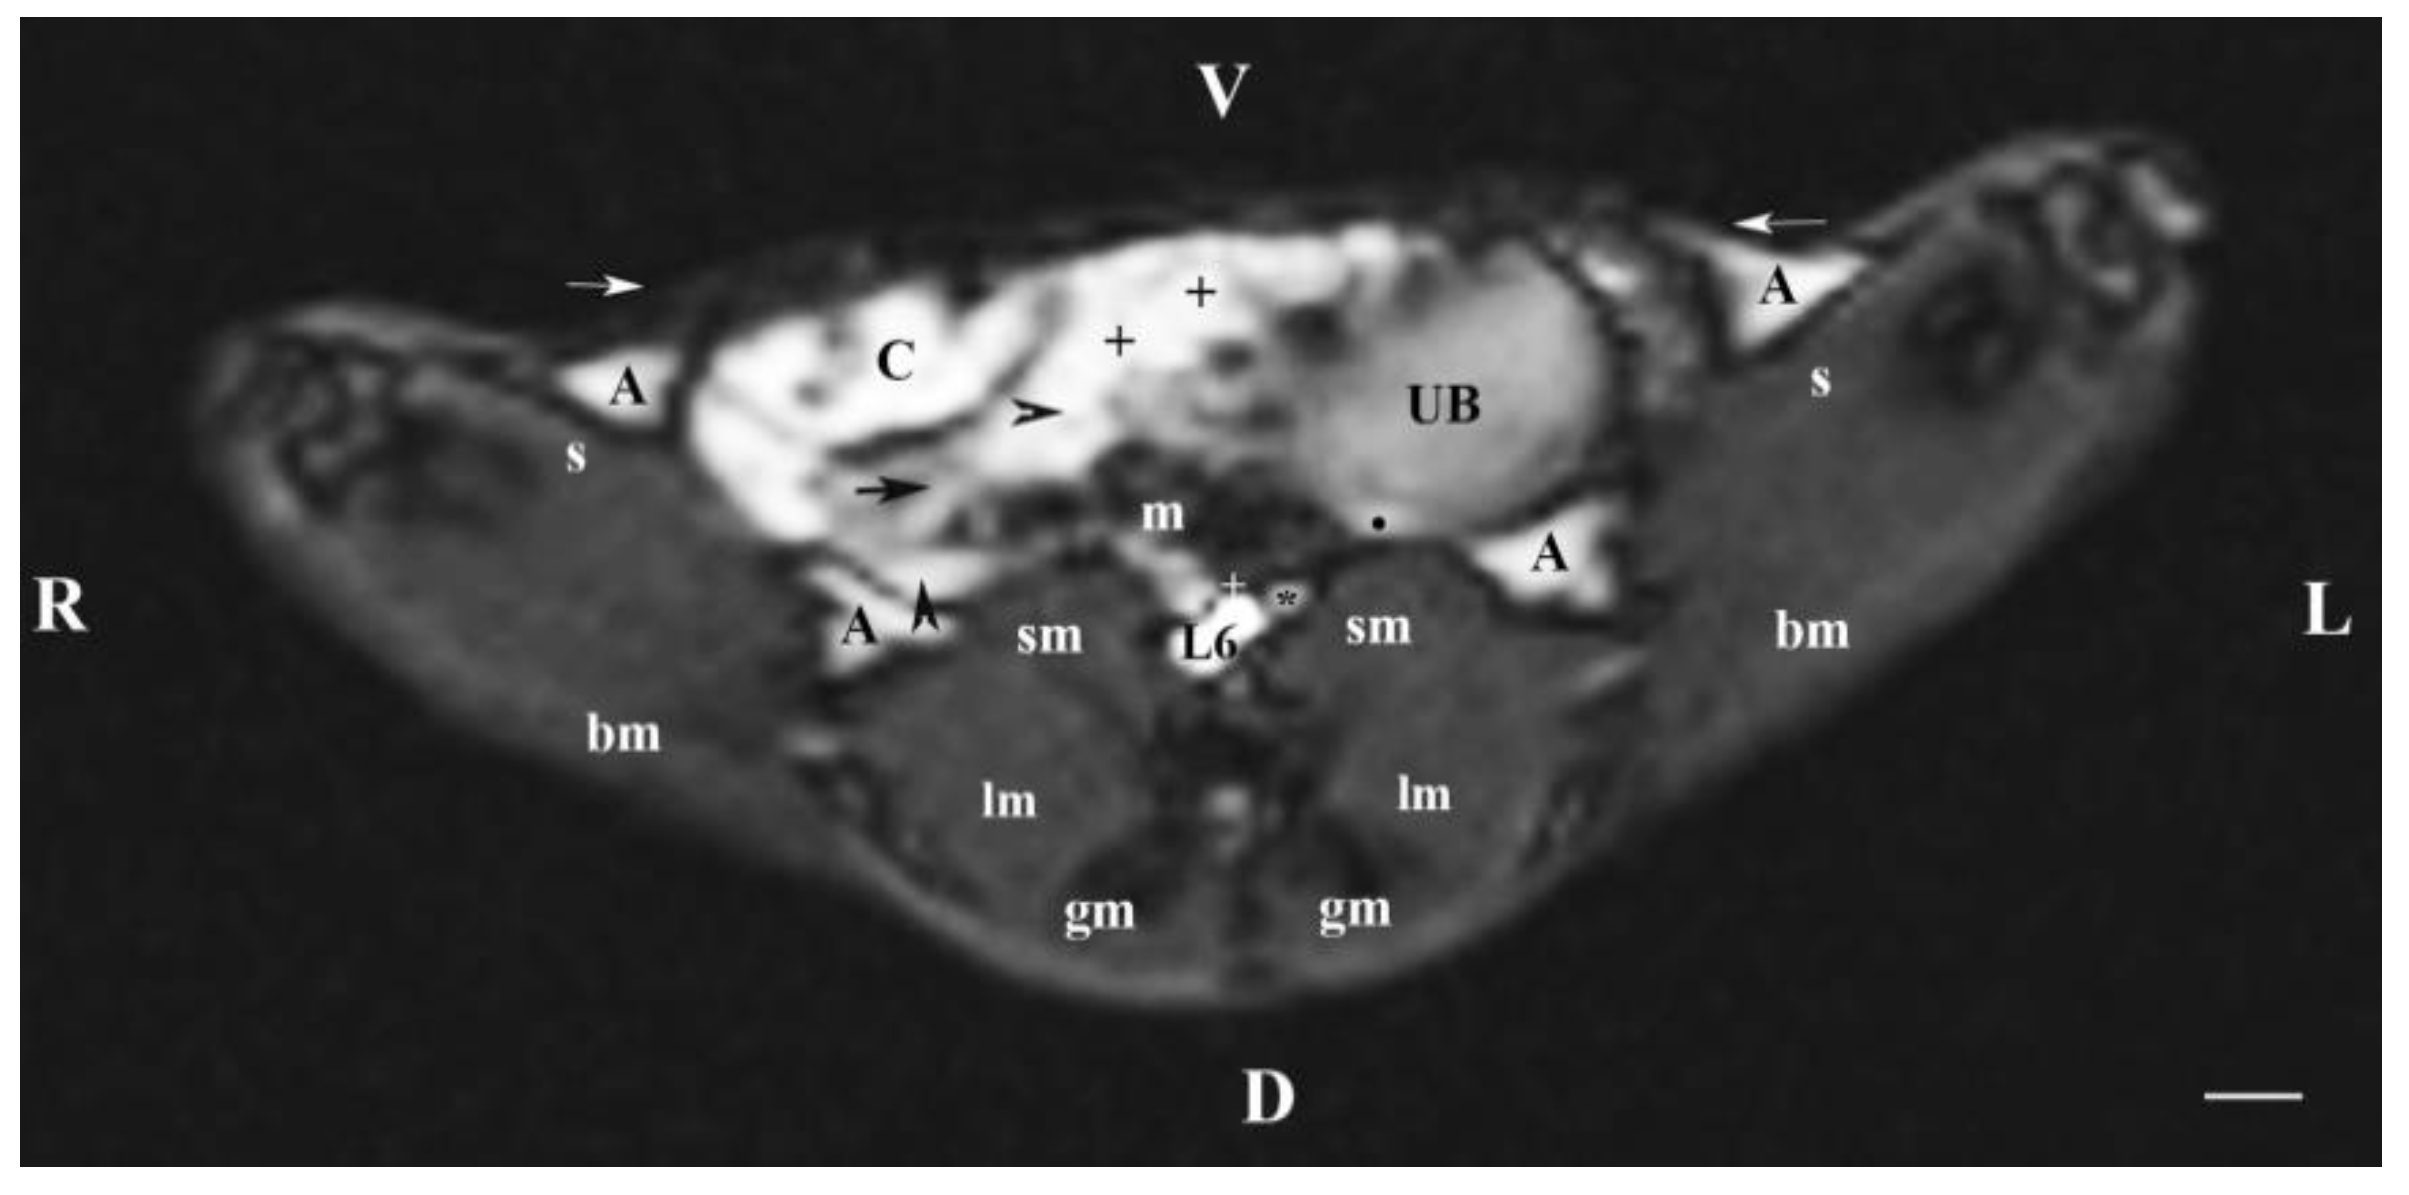
Figure 7.
MRI imaging anatomy of organs from the middle abdominal region (sagittal section) (T2-weighted sequence 30 mm to the right of the median plane) (Right kidney). CD-caudal, CC-cranial, D-dorsal, V-ventral. (UB) urinary bladder; (p) renal pelvis; (black star) renal cortex; (white line) renal medulla; (black point) corticomedullary junction; (h) renal hilus; (white cross) fibrous capsule; (oblique white arrowhead) dorsal and ventral renal recess; (perpendicular black arrowhead) ureter; (S) stomach; (L) liver; (c) renal adipose capsule; (rm) mesenterial root; (J) jejunum; (TD) transverse duodenum; (TC) transverse colon; (C) caecum; (A) adipose tissue; (PB) pubic bone; (lm) longissimus muscle; (gm) gluteal muscles; (I) ilium (white perpendicular arrow) abdominal wall. Line=10mm.
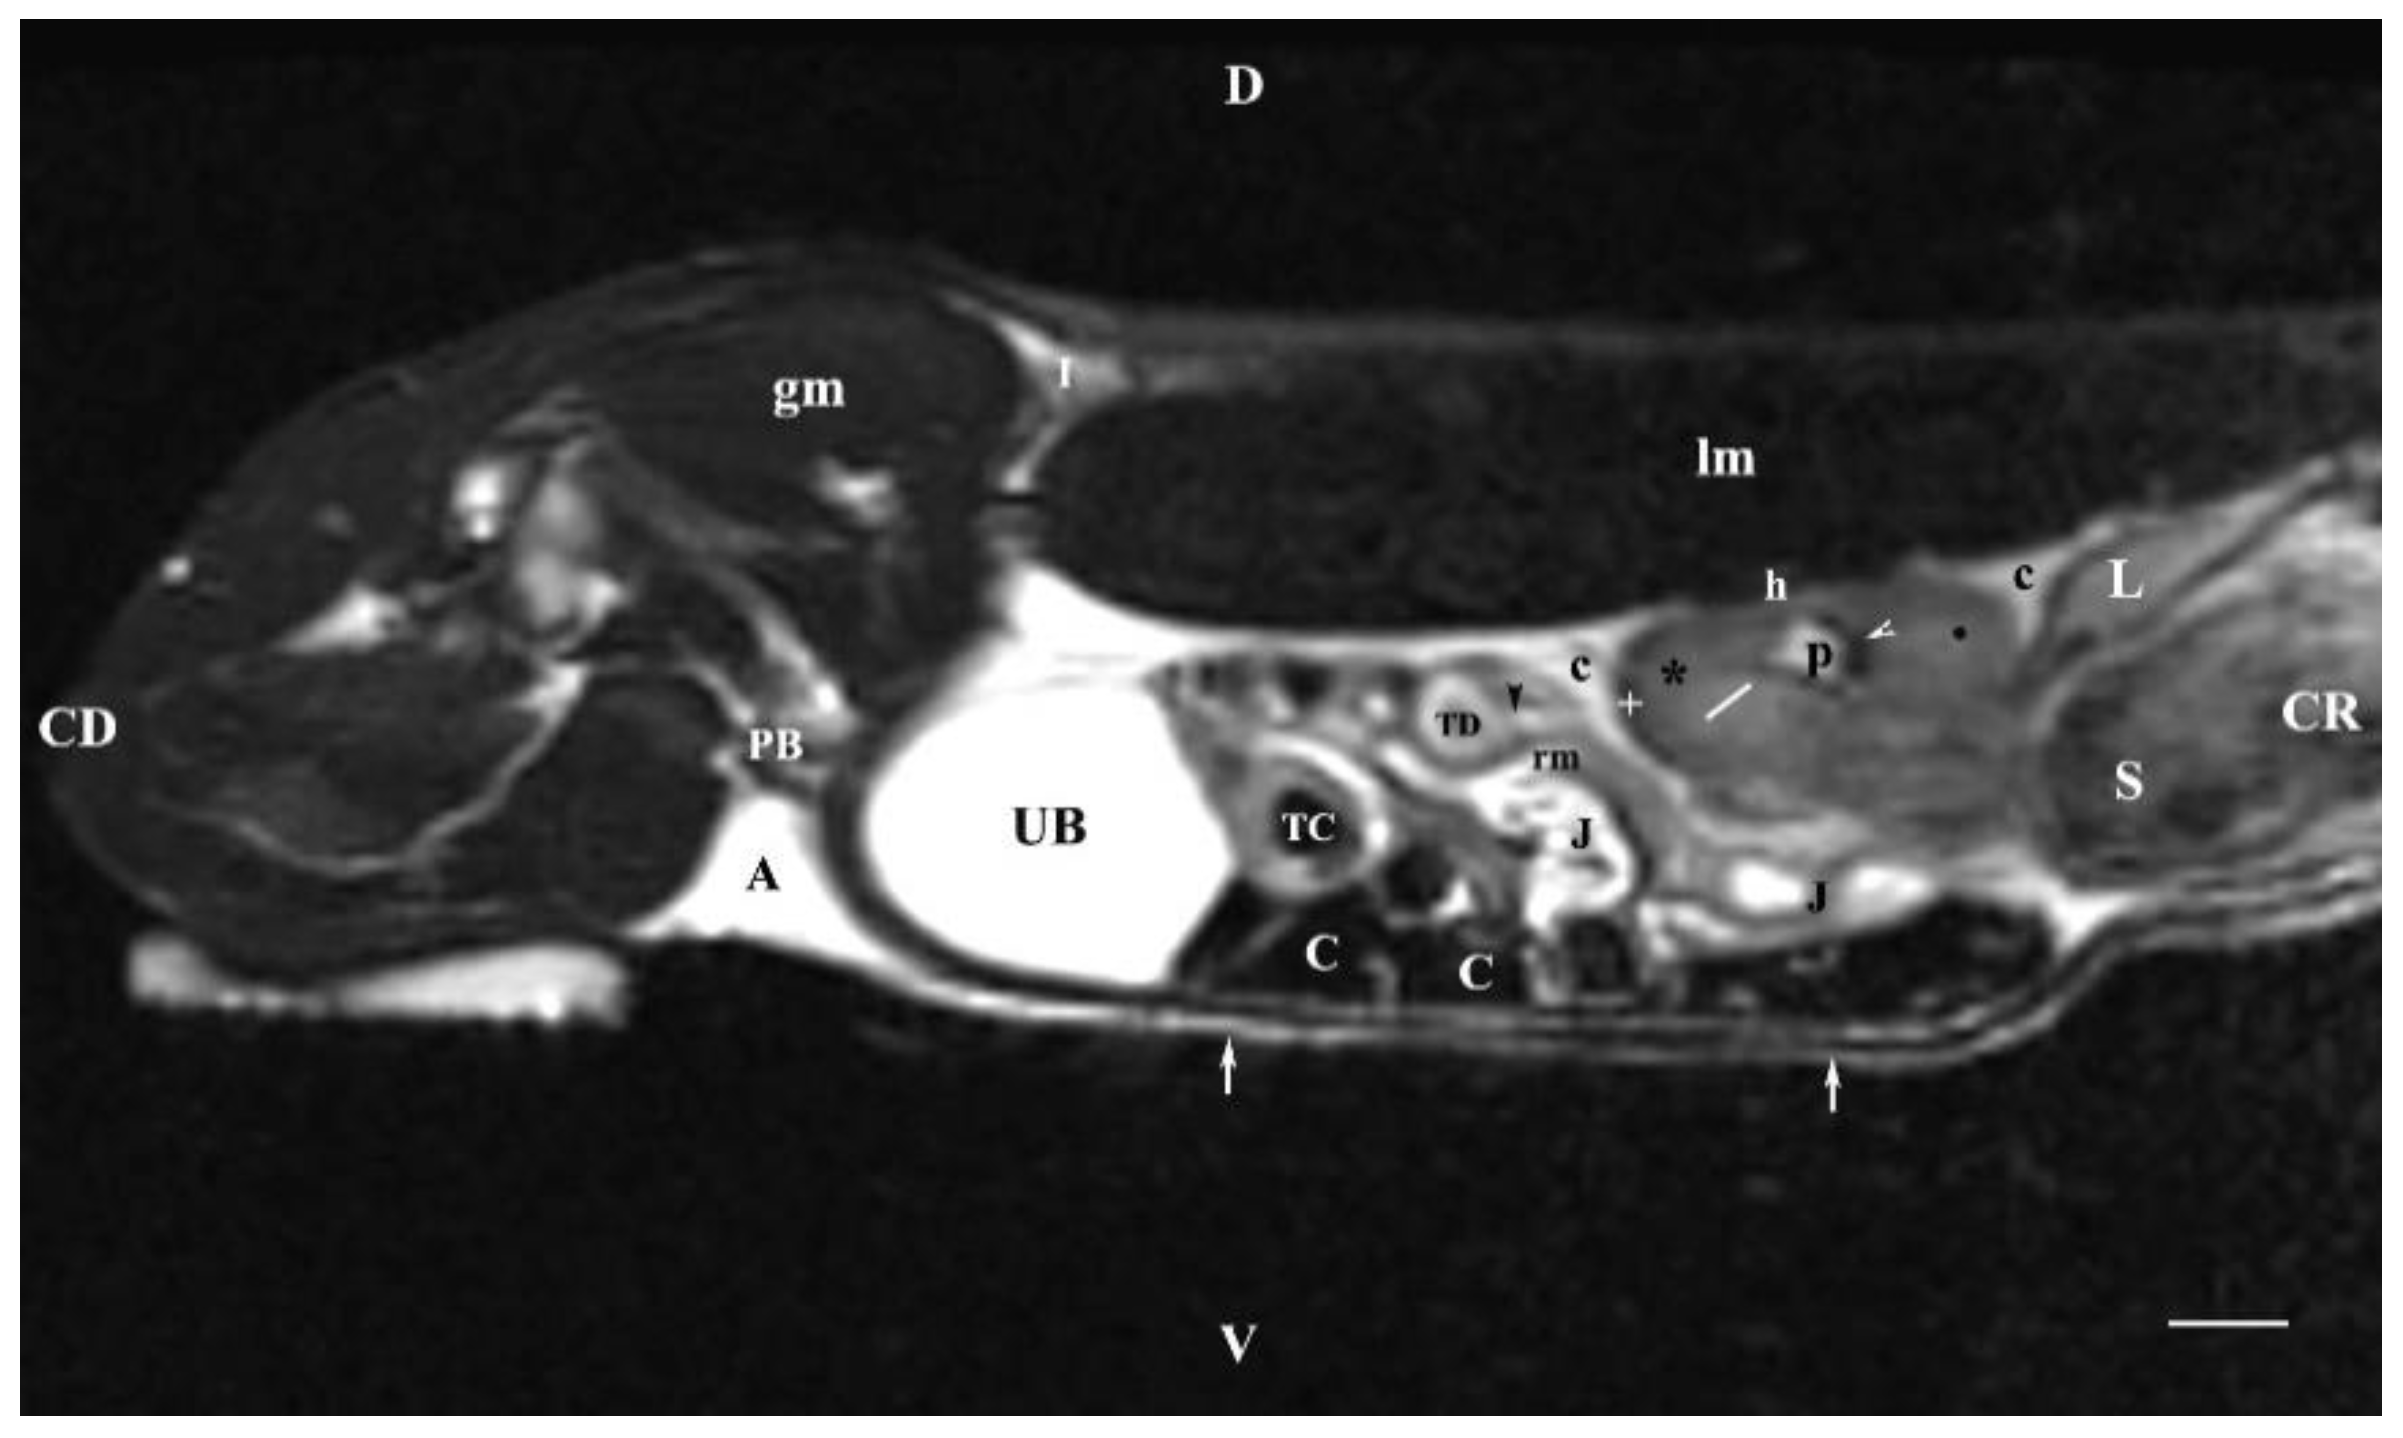
Figure 8.
MRI imaging anatomy of organs from the middle abdominal region (sagittal section) (T2-weighted sequence 30 mm to the left of the median plane) (Left kidney). CD-caudal, CC-cranial, D-dorsal, V-ventral. (UB) urinary bladder; (p) renal pelvis; (white star) renal cortex; (white line) renal medulla; (white point) corticomedullary junction; (perpendicular white arrow down directed) renal hilus; (oblique white arrowhead) renal recessus; (white star) renal cortex; (perpendicular white arrowhead) ureter; (S) stomach; (SP) spleen; (c) renal adipose capsule; (white cross) fibrous capsule; (J) jejunum; (TC) transverse colon; (C) caecum; (PB) pubic bone; (I) ilium; (lm) longissimus muscle; (gm) gluteal muscle; (I) ilium; (white perpendicular arrow upward directed) abdominal wall. Line=10mm.
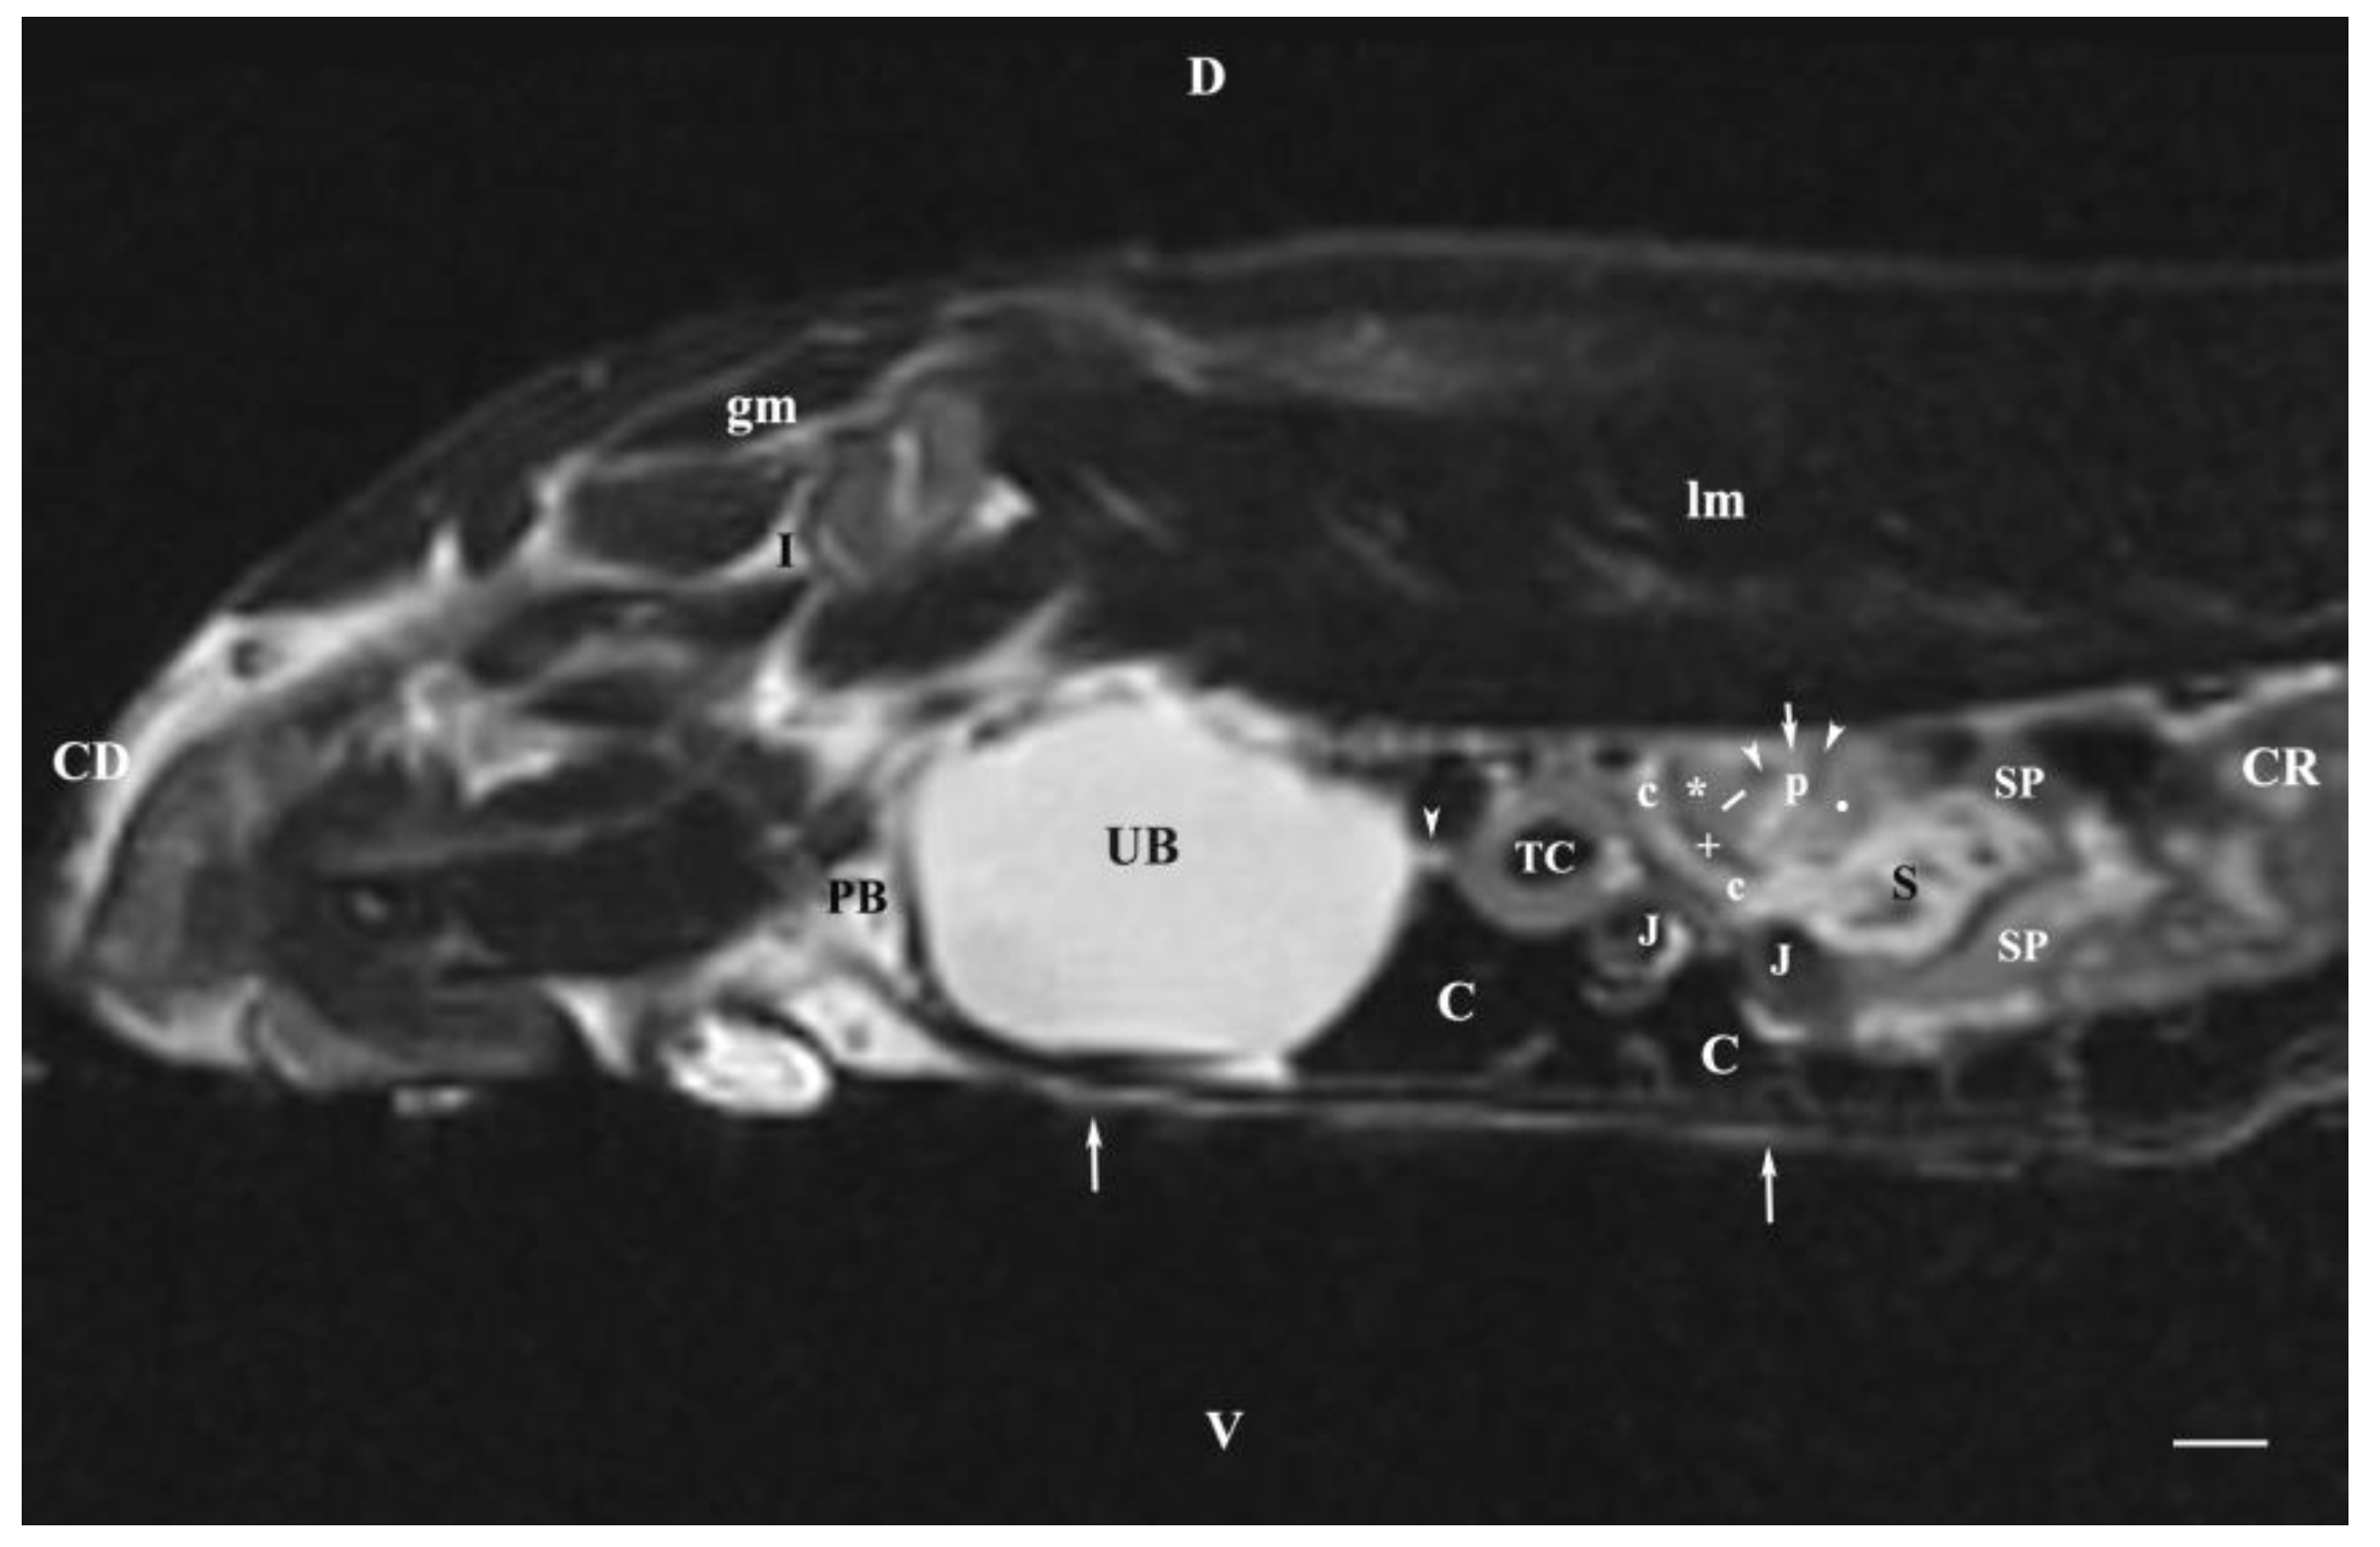
Figure 9.
MRI imaging anatomy of organs from the middle abdominal region (sagittal section; 15 mm to the right of the median plane) (T2-weighted sequence) (Right kidney). CD-caudal, CC-cranial, D-dorsal, V-ventral. (UB) urinary bladder; (p) renal pelvis; (h) renal hilus; (white line) renal medulla; (white star) renal cortex; (white point) corticomedullary junction; (S) stomach; (L) liver; (c) renal adipose capsule; (white cross) fibrous capsule; (oblique white arrowhead) renal recessus; (J) jejunum; (TC) transverse colon; (TD) transverse duodenum; (C) caecum; (PB) pubic bone; (I) ilium; (lm) longissimus muscle; (gl) gluteal muscle; (white perpendicular arrow) abdominal wall. Line=10mm.
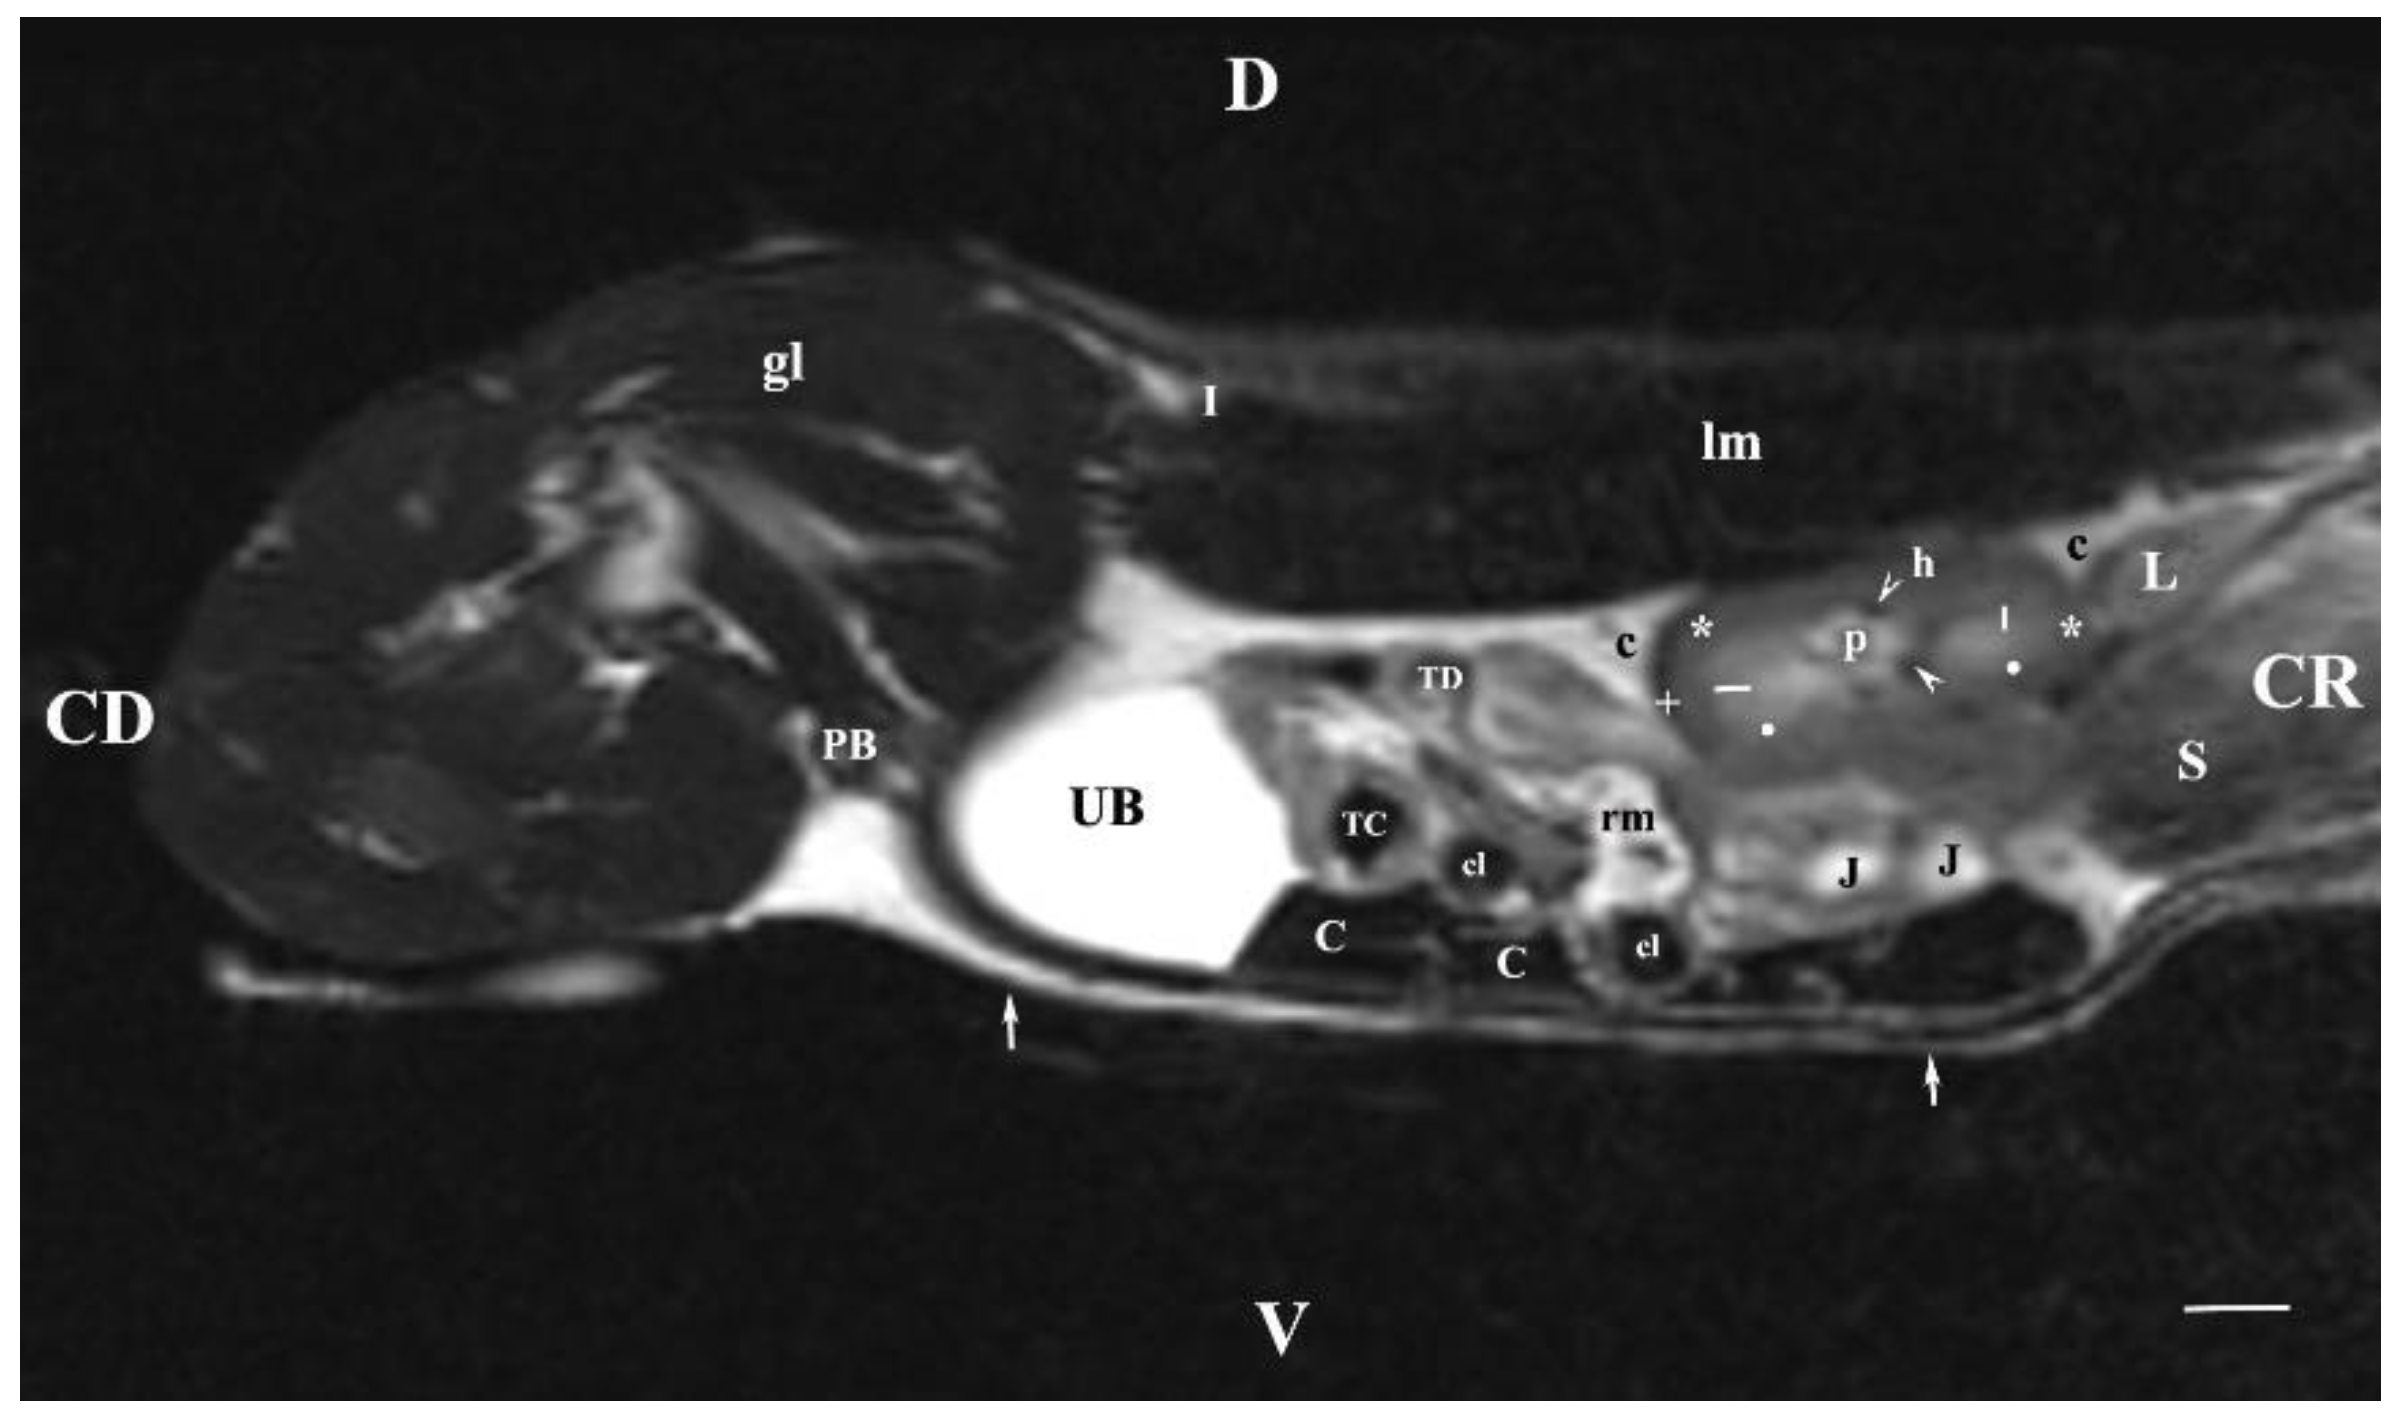
Figure 10.
MRI imaging anatomy of organs from the middle abdominal region (sagittal section; 45 mm to the left of the median plane). (T2-weighted sequence) (Left kidney). CD-caudal, CC-cranial, D-dorsal, V-ventral. (UB) urinary bladder; (p) renal pelvis; (c) renal adipose capsule; (white star) renal cortex; (n) neck of the urinary bladder; (oblique white arrowhead) ureter; (S) stomach; (SL) spleen; (J) jejunum; (TC) transverse colon; (C) caecum; (rm) mesenterial root; (PB) pubic bone; (u) urachus and median vesical ligament; (lm) longissimus muscle; (gm) gluteal muscle; (white perpendicular arrow) abdominal wall. Line=10mm.
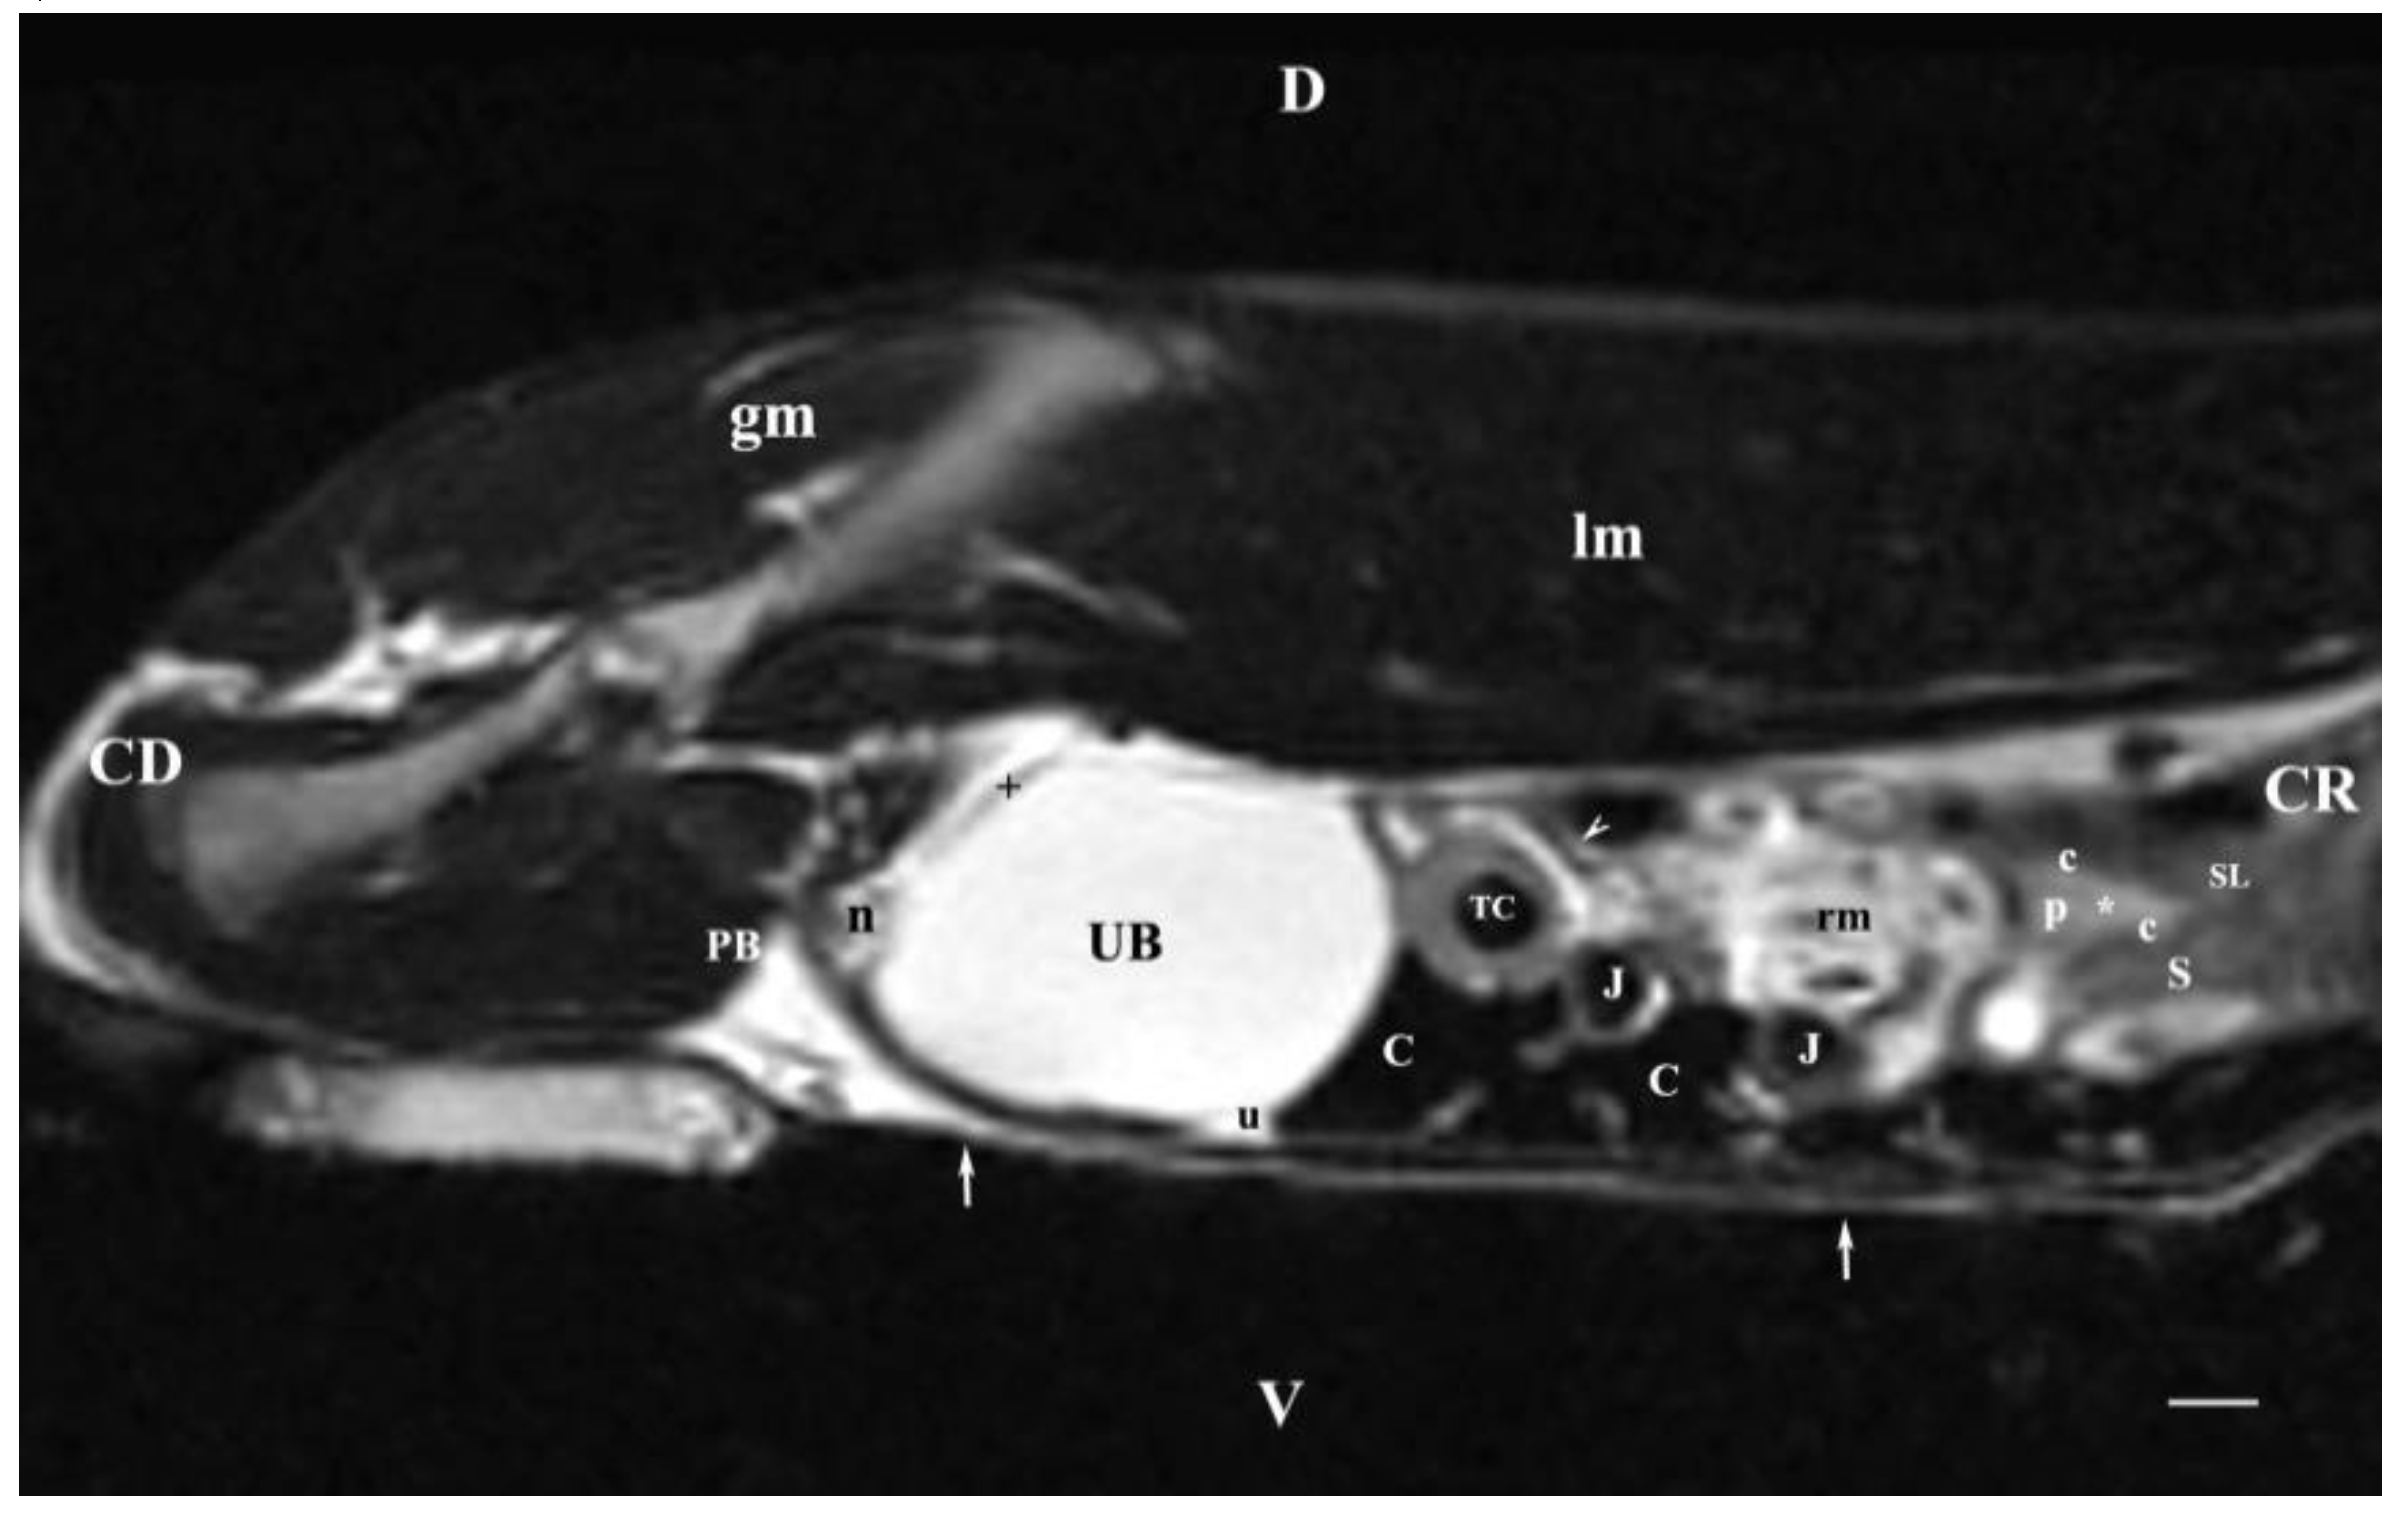
Figure 11.
MRI imaging anatomy of organs from the middle abdominal region (dorsal section; 15 mm ventral to the vertebral column). (T2-weighted sequence). R-right, L-left, CR-cranial, CD-caudal. (UB) urinary bladder; (p) renal pelvis; (perpendicular white arrow) commencement of right ureter; (oblique white arrowhead) dorsal renal recessus; (black star) renal cortex; (black line) renal medulla; (black point) corticomedullary junction; (lk) left kidney; (c) renal adipose capsule; (horizontal white arrowhead) renal hilus; (ip) iliopsoas muscle; (CL) caudate lobe; (S) stomach; (SP) spleen; (black perpendicular arrowhead) caudal vena cava; (white perpendicular arrowhead) abdominal aorta. Line=10mm.
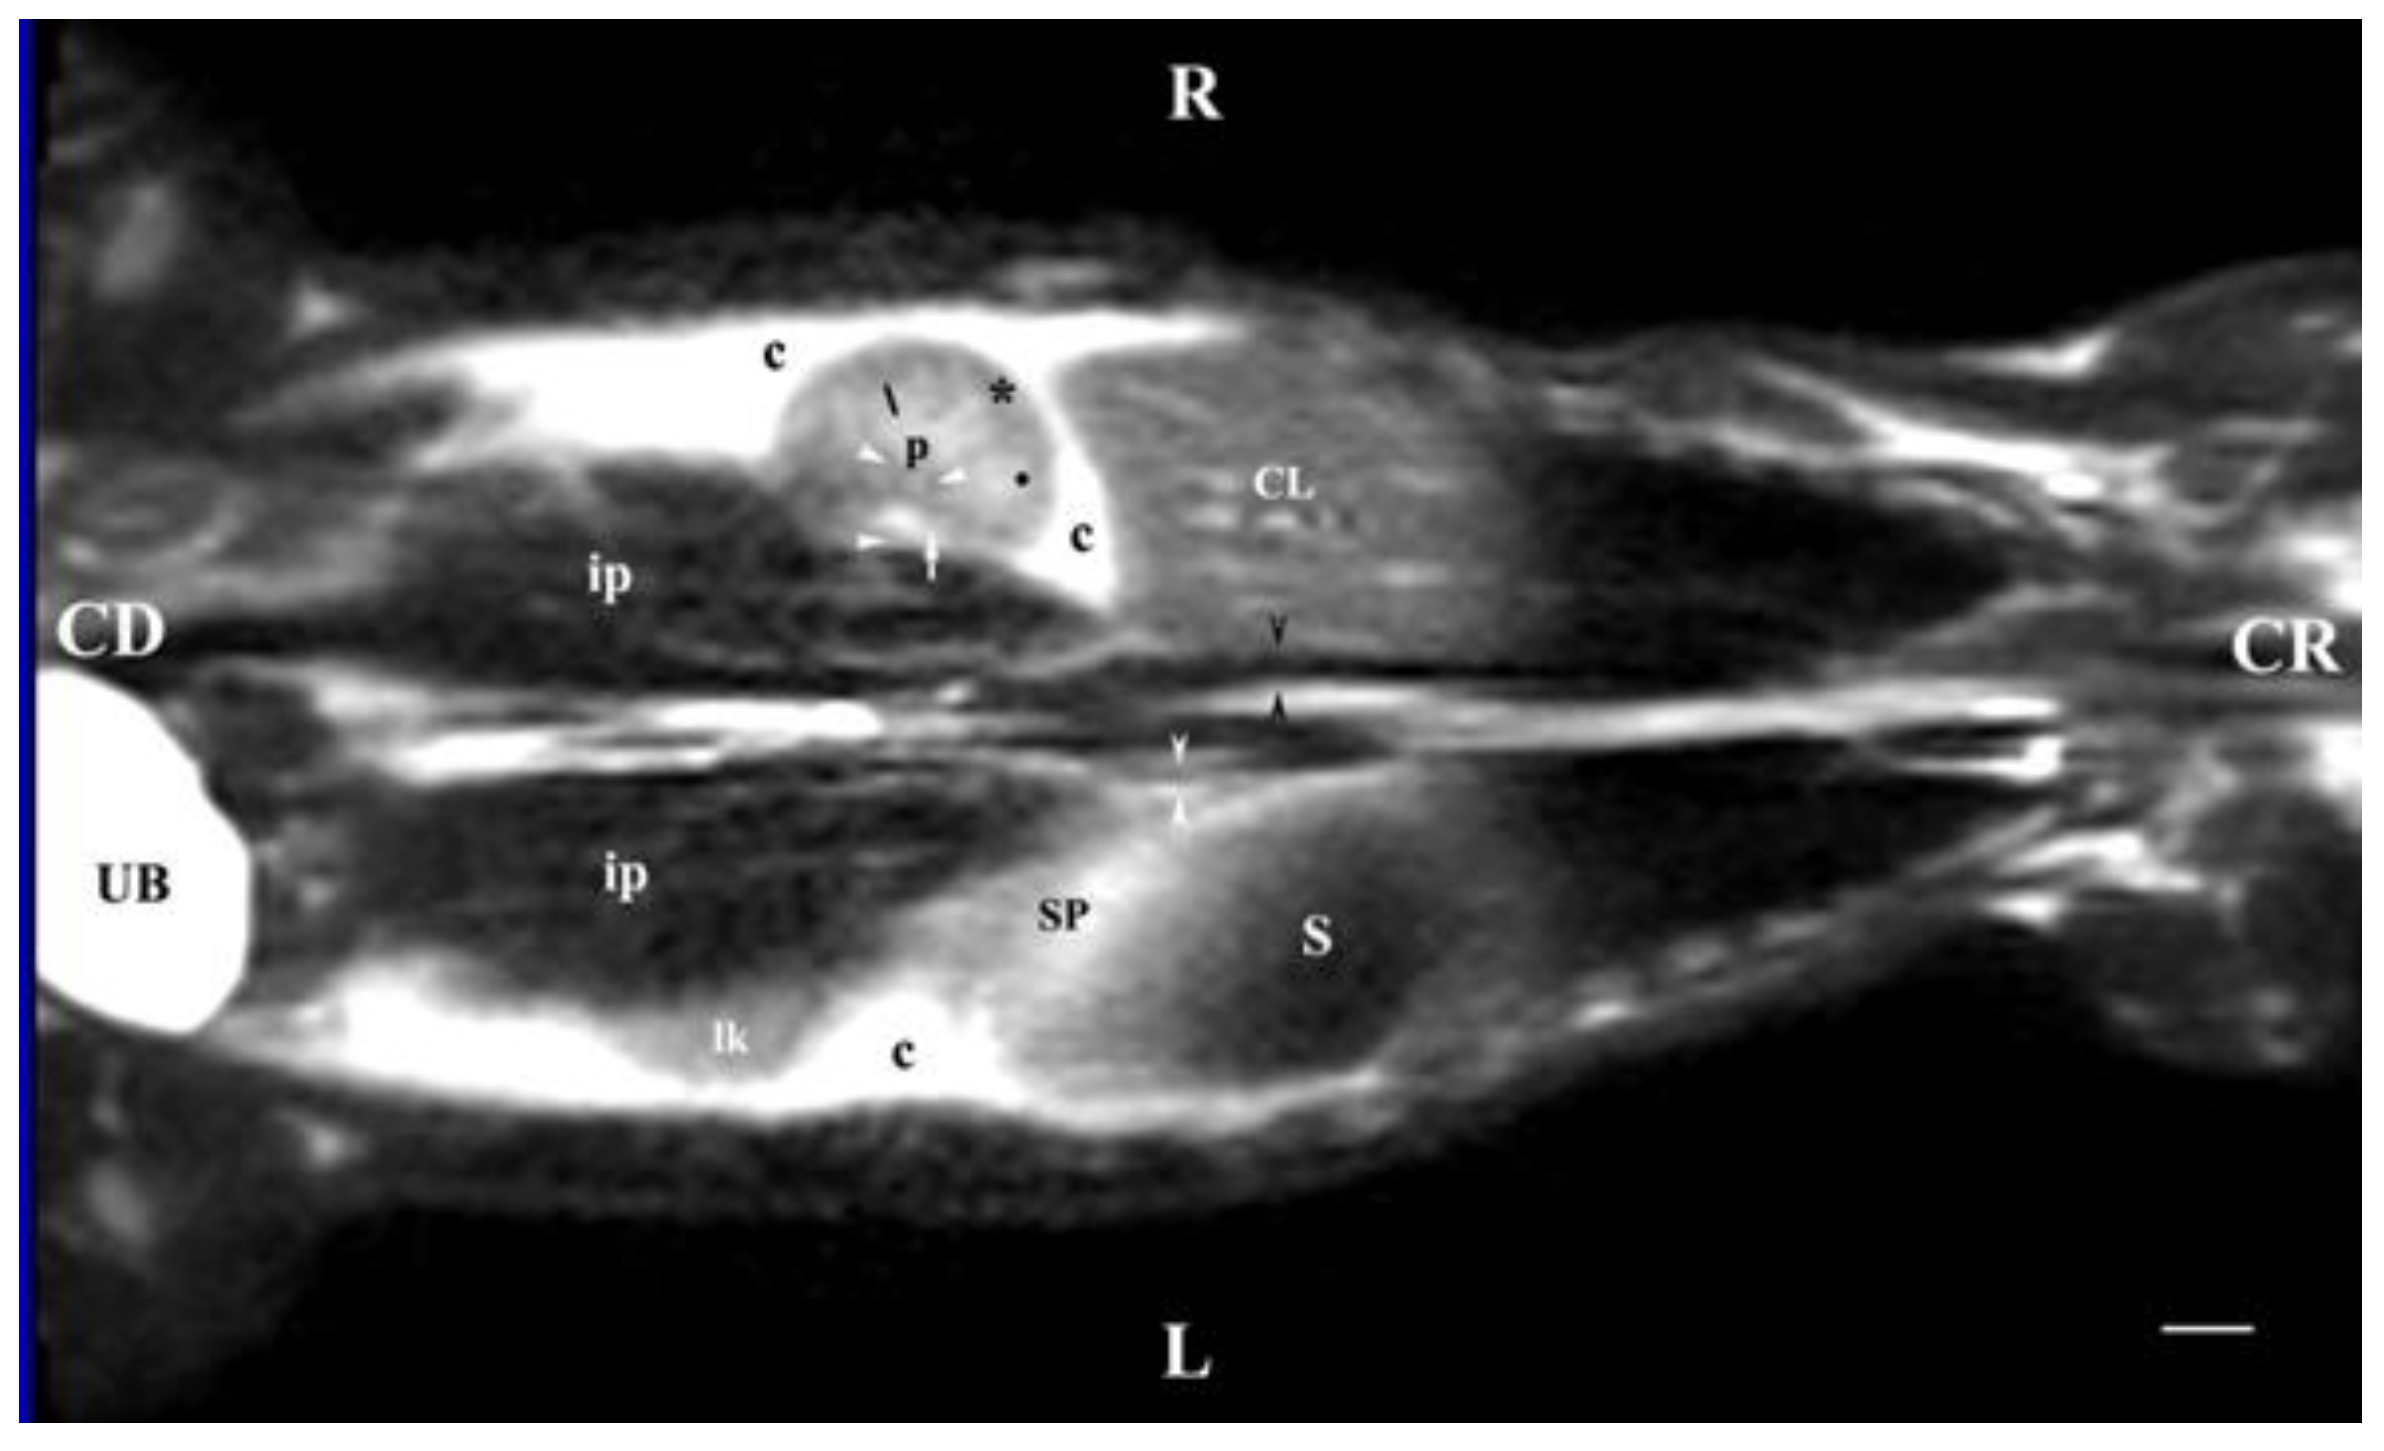
Figure 12.
MRI imaging anatomy of organs from the middle abdominal region (dorsal section; 30 mm ventral to the vertebral column). (T2-weighted sequence). R-right, L-left, CR-cranial, CD-caudal. (p) renal pelvis; (UB) urinary bladder; (black cross) renal cortex; (black star) inner part of the renal medulla; (white star) external part of the renal medulla; (perpendicular black arrow) renal hilus; (horizontal black arrowhead) transition between the dorsal and ventral recess; (oblique black arrow) renal sinus (c) renal adipose capsule; (black point) corticomedullary junction; (oblique white arrow) ureter; (CL) caudate lobe of the liver; (S) stomach; (SP) spleen; (black perpendicular arrowhead) caudal vena cava; (white perpendicular arrowhead) abdominal aorta; (C) caecum; (AD) ascending duodenum; (TC) transverse colon; (J) jejunum; (rm) root of mesentery. Line=10mm.
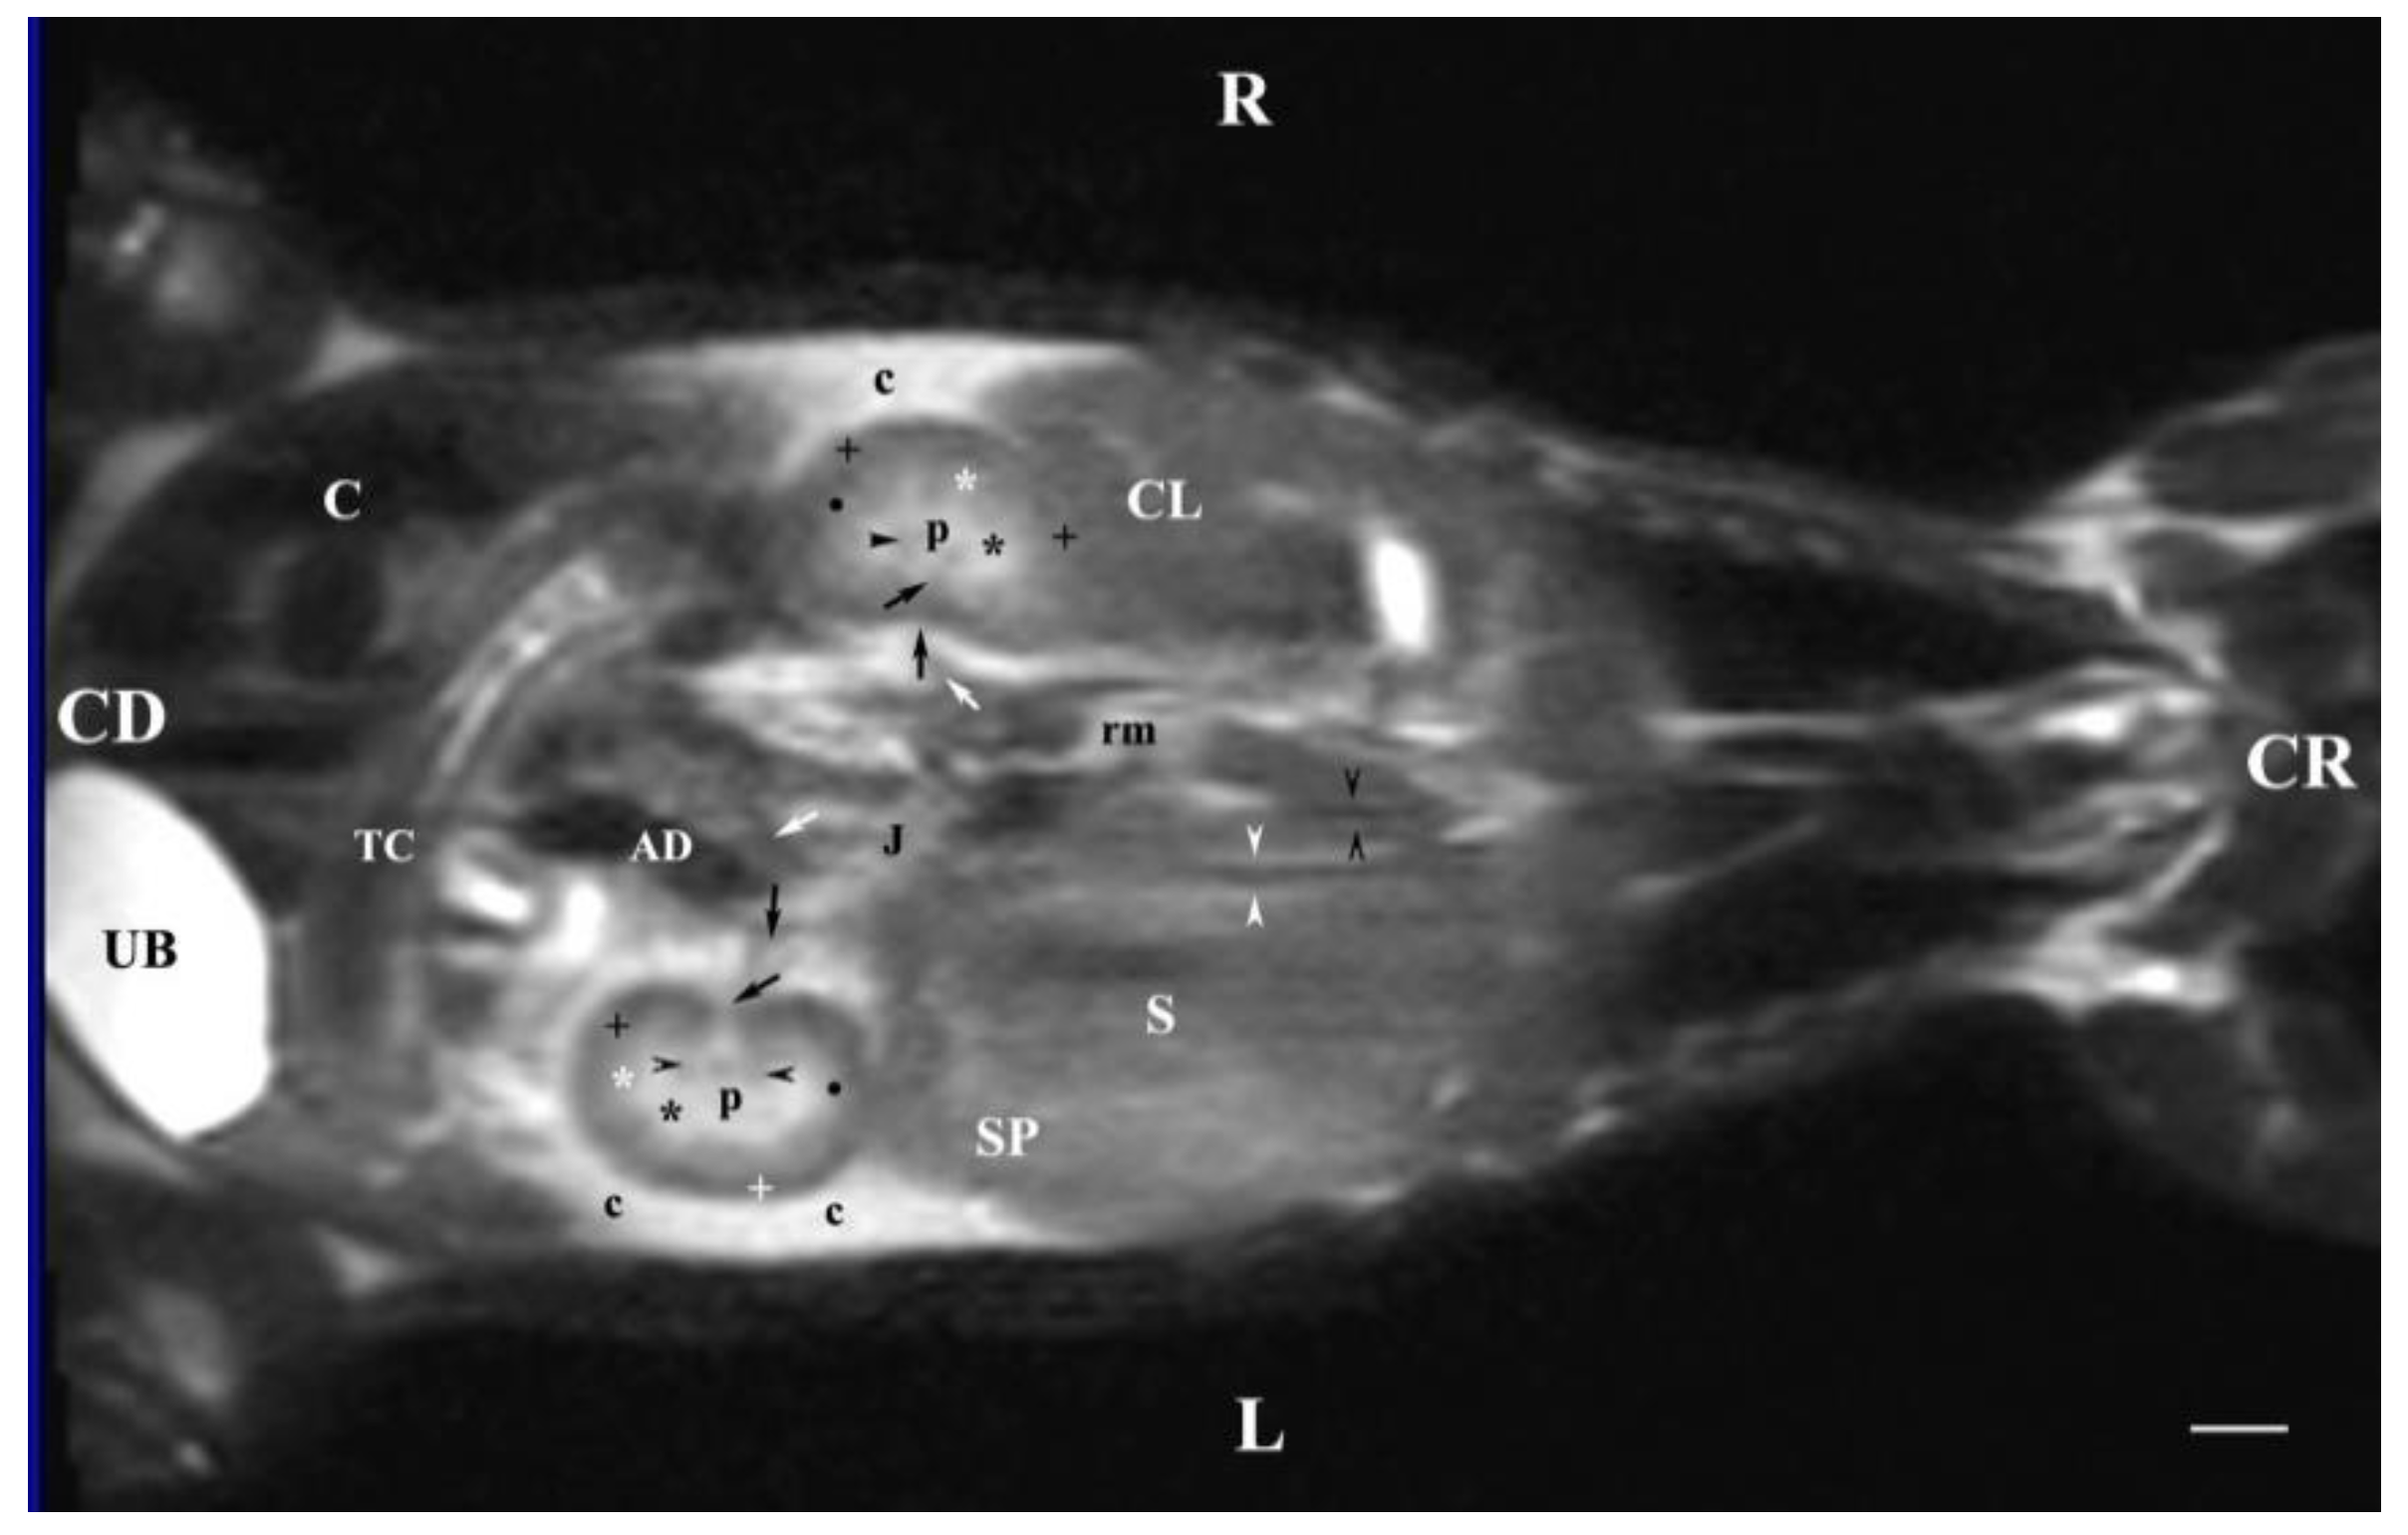
Figure 13.
MRI imaging anatomy of organs from the middle abdominal region (dorsal section; 45 mm ventral to the vertebral column) (T2-weighted sequence). R-right, L-left, CR-cranial, CD-caudal. (UB) urinary bladder; (p) renal pelvis; (rk) right kidney; (L) liver; (D) diaphragm; (S) stomach; (SP) spleen; (n) neck of the urinary bladder; (C) caecum; (TC) transverse colon; (AD) ascending duodenum; (J) jejunum; (rm) mesenterial root; (black oblique arrow) ureter; (white oblique arrow) renal hilus and ventral recess; (white star) outer part of the renal medulla; (black star) internal part of the renal medulla; (white point) corticomedullary junction; (black cross) renal cortex; (c) renal adipose capsule; (A) adipose tissue. Line=10mm.
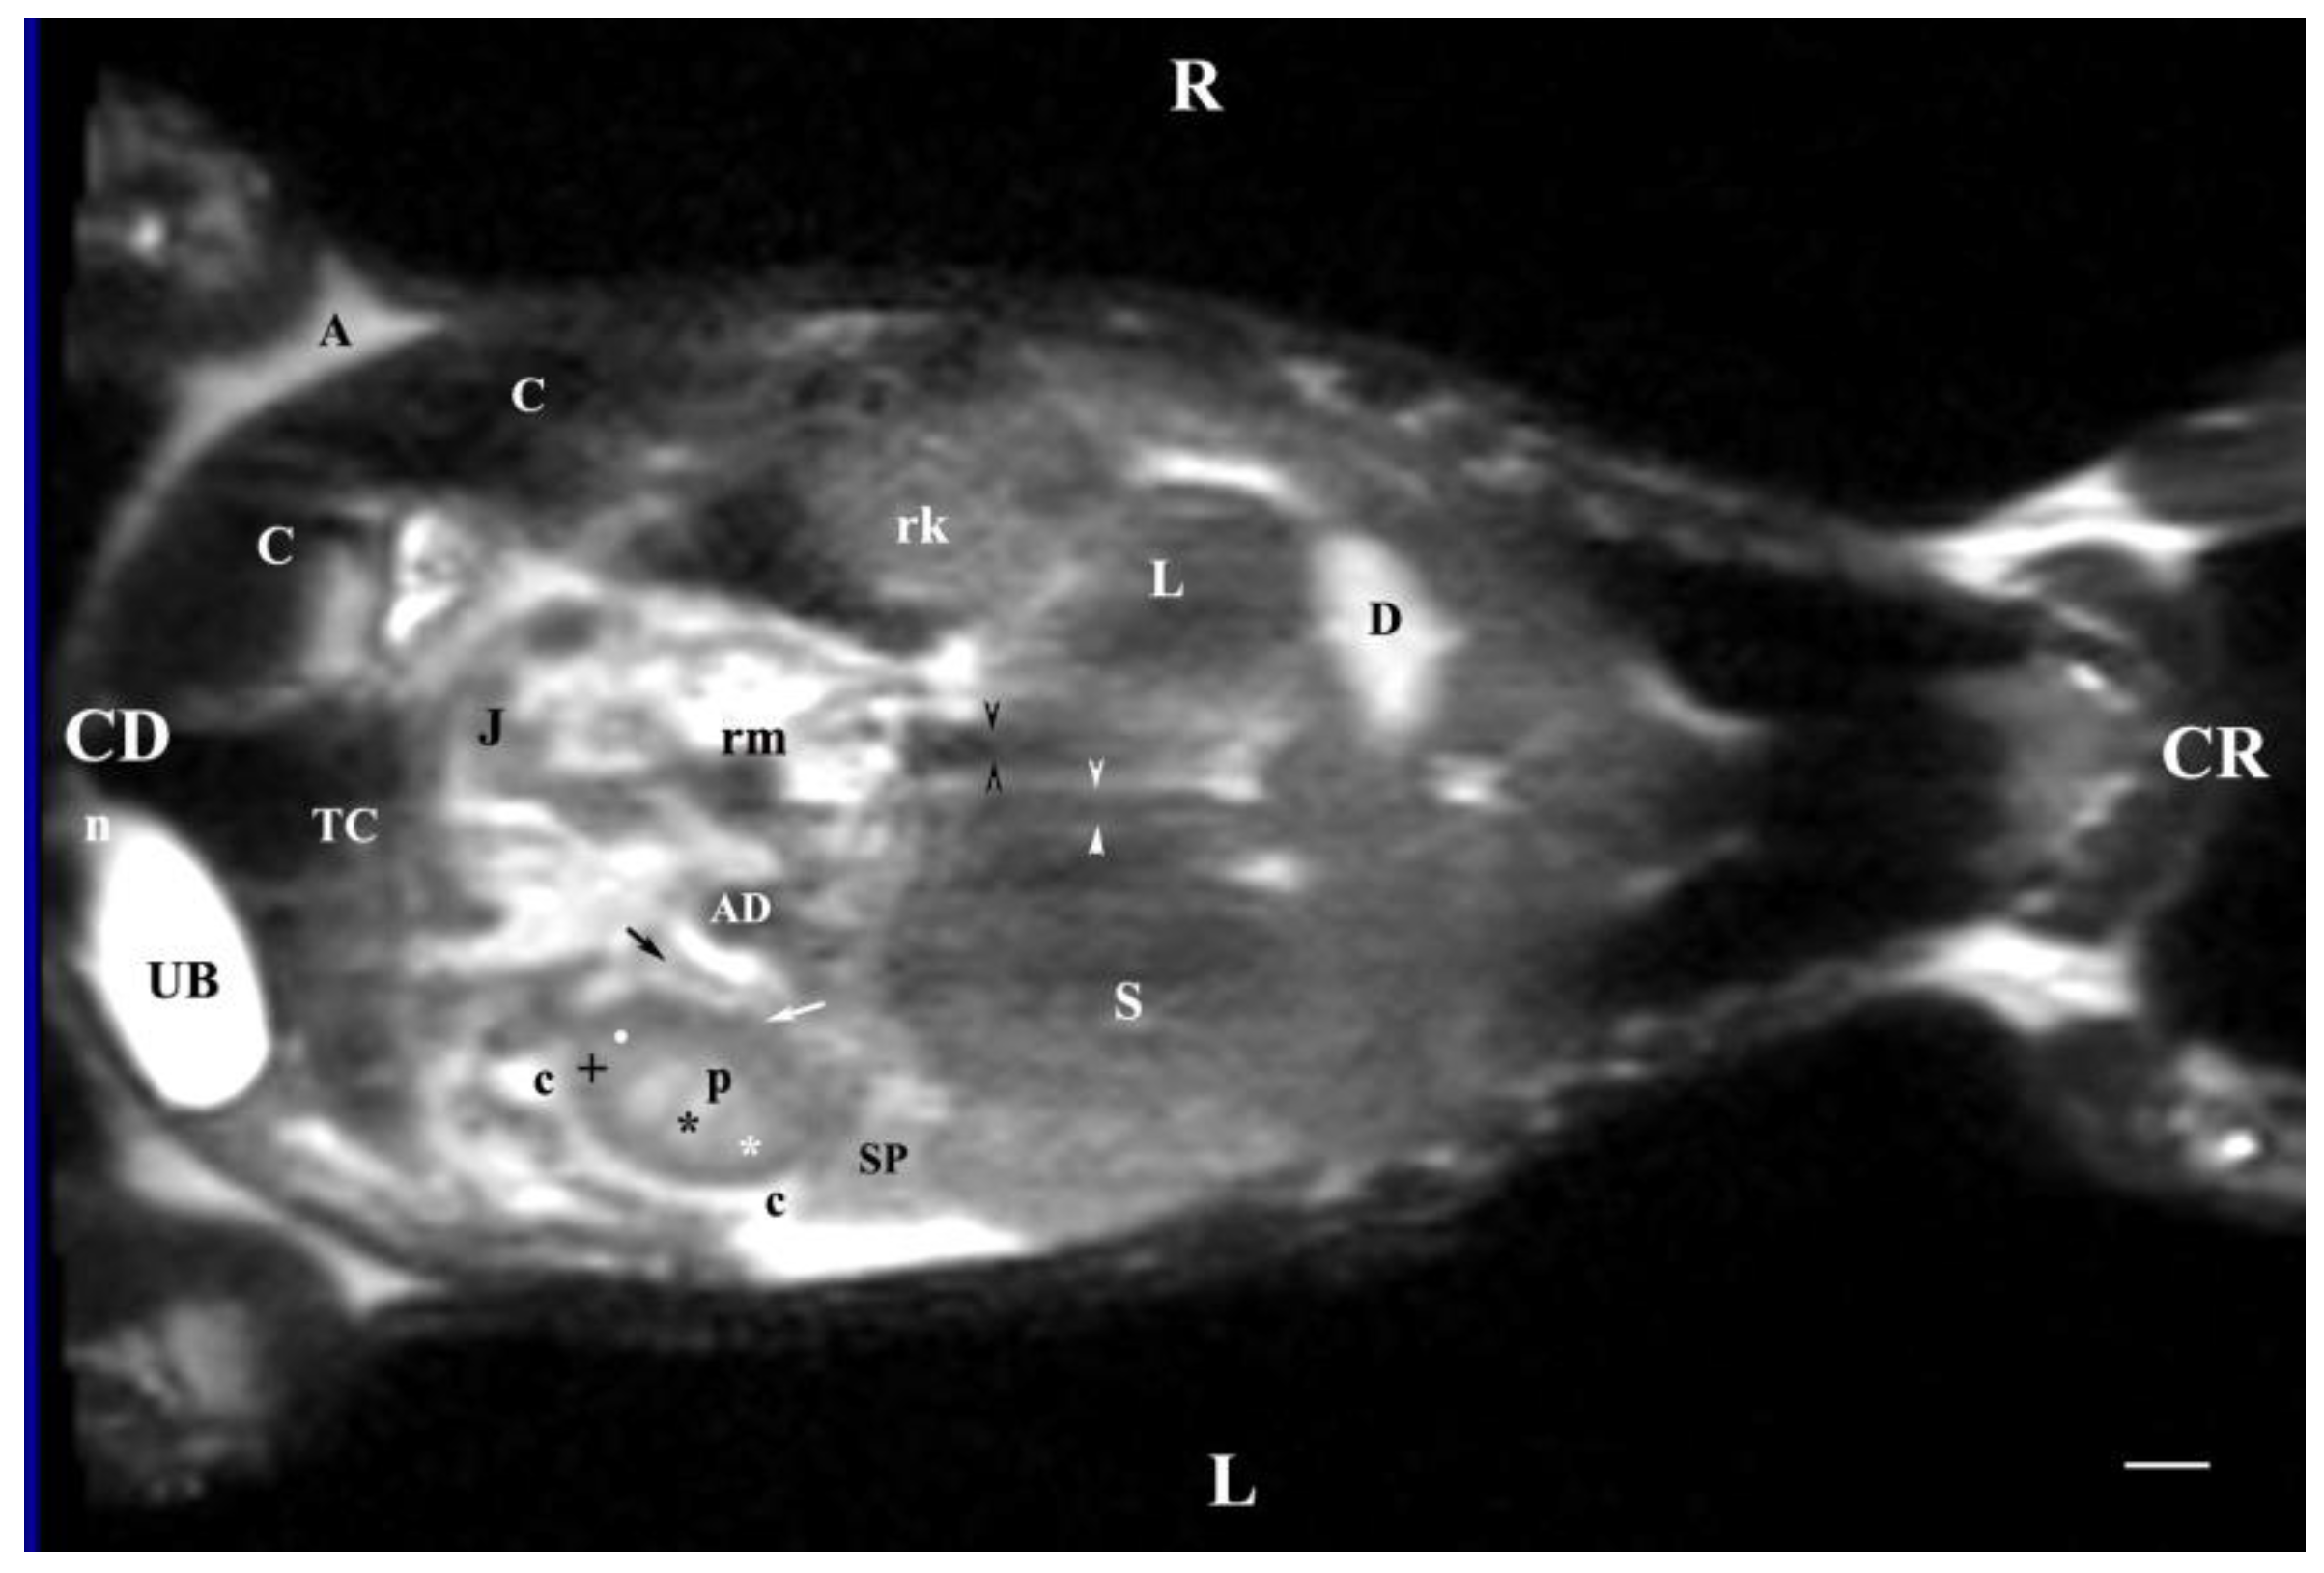
Figure 14.
MRI imaging anatomy of organs from the middle abdominal region (dorsal section; 60 mm ventral to the vertebral column). (T2-weighted sequence). R-right, L-left, CR-cranial, CD-caudal. (UB) urinary bladder; (n) neck of the urinary bladder; (black cross) renal cortex; (black star) renal medulla; (white point) corticomedullary junction; (L) liver; (D) diaphragm; (S) stomach; (SP) spleen; (c) renal adipose capsule; (black perpendicular arrow) left ureter; (white horizontal arrow) renal hilus; (J) jejunum; (TC) transverse colon; (C) caecum; (A) adipose tissue. Line = 10mm.
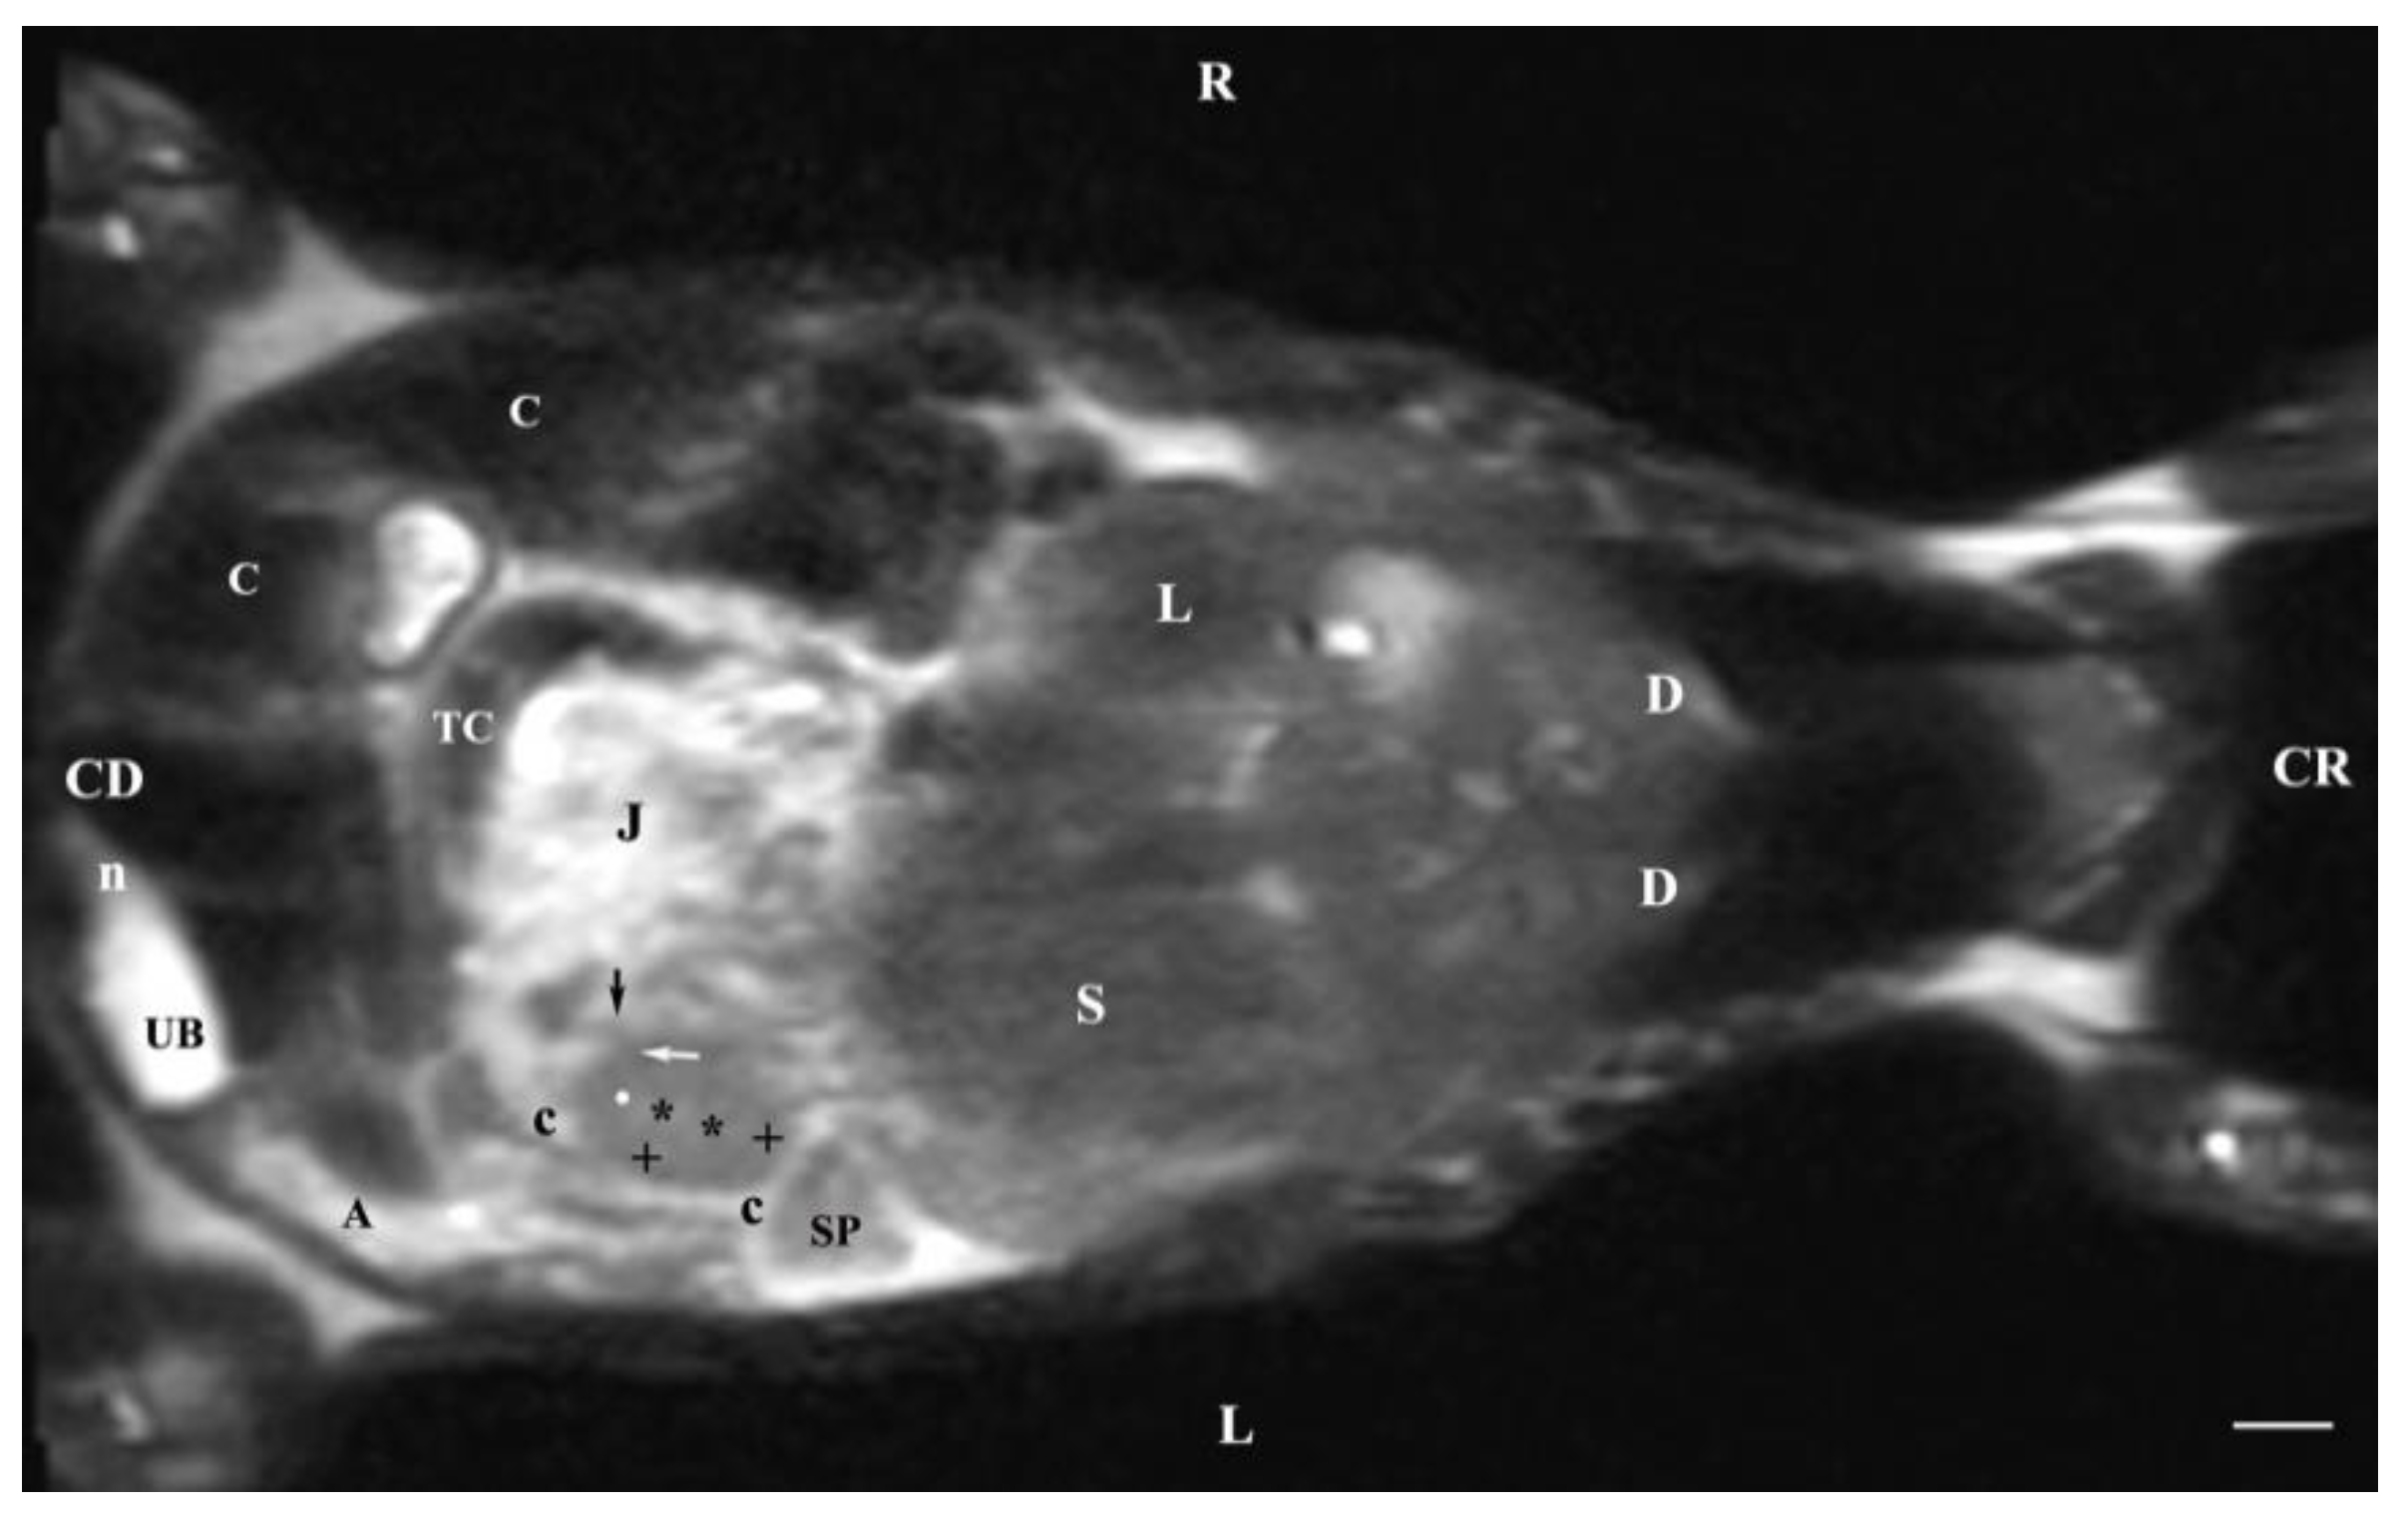
Disclaimer/Publisher’s Note: The statements, opinions and data contained in all publications are solely those of the individual author(s) and contributor(s) and not of MDPI and/or the editor(s). MDPI and/or the editor(s) disclaim responsibility for any injury to people or property resulting from any ideas, methods, instructions or products referred to in the content. |
© 2024 by the authors. Licensee MDPI, Basel, Switzerland. This article is an open access article distributed under the terms and conditions of the Creative Commons Attribution (CC BY) license (http://creativecommons.org/licenses/by/4.0/).
Copyright: This open access article is published under a Creative Commons CC BY 4.0 license, which permit the free download, distribution, and reuse, provided that the author and preprint are cited in any reuse.


