Submitted:
30 June 2024
Posted:
02 July 2024
You are already at the latest version
Abstract
Background: Acute kidney injury (AKI) and contrast-induced nephropathy (CIN) are common complications following percutaneous coronary intervention (PCI) or coronary angiography (CAG), presenting significant clinical challenges. Machine learning (ML) models offer promise for improving patient outcomes through early detection and intervention strategies.
Methods: A comprehensive literature search following PRISMA guidelines was conducted in PubMed, Scopus, and Embase from inception to June 11, 2024. Study characteristics, ML Models, performance metrics (AUC, accuracy, sensitivity, specificity, precision), and risk of bias assessment using the PROBAST tool were extracted. Statistical analysis used a random-effects model to pool AUC values, with heterogeneity assessed via the I² statistic.
Results: From 431 initial studies, 14 met the inclusion criteria. Gradient Boosting Machine (GBM) and Support Vector Machine (SVM) models showed the highest pooled AUCs of 0.87 (95% CI: 0.82-0.92) and 0.85 (95% CI: 0.80-0.90), respectively, with low heterogeneity (I² < 30%). Random Forest (RF) had a similar AUC of 0.85 (95% CI: 0.78-0.92) but significant heterogeneity (I² > 90%). Multilayer Perceptron (MLP) and XGBoost models had moderate pooled AUCs of 0.79 (95% CI: 0.74-0.84) with high heterogeneity. RF showed strong accuracy (0.83, 95% CI: 0.70-0.96), while SVM had balanced sensitivity (0.69, 95% CI: 0.63-0.75) and specificity (0.73, 95% CI: 0.60-0.86). Age, serum creatinine, left ventricular ejection fraction, and hemoglobin consistently influenced model efficacy.
Conclusions: GBM and SVM models, with robust AUCs and low heterogeneity, are effective in predicting AKI and CIN post-PCI/CAG. RF, MLP, and XGBoost, despite competitive AUCs, showed considerable heterogeneity, emphasizing the need for further validation.
Keywords:
Machine Learning
; Kidney Complications
; Acute Kidney Injury
; Contrast-Induced Nephropathy
; Percutaneous Coronary Intervention
; Systematic Review
; Meta-Analysis
1. Introduction
Coronary artery disease, particularly acute coronary syndrome (ACS), is a leading cause of mortality among adults over 35, accounting for approximately one-third of all deaths in this age group [1]. Percutaneous coronary intervention (PCI) has become the most common treatment for ACS [2]. However, a significant complication of PCI is acute kidney injury (AKI), affecting nearly 12.8% of patients and carrying a mortality rate of 20.2% during or after hospitalization [3]. AKI post-PCI is linked to severe long-term outcomes, including repeated coronary revascularization, myocardial infarction, and stroke [4].
To mitigate the risk of contrast-induced AKI (CI-AKI), preventive measures such as regulating contrast volume and osmolarity, pre-procedural statin intake, and adequate hydration are critical [5]. Identifying patients at risk of CI-AKI allows for tailored preventive strategies, improving clinical outcomes [6]. Traditional statistical models, like the NCDR-AKI risk model with a c-statistic of 0.71, have been used to predict CI-AKI. However, these models often fail to account for complex interactions among numerous variables, reducing their accuracy [3].
ML models offer a solution by capturing intricate, non-linear relationships in a data-driven manner without relying on predetermined assumptions about variable interactions. For instance, gradient-boosting algorithms like XGBoost have demonstrated superior performance over logistic regression (LR) in predicting medical outcomes by identifying complex patterns in patient data [7].
ML models’ algorithms rely on several critical predictive features to enhance accuracy and clinical relevance[3]. Among these, serum creatinine levels, blood urea nitrogen (BUN), and urine output accompanied by intraoperative variables such as the volume of contrast media used, preoperative hemoglobin levels, and the presence of comorbid conditions like diabetes and hypertension are crucial[6,8,9]. Advanced models also incorporate biomarkers like cystatin C and N-terminal pro-brain natriuretic peptide (NT-proBNP), which provide insights into both renal and cardiac health[10]. By analyzing these multifaceted variables, ML models like XGBoost and random forest (RF) outperform traditional LR models, offering improved predictive power and facilitating targeted preventive measures for high-risk patients[4]. Nevertheless, when managing a limited set of weakly correlated clinical variables, such as those present in structured electronic health records (EHR), LR models are expected to perform equivalently to ML models[11]. In 2019, the results of a systematic review by Christodoulou, E. et al.[12] demonstrated no significant difference in discriminative ability between ML-based and LR-based models when utilizing studies characterized by a low risk of bias. This is in line with the results of research claims ML has limited application in predicting CI-AKI in elective PCI patients[4].
To the best of our knowledge, our study is the first to meta-analyze and systematically evaluate the effectiveness of ML models in predicting different types of AKI in PCI patients. By comparing ML models with previously reported traditional methods, we aim to detail the efficacy of these advanced techniques in capturing complex, non-linear relationships among diverse risk factors, thus enhancing predictive accuracy and clinical outcomes.
2. Methods
2.1. Search Strategy
A comprehensive literature search followed the Preferred Reporting Items for Systematic Reviews and Meta-Analyses (PRISMA) guidelines[13]. Databases searched included PubMed, Scopus, and Embase from inception to 11th June 2024. We used a combination of MeSH terms including ("Artificial Intelligence" OR "Machine Learning" OR "Neural Networks (Computer)") AND ("Contrast-Induced Nephropathy" OR "Contrast Media") AND "Percutaneous Coronary Intervention". The search query of each database with detailed keywords is available in Supplementary Table S1. Additionally, we manually reviewed the reference lists of all included studies and relevant review articles to identify any further studies in the grey literature.
2.2. Eligibility Criteria and Study Selection
Studies were included if they met the following criteria: (1) Patients undergoing PCI/coronary Angiography (CAG); (2) Utilization of ML algorithms to predict Kidney complications (AKI, CIN); (3) Performance of the ML model reported with the Area Under the Curve (AUC) and 95% confidence interval (CI); (4) Prospective and retrospective observational studies; (5) Studies that separated data into training and validation/test datasets; (6) Articles published in English language.
Studies not reporting AUC or lacking sufficient data to calculate AUC, reviews, editorials, case reports, studies not involving PCI/CAG patients, those that did not split data into training and validation/test datasets, and predicting models just analyzed with traditional statistics (LR, multivariate logistic regression (MLR)) were excluded.
Two independent reviewers [S.N.] and [D.N.D.] screened titles and abstracts for relevance. Full texts were reviewed for uncertain cases. Discrepancies were resolved through discussion or by consulting a third reviewer [D.Sh.]
2.3. Data Extraction
Data extraction was conducted independently by two reviewers [S.N.] and [D.N.D] using a standardized data extraction form, as follows:
- Outcomes: AUC with 95%CI, and any additional performance metrics reported (Accuracy, Sensitivity, Specificity, Precision) for each ML model (Supplementary Table S2 and Table 4).
2.4. Quality and Risk of Bias Assessment
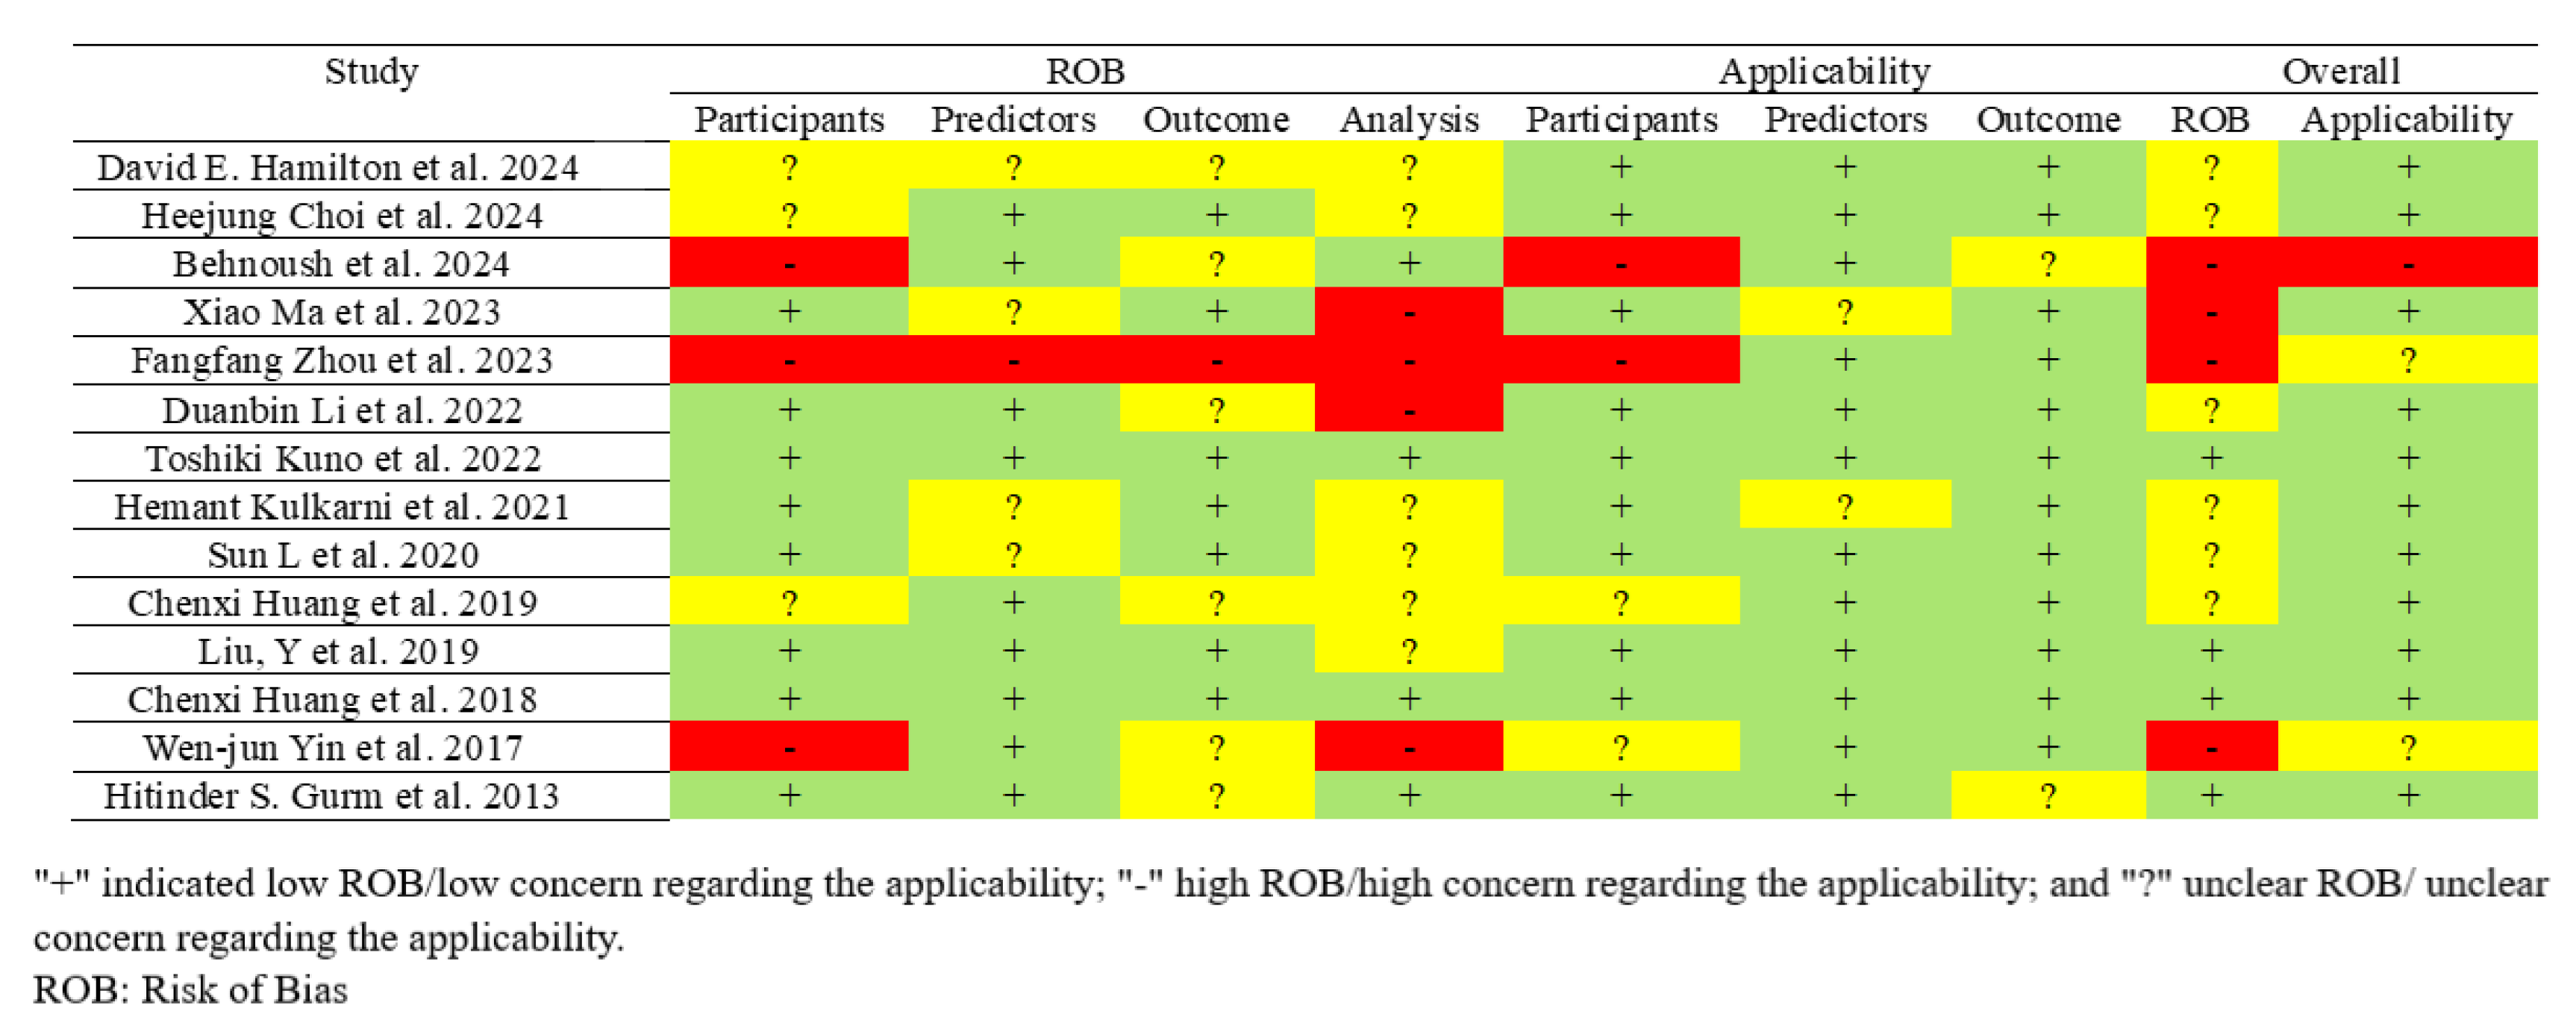
The risk of bias in included studies was independently assessed by two reviewers [S.N.] and [D.N.D.] using the PROBAST tool[14]. It comprises 20 signaling questions across four domains (participants, predictors, outcome, and analysis), and evaluates the risk of bias and applicability concerns. Each domain was rated as low (+), high (-), or unclear (?) risk of bias/applicability. Discrepancies were resolved through discussion or consultation with a third reviewer [D.Sh.] The overall risk of bias was determined based on domain ratings (Figure 9).
2.5. Study Outcomes
The primary outcome of our study is the predictive performance of ML models for kidney insufficiency (AKI, CIN) in patients undergoing coronary intervention (PCI/CAG), measured by the AUC and its 95%CI. Secondary outcomes include additional performance metrics of the ML models, such as accuracy, sensitivity, specificity, and precision. We also assess the calibration of the models and explore heterogeneity among the studies using the I² statistic.
2.6. Data Synthesis and Statistical Analysis
The performance of each ML model was assessed using discrimination and calibration as primary outcome measures. Discrimination, or the concordance index (C-index), is comparable to the Area under the Receiver Operating Characteristic Curve (AUROC) and reflects the model's ability to distinguish outcomes[15]. The AUROC categorizes the model's performance as follows: none (AUROC ≤0.6), poor (AUROC 0.6-0.7), fair (AUROC 0.7-0.8), good (AUROC 0.8-0.9), and excellent (AUROC 0.9-1).
We also performed a meta-analysis using STATA software (version 17). The primary effect size was the AUC with its 95%CI. We used a random-effects model to account for potential heterogeneity among studies. Heterogeneity was assessed using the I² statistic, providing an estimate of the proportion of variation among the included studies. I² values ranging from 0–25%, 25–50%, 50–75%, and above 75% indicate very low, low, moderate, and high heterogeneity, respectively. Forest plots were generated to visualize the effect sizes and CI for each study and the overall pooled effect size[16].
The 95%CI for those studies just reported the AUC was calculated by estimating the standard error (SE), following a formula by Hanley and McNeil[17]:
- is the number of cases with kidney complication
- is the number of cases without kidney complication
- and are constants calculated as:
Margin of Error (MOE): Multiplication of the SE(AUC) by the critical value (1.96):
Confidence Interval: Adding and subtracting the MOE from the estimated AUC:
The 95%CI for those studies just reported by definition of true positives (TPs), true negatives
(TNs), false positives (FPs), false negatives (FNs).
Moreover, Accuracy ((TP+TN)/(TP+FP+FN+TN)), Sensitivity (TP/(TP+FN)), Specificity (TN/(TN+FP)), and Precision (TP/(TP+FP)) were calculated by estimating the standard error (SE), following these formulas:
And the next steps – MOE and 95%CI – are calculated as the formula (2) and (3), in calculating 95%CI(AUC).
A formal publication bias assessment was not planned because of the limited number of included studies in each ML model meta-analysis (<10 studies) which makes it difficult to assess publication bias robustly.
2.7. Protocol Registration
The review protocol was registered with the International Research Registry under registration number researchregistry10434.
3. Results
A literature search across three databases resulted in 431 studies. After removing 33 duplicates and excluding 350 articles during the title and abstract screening, 48 studies were reviewed in full text. Accompanying the search of grey literature in citation references which led to the full text review of 14 more studies. After the exclusion of 30 studies in database search (no relevant population (n=10)[18,19,20,21,22,23,24,25,26,27], no sufficient data (n=9)[28,29,30,31,32,33,34,35,36], conference abstract (n=6)[37,38,39,40,41,42], no relevant sampling (n=4)[10,43,44,45], traditional statistics (n=4) [46,47,48,49,50,51,52], and no relevant intervention (n=1)[53]) and 14 studies in grey literature search (traditional statistics (n=14)[50,51,52,54,55,56,57,58,59,60,61,62,63,64]), an ultimate 14 studies were included in the final analysis [60,65,66,67,68,69,70,71,72,73,74,75,76,77] (Figure 1).
3.1. Study Characteristics
The extracted studies were from China (42.86%), the United States (35.7%), Korea, Japan, and Iran (7.14% each). About 50% of datasets were split into Validation and 100% into training sets; however, due to heterogeneity in reporting, percentages for those split into testing are not provided. Among all the studies, the learning models RF (64.3%), XGBoost (28.58%), and DT (21.43%) were the most frequently used, and the model RF and XGBoost were considered the most efficient performing predictor model in 6 (42.86%)[60,67,70,73,75,77], and 2 (14.28%)[65,76] studies, respectively.
The study population characteristics in the included studies comprised patients diagnosed with ACS (7.14%)[67] and AMI (7.14%)[73] who underwent PCI. Additionally, some studies focused on patients with unreported heart problems who were generally registered in the database and had undergone just PCI (57.1%)[60,65,66,68,71,72,74,76] or vascular intervention (PCI and CAG) (28.57%)[69,70,75,77]. Regarding the classification of renal complications post-intervention, based on the defined criteria, patients were reported in one of four categories:
- AKI: according to the Kidney Disease: Improving Global Outcomes (KDIGO) criteria is defined as an increase in serum creatinine by ≥0.3 mg/dL within 48 hours; or an increase in serum creatinine to ≥1.5 times baseline, which is known or presumed to have occurred within the prior 7 days; or Urine volume <0.5 mL/kg/h for 6 hours; is reported in 28.57% of studies [71,72,74,76].
- Acute Kidney Injury Network (AKIN): An abrupt (within 48 hours) reduction in kidney function, defined as an absolute increase in serum creatinine of ≥0.3 mg/dL, a percentage increase in serum creatinine of ≥50%, or a reduction in urine output (documented oliguria of <0.5 mL/kg/h for >6 hours); which is reported in 14.28% of studies (65, 67).
Additionally, Chenxi Huang et al. (74) evaluated its statistical methods by considering three cutoffs in the serum creatinine elevation (≥ 0.3, ≥ 0.5, and ≥ 1.0 mg/dL).
3.2. Feature of Importance and Predictors
In total, the most significant predictors and features considered for dataset analysis with machine learning models include Age (100%), Creatinine/Serum Creatinine (57.14%), Left Ventricular Ejection Fraction (LVEF) (50%), Hemoglobin (50%), Diabetes Mellitus (42.86%), Congestive Heart Failure/Heart Failure (35.7%), chronic kidney disease (CKD) (28.57%), Body Mass Index (BMI)/Weight/Height (28.57%), and Estimated Glomerular Filtration Rate (eGFR)/Baseline eGFR (21.43%). However, due to the high heterogeneity across study populations and varying importance coefficients of each feature in ML data analysis, the feasibility of reporting and correlating these features with other outcomes and variables in regression analysis is limited.
3.3. Meta-Analysis Outcomes
In a comprehensive pooled analysis of included studies, the predictive performance of various ML models for assessing kidney complications following cardiac interventions was evaluated. The primary metric used was the AUROC, complemented by measures of heterogeneity (I2) and subgroup analyses.
Considering Training Datasets, the meta-analysis of ML models for predicting kidney complications reveals that the GBM and SVM exhibit the highest pooled AUC values of 0.87 and 0.85, respectively, with low (I2 GBM: 28.82%) and very low heterogeneity (I2 SVM: 0.01%), indicating robust and consistent performance across studies (Figure 2 and Figure 3A).
The RF model, while demonstrating a similar pooled AUC of 0.85, shows significantly high heterogeneity (98.32%), particularly within the CI-AKI (99.49%) and vascular intervention (89.82%) subgroups, suggesting variability in effectiveness across different patient populations (Figure 4A–C).
MLP and XGBoost models achieve pooled AUCs of 0.79 but exhibit high heterogeneity (MLP: 81.98%, XGBoost: 99.70%), indicating inconsistent performance (Figure 5 and Figure 6A). XGBoost AKI subgroup analysis showed increased pooled AUC (0.82), and high heterogeneity (99.86%) (Figure 6C). The pooled AUC analysis, considering Fangfang Zhou et al. [69] and Chenxi Huang et al. [76] and excluding David E. Hamilton et al. [65] study resulted in a reduction of the effect size (0.74) and a decrease in the final heterogeneity (70.67%), as well (Figure 6B).
NB and DT models, with pooled AUCs of 0.78, also show moderate to high heterogeneity (NB: 67.55%, DT: 92.92%), although DT demonstrates consistent performance in the PCI subgroup (I²: 0.04%) (Figure 7A and Figure 8A,B).
Overall, GBM and SVM are the most reliable models, while the performance of RF, MLP, XGBoost, NB, and DT varies significantly across different clinical scenarios, highlighting the need for careful model selection based on specific patient characteristics and clinical settings (Table 3). Relevant Data for each ML model is available in Supplementary Table S2.
3.4. Pooled Analysis of Machine Learning Models Metrics
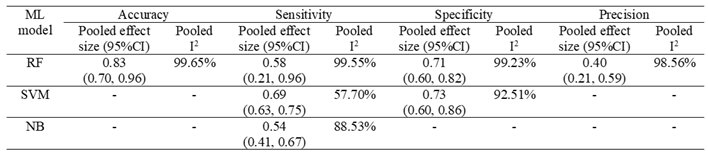
The pooled analysis of ML models illustrates nuanced performance metrics across different classifiers. RF exhibits strong overall accuracy (0.83, 95% CI: 0.70-0.96), with moderate sensitivity (0.58, 95% CI: 0.21-0.96) and specificity (0.71, 95% CI: 0.60-0.82), alongside modest precision (0.40, 95% CI: 0.21-0.59) (Figure 4D–G). SVM demonstrates balanced sensitivity (0.69, 95% CI: 0.63-0.75) and specificity (0.73, 95% CI: 0.60-0.86), highlighting its discriminative capability in classifying outcomes (Figure 3B,C). NB prioritizes sensitivity (0.54, 95% CI: 0.41-0.67), emphasizing its role in accurately predicting positive outcomes in clinical scenarios (Table 4). Relevant Data for each ML model is available in Supplementary Table S2.

Table 1.
Demographic Characteristics of included studies, ML model type, predictors, included patients, and AKI definition.
Table 1.
Demographic Characteristics of included studies, ML model type, predictors, included patients, and AKI definition.
| Reference | Country | Model Type | Predictors | Included Patients | AKI definition |
| David E. Hamilton et al. 2024 [65] | USA | XGBoost LR |
Age, Sex, Body Mass Index (BMI), Smoking Status, Diabetes Mellitus, Hypertension, Hyperlipidemia, Prior Myocardial Infarction, Prior Coronary Artery Bypass Grafting (CABG), Prior Percutaneous Coronary Intervention (PCI), Congestive Heart Failure, Peripheral Vascular Disease, Chronic Lung Disease, Chronic Kidney Disease, Stroke or Transient Ischemic Attack (TIA), Left Ventricular Ejection Fraction (LVEF), Systolic Blood Pressure, Diastolic Blood Pressure, Heart Rate, Hemoglobin, Platelet Count, Creatinine, and Cholesterol | patients undergoing PCI procedures | AKIN stage 1 or greater with absolute Cr increase of ≥0.3mg/dL or relative Cr increase ≥50%. |
| Heejung Choi et al. 2024 [66] | Korea | GBM RF LR DT Adaboost |
Age, history of chronic kidney disease (CKD), hematocrit result, troponin I level, blood urea nitrogen (BUN) level, base excess, and N-terminal pro-brain natriuretic peptide (NT-proBNP) level. | Patients underwent PCI at After excluding patients due to a history of ESRD, HD, or recent PCI, and those without medical records for at least one year prior | individual creatinine test results higher than the minimum creatinine test value of the past 2 days by ≥0.3 mg/dL or an increase in creatinine ≥1.5× the average value of the past seven days. |
| Behnoush et al. 2024 [67] | Iran | RF LR CatBoost MLP NB |
Left Ventricular Ejection Fraction (LVEF), Age, Fasting Plasma Glucose (FPG), Last Creatinine before PCI, Acute Myocardial Infarction (MI), Aborted Cardiac Arrest, CPR in PCI, Mean Creatinine, eGFR, Body Mass Index (BMI) | Acute Coronary Syndrome (ACS) patients undergoing Percutaneous Coronary Intervention (PCI) | Acute Kidney Injury (AKI) defined by the acute kidney injury necrosis (AKIN) criteria: absolute increase of ≥ 0.3 mg/dL or a relative increase of ≥ 50% in serum creatinine after the procedure |
| Xiao Ma et al. 2023 [68] | China | LR RR NB KNN SVM DT RF XGBoost |
uric acid, peripheral vascular disease, cystatin C, creatine kinase-MB, haemoglobin, N-terminal pro-brain natriuretic peptide, age, diabetes, systemic immune-inflammatory index, total protein, and low-density lipoprotein | Patients with coronary heart disease undergoing elective PCI | increase in serum creatinine (SCr) level by ≥0.5 mg/dL (≥44.2 µmol/L) or increase in SCr to ≥25% over baseline within 48–72 hours after contrast agent administration, or urine volume <0.5 mL/kg/h for 6 hours |
| Fangfang Zhou et al. 2023 [69] | China | LR RF GBDT XGBoost NB |
Neutrophil-to-Lymphocyte Ratio (NLR), serum creatinine concentration, fasting plasma glucose concentration, use of β-blocker | patients who underwent elective vascular intervention, coronary angiography, and percutaneous coronary intervention | An increase in serum creatinine (Scr) ≥ 26.5 μmol/L within 48 hours of contrast medium (CM) administration or ≥ 1.5 times the baseline value. |
| Duanbin Li et al. 2022 [70] | China | RF | Age, Hemoglobin, N-terminal of the prohormone brain natriuretic peptide (NT-proBNP), cardiac troponin I (cTnI), neutrophil-to-lymphocyte ratio (NLR), C-reactive protein (CRP), eGFR (estimated filtration rate). | patients undergoing coronary angiography (CAG) | An increase in serum creatinine (Scr) ≥44 µmol/L (0.5 mg/dL) or ≥25% within 72 hours after intravascular administration of iodinated contrast agents. |
| Toshiki Kuno et al. 2022 [71] | Japan | Light GBM LR |
Age, chronic kidney disease (eGFR), previous heart failure, diabetes mellitus, cerebrovascular disease, heart failure at admission, cardiogenic shock at admission, cardiopulmonary arrest at admission, use of intra-aortic balloon pump, ST-elevation myocardial infarction, non-ST-elevation myocardial infarction/unstable angina, and preprocedural hemoglobin. | Patients undergoing PCI | AKI defined as an absolute increase of 0.3 mg/dL or a relative increase of 50% in serum creatinine |
| Hemant Kulkarni et al. 2021 [72] | USA | MLP | Not being on dialysis, having CKD, undergoing emergent PCI as an inpatient, and pre-PCI troponin T levels | Patients undergoing PCI | Acute kidney injury network (AKIN) stage 1 or greater or a new requirement for dialysis following PCI |
| Sun L et al. 2020 [73] | China | DT SVM RF KNN NB GB LR |
Neutrophil percentage, Age, Free triiodothyronine (FT3), Preoperation hypotension, Serum creatinine, Hemoglobin, Low-density lipoprotein cholesterol, Total triglycerides, Brain natriuretic peptide, White blood cell count, High-density lipoprotein cholesterol, Heart rate, Body mass index, Cardiac troponin I, Systolic blood pressure, HbA1c, Diastolic blood pressure, Total cholesterol, Left ventricular ejection fraction (LVEF), Weight. | Patients diagnosed with AMI undergoing PCI | Increase in creatinine by ≥0.3 mg/dl within 48 hours. Increase in creatinine to ≥1.5 times baseline within the prior 7 days. Urine volume <0.5 ml/kg/h for 6 hours. |
| Chenxi Huang et al. 2019 [74] | USA | GAM | Age, Prior heart failure, Cardiogenic shock w/in 24 hours, Cardiac arrest w/in 24 hours, Diabetes mellitus composite, CAD presentation composite, Heart failure w/in 2 weeks composite, Pre-procedure GFR, Pre-procedure hemoglobin, Admission source, Body mass index, PCI status, Pre-PCI ventricular ejection fraction | Patients undergoing PCI | Acute Kidney Injury (AKI) was defined using three thresholds for pre-procedure to post-procedure creatinine level increase: ≥0.3 mg/dL ≥0.5 mg/dL ≥1.0 mg/dL |
| Liu, Y et al. 2019[75] | China | RF | Age (years), Log BNP (pg/mL), SBP (mmHg), LVEF (%), Serum creatinine (mg/dL), Serum albumin (g/L), Serum urea nitrogen (mg/L), Haemoglobin (g/L), Heart rate (b.p.m.), CKMB (U/L), Haematocrit (%), K (mmol/L), Uric acid (mmol/L) | Patients aged ≥ 18 years undergoing PCI or CAG between January 2010 and December 2013 | Increase in SCr ≥ 0.5 mg/dL from baseline within 48–72 h after Procedure |
| Chenxi Huang et al. 2018 [76] | USA | LightGBM XGBoost LR |
Age, Prior heart failure, Cardiogenic shock within 24 hours (no versus yes), Cardiac arrest within 24 hours (no versus yes), Diabetes mellitus composite (no versus yes, insulin versus yes, others), CAD presentation composite (non-STEMI versus others), Heart failure within 2 weeks composite (no versus yes, NYHA class IV versus yes, others), Preprocedure GFR, Preprocedure hemoglobin, Admission source (emergency department versus others), Body mass index, PCI status (elective versus emergency versus others), Pre-PCI left ventricular ejection fraction | Patients undergoing PCI | Post-PCI AKI defined by Acute Kidney Injury Network (AKIN) Increase in serum creatinine ≥ 0.3 mg/dL or 1.5-fold from baseline |
| Wen-jun Yin et al. 2017 [77] | China | RF | Baseline eGFR, RDW, Triglycerides, Most recent serum creatinine before the procedure, HDL, Total cholesterol, LDL, BUN, P-LCR, Serum sodium, Plateletocrit (PCT), INR, Blood glucose | Treated patients with CM for CAG or PCI or received intravenous CM such as for CT or endovascular procedures | Increase in serum creatinine of 0.5 mg/dl (44.2 µmol/L) or 25% relative increase in serum creatinine within 72 hours after exposure to CM |
| Hitinder S. Gurm et al. 2013 [60] | USA | RF | PCI indication, PCI status, CAD presentation, cardiogenic shock, heart failure within 2 weeks, pre-PCI left ventricular ejection fraction, Diabetes mellitus/diabetes therapy, Age, weight, height, Creatine kinase-MB, serum creatinine, hemoglobin, troponin I, troponin T. | patients undergoing percutaneous coronary intervention (PCI) | an impairment in renal function resulting in a ≥0.5 mg/dl increase in serum creatinine from baseline within a week following the procedure |
Table 2.
Summary of Best Performing ML model with AUC (95%CI) and number of patients in each dataset (Train, Validation, Test).
Table 2.
Summary of Best Performing ML model with AUC (95%CI) and number of patients in each dataset (Train, Validation, Test).
| Reference | Best Performing Model | Training Data set | Validation Data set | Testing Data set | AUC in Training Dataset Mean, (95%CI) |
|||
| With Kidney Complication | Without Kidney Complication | With Kidney Complication | Without Kidney Complication | With Kidney Complication | Without Kidney Complication | |||
| David E. Hamilton et al. 2024 [65] | XGBoost | 1623 | 63052 | 1082 | 42035 | - | - | 0.893 (0.883-0.903) |
| Heejung Choi et al. 2024 [66] | GBM | 1185 | 37296 | 460 | 10645 | - | - | 0.875 (0.853–0.897) |
| Behnoush et al. 2024 [67] | RF | 517 | 3155 | - | - | 129 | 791 | 0.775 (0.730–0.818) |
| Xiao Ma et al. 2023 [68] | SVM | 26 | 142 | - | - | 11 | 61 | 0.821 (0.719 – 0.923) |
| Fangfang Zhou et al. 2023 [69] | NB | 84 | 1477 | - | - | 36 | 633 | 0.774 (0.742, 0.806) |
| Duanbin Li et al. 2022 [70] | RF | 680 | 2828 | - | - | 280 | 1385 | 0.766 (0.737– 0.794) |
| Toshiki Kuno et al. 2022 [71] | Light GBM | 1587 | 15057 | - | - | 213 | 2365 | 0.790 (0.776, 0.804) |
| Hemant Kulkarni et al. 2021 [72] | MLP | 1532 | 19472 | - | - | 482 | 6519 | 0.8175 (0.8023 – 0.8326) |
| Sun L et al. 2020 [73] | RF | 169 | 953 | 57 | 316 | - | - | 0.995 (0.993–0.998) |
| Chenxi Huang et al. 2019 [74] | GAM | 228310 | 1848384 | 112697 | 849146 | - | - | 0.777 (0.775-0.779)1 0.839 (0.837-0.841)2 0.870 (0.867-0.873)3 |
| Liu, Y et al. 2019[75] | RF | 78 | 2350 | 37 | 1004 | - | - | 0.854 (0.796–0.913) |
| Chenxi Huang et al. 2018 [76] | XGBoost | 48878 | 614085 | 20948 | 263180 | - | - | 0.752 (0.749–0.754) |
| Wen-jun Yin et al. 2017[77] | RF | 942 | 6098 | 231 | 1529 | - | - | N.A. |
| Hitinder S. Gurm et al. 2013 [60] | RF | 1243 | 46758 | - | - | 505 | 20067 | 0.839 (0.821 – 0.857) |
1, 2, and 3 are AUC for creatinine level increase ≥ 0.3 mg/dL, creatinine level increase ≥ 0.5 mg/dL, and creatinine level increase ≥ 1.0 mg/dL, respectively. AUC: Area Under the Curve; CI: Confidence Interval; GAM: Generalized Additive Model; GBM: Gradient Boosting Machine; Light GBM: Light Gradient Boosting Machine; MLP: Multi-layer Perceptron; N.A.: Not Available; NB: Naive Bayes; RF: Random Forest; SVM: Support Vector Machine; XGBoost: Extreme Gradient Boosting.
Table 3.
Pooled AUC (95%CI) of each ML model with Subgroup Analysis within Kidney Complications and Included Patients. AUC: Area Under the Curve; AKI: Acute Kidney Injury; CI: Confidence Interval; CI-AKI: Contrast-Induced Acute Kidney Injury; CIN: Contrast-Induced Nephropathy; DT: Decision Tree; GBM: Gradient Boosting Machine; MLP: Multilayer Perceptron; NB: Naive Bayes; PCI: percutaneous coronary intervention; RF: Random Forest; SVM: Support Vector Machine.
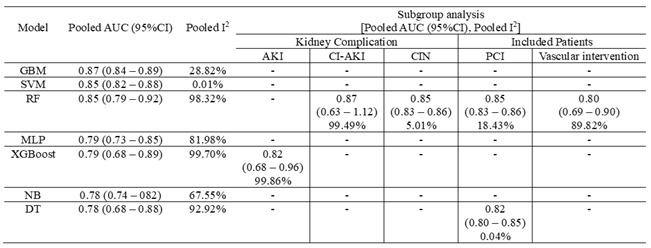 |
Table 4.
Pooled Metrics (Accuracy, Sensitivity, Specificity, and Precision) (95%CI) of each ML model. CI: Confidence Interval; ML: Machine Learning; NB: Naive Bayes; RF: Random Forest; SVM: Support Vector Machine.
Table 4.
Pooled Metrics (Accuracy, Sensitivity, Specificity, and Precision) (95%CI) of each ML model. CI: Confidence Interval; ML: Machine Learning; NB: Naive Bayes; RF: Random Forest; SVM: Support Vector Machine.
 |
3.5. Quality Assessment
Based on the PROBAST criteria, the included studies exhibit variable risk of bias (ROB) and applicability. Participant selection biases were predominantly low in eight studies (57.14%)[60,68,70,71,72,73,75,76], predictor assessment biases were low in nine studies (64.29%)[60,66,67,70,71,74,75,76,77], and outcome assessment biases were low in seven studies (50%)[66,68,71,72,73,75,76]. However, analysis biases were mostly unclear in six studies (42.86%)[65,66,72,73,74,75], indicating potential methodological issues (Figure 9). Overall, four studies (28.57%)[60,71,75,76] demonstrated low ROB across all domains, while six studies (42.86%)[65,66,70,72,73,74] had unclear ROB, and four studies (28.57%)[67,68,69,77] exhibited high ROB. Applicability concerns were generally low, with eleven studies (78.57%)[60,65,66,68,70,71,72,73,74,75,76] showing low concerns, two studies (14.29%)[69,77] with unclear concerns, and one study (7.14%)(67) with high concerns. These findings highlight the robustness of predictor and outcome assessments in many studies, despite some methodological uncertainties in analysis, underscoring the need for careful interpretation of results.
Figure 9.
PROBAST results of included studies.
4. Discussion
Our study is the pioneering research that systematically evaluated the predictive performance of various ML models for assessing kidney complications post-cardiac interventions. GBM and SVM exhibited the highest predictive performance with pooled AUCs of 0.87 and 0.85, respectively, and low heterogeneity. RF, despite a similar AUC, showed high heterogeneity, indicating variable effectiveness. Models like MLP, XGBoost, NB, and DT demonstrated inconsistent performance across studies. Moreover, predictors for kidney complications post-cardiac interventions showed the highest frequency of Age, Creatinine, LVEF, and Hemoglobin among the most significant.
4.1. Pathophysiology of Kidney Complications after PCI
PCI and CAG can cause AKI through multiple mechanisms including hemodynamic changes, inflammatory responses, microemboli, and CIN [78]. Hemodynamic changes, such as transient hypotension and impaired renal autoregulation, decrease renal perfusion, leading to ischemia and acute tubular necrosis[79]. Inflammatory responses, triggered by cytokines like IL-6, TNF-α, and IL-1β, cause endothelial dysfunction, reducing nitric oxide production and increasing vascular resistance[80]. Microemboli from atheroembolic events can occlude renal arterioles, leading to focal ischemia and atheroembolic renal disease (AERD)[81]. CIN results from the direct cytotoxicity of contrast media, which increases intracellular calcium, induces apoptosis and causes oxidative stress via reactive oxygen species (ROS)[82]. Additionally, contrast media increases blood viscosity, exacerbating medullary hypoxia and stabilizing hypoxia-inducible factors (HIFs)(78). These combined effects lead to CI-AKI with tubular obstruction from precipitated contrast media and cellular debris, increased intratubular pressure, and endothelial dysfunction due to reduced nitric oxide and increased endothelin levels[80].
4.2. Predictors of AKI/CIN post-PCI/CAG
ML models have shown promising results in identifying early predictors of AKI and CIN. These models leverage large datasets to uncover complex patterns and interactions between variables that are not apparent through traditional statistical methods. For instance, a study by Mo et al. in 2021 developed a predictive model for CIN using ML techniques, which included baseline uric acid level, creatine kinase-MB level, and log(N-terminal pro-brain natriuretic peptide) level as independent predictors[83].
Another study by Choi et al. in 2024 utilized a gradient boosting machine model to predict AKI, highlighting the importance of pre-catheterization variables such as age, known chronic kidney disease, hematocrit, troponin I, blood urea nitrogen, base excess, and N-terminal pro-brain natriuretic peptide[84].
Identifying early predictors of conditions inducing AKI/CIN is crucial for improving patient outcomes and guiding clinical practices following PCI/CAG. Here, we classify some of these developing predictors based on clinical, biochemical, and procedural factors:
4.2.1. Clinical Predictors
Pre-existing Renal Dysfunction: Baseline renal impairment is a well-established risk factor for AKI and CIN. A multivariate logistic regression analysis by Mehran et al. [52] demonstrated that a baseline creatinine clearance of <60 mL/min was associated with a 20% incidence of CIN post-PCI, significantly higher than in patients with normal renal function (p < 0.001). To be added, most unsupervised models (XGBoost, GBM, and Light GBM) have also been successful in predicting renal failure following PCI by selecting the feature of previous renal insufficiency, both in terms of GFR levels and the history of CKD [65,66,71]. This could be due to unsupervised models’ ability to discover complex patterns, analyze high-dimensional data, detect latent variables, identify outliers, adapt dynamically, and integrate heterogeneous data.
Diabetes Mellitus: Diabetes is associated with microvascular damage and increased oxidative stress, contributing to a higher risk of nephropathy. A study by F. Nassir et al. found that diabetic patients had a three times higher likelihood of developing CIN compared to non-diabetic patients[85]. Additionally, both supervised and unsupervised models incorporate DM as an explicit feature and contribute to the identification of underlying patterns and patient subgroups with similar risk profiles. Multivariable Logistic Regression, LR, and RF models use historical data to learn the association between DM and AKI, factoring in hyperglycemia-induced microvascular damage, increased susceptibility to contrast-induced nephropathy, and heightened systemic inflammation[46,49,60,68]. However, XGBoost, SVM, and DT models can reveal latent relationships and interactions between DM and other clinical variables, such as hypertension, duration of diabetes, and medication use, thus uncovering hidden structures within the data that indicate higher AKI risk [65,68,71,76].
4.2.2. Biochemical Predictors
Cystatin C: This low molecular weight protein is a sensitive biomarker of renal function, independent of muscle mass. Comparative studies have shown that cystatin C is a superior early marker for AKI when compared to traditional biomarkers like serum creatinine. A systematic review and meta-analysis indicated that serum cystatin C had a higher diagnostic odds ratio for predicting AKI[86]. Moreover, the combination of cystatin C with other markers, such as neutrophil gelatinase-associated lipocalin (NGAL), improved the accuracy of AKI detection and prognosis in critically ill patients[87]. In 2023, Xiao Ma et al. [88] showed the superiority of the SVM model in predicting CIN, by considering Cystatin C with other clinical features, with a total AUC value of 0.821, in patients undergoing PCI.
Neutrophil Gelatinase-Associated Lipocalin (NGAL): NGAL is an early biomarker of tubular injury. A meta-analysis by Haase et al. found that NGAL levels measured 2 hours post-contrast exposure had an AUC of 0.85 for predicting AKI, using a bivariate generalized linear model (p < 0.001). This demonstrates NGAL's strong predictive value for early diagnosis of AKI[89].
In 2014, C. Liebetrau et al.[90] evaluated urinary NGAL's different status (baseline, 4 hours after, 1 day, and 2 days after PCI) via Multivariate Cox regression analysis to evaluate the prediction of CI-AKI. They showed that the AUC of the first day, second day, baseline, and 4 hours after PCI, have values of 0.939, 0.688, 0.565, and 0.786, respectively, suggesting the effectiveness of timing urinary NGAL in predicting kidney insufficiency.
Additionally, NGAL has been shown to predict AKI effectively in various clinical settings. For instance, Mishra et al. [91] reported that urine NGAL levels rose significantly within 2 hours after cardiopulmonary bypass surgery in children, correlating strongly with subsequent AKI development. This is an issue that can be considered in the feature selection analysis of future ML studies.
Interleukin (IL) Status: As a pro-inflammatory cytokine, IL-18 is released by renal tubular cells in response to ischemic injury. Wybraniec et al.[92] found that post-procedural IL-18 levels were strong predictors of CI-AKI. This study demonstrated that incorporating IL-18 into predictive models enhanced the early diagnosis of AKI. This is in line with another relevant study, conducted by Musiał et al. that utilized an RF Classifier model to predict AKI based on IL-18, showing its potential in early detection and prognosis[93].
4.2.3. Preprocedural Predictors
Contrast Volume: High contrast volumes contribute to CIN through direct tubular epithelial cell toxicity, medullary hypoxia from increased oxygen demand and vasoconstriction, oxidative stress due to elevated ROS, an inflammatory response, and tubular obstruction from necrotic debris [96,97,98,99,100].
Supervised ML models, such as MLR, have advanced CIN risk prediction by handling interactions between multiple independent variables and a binary dependent variable, such as contrast volume and other risk factors for CIN. In 2004, Mehran et al.[52] introduced the Mehran CIN Risk Scoring System which was initially validated for non-urgent PCI procedures in patients undergoing angioplasty. However, its utility in predicting outcomes had not been previously assessed. Additionally, the score includes eight clinical and procedural variables (hypotension, intra-aortic balloon pump, congestive heart failure, chronic kidney disease, diabetes, age >75 years, anemia, and volume of contrast), making it complex for practical clinical use. A prospective cohort in 2020 by Zhi-Feng Yao et al.[48] established four independent variables (LVEF < 40%, acute coronary syndrome (ACS), eGFR < 60, and contrast volume > 300 mL) that significantly increased the CIN predicting score by 5.9%, 32.9%, and 60.0%, in low-, moderate- and high-risk groups patients, respectively.
Prolonged Procedural Time: Longer durations of PCI/CAG are associated with increased exposure to contrast media and greater procedural complexity, both of which heighten the risk of renal injury. McCullough et al.[101] demonstrated that procedures lasting longer than 90 minutes were associated with a 25% increased risk of CIN (p < 0.05).
In 2023, an SVM was developed by Ma et al.[88] which incorporated procedural time, among other clinical variables. These models are effective in high-dimensional spaces and are used when the relationship between predictors and the outcome is complex and non-linear. However, correlation analysis showed no significant difference between with and without CIN patients in terms of the procedure duration (p=0.242).
Type of Contrast Media: Iso-osmolar contrast agents are generally less nephrotoxic than low-osmolar agents. Solomon et al.[102] reported that the use of low-osmolar contrast media reduced the incidence of all adverse events (including CIN) by nearly 3 times less than iso-osmolar agents (p < 0.05). However, others claim contradictory findings by showing that CIN is less likely to develop in high-risk patients when iodixanol is used rather than a low-osmolar, nonionic contrast medium, that statistically is no difference between these two groups as well [103,104]. So, it is necessary to conduct analyses using ML models to understand the significance of this factor in predicting the occurrence of CIN.
4.3. Best performing ML Model
Our pooled analysis of each ML model’s AUC revealed that the GBM algorithm, known for its high accuracy and robustness, has superior predictive capabilities in this clinical setting (pooled AUC= 0.87; 95%CI= (0.84 – 0.89); pooled I2= 28.82%). This unsupervised machine works by creating an ensemble of weak prediction models, typically decision trees, and optimizing them to correct errors from previous models. The following features are often included in the model for predicting AKI/CIN: (1) Patient demographics: Age, gender; (2) Clinical history: Diabetes, hypertension, prior kidney function; (3) Procedure details: Contrast volume, procedure duration; and (4) Laboratory results: Baseline serum creatinine, eGFR, hemoglobin levels.
Studies have demonstrated that GBM models show better discrimination than traditional LR models(3). Besides, these models provide better-calibrated risk predictions, which is essential for clinical decision-making(4). Moreover, GBM can handle numerous predictor variables and complex interactions between them, enhancing its predictive power. This is in line with the results of a study utilizing 13 variables that showed significantly better performance compared to a baseline model with fewer variables(3). Consequently, the GBM's ability to incorporate various types of data, including clinical and procedural details, makes it highly versatile and robust across different patient populations and clinical settings[105].
4.4. Study Limitations
The application of ML models for predicting AKI in patients undergoing PCI is still emerging, with limited publications on this topic, likely due to our search criteria focusing on English-language studies. High heterogeneity among the included studies affected the consistency and comparability of the results, and our meta-analysis may lack the statistical power to detect subtle differences between ML models due to variability in study design and reporting standards.
External validation of ML models was insufficiently addressed, with few studies performing such validations, limiting the generalizability of our findings. A comparison of ML models with traditional statistical models in both internal and external validation processes would have provided clearer insights into their predictive capabilities. Practical implementation of ML models in clinical settings remains challenging due to data collection feasibility and model application complexities.
Our bias assessment, using the PROBAST tool, identified issues, particularly in the outcome assessment and analysis domains. The variability in data splitting methods and diagnostic criteria contributed to unclear or high risks of bias. Despite these limitations, bias assessment is essential, and there is a need for a bias assessment tool specifically tailored to ML studies.
Future research should focus on larger, more diverse datasets, and prospectively evaluate ML model performance against traditional statistical models to enhance robustness and generalizability. Addressing practical challenges in real-world implementation will be critical for the widespread adoption of ML models in clinical practice.
5. Conclusion
Our systematic review and meta-analysis demonstrate the robustness of ML models in predicting AKI in PCI patients, with GBM achieving the highest pooled AUC of 0.87. Despite high study heterogeneity and insufficient external validation, ML models show superior predictive performance over traditional methods. Key predictive features include age, creatinine levels, diabetes, and heart failure. Pooled analyses highlight the strong performance of SVM in balanced sensitivity and specificity, and RF in overall accuracy. Future research should enhance real-world applicability, validate models externally, and address implementation challenges to integrate ML into clinical practice.
Supplementary Materials
The following supporting information can be downloaded at the website of this paper posted on Preprints.org.
Author Contributions
[S.N.] and [D.N.D.]: manuscript writing, data screening, and extraction, quality assessment; [D.Sh.] supervision of data extraction and screening; [A.A.] and [D.Sh.]: editing the manuscript; [S.N.]: database systematic search and statistical analysis. All authors read and approved the final manuscript.
Funding
We do not have any financial support for this study.
Institutional Review Board Statement
Not applicable.
Informed Consent Statement
Not applicable.
Data Availability Statement
The datasets analyzed during the current study are available upon request with no restriction.
Conflicts of Interest
The authors declare that they have no known competing financial interests or personal relationships that could have appeared to influence the work reported in this paper.
List of abbreviations
ACS: Acute Coronary Syndrome; AERD: Atheroembolic Renal Disease; AKI: Acute Kidney Injury; AKIN: Acute Kidney Injury Network; AMI: Acute Myocardial Infarction; AUC: Area Under the Curve; AUROC: Area Under the Receiver Operating Characteristic curve; BMI: Body Mass Index; CAG: Coronary Angiography; CI: Confidence Interval; CI-AKI: Contrast-Induced Acute Kidney Injury; CIN: Contrast-Induced Nephropathy; CKD: Chronic Kidney Disease; DM: Diabetes Mellitus; DT: Decision Tree; eGFR: Estimated Glomerular Filtration Rate; EHR: Electronic Health Records; FN: False Negative; FP: False Positive; GBM: Gradient Boosting Machine; IL – Interleukin; LR: Logistic Regression Machine Learning: ML; MLP: Multilayer Perceptron; MLR: Multivariable Logistic Regression; NB: Naive Bayes; NGAL: Neutrophil Gelatinase-Associated Lipocalin; NT-proBNP: N-terminal pro-brain natriuretic peptide; PCI: Percutaneous Coronary Intervention; PRISMA: Preferred Reporting Items for Systematic Reviews and Meta-Analyses; PROBAST: Prediction model Risk Of Bias Assessment Tool; RF: Random Forest; ROB: Risk of Bias; ROS: Reactive Oxygen Species; SE: Standard Error; SVM: Support Vector Machine; TN: True Negative; TP: True Positive
References
- Xiao, C.; Guo, Y.; Zhao, K.; Liu, S.; He, N.; He, Y.; et al. Prognostic Value of Machine Learning in Patients with Acute Myocardial Infarction. Journal of Cardiovascular Development and Disease. 2022, 9. [Google Scholar] [CrossRef]
- Tofighi, S.; Poorhosseini, H.; Jenab, Y.; Alidoosti, M.; Sadeghian, M.; Mehrani, M.; et al. Comparison of machine-learning models for the prediction of 1-year adverse outcomes of patients undergoing primary percutaneous coronary intervention for acute ST-elevation myocardial infarction. Clinical Cardiology. 2023, 47. [Google Scholar] [CrossRef]
- Huang, C.; Murugiah, K.; Mahajan, S.; Li, S.-X.; Dhruva, S.S.; Haimovich, J.S.; et al. Enhancing the prediction of acute kidney injury risk after percutaneous coronary intervention using machine learning techniques: A retrospective cohort study. PLoS Medicine. 2018, 15. [Google Scholar] [CrossRef]
- Niimi, N.; Shiraishi, Y.; Sawano, M.; Ikemura, N.; Inohara, T.; Ueda, I.; et al. Machine learning models for prediction of adverse events after percutaneous coronary intervention. Scientific Reports. 2021, 12. [Google Scholar] [CrossRef]
- Brown, J.R.; Mackenzie, T.; Maddox, T.M.; Fly, J.; Tsai, T.; Plomondon, M.E.; et al. Acute Kidney Injury Risk Prediction in Patients Undergoing Coronary Angiography in a National Veterans Health Administration Cohort With External Validation. Journal of the American Heart Association: Cardiovascular and Cerebrovascular Disease 2015, 4. [Google Scholar] [CrossRef]
- Tseng, P.-Y.; Chen, Y.-T.; Wang, C.-H.; Chiu, K.M.; Peng, Y.-S.; Hsu, S.-P.; et al. Prediction of the development of acute kidney injury following cardiac surgery by machine learning. Critical Care. 2020, 24. [Google Scholar] [CrossRef]
- Zhou, Y.; Feng, J.; Mei, S.; Zhong, H.; Tang, R.C.P.; Xing, S.; et al. MACHINE LEARNING MODELS FOR PREDICTING ACUTE KIDNEY INJURY IN PATIENTS WITH SEPSIS-ASSOCIATED ACUTE RESPIRATORY DISTRESS SYNDROME. Shock. 2023, 59, 352–359. [Google Scholar] [CrossRef]
- Peng, X.; Li, L.; Wang, X.; Zhang, H. A Machine Learning-Based Prediction Model for Acute Kidney Injury in Patients With Congestive Heart Failure. Frontiers in Cardiovascular Medicine. 2022, 9. [Google Scholar] [CrossRef]
- Gao, Y.; Wang, C.; Dong, W.; Li, B.; Wang, J.; Li, J.; et al. An Explainable Machine Learning Model to Predict Acute Kidney Injury After Cardiac Surgery: A Retrospective Cohort Study. Clinical Epidemiology. 2023, 15, 1145–1157. [Google Scholar] [CrossRef]
- Mo, H.; Ye, F.; Chen, D.; Wang, Q.; Liu, R.; Zhang, P.; et al. A predictive model based on a new CI-AKI definition to predict contrast induced nephropathy in patients with coronary artery disease with relatively normal renal function. Frontiers in cardiovascular medicine. 2021, 8, 762576. [Google Scholar] [CrossRef] [PubMed]
- Engelhard, M.M.; Navar, A.M.; Pencina, M.J. Incremental benefits of machine learning—When do we need a better mousetrap? JAMA cardiology. 2021, 6, 621–623. [Google Scholar] [CrossRef] [PubMed]
- Christodoulou, E.; Ma, J.; Collins, G.S.; Steyerberg, E.W.; Verbakel, J.Y.; Van Calster, B. A systematic review shows no performance benefit of machine learning over logistic regression for clinical prediction models. Journal of clinical epidemiology. 2019, 110, 12–22. [Google Scholar] [CrossRef]
- Page, M.J.; McKenzie, J.E.; Bossuyt, P.M.; Boutron, I.; Hoffmann, T.C.; Mulrow, C.D.; et al. The PRISMA 2020 statement: An updated guideline for reporting systematic reviews. bmj. 2021, 372. [Google Scholar]
- Moons, K.G.; Wolff, R.F.; Riley, R.D.; Whiting, P.F.; Westwood, M.; Collins, G.S.; et al. PROBAST: A tool to assess risk of bias and applicability of prediction model studies: Explanation and elaboration. Annals of internal medicine. 2019, 170, W1–W33. [Google Scholar] [CrossRef]
- Steyerberg, E.W.; Vickers, A.J.; Cook, N.R.; Gerds, T.; Gonen, M.; Obuchowski, N.; et al. Assessing the performance of prediction models: A framework for traditional and novel measures. Epidemiology. 2010, 21, 128–138. [Google Scholar] [CrossRef]
- Higgins, J.P.; Thompson, S.G.; Deeks, J.J.; Altman, D.G. Measuring inconsistency in meta-analyses. Bmj. 2003, 327, 557–560. [Google Scholar] [CrossRef] [PubMed]
- Hanley, J.A.; McNeil, B.J. The meaning and use of the area under a receiver operating characteristic (ROC) curve. Radiology. 1982, 143, 29–36. [Google Scholar] [CrossRef]
- Cai, D.; Xiao, T.; Zou, A.; Mao, L.; Chi, B.; Wang, Y.; et al. Predicting acute kidney injury risk in acute myocardial infarction patients: An artificial intelligence model using medical information mart for intensive care databases. Frontiers in cardiovascular medicine. 2022, 9, 964894. [Google Scholar] [CrossRef]
- Che, M.; Wang, X.; Liu, S.; Xie, B.; Xue, S.; Yan, Y.; et al. A clinical score to predict severe acute kidney injury in Chinese patients after cardiac surgery. Nephron. 2019, 142, 291–300. [Google Scholar] [CrossRef]
- Chiofolo, C.; Chbat, N.; Ghosh, E.; Eshelman, L.; Kashani, K., editors. Automated continuous acute kidney injury prediction and surveillance: A random forest model. Mayo Clinic Proceedings; 2019: Elsevier.
- Cox, M.; Panagides, J.; Di Capua, J.; Dua, A.; Kalva, S.; Kalpathy-Cramer, J.; Daye, D. An interpretable machine learning model for the prevention of contrast-induced nephropathy in patients undergoing lower extremity endovascular interventions for peripheral arterial disease. Clinical Imaging. 2023, 101, 1–7. [Google Scholar] [CrossRef]
- Du, Y.; Wang, X.-Z.; Wu, W.-D.; Shi, H.-P.; Yang, X.-J.; Wu, W.-J.; Chen, S.-X. Predicting the risk of acute kidney injury in patients after percutaneous coronary intervention (PCI) or cardiopulmonary bypass (CPB) surgery: Development and assessment of a nomogram prediction model. Medical Science Monitor: International Medical Journal of Experimental and Clinical Research. 2021, 27, e929791-1. [Google Scholar] [CrossRef] [PubMed]
- Tao, F.; Yang, H.; Wang, W.; Bi, X.; Dai, Y.; Zhu, A.; Guo, P. Acute kidney injury prediction model utility in premature myocardial infarction. Iscience 2024, 27. [Google Scholar] [CrossRef] [PubMed]
- Thongprayoon, C.; Hansrivijit, P.; Bathini, T.; Vallabhajosyula, S.; Mekraksakit, P.; Kaewput, W.; Cheungpasitporn, W. Predicting acute kidney injury after cardiac surgery by machine learning approaches. MDPI; 2020. p. 1767.
- Wu, L.; Hu, Y.; Liu, X.; Zhang, X.; Chen, W.; Yu, A.S.; et al. Feature ranking in predictive models for hospital-acquired acute kidney injury. Scientific reports. 2018, 8, 17298. [Google Scholar] [CrossRef] [PubMed]
- Yun, D.; Cho, S.; Kim, Y.C.; Kim, D.K.; Oh, K.-H.; Joo, K.W.; et al. Use of deep learning to predict acute kidney injury after intravenous contrast media administration: Prediction model development study. JMIR Medical Informatics. 2021, 9, e27177. [Google Scholar] [CrossRef] [PubMed]
- Zheng, S.; Li, Y.; Luo, C.; Chen, F.; Ling, G.; Zheng, B. Machine Learning for Predicting the Development of Postoperative Acute Kidney Injury After Coronary Artery Bypass Grafting Without Extracorporeal Circulation. Cardiovascular Innovations and Applications 2023, 7. [Google Scholar] [CrossRef]
- Al'Aref, S.J.; Singh, G.; van Rosendael, A.R.; Kolli, K.K.; Ma, X.; Maliakal, G.; et al. Determinants of in-hospital mortality after percutaneous coronary intervention: A machine learning approach. Journal of the American Heart Association. 2019, 8, e011160. [Google Scholar] [CrossRef] [PubMed]
- Huang, Y.-C.; Chen, K.-Y.; Li, S.-J.; Liu, C.-K.; Lin, Y.-C.; Chen, M. Implementing an ensemble learning model with feature selection to predict mortality among patients who underwent three-vessel percutaneous coronary intervention. Applied Sciences. 2022, 12, 8135. [Google Scholar] [CrossRef]
- Kuno, T.; Numasawa, Y.; Mikami, T.; Niimi, N.; Sawano, M.; Kodaira, M.; et al. Association of decreasing hemoglobin levels with the incidence of acute kidney injury after percutaneous coronary intervention: A prospective multi-center study. Heart and vessels. 2021, 36, 330–336. [Google Scholar] [CrossRef] [PubMed]
- Li, Y.; Chan, T.-M.; Feng, J.; Tao, L.; Jiang, J.; Zheng, B.; et al. A pattern-discovery-based outcome predictive tool integrated with clinical data repository: Design and a case study on contrast related acute kidney injury. BMC medical informatics and decision making. 2022, 22, 103. [Google Scholar] [CrossRef]
- Matheny, M.E.; Miller, R.A.; Ikizler, T.A.; Waitman, L.R.; Denny, J.C.; Schildcrout, J.S.; et al. Development of inpatient risk stratification models of acute kidney injury for use in electronic health records. Medical Decision Making. 2010, 30, 639–650. [Google Scholar] [CrossRef]
- Wang, J.; Wang, S.; Zhu, M.X.; Yang, T.; Yin, Q.; Hou, Y. Risk prediction of major adverse cardiovascular events occurrence within 6 months after coronary revascularization: Machine learning study. JMIR Medical Informatics. 2022, 10, e33395. [Google Scholar] [CrossRef] [PubMed]
- Weisenthal, S.J.; Quill, C.; Farooq, S.; Kautz, H.; Zand, M.S. Predicting acute kidney injury at hospital re-entry using high-dimensional electronic health record data. PLoS ONE. 2018, 13, e0204920. [Google Scholar] [CrossRef] [PubMed]
- Zhang, X.; Liu, T.; Tian, C. Artificial Intelligence Algorithm-Based Computed Tomography Image in Assessment of Acute Renal Insufficiency of Patients Undergoing Percutaneous Coronary Intervention. Contrast Media & Molecular Imaging. 2022, 2022, 2214583. [Google Scholar]
- Zhu, X.; Zhang, P.; Jiang, H.; Kuang, J.; Wu, L. Using the Super Learner algorithm to predict risk of major adverse cardiovascular events after percutaneous coronary intervention in patients with myocardial infarction. BMC Medical Research Methodology. 2024, 24, 59. [Google Scholar] [CrossRef] [PubMed]
- Chen P-y Liu, Y.; Chen, S.; Xian, Y.; Chen, J.-y.; Tan, N. A NOVEL TOOL FOR PRE-PROCEDURAL RISK STRATIFICATION FOR CONTRAST-INDUCED NEPHROPATHY AND ASSOCIATIONS BETWEEN HYDRATION VOLUME AND CLINICAL OUTCOMES FOLLOWING CORONARY ANGIOGRAPHY AT DIFFERENT RISK LEVELS. Journal of the American College of Cardiology. 2018, 71. [Google Scholar]
- Fanous, H.; Mohammad, K.O.; Patel, A.P.; Liu, Y. SIMPLIFYING HEART-CATHETERIZATION, CONTRAST-INDUCED ACUTE KIDNEY INJURY PREDICTIVE MODELS, USING MACHINE LEARNING. Journal of the American College of Cardiology. 2023. [Google Scholar] [CrossRef]
- Kuno, T.; Mikami, T.; Sahashi, Y.; Numasawa, Y.; Suzuki, M.; Noma, S.; et al. TCT-332 Machine Learning Methods in Prediction of Acute Kidney Injury: Application of the US National Cardiovascular Data Registry Model on Japanese Percutaneous Coronary Intervention Patients. Journal of the American College of Cardiology. 2021. [Google Scholar] [CrossRef]
- Lu, Y.; Zhou, F.; Xu, Y.; Zhang, S.; Luo, Q. The Correlation Between Neutrophil-to-Lymphocyte Ratio and Contrast-Induced AKI and Establishment of New Predictive Models by Machine Learning: FR-PO077. Journal of the American Society of Nephrology. 2022, 33, 348. [Google Scholar] [CrossRef]
- Tsutsui, R.S.; Johnston, J.D.; Felix, C.; Alberts, J.L.; Reed, G.W.; Puri, R.; et al. TCT-615 A Supervised Machine Learning Approach for Predicting Acute Kidney Injury Following Percutaneous Coronary Intervention. Journal of the American College of Cardiology. 2019. [Google Scholar] [CrossRef]
- Yuan, N.; Ebinger, J. A New Multivariate Model for Safe Contrast Limits to Prevent Contrast Induced Nephropathy After Percutaneous Coronary Intervention. Circulation 2019, 140 (Suppl_1), A15026-A. [Google Scholar]
- Dodson, J.A.; Hajduk, A.; Curtis, J.; Geda, M.; Krumholz, H.M.; Song, X.; et al. Acute kidney injury among older patients undergoing coronary angiography for acute myocardial infarction: The SILVER-AMI study. The American Journal of Medicine. 2019, 132, e817–e26. [Google Scholar] [CrossRef] [PubMed]
- Ma, B.; Allen, D.W.; Graham, M.M.; Har, B.J.; Tyrrell, B.; Tan, Z.; et al. Comparative performance of prediction models for contrast-associated acute kidney injury after percutaneous coronary intervention. Circulation: Cardiovascular Quality and Outcomes. 2019, 12, e005854. [Google Scholar] [CrossRef] [PubMed]
- Yu, S.; Li, Q.; He, Y.; Jia, C.; Liang, G.; Lu, H.; et al. Comparison of cardiac biomarkers on risk assessment of contrast-associated acute kidney injury in patients undergoing cardiac catheterization: A multicenter retrospective study. Nephrology. 2023, 28, 588–596. [Google Scholar] [CrossRef] [PubMed]
- Qiu, H.; Zhu, Y.; Shen, G.; Wang, Z.; Li, W. A predictive model for contrast-induced acute kidney injury after percutaneous coronary intervention in elderly patients with ST-segment elevation myocardial infarction. Clinical Interventions in Aging. 2023, 453–465–465. [Google Scholar] [CrossRef] [PubMed]
- Uzendu, A.; Kennedy, K.; Chertow, G.; Amin, A.P.; Giri, J.S.; Rymer, J.A.; et al. Contemporary methods for predicting acute kidney injury after coronary intervention. Cardiovascular Interventions. 2023, 16, 2294–2305. [Google Scholar] [CrossRef] [PubMed]
- Yao, Z.F.; Shen, H.; Tang, M.N.; Yan, Y.; Ge, J.B. A novel risk assessment model of contrast-induced nephropathy after percutaneous coronary intervention in patients with diabetes. Basic & clinical pharmacology & toxicology. 2021, 128, 305–314. [Google Scholar]
- Ibrahim, N.E.; McCarthy, C.P.; Shrestha, S.; Gaggin, H.K.; Mukai, R.; Magaret, C.A.; et al. A clinical, proteomics, and artificial intelligence-driven model to predict acute kidney injury in patients undergoing coronary angiography. Clinical cardiology. 2019, 42, 292–298. [Google Scholar] [CrossRef] [PubMed]
- Brown, J.R.; MacKenzie, T.A.; Maddox, T.M.; Fly, J.; Tsai, T.T.; Plomondon, M.E.; et al. Acute kidney injury risk prediction in patients undergoing coronary angiography in a national veterans health administration cohort with external validation. Journal of the American Heart Association. 2015, 4, e002136. [Google Scholar] [CrossRef]
- Tsai, T.T.; Patel, U.D.; Chang, T.I.; Kennedy, K.F.; Masoudi, F.A.; Matheny, M.E.; et al. Validated contemporary risk model of acute kidney injury in patients undergoing percutaneous coronary interventions: Insights from the National Cardiovascular Data Registry Cath-PCI Registry. Journal of the American Heart Association. 2014, 3, e001380. [Google Scholar] [CrossRef]
- Mehran, R.; Aymong, E.D.; Nikolsky, E.; Lasic, Z.; Iakovou, I.; Fahy, M.; et al. A simple risk score for prediction of contrast-induced nephropathy after percutaneous coronary intervention: Development and initial validation. Journal of the American College of Cardiology. 2004, 44, 1393–1399. [Google Scholar] [CrossRef]
- Chen, Y.-Y.; Liu, C.-F.; Shen, Y.-T.; Kuo, Y.-T.; Ko, C.-C.; Chen, T.-Y.; et al. Development of real-time individualized risk prediction models for contrast associated acute kidney injury and 30-day dialysis after contrast enhanced computed tomography. European Journal of Radiology. 2023, 167, 111034. [Google Scholar] [CrossRef] [PubMed]
- Victor, S.M.; Gnanaraj, A.; VijayaKumar, S.; Deshmukh, R.; Kandasamy, M.; Janakiraman, E.; et al. Risk scoring system to predict contrast induced nephropathy following percutaneous coronary intervention. indian heart journal. 2014, 66, 517–524. [Google Scholar] [CrossRef] [PubMed]
- Bartholomew, B.A.; Harjai, K.J.; Dukkipati, S.; Boura, J.A.; Yerkey, M.W.; Glazier, S.; et al. Impact of nephropathy after percutaneous coronary intervention and a method for risk stratification. The American journal of cardiology 2004, 93, 1515–1519. [Google Scholar] [CrossRef] [PubMed]
- Chen, Y.L.; Fu, N.K.; Xu, J.; Yang, S.C.; Li, S.; Liu, Y.Y.; Cong, H.L. A simple preprocedural score for risk of contrast-induced acute kidney injury after percutaneous coronary intervention. Catheterization and Cardiovascular Interventions. 2014, 83, E8–E16. [Google Scholar] [CrossRef]
- Fu, N.; Li, X.; Yang, S.; Chen, Y.; Li, Q.; Jin, D.; Cong, H. Risk score for the prediction of contrast-induced nephropathy in elderly patients undergoing percutaneous coronary intervention. Angiology. 2013, 64, 188–194. [Google Scholar] [CrossRef] [PubMed]
- Gao, Y.-m.; Li, D.; Cheng, H.; Chen, Y.-p. Derivation and validation of a risk score for contrast-induced nephropathy after cardiac catheterization in Chinese patients. Clinical and experimental nephrology. 2014, 18, 892–898. [Google Scholar] [CrossRef] [PubMed]
- Ghani, A.A.; Tohamy, K.Y. Risk score for contrast induced nephropathy following percutaneous coronary intervention. Saudi Journal of Kidney Diseases and Transplantation. 2009, 20, 240–245. [Google Scholar] [PubMed]
- Gurm, H.S.; Seth, M.; Kooiman, J.; Share, D. A novel tool for reliable and accurate prediction of renal complications in patients undergoing percutaneous coronary intervention. Journal of the American College of Cardiology. 2013, 61, 2242–2248. [Google Scholar] [CrossRef] [PubMed]
- Liu, Y.; Liu, Y.-h.; Chen, J.-y.; Tan, N.; Zhou, Y.-l.; Li, H.-l.; et al. A simple pre-procedural risk score for contrast-induced nephropathy among patients with chronic total occlusion undergoing percutaneous coronary intervention. International journal of cardiology. 2015, 180, 69–71. [Google Scholar] [CrossRef]
- Maioli, M.; Toso, A.; Gallopin, M.; Leoncini, M.; Tedeschi, D.; Micheletti, C.; Bellandi, F. Preprocedural score for risk of contrast-induced nephropathy in elective coronary angiography and intervention. Journal of cardiovascular medicine. 2010, 11, 444–449. [Google Scholar] [CrossRef]
- Marenzi, G.; Lauri, G.; Assanelli, E.; Campodonico, J.; De Metrio, M.; Marana, I.; et al. Contrast-induced nephropathy in patients undergoing primary angioplasty for acute myocardial infarction. Journal of the American College of Cardiology. 2004, 44, 1780–1785. [Google Scholar] [CrossRef] [PubMed]
- Tziakas, D.; Chalikias, G.; Stakos, D.; Altun, A.; Sivri, N.; Yetkin, E.; et al. Validation of a new risk score to predict contrast-induced nephropathy after percutaneous coronary intervention. The American journal of cardiology. 2014, 113, 1487–1493. [Google Scholar] [CrossRef] [PubMed]
- Hamilton, D.E.; Albright, J.; Seth, M.; Painter, I.; Maynard, C.; Hira, R.S.; et al. Merging machine learning and patient preference: A novel tool for risk prediction of percutaneous coronary interventions. European Heart Journal. 2024, 45, 601–609. [Google Scholar] [CrossRef] [PubMed]
- Choi, H.; Choi, B.; Han, S.; Lee, M.; Shin, G.-T.; Kim, H.; et al. Applicable Machine Learning Model for Predicting Contrast-induced Nephropathy Based on Pre-catheterization Variables. Internal Medicine. 2024, 63, 773–780. [Google Scholar] [CrossRef] [PubMed]
- Behnoush, A.H.; Shariatnia, M.M.; Khalaji, A.; Asadi, M.; Yaghoobi, A.; Rezaee, M.; et al. Predictive modeling for acute kidney injury after percutaneous coronary intervention in patients with acute coronary syndrome: A machine learning approach. European Journal of Medical Research. 2024, 29, 76. [Google Scholar] [CrossRef] [PubMed]
- Ma, X.; Mo, C.; Li, Y.; Chen, X.; Gui, C. Prediction of the development of contrast-induced nephropathy following percutaneous coronary artery intervention by machine learning. Acta Cardiologica. 2023, 78, 912–921. [Google Scholar] [CrossRef]
- Zhou, F.; Lu, Y.; Xu, Y.; Li, J.; Zhang, S.; Lin, Y.; Luo, Q. Correlation between neutrophil-to-lymphocyte ratio and contrast-induced acute kidney injury and the establishment of machine-learning-based predictive models. Renal Failure. 2023, 45, 2258983. [Google Scholar] [CrossRef] [PubMed]
- Li, D.; Jiang, H.; Yang, X.; Lin, M.; Gao, M.; Chen, Z.; et al. An online pre-procedural nomogram for the prediction of contrast-associated acute kidney injury in patients undergoing coronary angiography. Frontiers in Medicine. 2022, 9, 839856. [Google Scholar] [CrossRef] [PubMed]
- Kuno, T.; Mikami, T.; Sahashi, Y.; Numasawa, Y.; Suzuki, M.; Noma, S.; et al. Machine learning prediction model of acute kidney injury after percutaneous coronary intervention. Scientific reports. 2022, 12, 749. [Google Scholar] [CrossRef]
- Kulkarni, H.; Amin, A.P. Artificial intelligence in percutaneous coronary intervention: Improved risk prediction of PCI-related complications using an artificial neural network. BMJ Innovations 2021, 7. [Google Scholar] [CrossRef]
- Sun, L.; Zhu, W.; Chen, X.; Jiang, J.; Ji, Y.; Liu, N.; et al. Machine learning to predict contrast-induced acute kidney injury in patients with acute myocardial infarction. Frontiers in medicine. 2020, 7, 592007. [Google Scholar] [CrossRef] [PubMed]
- Huang, C.; Li, S.-X.; Mahajan, S.; Testani, J.M.; Wilson, F.P.; Mena, C.I.; et al. Development and validation of a model for predicting the risk of acute kidney injury associated with contrast volume levels during percutaneous coronary intervention. JAMA network open. 2019, 2, e1916021–e. [Google Scholar] [CrossRef] [PubMed]
- Liu, Y.; Chen, S.; Ye, J.; Xian, Y.; Wang, X.; Xuan, J.; et al. Random forest for prediction of contrast-induced nephropathy following coronary angiography. The International Journal of Cardiovascular Imaging. 2020, 36, 983–991. [Google Scholar] [CrossRef] [PubMed]
- Huang, C.; Murugiah, K.; Mahajan, S.; Li, S.-X.; Dhruva, S.S.; Haimovich, J.S.; et al. Enhancing the prediction of acute kidney injury risk after percutaneous coronary intervention using machine learning techniques: A retrospective cohort study. PLoS medicine. 2018, 15, e1002703. [Google Scholar] [CrossRef] [PubMed]
- Yin, W.j.; Yi, Y.h.; Guan, X.f.; Zhou, L.y.; Wang, J.l.; Li, D.y.; Zuo, X.c. Preprocedural Prediction Model for Contrast-Induced Nephropathy Patients. Journal of the American Heart Association. 2017, 6, e004498. [Google Scholar] [CrossRef] [PubMed]
- Kashani, K.B.; Levin, A.; Schetz, M. Contrast-associated acute kidney injury is a myth: We are not sure. Intensive Care Medicine. 2017, 44, 110–114. [Google Scholar] [CrossRef]
- Sreenivasan, J.; Zhuo, M.; Khan, M.T.; Fugar, S.; Li, H.; Desai, P.V.; et al. ANEMIA AND PERIPROCEDURAL DROP IN HEMOGLOBIN AS A RISK FACTOR FOR CONTRAST-INDUCED ACUTE KIDNEY INJURY IN PATIENTS UNDERGOING CORONARY ANGIOGRAM (CA) AND/OR PERCUTANEOUS CORONARY INTERVENTION (PCI). Journal of the American College of Cardiology. 2018, 71. [Google Scholar] [CrossRef]
- Yuan, Y.; Qiu, H.; Hu, X.; Luo, T.; Gao, X.; Zhao, X.; et al. Predictive value of inflammatory factors on contrast-induced acute kidney injury in patients who underwent an emergency percutaneous coronary intervention. Clinical cardiology. 2017, 40, 719–725. [Google Scholar] [CrossRef] [PubMed]
- Ma, G.-z.; Yu, D.-q.; Cai, Z.-x.; Ni, C.-m.; Xu, R.-h.; Lan, B.; et al. Contrast-induced nephropathy in postmenopausal women undergoing percutaneous coronary intervention for acute myocardial infarction. The Tohoku journal of experimental medicine. 2010, 221, 211–21. [Google Scholar] [CrossRef]
- Kurtul, A.; Gok, M.; Esenboğa, K. Prognostic Nutritional Index Predicts Contrast-Associated Acute Kidney Injury in Patients with ST-Segment Elevation Myocardial Infarction. Acta Cardiologica Sinica. 2021, 37, 496–503. [Google Scholar]
- Mo, H.; Ye, F.; Chen, D.; Wang, Q.; Liu, R.; Zhang, P.; et al. A Predictive Model Based on a New CI-AKI Definition to Predict Contrast Induced Nephropathy in Patients With Coronary Artery Disease With Relatively Normal Renal Function. Frontiers in Cardiovascular Medicine. 2021, 8. [Google Scholar] [CrossRef] [PubMed]
- Choi, H.; Choi, B.H.; Han, S.; Lee, M.-J.; Shin, G.-T.; Kim, H.; et al. Applicable Machine Learning Model for Predicting Contrast-induced Nephropathy Based on Pre-catheterization Variables. Internal Medicine. 2023, 63, 773–780. [Google Scholar] [CrossRef] [PubMed]
- Nassir, F. Contrast-induced nephropathy in diabetic and non-diabetic patients after coronary intervention. J Babylon Univ/Pure Appl Sci. 2014, 22, 2530–2546. [Google Scholar]
- Bao, W.; Lu, B.; Sheng, X.; Jin, N. Cystatin C in prediction of acute kidney injury: A systemic review and meta-analysis. American journal of kidney diseases : The official journal of the National Kidney Foundation. 2011, 58, 356–365. [Google Scholar]
- Deng, Y.; Chi, R.; Chen S-l Ye, H.; Yuan, J.; Wang, L.; et al. Evaluation of clinically available renal biomarkers in critically ill adults: A prospective multicenter observational study. Critical Care. 2017, 21. [Google Scholar] [CrossRef] [PubMed]
- . !!! INVALID CITATION !!!
- Haase, M.; Bellomo, R.; Devarajan, P.; Schlattmann, P.; Haase-Fielitz, A. Accuracy of neutrophil gelatinase-associated lipocalin (NGAL) in diagnosis and prognosis in acute kidney injury: A systematic review and meta-analysis. American journal of kidney diseases : The official journal of the National Kidney Foundation. 2009, 54, 1012–1024. [Google Scholar] [CrossRef] [PubMed]
- Liebetrau, C.; Gaede, L.; Doerr, O.; Blumenstein, J.; Rixe, J.; Teichert, O.; et al. Neutrophil gelatinase-associated lipocalin (NGAL) for the early detection of contrast-induced nephropathy after percutaneous coronary intervention. Scandinavian Journal of Clinical and Laboratory Investigation. 2014, 74, 81–88. [Google Scholar]
- Mishra, J.; Dent, C.L.; Tarabishi, R.; Mitsnefes, M.M.; Ma, Q.; Kelly, C.; et al. Neutrophil gelatinase-associated lipocalin (NGAL) as a biomarker for acute renal injury after cardiac surgery. The Lancet. 2005, 365, 1231–1238. [Google Scholar] [CrossRef] [PubMed]
- Wybraniec, M.T.; Chudek, J.; Bożentowicz-Wikarek, M.; Mizia-Stec, K. Prediction of contrast-induced acute kidney injury by early post-procedural analysis of urinary biomarkers and intra-renal doppler flow indices in patients undergoing coronary angiography. Journal of interventional cardiology. 2017, 30, 465–472. [Google Scholar] [CrossRef]
- Musiał, K.; Stojanowski, J.; Miśkiewicz-Bujna, J.; Kałwak, K.; Ussowicz, M. KIM-1, IL-18, and NGAL, in the machine learning prediction of kidney injury among children undergoing hematopoietic stem cell transplantation—A pilot study. International Journal of Molecular Sciences. 2023, 24, 15791. [Google Scholar] [CrossRef]
- Qi, X.; Li, J.; Gu, J.; Li, S.; Dang, Y.; Wang, T. Plasma levels of IL-8 predict early complications in patients with coronary heart disease after percutaneous coronary intervention. Japanese heart journal. 2003, 44, 451–461. [Google Scholar] [CrossRef] [PubMed]
- Su, R.; Li, Y.; Zink, D.; Loo, L.-H. Supervised prediction of drug-induced nephrotoxicity based on interleukin-6 and-8 expression levels. BMC bioinformatics. 2014, 15, 1–9. [Google Scholar]
- Meyrier, A.Y. Renal complications associated with contrast media. European Radiology Supplements. 2006, 16, D11–D6. [Google Scholar] [CrossRef]
- Briguori, C.; Tavano, D.; Colombo, A. Contrast agent--associated nephrotoxicity. Progress in cardiovascular diseases. 2003, 45, 493–503. [Google Scholar] [CrossRef] [PubMed]
- Faucon, A.-L.; Bobrie, G.; Clément, O. Nephrotoxicity of iodinated contrast media: From pathophysiology to prevention strategies. European journal of radiology. 2019, 116, 231–241. [Google Scholar] [CrossRef] [PubMed]
- Romano, G.; Briguori, C.; Quintavalle, C.; Zanca, C.; Rivera, N.V.; Colombo, A.; Condorelli, G. Contrast agents and renal cell apoptosis. European heart journal. 2008, 29, 2569–2576. [Google Scholar] [CrossRef] [PubMed]
- Kodama, A.; Watanabe, H.; Tanaka, R.; Tanaka, H.; Chuang, V.T.G.; Miyamoto, Y.; et al. A human serum albumin-thioredoxin fusion protein prevents experimental contrast-induced nephropathy. Kidney international. 2013, 83, 446–454. [Google Scholar] [CrossRef] [PubMed]
- McCullough, P.A.; Adam, A.; Becker, C.R.; Davidson, C.J.; Lameire, N.; Stacul, F.; Tumlin, J.A. Risk prediction of contrast-induced nephropathy. The American journal of cardiology. 2006, 98, 27K–36K. [Google Scholar] [CrossRef] [PubMed]
- Solomon, R.J.; Mehran, R.; Natarajan, M.K.; Doucet, S.; Katholi, R.E.; Staniloae, C.S.; et al. Contrast-induced nephropathy and long-term adverse events: Cause and effect? Clinical Journal of the American Society of Nephrology. 2009, 4, 1162–1169. [Google Scholar] [CrossRef]
- Aspelin, P.; Aubry, P.; Fransson, S.G.; Strasser, R.H.; Willenbrock, R.; Berg, K.J. Nephrotoxic effects in high-risk patients undergoing angiography. The New England journal of medicine. 2003, 348, 491–499. [Google Scholar]
- Heinrich, M.C.; Häberle, L.; Müller, V.; Bautz, W.; Uder, M. Nephrotoxicity of iso-osmolar iodixanol compared with nonionic low-osmolar contrast media: Meta-analysis of randomized controlled trials. Radiology. 2009, 250, 68–86. [Google Scholar] [CrossRef] [PubMed]
- Lee, Y.; Ryu, J.Y.; Kang, M.W.; Seo, K.H.; Kim, J.; Suh, J.; et al. Machine learning-based prediction of acute kidney injury after nephrectomy in patients with renal cell carcinoma. Scientific Reports. 2021, 11. [Google Scholar] [CrossRef] [PubMed]
Figure 1.
PRISMA Flow chart of the systematic review process.
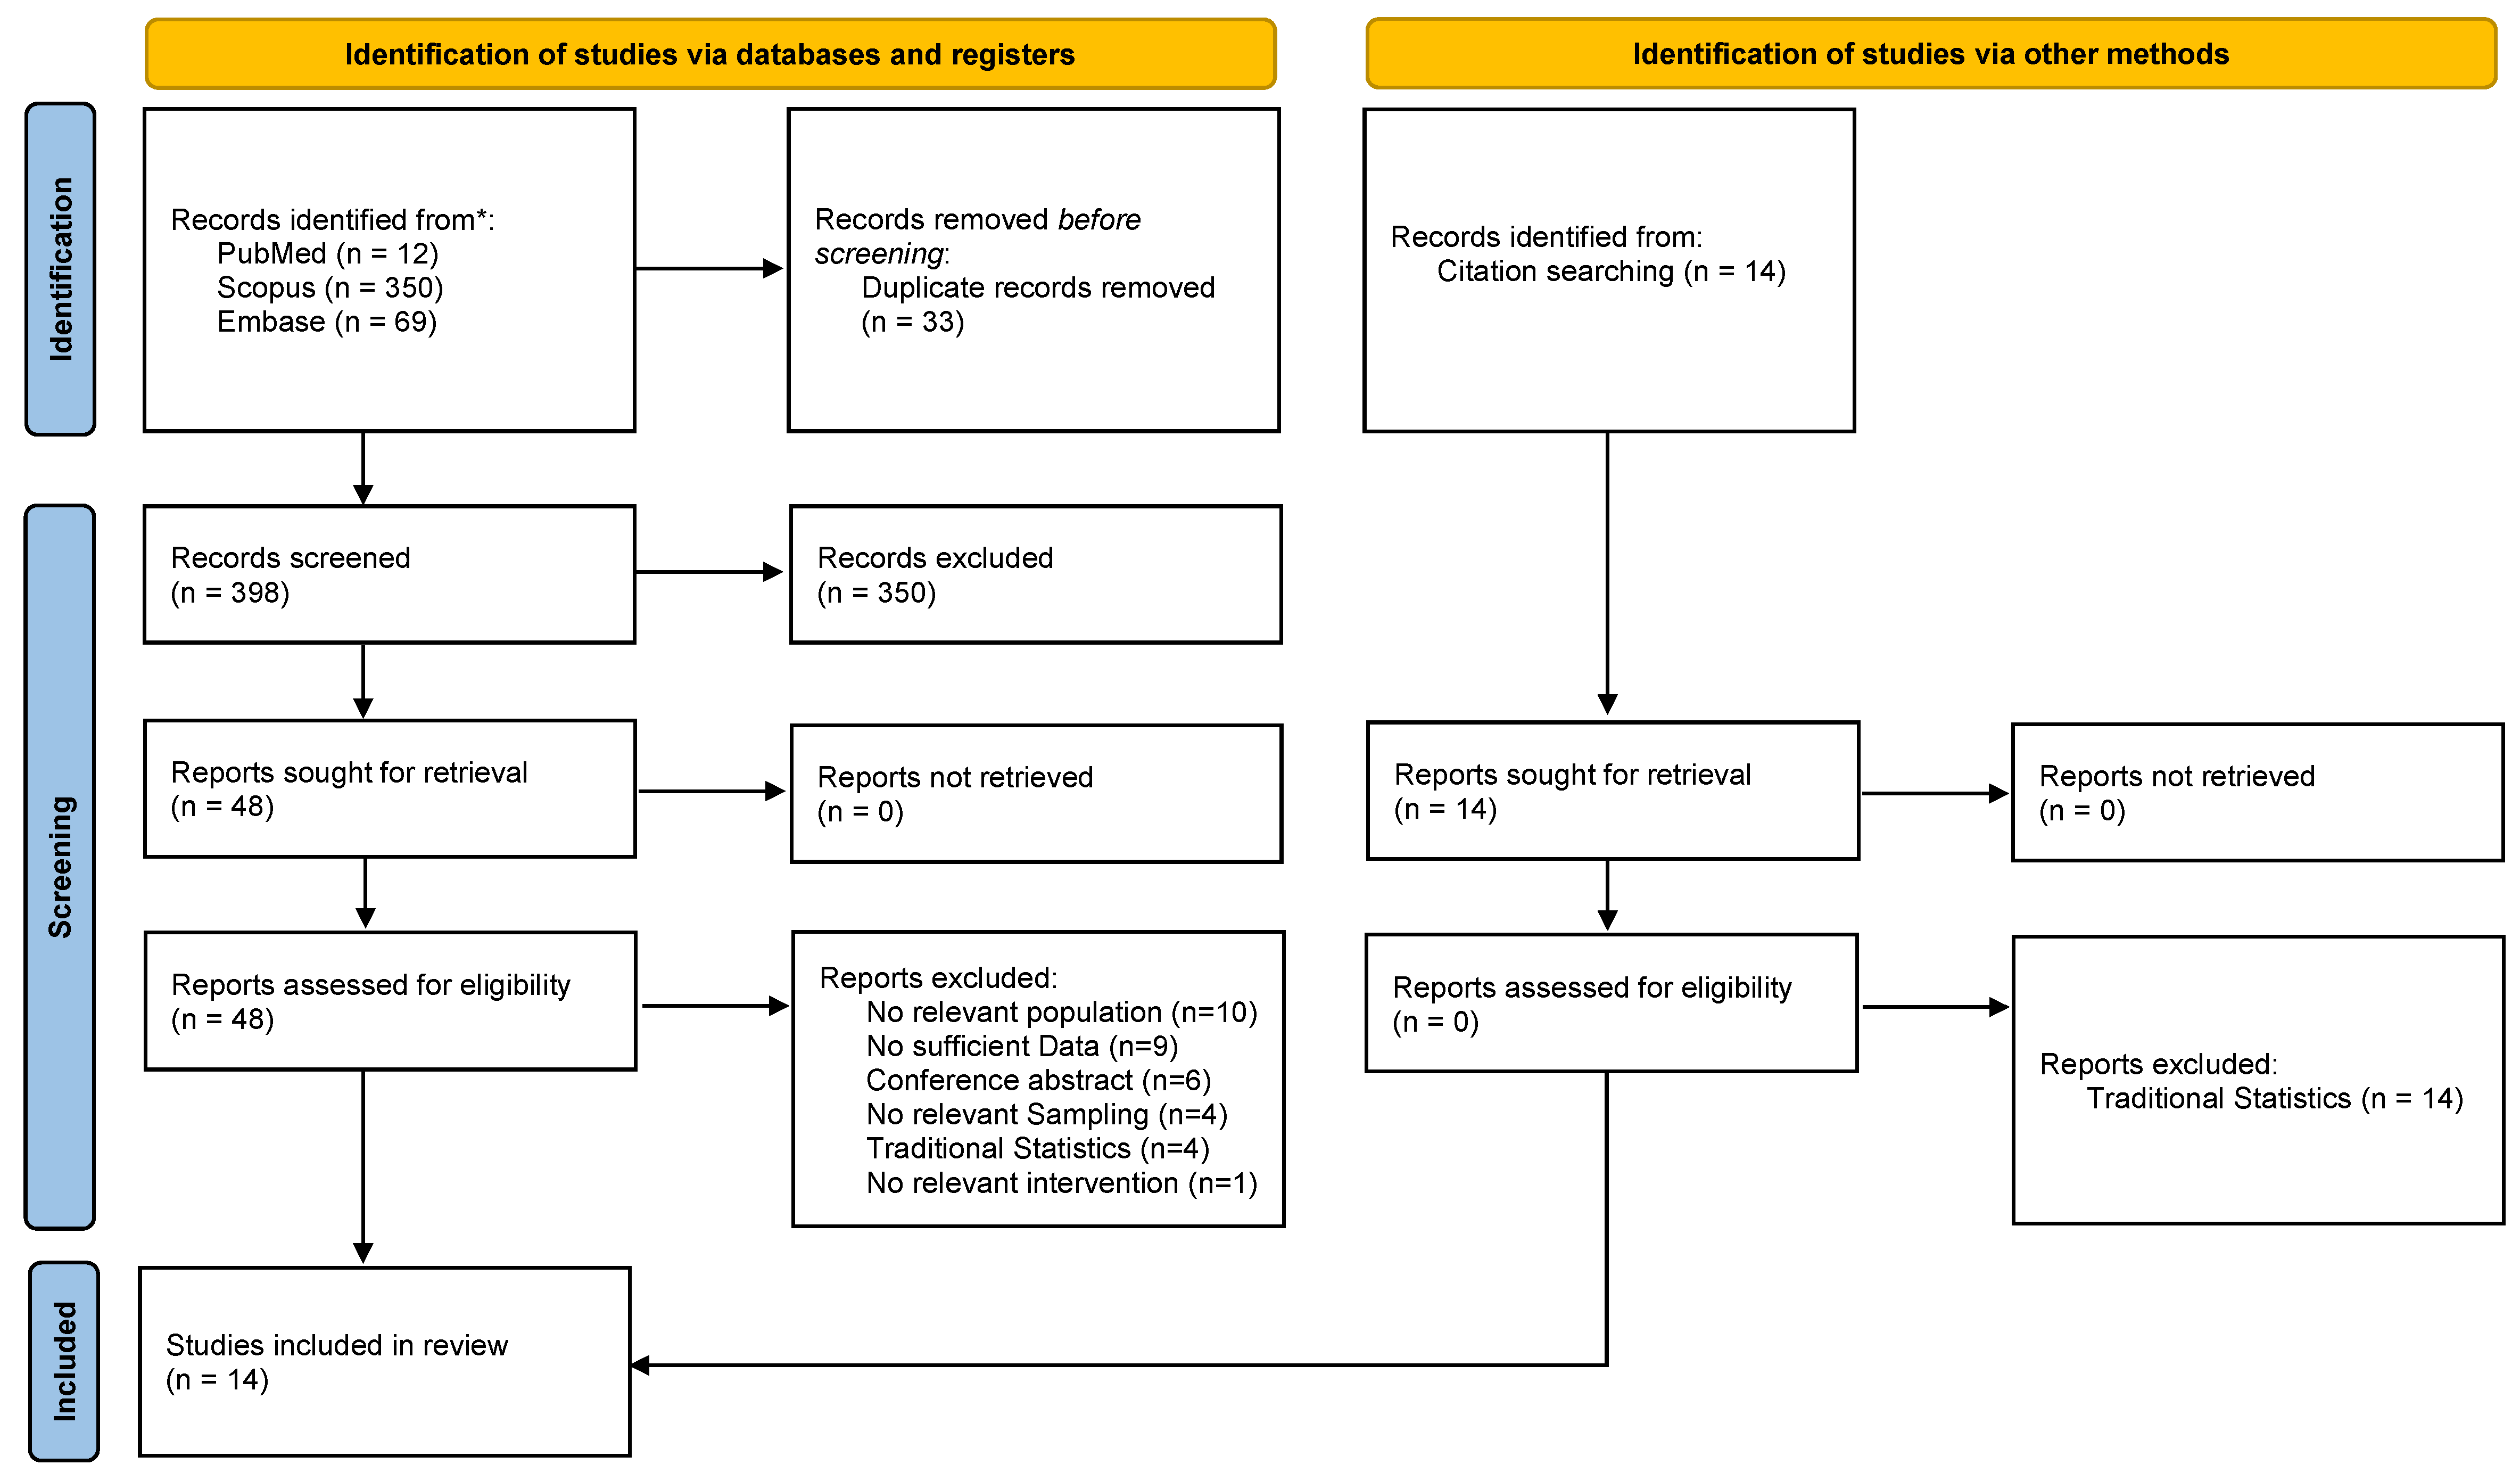
Figure 2.
Forest plot showing the Pooled AUC (95%CI) of the GBM model and its heterogeneity (I2). AUC: Area Under the Curve; CI: Confidence Interval; GBM: Gradient Boosting Machine.
Figure 2.
Forest plot showing the Pooled AUC (95%CI) of the GBM model and its heterogeneity (I2). AUC: Area Under the Curve; CI: Confidence Interval; GBM: Gradient Boosting Machine.
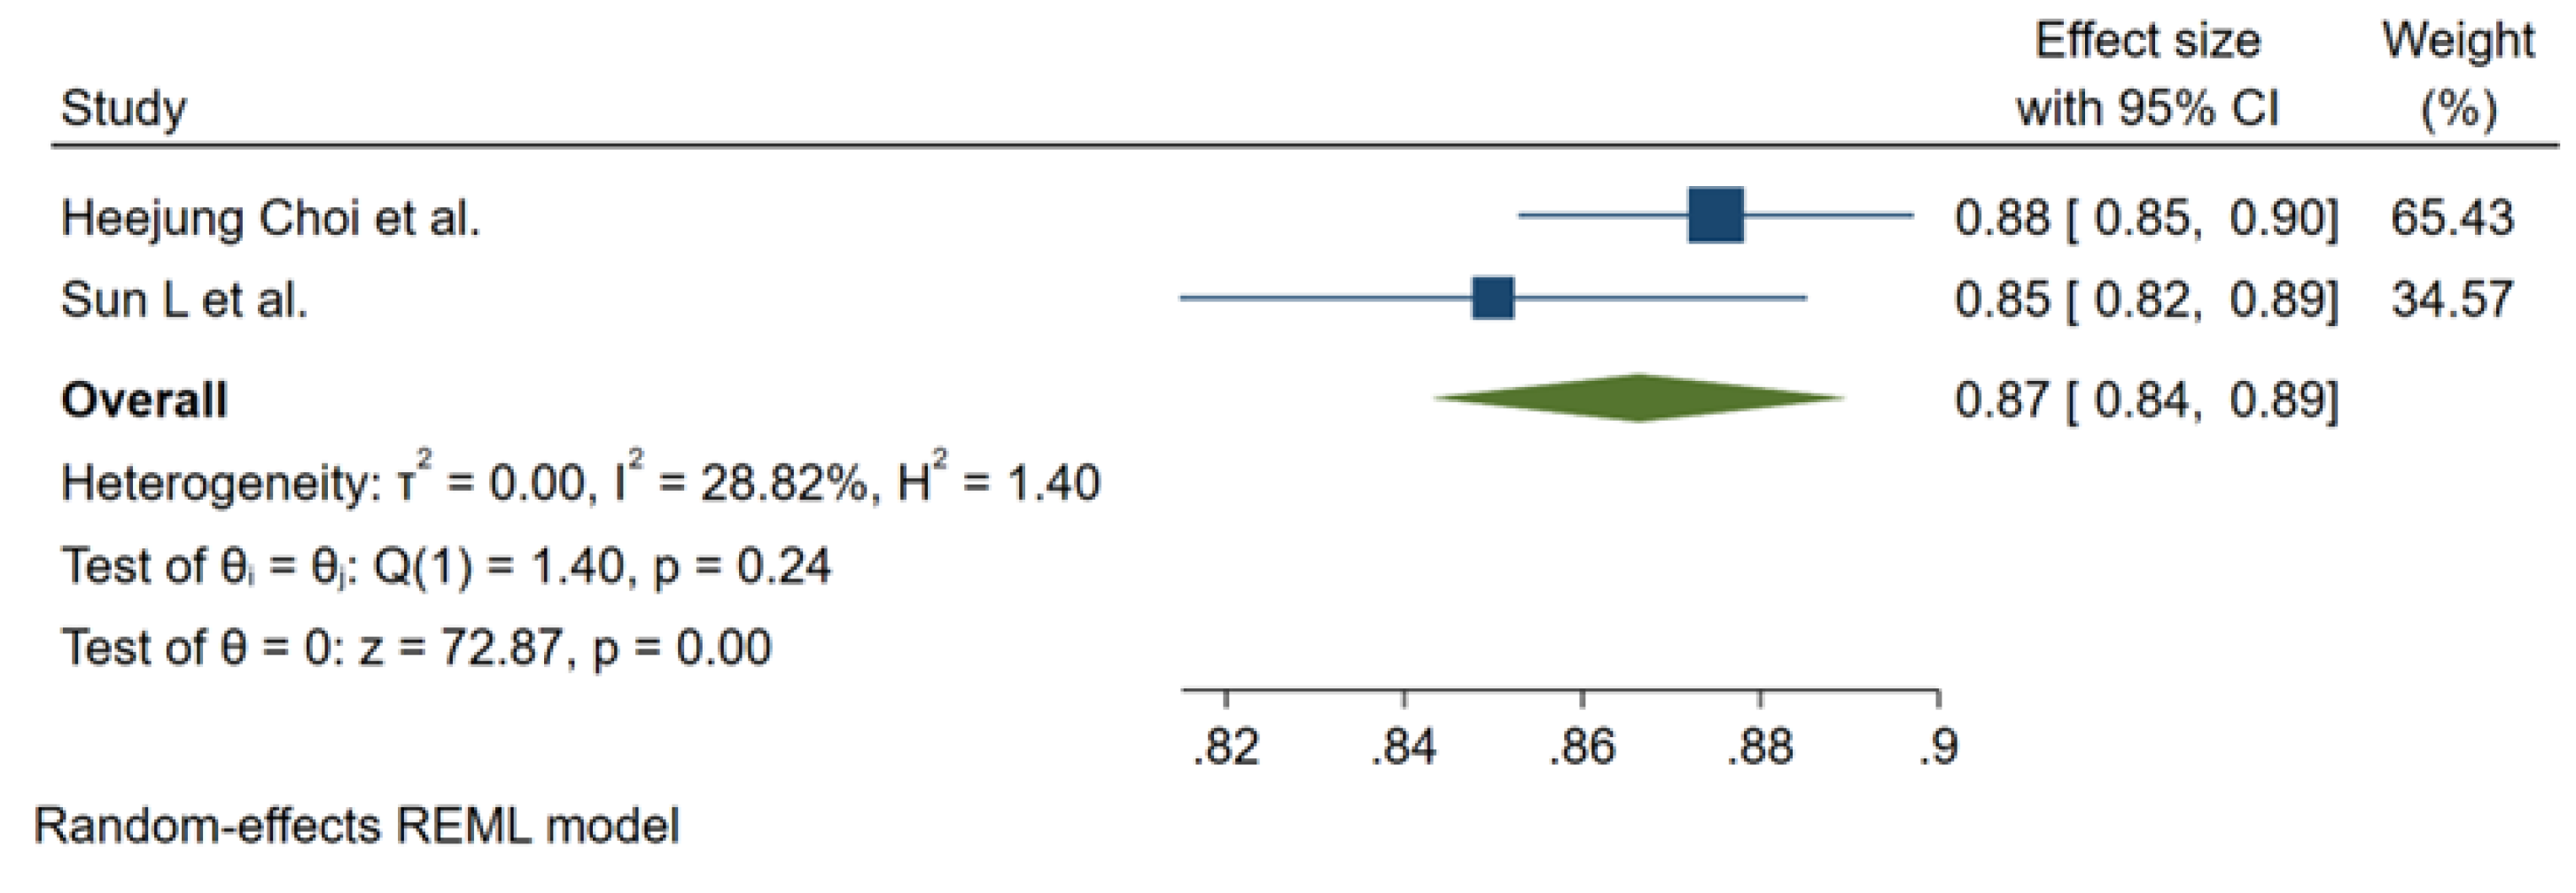
Figure 3.
Forest plot showing the Pooled AUC (95%CI) of the SVM model (A); Pooled Sensitivity (95%CI) (B) and Specificity (95%CI) (C) with each heterogeneity (I2). AUC: Area Under the Curve; CI: Confidence Interval; SVM: Support Vector Machine.
Figure 3.
Forest plot showing the Pooled AUC (95%CI) of the SVM model (A); Pooled Sensitivity (95%CI) (B) and Specificity (95%CI) (C) with each heterogeneity (I2). AUC: Area Under the Curve; CI: Confidence Interval; SVM: Support Vector Machine.
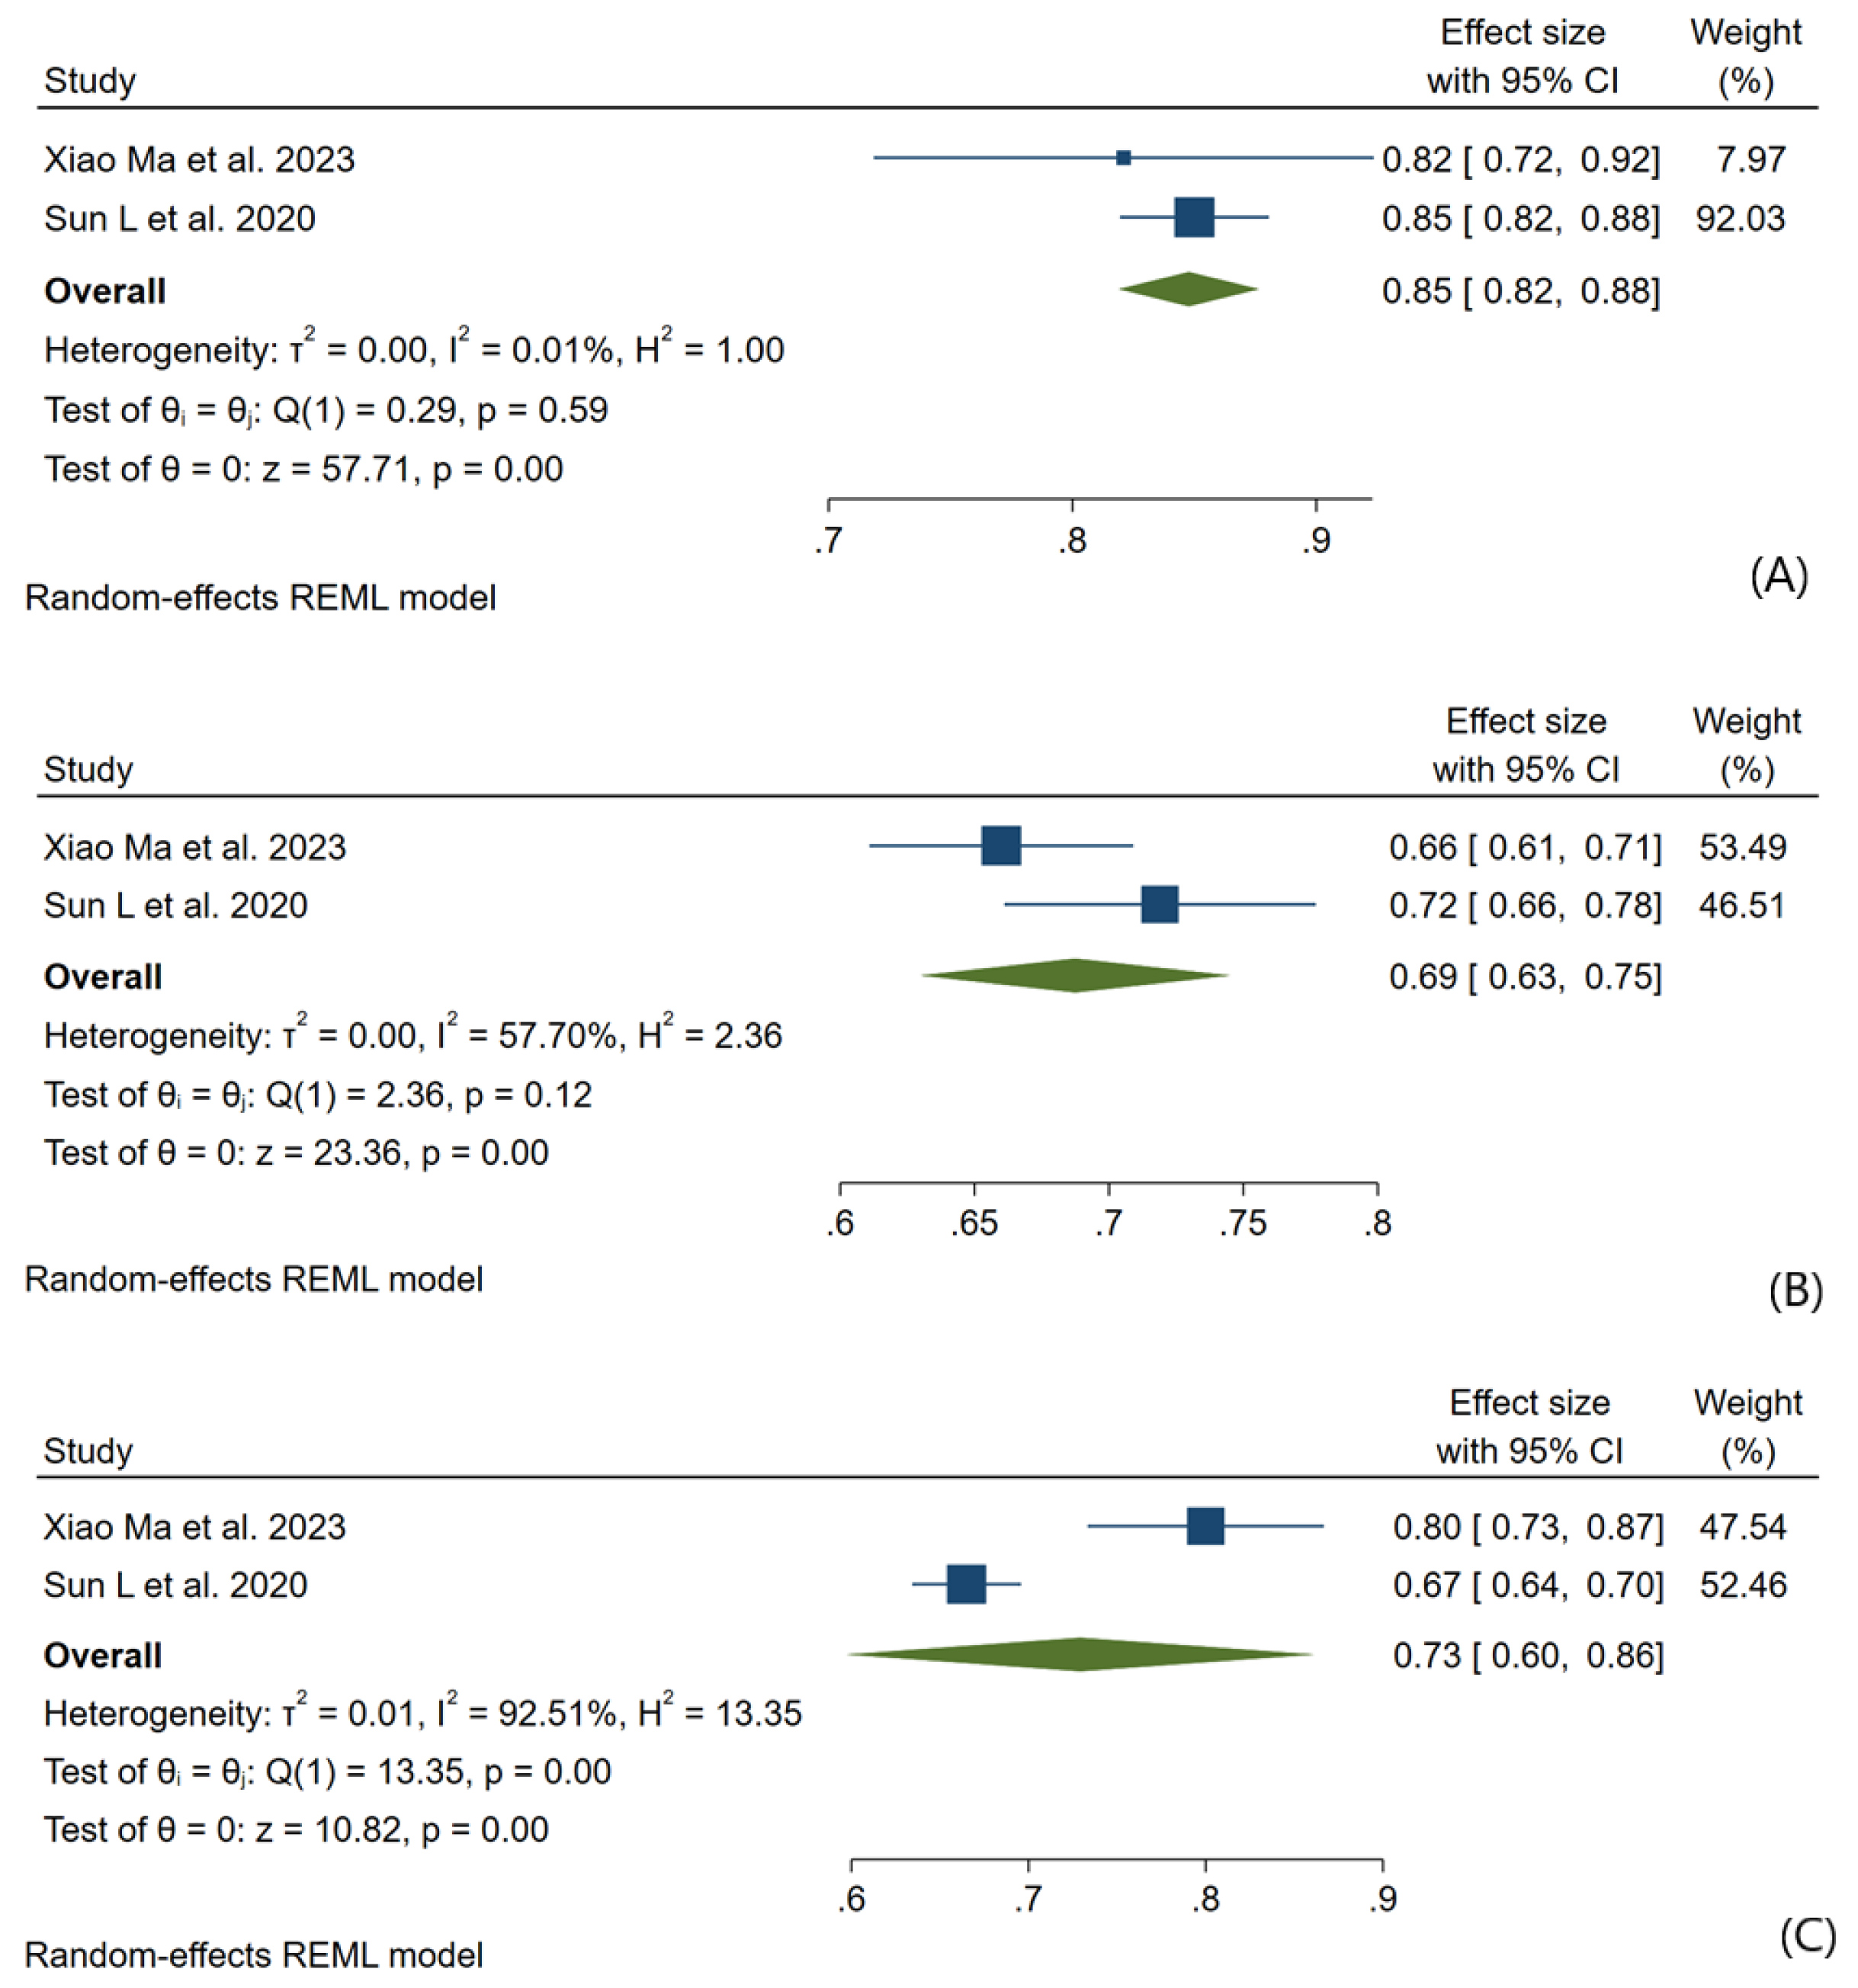
Figure 4.
Forest plot showing the Pooled AUC (95%CI) of the RF model (A); Subgroup analysis in Kidney Complications (B); Subgroup analysis in Included patients (C); Pooled Accuracy (95%CI) (D); Pooled Sensitivity (95%CI) (E); Pooled Specificity (95%CI) (F); Pooled Precision (95%CI) (G) with each heterogeneity (I2). AUC: Area Under the Curve; CI: Confidence Interval; RF: Random Forest.
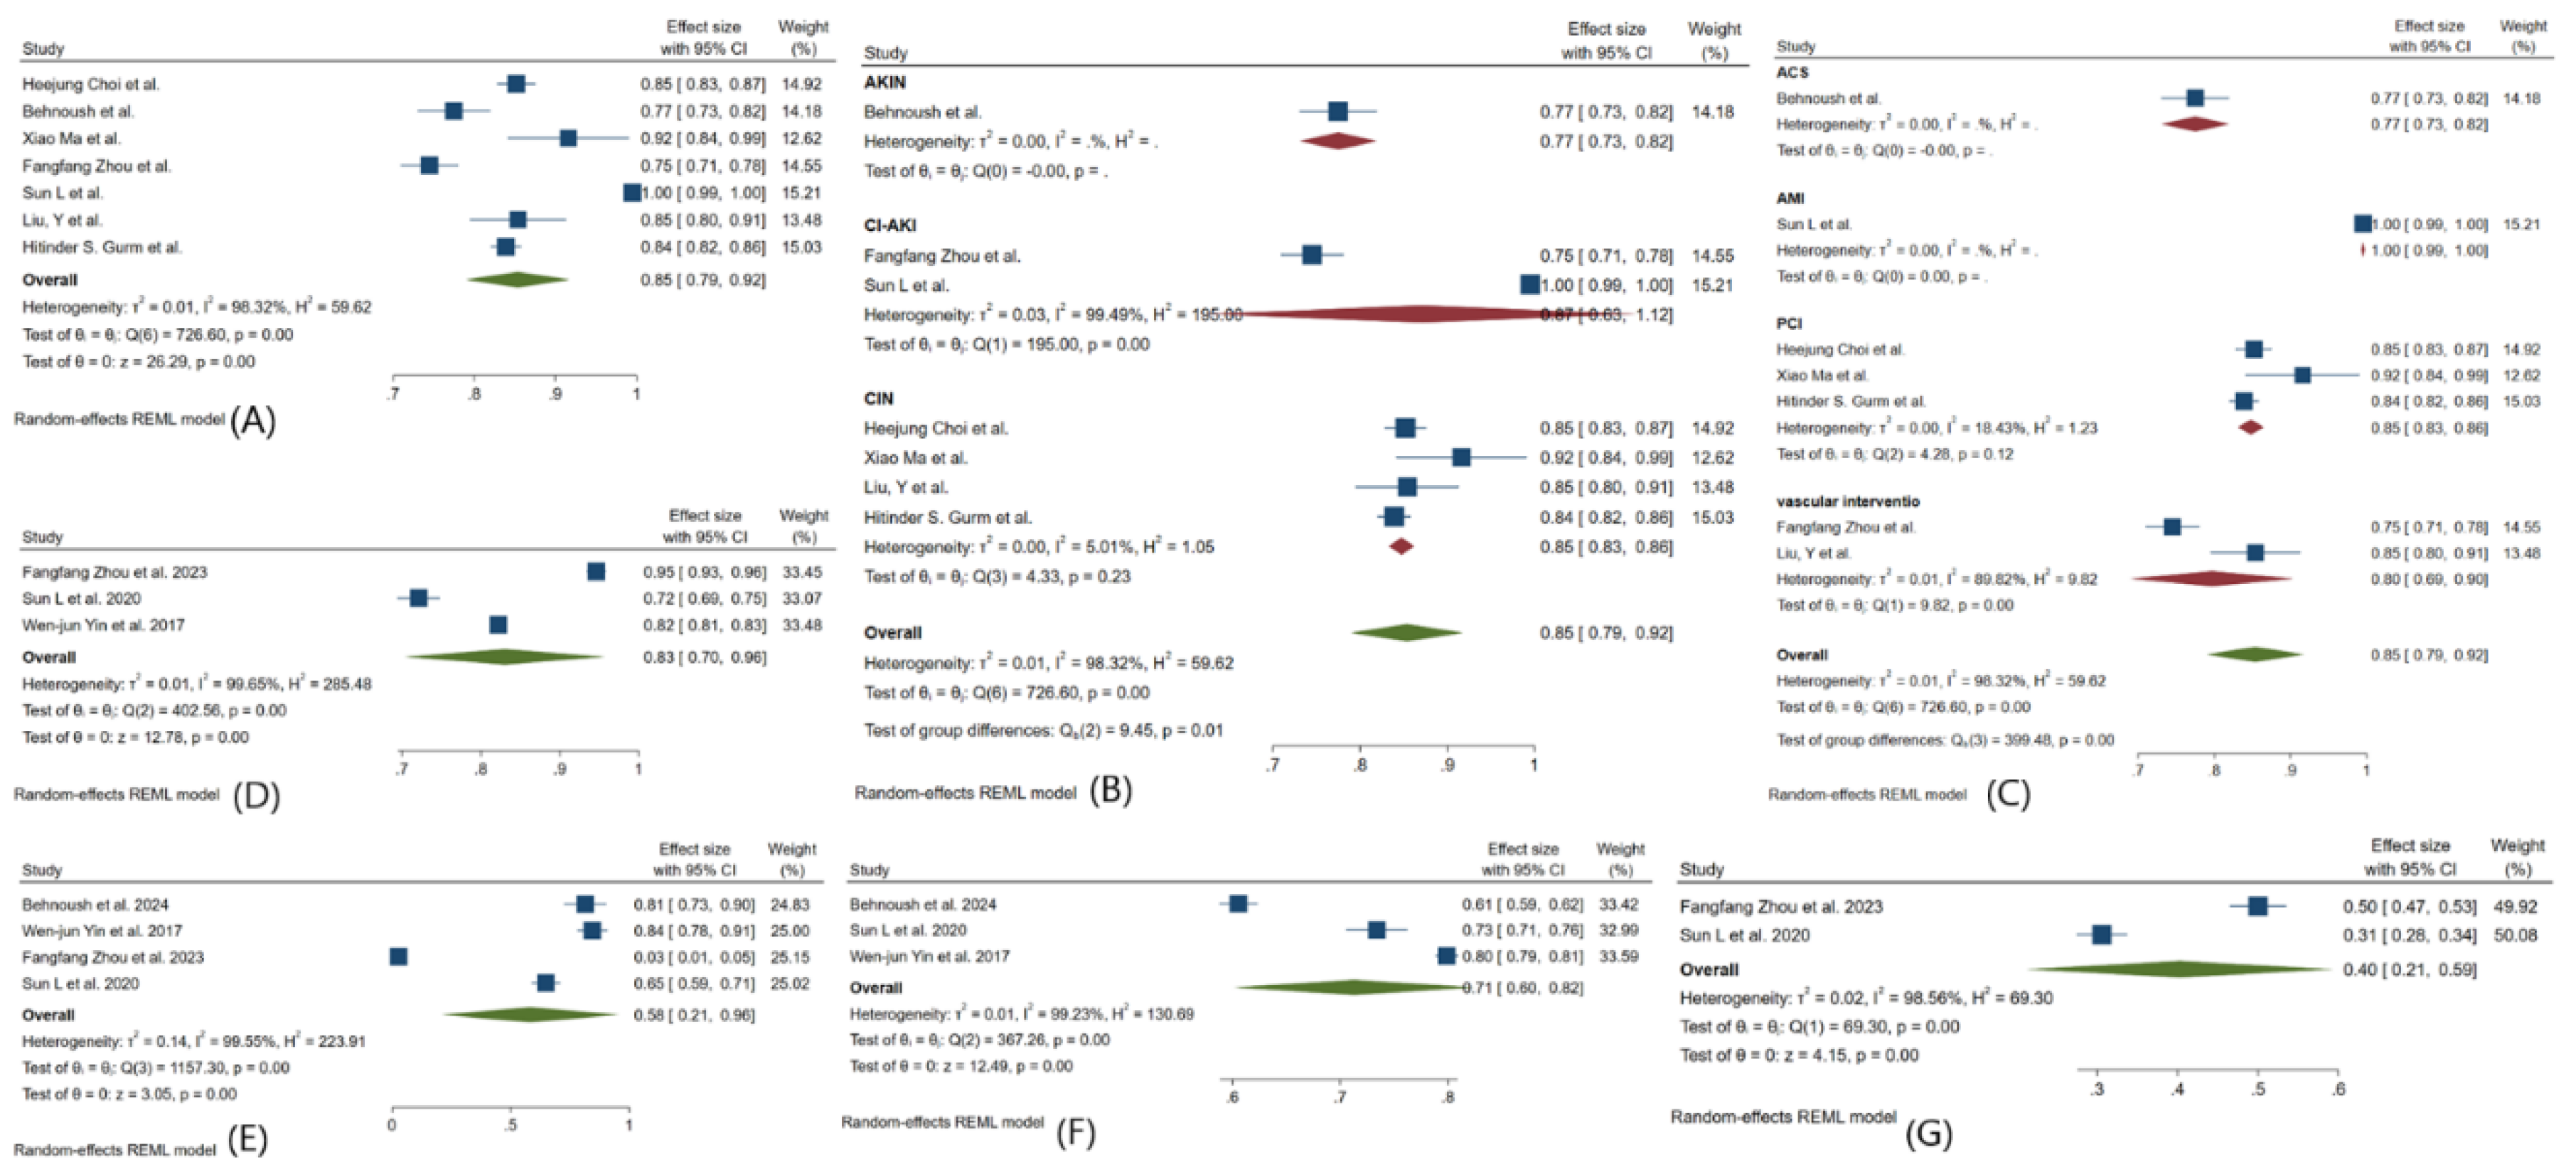
Figure 5.
Forest plot showing the Pooled AUC (95%CI) of the MLP model and its heterogeneity (I2). AUC: Area Under the Curve; CI: Confidence Interval; MLP: Multilayer Perceptron.
Figure 5.
Forest plot showing the Pooled AUC (95%CI) of the MLP model and its heterogeneity (I2). AUC: Area Under the Curve; CI: Confidence Interval; MLP: Multilayer Perceptron.
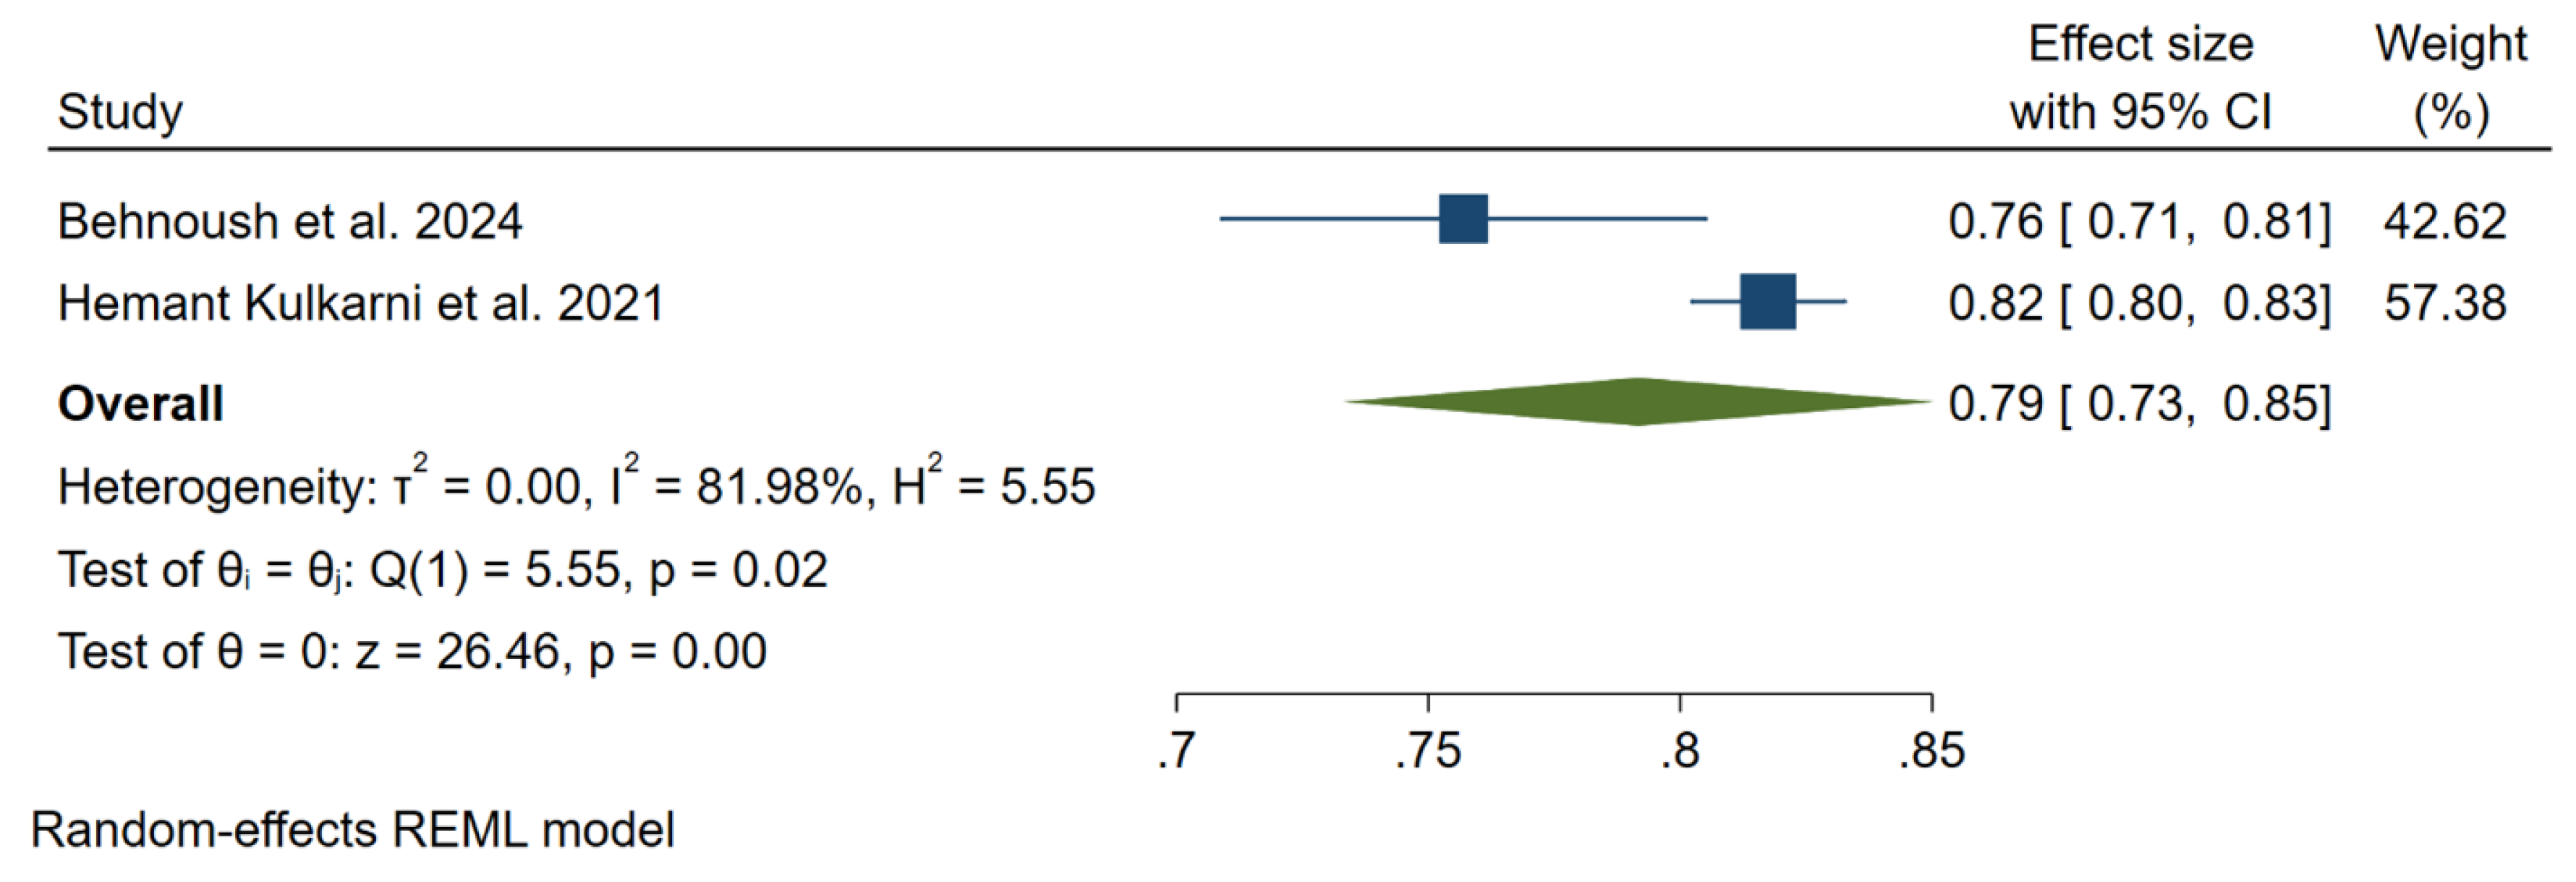
Figure 6.
Forest plot showing the Pooled AUC (95%CI) of the XGBoost model (A); Subgroup analysis in Kidney Complications (B); Subgroup analysis in Included patients (C); Pooled Accuracy (95%CI) (D); Pooled Sensitivity (95%CI) (E); Pooled Specificity (95%CI) (F); Pooled Precision (95%CI) (G) with each heterogeneity (I2). AUC: Area Under the Curve; CI: Confidence Interval.
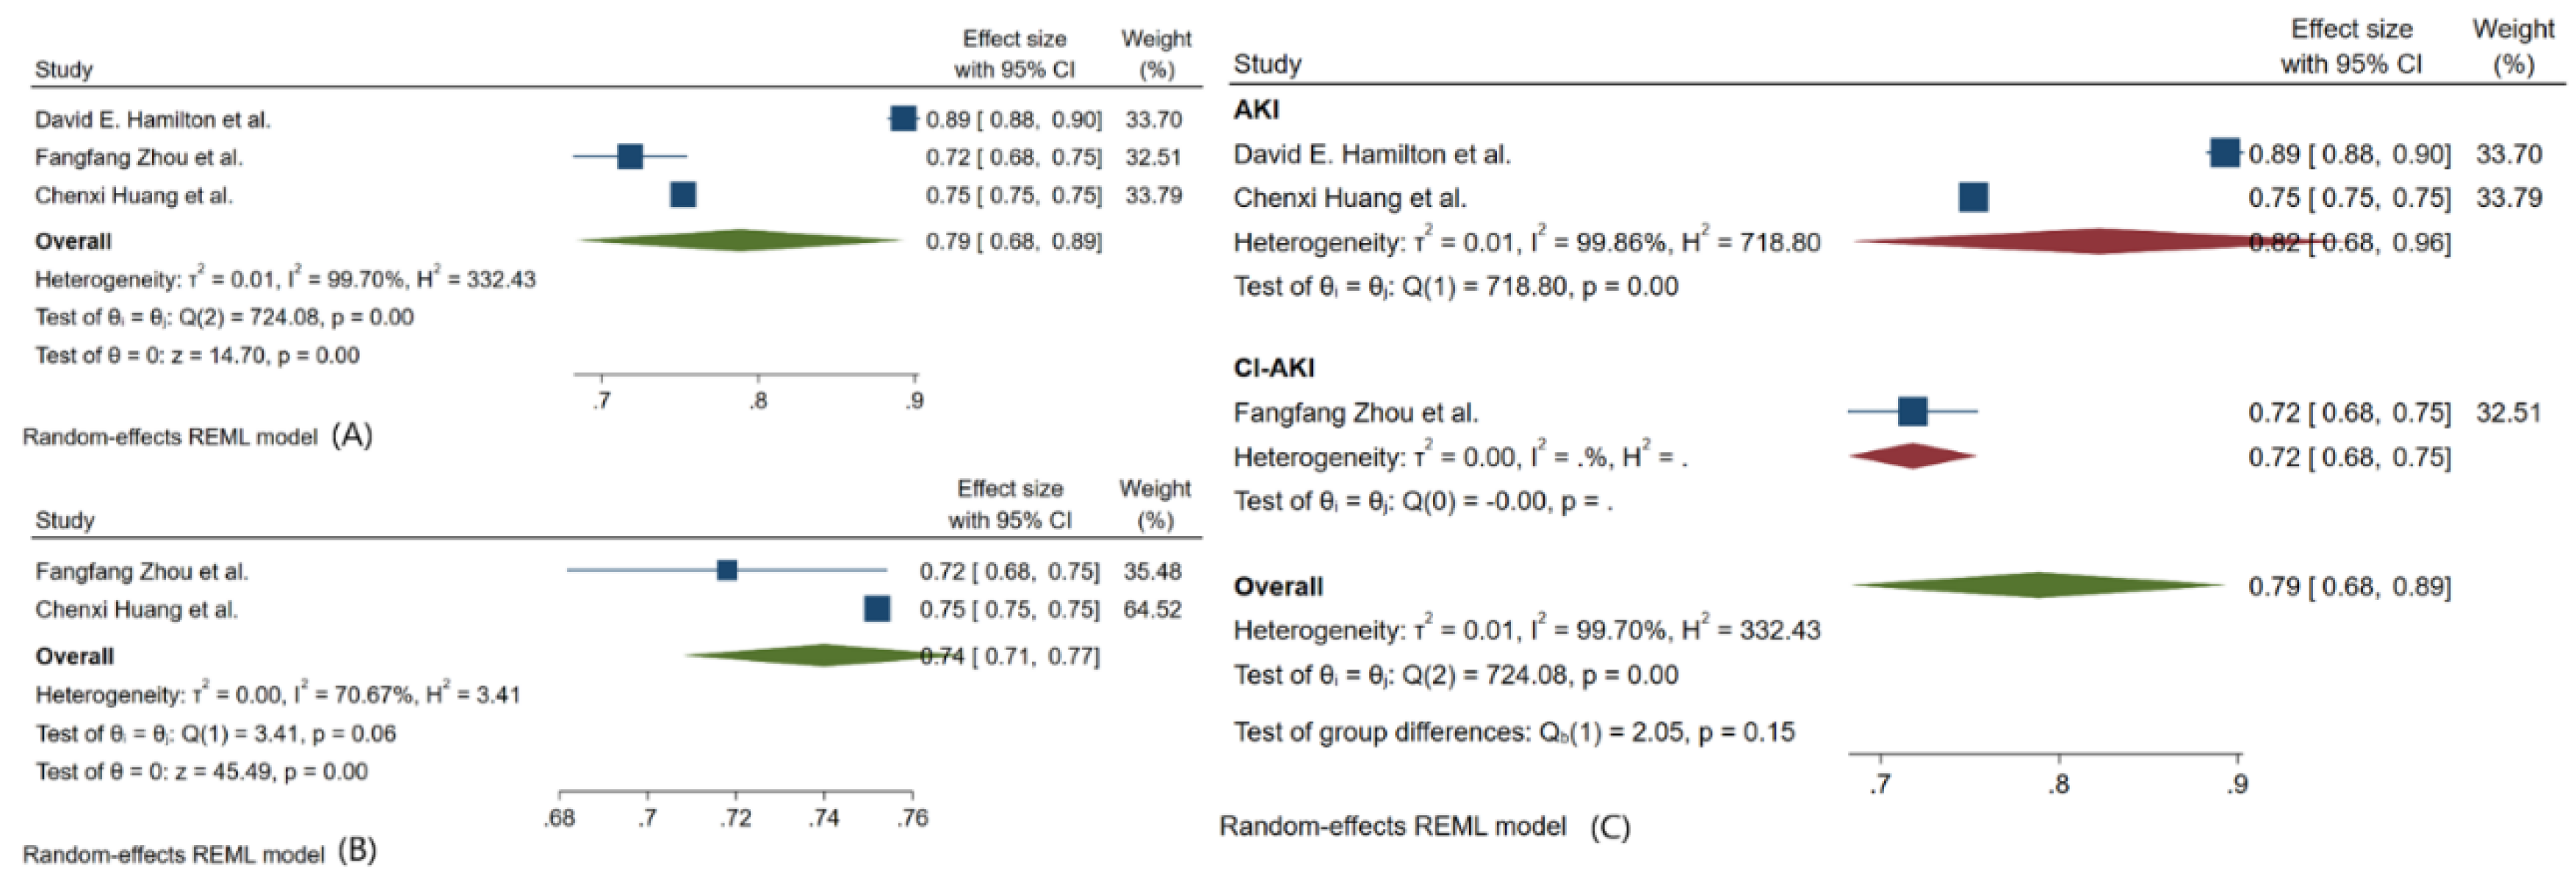
Figure 7.
Forest plot showing the Pooled AUC (95%CI) of the NB model (A); Pooled AUC (95%CI) after excluding one study (B); Pooled Sensitivity (95%CI) (E) with each heterogeneity (I2). AUC: Area Under the Curve; CI: Confidence Interval; NB: Naive Bayes.
Figure 7.
Forest plot showing the Pooled AUC (95%CI) of the NB model (A); Pooled AUC (95%CI) after excluding one study (B); Pooled Sensitivity (95%CI) (E) with each heterogeneity (I2). AUC: Area Under the Curve; CI: Confidence Interval; NB: Naive Bayes.
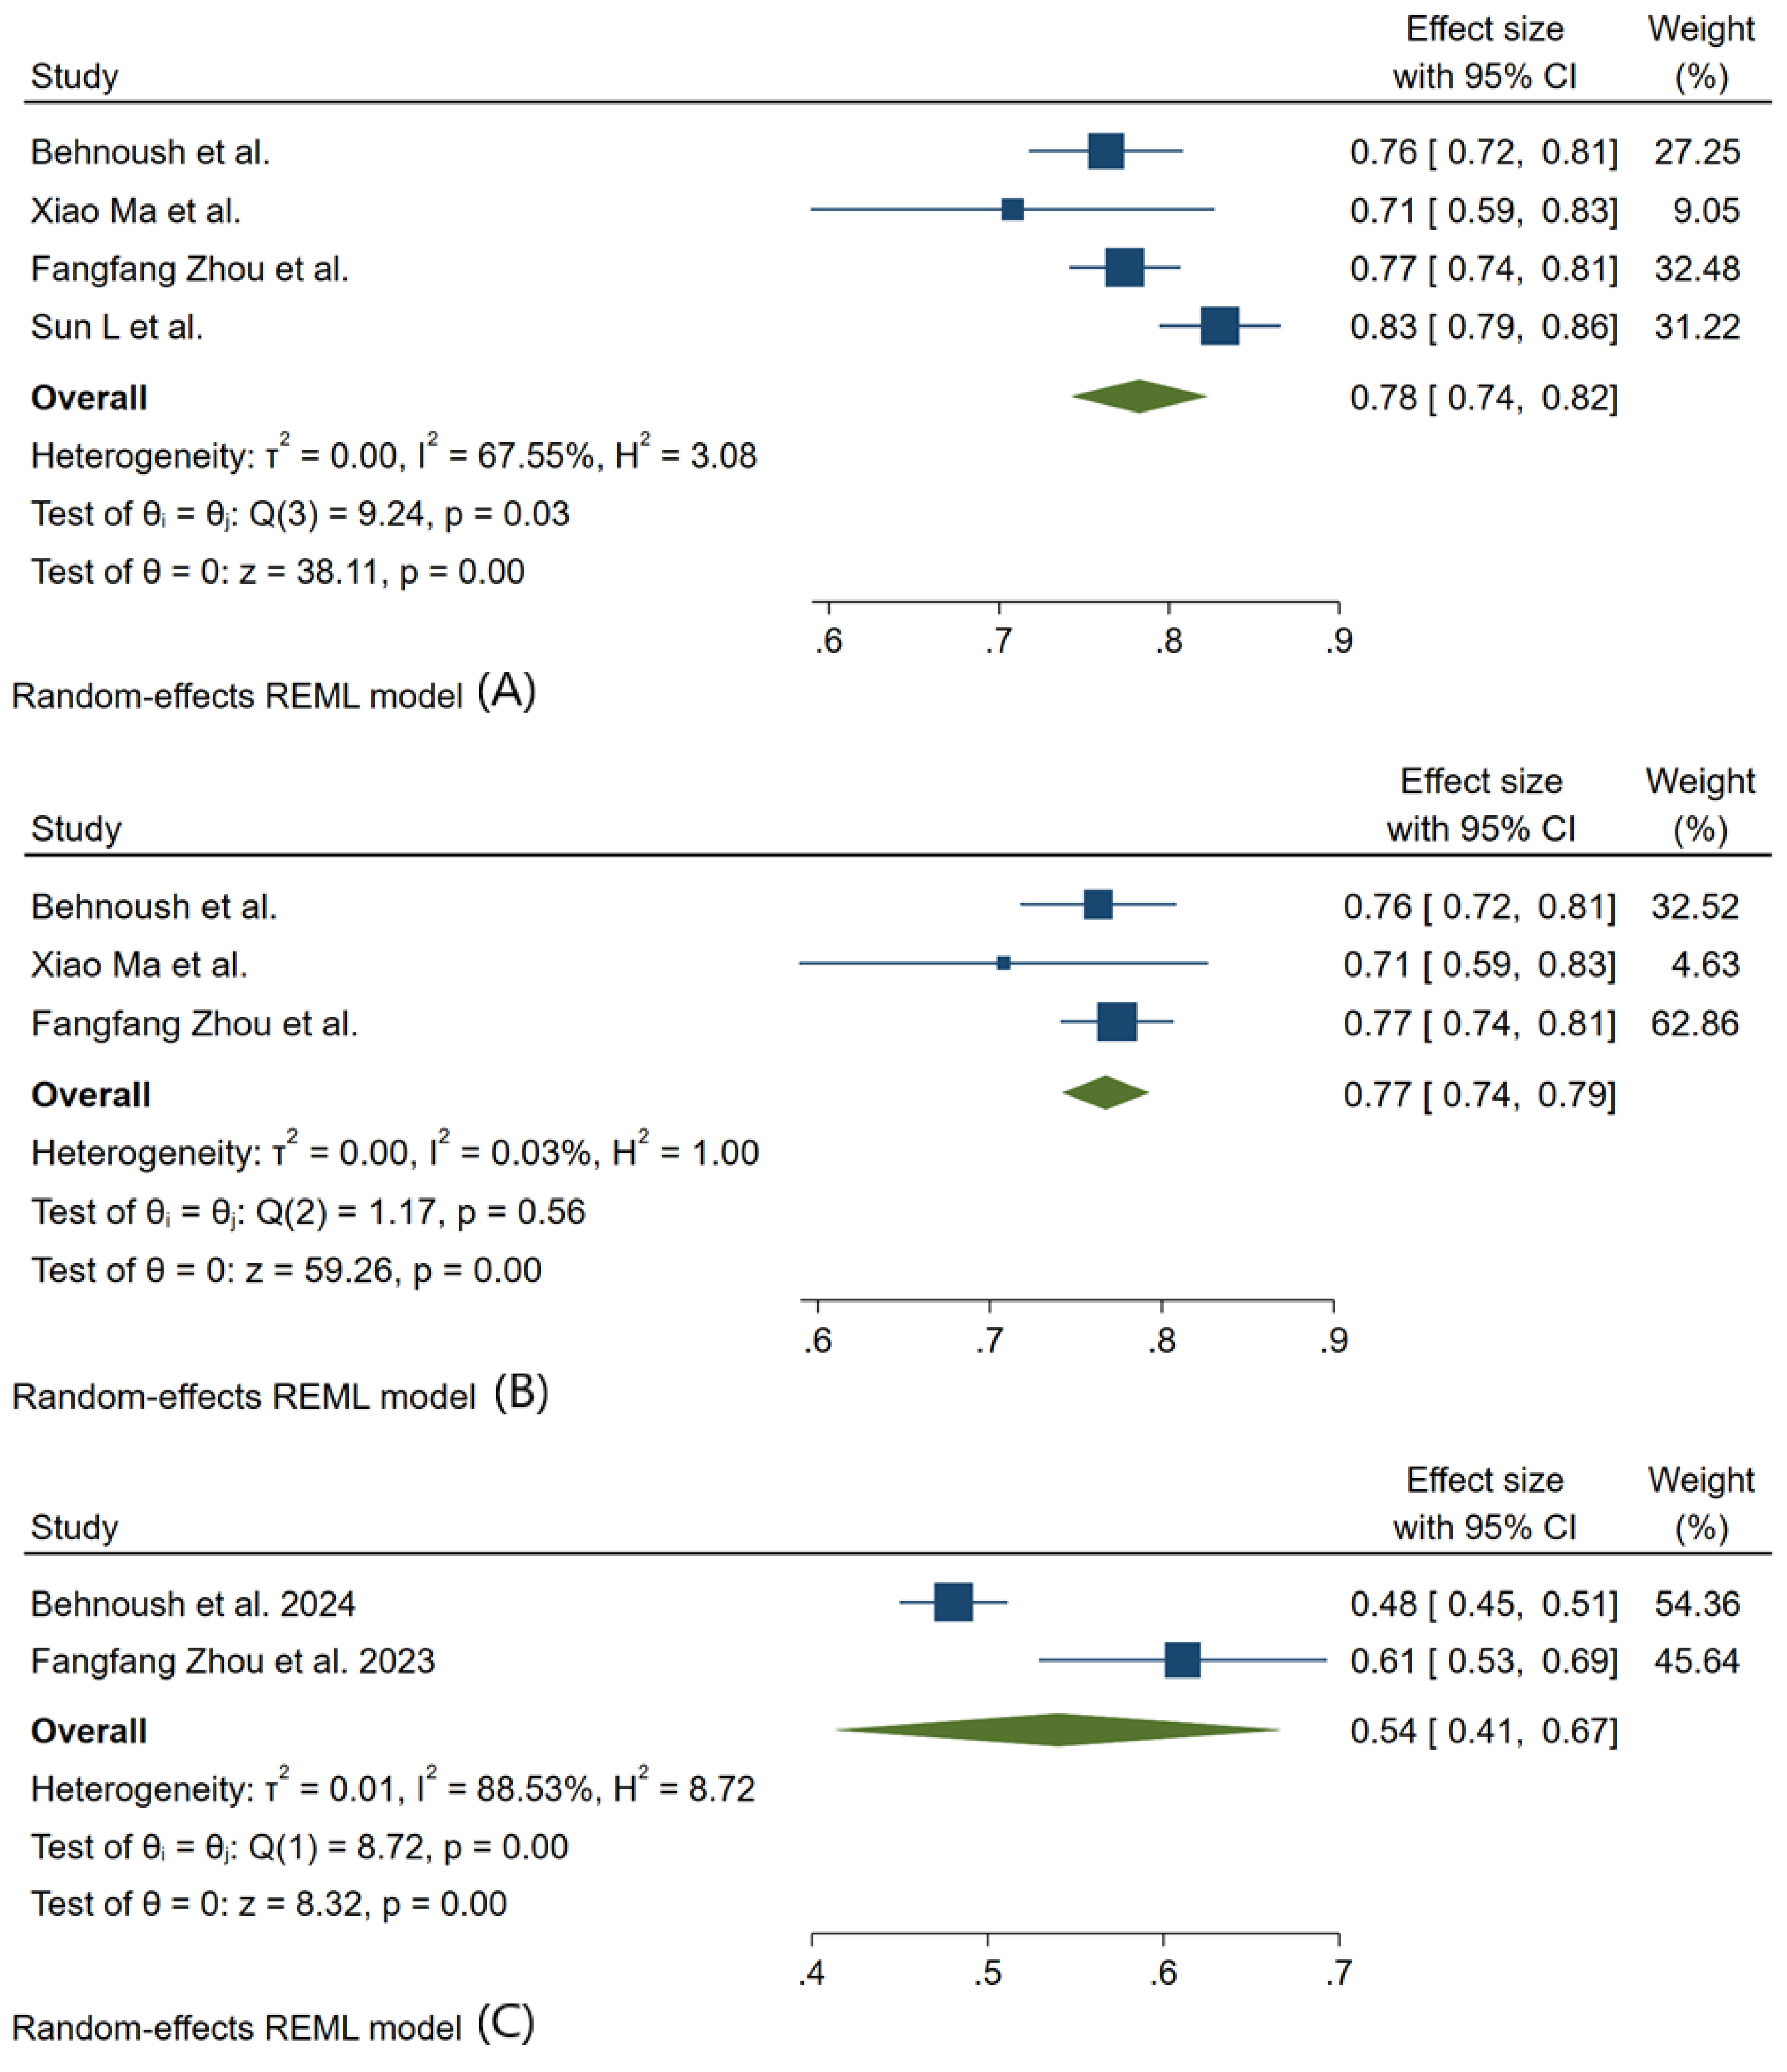
Figure 8.
Forest plot showing the Pooled AUC (95%CI) of the DT model (A); Subgroup analysis in Included patients (B); with each heterogeneity (I2). AUC: Area Under the Curve; CI: Confidence Interval; DT: Decision Tree.
Figure 8.
Forest plot showing the Pooled AUC (95%CI) of the DT model (A); Subgroup analysis in Included patients (B); with each heterogeneity (I2). AUC: Area Under the Curve; CI: Confidence Interval; DT: Decision Tree.
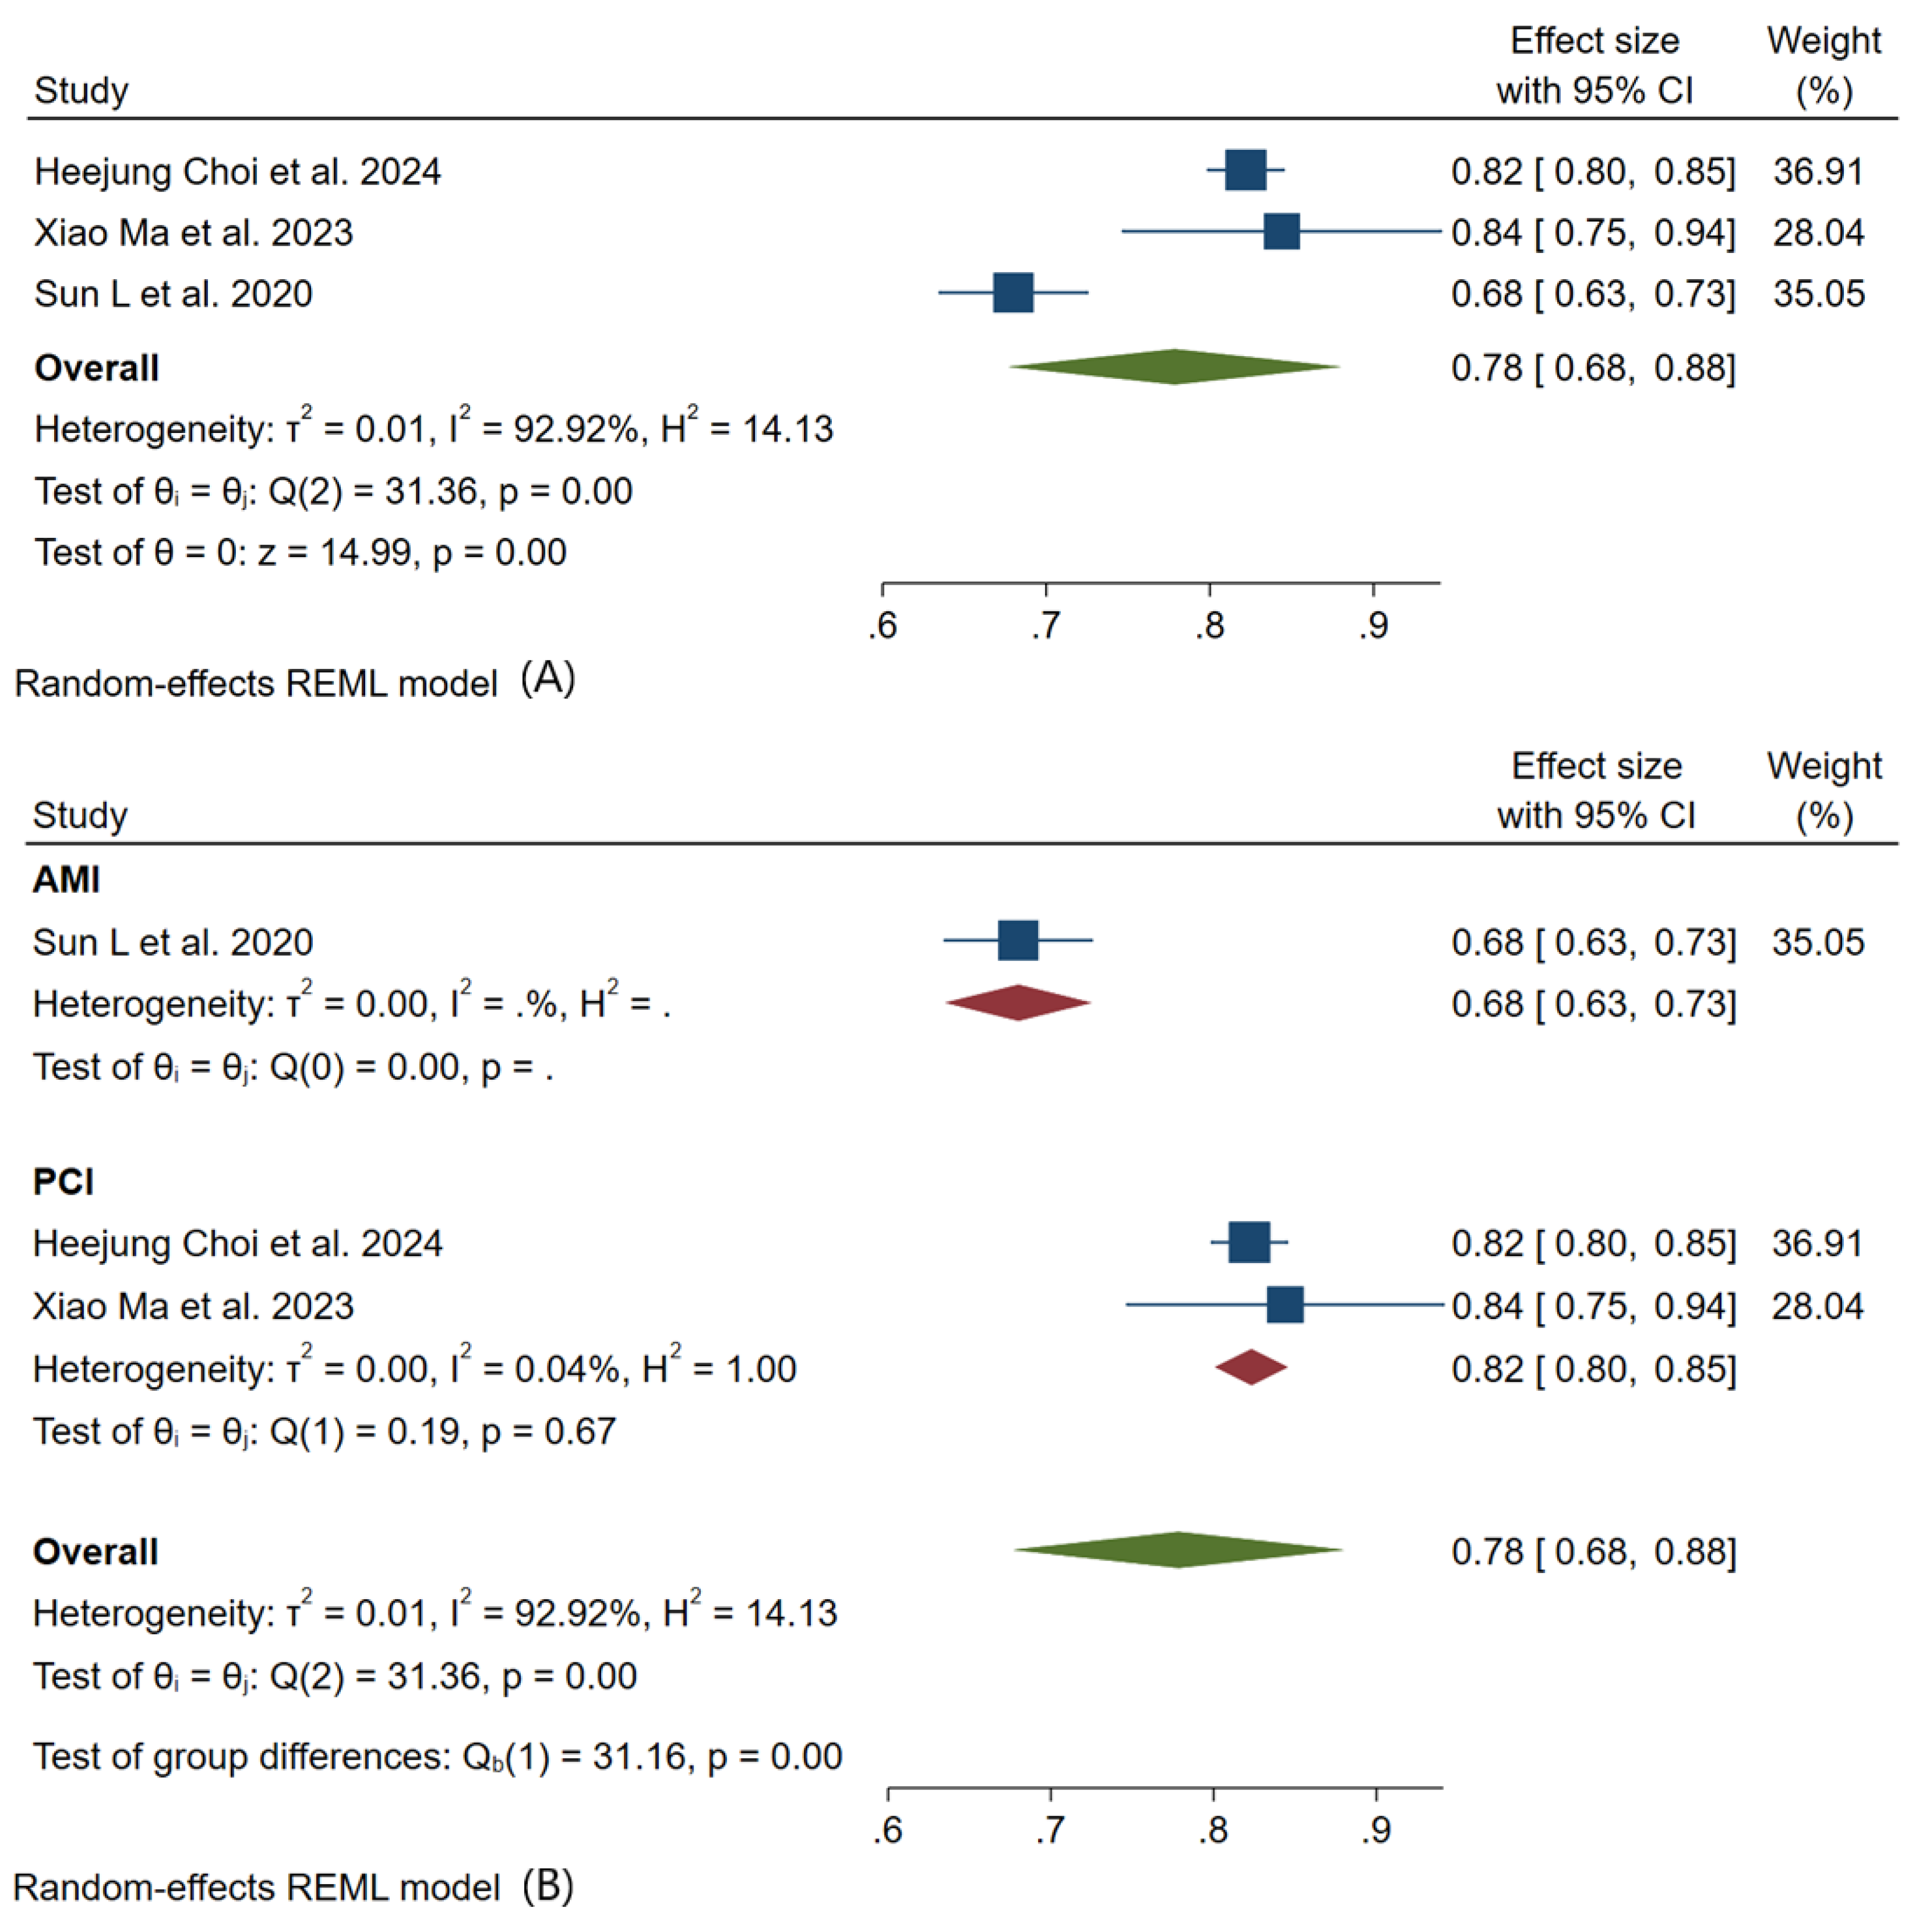
Disclaimer/Publisher’s Note: The statements, opinions and data contained in all publications are solely those of the individual author(s) and contributor(s) and not of MDPI and/or the editor(s). MDPI and/or the editor(s) disclaim responsibility for any injury to people or property resulting from any ideas, methods, instructions or products referred to in the content. |
© 2024 by the authors. Licensee MDPI, Basel, Switzerland. This article is an open access article distributed under the terms and conditions of the Creative Commons Attribution (CC BY) license (http://creativecommons.org/licenses/by/4.0/).
Copyright: This open access article is published under a Creative Commons CC BY 4.0 license, which permit the free download, distribution, and reuse, provided that the author and preprint are cited in any reuse.


