
Submitted:
05 September 2025
Posted:
08 September 2025
You are already at the latest version
Abstract
Background: Contrast-induced nephropathy (CIN) remains a significant and potentially preventable complication following percutaneous coronary intervention (PCI), linked to increased morbidity, prolonged hospitalization, and higher mortality. Existing risk scores such as CHA₂DS₂-VASc and the Mehran Risk Score (MRS) fail to capture the full spectrum of risk factors.Objective: To develop and validate the MENT Score (Multifactorial Evaluation for Nephropathy after Transcatheter Intervention), a streamlined predictive model that integrates key clinical and procedural variables from CHA₂DS₂-VASc, MRS, and PCI urgency.Methods: In this prospective study, 1000 consecutive PCI patients were enrolled—500 for derivation and 500 for validation. CIN was defined as a ≥25% or ≥0.5 mg/dL rise in serum creatinine within 48 hours post-procedure. Variables from established risk models and PCI-related factors were assessed through multivariable logistic regression.Results: Six independent predictors were incorporated into the MENT Score: female sex (p=0.009), diabetes mellitus (p=0.002), peripheral arterial disease (p=0.021), contrast volume ≥200 mL (p=0.060), systolic blood pressure ≤80 mmHg or inotrope use (p=0.0005), and baseline serum creatinine >1.5 mg/dL (p=0.043). A score >3 yielded strong discriminatory power:Derivation cohort: AUC = 0.770, sensitivity = 52.5%, specificity = 91.6%, accuracy = 82.4% Validation cohort: AUC = 0.861, outperforming MRS (0.76) and CHA₂DS₂-VASc (0.71) Conclusion: The MENT Score offers a concise, clinically relevant tool for early CIN risk stratification in PCI patients. Its superior predictive accuracy and ease of use make it a promising alternative to existing models, with potential to guide targeted preventive strategies.
Keywords:
Contrast-induced nephropathy
; PCI
; MENT Score
; risk prediction
; Mehran Score
; CHA₂DS₂-VASc
; coronary angiography
Background
Contrast-induced nephropathy (CIN), also referred to as contrast-induced acute kidney injury (AKI), is defined as an increase in serum creatinine by ≥0.5 mg/dL (44 µmol/L) or ≥25% from baseline within 48–72 hours following the administration of intravenous contrast media [1]. It remains a well-recognized complication of cardiac catheterization, particularly in high-risk populations.[2]
The incidence of CIN varies substantially, ranging from 7% to 25% depending on underlying comorbidities, with an average reported rate of 13.2% following percutaneous coronary intervention (PCI) [3]. Its occurrence is associated with significantly increased in-hospital and long-term morbidity and mortality, prolonged hospitalization, and the potential for permanent renal dysfunction.[4]
Although the precise pathophysiology is not fully understood, CIN is believed to be multifactorial—primarily involving renal vasoconstriction, medullary hypoxia, endothelial dysfunction, and direct tubular injury. Established risk factors include advanced age, female sex, diabetes mellitus (DM), hypertension (HTN), congestive heart failure (CHF), pre-existing renal impairment, and elevated central pulse pressure [5].
Patients undergoing cardiac catheterization, especially those with baseline renal dysfunction or coexistent diabetes, are at increased risk. The risk is further elevated in the context of primary PCI due to procedural urgency, potential hypotension or shock, high contrast volume, and reduced opportunities for pre-procedural renal protection.[6]
Both ionic and non-ionic iodinated contrast agents, whether administered intra-arterially or intravenously, may worsen renal function in predisposed individuals. Risk stratification tools are thus essential for tailoring prophylactic strategies.[7,8]
The CHA2DS2-VASc score—originally developed to estimate thromboembolic risk in non-valvular atrial fibrillation—incorporates several relevant risk factors: congestive heart failure (including left ventricular dysfunction or hypertrophic cardiomyopathy), hypertension, age ≥75 years, diabetes, prior stroke, vascular disease, age 65–74 years, and female sex [9]. Its applicability has extended beyond atrial fibrillation, including CIN prediction, prognostic utility in coronary artery disease (CAD) severity, stent thrombosis, and the no-reflow phenomenon in STEMI patients undergoing emergent PCI [10,11].
Meanwhile, Mehran et al. [12] developed a dedicated CIN risk score (Mehran Risk Score, MRS) based on a cohort of 5,571 PCI patients. MRS includes eight variables: hypotension (SBP <80 mmHg), use of intra-aortic balloon pump (IABP), congestive heart failure (NYHA class III–IV), age >75 years, anemia (hematocrit <39% for men or <36% for women), diabetes mellitus, baseline serum creatinine >1.5 mg/dL, and total contrast volume. Owing to its simplicity and evidence base, MRS remains widely used in clinical practice.[13]
Notably, CHA2DS2-VASc and MRS share overlapping variables but also demonstrate key omissions: CHA2DS2-VASc does not account for renal parameters (creatinine, eGFR), contrast volume, or hemodynamic instability, while MRS excludes vascular risk elements such as hypertension, female sex, and prior stroke. These limitations reduce their individual predictive accuracy for CIN.[14]
Recent literature has explored additional CIN predictors, including hematological indices (e.g., red cell distribution width, platelet-to-lymphocyte ratio), yet a consolidated, readily applicable scoring system remains lacking.[15]
Rationale and Study Objective
To address this gap, we propose a novel scoring model—MENT Score— (Multifactorial Evaluation for Nephropathy after Transcatheter intervention) which integrates selected components of both CHA2DS2-VASc and Mehran Risk Score, along with procedural urgency. This composite score aims to provide a more comprehensive and practical risk stratification tool for predicting CIN in patients undergoing PCI for acute coronary syndromes (ACS) or stable CAD.
All parameters required for the MENT Score are obtainable from standard clinical history, physical examination, and routine investigations—allowing for pre-procedural risk assessment and timely implementation of preventive strategies.
Aim of the Work
To evaluate the performance of a novel risk score (MENT Score) for predicting contrast-induced nephropathy in patients undergoing percutaneous coronary interventions.
Patients and Methods
Study Design and Setting
This was a prospective, multicenter cohort study conducted across three tertiary care cardiac centers in Egypt between [October 2021] and [October 2024]. The study included 1000 consecutive patients undergoing percutaneous coronary intervention (PCI), with 500 patients in the derivation cohort and 500 in the external validation cohort. Participating centers were selected to represent a diverse spectrum of case volumes and patient demographics, enhancing the generalizability of the findings.
Study Population
Out of 1050 screened patients, 1000 were included in the final analysis. Fifty records were excluded due to missing key variables such as serum creatinine or contrast volume, which were essential for CIN classification and MENT Score calculation. (Figure 1) The derivation cohort included 500 patients with ischemic heart disease (IHD)—either acute coronary syndrome (ACS) or stable coronary artery disease (CAD)—who underwent percutaneous coronary intervention (PCI). For each patient, demographic, clinical, laboratory, and angiographic data were collected. Both CHA2DS2-VASc and Mehran Risk Scores (MRS) were calculated, and serum creatinine was monitored daily for 72 hours post-PCI to detect CIN. CIN was defined as either: ≥0.5 mg/dL absolute increase in serum creatinine, or ≥25% rise from baseline within 48–72 hours after contrast exposure. The validation cohort (n = 500) was used to test the performance of the derived scoring system.
- Inclusion and Exclusion Criteria
Eligible patients were ≥18 years old and undergoing elective or emergency PCI. Exclusion criteria included Complex PCI procedures (e.g., chronic total occlusions, bifurcation lesions), pre-existing dialysis-dependent renal failure, estimated glomerular filtration rate (eGFR) <15 mL/min/1.73 m2 (with or without dialysis), recent contrast exposure (<7 days), hematologic disorders (e.g., severe anemia or malignancies affecting renal perfusion), active infection, active hepato-biliary or chronic liver disease, patients who died during or within 24 hours post-procedure, or incomplete clinical or laboratory data.
Clinical Evaluation
History
Detailed patient history was recorded, including demographics (age, sex), smoking status, and comorbidities (DM, HTN, dyslipidemia, chronic kidney disease, CHF [NYHA III–IV or EF <40%]). Past vascular events (e.g., peripheral arterial disease, stroke, transient ischemic attack [TIA], myocardial infarction), as well as time-to-balloon metrics (chest pain onset to presentation and door-to-balloon time), were documented. Prior contrast exposures (cardiac or non-cardiac) were noted.
Physical Examination
Examination focused on blood pressure, jugular venous pressure, signs of heart failure (S3 gallop, pulmonary rales), and mechanical complications (e.g., ventricular septal rupture, acute mitral regurgitation). Killip class [16] was determined:
- Class I: No heart failure.
- Class II: Rales or S3.
- Class III: Acute pulmonary edema.
- Class IV: Cardiogenic shock.
Ankle-Brachial Index (ABI): [17] Calculated as ankle systolic BP / brachial systolic BP (normal: 0.9–1.3).
Investigations
- ECG: Baseline 12-lead ECG to identify ACS type (STEMI or NSTEMI) and dynamic changes.
- Echocardiography: Assessment of ejection fraction (EF ≤40% considered systolic heart failure) and other findings (e.g., hypertrophic cardiomyopathy, aortic plaque).
- Laboratory tests: HbA1c (DM: ≥6.5%), hemoglobin/hematocrit (anemia: <13 g/dL for men, <12 g/dL for women), serial cardiac biomarkers, and serum creatinine (baseline and daily up to 72 hours).
Angiographic and Procedural Details
Pre-Procedure
All patients received 300 mg aspirin plus either clopidogrel (300–600 mg) or ticagrelor (180 mg) as a loading dose. PCI was performed using standard techniques (radial or femoral access). Culprit vessels only were targeted. Non-ionic, iso-osmolar iodixanol or low-osmolar iopamidol contrast was used. Informed consent was obtained.
Intra-Procedural
- Unfractionated heparin (70–100 U/kg) was administered.
- Use of glycoprotein IIb/IIIa inhibitors and periprocedural hydration was left to operator discretion.
- Hypotension was defined as an SBP drop ≥20 mmHg to ≤90 mmHg.
Post-Procedure
Patients received aspirin (75–100 mg daily), clopidogrel (75 mg daily) or ticagrelor (90 mg twice daily), beta-blockers, ACE inhibitors, statins, and glucose-lowering agents as per guidelines. [18] Hydration and sodium bicarbonate were used when indicated. Daily serum creatinine was monitored.
Ethical Considerations
All patient data were fully anonymized prior to analysis to ensure confidentiality. The study was conducted in accordance with the principles outlined in the Declaration of Helsinki. Institutional review board (IRB) approval was obtained from all participating centers. Informed written consent was obtained from all individual participants included in the study.
Statistical Analysis
Statistical analyses were performed using MedCalc® version 20 (MedCalc Software Ltd., Ostend, Belgium).
- Categorical variables were expressed as counts and percentages.
- Derivation of the score: Variables with p <0.1 in univariate analysis (odds ratio) were entered into a multivariable logistic regression (backward stepwise method). Variables with p <0.05 were retained.
- A point-based scoring system was constructed using the Framingham method [19]:
- Binary variables were coded as 0/
- Each coefficient was normalized by dividing it by the smallest regression coefficient (Constant B).
- The resulting points were rounded to the nearest integer.
Score Validation
The novel score was applied to the validation cohort. Logistic regression was used to calculate expected CIN probabilities. Patients were stratified into 6 bins based on predicted probabilities. Calibration was evaluated using a calibration plot (observed vs. predicted CIN probabilities). Discrimination was assessed via ROC curve analysis, and the AUC was compared with CHA2DS2-VASc and Mehran scores using the DeLong method. P <0.05 was considered statistically significant.
Data Cleaning and Handling of Missing Data
All records were reviewed for completeness. Patients with missing data for any of the six MENT Score variables or for CIN outcome classification were excluded. The excluded records represented less than 5% of the screened population. No imputation techniques were applied; complete-case analysis was performed. Continuous variables were checked for range validity and outliers; categorical variables were verified for consistency.
MENT Score Study—Results
Results
The derivation cohort included 500 patients undergoing PCI, among whom 118 (23.6%) developed contrast-induced nephropathy (CIN). Baseline demographic and clinical characteristics are presented in (Table 1). The majority of patients were aged ≥65 years (63.6%), and 52% were male.
Univariate Predictors of CIN
On univariate analysis (Table 2), several variables were significantly associated with the development of CIN. These included:
- Age ≥65 years (OR: 2.011, 95% CI: 1.111–3.641, p = 0.021)
- Male sex (OR: 0.414, 95% CI: 0.227–0.756, p = 0.004; indicating higher CIN risk in females)
- Hypertension (OR: 1.914, p = 0.029)
- EF ≤40% (OR: 2.318, p = 0.010)
- Diabetes Mellitus (OR: 2.707, p = 0.002)
- Peripheral arterial disease (OR: 2.585, p = 0.021)
- Primary PCI (OR: 2.385, p = 0.037)
- Contrast volume ≥200 ml (OR: 1.989, p = 0.060)
- Baseline serum creatinine >1.5 mg/dL (OR: 4.510, p < 0.001)
- SBP ≤80 mmHg or use of inotropes (OR: 6.681, p < 0.001)
- Anemia (OR: 2.392, p = 0.003)
- eGFR <60 mL/min (OR: 2.318, p = 0.015)
Conversely, history of stroke, old ischemic heart disease, and DVT showed no significant association with CIN.
Multivariable Predictors of CIN
A multivariable logistic regression model with backward stepwise selection (Table 3) identified the following independent predictors of CIN:
- Female sex (B = 0.918, OR = 2.505, 95% CI: 1.258–4.989, p = 0.009)
- Diabetes Mellitus (B = 1.124, OR = 3.077, 95% CI: 1.505–6.290, p = 0.002)
- Peripheral arterial disease (B = 1.436, OR = 4.206, 95% CI: 1.240–14.263, p = 0.021)
- Contrast volume ≥200 ml (B = 0.688, OR = 1.990, p = 0.060)
- SBP ≤80 mmHg or need for inotropes (B = 1.925, OR = 6.854, p < 0.001)
- Baseline creatinine >1.5 mg/dL (B = 1.939, OR = 6.954, p < 0.001)
These six variables were retained in the final model and incorporated into the MENT Score using the Framingham-based point allocation method.(Figure 3)
Discrimination and Performance of the MENT Score
In the derivation sample, a MENT Score cut-off >3 was found to optimally stratify patients at elevated CIN risk, balancing sensitivity and specificity. Clinically, this threshold may serve as a trigger for enhanced preventive measures such as IV hydration and nephroprotective strategies.
- Sensitivity: 72.6%
- Specificity: 91.5%
- Accuracy: 86.0%
- Youden Index: 0.641
(See Table 4)
The score was further stratified into four risk categories (Table 5):
- Low risk (<2 points): Estimated CIN incidence 7.5%
- Moderate risk (2–3 points): 14.6%
- High risk (4–5 points): 68.2%
- Very high risk (≥6 points): 95.8%
Validation and Model Comparison
External validation in a separate cohort of 500 patients confirmed the high discriminative ability of the MENT Score. The AUC was:
- Derivation cohort: 0.770
- Validation cohort: 0.861
Compared to other scoring systems (Table 6), the MENT Score outperformed:
- Mehran Score (AUC: 0.737 in derivation; 0.752 in validation)
- CHA2DS2-VASc Score (AUC: 0.656 in derivation; 0.701 in validation)
All comparative AUC differences were statistically significant (p < 0.05, DeLong test), establishing the MENT Score as a superior risk prediction tool for CIN in PCI patients.(Figure 2)
Discussion
Contrast-induced nephropathy (CIN) remains one of the most important and feared complications of percutaneous coronary interventions (PCI), contributing significantly to acute renal failure, prolonged hospitalization, increased healthcare costs, and elevated mortality [20]. Given its clinical burden, accurate pre-procedural risk prediction is crucial to guide preventive strategies, particularly adequate hydration and hemodynamic stabilization.[21]
In our study, we proposed the MENT score—a novel and simple scoring system that combines selected variables from MRS and CHA2DS2-VASc scores along with PCI urgency. The score was derived from a development cohort (n=500) and validated in a separate cohort (n=500). All predictors were easily obtainable from patient history and basic investigations, making the score feasible in both elective and emergency settings.
Six variables emerged as independent predictors of CIN and formed the final MENT score: female sex, diabetes mellitus (DM), peripheral arterial disease (PAD), baseline creatinine >1.5 mg/dL, systolic blood pressure ≤80 mmHg or inotropic need, and contrast volume ≥200 mL. Points were assigned based on regression coefficients: 1 point for female sex, baseline creatinine >1.5 mg/dL, and contrast volume ≥200 mL; 2 points for DM and PAD; and 5 points for hypotension/inotrope use, yielding a total score range of 0–12.
The MENT score demonstrated robust performance:
- In the derivation cohort: AUC = 0.770, sensitivity = 52.5%, specificity = 91.6%, accuracy = 82.4%.
- In the validation cohort: AUC = 0.861, sensitivity = 72.6%, specificity = 91.5%, accuracy = 86.0%.
In contrast to MRS, which includes variables like anemia, heart failure, and age >75, our analysis showed these factors to be significant but dependent, losing independent predictive power in multivariable models. Their contribution to CIN risk was largely mediated through comorbid conditions such as DM and renal impairment. Similarly, primary PCI was a significant but dependent variable—primarily due to its association with hemodynamic instability.
PAD and female sex, both excluded in MRS, were retained in the MENT score as independent predictors. PAD may reflect systemic atherosclerosis and renal artery disease, while female sex has been consistently linked to higher CIN risk in multiple studies,[22,23,24] potentially due to hormonal effects on renal hemodynamics.
Unlike MRS, which includes contrast volume as a continuous variable, we used a ≥200 mL cutoff to enhance clinical applicability. Similarly, we opted to include serum creatinine rather than eGFR for its broader accessibility in practice.
Comparison with CHA2DS2-VASc score also highlights the MENT score’s superiority. Variables such as stroke, DVT, and prior ischemic heart disease—present in CHA2DS2-VASc—did not independently predict CIN in our cohorts.
Statistically, the MENT score showed significantly higher AUCs than CHA2DS2-VASc in both the derivation and validation cohorts. While the difference between MENT and MRS scores was not statistically significant, the MENT score’s simplicity and reliance on pre-procedural and early intra-procedural variables, allowing for dynamic risk assessment during the PCI procedure and enhance its clinical utility, especially in acute settings.
Clinical Utility and Implications
The MENT score offers a practical, bedside-friendly tool for early risk stratification of contrast-induced nephropathy (CIN) in patients undergoing PCI. Unlike other models that require post-procedural variables or extensive lab data, this score relies solely on six easily obtainable clinical and procedural parameters. This enables timely identification of high-risk patients, particularly in emergency PCI settings, where preventive measures (e.g., intravenous hydration, contrast minimization, or deferred strategy) can be implemented proactively. Furthermore, the MENT score demonstrated comparable or superior discrimination compared to the Mehran and CHA2DS2-VASc scores while maintaining a simpler structure, making it suitable for routine clinical use and integration into electronic health systems.
In summary, the MENT score offers a reliable, easily calculated tool for identifying patients at high risk of CIN. Its implementation may improve risk stratification, guide prophylactic strategies, and enable tailored research on CIN prevention.
Future Directions
To enhance the clinical utility and generalizability of the MENT Score, future steps include a large-scale, prospective, multicenter validation study across diverse populations. Additionally, we plan to develop a user-friendly online calculator and explore integration into electronic medical record (EMR) systems for real-time CIN risk assessment at the point of care.
Conclusion
In this study, we introduced and validated the MENT Score —a novel, simplified risk model for predicting contrast-induced nephropathy (CIN) following percutaneous coronary interventions (PCI). By integrating both pre-procedural (e.g., sex, diabetes, PAD, baseline creatinine, hypotension) and early intra-procedural (contrast volume) variables, the score allows for practical and timely risk stratification during PCI. Its robust discriminative performance, with AUCs exceeding 0.86 in the validation cohort, and superior specificity over existing models such as CHA2DS2-VASc and Mehran scores, supports its potential clinical utility. The MENT score offers clinicians a feasible tool to anticipate CIN risk and optimize preventive strategies. Future multinational studies are warranted to further validate its generalizability and explore its role in clinical outcomes.
Limitations
Our study has several limitations. First, the sample size, although adequate for initial analysis, should be expanded in future multinational studies to increase generalizability and model robustness. Second, important clinical parameters such as peri-procedural hydration volume, proteinuria, urine output, and nephrotoxic medication exposure were not included, potentially affecting model comprehensiveness. We also did not use 24-hour urine creatinine clearance to confirm baseline renal function. Some potentially important predictors, such as TIA, IABP use, hypertrophic cardiomyopathy (HCM), and aortic plaque, were underrepresented in our cohort. Finally, several variables including advanced heart failure, age, anemia, and PAD—which differed between the MENT and Mehran scores—require further exploration in larger, multinational populations to establish their independent predictive value and enhance the score’s external validity.
Data Sharing Statement
The data underlying this article will be shared on reasonable request to the corresponding author, in accordance with institutional policies and participant privacy guidelines. This observational study was reported in accordance with the Strengthening the Reporting of Observational Studies in Epidemiology (STROBE) guidelines. A completed STROBE checklist is available upon request.
References
- Pugh CW, Dance DR, Khawaja AZ, et al. Risk models for predicting contrast-induced nephropathy in contemporary practice. JACC Cardiovasc Interv. 2023;16(4):375–386.
- Li M, Liu Y. A systematic review of contrast-induced acute kidney injury: mechanisms, risk factors, and clinical outcomes. Open J Nephrol. 2024;14(2):35–48.
- Brar, S.S.; Shen, A.Y.-J.; Jorgensen, M.B.; Kotlewski, A.; Aharonian, V.J.; Desai, N.; Ree, M.; Shah, A.I.; Burchette, R.J. Sodium Bicarbonate vs Sodium Chloride for the Prevention of Contrast Medium–Induced Nephropathy in Patients Undergoing Coronary Angiography. JAMA 2008, 300, 1038–1046. [Google Scholar] [CrossRef] [PubMed]
- Barbieri, L.; Verdoia, M.; Marino, P.; Suryapranata, H.; De Luca, G. ; on behalf of the Novara Atherosclerosis Study Group Contrast volume to creatinine clearance ratio for the prediction of contrast-induced nephropathy in patients undergoing coronary angiography or percutaneous intervention. Eur. J. Prev. Cardiol. 2015, 23, 931–937. [Google Scholar] [CrossRef] [PubMed]
- Caiazza, A.; Russo, L.; Sabbatini, M.; Russo, D. Hemodynamic and Tubular Changes Induced by Contrast Media. BioMed Res. Int. 2014, 2014, 1–7. [Google Scholar] [CrossRef] [PubMed]
- Berns, AS. Nephrotoxicity of contrast media. Kidney Int. 1989;36(4):730–40.
- Azzalini, L.; Spagnoli, V.; Ly, H.Q. Contrast-Induced Nephropathy: From Pathophysiology to Preventive Strategies. Can. J. Cardiol. 2016, 32, 247–255. [Google Scholar] [CrossRef] [PubMed]
- Lip GYH, Nieuwlaat R, Pisters R, Lane DA, Crijns HJ. Refining clinical risk stratification for predicting stroke and thromboembolism in atrial fibrillation using a novel risk factor-based approach: the Euro Heart Survey on Atrial Fibrillation. Chest. 2010;137(2):263–72.
- Bartlett RJ, McCullough PA, Mehran R, Brar SS, Gray WA, Hillege HL, et al. Consensus statement for the prevention of contrast-associated acute kidney injury. JACC Cardiovasc Interv. 2021;14(6):622–34.
- Liu FD, Shen XL, Zhao R. Predictive role of CHADS2 and CHA2DS2-VASc scores on stroke and thromboembolism in patients without atrial fibrillation: a meta-analysis. Ann Med. 2016;48(5):367–75.
- Ipek, G.; Onuk, T.; Karatas, M.B.; Gungor, B.; Osken, A.; Keskin, M.; Oz, A.; Tanik, O.; Hayiroglu, M.I.; Yaka, H.Y.; et al. CHA2DS2-VASc Score is a Predictor of No-Reflow in Patients With ST-Segment Elevation Myocardial Infarction Who Underwent Primary Percutaneous Intervention. Angiology 2016, 67, 840–845. [Google Scholar] [CrossRef] [PubMed]
- Mehran, R.; Aymong, E.; Nikolsky, E.; Lasic, Z.; Iakovou, I.; Fahy, M.; Mintz, G.; Lansky, A.; Moses, J.; Stone, G. A simple risk score for prediction of contrast-induced nephropathy after percutaneous coronary interventionDevelopment and initial validation. JACC 2004, 44, 1393–1399. [Google Scholar] [CrossRef] [PubMed]
- Lee HJ, Kim S, Park JY, Bae SY, Han Y, Lim YH, et al. Biomarkers in contrast-induced nephropathy: advances in early detection and personalized risk assessment. Int J Mol Sci. 2025;26(7):2869.
- Jun T, Zhao L, Chen K, Li S, Zhou L, Li Y, et al. Prediction models for contrast-associated acute kidney injury: a systematic review and meta-analysis. JAMA Netw Open. 2025;6(3):e2310112.
- Li, Y.; Liu, Y.; Fu, L.; Mei, C.; Dai, B.; Ashton, N. Efficacy of Short-Term High-Dose Statin in Preventing Contrast-Induced Nephropathy: A Meta-Analysis of Seven Randomized Controlled Trials. PLOS ONE 2012, 7, e34450. [Google Scholar] [CrossRef] [PubMed]
- Killip, T.; Kimball, J.T. Treatment of myocardial infarction in a coronary care unit. Am. J. Cardiol. 1967, 20, 457–464. [Google Scholar] [CrossRef] [PubMed]
- Aboyans V, Criqui MH, Abraham P, Allison MA, Creager MA, Diehm C, et al. Measurement and interpretation of the ankle-brachial index: a scientific statement from the American Heart Association. Circulation. 2012;126(24):2890–909.
- Neumann, F.-J.; Sousa-Uva, M.; Ahlsson, A.; Alfonso, F.; Banning, A.P.; Benedetto, U.; Byrne, R.A.; Collet, J.-P.; Falk, V.; Head, S.J.; et al. 2018 ESC/EACTS guidelines on myocardial revascularization. Russ. J. Cardiol. 2019, 151–226. [Google Scholar] [CrossRef]
- Sullivan LM, Massaro JM, D’Agostino RB Sr. Presentation of multivariate data for clinical use: The Framingham Study risk score functions. Stat Med. 2004;23(10):1631–60.
- McCullough PA, Wolyn R, Rocher LL, Levin RN, O’Neill WW. Acute renal failure after coronary intervention: incidence, risk factors, and relationship to mortality. Am J Med. 1997;103(5):368–75.
- Iakovou, I.; Dangas, G.; Mehran, R.; Lansky, A.J.; Ashby, D.T.; Fahy, M.; Mintz, G.S.; Kent, K.M.; Pichard, A.D.; Satler, L.F.; et al. Impact of gender on the incidence and outcome of contrast-induced nephropathy after percutaneous coronary intervention. . 2003, 15, 18–22. [Google Scholar] [CrossRef] [PubMed]
- Marenzi, G.; Lauri, G.; Assanelli, E.; Campodonico, J.; De Metrio, M.; Marana, I.; Grazi, M.; Veglia, F.; Bartorelli, A.L. Contrast-induced nephropathy in patients undergoing primary angioplasty for acute myocardial infarction. JACC 2004, 44, 1780–1785. [Google Scholar] [CrossRef] [PubMed]
- Kurtul, A.; Duran, M.; Yarlioglues, M.; Murat, S.N.; Demircelik, M.B.; Ergun, G.; Acikgoz, S.K.; Sensoy, B.; Cetin, M.; Ornek, E. Association Between N-Terminal Pro-Brain Natriuretic Peptide Levels and Contrast-Induced Nephropathy in Patients Undergoing Percutaneous Coronary Intervention for Acute Coronary Syndrome. Clin. Cardiol. 2014, 37, 485–492. [Google Scholar] [CrossRef] [PubMed]
- Abdelrahman A, Shen Y, Liu J, Huang J, Zhang L, Ma R, et al. Association of contrast volume with nephropathy risk: a personalized contrast dose strategy study. Sci Rep. 2025;15(1):10935.
Figure 1.
.
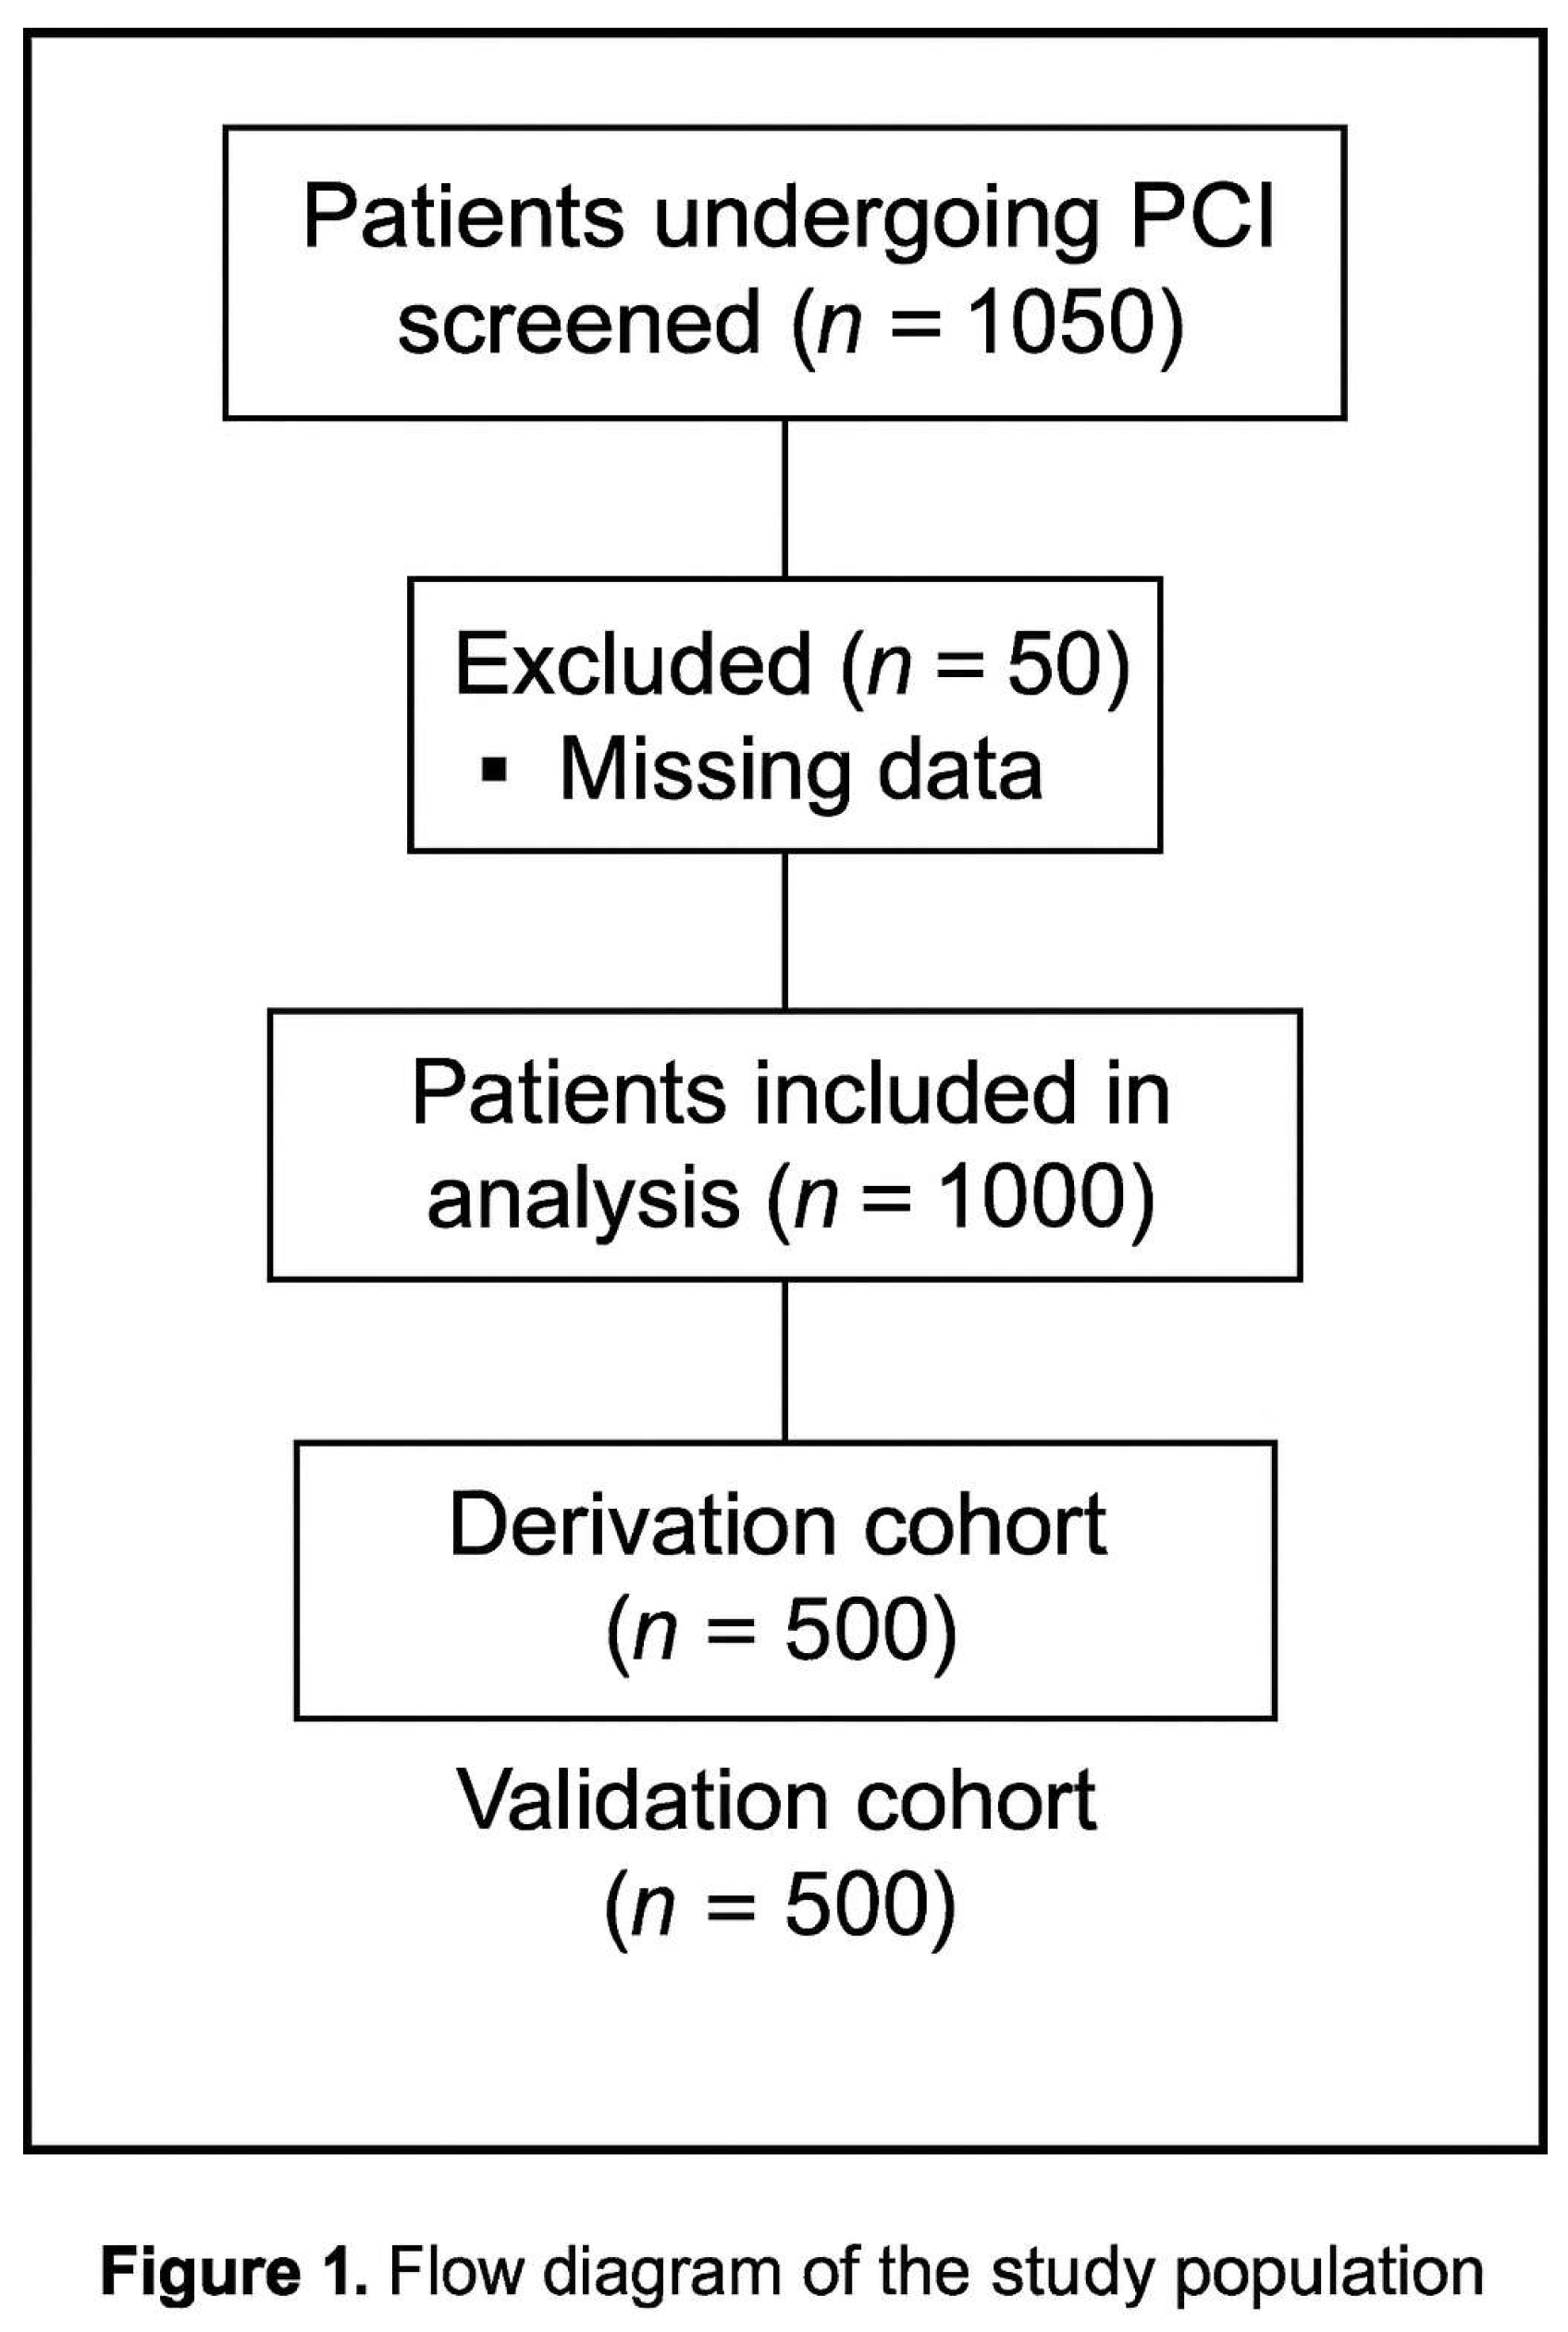
Figure 2.
ROC curve comparison of the novel MENT score with CHA₂DS₂-VASc and Mehran scores for predicting CIN in the validation cohort. AUC values are illustrated for each scoring method.
Figure 2.
ROC curve comparison of the novel MENT score with CHA₂DS₂-VASc and Mehran scores for predicting CIN in the validation cohort. AUC values are illustrated for each scoring method.
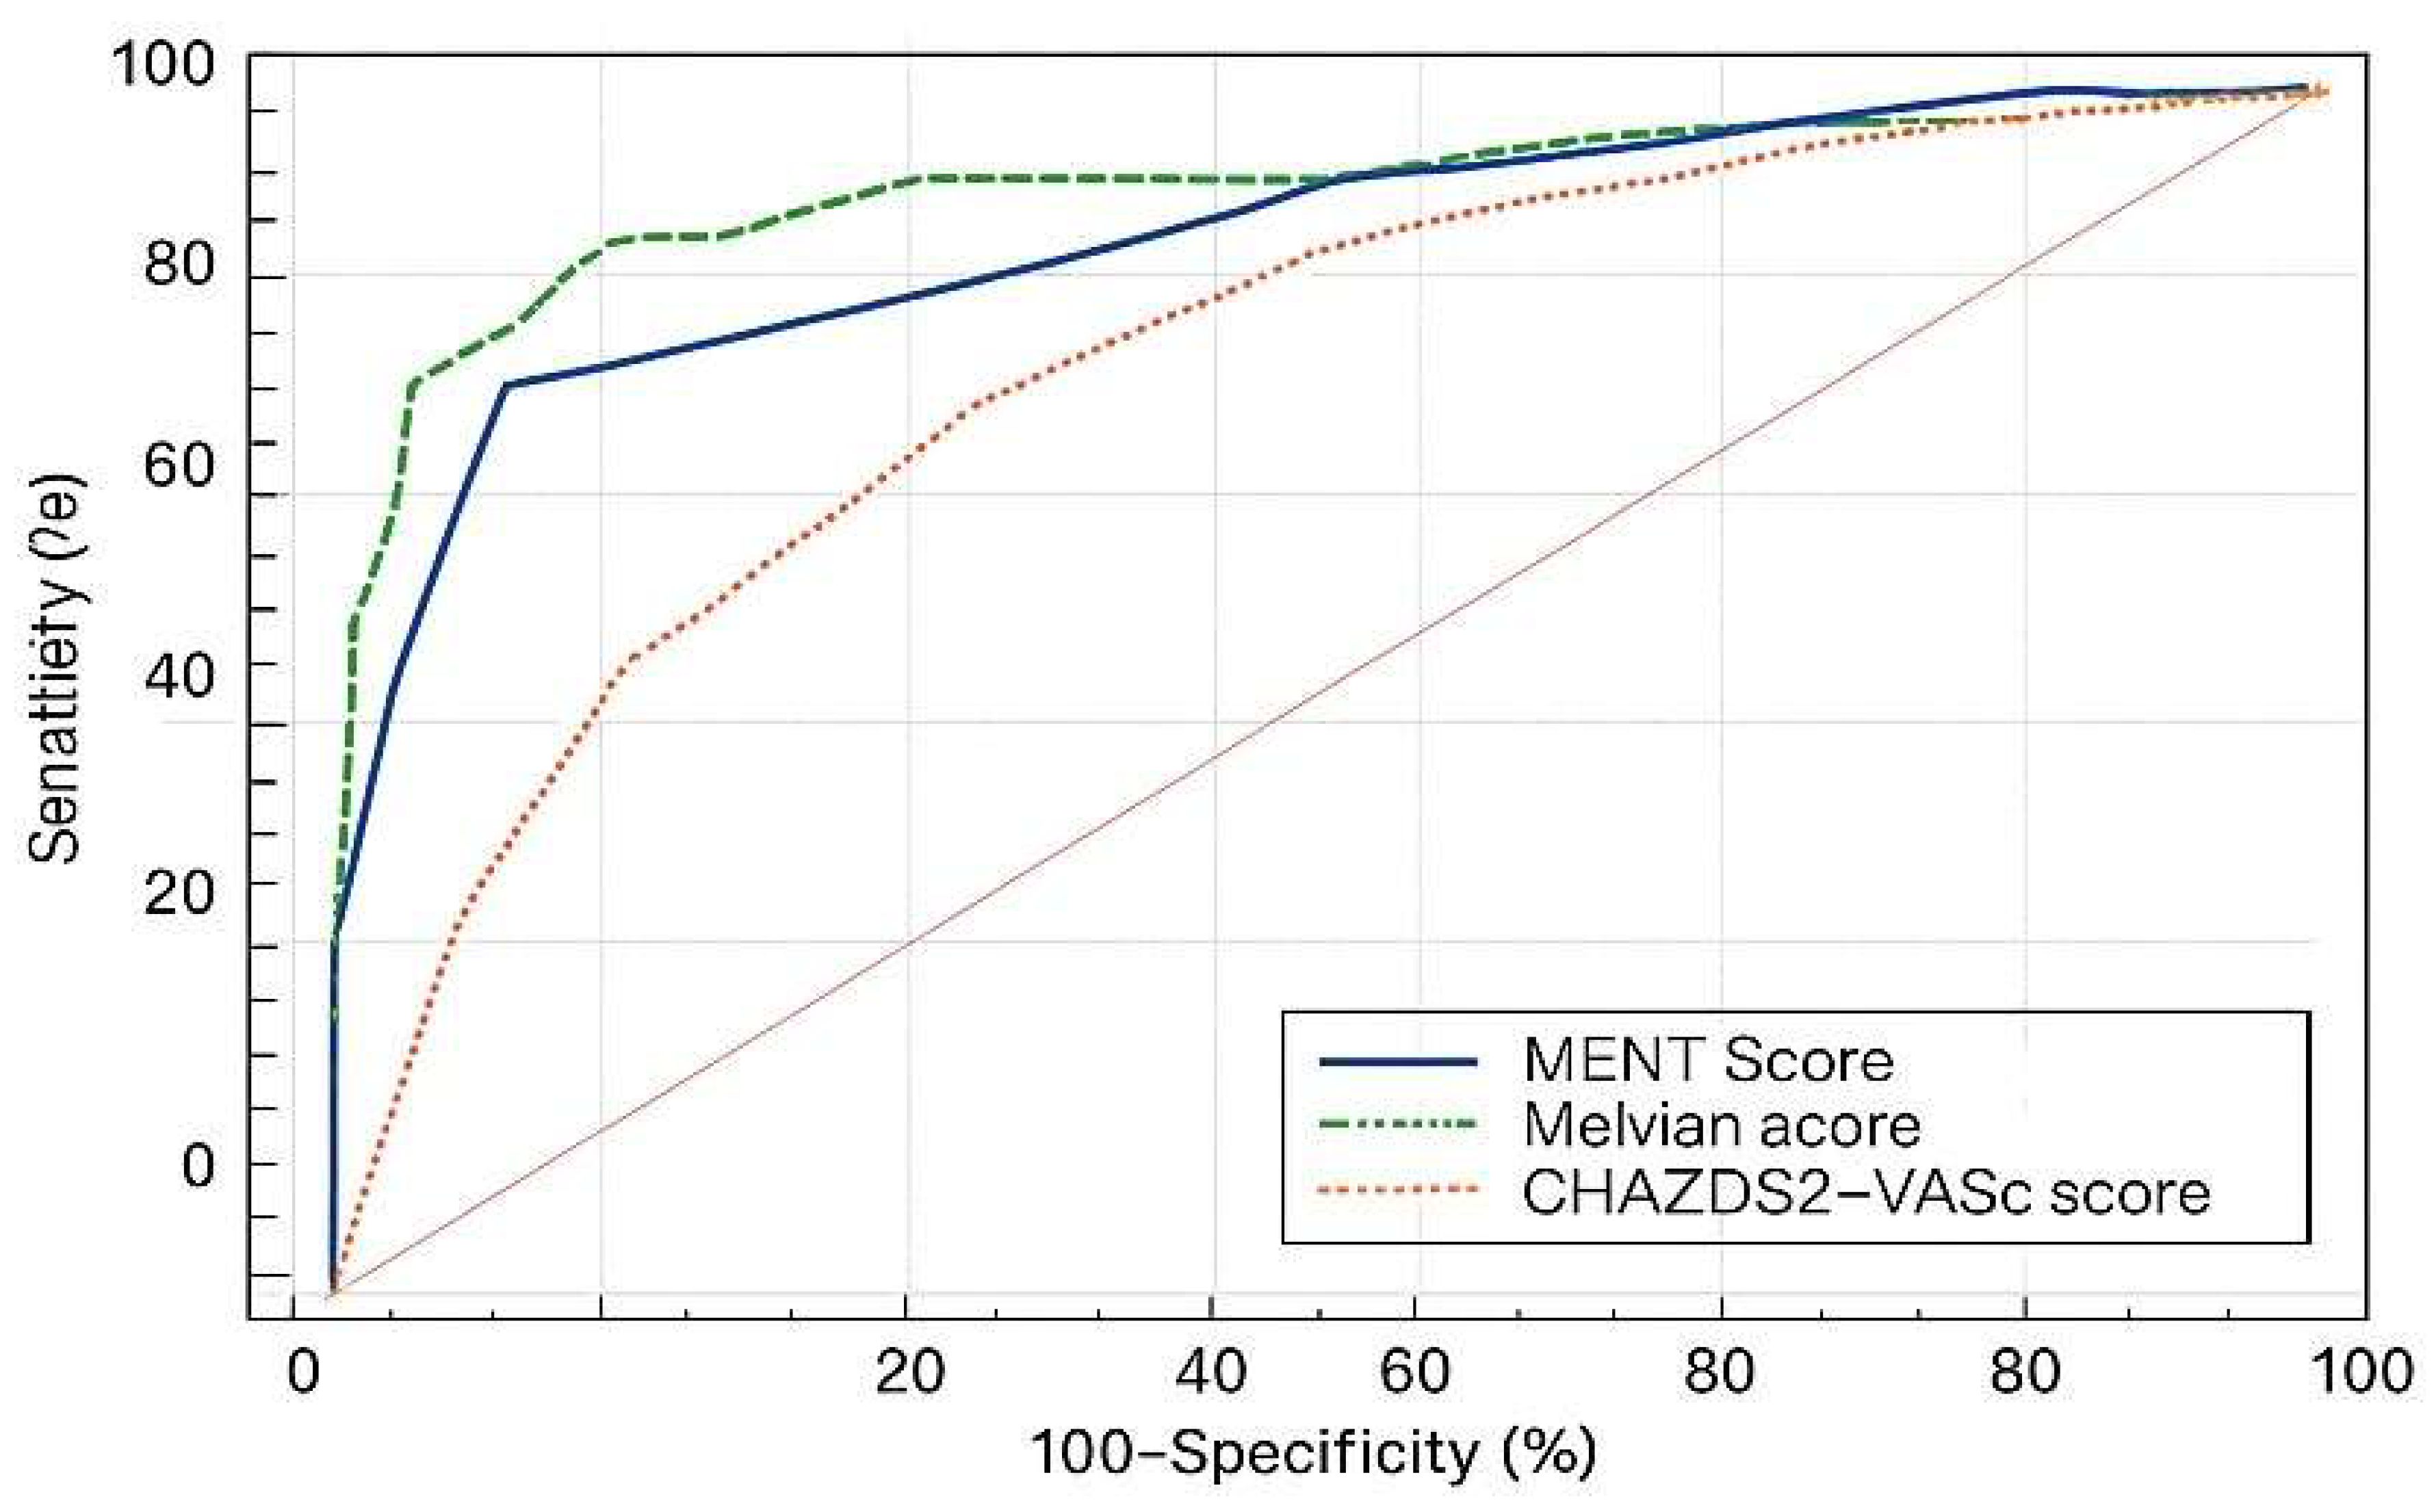
Figure 3.
Schematic representation of the MENT score components: Female sex, PAD, diabetes mellitus, hypotension (SBP ≤80 mmHg requiring inotropes), contrast volume ≥200 mL, and serum creatinine >1.5 mg/dL.
Figure 3.
Schematic representation of the MENT score components: Female sex, PAD, diabetes mellitus, hypotension (SBP ≤80 mmHg requiring inotropes), contrast volume ≥200 mL, and serum creatinine >1.5 mg/dL.
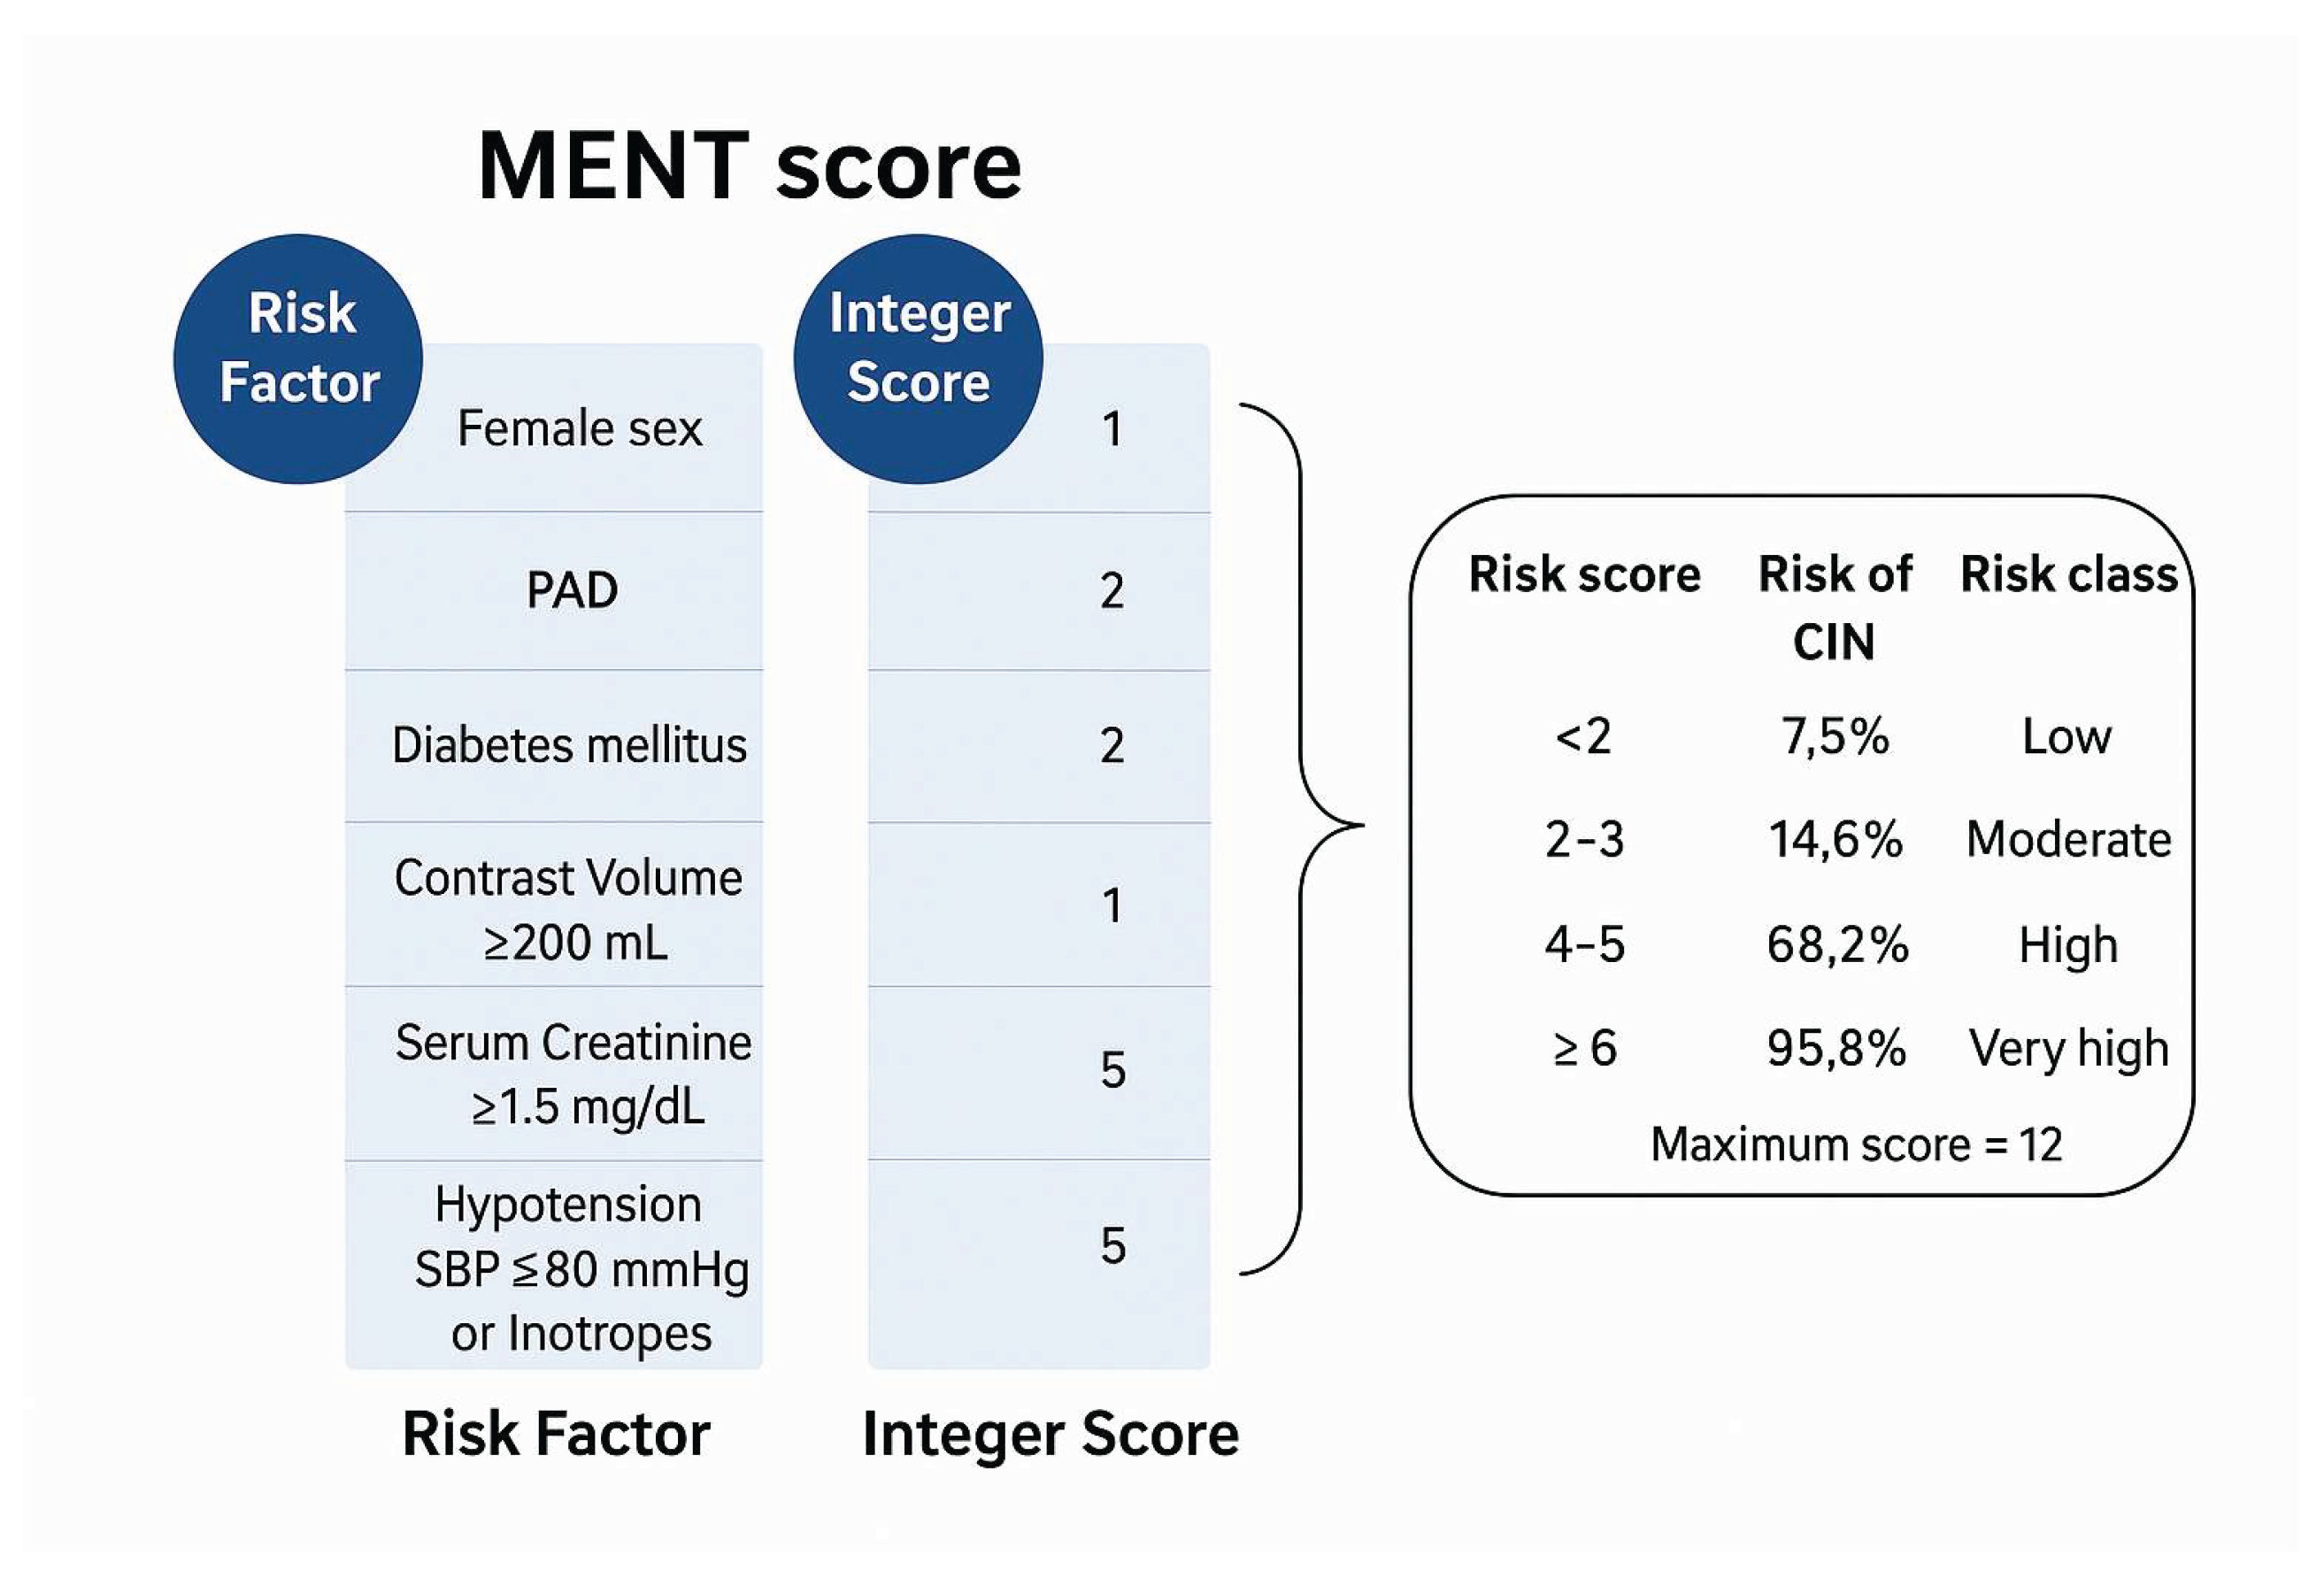

Table 1.
Baseline demographic, clinical, and procedural characteristics of the derivation cohort (n = 500). Data are presented as counts and percentages.
Table 1.
Baseline demographic, clinical, and procedural characteristics of the derivation cohort (n = 500). Data are presented as counts and percentages.
| Variable | N | % | |
| Age category | <65 years | 318 | 63.6% |
| 65-74 years | 146 | 29.2% | |
| >75 years | 36 | 7.2% | |
| + | 182 | 36.4% | |
| Sex | Female | 160 | 32.0% |
| Male | 340 | 68.0% | |
| Hypertension | - | 188 | 37.6% |
| + | 312 | 62.4% | |
| DM | - | 264 | 52.8% |
| + | 236 | 47.2% | |
| DVT | - | 492 | 98.4% |
| + | 8 | 1.6% | |
| TIA | - | 500 | 100.0% |
| + | 0 | 0.0% | |
| Stroke | - | 476 | 95.2% |
| + | 24 | 4.8% | |
| Aortic plaque | - | 500 | 100.0% |
| + | 0 | 0.0% | |
| PAD | - | 472 | 94.4% |
| + | 28 | 5.6% | |
| Old MI | - | 96 | 19.2% |
| + | 404 | 80.8% | |
| HCM | - | 500 | 100.0% |
| + | 0 | 0.0% | |
| NYHA III/IV | - | 440 | 88.0% |
| + | 60 | 12.0% | |
| EF ≤40% | - | 340 | 68.0% |
| + | 160 | 32.0% | |
| IABP | - | 498 | 99.6% |
| + | 2 | 0.4% | |
| Type of PCI | Secondary | 288 | 57.6% |
| Primary | 212 | 42.4% | |
| Contrast volume | <100 ml | 28 | 5.6% |
| 100 ml | 242 | 48.4% | |
| 200 ml | 182 | 36.4% | |
| 300 ml | 30 | 6.0% | |
| 400 ml | 14 | 2.8% | |
| 500 ml | 0 | 0.0% | |
| 600 ml | 4 | 0.8% | |
| Contrast volume ≥200 ml | - | 270 | 54.0% |
| + | 230 | 46.0% | |
| SBP ≤80 mmHg / Need for inotropes | - | 478 | 95.6% |
| + | 22 | 4.4% | |
| eGFR | ≥60 ml/min | 176 | 70.4% |
| 40 - <60 ml/min | 49 | 19.6% | |
| 20 - <40 ml/min | 15 | 6.0% | |
| <40 ml/min | 10 | 4.0% | |
| eGFR <60 ml/min | - | 352 | 70.4% |
| + | 148 | 29.6% | |
| Baseline creatinine >1.5 mg/dl | - | 432 | 86.4% |
| + | 68 | 13.6% | |
| Anemia | - | 334 | 66.8% |
| + | 166 | 33.2% | |
| CHA2DS2-VASc risk for CIN | Nil | 10 | 2.0% |
|
Low |
180 | 36.0% | |
| Moderate | 112 | 22.4% | |
| High | 124 | 24.8% | |
| Very high | 74 | 14.8% | |
| Mehran risk for CIN | Low | 284 | 56.8% |
| Moderate | 136 | 27.2% | |
| High | 74 | 14.8% | |
| Very high | 6 | 1.2% | |
| Creatinine rise ≥0.5 mg/dl | - | 440 | 88.0% |
| + | 60 | 12.0% | |
| Creatinine increase ≥25% above baseline | - | 394 | 78.8% |
| + | 106 | 21.2% | |
| Criteria for CIN | Nil (No CIN) | 382 | 76.4% |
| Creatinine rise ≥0.5 mg/dl only | 12 | 2.4% | |
| Creatinine rise ≥25% above baseline only | 58 | 11.6% | |
| Creatinine rise ≥0.5 mg/dl and ≥25% above baseline | 48 | 9.6% | |
| CIN (Creatinine rise ≥0.5 mg/dl or Creatinine increase ≥25% above baseline) | No CIN | 382 | 76.4% |
| CIN | 118 | 23.6% |
Data are number (N) and percentage (%). Primary PCI: STEMI, hemodynamically unstable NSTEMI. Elective PCI: Unstable angina, hemodynamically stable NSTEMI, CCS planned for CA.
Table 2.
Unadjusted odds ratios for the occurrence of contrast-induced nephropathy (CIN). Data show row percentages, odds ratios (OR), 95% confidence intervals (CI), Z-statistics, and p-values.
Table 2.
Unadjusted odds ratios for the occurrence of contrast-induced nephropathy (CIN). Data show row percentages, odds ratios (OR), 95% confidence intervals (CI), Z-statistics, and p-values.
| Variable | No CIN (N=382) | CIN (N=118) |
Unadjusted odds ratio |
Z | p-value | ||||
| N | % | N | % | OR | 95% CI | ||||
| Age ≥65 years | - | 258 | 81.1% | 60 | 18.9% | 2.011 | 1.111 to 3.641 | 2.308 | 0.021 |
| + | 124 | 68.1% | 58 | 31.9% | |||||
| Male sex | - | 104 | 65.0% | 56 | 35.0% | 0.414 | 0.227 to 0.756 | 2.869 | 0.004 |
| + | 278 | 81.8% | 62 | 18.2% | |||||
| Hypertension | - | 158 | 84.0% | 30 | 16.0% | 2.069 | 1.077 to 3.975 | 2.183 | 0.029 |
| + | 224 | 71.8% | 88 | 28.2% | |||||
| DM | - | 228 | 86.4% | 35 | 13.6% | 3.372 | 1.805 to 6.301 | 3.812 | 0.0001 |
| + | 154 | 65.3% | 82 | 34.7% | |||||
| DVT | - | 376 | 76.4% | 116 | 23.6% | 1.081 | 0.110 to 10.587 | 0.0665 | 0.947 |
| + | 6 | 75.0% | 2 | 25.0% | |||||
| TIA | - | 382 | 76.4% | 118 | 23.6% | NC | - | - | - |
| + | 0 | 0.0% | 0 | 0.0% | |||||
| Stroke | - | 362 | 76.1% | 114 | 23.9% | 0.635 | 0.135 to 2.984 | 0.575 | 0.565 |
| + | 20 | 83.3% | 4 | 16.7% | |||||
| Aortic plaque | - | 382 | 76.4% | 118 | 23.6% | NC | - | - | - |
| + | 0 | 0.0% | 0 | 0.0% | |||||
| PAD | - | 370 | 78.4% | 102 | 21.6% | 4.837 | 1.605 to 14.573 | 2.801 | 0.005 |
| + | 12 | 42.9% | 16 | 57.1% | |||||
| Old MI | - | 76 | 79.2% | 20 | 20.8% | 1.217 | 0.565 to 2.621 | 0.502 | 0.616 |
| + | 306 | 75.7% | 98 | 24.3% | |||||
| HCM | - | 382 | 76.4% | 118 | 23.6% | NC | - | - | - |
| + | 0 | 0.0% | 0 | 0.0% | |||||
| EF ≤40% | - | 276 | 81.2% | 64 | 18.8% | 2.197 | 1.203 to 4.012 | 2.562 | 0.010 |
| + | 106 | 66.3% | 54 | 33.8% | |||||
| IABP | - | 382 | 76.7% | 118 | 23.3% | 9.821 | 0.395 to 244.326 | 1.393 | 0.164 |
| + | 0 | 0.0% | 1 | 100.0% | |||||
| NYHA III/IV | - | 342 | 77.7% | 98 | 22.3% | 1.745 | 0.766 to 3.973 | 1.326 | 0.185 |
| + | 40 | 66.7% | 20 | 33.3% | |||||
| Primary PCI | - | 234 | 81.3% | 54 | 18.8% | 1.874 | 1.040 to 3.378 | 2.089 | 0.037 |
| + | 148 | 69.8% | 64 | 30.2% | |||||
| Contrast volume≥200 ml | - | 220 | 81.5% | 50 | 18.5% | 1.847 | 1.023 to 3.334 | 2.035 | 0.042 |
| + | 162 | 70.4% | 68 | 29.6% | |||||
| SBP ≤80 mmHg | - | 378 | 79.1% | 100 | 20.9% | 17.010 | 3.562 to 81.238 | 3.552 | 0.0004 |
| + | 4 | 18.2% | 18 | 81.8% | |||||
| eGFR <60 ml/min | - | 284 | 80.7% | 68 | 19.3% | 2.131 | 1.158 to 3.922 | 2.431 | 0.015 |
| + | 98 | 66.2% | 50 | 33.8% | |||||
| Baseline creatinine >1.5 mg/dl | - | 346 | 80.1% | 86 | 19.9% | 3.576 | 1.686 to 7.584 | 3.323 | 0.001 |
| + | 36 | 52.9% | 32 | 47.1% | |||||
| Anemia | - | 274 | 82.0% | 60 | 18.0% | 2.453 | 1.346 to 4.468 | 2.932 | 0.003 |
| + | 108 | 65.1% | 58 | 34.9% | |||||
Data are number (N) and row percentage (%). 95% CI = 95% confidence interval, NC =not calculable, OR = odds ratio, Z = Z-statistic. This table shows the significant dependant and non-dependant variables (p-value <0.05) detecting the risk of CIN.
Table 3.
Multivariable logistic regression model for predictors of CIN. Variables retained after backward elimination are shown with coefficients (B), standard errors (SE), adjusted odds ratios [Exp(B)], 95% CIs, and significance values.
Table 3.
Multivariable logistic regression model for predictors of CIN. Variables retained after backward elimination are shown with coefficients (B), standard errors (SE), adjusted odds ratios [Exp(B)], 95% CIs, and significance values.
| Variable* | 95% CI for Exp (B) | |||||||
| B | SE | Wald | Df | p-value | Exp (B) | Lower | Upper | |
| Female sex (=1) | 0.918 | 0.352 | 6.824 | 1 | 0.009 | 2.505 | 1.258 | 4.989 |
| DM (=1) | 1.124 | 0.365 | 9.494 | 1 | 0.002 | 3.077 | 1.505 | 6.290 |
| PAD (=1) | 1.436 | 0.623 | 5.314 | 1 | 0.021 | 4.206 | 1.240 | 14.263 |
| Contrast volume ≥200 ml (=1) | 0.650 | 0.345 | 3.542 | 1 | 0.060 | 1.916 | 0.973 | 3.770 |
| SBP ≤80 mmHg or need for inotropes (=1) | 3.038 | 0.873 | 12.116 | 1 | 0.0005 | 20.864 | 3.771 | 115.426 |
| Baseline creatinine >1.5 mg/dl (=1) | 0.905 | 0.446 | 4.110 | 1 | 0.043 | 2.471 | 1.030 | 5.925 |
| Constant | -2.892 | 0.392 | 54.576 | 1 | 0.000 | 0.055 | ||
B = regression coefficient, SE = standard error, Wald = Wald chi-squared statistic, df = degree of freedom, Exp (B) = adjusted odds ratio, 95% CI = 95% Confidence interval. This table shows the dependant significant variables for detecting CIN risk after binary logistic regression model.
Table 4.
Receiver operating characteristic (ROC) curve criteria for the novel CIN risk score tested on the validation cohort. Sensitivity, specificity, confidence intervals, and accuracy are presented for the optimal cutoff.
Table 4.
Receiver operating characteristic (ROC) curve criteria for the novel CIN risk score tested on the validation cohort. Sensitivity, specificity, confidence intervals, and accuracy are presented for the optimal cutoff.
| Criterion | Sensitivity | 95% CI | Specificity | 95% CI | Youden index | Accuracy |
| >3 | 72.6 | 60.9 - 82.4 | 91.5 | 86.4 - 95.2 | 0.641 | 0.860 |
Table 5.
Estimated CIN risk stratified by score thresholds from the novel MENT Score (range: 0–12). Four risk categories and corresponding event probabilities are shown.
Table 5.
Estimated CIN risk stratified by score thresholds from the novel MENT Score (range: 0–12). Four risk categories and corresponding event probabilities are shown.
| New CIN Risk Score* | <2 | 2-3 | 4-5 | ≥6 |
| Risk class | Low | Moderate | High | Very high |
| Estimated risk of CIN | 7.5% | 14.6% | 68.2% | 95.8% |
*. Maximum score = 12.
Table 6.
Comparative ROC curve values for the derivation and validation cohorts. The MENT score showed AUCs of 0.770 and 0.861, respectively, compared to CHA₂DS₂-VASc and Mehran scores.
Table 6.
Comparative ROC curve values for the derivation and validation cohorts. The MENT score showed AUCs of 0.770 and 0.861, respectively, compared to CHA₂DS₂-VASc and Mehran scores.
| Variable |
AUC of study sample |
Variable |
AUC of validation sample |
| New CIN risk score | 0.770 | New CIN risk score | 0.861 |
| Mehran score | 0.737 | CHA2DS2-VASc score | 0.752 |
|
CHA2DS2- VASc score |
0.656 | Mehran score | 0.901 |
Disclaimer/Publisher’s Note: The statements, opinions and data contained in all publications are solely those of the individual author(s) and contributor(s) and not of MDPI and/or the editor(s). MDPI and/or the editor(s) disclaim responsibility for any injury to people or property resulting from any ideas, methods, instructions or products referred to in the content. |
© 2025 by the authors. Licensee MDPI, Basel, Switzerland. This article is an open access article distributed under the terms and conditions of the Creative Commons Attribution (CC BY) license (https://creativecommons.org/licenses/by/4.0/).
Copyright: This open access article is published under a Creative Commons CC BY 4.0 license, which permit the free download, distribution, and reuse, provided that the author and preprint are cited in any reuse.


