
Submitted:
01 July 2024
Posted:
02 July 2024
You are already at the latest version
Abstract
Understanding the dynamics of land use and land cover (LULC) change in today's context of rapid urbanization is critical for sustainable urban planning and environmental conservation.
Therefore, the research aim is to understand the LULC changes in Chattogram Metropolitan Area and to assess the policy implications of these changes for sustainable urban development. Through a comparative analysis of LULC maps for two periods (1997–2007; 2007–2017), we investigated the transformation of a detailed planning zone before and after detailed area plan (DAP) approval. Using a mixed-method approach integrating quantitative data with policy analysis, we elucidated the impacts of urbanization trends on local ecosystems—specifically the conversion of forest cover and waterscape use. The findings reveal a significant conversion of forested and waterscape areas to urban and peri-urban landscapes, highlighting the urgent need for sustainable planning interventions that focus on these peri-urban areas. The study further critiques the DAP's effectiveness, revealing a disconnect between regional policy implementation and local outcomes. This research proposes a validated, scalable framework for urban master plans that adapts to the complex socio-ecological contexts of rapidly urbanizing regions.
Keywords:
Comparative Analysis
; LULC
; Land use Planning and Management
; Peri-urban Chattogram
; Peri-urban Landscape Dynamics
; Remote Sensing Analysis
; Sustainability
1. Introduction
The prioritization of peripheral urban (or 'peri-urban') landscapes is essential for enhancing sustainable development and management in metropolitan areas worldwide. Notably, this need is not limited to ensuring environmental protection against natural disasters and vulnerability [1] but also extends to promoting positive social behavior [2,3] and maximizing economic benefits [4,5,6], and land use activities [7,8,9,10]. According to the World Urbanization Prospects [11], the current global urban population stands at 55%, with projections indicating a rise to 68% by 2050. Concurrently, there is the gradual occurrence of rural-urban migration and economic development in the peri-urban region [2,12]. It is also commonly acknowledged that developing nations have the fastest urban growth rate [8,13,14,15]. One explanation is that spatial planning, particularly urban planning, encounters various social, economic, and political problems that obstruct organized urban growth, leading to urban sprawl [2]. This poses significant risks to land use planning and the sustainability of cities in the global south [8,15].
Land use changes play a pivotal role in urbanization processes as they are both a consequence of human activities related to land development and a catalyst for transforming natural environments[7,9]. In most cases, unregulated LULC alterations tend to transition towards peri-urban regions [16,17]. Nevertheless, comprehending the dynamic alterations in LULC and their impacts on the configuration of landscapes provides a significant obstacle for professionals in natural resource management and urban planning [1,18]. Hence, it is imperative to prioritize the inclusion of urban periphery landscape settings into urban planning processes. This involves incorporating human population growth and urban development patterns, focusing on environmental preservation and conservation efforts within landscape settings to drive changes in land use and land cover. Land use planning aims to allocate different land uses efficiently within a landscape to ensure optimal and suitable utilization. [14].
Current data indicates that urbanization in Asia is nearing 50%, with forecasts predicting that the urban population will reach over 90% by 2050. [11]. Urbanization resulting from population growth and dense settlement structures will create concentrated stress in small cities and their surrounding areas, particularly in Latin America and Asia. [8,9,13,15]. This will lead to unsustainable impacts on peripheral landscapes and ecological services [7,15].
In Chattogram, Bangladesh, rapid agglomeration of urban centers and peri-urbanization are evident through the expansion of human settlements, industries, and roads [19]. Chattogram was ranked as the 20th largest urban area in 2023, according to Demographia (Demographia, 2023). T. This impacts the surrounding green environment and its ecological value [1]. Examining urban expansion trends in small and medium-sized cities and towns is crucial for ensuring sustainable urbanization in the future. It is also important to realign urban policy accordingly.
Peri-urban areas in the Global South, particularly in Bangladeshi cities, have received less research attention compared to cities in the Global North. The unique and evolving characteristics of Bangladesh's peri-urban regions remain underexplored, highlighting a gap in understanding their LULC dynamics [1]. Furthermore, existing studies have shown that stakeholder involvement at the regional scale of Chattogram Metropolitan Area (CMA) significantly impacts land use planning and decision-making processes in these peri-urban landscapes [1]. Despite this, there is still a noticeable absence of research focusing on how changes in the local landscapes influence land use planning. The existing literature lacks studies that compare and integrate regional and local scales of LULC changes in peri-urban areas. Past research showed a 14% reduction in green coverage at the regional level in peri-urban areas of CMA [1]. However, it remains unclear how this loss manifests itself locally. So, the utilization of LULC data at the regional level is greatly impeded by the absence of comprehensive data at the local level. Therefore, difficulties arise from the lack of local spatial data needed to create databases and models that assist in sustainable urban land use planning and decision-making processes. Hence, this research attempts to demonstrate a clear and indisputable connection between the comprehensive LULC data on regional and local scales and urban and regional planning. Notably, the study has addressed the following questions: (1) What are the LULC change scenarios at different levels in the peri-urban landscape? (2) what are the conflict land use practices at the regional and local levels? Furthermore, (3) What can be foreseen for future urban planning and management concerning LULC?
The study focuses on the CMA, the second-largest metropolitan area in Bangladesh. The CMA represents one of the fastest-growing urban areas in recent decades. Urban expansion and peri-urbanization are visible in the CMA and have been acknowledged in the detailed area plan (DAP) for the Chattogram Metropolitan Master Plan (CMMP) 2009-2015, approved by the Ministry of Housing and Public Works and Chattogram Development Authority (CDA) in 2007/2008. This study investigates the LULC of a selected detailed planning zone (DPZ) of the DAP through a comparative analysis between regional and local scales based on classifying and combining satellite images taken over the past 20 years (i.e., 1997–2007 and 2007–2017), which were collected before and after the approved DAP of the CMMP. In conclusion, the present study provides a comprehensive overview (Figure 1) of the gaps in current practices, offering actionable insights and recommendations to improve local landscape planning approaches for enhanced environmental conservation in the face of rapid urbanization and peri-urbanization trends in the CMA.
1.1. Sustainable Land Use Planning and Management (SLUPM) Framework Overview
Peri-urban areas, which serve as a transitional zone between rural and urban areas [16], encompass valuable protected biotopes (Huang et al., 2009), forested and non-forested hills [17], prime agricultural lands [6], and crucial wetlands [21]. However, urbanization in urban peripheries still occurs under the radar [1], which has a significant impact on water and food provision, as well as biodiversity and culture loss [22,23,24,25,26].
Certain cities have encountered challenges in landscape management [7,24,27], whereby inadequate strategic planning for and maintenance of (peri-)urban landscapes can result in diminished productivity, the decreased availability of green spaces, and a weakened co-beneficial relationship across various domains (Vejre et al., 2010). Moreover, the United Nations Sustainable Development Goals have been prioritized in the future development plans of many metropolitan areas in developing countries [28]. The configuration of peri-urban land and the intended use of physical space for future development have emerged as essential considerations in urban planning [29]. These plans have focused on various aspects such as energy-efficient building design, rainwater harvesting systems, the implementation of mass rapid transit, and achieving socioeconomic balance. However, there has been a lack of emphasis on the landscape as a basis for fundamental planning (Nijhuis, 2022), where comprehending the analysis of various land use and land cover (LULC) data is vital [7,31,32,33]. Several scholarly articles have provided definitions of the phenomenon wherein the need for land for urban expansion, including the establishment of peripheral industrial developments, has resulted in significant and detrimental alterations to LULC [1,6,19,32,34,35]. These changes have posed increased risks to peri-urban landscape areas at both local and regional scales [1]. Based on findings from the Federal Environment Agency of Germany [36], 100 million ha of land is projected to be required for urban development worldwide by 2050. This significant demand for land is expected to result in substantial changes in LULC, impacting the overall landscape system and configuration locally [33,35], regionally [1,37], and globally [17,38]. Notably, local areas have experienced a loss of nearly 80% of their natural ecosystems [38].
Despite the biodiversity losses and ecological changes in peri-urban landscape settings at the local scale, regional results have dominated the urban planning process [7]. Rojas et al. (2013) provided an explicit quantitative assessment to set regional data into decision-making stages for preparing a metropolitan development plan by detecting LULC using satellite images. The findings indicate a relentless urbanization pressure characterized by exploiting regional natural resources and unbridled population growth. Gerard (2010) applied a comparable methodology in the metropolitan regions of Europe and noted that SLUPM was influenced by urbanization pressures in metropolitan areas, albeit with variations at the local level. Similarly, Henríquez et al. (2023) also claimed that local-level LULC changes have tremendous potential and advantages for urban-regional planning, but the effects must be considered at different scales to avoid spatial conflicts. Analyses at the local scales can emphasize the real land use and land cover changes and illustrate the relationship between SLUPM and urbanization pressures. Kleemann et al. (2017) suggested that national land use plans should take into account local conditions. The appreciation of the importance of local conditions in informing national policy is illustrated by Ghana's land use management system, which is characterized by a bottom-up approach [14]. In light of these insights, K and Angadi (2021) underscore the urgency of extending these studies to encompass the urban dynamics of small and medium cities, thereby enriching our understanding of urbanization's diverse impacts across different urban scales
The dynamic interplay between landscape and urban land uses frequently results in conflicts, highlighting the critical need for a nuanced understanding of the interactions between local and regional landscapes in sustainable planning. Nevertheless, the application of effective methodologies to thoroughly assess these vital links remains surprisingly scarce, despite the acknowledged significance of these relationships in the literature [2,7,8,13,14,15]. This gap often results in urban planning decision-making processes that overlook the significance of integrating specific, localized outcomes, thereby risking the effectiveness of planning initiatives [2,24,39]. research in peri-urban planning and management has tended to focus either predominantly on regional or local scales, neglecting the nuanced interdependencies between these spatial dimensions. Furthermore, there is a notable lack of investigation into the constraints and potentials of land use planning in leveraging landscape resources. Addressing this knowledge deficit, the research aims to bridge these gaps by offering a comprehensive understanding of the diverse spatial significances at the decision-making stage, as illustrated in Figure 1.
Planning is often complex for smaller cities in developing countries due to insufficient expert knowledge, spatial data, tools, and land use information [8]. In recent years, there has been a rise in the use of spatially detailed analyses to assess the effects of urbanization at various scales by considering future LULC changes [39]. Consequently, this study seeks to remedy the methodological void in urban land use planning, discussed above, by implementing a comparative analysis framework, thereby enriching spatial data utilization across different scales.
2. Materials and Methods
2.1. Study Area
This section pertains to various land use categories encompassing rural, peri-urban, and urban areas within three unions (Sonaichhari (B), Bhatiari (C), and Salimpur (D)) located in the Sitakunda Sub-district of the CMA. These unions are situated between 22° 22′ to 22° 29′ N and 91° 42′ to 91° 47′ E (see Figure 2). The area is surrounded by diverse geographical features, including the Bay of Bengal to the west, a core zone (A) to the north, and hilly regions to the northeast, east, and south, which form the Chattogram City Corporation boundary. The research region is categorized as DPZ7, which is one of the 12 DPZs within the CMA [40].
The region includes vast cultural and natural landscapes, such as a large coastal plain, forested hills, mangrove forests, and village woodlands. An officially designated buffer zone improvement project is located in Sonaichhari Union (SoU/Zone B), with natural resources in rural and peri-urban settings. The second union, 'BU/Zone C,' has less landscape geography and a fully peri-urban backdrop. However, in the DAP, Salimpur union (SU/Zone D) is entitled to a mixed land use area containing more urban settings rather than peri-urban characteristics with limited landscape resources.
2.2. The DAP of CMMP for DPZ7
The DAP, approved in 2007/2008, was devised to guide and manage the CMMP, which also builds upon the foundational Structure Plan (1995–2015) and Urban Development Master Plan (1995–2005). The CMMP's primary aim was to facilitate planned development from 2009 to 2015, with a focus on ensuring a sustainable environment. The proposal for DPZ7 illustrates a spatial zoning plan to strengthen and execute physical and socioeconomic development, which has welcomed population growth, resulting in additional rural-urban migration. Large-scale peripheral expansions, whether in housing projects or industrial developments, have been implemented. The plan has prioritized the development of environmental protections to reduce the impact of development on the environment. This includes implementing programs to preserve hilly landscapes as 'strategic open space,' establishing a linear coastal afforestation program, creating a green walkway along lakes and river belts, expanding coastal mangrove forests, developing green corridors along coastal areas, and safeguarding all bodies of water.
2.3. Preparing LULC Maps Combining 1997, 2007, and 2017 Data to Detect LULC
LULC maps from 1997 and 2017 were obtained for the study region using Landsat satellite (LS) images corresponding to periods both before and after the DAP approval, respectively, whereas 2007 was the survey period for the baseline data of the DAP. These were acquired for the study region, which was already ortho-rectified. The properties of the images are presented in Table 1.
Using ArcGIS 10.1 and maximum likelihood classification, five thematic LULC categories were produced from the LS images. According to Rojas et al. (2013), this is a blended characterization method employed in LS symbolism. Figure 3 presents the five land classes that were obtained: (1) Vegetation: Bushes, hilltop plants, and forests; (2) Built-up area/human activities: Areas occupied by cities or industrial facilities and ship-breaking yards; (3) Waterscapes: Ocean, rivers, lakes, canals, wetlands, and ponds; (4) Bare soil: Regions that have been chopped down, burned, cleared of forests, or otherwise devoid of vegetation; (5) Sandy surfaces: Open beaches and empty sandy soil fill.
The land cover classifications were arranged by utilizing training sites (signature files) submitted to a measurable examination of likeness that encouraged recognizing the separation between consecutively consolidated classes and their segregation. The characterizations were approved through the affirmation of specific ground control points. The land cover maps were approved with 100 previously chosen points in regions that did not change among the maps and were strategically available. Temporal pictures from Google Earth were utilized as references for creating approving points in the 1997 and 2007 maps, while the most recent (2017) images were approved by acquiring ground control points through field visits. Twenty arbitrary points for each of the five land cover classes were utilized to validate the three maps. For the TM (Thematic Mapper) and ETM (Enhanced Thematic Mapper) images, the band combination 432 was used while training samples were collected. For Landsat 8 images, the band combination was 543. The general measurable exactness of the 1997 guide was 88% (kappa index (KI)=0.85). The producer’s accuracy of each land cover class (in descending order) was as follows: vegetation (100%); barren soil (95%); waterscapes (85%); built-up area (80%); sand fill (80%). In the 2007 guide, the approval revealed KI=0.94 with 95% general exactness. The producer’s accuracy estimates for each land cover class were as follows (in descending order): built-up area (100%), barren soil (100%), sand fill (100%), vegetation (95%), and waterscapes (80%). The overall accuracy of the 2017 map was 87% (KI=0.84). The producer’s accuracy of each land cover classification (in descending order) was as follows: barren soil (100%), vegetation (95%), built-up area (95%), sand fill (90%), and waterscapes (55%).
2.4. Cross-Transition Matrix for Comparative Analysis
This study compared land use and land cover (LULC) data from different periods to analyze changes and trends. It focused on assessing the increases and decreases in each LULC category. To quantify these changes, a cross-tabulation method known as a cross-transition matrix (CTM) was employed, as detailed in Table 6 in the Appendix [41]. This method was used to analyze how the transitions between categories vary at different scales (e.g., local, regional) in order to identify the factors influencing LULC change. It was observed that the factors influencing LULC change were inconsistent when considering the area percentage under each category.
2.5. Forecasting the Future Scenario of DPZ7
Based on expected urban expansion and the entire development of DPZ7 (e.g., housing, industries, land, and road development, and shipbreaking yard extensions), a preliminary forecast was prepared by comparing the proposed DPZ7 of the CMMP for 2015 onward with the LULC map of 2017 using the zonal analysis in GIS obtained from each of the LULC categories.
3. Results
The discourse and examination presented here offer an intricate exploration of the dynamic shifts in demographics and land use within DPZ7, a significant region earmarked for planning purposes in Bangladesh. In addition to transitioning seamlessly into an exploration of LULC transformations across discrete intervals (1997–2007 and 2007–2017), the analysis meticulously unravels the nuanced alterations in pivotal categories (e.g., vegetation, built-up areas, waterscapes, bare soil, and sand) operating at both regional and localized scales. Furthermore, this analysis employed a cross-tabulation matrix to elucidate the gains and losses within LULC classifications across defined temporal frameworks and the intricate dynamics between these categories. Foretelling the future trajectory, the present study forecasts prospective LULC changes—particularly those accentuating the envisaged expansion of built-up areas and its potential ramifications on diverse land cover types, including sensitive habitats such as mangrove forests.
3.1. Regional-Level LULC Changes in the 1997–2007 and 2007-2017 Periods
Analyzing the spatial and temporal changes in LULC is one functional method of understanding the current land use scenarios and continuing changes in an area. The land use maps of the separate timelines (1997, 2007, and 2017) extracted from reference maps and satellite images based on visual interpretation illustrate land use classes such as vegetation, built-up, waterscapes, bare soil, and sand.
Table 2 presents the study region’s land use and land cover compositions in 1997, 2007, and 2017, as well as their changes in Figure 4 (a) and (b). In 1997, 2007, and 2017, vegetation covered over 65, 60, and 50% of the designated region, respectively. Both timelines exhibited vegetation cover shifts of nearly 7%. The built-up areas doubled in size between 1997 (by more than 13%) to nearly 26% in 2017. Bare soil increased more than double from 1997–2007 to 2007–2017, from 1.5 to 4%. The two timelines showed contrasts in terms of waterscapes and sand. The sand category increased by approximately 234 ha, from 3.6 to 6% in the first period; however, it decreased by nearly 3.5% in the last period. Finally, although waterscape is a minor category, it lost 3% of its surface area between 1997 and 2007 and witnessed a slight increase from 0.3% to roughly 1.5% of DPZ7 over the last ten years.
3.2. Local-Level LULC Changes in the 1997, 2007, and 2017 Periods
Table 3 presents the percentages of LULC changes in three unions across two study periods. Vegetation cover was the most dominant category. In Sonaichhari Union (SoU), 74% of the land was covered with vegetation in 1997, which remained constant until 2007 and then lost 8% over the past decade. Nearly 50% of waterscapes were restored after a massive reduction from 6 to 0.5% in the initial phase (Figure 5 (a)). However, built-up areas rose from 0.5% to over 10% in 1997–2007 and 2007–2017 (Figure 5 (b)). Later, vegetation cover changes in Bhatiari (BU) were reduced by 8% (1.6%). The built-up areas showed growth of nearly 12% in the first ten years and then less significant growth (nearly 2%) in the following ten years (Figure 5 (c), (d)). Changes in the land cover areas of waterscapes show a similar trend to those in SoU.
In Salimpur (SU), every category changed drastically, and waterscapes disappeared (Figure 5 (e), (f)). The vegetation cover declined dramatically from 69% in 1997 to 46% in 2007. From 1997 to 2007, the built-up area increased from 18% to nearly 34%, whereas from 2007 to 2017, it shrank to approximately 2%. In all time periods, similar trends were observed in the bare soil cover in every union except the moderate increase scenario of SU. Sand cover declined overall, except for the first SoU difference (2.66% in 1997 to 8.30% in 2007).
3.3. Cross-Tabulation Matrix for a Comparative Model of the Local to Regional Landscape
From 1997 to 2007, more than 1,561 ha—corresponding to 24.48% of the study area (approximately 6,377 ha)—changed in the LULC categories. Those changes resulted from gains and losses between categories (Table 4). For the first period, the main gains were observed in built-up areas and bare soil, with increases of approximately 13.5 and over 7%, respectively, corresponding to the replacement of vegetation cover losses at nearly 14% (9.3 and 4.5%, respectively). Another significant decrease in LULC from 1997 to 2007 was observed in waterscapes (nearly 90%).
In the latter period (2007–2017), approximately 29% of the area changed, corresponding to more than 1849 ha. The main gains were observed in the built-up area and bare soil, with increases of approximately 11.5 and 12.02%, respectively, with shifts corresponding to vegetation losses (approximately 5.1 and 8.5%, respectively). Another significant gain of nearly 6.5% was identified for vegetation cover (by built-up area and bare soil; approximately 4.5 and 2.1%, respectively). Simultaneously, the key LULC was observed in waterscapes (gain of 1%).
Table 5 summarizes the percentages of LULC changes in the three unions (SoU, BU, and SU). Considering the local scale, vegetation coverage in SoU was the most dominant LULC category. In contrast, the maximum losses of approximately 10.5% were presented by peri-urbanization, forest clearing, and hill-cutting scenarios from 2007 to 2017. Moreover, a waterscape gain of 3% was observed in the second period. SU experienced more vegetation loss (approximately 47%) over time than BU and SoU (nearly 21 and 15%, respectively). Waterscapes experienced minimal losses and were substituted with urbanized areas, which became highly prevalent in SU between 2007 and 2017. Conversely, there were significant gains in the bare soil of SU, amounting to approximately 22%, which were replaced by vegetation cover in urban areas, accounting for approximately 16% between 2007 and 2017. Simultaneously, there was an increase in vegetation land use, primarily due to afforestation and reforestation, which accounted for approximately 10% in coastal areas and urban peripheries.
3.4. LULC Change Forecasting for DPZ7
According to the DAP (2009–2015), the initial prediction for the future development plan of DPZ7 in the CMMP suggests that the built-up land cover will increase by 1313 ha to reach a total of 4652 ha. This expansion will cover more than 20.5% of DPZ7, resulting in an almost 30% increase in the urban area by 2017. The development of future housing projects, industries, and roads will be implemented in easily accessible land cover, such as vegetation, waterscapes, base soil, and sand (5.1, 0.07, 4.3, and 2.1%, respectively). All LULC will be affected by these urbanization and peri-urbanization trends, including the crucial vulnerable categories such as overall vegetation cover (coastal mangrove forest and hilly forest), by deducting more than 14% from baseline data of 1997–2017 (Figure 6).
3.5. Policy Level Contradictions of CMMP for DPZ7
The 1995 Structure Plan, with a planning horizon until 2015, included several positive intentions to protect green areas; the Urban Development Master Plan (1995-2005) also took into account the protection of natural areas. However, the 2009 revision of the DAP could not uphold these intentions. The land use survey conducted in 2005-2006 revealed that vegetation covered 46.20% of the region's total land area. However, the DAP recommended a decrease to 32.56%, which includes the development of agricultural land of less than 2%. This proposal contradicts the government's plan to protect and improve the management of forest cover. In addition, the Detailed Area Plan (DAP) has introduced and implemented 11 different landscape development programs aimed at improving forestry practices in the planning process. Furthermore, the proposed land use includes ambitious development schemes for 25.51% of the coastline region, disregarding its classification as a highly vulnerable location for disasters by the Structure Plan and Ministry of Disaster Management and Relief [42]. According to the Detailed Area Plan, industrial expansion is prohibited within 300 meters of the foothills. Additionally, rules prohibit any development within 50 meters of the foothills that was dedicated as 'Strategic Open Space' to form a Regional Park and 'No Development Zone' (Figure 7). The Bangladesh National Building Code similarly implemented a comparable limitation on certain operations within a radius of 300 meters. Notwithstanding these limitations, numerous industrial activities have been carried out in close proximity to the steep terrain without obtaining legal authorization and/or conducting any thorough environmental evaluation. Remarkably, the CDA and other relevant authorities have authorized such advancements [1].

Table 5.
Cross-tabulation matrix results for the local level (prepared by the authors).
| Sonaichhari (%) |
2007 | 2017 | |||||||||||||||
| 1997 | 1 | 2 | 3 | 4 | 5 | Total 1997 | Losses | 2007 | 1 | 2 | 3 | 4 | 5 | Total 2007 | Losses | ||
| 1 | 70.09 | 1.92 | 0.00 | 2.07 | 0.19 | 74.27 | 4.18 | 1 | 63.38 | 5.9 | 0.00 | 4.56 | 0.01 | 73.86 | 10.48 | ||
| 2 | 1.66 | 4.27 | 0.00 | 1.39 | 0.54 | 7.87 | 3.60 | 2 | 0.90 | 6.12 | 0.05 | 0.80 | 0.44 | 8.31 | 2.19 | ||
| 3 | 0.00 | 0.12 | 0.55 | 0.00 | 5.33 | 6.00 | 5.45 | 3 | 0.00 | 0.03 | 0.52 | 0.00 | 0.00 | 0.55 | 0.03 | ||
| 4 | 2.18 | 1.48 | 0.00 | 5.51 | 0.03 | 9.21 | 3.70 | 4 | 1.61 | 3.29 | 0.00 | 4.07 | 0.03 | 9.00 | 4.94 | ||
| 5 | 0.03 | 0.41 | 0.00 | 0.03 | 2.18 | 2.65 | 0.47 | 5 | 0.00 | 2.56 | 2.85 | 0.00 | 2.86 | 8.28 | 5.42 | ||
| Total 2007 | 73.96 | 8.21 | 0.55 | 9.00 | 8.28 | Total 2017 | 65.90 | 17.91 | 3.42 | 9.42 | 3.35 | ||||||
| Gains | 3.87 | 3.94 | 0.00 | 3.49 | 6.10 | Gains | 2.51 | 11.79 | 2.90 | 5.35 | 0.48 | ||||||
| Bhatiari (%) |
2007 | 2017 | |||||||||||||||
| 1997 | 1 | 2 | 3 | 4 | 5 | Total 1997 | Losses | 2007 | 1 | 2 | 3 | 4 | 5 | Total 2007 | Losses | ||
| 1 | 41.40 | 8.65 | 0.00 | 2.79 | 0.19 | 53.04 | 11.64 | 1 | 36.34 | 3.77 | 0.00 | 5.13 | 0.01 | 45.26 | 8.92 | ||
| 2 | 1.73 | 17.31 | 0.00 | 2.50 | 0.32 | 21.87 | 4.56 | 2 | 5.18 | 23.75 | 0.02 | 3.76 | 0.41 | 33.12 | 9.37 | ||
| 3 | 0.00 | 0.09 | 0.00 | 0.00 | 1.29 | 1.38 | 1.38 | 3 | 0.00 | 0.00 | 0.00 | 0.00 | 0.00 | 0.00 | 0.00 | ||
| 4 | 2.20 | 3.67 | 0.00 | 9.90 | 0.00 | 15.77 | 5.87 | 4 | 1.97 | 4.11 | 0.00 | 9.11 | 0.02 | 15.20 | 6.10 | ||
| 5 | 0.09 | 3.13 | 0.00 | 0.07 | 4.65 | 7.94 | 3.29 | 5 | 0.00 | 3.42 | 0.12 | 0.02 | 2.86 | 6.42 | 3.56 | ||
| Total 2007 | 45.42 | 32.86 | 0.00 | 15.27 | 6.45 | Total 2017 | 43.48 | 35.05 | 0.14 | 18.02 | 3.30 | ||||||
| Gains | 4.02 | 15.54 | 0.00 | 5.36 | 1.81 | Gains | 7.15 | 11.30 | 0.14 | 8.92 | 0.44 | ||||||
| Salimpur (%) |
2007 | 2017 | |||||||||||||||
| 1997 | 1 | 2 | 3 | 4 | 5 | Total 1997 | Losses | 2007 | 1 | 2 | 3 | 4 | 5 | Total 2007 | Losses | ||
| 1 | 42.36 | 17.31 | 0.00 | 8.58 | 0.02 | 68.26 | 25.90 | 1 | 24.61 | 5.58 | 0.00 | 15.59 | 0.03 | 45.81 | 21.20 | ||
| 2 | 2.10 | 12.45 | 0.17 | 3.60 | 0.22 | 18.54 | 6.09 | 2 | 6.95 | 20.52 | 0.00 | 6.20 | 0.12 | 33.80 | 13.28 | ||
| 3 | 0.00 | 0.00 | 0.00 | 0.00 | 0.00 | 0.00 | 0.00 | 3 | 0.00 | 0.18 | 0.00 | 0.00 | 0.00 | 0.18 | 0.18 | ||
| 4 | 1.51 | 2.98 | 0.00 | 7.75 | 0.01 | 12.26 | 4.50 | 4 | 2.69 | 5.46 | 0.00 | 11.79 | 0.00 | 19.94 | 8.15 | ||
| 5 | 0.06 | 0.76 | 0.00 | 0.08 | 0.04 | 0.94 | 0.90 | 5 | 0.00 | 0.25 | 0.00 | 0.00 | 0.01 | 0.27 | 0.26 | ||
| Total 2007 | 46.02 | 33.50 | 0.17 | 20.02 | 0.29 | 0.00 | 0.00 | Total 2017 | 34.26 | 31.99 | 0.00 | 33.59 | 0.16 | ||||
| Gains | 3.66 | 21.05 | 0.17 | 12.26 | 0.25 | 0.00 | 0.00 | Gains | 9.65 | 11.47 | 0.00 | 21.80 | 0.15 |
4. Discussion
The following discussion emphasizes the significance of the methodology used in this study, notably the CTM, to discern precise cause-and-effect correlations in the context of changes in LULC. Highlighting the critical role of integrating various datasets, this methodology not only identified LULC changes but also suggested an alternative strategy to analyze phenomena across different scales. Moreover, this discussion elucidates the impacts of LULC changes at both regional and local scales, showcasing how alarming shifts in vegetation, bare soil, and waterscapes—influencing urbanization, industrialization, and unplanned developmental strategies—pose significant threats to landscape resources and biodiversity within DPZ7, reflecting a narrative of conflict and change in the region.
4.1. Methodological Considerations
The objective of this study was to examine multi-scale quantitative data using the CTM to determine more accurate cause-and-effect correlations related to changes in LULC in different landscape contexts. Additionally, this methodology was employed not only to identify changes in land use but also to propose an alternative strategy that emphasizes the significance of examining less granular phenomena that may occur between regional and local scales. Notably, Islam et al. (2018) highlighted the significance of incorporating data on LULC changes in the field of natural resource management. It is imperative for landscape ecologists, urban environmentalists, and geographers to employ more precise analytical approaches in their decision-making processes [1,7,45]. Employing this approach, as applied in this study, enables a more thorough understanding of how different datasets can be integrated to assist in making decisions related to sustainable land use planning [8,39,46].
4.2. Unpacking Peri-Urbanization through Regional and Local Data, and Policy Synthesis
The present study highlights critical findings at the regional level regarding the impact of changes in LULC categories on DPZ7. During two distinct study periods, 24–29% of DPZ7 was affected by these landscape dynamics. These changes hold substantial implications for preserving regional landscape resources—a factor often overlooked despite its significance, as previously acknowledged by various researchers [1,7,18].
Furthermore, the CTM analysis conducted in the present study revealed the significant consequences of these impacts on landscape resources, including deforestation, logging, and subsequent hill excavation [19], which resulted in a 27.44% reduction in vegetation cover. These findings underscore the alarming presence of urban sprawl, echoing the observations of Douglas (2006), Rojas et al. (2013), Mamun and Kim (2020), and K and Angadi (2021). Moreover, the disappearance of numerous ponds and other waterscapes over the past two decades has given way to construction, infrastructure development, and the establishment of industrial waste dumping sites [47]. Notably, while built-up areas are a focal point of land conversion, their growth rate has accelerated compared to the previous period. The swift urbanization process presents both challenges and opportunities, including the management of unplanned population growth and the diversification of employment sectors, which can lead to greater job opportunities. Additionally, this transition offers socio-cultural benefits and improved accessibility to amenities in central urban areas. Central to this dynamic change is the significant migration from rural to urban regions, underscoring the complex interplay between challenges and advantages in the urbanization narrative [1,19,40].
Additionally, the DAP's suggestion to utilize small industrial and commercial plots along the highway led to ribbon development, resulting in the depletion of natural resources due to the abandonment of agricultural land, the disappearance of waterscapes, and the clearance of homestead forests. Despite being an environmentally sensitive zone following a massive cyclone in 1991, as outlined in the Structural Plan (1995–2015) of the CMA, the Government of Bangladesh designated this area as a 'Future Economic Expansion Area' [42,43]. This decision has contributed to furthering shipbreaking activities, with Chattogram accounting for 22% of global ship dismantling by 2014 [48]. These developments are poised to intensify shipbreaking activities and establish associated business zones within the region, which poses a significant threat to sustainable landscape resource management [1].
Although urbanization did not exert primary pressure on local landscape settings in the preceding period, a conventional developmental trend (peri-urbanization) emerged, integrating practices reliant on hilly forests (at SoU) but primarily situated far from the urban core. This led to severe deforestation driven by substantial human activities, resulting in a nearly 36% increase in bare soil surfaces over the last decade. The urban periphery areas (SU and BU) experienced a notable increase in bare soil of 22%, indicating the emergence of new urban growth. As Hasan and Nazem (2016) highlighted, Chattogram City expanded to its periphery, encroaching upon more than 17% of existing natural landscapes. However, ongoing road and land development projects and industry-driven development strategies in the local context revealed alarming deforestation trends and hill-cutting activities [1]. This baseline scenario witnessed the settlement of a few heavy and environmentally hazardous industries (e.g., shipbreaking yards), which contributed to extensive tree felling. In response, the Government of Bangladesh initiated buffer zone improvement and eco-park development programs [42,43]. Reports from The Daily Star (2012) indicated the felling of approximately 15,000 mangrove trees after 2009 to establish four shipyards in SoU. Additionally, approximately 50% of mangrove trees were cleared to facilitate the construction of new shipbreaking industries in BU. Furthermore, establishing four brickfields to support construction materials for new road development projects resulted in the loss of 135 ha of forest cover [50]. As a result, the main processes of peri-urbanization in the recent research period had a substantial impact on the landscape and occurred over an extended period, ranging from the local to regional scales.
An essential outcome of artificial forestation is its direct impact on the local forest market, primarily driven by afforestation and reforestation programs aimed at rectifying LULC practices [40,42,51]. Despite this noteworthy consequence at the regional scale, the afforestation and reforestation programs failed to achieve dominance at the community level regarding coastal mangrove forest preservation, riverside green belt development, and hilly forest plantation from 2007 to 2017 after the initiation of DAP. These programs only covered 6.5% of the targeted areas during this period. This observation reinforces the hypothesis that environmental protection takes a back seat in sustainable planning at the regional level. Artificial forestation has a significant impact on the local forest market by implementing afforestation and reforestation programs (i.e., coastal mangrove forests, riverside green belts development, and hilly forest plantations) to restore illegally exploited land [40,42,51]. This trend is expected to continue in the near future as part of urban development strategies in the CMA, with a focus on incentivizing local participation, particularly among women [40,52]. Despite relevant consequences at the regional level, the afforestation and reforestation programs fail to speak to the communities. For instance, despite the establishment of the DAP, vegetation cover only grew by 6.5%, with a loss of 8.3% occurring over the same period. This outcome supports the hypothesis that environmental protection has a lower priority in sustainable planning at the regional level.
As described in the DAP, the approach for waterscapes aimed to create a detailed master plan for stormwater drainage and flood management; however, it encountered an unexpected dispute at the local level. The concept involved the restoration of extensive khals (canals) that spanned 48 km, the preservation of 286 ponds measuring 0.2 ha each, and the construction of 28 additional flood storage ponds [40]. Nevertheless, data from the CTM presented a conflicting picture, indicating substantial declines in waterscapes over the course of the research periods. The difference highlighted here emphasizes the importance of safeguarding waterscapes during (rapid) urbanization [53].
The influence of urbanization goes beyond the immediate urban bounds and has an impact on the attractiveness of new employment markets and affordable housing options. In turn, this leads to changes in the functional values and spatial structure of landscape settings [7,39]. The consequences are palpable; deforestation, the clearance of hilly forests, and hill cutting gather momentum under the cloak of urbanization (Hassan & Nazem, 2016), thereby fueling the engine of peri-urbanization through rural-urban migration [4,7,54]. Hence, the mounting pressure witnessed over the study period could be attributed to urban sprawl rather than a straightforward narrative of deforestation and afforestation. This pressure affects the protective shield of forests and the conservation efforts aiming to preserve the majestic contours of hilly landscapes. The complex interaction between urbanization and landscape dynamics unfolds as a narrative of conflict and change since the dynamic patterns of urban expansion pose a fundamental challenge to the preservation and safeguarding of natural resources.
5. Conclusion
From a regional perspective, this study illuminates the substantial impact of LULC changes on DPZ7, revealing a significant proportion of land being affected by these alterations. These changes, which are often overlooked in landscape resource preservation, have led to alarming scenarios of deforestation, urban sprawl, infrastructure development, and the decline of vital waterscapes. Conversely, the impact of urbanization on local landscapes has fueled peri-urbanization, resulting in severe deforestation and the encroachment of urban boundaries into previously untouched areas. Driven by developmental trends, this local transformation has significantly altered landscapes, with increasing repercussions at the regional scale. Despite efforts such as afforestation and reforestation programs aimed at rectifying illegal LULC practices, their impact remains limited, especially for coastal mangrove forests and hilly forest plantations. The divergence between grand development plans and the actual loss of waterscapes underscores the challenges faced in protecting vital resources in the face of urbanization pressures. The analysis of these findings indicates an intricate interaction between the expansion of urban areas and changes in the surrounding environment. Increasing urbanization poses a significant challenge to preserving natural resources (Mamun & Kim, 2020).
This study advocates for a revised Chattogram Metropolitan Master Plan that ensures development strategies are ecologically sound, socially inclusive, and economically viable. An integrated planning approach should be sensitive to regional and local nuances, providing environmentally sustainable, socio-culturally beneficial, and economically feasible outcomes. Such an approach could mitigate the conflicts identified in this research and promote a resilient urban and peri-urban environment amid rapid urbanization. Sustainable peri-urban development must work across scales, assessing Land Use and Land Cover (LULC) changes from regional to micro-local levels. Policymakers and practitioners should conduct thorough examinations of neighbourhoods at the micro level, understand (and, if needed, interfere with) the forces that impact LULC changes at the regional level and draw lessons from international case studies and policy evaluations. Future studies should focus on detailed LULC changes across scales to enhance sustainable peri-urban development strategies.
Author Contributions
Md Mustiafiz Al Mamun: Conceptualization, Methodology, Software, Data curation, Formal analysis, Visualization, Investigation, Writing- Original draft, Steffen Nijhuis: Supervision, Writing - Review & Editing, Validation, Caroline Newton: Supervision, Validation, Writing - Reviewing & Editing.
Funding
This research was funded by the Government of Bangladesh under the Prime Minister's Fellowship Bangladesh Programme 2021–2022 (2nd phase), and Fellowship number: PHD.2122.2.NON.2097.
Conflicts of Interest
The authors declare no conflicts of interest. The funders had no role in the design of the study, such as in the collection, analyses, or interpretation of data, in the writing of the manuscript, and in the decision to publish the results.
Appendix
Table 6.
Cross-tabulation matrix (source: Pontius et al., 2004).
| Timeline 2 (t2) | ||||||||
| Category 1 | Category 2 | Category 3 | Category 4 | Category 5 | Total Timeline 1 | Losses | ||
| Timeline 1 (t1) | Category 1 | P11 | P12 | P13 | P14 | P15 | P1+ | P1+ - P11 |
| Category 2 | P21 | P22 | P23 | P24 | P25 | P2+ | P1+ - P22 | |
| Category 3 | P31 | P32 | P33 | P34 | P35 | P3+ | P1+ - P33 | |
| Category 4 | P41 | P42 | P43 | P44 | P45 | P4+ | P1+ - P44 | |
| Category 5 | P51 | P52 | P53 | P54 | P55 | P5+ | P1+ - P55 | |
| Total Timeline 2 | P+1 | P+2 | P+3 | P+4 | P+5 | 1 | ||
| Gains | P+1 - P11 | P+2 – P22 | P+3 – P33 | P+4 – P44 | P+5 – P55 | |||
References
- Mamun, M. M. Al; Kim, S. M. Stakeholder Analysis Matrix for Buffer Zone Management in the Peri-Urban Area of Chittagong, Bangladesh. Environ Dev Sustain, 2020, 22 (6), 5503–5520. [CrossRef]
- Kleemann, J.; Inkoom, J. N.; Thiel, M.; Shankar, S.; Lautenbach, S.; Fürst, C. Peri-Urban Land Use Pattern and Its Relation to Land Use Planning in Ghana, West Africa. Landsc Urban Plan, 2017, 165, 280–294. [CrossRef]
- Lwasa, S.; Mugagga, F.; Wahab, B.; Simon, D.; Connors, J. P.; Griffith, C. A Meta-Analysis of Urban and Peri-Urban Agriculture and Forestry in Mediating Climate Change. Curr Opin Environ Sustain, 2015, 13, 68–73. [CrossRef]
- Ravetz, J.; Fertner, C.; Nielsen, T. S. The Dynamics of Peri-Urbanization. In Peri-urban futures: Scenarios and models for land use change in Europe; Nilsson, K., Pauleit, S., Bell, S., Aalbers, C., Nielsen, T., Eds.; Springer Berlin Heidelberg, 2013; p 452. [CrossRef]
- Vejre, H.; Jensen, F. S.; Thorsen, B. J. Demonstrating the Importance of Intangible Ecosystem Services from Peri-Urban Landscapes. Ecological Complexity, 2010, 7 (3), 338–348. [CrossRef]
- Salem, M.; Tsurusaki, N.; Divigalpitiya, P. Land Use/Land Cover Change Detection and Urban Sprawl in the Peri-Urban Area of Greater Cairo since the Egyptian Revolution of 2011. J Land Use Sci, 2020, 15 (5), 592–606. [CrossRef]
- Rojas, C.; Pino, J.; Basnou, C.; Vivanco, M. Assessing Land-Use and -Cover Changes in Relation to Geographic Factors and Urban Planning in the Metropolitan Area of Concepción (Chile). Implications for Biodiversity Conservation. Applied Geography, 2013, 39, 93–103. [CrossRef]
- K, D.; Angadi, D. P. Urban Expansion Quantification from Remote Sensing Data for Sustainable Land-Use Planning in Mangaluru, India. Remote Sens Appl, 2021, 23. [CrossRef]
- Wen, Y.; Zhang, Z.; Liang, D.; Xu, Z. Rural Residential Land Transition in the Beijing-Tianjin-Hebei Region: Spatial-Temporal Patterns and Policy Implications. Land use policy, 2020, 96. [CrossRef]
- van Vliet, J.; Verburg, P. H.; Grădinaru, S. R.; Hersperger, A. M. Beyond the Urban-Rural Dichotomy: Towards a More Nuanced Analysis of Changes in Built-up Land. Comput Environ Urban Syst, 2019, 74, 41–49. [CrossRef]
- UN. Revision of World Urbanization Prospects 2018 by UN DESA https://www.un.org/development/desa/en/news/population/2018-revision-of-world-urbanization-prospects.html (accessed Apr 30, 2019).
- McKinlay, A. The Future of the Fringe: The Crisis in Peri-Urban Planning. Australasian Journal of Environmental Management, 2020, 27 (4), 452–453. [CrossRef]
- Paul, S.; Saxena, K. G.; Nagendra, H.; Lele, N. Tracing Land Use and Land Cover Change in Peri-Urban Delhi, India, over 1973–2017 Period. Environ Monit Assess, 2021, 193 (2). [CrossRef]
- Akaateba, M. A. Tenure Responsive Land Use Planning in Ghana: Evidence from Peri-Urban Tamale. Int Plan Stud, 2023, 28 (2), 107–123. [CrossRef]
- Ayambire, R. A.; Amponsah, O.; Peprah, C.; Takyi, S. A. A Review of Practices for Sustaining Urban and Peri-Urban Agriculture: Implications for Land Use Planning in Rapidly Urbanising Ghanaian Cities. Land use policy, 2019, 84, 260–277. [CrossRef]
- Meeus, S. J.; Gulinck, H. Semi-Urban Areas in Landscape Research : A Review. Living Reviews in Landscape Research, 2008, 2, 3. [CrossRef]
- Douglas, I. Peri-Urban Ecosystems and Societies: Transitional Zones and Contrasting Values. In The Peri-urban Interface: Approaches to Sustainable Natural and Human Resource Use; Mcgregor, D., Simon, D., Donald, T., Eds.; Routledge, 2006; p 336. [CrossRef]
- Leon, R. C. De; Kim, S. M. Stakeholder Perceptions and Governance Challenges in Urban Protected Area Management: The Case of the Las Piñas – Parañaque Critical Habitat and Ecotourism Area, Philippines. Land use policy, 2017, 63, 470–480. [CrossRef]
- Hassan, M. M.; Nazem, M. N. I. Examination of Land Use/Land Cover Changes, Urban Growth Dynamics, and Environmental Sustainability in Chittagong City, Bangladesh. Environ Dev Sustain, 2016, 18 (3), 697–716. [CrossRef]
- Demographia. Demographia World Urban Areas (Built Up Urban Areas or World Agglomerations; 2023.
- Su, S.; Wang, Y.; Luo, F.; Mai, G.; Pu, J. Peri-Urban Vegetated Landscape Pattern Changes in Relation to Socioeconomic Development. Ecol Indic, 2014, 46, 477–486. [CrossRef]
- Sahana, M.; Ravetz, J.; Patel, P. P.; Dadashpoor, H.; Follmann, A. Where Is the Peri-Urban? A Systematic Review of Peri-Urban Research and Approaches for Its Identification and Demarcation Worldwide. Remote Sens (Basel), 2023, 15 (5), 1316. [CrossRef]
- Water Security, Conflict and Cooperation in Peri-Urban South Asia; Narain, V., Roth, D., Eds.; Springer International Publishing: Cham, 2022. [CrossRef]
- Wandl, A.; Magoni, M. Sustainable Planning of Peri-Urban Areas: Introduction to the Special Issue. Planning Practice and Research, 2017, 32 (1), 1–3. [CrossRef]
- Mortoja, Md. G.; Yigitcanlar, T. Why Is Determining Peri-Urban Area Boundaries Critical for Sustainable Urban Development? Journal of Environmental Planning and Management, 2023, 66 (1), 67–96. [CrossRef]
- Gidey, E.; Gitet, S.; Mhangara, P.; Dikinya, O.; Hishe, S.; Girma, A.; Gebremeskel, G.; Lottering, R.; Zenebe, A.; Birhane, E. Impact of Urban and Peri-Urban Growth on Arable Land (1976–2029) in a Medium Sized City of Shire Indaselassie, North Western Tigray, Ethiopia. SN Appl Sci, 2023, 5 (4). [CrossRef]
- Choy, D. L.; Buxton, M. A Resilience Approach To Peri-Urban Landscape Management. In The State of Australian Cities (SOAC) national conference; Whitzman, C., Fincher, R., Eds.; Australian Sustainable Cities and Regions Network (ASCRN): Melbourne, Australia, 2011; pp 1–7.
- UN. Transforming Our World: The 2030 Agenda for Sustainable Development; A/Res/70/1; New York, USA, 2015.
- Lee, Y. C.; Ahern, J.; Yeh, C. T. Ecosystem Services in Peri-Urban Landscapes: The Effects of Agricultural Landscape Change on Ecosystem Services in Taiwan’s Western Coastal Plain. Landsc Urban Plan, 2015, 139, 137–148. [CrossRef]
- Nijhuis, S. Landscape-Based Urbanism: Cultivating Urban Landscapes Through Design. In Design for Regenerative Cities and Landscapes, Contemporary Urban Design Thinking; Roggema, R., Ed.; Springer Nature Switzerland, 2022; pp 249–277. [CrossRef]
- Huang, S. L.; Wang, S. H.; Budd, W. W. Sprawl in Taipei’s Peri-Urban Zone: Responses to Spatial Planning and Implications for Adapting Global Environmental Change. Landsc Urban Plan, 2009, 90 (1–2), 20–32. [CrossRef]
- Arifeen, H. M.; Phoungthong, K.; Mostafaeipour, A.; Yuangyai, N.; Yuangyai, C.; Techato, K.; Jutidamrongphan, W. Determine the Land-Use Land-Cover Changes, Urban Expansion and Their Driving Factors for Sustainable Development in Gazipur Bangladesh. Atmosphere (Basel), 2021, 12 (10). [CrossRef]
- Baidoo, R.; Obeng, K. Evaluating the Impact of Land Use and Land Cover Changes on Forest Ecosystem Service Values Using Landsat Dataset in the Atwima Nwabiagya North, Ghana. Heliyon, 2023, 9 (11). [CrossRef]
- Wiatkowska, B.; Słodczyk, J.; Stokowska, A. Spatial-Temporal Land Use and Land Cover Changes in Urban Areas Using Remote Sensing Images and Gis Analysis: The Case Study of Opole, Poland. Geosciences (Switzerland), 2021, 11 (8). [CrossRef]
- Aguilar, A. G.; Flores, M. A.; Lara, L. F. Peri-Urbanization and Land Use Fragmentation in Mexico City. Informality, Environmental Deterioration, and Ineffective Urban Policy. Frontiers in Sustainable Cities, 2022, 4. [CrossRef]
- FEA. Resource-Efficient Land Use – Towards a Global Sustainable Land Use Standard (GLOBALANDS); Germany, 2015.
- Wei, L.; Zhou, L.; Sun, D.; Yuan, B.; Hu, F. Evaluating the Impact of Urban Expansion on the Habitat Quality and Constructing Ecological Security Patterns: A Case Study of Jiziwan in the Yellow River Basin, China. Ecol Indic, 2022, 145. [CrossRef]
- Chen, G.; Li, X.; Liu, X.; Chen, Y.; Liang, X.; Leng, J.; Xu, X.; Liao, W.; Qiu, Y.; Wu, Q.; et al. Global Projections of Future Urban Land Expansion under Shared Socioeconomic Pathways. Nat Commun, 2020, 11 (1). [CrossRef]
- Henríquez, C.; Morales, M.; Qüense, J.; Hidalgo, R. Future Land Use Conflicts: Comparing Spatial Scenarios for Urban-Regional Planning. Environ Plan B Urban Anal City Sci, 2023, 50 (2), 332–349. [CrossRef]
- DAP. Detailed Area Plan for Chittagong Metropolitan City; Chittagong, Government of the People’s Republic of Bangladesh, 2009.
- Pontius, R. G.; Shusas, E.; McEachern, M. Detecting Important Categorical Land Changes While Accounting for Persistence. Agric Ecosyst Environ, 2004, 101 (2–3), 251–268. [CrossRef]
- UDMC. Development of Disaster Management Plan at Upazila Level; CDMP-2; 2; Sitakunda, Chittagong, 2014.
- CDA. Urban Development Master Plan, 2nd ed.; Chittagong Development Authority and Ministry of Housing and Public Works: Chittagong, Bangladesh, 2008.
- Islam, K.; Jashimuddin, M.; Nath, B.; Nath, T. K. Land Use Classification and Change Detection by Using Multi-Temporal Remotely Sensed Imagery: The Case of Chunati Wildlife Sanctuary, Bangladesh. Egyptian Journal of Remote Sensing and Space Science, 2018, 21 (1), 37–47. [CrossRef]
- Gerard, F.; Petit, S.; Smith, G.; Thomson, A.; Brown, N.; Manchester, S.; Wadsworth, R.; Bugar, G.; Halada, L.; Bezák, P.; et al. Land Cover Change in Europe between 1950 and 2000 Determined Employing Aerial Photography. Prog Phys Geogr, 2010, 34 (2), 183–205. [CrossRef]
- Debolini, M.; Valette, E.; François, M.; Chéry, J. P. Mapping Land Use Competition in the Rural-Urban Fringe and Future Perspectives on Land Policies: A Case Study of Meknès (Morocco). Land use policy, 2015, 47 (2015), 373–381. [CrossRef]
- Yousuf, M. No one here goes to jail for filling up water bodies | The Daily Star https://www.thedailystar.net/backpage/no-one-here-goes-jail-filling-water-bodies-1485769 (accessed Jan 5, 2019).
- Nøst, T. H.; Halse, A. K.; Randall, S.; Borgen, A. R.; Schlabach, M.; Paul, A.; Rahman, A.; Breivik, K. High Concentrations of Organic Contaminants in Air from Ship Breaking Activities in Chittagong, Bangladesh. Environ Sci Technol, 2015, 49 (19), 11372–11380. [CrossRef]
- The Daily Star. 30 trees felled at Sitakunda | The Daily Star https://www.thedailystar.net/news-detail-249309 (accessed Jan 6, 2019).
- Uddin, M. Brick Kilns near Reserve Forest Defying Laws | The Daily Star. the daily star. March 2015.
- CRPARP. Project Implementation Manual Volume I : General Guidelines of Climate Resilient Participatory Afforestation and Reforestation Project; Bangladesh Forest Department and Arannayk Foundation, 2013; Vol. I.
- Chowdhury, M. S. H.; Gudmundsson, C.; Izumiyama, S.; Koike, M.; Nazia, N.; Rana, M. P.; Mukul, S. A.; Muhammed, N.; Redowan, M. Community Attitudes toward Forest Conservation Programs through Collaborative Protected Area Management in Bangladesh. Environ Dev Sustain, 2014, 16 (6), 1235–1252. [CrossRef]
- Balasubramanian, R.; Choi, S.-C. Urbanization, Population Pressure and Agricultural Intensification: Evidences from Tamil Nadu in India. J Rural Dev, 2010, 33 (2), 87–108.
- Chen, R.; Ye, C.; Cai, Y.; Xing, X.; Chen, Q. The Impact of Rural Out-Migration on Land Use Transition in China: Past, Present and Trend. Land use policy, 2014, 40, 101–110. [CrossRef]
Figure 1.
Conceptual framework (prepared by the authors).
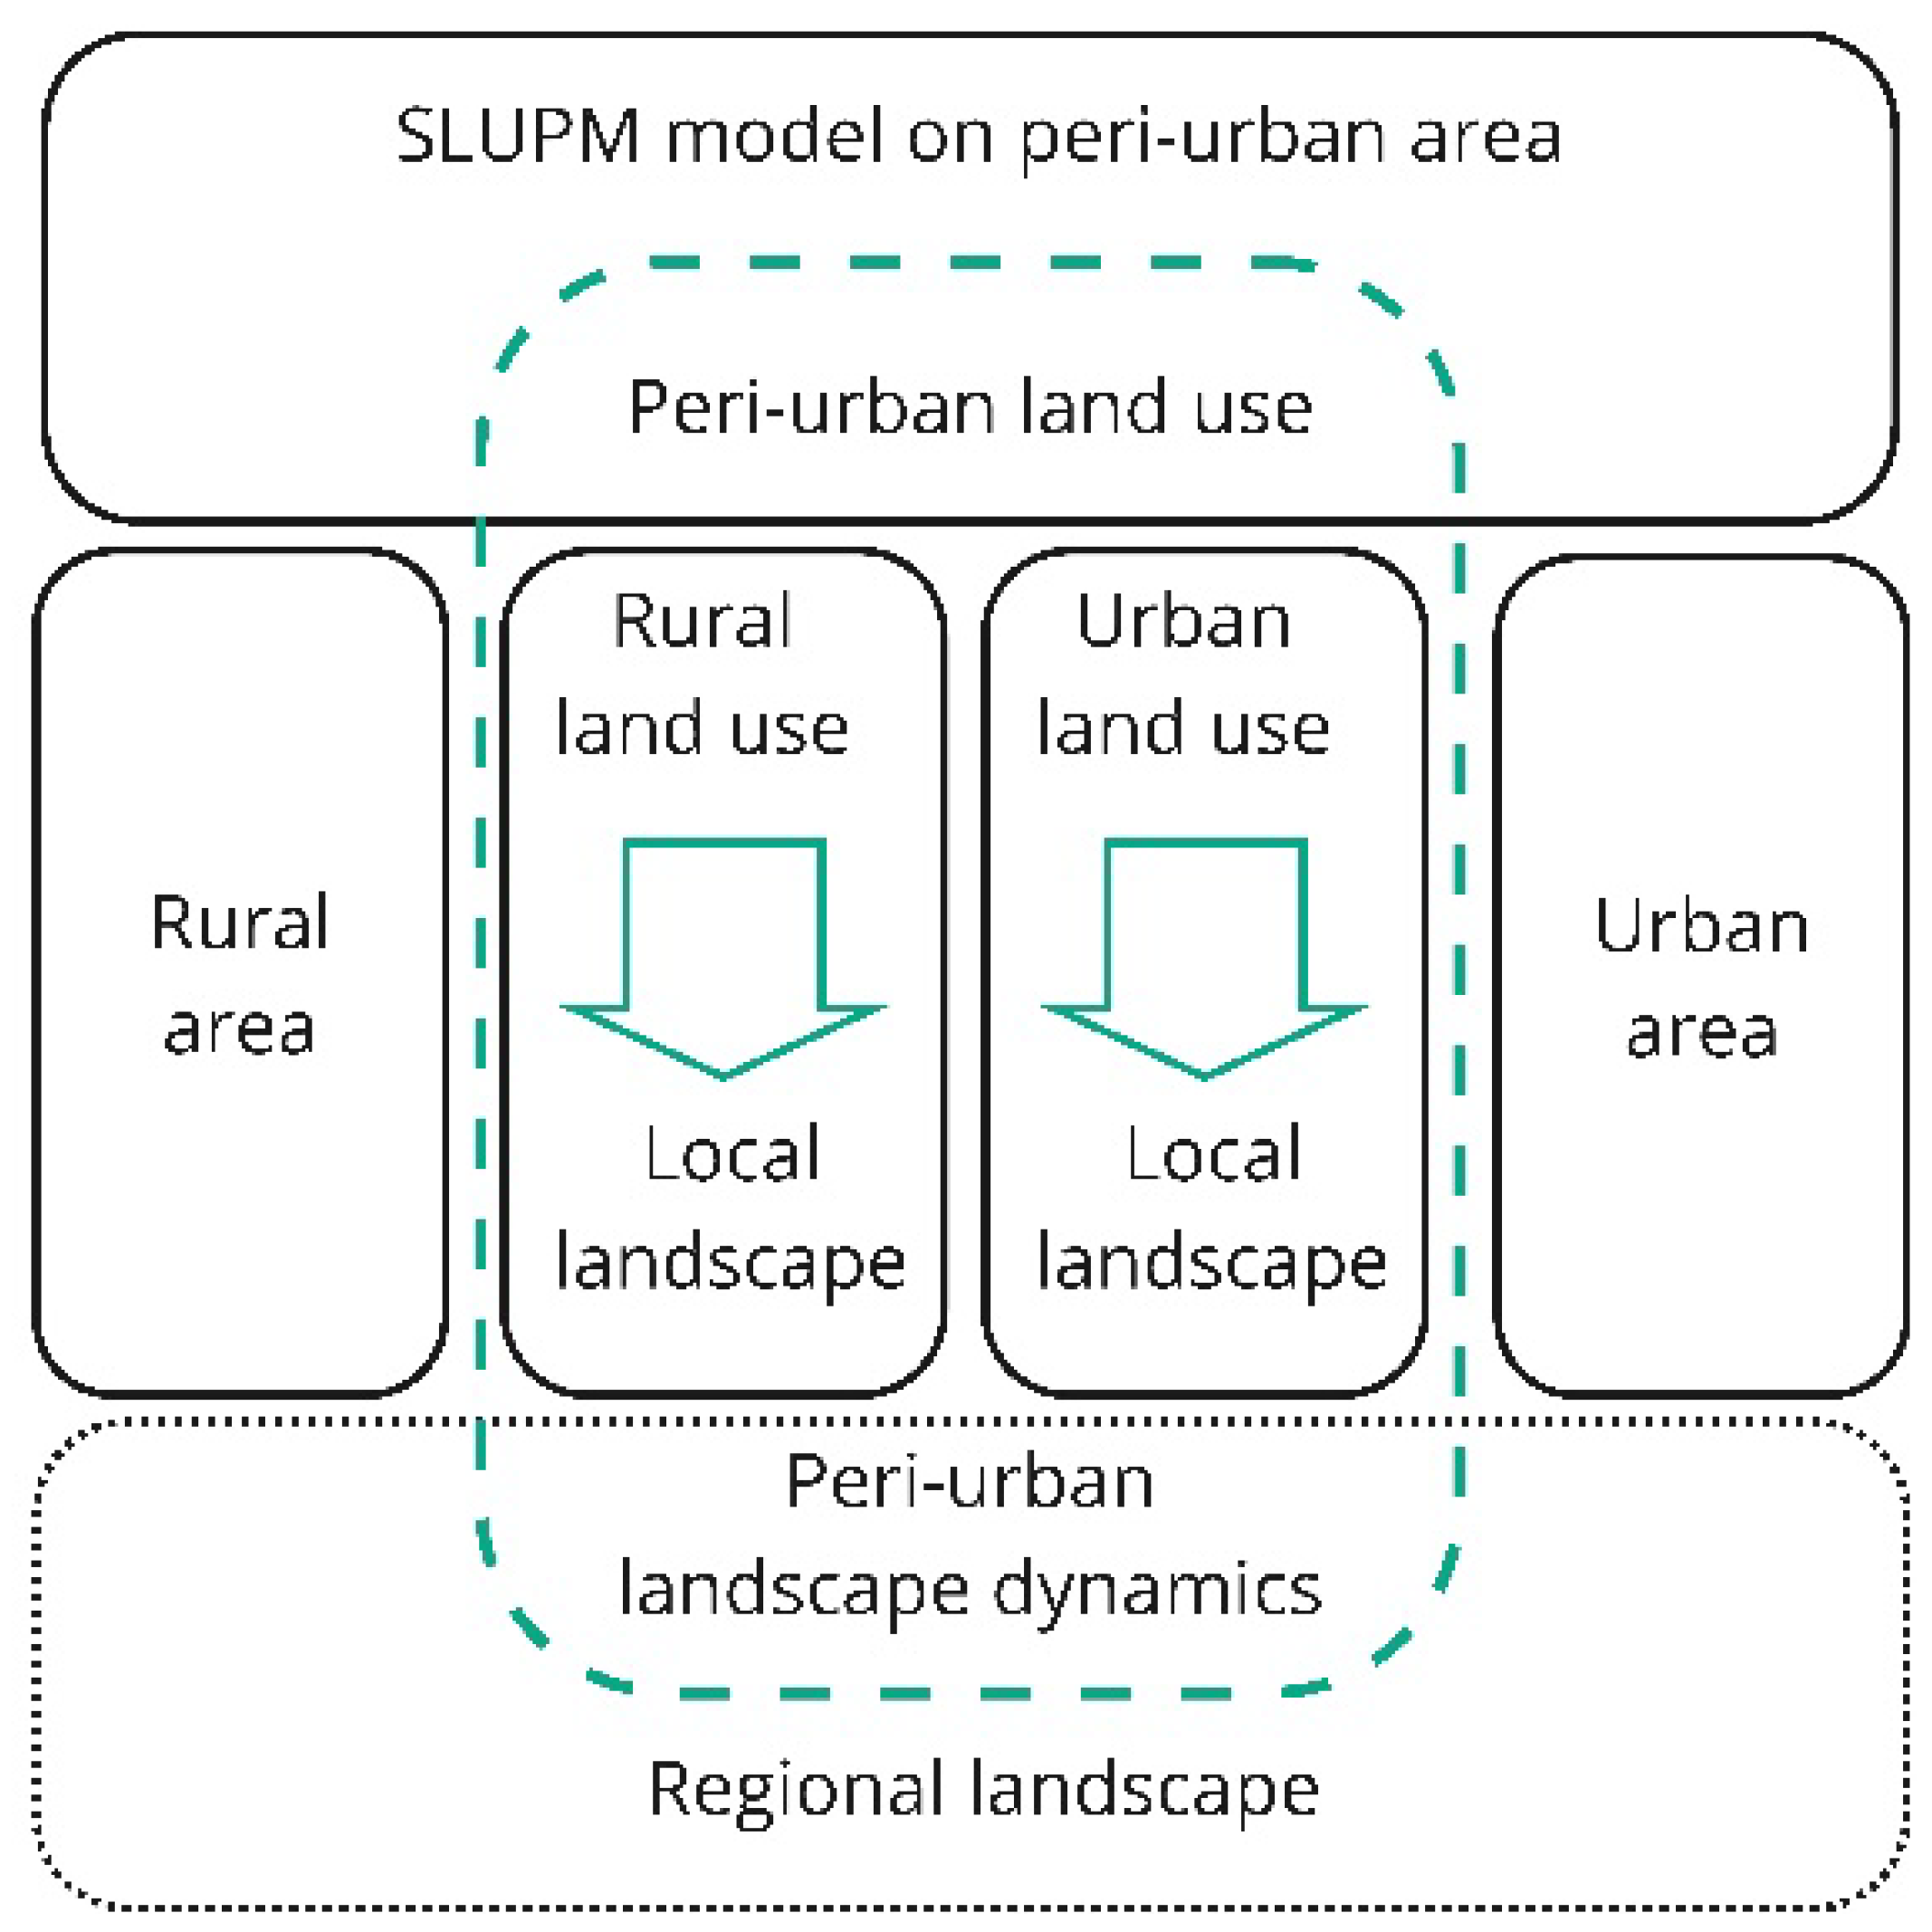
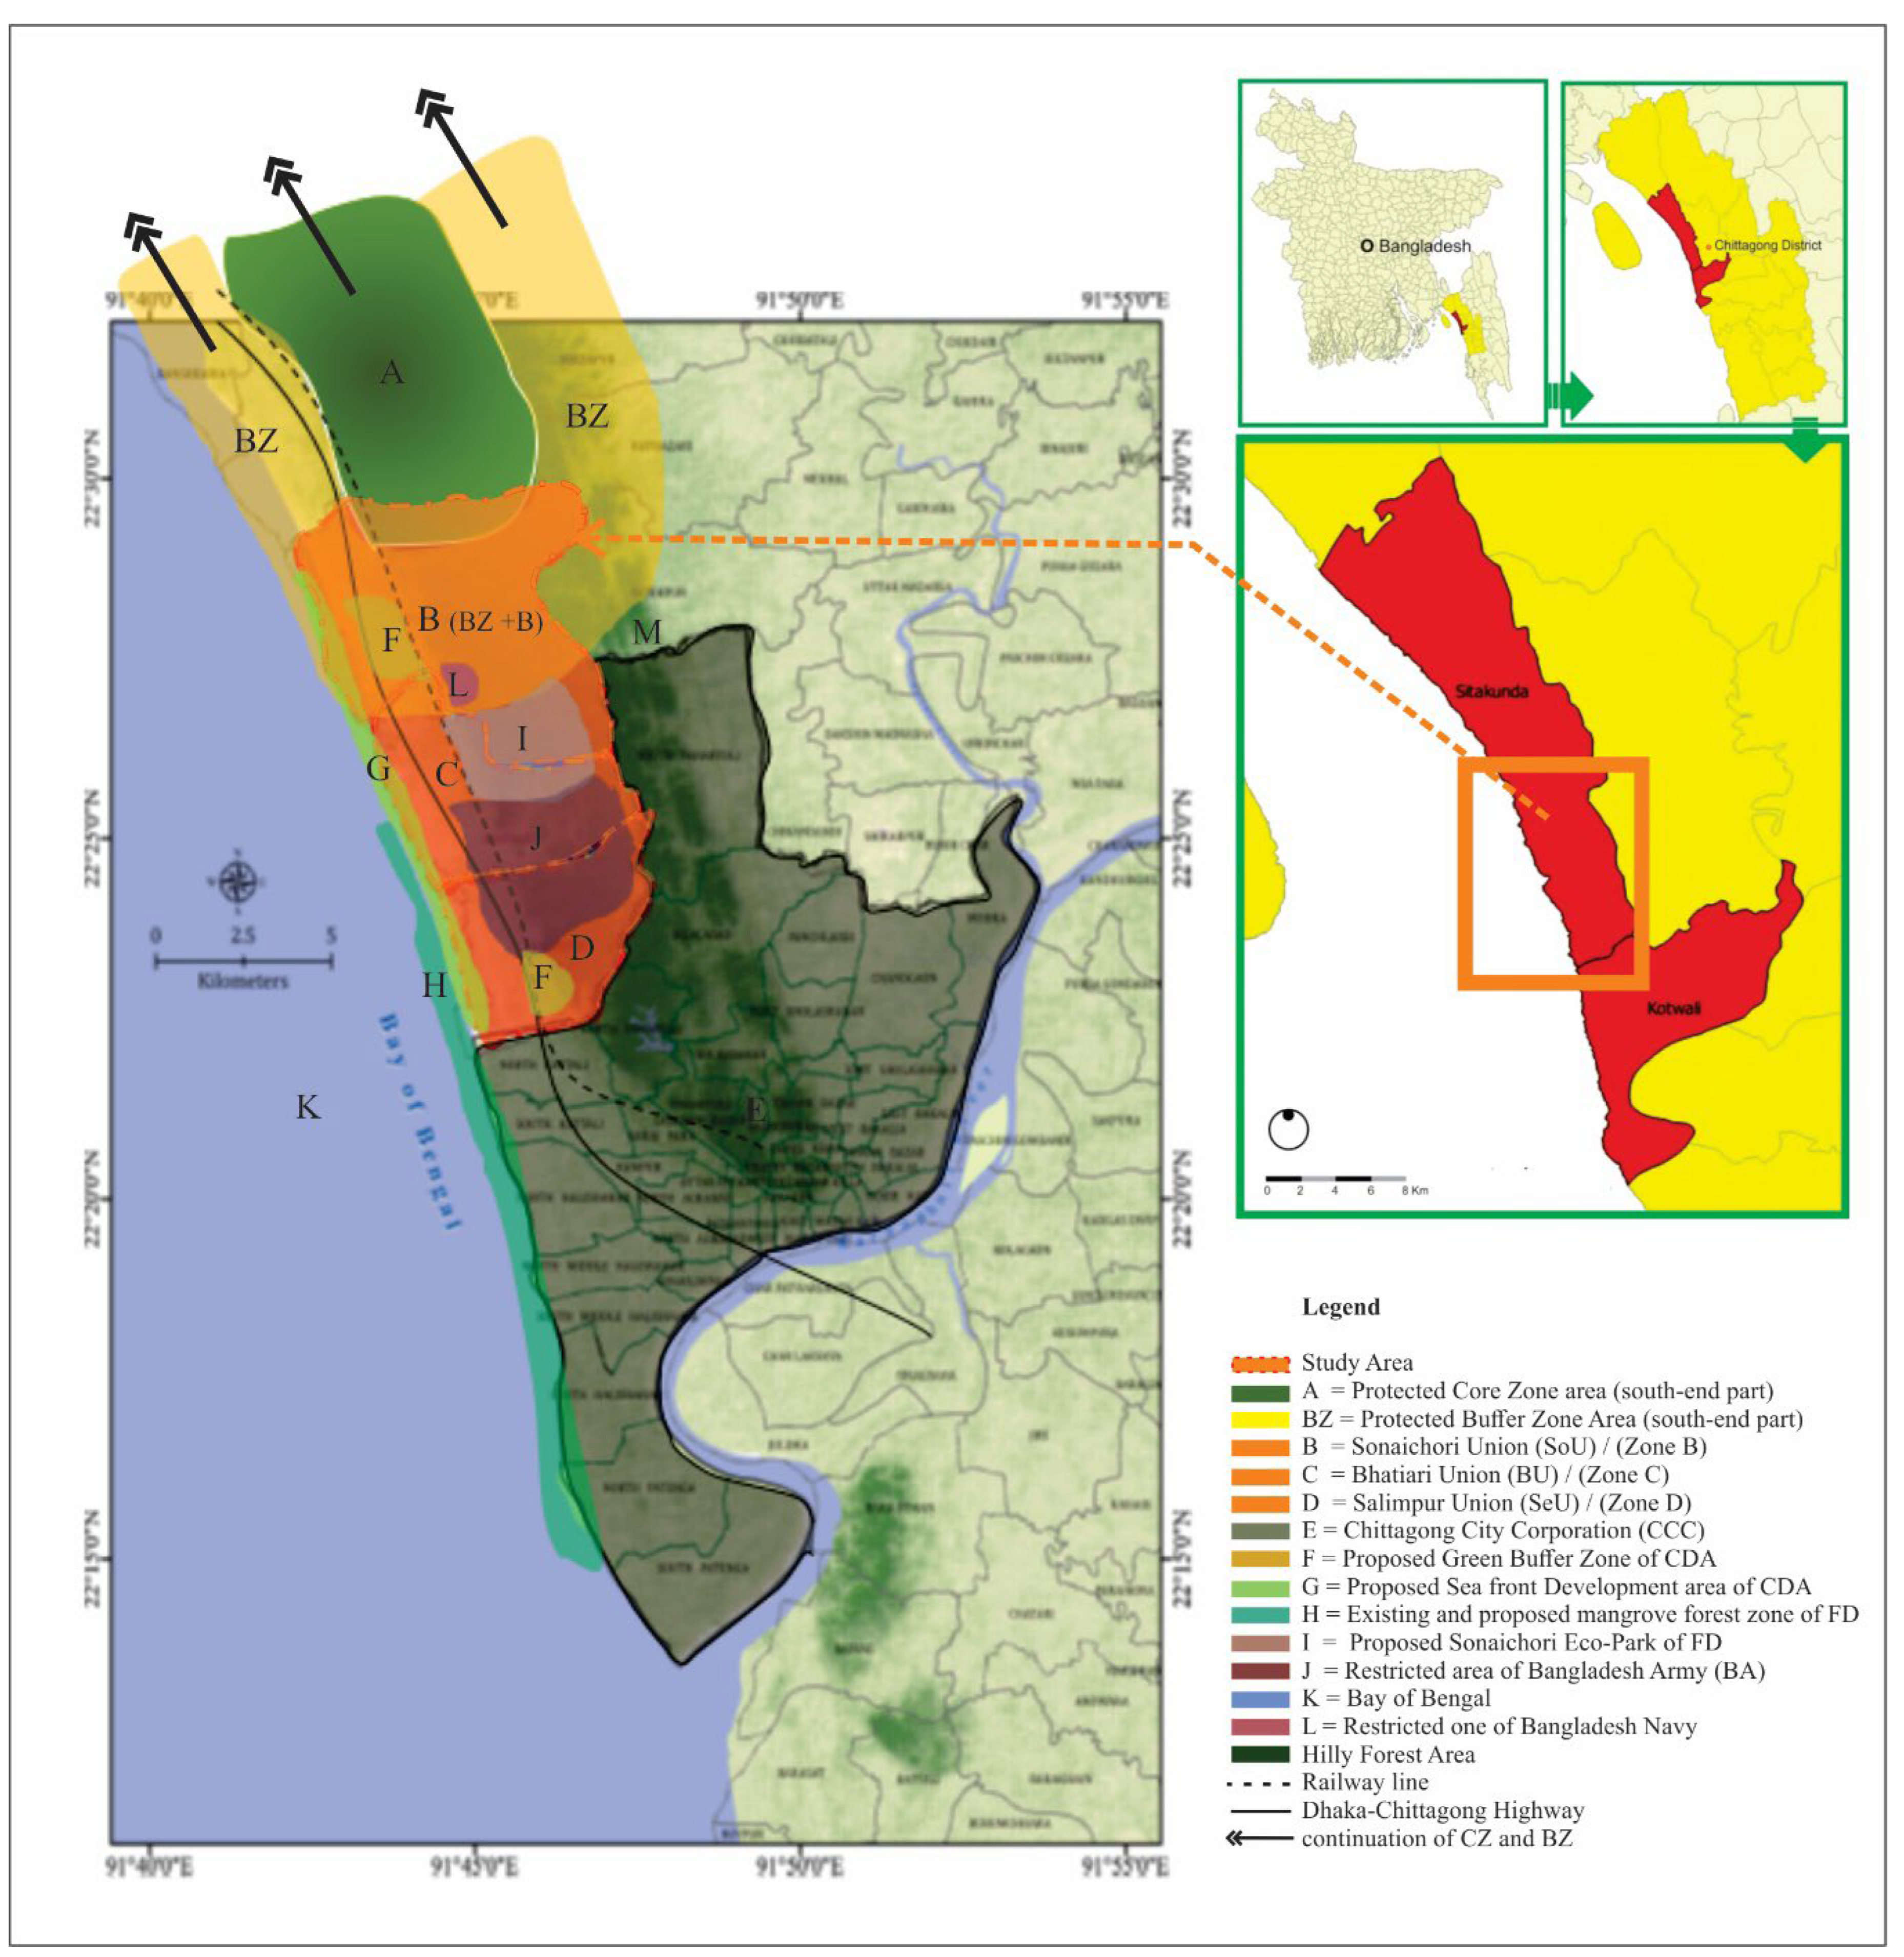
Figure 3.
LULC maps for 1997, 2007, and 2017 after the classification process.
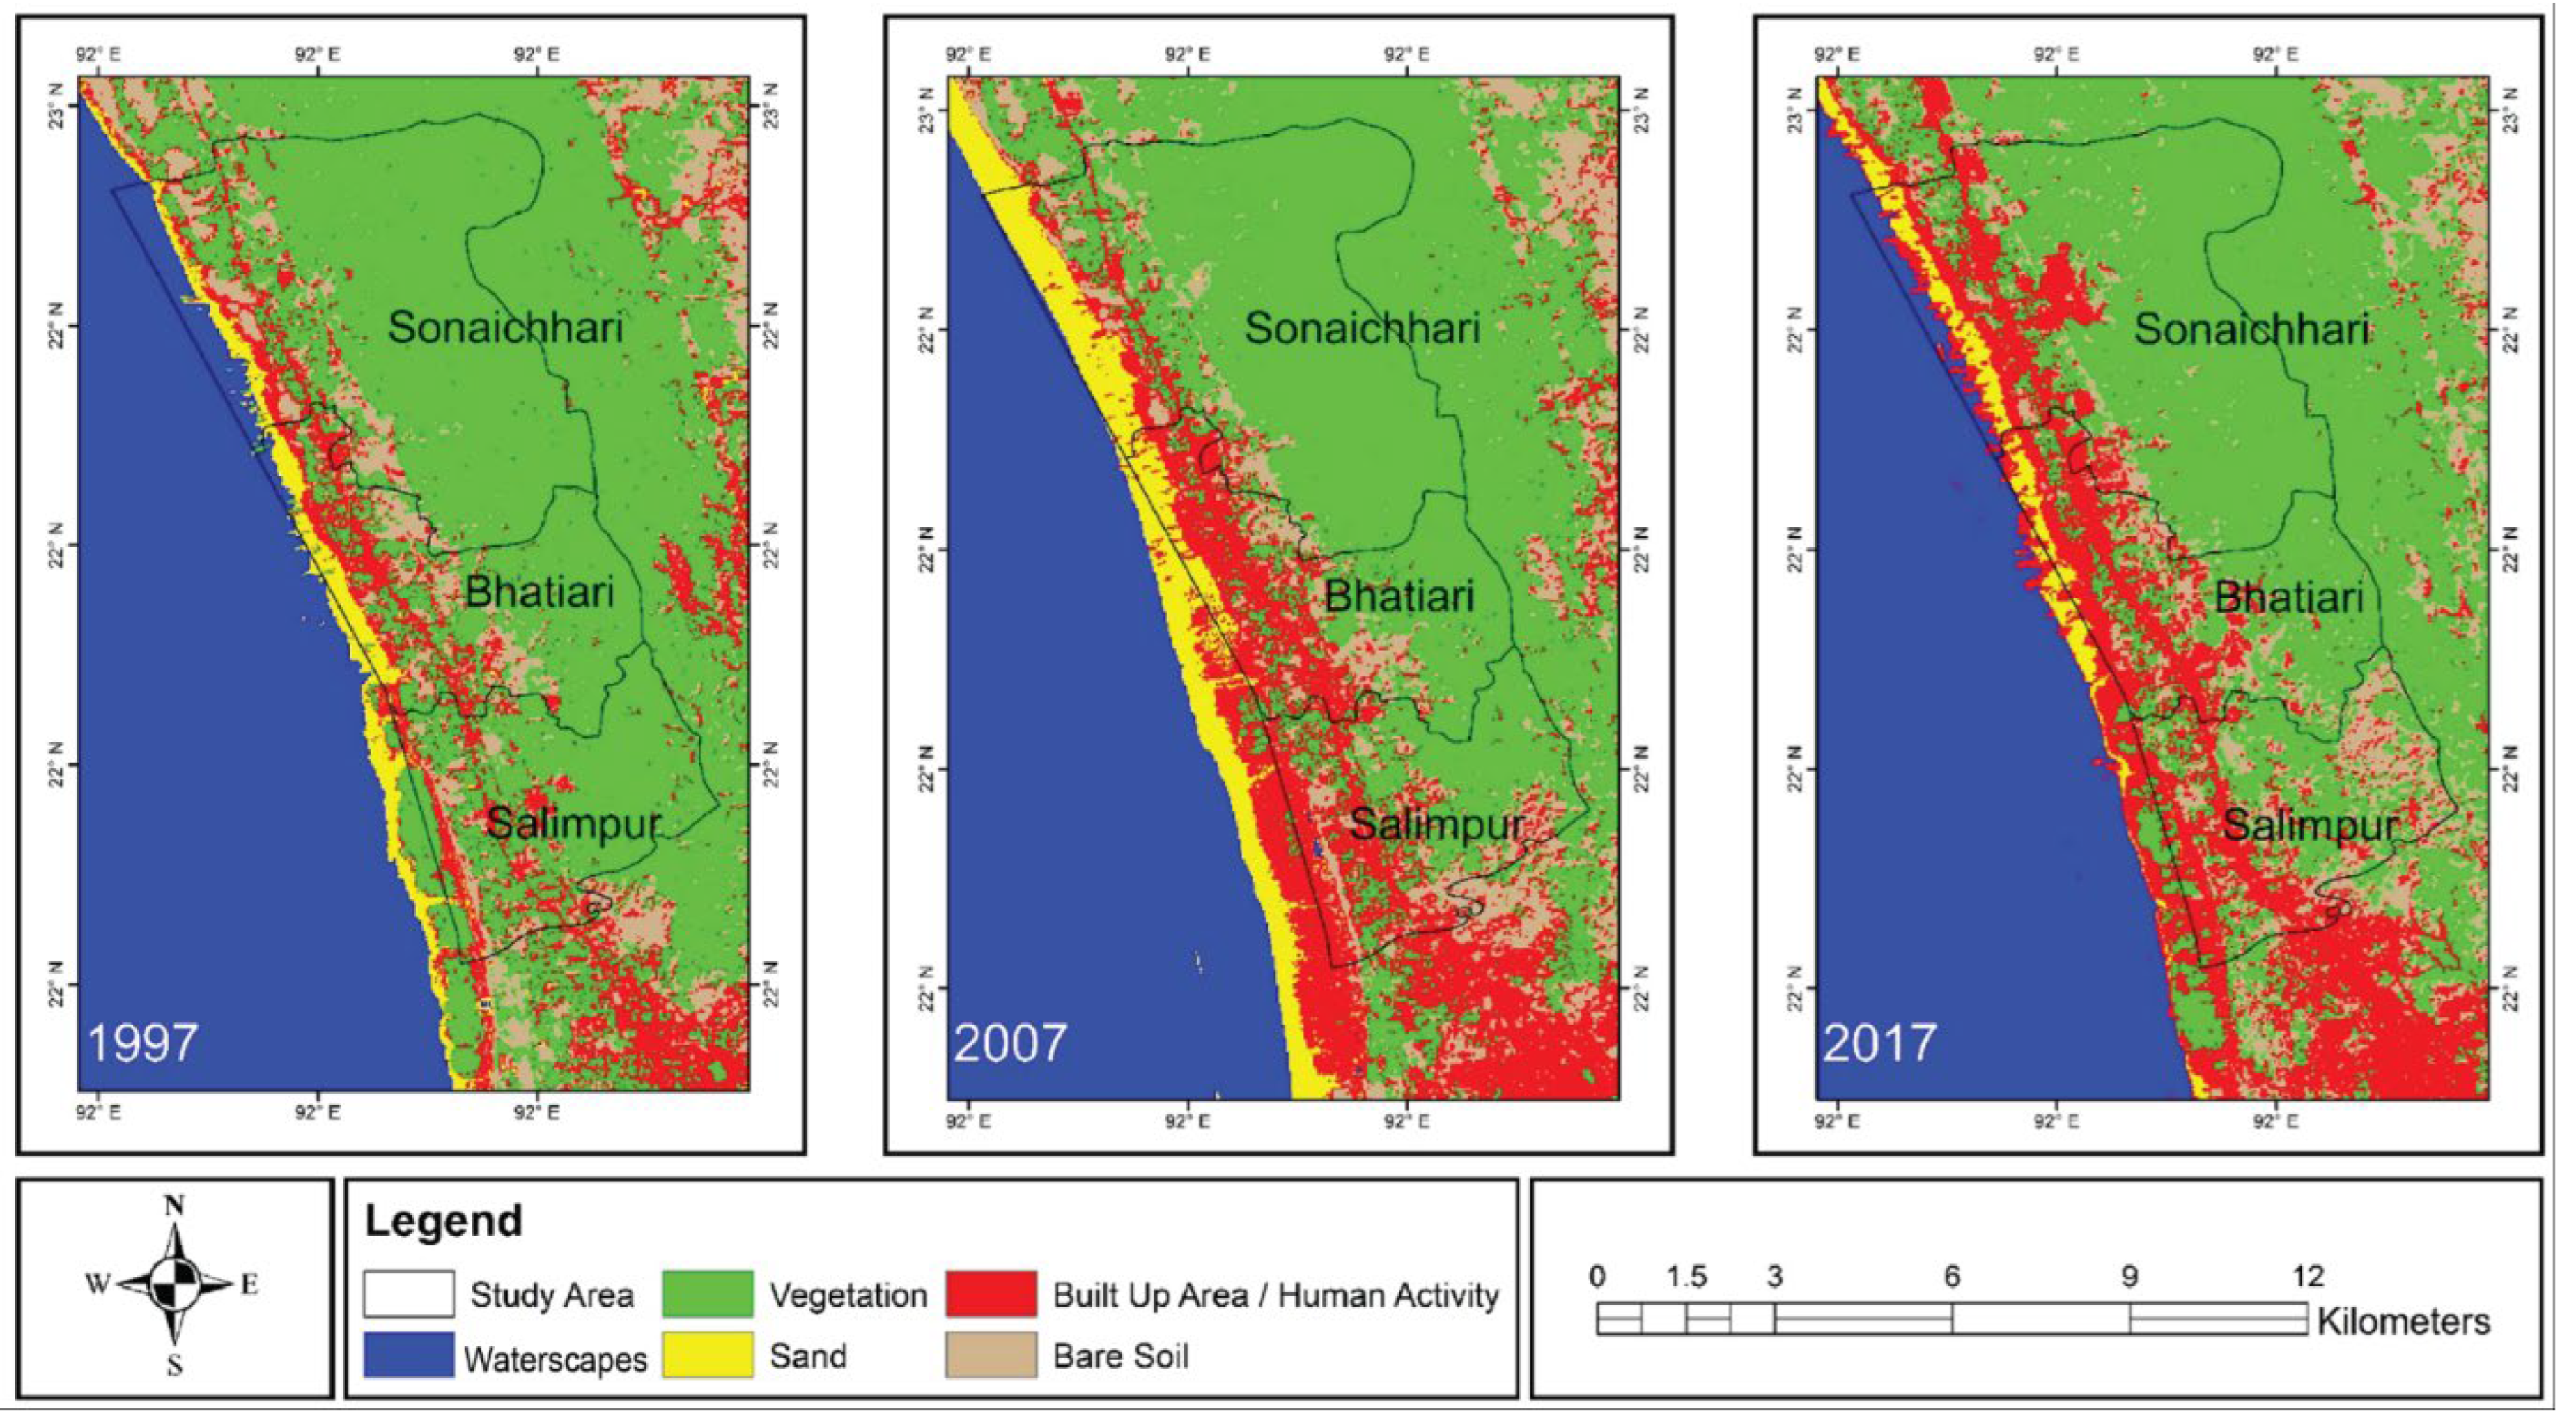
Figure 4.
Regional level percentages of (a) LULC changes and (b) LULC change differences.
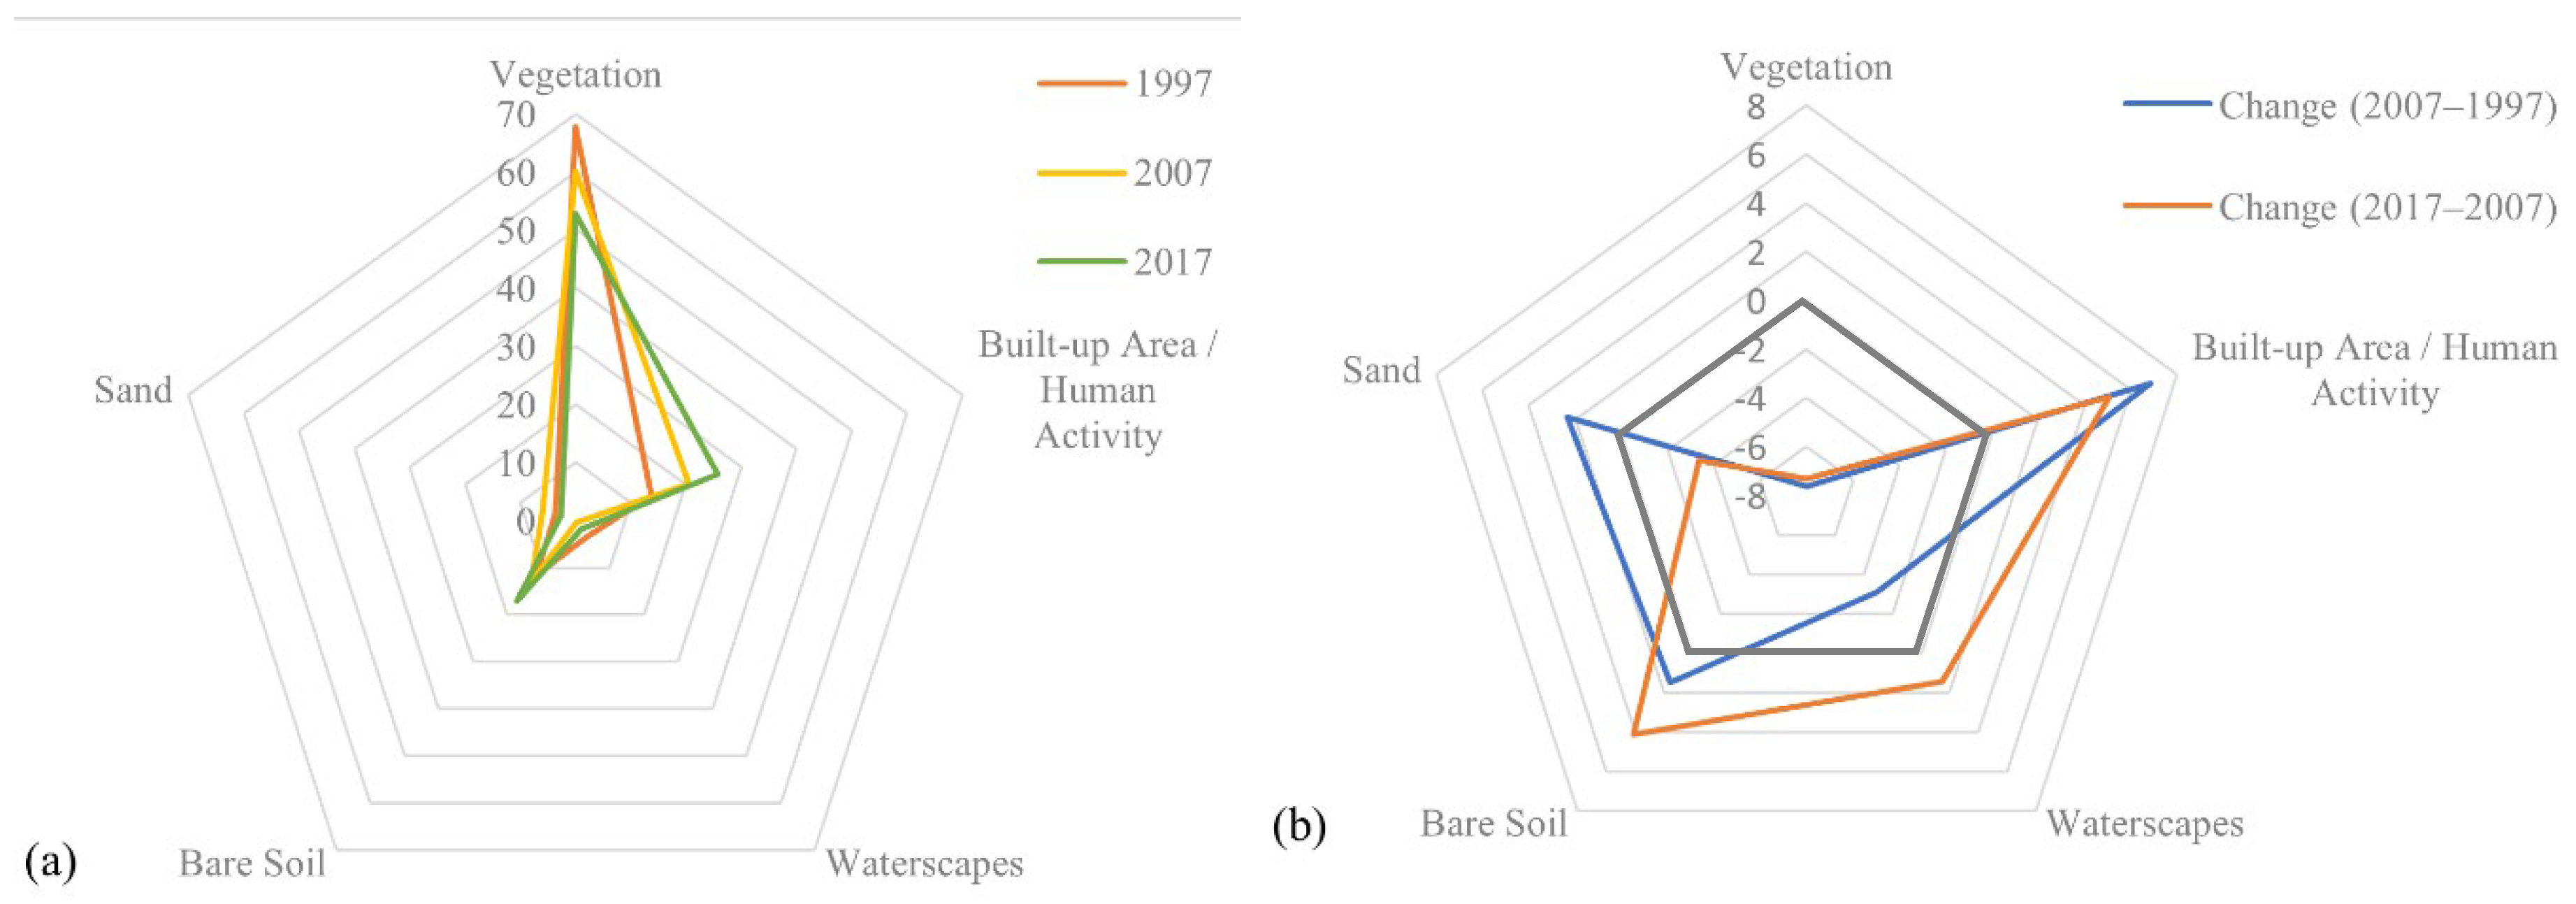
Figure 5.
Local level percentages of LULC changes (a) (c) (e), and LULC change differences (b) (d) (f).
Figure 5.
Local level percentages of LULC changes (a) (c) (e), and LULC change differences (b) (d) (f).
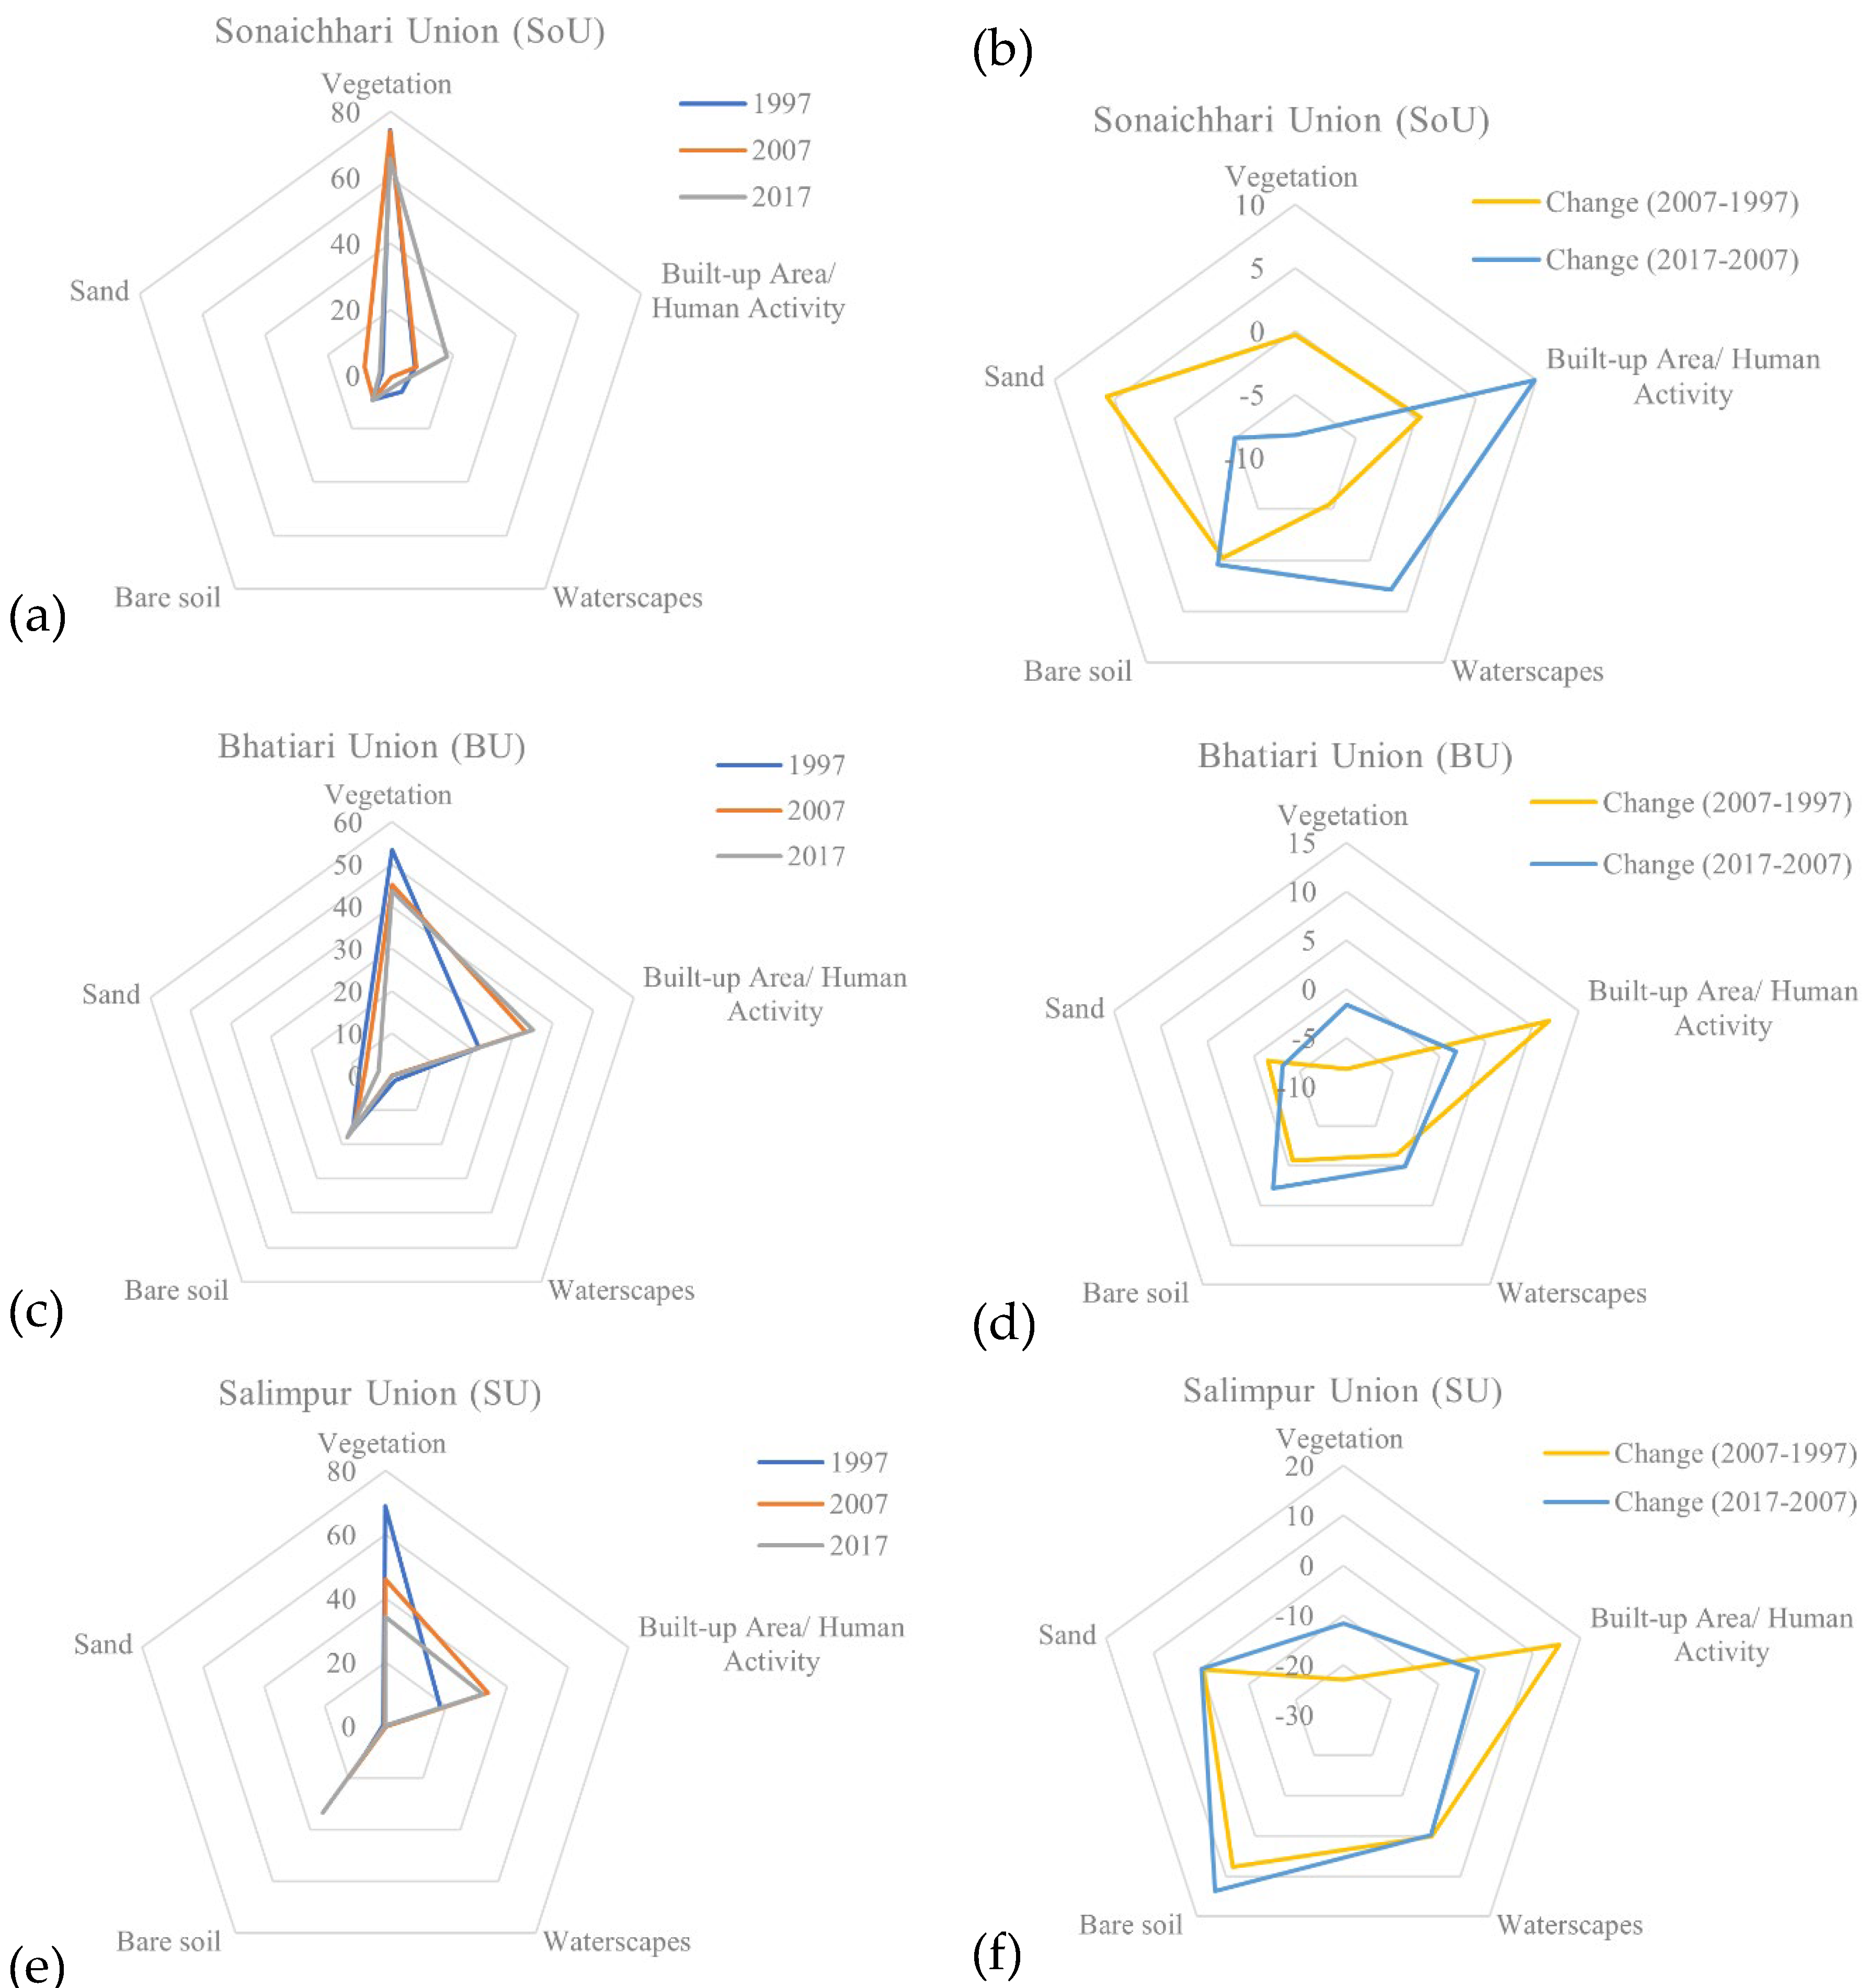
Figure 6.
Forecasted losses in non-urban LULC categories in DPZ7 under the CMMP based on two DAP baseline data sets (percentages before and after DAP approval).
Figure 6.
Forecasted losses in non-urban LULC categories in DPZ7 under the CMMP based on two DAP baseline data sets (percentages before and after DAP approval).
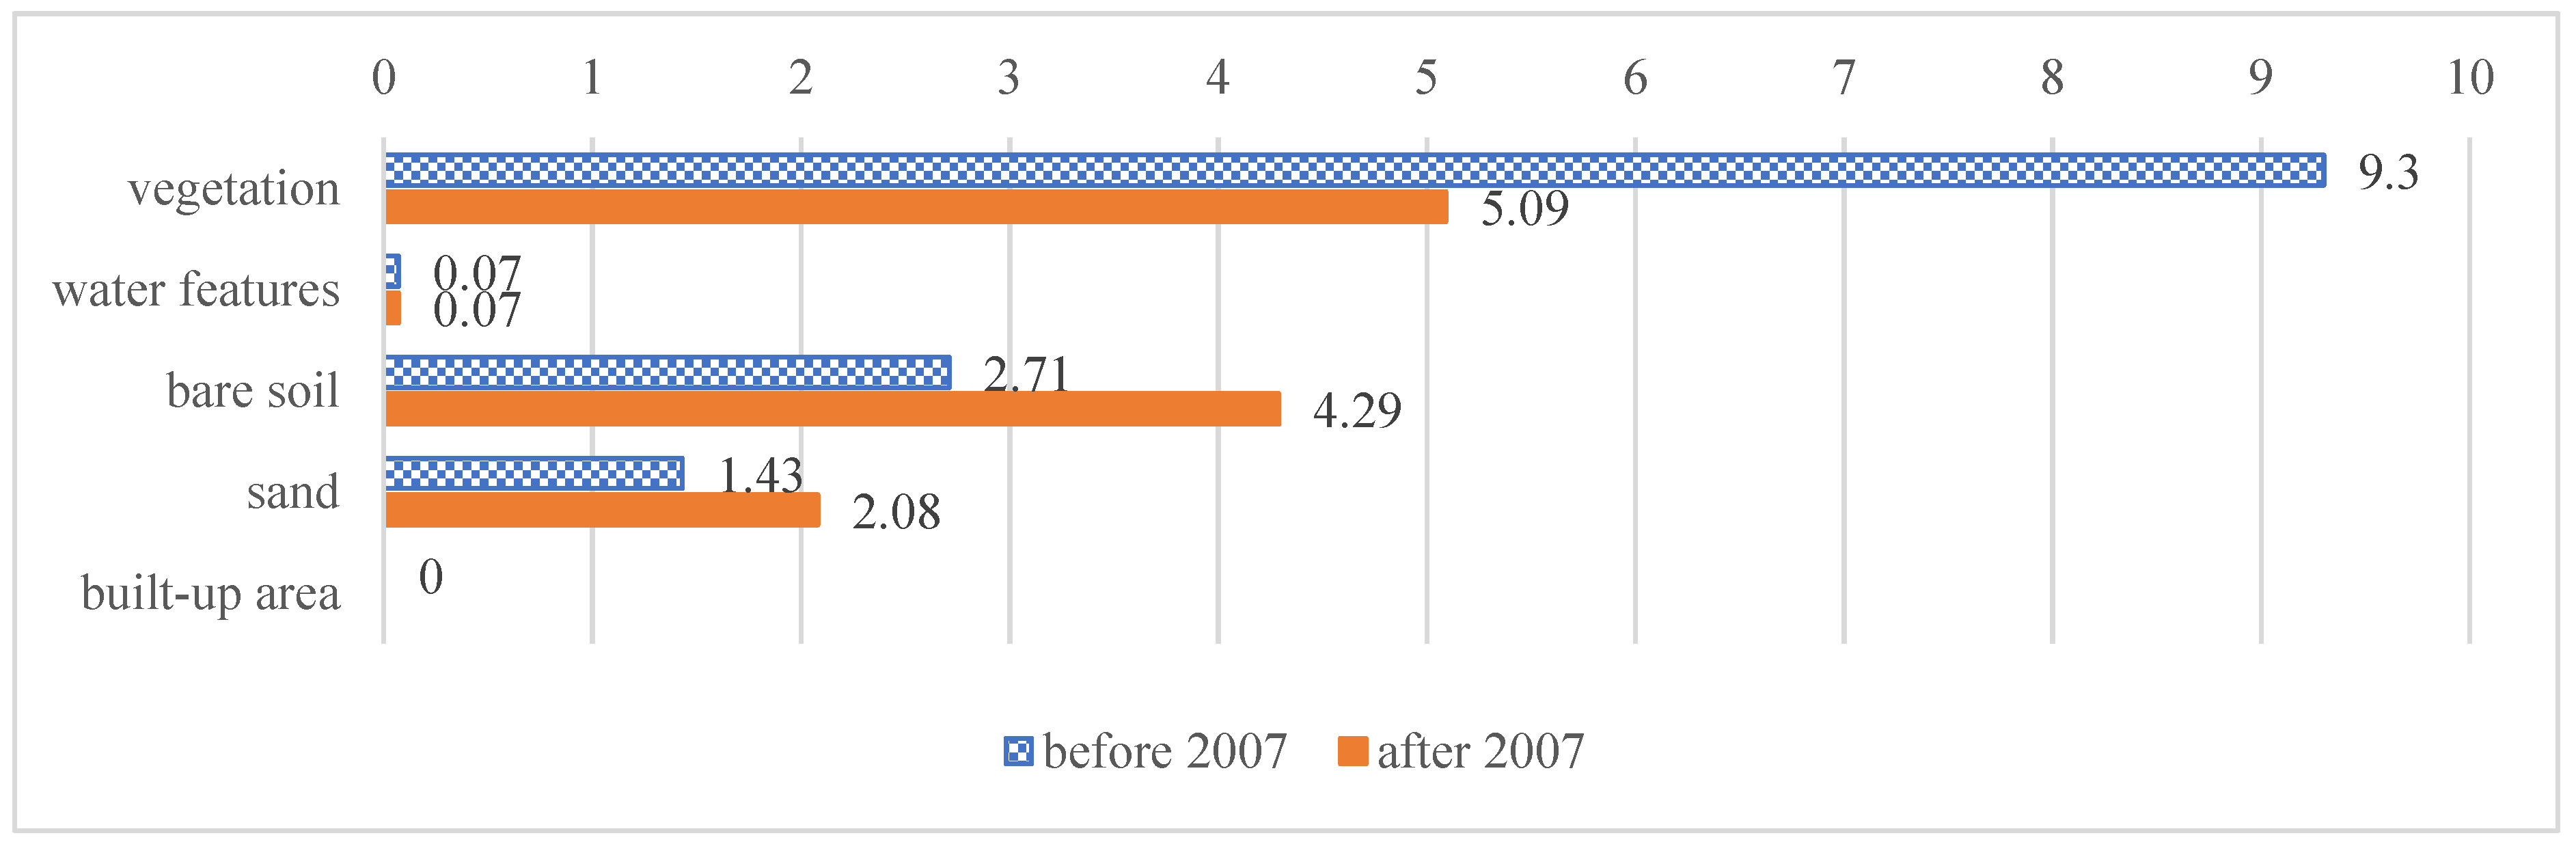
Figure 7.
Contradictory maps of DPZ7: (a) existing and proposed industrial development areas, (b) strategic open space, no development zone, and road development projects. Sources: [1,43]
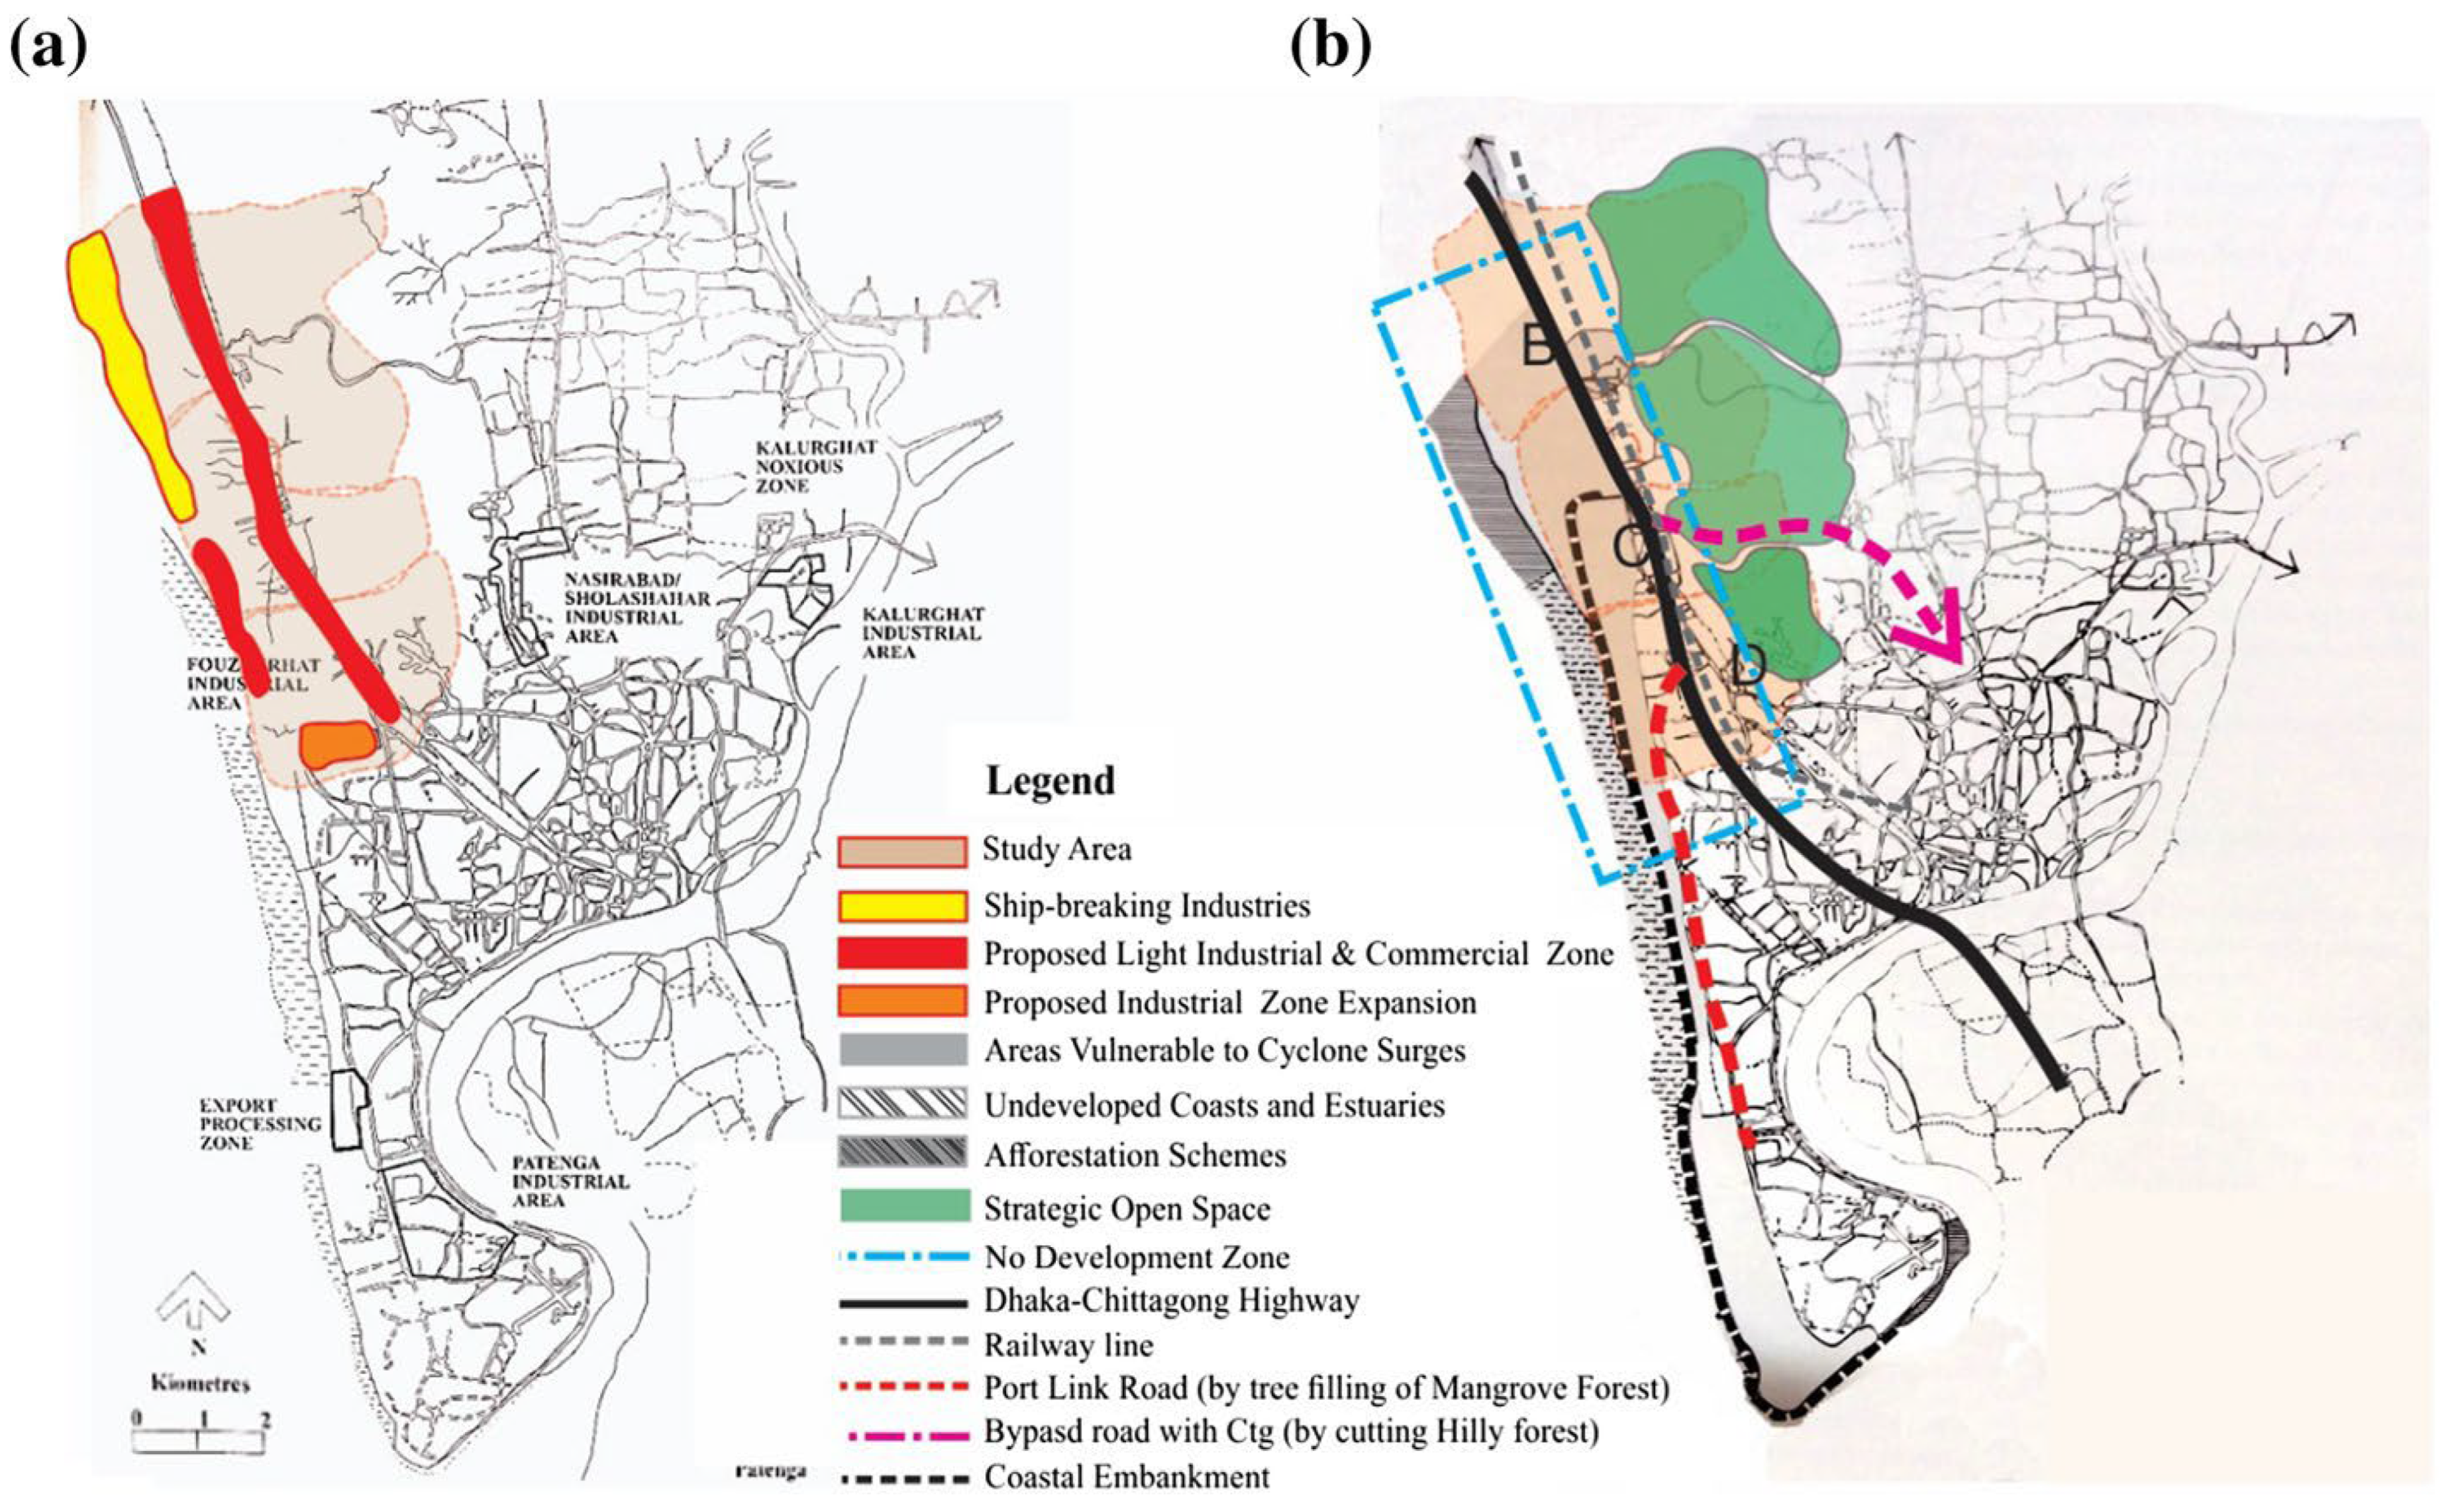
Table 1.
Properties of the ortho-rectified images of Landsat charts for 1997, 2007, and 2017.
| Year | Date Acquired (M/D/Y) | Sensor | Path/Row | Land Cloud Cover | Spatial Resolution | Projected Co-ordinate system |
|---|---|---|---|---|---|---|
| 1997 | 01/19/1997 | LANDSAT_5 TM | 136/45 | 0.00 | 30 m | WGS_1984_46N |
| 2007 | 02/24/2007 | LANDSAT_7 ETM | 136/45 | 0.00 | 30 m | WGS_1984_46N |
| 2017 | 01/02/2017 | LANDSAT_8 OLI | 136/45 | 0.01 | 30 m | WGS_1984_46N |
Table 2.
Percentages of LULC changes at the regional level (prepared by the authors).
| Land Use Classification | 1997 | 2007 | 2017 | Change (2007–1997) | Change (2017–2007) | |||
| km2 | % | km2 | % | km2 | % | % | % | |
| Vegetation | 43.18 | 67.71 | 38.31 | 60.08 | 33.65 | 52.77 | -7.63 | -7.31 |
| Built-up Area / Human Activity | 8.75 | 13.73 | 13.13 | 20.59 | 16.38 | 25.68 | 6.87 | 5.09 |
| Waterscapes | 2.18 | 3.41 | 0.21 | 0.32 | 1.138 | 1.78 | -3.09 | 1.46 |
| Bare Soil | 7.37 | 11.55 | 8.33 | 13.07 | 10.96 | 17.18 | 1.52 | 4.12 |
| Sand | 2.29 | 3.60 | 3.79 | 5.94 | 1.645 | 2.58 | 2.34 | -3.36 |
Table 3.
Percentages of LULC changes at the local level (prepared by the authors).
| Unions | Sonaichhari (SoU) (Rural + Peri-urban Area) (%) |
Bhatiari (BU) (Peri-urban Area) (%) |
Salimpur (SU) (Peri-urban + Urban Area) (%) |
||||||||||||
|---|---|---|---|---|---|---|---|---|---|---|---|---|---|---|---|
| Class/Year | 1997 | 2007 | 2017 | Change (2007-1997) |
Change (2017-2007) |
1997 | 2007 | 2017 | Change (2007-1997) |
Change (2017-2007) |
1997 | 2007 | 2017 | Change (2007-1997) |
Change (2017-2007) |
| Vegetation | 74.37 | 74.04 | 65.86 | -0.33 | -8.18 | 53.34 | 45.16 | 43.57 | -8.18 | -1.59 | 68.85 | 45.93 | 34.29 | -22.92 | -11.64 |
| Built-up Area/ Human Activity | 7.76 | 8.18 | 18.05 | 0.42 | 9.87 | 21.55 | 33.33 | 35.09 | 11.78 | 1.76 | 18.20 | 33.78 | 32.05 | 15.58 | -1.73 |
| Waterscapes | 6.00 | 0.55 | 3.42 | -5.45 | 2.87 | 1.37 | 0.00 | 0.14 | -1.37 | 0.14 | 0.00 | 0.19 | 0.00 | 0.19 | -0.19 |
| Bare soil | 9.20 | 8.94 | 9.33 | -0.26 | 0.39 | 15.77 | 15.08 | 17.91 | -0.69 | 2.83 | 12.07 | 19.85 | 33.50 | 7.78 | 13.65 |
| Sand | 2.66 | 8.30 | 3.34 | 5.64 | -4.96 | 7.97 | 6.44 | 3.29 | -1.53 | -3.15 | 0.87 | 0.26 | 0.16 | -0.61 | -0.1 |
Table 4.
Cross-tabulation matrix results for the regional level (prepared by the authors).
| 2007 | ||||||||
| Study Area(%) | 1997 | 1 | 2 | 3 | 4 | 5 | Total 1997 | Losses |
| 1 | 51.28 | 9.30 | 0.00 | 4.48 | 0.13 | 65.19 | 13.91 | |
| 2 | 1.83 | 11.34 | 0.06 | 2.50 | 0.36 | 16.09 | 4.75 | |
| 3 | 0.00 | 0.07 | 0.18 | 0.00 | 2.21 | 2.46 | 2.28 | |
| 4 | 1.96 | 2.71 | 0.00 | 7.72 | 0.01 | 12.41 | 4.69 | |
| 5 | 0.06 | 1.43 | 0.00 | 0.06 | 2.29 | 3.85 | 1.55 | |
| Total 2007 | 55.14 | 24.85 | 0.24 | 14.76 | 5.01 | |||
| Gains | 3.85 | 13.51 | 0.06 | 7.04 | 2.72 | |||
| Study Area(%) | 2017 | |||||||
| 2007 | 1 | 2 | 3 | 4 | 5 | Total 2007 | Losses | |
| 1 | 41.44 | 5.09 | 0.00 | 8.43 | 0.02 | 54.97 | 13.53 | |
| 2 | 4.34 | 16.80 | 0.02 | 3.59 | 0.32 | 25.08 | 8.28 | |
| 3 | 0.00 | 0.07 | 0.17 | 0.00 | 0.00 | 0.24 | 0.07 | |
| 4 | 2.09 | 4.29 | 0.00 | 8.32 | 0.02 | 14.72 | 6.40 | |
| 5 | 0.00 | 2.08 | 0.99 | 0.01 | 1.91 | 4.99 | 3.08 | |
| Total 2017 | 47.88 | 28.32 | 1.19 | 20.34 | 2.27 | |||
| Gains | 6.44 | 11.5 | 1.02 | 12.02 | 0.36 |
Disclaimer/Publisher’s Note: The statements, opinions and data contained in all publications are solely those of the individual author(s) and contributor(s) and not of MDPI and/or the editor(s). MDPI and/or the editor(s) disclaim responsibility for any injury to people or property resulting from any ideas, methods, instructions or products referred to in the content. |
© 2024 by the authors. Licensee MDPI, Basel, Switzerland. This article is an open access article distributed under the terms and conditions of the Creative Commons Attribution (CC BY) license (http://creativecommons.org/licenses/by/4.0/).
Copyright: This open access article is published under a Creative Commons CC BY 4.0 license, which permit the free download, distribution, and reuse, provided that the author and preprint are cited in any reuse.


