Submitted:
28 June 2024
Posted:
01 July 2024
You are already at the latest version
Abstract
One of the goals of modern orcharding is to have a high production of fruits that are uniform in size, organoleptic parameters, and health characteristics. The aim of the work was to study the assortment of different shoot types and their prevailing position along the cane and how shoot type can contribute to on shoot type on fruit quality in Actinidia tree. The experiment was carried out over two years in a commercial orchard of Actinidia chinensis, cv Gold 3. Along the cane, the shoots were classified as Spur shoot (SP), terminate shoot (TE), no terminate shoot (NT), and cut no terminate shoot (CNT). The data were statistically processed using ANOVA and Principal Component Analysis (ACP). Four different fruit categories were obtained from to the four shoot type to compared: a prevailing category (55% of total fruits), which is characterised by its higher soluble solids content, sweetness, and excellent health characteristics, but with a lower hardness of the pulp, which would lead to the hypothesis that harvesting could be brought forward; a second category of fruit (19% of total fruit) with the lowest soluble solids content, but a high antioxidant capacity detached from CNT shoot; another category of fruit (13% of total fruit) produced from NT shoots, with the lowest health value, but good sweetness perception; finally the category with the lowest fruit percentage over total fruit harvested (10%) from SP shoots, characterised by its smaller size. It is to be verified what the performance of each category will be after post-harvest to speculate whether it is possible to differentiate the product at harvest into quality categories or possibly to differentiate the harvest time.
Keywords:
fruit quality
; hydraulic conductance
; kiwifruit
; shoot type
1. Introduction
One of the goals of modern orcharding is to have from the orchard a high production that is of quality, thus fruits as much or less uniform in size and valuable organoleptic and health characteristics [1], to achieve this it is necessary to have self-rooted plants or propagated on certified clonal rootstocks [2,3], uniform soil characteristics and soil management, as well as the same irrigation, fertilisation, and canopy management [4]. However, even with uniformity in these aspects, variability among plants can be reduced, but variability related to, for example, the type of branch or shoot bearing the fruit may exist. In kiwifruit, the shoots of the current season at the axil of the leaves originate from the axillary meristems [5]. A certain number of phytomers originate in these meristems between the summer of the year of their formation and before winter dormancy. In the spring of the following year, the active bud begins to swell and develops into a shoot containing a few leaves [6]. In many shoots, growth arrest occurs shortly afterwards, followed by the abortion of the bud tip. Other shoots continue to grow until late in the season, with the final number of phytomers exceeding the number of preformed phytomers present during sprouting [5,7]. This indicates that the initiation of new phytomers must occur in some shoots during the current growing season or ‘neoformation’ [8]. Therefore, all kiwi buds have the same potential to develop into long, non-terminated shoots [9]. Furthermore, the vine must support the rapid formation of a new canopy together with the flower development between bud break and flowering [6] with previously stored reserves [10] until the shoot becomes autotrophic after 40 days from bud-break [11]. Some authors reported that shoot growth depends by genotype, environmental conditions (temperature) [12], and shoot competition. Indeed, it is reported that the removal of neighbouring shoots results in a higher proportion of long shoots [13,14]. Therefore, the competition between shoots and reserves defines the shoot growth rate at bud-break starting. The early shoots are more vigorous and competitive than the next shoots. Insufficient satisfaction with the cold requirement accentuates the scalarity of sprouting; furthermore, in these conditions, the competition of early shoots on later ones is much more pronounced. Furthermore, in Actinidia, tip abortion of shoots can occur at any time during the extension of the preformed phytomers, giving rise to short or medium shoots. In contrast, shoot growth becomes indeterminate, giving rise to long shoots when tip abortion does not occur. Therefore, there are different shoots in the Actinidia canopy, with different leaf numbers and leaf areas [15] classified the shoot into three types: short sprouts (up to nine nodes and are terminated), medium shoots (between 10 and 18 nodes and are terminated), and long shoots (more than 18 nodes and can have up to 90 nodes and are unterminated). A fourth can be added to these three categories: long shoots are pruned with summer pruning. Furthermore, a previous study on Actinidia deliciosa cv. Hayward showed that the assimilate can be easily translocated within the plant to support fruit growth on shoots with an inadequate leaf-to-fruit ratio [16,17,18], reducing variability between fruit in vines. However, it is reported that reducing the number of sources increased the variability in fresh and dry weight [19]. The aim of the work was to study the assortment of different shoot types and their prevailing position along the cane and how shoot type can contribute to on shoot type on fruit quality in Actinidia chinensis plants, cultivar Gold 3, cultivated in one of the most important Actinidia growing areas of Italy.
2. Materials and Methods
2.1. Orchard
The experiment was carried out during 2022 and 2023 in a commercial orchard (Actinidia chinensis, cv Gold 3) located at Polistena (RC) (38°25′14.9”N - 16°01′56.9”E) Calabria, Italy, UE. Vines of A. deliciosa, Hayward cv, were planted in sandy soil with 7.0 pH, 2.2% organic matter and 1.7g kg–1 N content during 2015. Vines were spaced 5.0 m× 4.0 m apart (500 vines ha–1), and interspecific grafted was applied in 2016 using a scion of A. chinensis cv, Gold 3. The plant was trained to a pergola system. The male/female plant ratio was 1:7, and the pollinator used was cv. Bélen. The orchard was irrigated with two drippers per tree of 4 liters.h-1. The cane was pruned to 1.4 m, and twelve canes were left per plant. The yearly dormant pruning (December) was combined with summer pruning (July). The orchard was managed using standard integrated pest control systems and stable drip irrigation and fertilisation systems.
2.2. Experimental Design
Three vines were selected that were similar in vegetative development and fruit load. The experimental design adopted was a randomised blocks; each vine was considered a single block. Subsequently, 3 parent shoots per plant similar to proximal diameter were selected; along the cane were detected for each node the un-broken buds and the shoots; these last were classified in Spur shoot (SP) under 15 cm length, terminate shoot (TE) with length ranging from 15 to 60 cm, no terminate shoot (NT) over 60 cm, and cut no terminate shoot (CNT). At the harvest, the fruits were harvested and discriminated according to the shoot type, and the leading morphobiometric and qualitative indices were acquired on them. Hydraulic resistance measurements were performed on three parent shoots of the cv. G3, distinguished by vigour.
2.3. Maturation Indices and Nutraceutical Parameters
At the harvest (164 GDPF in the first year, 2022, and 162 DAFB in the second year, 2023), the fruits were harvested and discriminated according to the shoot Types.
2.4. Fruit Biometric Measures
They were immediately used to acquire transversal diameters (Dmax and Dmin) and longitudinal diameter (H) by using a precision calibre; Fresh weight (FW) was determined using an electronic balance (Mettler-Toledo MgbH, Grelfensee, Switzerland).
2.5. Flesh Firmness
Flesh firmness (FF) was measured with a digital penetrometer PCE-FM200 (PCE Instruments, UK) with an 8 mm probe. The peel was removed before measurements, and these last were taken on two opposite sides of the equatorial zone of the fruit; the two measures were averaged.
2.6. Soluble Solids Content
The total soluble solids content (TSS) of juice drops obtained by squeezing each fruit’s apex and base using a digital refractometer (PAL-1, Atago, Tokio, Japan) was measured. The value was expressed as °brix.
2.7. Titratable Acidity
Titratable acidity (TA) was determined by titrating 10ml of the juice diluted with distilled water (1:1) and titrated to pH 8.2 with 0.1N NaOH (mEq. NaOH/100g fresh fruit). Titration results were expressed as citric acid equivalents per 100 ml of sample juice.
2.8. Dry Matter Content
Dry matter content (DMC) was determined using a standardised sampling method: a horizontal slice of the equatorial zone fruit tissue was extracted from each fruit. The thickness of the slice was about 1cm, and the fresh weight was recorded. The slice was placed in a dehydrator (Binder EED240, Tuttlingen, Germany) at 105 °C until the constant dry weight was reached. The dry matter content was expressed as a percentage of fresh weight using the formula:
2.8. Total Polyphenol Content (TPC) and Total Antioxidant Capacity (TAC)
Five fruits per plant were taken to analyse mesocarp TPC and TAC. Fruit samples were homogenised using an Ultraturrax blender (20.000 rpm; T25 Basic, IKA Werke, Germany). TPC and TAC were analysed separately using a Kontron Uvikon 941 Plus spectrophotometer. Before measuring TPC and TAC, standard curves were prepared for each test. TPC (mg gallic acid equivalents/g fresh weight) was determined using the Folin-Ciocalteau method [20]. TAC was determined using the modified TEAC assay and expressed as mmoles Trolox equivalents/100g fresh weight [21,22]. TEAC assay included the kiwifruit samples hydrophilic and lipophilic contributions [23].
2.9. Flesh Color
Flesh color was evaluated with a Minolta spectrophotometer CM-700d (Minolta, Inc., Tokyo, Japan), which provided measurements of L*, a* and b* in three points of each fruit. L* measures the lightness, varying from 100 for the perfect white to zero for black. a* measures the redness when its value is positive, grey when zero, and green when negative. b* measures yellowness when positive, grey when zero, and blue when negative. The colorimeter was calibrated with standard black and white calibration tiles.
2.10. Leaf Drop
Leaves were counted on 20 marked shoots of each vine, from 160 DAFB to 190 DAFB. In both years, leaf drop began not earlier than 175 DAFB in November.
2.11. Vegetative Measurements
During each growing season, on three parent shoots per vine, the length, the number of leaves, and the number of fruits on each shoot type were acquired from the proximal to the distal zone of the cane. The cane diameter was also measured at the shoot base. At the end of the season, the leaves of each shoot type were detached and used to measure the leaf area with Area-meter Li-3100 (Li-COR, Lincoln, NE, USA), No. of leaves per fruit and average leaf area per fruit.
2.12. Gas Exchange
Net photosynthesis (Pn) and Transpiration (Tr) were measured on nine leaves x shoot (9 leaves×3 shoots×3 plants). The measurements were taken using a portable photosynthesis system (Li-Cor 6400XT; LI-COR Biosciences, Lincoln, Nebraska, USA). The gas exchange measurements were carried out during clear sunny summer days (from 11:00 to 13:00) during the last week of the summer months (June, July, and August) in both years.
2.13. Shoot Hydraulic Conductance
For this purpose, a Hydraulic Conductance Flow Meter XP Gen3 (Dynamax Inc., Houston, TX, USA) was used. With a clean cut, the shoots were removed from the cordon and connected to the HCFM; shoot hydraulic conductance (HC) was measured in quasi-steady mode at a pressure of 0.3 MPa. The sample was perfused with high-pressure water until the leaves were visibly waterlogged. HC was monitored once this hydration state was reached until it became stable, and a quasi-steady state (QSS) reading was taken [24].
2.14. Statistical Analysis
The data were statistically processed using SPSS v. 22.0 software (IBM Corp, Armonk, NY) by one-way analysis of variance. Tukey’s test was used to discriminate averages that showed a significant effect of ANOVA. The dataset was subjected to data mining techniques such as Principal Component Analysis (ACP), using XLSTAT (Addinsoft, New York, USA).
3. Results
The fruit fresh weight (FW) was highest on the CNT. The FW difference was statistically significant between the CNT and SP, while the FW was similar among the NT and TE and other shoot types (Table 1).
The shoot type does not influence the ratio between the two transversal diameters of the fruit and the H/D ratio (Table 1). Differences were recorded from two observation years, but the interaction between year x shoot types was not significantly. The average total soluble solids value was 27% statistically lower in the fruit of the SP than in fruit detached from the TE (14.28 °Brix). Instead, the TSS average value found in the fruit of the NT was intermediate and statistically different compared to TE and SP. The TSS in fruit on the CNT was similar to the last. The titratable acidity was higher in the fruit of the SP sprout and lowest in the TE sprout, with statistically different differences; on the other types, the TA value was intermediate to what was found in the fruit of the preceding sprouts (SP and TE) significantly different (Table 2).
The TSS/TA ratio expressing fruit sweetness was significantly higher on the TE shoot fruit, following from NT, CNT, and finally SP, with difference statically different. The values of the CNT and NT fruits were significantly similar to each other and intermediate to the alternative shoots and significantly different from them (Table 2). Concerning the Dry weight (g.fruit-1), the significantly highest value was recorded in the CNT. In contrast, the statistically lower value was recorded in the SP, with a value drop of about 1.43 g (Table 2). Intermediate and significantly different values compared to the CNT and SP were found with the NT and TE shoots without statistical differences (Table 2). The DMC (percentage of fresh weight) was significantly lower in the fruit detached from the CNT than those harvested from NT and SP. The average value detected in fruit harvested from TE did not differ from that of other types of shoots (Table 2). The effect of the year was recorded for all the above parameters reported; however, no significant interaction between year and Type shoot was observed. The firmness of the fruit pulp harvested from the TE was significantly lower than that of the other shoot types; in these last, the value was statistically similar and ranged from 8.47 to 8.9 kg.cm2 (Table 2). During the early stages of development, Kiwifruits showed a green coloration of the pulp. In cv G3, the fruit should be harvested when the tint, expressed as °Hue falls below 103 °Hue (US patent 22,355 P3). The fruit of the different shoot types reached an excellent value and was well below the prescribed limit average value on the harvest date. However, the lowest value was measured in fruit on the SP (88.95 °Hue ±0.32), and the highest value was found in fruit pulp detached from TE (Table 3).
The close correlation between TPC and TAC is confirmed for the bioactive compounds. However, green pruning led to a significant increase in TAC without an equivalent increase in TPC. It is conceivable that the green pruning intervention led to an increase in other bioactive compounds (Table 4).
The average length of the shoot was highest in the NT shoot (404.33 cm ±164.20); in contrast, the shortest length was recorded in the SP shoot (16.273 cm ±5.14), while intermediate values were detected on the TE (66.16 cm ±30.36) and CNT (153.529 cm±31.72) shoot types (Table 5).
Differences were recorded from two years, but interaction tear x treatments were not significant. A similar trend was observed for the number of leaves; this parameter significantly differed among the shoot types. Indeed, the highest number of leaves was found in the NT shoot (60 leaves) and the lowest value in the SP (6 leaves), while on the TE shoot and CNT, the number of leaves was intermediate, 24 leaves and 14 leaves, respectively (Table 5). The distribution of the different types of shoots on the cane showed that 33 % of the shoots of the NT type cut were present in the proximal section of the cane; they were cut to be used next year as renewal canes. The shoots of SP type were found in the middle of the cane (about 22% of total shoots), while in the distal portion of the cane were found both the shoots of TE type (about 35 % of total shoots) that the shoots of NT type (about 10 % of total shoots), in the zone more distal of cane. Similar trends were recorded in two years of the experiment without significant differences between them. The NT type was found when the cane diameter at the shoot base was over 15 mm, TE when the cane section was lower, about 11 mm, and SP when the cane diameter was under 9 mm. The average leaf area of the shoot was highest in the indeterminate growth shoot (250.00 cm2 ±6.58), while significantly lower values were observed on the TE (177.15 cm2 ±7.31 cm2) and CNT (175.00 cm2 ±4.73) shoots. However, the lowest values were found on the shoots of the SP type (136.36 cm2 ±8. 31). For this parameter, the pattern was also similar between the first and second year and no significant interaction year per treatment was observed (Table 5). The length of the internodes was significantly highest in NT shoots (6.73 cm ±0.99), and the value was statistically similar to those found in the TE shoots, while internode length was 4 cm shorter in the SP shoots (2.35 cm ±0.93). The differences in internode length among the shoot types were recorded over the two years. No interaction Year x type of shoot was not recorded. No differences were observed in leaf drop at the end of the vegetative annual cycle. However, the shorter shoot showed the lowest value, about 50% (Table 5). The leaf area per fruit was lower on SP and TE shoots, 300 and 376 cm2.fruit-1, respectively, with 1.69 and 2.76 leaves per fruit-1, whereas it was higher in alternative shoots; in particular, it was about 530 cm2.fruit-1 in a CNT shoot, with 3 leaves.fruit-1, and was significantly higher in NT shoots, with 2200 cm-2.fruit-1 and 8 leaves.fruit-1. The value was significantly similar for each shot type between two years, and no interaction Y x type of shoot was observed. Analysing gas exchange, lower photosynthetic activity (An) and lower stomatal conductance (gs) and transpiration (E) were observed in SP; significantly higher values were found in NT and CNT shoots; intermediate values in TE shoots (Table 6).
With regard hydraulic conductance of shoot type (HC) the values were similar to TE and NT shoots, while the value was also significantly lower in SP shoot. The measurement was not detechead onto CNT (Table 6). Principal Components Analysis (PCA) allowed the study of the relationships between the original variables to find a new, smaller set that expressed what was in common between the original items; this made it possible to identify factors not directly observable (latent variables or common factors) while maintaining a high explained variability. The variables strongly correlated and belonging to factor F1 were some variables of the fruit such as fresh weight, H/D ratio, TSS, dry weight per fruit, color parameters L* and Hue, and antioxidant capacity; also strongly correlated to factor 1 were leaf photosynthesis (Pn) and other variables of the shoot such as conductance, length, leaf area, internode length, and phylloptosis. Fruit variables such as pulp firmness, dry weight content (%), polyphenol total content, number of leaves per fruit and leaf area per fruit were strongly correlated and belonged to factor 2. Finally, the colorimetric variables of the pulp a, b and chroma, minimum and maximum diameter ratio of the fruit, and number of fruits per shoot were strongly correlated and belonged to F3 (Figure 1).
The dataset was used to make a 3-dimensional graph with Excel using the XLSTAT add-on statistical software (Figure 2). The data correspond to the outputs (rows points and columns points) of the correspondence analysis.
4. Discussion
Bud-break of Actinidia chinensis was lower at the proximal zone of the parent shoot (cane) and was higher in the medium and distal portions. The bud-break along the cane did not change significantly over two years. However, the actinidia cultivar used in the experiment with lower chilling unit requirements and the bend of cane adopted in the pergola system reduced the acrotony habitus along the cane and favoured a higher bud breaking in the basal and central zone. Carbohydrate sinks are described by their sink strength, that is their ability to attract carbohydrates when supply is not limited [25,26], and by their priority which describes their ability to compete when carbohydrate supply is limited. Root and shoot apices are the principal sinks during vegetative growth, while fruits become the dominant sinks during the reproductive phase. Then, the distribution of different types of shoots along the parent shoot observed is the complex result of many factors interaction that design the fate of the tip of shoots, such as carbohydrate supply from vine reserves and competition for reserves [8,10,14,27]. The lower reserve favoured SP; TE were likely due to a lower reserve and lower production of photosynthate by leaves during the transition of the shoot from heterotrophy to autotrophy Finally, NT development when reserves were highest. Furthermore, the greatest access to the reserves favoured higher shoot development [11,28,29]. Indeed, the relationship between shoot type and the cane diameter at the base of the shoot was found according to previous studies [7,15]. The spur shoot has a lower internode length and diameter than TE and NT shoots and lower conductance (HC). Therefore, it is reported that in the fruit, the water is imported by xylem early in development to dominance by phloem flows during the later stages of development [19,30,31,32]. Dry matter predominantly enters in the fruit through the phloem while water enters via phloem [19]. The lower dry weight in fruit of SP can be attributed to the lower photosynthetic activity on the spur. The lower Pn recorded on spur shoot, according to observed by [9], could be also the result of a lower water available or less palisade tissue development. Finally, the lower Pn, the lower number of leaves and the leaf surface in spur shoots reduced the amount of photosynthates produced by the spur shoots. However, the leaf surface to fruit was the same between SP and TE shoots. Therefore, the lower dry weight in the first case is attributable to the lower Pn of the leaf. [29] reported that nine weeks after budburst, long shoots had a carbon surplus three times that of the short shoots; our results showed a higher leaf area per fruit and high Pn activity. All previous reports suggest the higher advantage of fruit development medium and long shoots and explain the higher water and dry weight in the fruit of the alternative shoots to spur shoots. However, the DMC did not change compared to the other not-cut shoots because the water and dry weight were lower in fruit on the spur. For last shoot type the hydraulic conductance was the lowest (Table 5). In contrast, the fruits of indeterminate shoots with higher conductance have a higher water content, while the conductance in TE shoots was intermediate between NT and SP. In the fruit of CNT, the dry weight per fruit and water were highest, probably due to minor competition between fruit, tip, and new leaves in development compared to NT, but the final result was to lead to the lowest dry weight fruit content. However, the ripening stage on the shoot was higher in fruit on TE shoots, as shown by TSS, FF, and Hue° angle values. Therefore, the ratio TSS/TA that corresponds to the sweetness of the fruit was also influenced by shoot type. Finally, shoots also influence the values of bioactive substances such as TPC and TAC (Table 6). Indeed, the highest values were found in shoots that were alternative to SP and TE shoots: NT and CNT shoots. Therefore, the green pruning on CNT shoots has increased the TAC but not the TPC. Finally, the PCA showed that the fruits were strongly differentiated according to the type of sprouts; in fact, the SP and NT sprouts belong to the F1 and F3 factors, respectively, while the fruits of the TE and CNT shoots belong to the F2 Factor.
5. Conclusions
The work highlighted the qualitative variability within the same plant conditioned by the type of bud that supports fruiting. It emerged that the amount of reserve substances present in the cane determines the type of the shoot and appears to be a function of the diameter of the cane itself at the budding bud. The size was optimal for each bud type. However, as a function of bud type, the PCA showed that NT and SP buds are correlated with variables belonging to different factors. In contrast, TE and NT buds have correlations with variables belonging to the same plan. Four different fruit categories were obtained from to the four shoot type to compared: a prevailing category (55% of total fruits), which is characterised by its higher soluble solids content, sweetness, and excellent health characteristics, but with a lower hardness of the pulp, which would lead to the hypothesis that harvesting could be brought forward; a second category of fruit (19% of total fruit) with the lowest soluble solids content, but a high antioxidant capacity detached from CNT shoot; another category of fruit (13% of total fruit) produced from NT shoots, with the lowest health value, but good sweetness perception; and finally the category with the lowest fruit percentage over total fruit harvested (10%) from SP shoots, characterised by its smaller size. It is to be verified what the performance of each category will be after post-harvest to speculate whether it is possible to differentiate the product at harvest into quality categories or possibly to differentiate the harvest time, for example, one could anticipate production from TE sprouts, which accounts for more than 50%.
Author Contributions
Conceptualization, A.D. and G.G.; methodology, A.D. and G.G.; software, A.D. and G.G.; validation, A.D, R.Z. and G.G.; formal analysis, A.A., A.D., G.G.; investigation, A.A., A.D., G.G.; resources, A.A., A.D., G.G.; data curation, A.A., A.D., G.G.; writing—original draft preparation, A.D. and G.G.; writing—review and editing, A.D. and G.G.; visualization, A.D and G.G..; supervision, A.D, R.Z. and G.G.; project administration, A.D, R.Z. and G.G.; funding acquisition, A.D. and G.G. All authors have read and agreed to the published version of the manuscript.
Conflicts of Interest
The authors declare no conflicts of interest.
References
- Musacci, S.; Serra, S. Apple fruit quality: Overview on pre-harvest factors. Sci. Hortic. 2018, 234, 409–430. [Google Scholar] [CrossRef]
- Jimenes, I.M.; Mayer, N.A.; Dias, C.TdS.; Filho, J.A.S.; Rodrigues da Silva, S.R. Influence of clonal rootstocks on leaf nutrient content, vigor and productivity of young ‘Sunraycer’ nectarine trees. Sci. Hortic. 2018, 235, 279-285.
- Milošević, T.; Milošević, N.; Mladenović, J. Combining fruit quality and main antioxidant attributes in the sour cherry: The role of new clonal rootstock. Sci. Hortic., 2020, 264, 109236. [Google Scholar] [CrossRef]
- Minas, I.S.; Tanou, G.; Molassiotis, A. Environmental and orchard bases of peach fruit quality. Sci. Hortic. 2018, 235, 307–322. [Google Scholar] [CrossRef]
- Snowball, A.M. Seasonal cycle of shoot development in selected Actinidia species. New Zeal. J. Crop Hortic. Sci. 1997a, 25, 221–231. [Google Scholar] [CrossRef]
- Brundell, DJ. 1975. Flower development in the Chinese gooseberry (Actinidia chinensis Planch). I. Development of the flowering shoot. New Zeal. J. Bot. 1975, 13, 473–483. [Google Scholar]
- Snowball, A.M. Axillary shoot bud development in selected Actinidia species. New Zeal. J. Crop Hortic. Sci. 1997b, 25, 233–242. [Google Scholar] [CrossRef]
- Foster, T.M.; Seleznyova, A.N.; Barnett, A.M. Independent control of organogenesis and shoot tip abortion are key factors to developmental plasticity in Kiwifruit (Actinidia). Ann. Bot. 2007, 100(3), 471–481. [Google Scholar] [CrossRef] [PubMed]
- Richardson, A.; Eyre, V.; Kashuba, P.; Ellingham, D.; Jenkins, H.; Nardozza, S. Early shoot development affects carbohydrate supply and fruit quality of red-fleshed Actinidia chinensis var. chinensis ‘Zes008’. Agron. 2020, 11(1), 66.
- Richardson, A., Boldingh, H., Kashuba, P., Knight, G., Ellingham, D., 2019. Flowering time determines the weight and composition of Actinidia chinensis var. chinensis ‘Zesy002’ kiwifruit. Sci. Hortic. 2019, 246, 741-748.
- Greer, D.H.; Jeffares, D. Temperature-dependence of carbon acquisition and demand in relation to shoot growth of kiwifruit (Actinidia deliciosa) vines grown in controlled environments. Aust. J. Plant Physiol. 1998, 25, 843–850. [Google Scholar] [CrossRef]
- Seleznyova, A.; Halligan, L. Modelling effect of temperature on area expansion at the leaf the shoot and the whole plant level. Acta Hortic. 2006, 707, 167–174. [Google Scholar] [CrossRef]
- Piller, G.J., Meekings, J.S. The acquisition and utilization of carbon in early spring by kiwifruit shoots. Ann. Bot. 1997, 79, 573–581. [CrossRef]
- Clearwater, M.J.; Seleznyova, A.N.; Thorp, T.G.; Blattmann, P.; Barnett, A.M.; et al. Vigor-controlling rootstocks affect early shoot growth and leaf area development of kiwifruit. Tree Physiol. 2006, 26, 505–515. [Google Scholar] [CrossRef] [PubMed]
- Seleznyova, A.N.; Thorp, T.G.; Barnett, A.M.; Costes, E. Quantitative analysis of shoot development and branching patterns in Actinidia. Ann. Bot. 2002, 89, 471–482. [Google Scholar] [CrossRef] [PubMed]
- Famiani, F.; Antognozzi, E.; Boco, M.; Tombesi, A.; Battistelli, A.; Moscatello, S.; Spaccino, L. Effects of altered source-sink relationships on fruit development and quality in actinidia deliciosa. Acta Hortic. 1997, 444, 355–360. [Google Scholar] [CrossRef]
- Snelgar, W.P.; Thorp, T.G. Leaf area, final fruit weight and productivity in kiwifruit. Sci. Hortic. 1988, 36, 241–249. [Google Scholar] [CrossRef]
- Lai, R.; Wooley, D.J.; Lawes, G.S. Effect of leaf to fruit ratio on fruit growth of kiwifruit (Actinidia deliciosa). Sci. Hortic. 1989, 39, 247255. [Google Scholar] [CrossRef]
- Minchin, P.E.H.; Snelgar, W.P.; Blattmann, P.; Hall, A.J. Competition between fruit and vegetative growth in Hayward kiwifruit. New Zeal. J. Crop Hortic. Sci. 2010, 38(2), 101–112. [Google Scholar] [CrossRef]
- Slinkard, K.; Singleton, V.L. Total phenol analysis: Automation and comparison with manual methods. Am. J. Enol. Viticult. 1997, 28, 49–55. [Google Scholar] [CrossRef]
- Pellegrini, N.; Re, R.; Yang, M.; Rice-Evans, C. Screening of dietary carotenoids and carotenoid-rich fruit extracts for anti-oxidant activities applying 2,2_-azino-bis-(3-ethylenebenzothiazoline-6-sulphonic acid) radical cation decolourisation assay. Method Enzymol. 1999, 299, 379–89. [Google Scholar]
- Re, R., Pellegrini, N., Proteggente, A., Pannala, A., Yang, M., RiceEvans, C., 1999. Antioxidant activity applying an improved ABTS radical cation decolourisation assay. Free Radic Bio Med. 1999, 26,1231-37.
- Scalzo, J.; Politi, A.; Pellegrini, N.; Mezzetti, B.; Battino, M. 2005. Plant genotype affects total antioxidant capacity and phenolic contents in fruit. Nutr. 2005, 21(2), 207–13. [Google Scholar] [CrossRef]
- Bogeat-Triboulot, M.B.; Martin, R.; Chatelet, D.; Cochard, H. Hydraulic conductance of root and shoot measured with the transient and dynamic modes of the high-pressure flowmeter. Ann. For. Sci. 2010, 59, 389–396. [Google Scholar] [CrossRef]
- Grossman, Y.L.; DeJong, T.M. PEACH: A simulation model of reproductive and vegetative growth in peach trees. Tree Physiol. 1994, 329345. [Google Scholar] [CrossRef] [PubMed]
- Lacointe, A.; Minchin, P.E.H. Modelling phloem and xylem transport within a complex architecture. Funct. Plant Biol. 2008, 35, 772780. [Google Scholar] [CrossRef] [PubMed]
- Piller, G.J.; Greaves, A.J.; Meekings, J.S. Sensitivity of floral shoot growth, fruit set and early fruit size in Actinidia deliciosa to local carbon supply. Ann. Bot. 1998, 81, 723–728. [Google Scholar] [CrossRef]
- Greer, D.H.; Cirillo, C.; Norling, C.L. Temperature-dependence of carbon acquisition and demand in relation to shoot and fruitgrowth of fruiting kiwifruit (Actinidia deliciosa) vines grown in controlled environments. Func. Plant Biol. 2003, 30, 927–937. [Google Scholar] [CrossRef] [PubMed]
- Piller, G.J.; Meekings, J.S. The acquisitionand utilization of carbon in early spring by kiwi fruit shoots. Ann. Bot. 1997, 79, 573–581. [Google Scholar] [CrossRef]
- Ho, L.C.; Grange, R.I.; Picken, A.J. An analysis of the accumulation of water and dry matter in tomato fruit. Plant, Cell Environ. 1987, 10, 157–162, ISSN 0304-4238. [Google Scholar] [CrossRef]
- Lang, A. Xylem, phloem and transpiration flows in developing apple fruits. J. Exp. Bot., 1990, 41, 645–651. [Google Scholar] [CrossRef]
- Greenspan, M.D.; Shackel, K.A.; Matthews, M.A. 1994. Developmental-changes in the diurnal water-budget of the grape berry exposed to water deficits. Plant, Cell Environ. 1994, 17, 811–820. [Google Scholar] [CrossRef]
Figure 1.
Bi-plot with centroid and variable vectors on F1 and F2 plane.

Figure 2.
3d representation of latent variables discriminated according to shoot type.
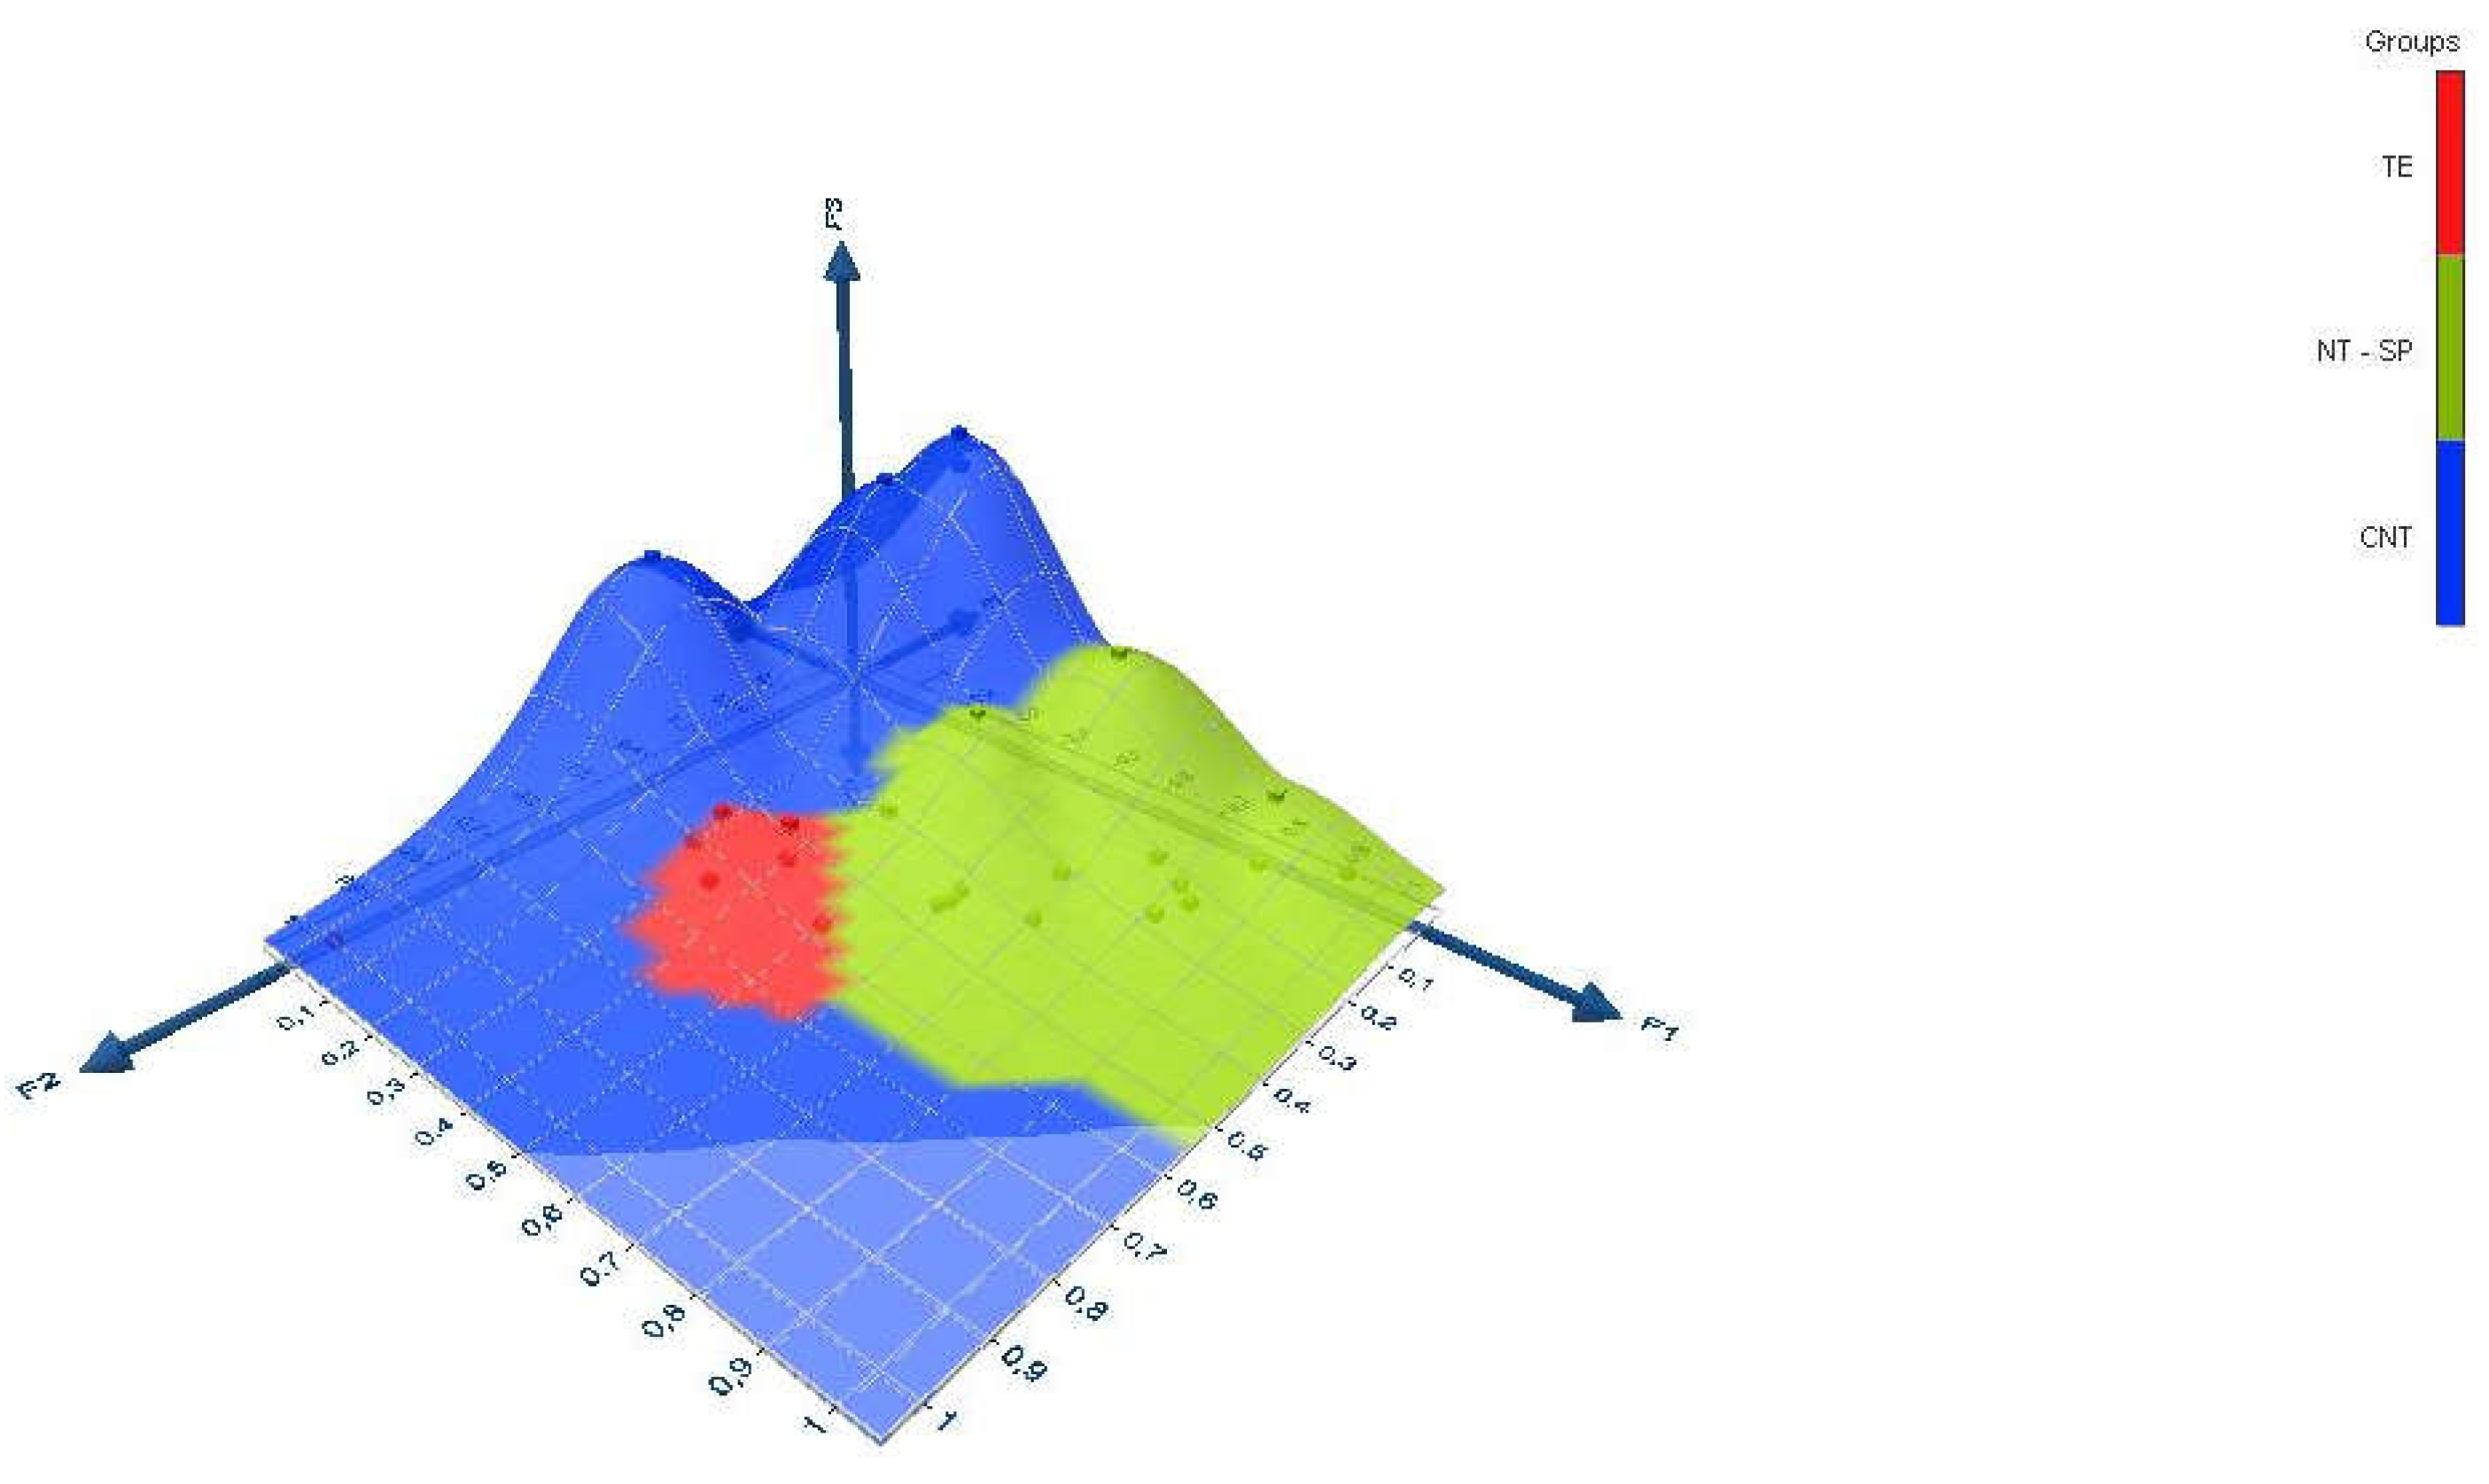

Table 1.
– Principal morphobiometric indices measured, during 2022-2023, on fruits of Actinidia chinensis Planch, cv. G3, discriminated according to shoot type.
Table 1.
– Principal morphobiometric indices measured, during 2022-2023, on fruits of Actinidia chinensis Planch, cv. G3, discriminated according to shoot type.
| Type of shoot |
FW (grams) |
Dmin/Dmax | H/D |
|---|---|---|---|
| TE | 166.655±3.35ab | 0.899±0.007ns | 1.418±0.008ns |
| NT | 164.833±3.26ab | 0.897±0.007 | 1.409±0.012 |
| SP | 154.856±3.88b | 0.901±0.013 | 1.382±0.009 |
| CNT | 172.603±2.99a | 0.903±0.008 | 1.413±0.009 |
| Year (A) | ns | ns | ns |
| Treatment (B) | * | ns | ns |
| Interaction (AxB) | ns | ns | ns |
Means in the same column followed by different letters are significantly different (P<0.05) using Tukey’s test. NS not significant.Analysis of Variance (two-way ANOVA); (A = Year; B: Treatment; AxB: interaction between year and treatment); *0.05>P<0.01; **0.01>P<0.001; ***0.001>P.
Table 2.
- Principal ripening indices measured during 2022-2023 on fruits of Actinidia chinensis Planch, cv. G3, discriminated according to shoot type.
Table 2.
- Principal ripening indices measured during 2022-2023 on fruits of Actinidia chinensis Planch, cv. G3, discriminated according to shoot type.
| Type of shoot |
FF (kg cm-2) |
TSS (°BRIX) |
TA (%) |
TSS/TA |
DMC (%) |
Dry weight fruit-1 (grams) |
|---|---|---|---|---|---|---|
| TE | 7.135±0.33b | 14.288±0.30a | 2.488±0.12c | 5.742±0.13a | 18.170±0.12ab | 30.281±0.15b |
| NT | 8.930±0.23a | 12.620±0.29b | 3.09±0.01b | 4.084±0.01b | 18.468±0.10a | 30.441±0.11b |
| SP | 8.514±0.20a | 10.435±0.34c | 3.88±0.93a | 2.689±0.21d | 18.631±0.20a | 28.851±0.17c |
| CNT | 8.467±0.26a | 11.196±0.32c | 3.30±0.02b | 3.392±0.43c | 17.825±0.10b | 30.766±0.18a |
| Year (A) | ns | ns | ns | ns | ns | ns |
| Treatment (B) | * | *** | * | * | * | * |
| Interaction (AxB) | ns | * | ns | * | ns | ns |
Means in the same column followed by different letters are significantly different (P<0.05) using Tukey’s test. NS not significant. Analysis of Variance (two-way ANOVA); (A = Year; B: Treatment; AxB: interaction between year and treatment); *0.05>P<0.01; **0.01>P<0.001; ***0.001>P.
Table 3.
- Principal colorimetric indices measured, during 2022-2023, on fruits of Actinidia chinensis Planch, cv. G3, discriminated according to shoot type.
Table 3.
- Principal colorimetric indices measured, during 2022-2023, on fruits of Actinidia chinensis Planch, cv. G3, discriminated according to shoot type.
| Type of shoot | L* (10°/D65) | a* (10°/D65) | b* (10°/D65) | Chroma (10°/D65) | °Hue |
|---|---|---|---|---|---|
| TE | 67.66±0.56c | 0.40±0.03ns | 14.20±0.20ab | 14.203±0.19ab | 89.775±0.27bc |
| NT | 69.23±0.58bc | 0.34±0.03 | 13.96±0.25ab | 13.969±0.25ab | 91.124±0.19a |
| SP | 72.83±0.92a | 0.33±0.05 | 13.56±0.41b | 13.567±0.41b | 88.959±0.32c |
| CNT | 70.77±0.61ab | 0.28±0.03 | 14.89±0.27a | 14.892±0.26a | 90.559±0.17ab |
| Year (A) | ns | ns | ns | ns | ns |
| Treatment (B) | * | ns | ** | * | * |
| Interaction (AxB) | ** | ns | ns | * | ns |
Means in the same column followed by different letters are significantly different (P<0.05) using Tukey’s test. NS not significant. Analysis of Variance (two-way ANOVA); (A = Year; B: Treatment; AxB: interaction between year and treatment); *0.05>P<0.01; **0.01>P<0.001; ***0.001>P.
Table 4.
- Nutraceutical parameters in kiwifruit, Gold 3cv., discriminated according to shoot type.
| Type of shoot |
CAT µmol trolox/gr FW |
TPC mg GA/gr FW |
|---|---|---|
| TE | 6.851±0.289b | 2.247±0.163a |
| NT | 4.923±0.790c | 1.739±0.109b |
| CNT | 9.336±0.485a | 2.114±0.050a |
| SP | 6.927±1.098b | 1.456±0.104b |
| Year (A) | ns | ns |
| Treatment (B) | ** | * |
| Interaction (AxB) | * | ns |
Means in the same column followed by different letters are significantly different (P<0.05) using Tukey’s test. NS not significant. Analysis of Variance (two-way ANOVA); (A = Year; B: Treatment; AxB: interaction between year and treatment); *0.05>P<0.01; **0.01>P<0.001; ***0.001>P.
Table 5.
– Principal vegetative indices discriminated according to different shoot type.
| Type of shoot |
Shoot length (cm) |
N° leaves |
Leaf area (cm2) |
N° fruits | N° leaves fruit-1 |
Leaf area fruit-1 (cm2) |
Phylloptosis |
Internode length (cm) |
|---|---|---|---|---|---|---|---|---|
| TE | 66.16±30.36c | 14.41±3.94c | 177.15±7.31b | 8.50±1.15a | 1.69±0.83c | 300.37±15.79c | 59.60±2.67ns | 4.59±0.73b |
| NT | 404.33±164.20a | 60.00±22.32a | 250.00±6.58a | 6.80±1.17b | 8.82±0.70a | 2205.88±31.50a | 63.33±7.64 | 6.73±0.99a |
| SP | 16.273±5.14d | 6.90±2.6d | 136.36±8.31c | 2.50±0.83d | 2.76±0.11c | 376.85±2.70c | 50.00±3.67 | 2.35±0.93c |
| CNT | 153.529±31.72b | 24.41±4.0b | 175.00±4.73b | 3.05±0.91c | 3.05±0.94b | 534.00±12.48b | 56.50±2.79 | 6.28±0.78a |
| Year (A) | ns | ns | ns | ns | ns | ns | ns | ns |
| Treatment (B) | ** | * | ** | * | *** | * | * | ** |
| Interaction (AxB) | * | ns | ns | * | ns | * | ** | ns |
Means in the same column followed by different letters are significantly different (P<0.05) using Tukey’s test. NS not significant. Analysis of Variance (two-way ANOVA); (A = Year; B: Treatment; AxB: interaction between year and treatment); *0.05>P<0.01; **0.01>P<0.001; ***0.001>P.
Table 6.
- Principal ecophysioligical indices discriminated according to shoot type.
| Type of shoot |
An mol CO2 m–2 s–1 |
E mol H2O m-2 s-1 |
gs mol H2O m–2 s–1 |
HC Kg sec-1 MPa-1 |
|---|---|---|---|---|
| TE | 19.542±1.33a | 3.575±0.33a | 0.376±0.05c | 15x10-6a |
| NT | 17.843±0.98b | 3.537±0.56a | 0.881±0.04a | 14x10-6a |
| SP | 17.235±0.32b | 1.908±0.38c | 0.247±0.01d | 18x10-6b |
| CNT | 16.114±0.70c | 2.209±0.15b | 0.653±0.07b | |
| Year (A) | ns | ns | ns | ns |
| Treatment (B) | ** | * | * | ** |
| Interaction (AxB) | * | ns | ns | ns |
Means in the same column followed by different letters are significantly different (P<0.05) using Tukey’s test. NS not significant. Analysis of Variance (two-way ANOVA); (A = Year; B: Treatment; AxB: interaction between year and treatment); *0.05>P<0.01; **0.01>P<0.001; ***0.001>P.
Disclaimer/Publisher’s Note: The statements, opinions and data contained in all publications are solely those of the individual author(s) and contributor(s) and not of MDPI and/or the editor(s). MDPI and/or the editor(s) disclaim responsibility for any injury to people or property resulting from any ideas, methods, instructions or products referred to in the content. |
© 2024 by the authors. Licensee MDPI, Basel, Switzerland. This article is an open access article distributed under the terms and conditions of the Creative Commons Attribution (CC BY) license (http://creativecommons.org/licenses/by/4.0/).
Copyright: This open access article is published under a Creative Commons CC BY 4.0 license, which permit the free download, distribution, and reuse, provided that the author and preprint are cited in any reuse.


