Submitted:
28 June 2024
Posted:
01 July 2024
You are already at the latest version
Abstract
This review provides an overview of eXplainable AI (XAI) methods for oncological ultrasound image analysis and compares their performance evaluations. A systematic search of Medline Embase and Scopus between March 25 and April 14 2024 identified 17 studies describing 14 XAI methods, including visualization, semantics, example-based, and hybrid functions. These methods primarily provided specific, local, and post-hoc explanations. Performance evaluations focused on AI model performance, with limited assessment of explainability impact. Standardized evaluations incorporating clinical end-users are generally lacking. Enhanced XAI transparency may facilitate AI integration into clinical workflows. Future research should develop real-time methodologies and standardized quantitative evaluative metrics.
Keywords:
Cancer
; Explainable AI
; Image Analysis
; Real-Time Imaging
; Ultrasound
1. Introduction
Artificial intelligence (AI) technologies are omnipresent, with the healthcare industry experiencing exponential integration in recent years. Projections indicate further expansion of the global AI healthcare market, with an expected compound annual growth rate (CAGR) exceeding 36% from 2024 to 2030 [1,2]. The rapid growth is driven by several key factors, including the accumulation of patient health-related digital information, the increased demand for (personalized) medicine, and the intensified need to reduce care expenses and tackle healthcare workforce shortages [1,3,4].
As digital health data becomes increasingly available, so does the pursuit to derive deeper insights from them. In response to the mounting pressure on healthcare systems, AI technologies are applied to offer diverse solutions [5,6]. Widely adopted and integrated AI algorithms can facilitate accurate and early-stage disease prediction, analyze complex medical images, and assist in the medical decision-making process [1,7]. These advancements have promise to improve diagnosis, treatment, prognosis, and overall quality of life for patients across various conditions [8].
In the medical imaging field, ongoing research is exploring novel algorithms, architectures, and methodologies [2,9]. These innovations show potential to aid clinicians in extracting decisive insights from medical images, identifying abnormalities, facilitating precision-guided interventions, and improving patient outcomes [7,10]. Machine learning (ML) and Deep learning (DL) are specific subsets of AI. Specifically, DL algorithms employ neural networks and have demonstrated significant success in tasks such as image pre-processing, registration, segmentation, and classification, even surpassing human performance levels [11,12]. The research focus on implementing innovative and powerful system architectures to address various healthcare tasks has led to increasingly complex AI solutions [11,13]. However, the complex layered architecture of such neural networks presents challenges in directly interpreting results, due to their inherent "black box" properties. This limits the provision of intuitive explanations for the processes and outcomes of AI systems [11]. The need for transparent decision-making processes becomes apparent in healthcare settings, where AI-based support systems directly influence patient care. Additionally, to gain the trust of clinicians, the inner workings of medical AI systems should be understandable [11,14]. Furthermore, legal and ethical frameworks, such as the European Union’s General Data Protection Regulation (GDPR) and the European AI Act (AIA), mandate meaningful explanations of algorithmic decisions to ensure compliance and protect patient rights [15]. Similarly, identifying errors and potential biases is essential in developing and applying trustworthy AI systems in healthcare [16].
In response to the growing demand for explainability, the field of eXplainable AI (XAI) has emerged [17,18]. XAI encompasses "techniques that enable stakeholders to understand an AI algorithm and its decisions better" [11,17]. The global XAI market has been valued at $5 billion (2022) and is expected to reach over $24 billion by 2030, with a CAGR of 21.5% [19]. XAI for medicine is the second largest field in the trend, showing exponential growth [20]. Such explanations of intricate DL processes and outcomes for clinical applications impact functional benefits, clinical confidence, and patient outcomes [21]. Particularly, in the fight against cancer, where timely and accurate decisions are critical and DL model results can directly influence treatment decisions, the integration of XAI is fundamental [22]. Researchers have proposed different strategies for qualitative and quantitative XAI, using comprehensible text, mathematics, or visualizations, however, a widely accepted benchmark for XAI is missing.
This need for XAI is underscored by the rapidly increasing global cancer burden. Over 35 million new cancer cases are predicted in 2050, depicting a 77% increase since 2022. The rapidly growing global cancer burden reflects both population aging and growth, as well as increased exposure to risk factors such as tobacco, obesity, and pollution [23]. In the past several years, researchers have developed AI tools based on deep knowledge that have been highly effective and have demonstrated great accuracy in oncological image analyses [24,25] and predicting various types of cancer, including breast, brain, lung, liver, and prostate cancer [8].
One particular area where XAI can provide significant advantages is in ultrasound (US) imaging. This widely used real-time, non-invasive, and relatively low-cost modality plays a crucial role in diagnosing and monitoring various cancers [26,27]. During oncological surgeries, it can be used, for example, for tumor localization and/or margin assessment [28,29,30]. Despite its benefits, US imaging faces challenges such as variability in operator performance and image quality, as well as the need for extensive training to accurately interpret images due to artifacts, noise, and the lack of distinct global anatomical structures [31]. These challenges present opportunities for XAI methods to enhance US image interpretation by providing transparent, understandable insights that aid clinicians in making fast and accurate decisions during clinical procedures. By offering real-time, interpretable feedback in terms of additional information or by highlighting areas of concern on images, XAI may enhance diagnostic accuracy, clinician confidence, and patient trust in AI-driven assessments.
While recent studies have started integrating XAI into AI-driven healthcare applications, a noticeable gap in research exists. Despite several reviews exploring XAI methods in general medical imaging applications [11,14,32], they lack a specific focus on oncological ultrasound imaging contexts. Moreover, these reviews fail to provide an extensive comparison of the advantages and disadvantages of various XAI methods for clinical use, as well as a comprehensive overview of the evaluation metrics employed. To the best of our knowledge, no review investigates the utilization and comparative effectiveness of XAI methods in oncological ultrasound imaging. This review aims to address this gap by investigating XAI methods for real-time ultrasound imaging data. The review will specifically analyze the role of XAI methods in segmentation, classification, and localization tasks. Our primary objective is to offer an overview of identified XAI methods and assess their qualitative and/or quantitative impact.
2. Materials and Methods
2.1. Search Strategy and Data Collection
Between March 25 2024 and April 14 2024, comprehensive searches were conducted in the Medline Embase [33] and Scopus [34] databases to identify relevant articles. The search strategy compromised terms related to explainable artificial intelligence, ultrasound imaging, and image analysis tasks including segmentation, classification, and margin assessment (see Appendix A). No filters regarding publication dates were applied. Boolean operators were used to combine the major topic terms and their synonyms. The search was constrained to articles published in English and duplicate articles were removed. Articles were included based on their focus on applying or developing XAI methods for ultrasound image analysis tasks.
2.2. Study Eligibility Criteria
Articles were systematically selected following the PRISMA 2020 statement [35]. The titles and abstracts of identified articles were screened by a single assessor (L.S.W.). Articles were excluded if they met one or more of the predefined exclusion criteria: (i) non-human studies, (ii) imaging modalities not aligned with ultrasound imaging, (iii) studies unrelated to cancer or oncological procedures, (iv) absence of XAI method discussion or analysis, (v) lack of focus on segmentation, classification, or margin assessment tasks, (vi) reviews, editorials, conference abstracts, letters to the editor, or studies with insufficient methodological detail, (vii) studies without medical topic, focus or application. Articles with inaccessible full texts were excluded as well. The remaining full-text articles were further assessed for eligibility and solely included if none of the exclusion criteria were met. The selection process is illustrated in Figure 4.
2.3. Data Extraction
Data extraction was performed independently for all included studies. General study characteristics were collected such as researched cancer type, clinical application, study design, and dataset specifics. The AI models developed in the studies were analyzed to provide contextual knowledge of the intrinsic data structures the XAI methods aimed to explain. The types of XAI methods applied in the included articles were identified to provide an overview of the explanatory techniques employed in the AI-driven analysis of ultrasound imaging data within an oncological context. Characteristics of each identified XAI method were cataloged, including their operational mechanisms, explanatory function, input requirements, outputs, and evaluation metrics.
The operational mechanisms of methods were categorized using taxonomic criteria proposed in previous research [11,17,22,32], these comprise:
- Model-Specific vs. Model-Agnostic: Model-specific explanation methods are limited to application on particular AI model architectures, e.g. a specific convolutional network model (CNN), see Figure 1. These methods leverage the underlying network’s internal characteristics and use reverse engineering to generate their explanations. Model-agnostic explanation methods only operate on the model input and output, thus, independent of the model architecture. They aim to clarify the model’s underlying function, for example, by approximating with another, simpler model that should be explainable. Other agnostic methods attribute weights to each model variable, depending on its influence on the , to decompose the importance between variables [36].
- Global vs. Local scope: Global scope explanations provide general relationships learned by the model, by assessing common patterns in the overall dataset that drive the model’s predictions, see Figure 2. Local scope methods offer explanations of the model’s specific prediction for a given input or single case.
- Intrinsic vs. Post-hoc explanation: Intrinsic explanation models can construct general, internal relationships between input and output made during predictions, due to their simple structure (e.g. decision trees, linear regression model, or support vector machine), see Figure 3. Post-hoc explanations are applied to analyze models after these have completed training, providing insight into the learned relationships. The important difference is that post-hoc explanations train a neural network and attempt to explain the behavior of the black box network after that. In contrast, intrinsic explanations force the neural network to be explainable itself [32].
2.4. Main Outcomes
The primary outcome was to provide an overview of XAI methods utilizing real-time ultrasound data for cancer-focused classification, segmentation, or localization tasks. The function-specific performance of XAI methods, which include explaining by examples, semantics, or, visualization, was assessed. This categorization of explanatory functions is based on proposed deep learning frameworks for medical image analysis [14,32]. Further elaboration focused on the advantages and disadvantages of each function’s identified XAI methods, emphasizing their clinical relevance and contribution. Additionally, the extent and impact of quantitative versus qualitative evaluations of XAI were explored across the included studies. Special emphasis was given to studies that integrated quantitative evaluations of XAI capabilities and assessments by clinical end-users, highlighting the practical impact of these technologies in clinical settings.
3. Results
3.1. Data Collection
On May 29 2024, the search strategy identified a total of 222 articles from the Medline Embase (n=57) and Scopus (n=165) databases. After the removal of 65 duplicates, 157 articles remained for the initial title and abstract screening. The screening phase resulted in the exclusion of 129 articles due to non-human study models (n=30), lack of real-time ultrasound imaging data (n=51), irrelevance to cancer (n=95), absence of XAI applications (n=25), focus on impertinent tasks (n=18), inappropriate study types (n=19), and no medical application (n=51). Excluded articles complied with one (n=29) or multiple exclusion (n=100) criteria.
Subsequently, the remaining 28 articles underwent full-text analysis. Two articles were excluded during the retrieval, due to their unavailability of full text. The full-text analysis of the remaining 26 articles resulted in an additional exclusion of 9 articles based on the pre-defined criteria. These exclusions encompassed articles that (i) investigated non-human subjects i.e. objects (n=2) and animals (n=1); (ii) utilized inappropriate imaging data types such as static photographs (n=2), mono-modal CT scans (n=1), schematic images (n=1), or the use of ultrasound for navigational purposes instead of image analysis (n=1); (iii) lacked sufficient relevance to cancer or oncology (n=4); (iv) only mentioned XAI as a future recommendation (n=2) or in mathematical expressions (n=2); (v) focused on peripheral tasks such as captioning (n=1), eye-gaze mapping (n=1), or lacked a specific task (n=1); and (vi) were directed towards non-medical image description applications (n=3). Excluded articles complied with one (n=4) or multiple (n=4) exclusion criteria. Ultimately, 17 articles were eligible and selected for further in-depth analysis [37,38,39,40,41,42,43,44,45,46,47,48,49,50,51,52,53]. Figure 4 provides a visual overview of the article selection process.
3.2. General Study Characteristics
The general study characteristics of all included articles (n=17) were extracted and compared, see Table 1. The studies comprise a variety of cancer types, with the majority focused on breast (n=8) or thyroid (n=5) cancers. Further, most studies focus on diagnostic applications (n=11), and only a few address surgical applications (n=2). Regarding study type, most studies are retrospective (n=14), indicating a common reliance on historical data for analysis.
Several studies employ extensive datasets, highlighting the significant data-handling capabilities of current medical image analysis technologies. In the study by Hassan et al. (2022) over 600,000 prostate multi-modal MRI and US images were used [42]. In the studies by Song et al.(2023) and Qian et al. (2021) more than 19,000 and 10,000 breast US images were analyzed respectively [47,49]. The number of included lesions were highest in Song (2023) et al. [49], Han (2022) et al. [41], and Karimzadeh (2023) et al. [43], all counting 2,917 or more unique lesions.
The distribution of tissue types varies in the studies and illustrates the different focuses of studies, encompassing two (n=13), or three (n=4) different tissue types. Studies with tripartite tissues distinguished between healthy, benign, and malignant in three studies [38,45,48], with a single study differentiating between three malignant variants [53]. The thirteen studies with binary tissue labels discriminated between benign and malignant tissue. In the twelve studies describing datasets’ class balance, eight studies were unbalanced, with malignant data as the minority in six studies [38,44,45,49,50,52] and the majority in two studies [48,53]. Four studies showed relative class balance [37,39,40,41].
3.3. Imaging Modality
Most of the included studies used solely ultrasound as imaging modality (n=16), while one study combined US with MRI [42]. A detailed overview of the ultrasound systems covered in the included studies can be found in Appendix B.
Fourteen studies employed continuous US acquisition, underscoring a dynamic, real-time imaging trend. Rezazadeh (2022) et al. and Zheng (2024) et al. highlight the importance of live feedback during oncological procedures [48,53]. Two studies acquired 3D volume scans [44,45]. All studies mention a trend towards real-time imaging combined with AI to enhance clinical accuracy and patient outcomes.
3.4. AI Models
Properties of the AI models studied can be found in Table 2 and Table 3. The developed models primarily focused on classification, followed by segmentation and localization, see Figure 5. Six studies applied ML models for either classification (n=5) or segmentation (n=1) tasks. Fourteen studies applied DL models for classification (n=12), segmentation (n=1), or localization (n=1) tasks.
Prominent DL architectures for classification were VGG-16, DenseNets, and ResNets. The predicted classes were compared to labels originating from (histo)pathology reports (n=8), clinical diagnosis (n=8), or expert annotations (n=2). Four studies encompassed multi-class tasks where models predicted multiple malignancy risk-level descriptors [41,43,46,47]. The average reported classification accuracy was 0.89 (0.78-0.95) across binary models and 0.85 (0.78-0.96) across multi-class models (Table 2). The highest performing models combined either DenseNets [41] or ResNet-18 [47] with an attention module for final class prediction. Segmentation tasks were performed using a U-Net architecture in one out of two studies [43], with a reported Dice Similarity Coefficient (DSC) of 0.83 (Table 3). The localization task was performed on a global level. Results from segmentation and localization tasks were compared to ground truth manual annotation masks.
3.5. XAI Methods
In total, fourteen distinctive XAI methods were identified across the included studies. The main characteristics of each XAI method were cataloged and can be found in Table 4. The operational mechanisms of the identified XAI methods showed the following distribution:
- Model: Specific (71.4%) vs. Agnostic (28.6%)
- Scope: Local (85.7%) vs. Global scope (14.3%)
- Explanation: Intrinsic (42.9%) vs. Post-hoc (57.1%)
Within the nine DL model-specific XAI methods, eight methods were specific to CNNs and one to Transformers. Two CNN-specific methods, BI-RADS-Net and MT-BI-RADS, implemented multi-task learning (MTL) to improve AI-model classification and segmentation performance respectively [43,52]. The XNML segmentation model, described by Martizzi et al. (2021), was the only XAI method that showed ML model-specific attributes and was tailored to their in-study developed PRISMTM platform [45]. The remaining four XAI methods were model-agnostic, solely operating on input and output, independent of the AI model architecture. The most occurring explanations comprised a local scope and post-hoc application, see Figure 6. The local scope indicated a focus on the explanation of specific patient cases. The post-hoc applications of XAI indicated models used for explaining model outputs, for better comprehension of the decision-making process of AI models.
3.6. XAI Functions
The main XAI function implemented in the identified methods was visualization (n=9), followed by semantics (n=5) and example-based (n=3), see Figure 7 and Figure 8. All three XAI methods with an example-based function were combined with additional semantics (n=2) or visualization (n=1) functions.
3.6.1. Visualization
In classification tasks, visualization provided insight into model behavior realized through backpropagation, perturbation, optimization, or feature attribution approaches.
Backpropagation-based approaches include saliency maps to visually represent the importance of different areas of the input image in the prediction process by highlighting pixels with the highest impact on the predicted class output. These approaches provide model-specific, local scope, post-hoc explanations. Byra et al. (2022) and Tasnim et al. (2024) used class activation mapping (CAM), which replaces the fully connected layers at the end of CNNs with global average pooling layers to spatially aggregate the feature maps from the last convolutional layer [39,50]. The layer outputs are used to create a heat map, by weighting the class-specific spatial grid with the output weights connected to the class predictions. This heat map can hereafter be overlaid on the original image to show the discriminative regions used by the network to identify that class.
A generalized, gradient-weighted form of CAM, Grad-CAM, is used for classification tasks in six studies [37,41,47,49,53]. Grad-CAM is model-specific to CNNs and can be used without global average pooling, allowing the application to a wider variety of CNN architectures. Grad-CAM first computes the gradients of the target output concerning the feature maps of the last convolutional layer, which are global-average-pooled to obtain the importance weights for each feature map. These weights are multiplied with the forward activation maps to create the localization map and passed through a ReLU function to preserve the features that positively influence the class of interest. The result is an overlay of the produced heat map highlighting the most discriminative areas on the input image, see an example in Figure 9.
Perturbation-based approaches perturb the input image to assess the importance of image areas for the proposed task (e.g. classification). Local Interpretable Model-agnostic Explanations (LIME) are used in Hassan et al. (2022) [42]. LIME provides a local explanation by replacing a complex model locally with simpler models, for example by approximating a CNN by a linear model, see Figure 10. The input data is perturbed and the simplified model is used to learn the change in output. The similarity of the perturbed input to the original input is used as a weight, to ensure that explanations provided by the simple models with highly perturbed inputs have less effect on the final explanation. The simple model is trained on the dataset of perturbed samples using the prediction labels and the assigned weights. The simple model’s coefficients serve as the explanation for the instance. In the case of classification tasks, the coefficients reveal the contribution of each feature to the prediction of a specific class. Unlike CAM and Grad-CAM, LIME is model-agnostic and can be applied to any type of (ensemble) model.
Optimization-based approaches involve optimizing the input to see what features the network learns to recognize as belonging to a certain class, rather than observing changes in output due to perturbations or backpropagation of error. Tasnim et al. (2024) propose Activation Maximization, a technique where the model’s parameters are adjusted to maximize the output activation of a specific class or feature [50]. The input image is iteratively adjusted until the pattern that most excite a particular neuron or layer is found. Activation Maximizations allow the exploration of what each part of a neural network is looking for in its input.
Feature attribution approaches identify and quantify the contribution of individual features or regions in the input data to the output prediction. The Region-of-Evidence (ROE) method described by Dong et al. (2021) focuses on highlighting discriminative regions (ROEs) in ultrasound images that the CNN relies on for making class decisions, aligning with feature attribution through visualization [40]. The Explainer framework designed by Song et al. (2023) generates heat maps, or "E maps", from the convolution of feature maps to highlight the region a CNN model uses for determining the output class [49]. These E maps, which have the same dimensions as the input feature maps, assign values between 0 and 1 to represent the importance of each pixel. Subsequently, these E maps are multiplied by the feature maps, with their resultant map used for the classification. This method produces salient mappings directly aligned with the model’s reasoning process, providing intrinsic explanations as it leverages the model’s internal architectures and computations to attribute features directly contributing to the output. Pixels deemed unimportant are assigned a value of 0, effectively excluding the features they represent from the classification. This approach contrasts with Grad-CAM, which identifies significant features considered by the model, whereas the Explainer focuses on the features the model actually uses to make predictions [49]. Although there may be overlap, these two sets of features are not identical. Additionally, the Explainer framework reshapes feature maps from different layers into the same size, allowing it to combine inputs from multiple layers, rather than being limited to the last convolution layer.
In segmentation tasks, integrated visualization approaches approaches empowered visual evaluations of the model’s ability to separate different regions (tumor vs. healthy tissue) within the images. Integrated visualization techniques enhance explainability without perturbing the input or analyzing backpropagation gradients directly, as they inherently integrate visualization into the model’s architecture. The XNML method integrated data-centric learning and causal explanations directly into the learning process. It focused on generating explainable ML predictions in medical anomaly detection by generating color-coded masks ranking lesion candidates [45]. In Karimzadeh et al. (2023) the developed MTL approach combined classification, segmentation, and quantitative explainability using semantic Shapley Values [43]. Their MT-BI-RADS model outputs the predicted category of each BI-RADS risk assessment descriptor and provides visual explanations by highlighting tumor regions with image segmentation.
In localization tasks, object detection frameworks localized and highlighted critical areas (lesions) in an image using backpropagation-based heat maps that allowed for visual interpretation by experts. The activation heat map in Basu et al. (2023) was generated from global image features [38]. This method involved backpropagation of gradients from the output back to the input image, resulting in a map localizing salient regions in the images. The activation heat map was subjected to Otsu binarization to determine the highest activated region, and a bounding box was selected that covered this local region of interest (ROI), see Figure 11.
3.6.2. Semantics
XAI methods involving semantics aimed to produce meaningful descriptions or labels that correlate closely with the features and decision-making criteria used by clinical experts. This approach enhances the explainability of AI systems by providing explanations that are not only technically accurate but also understandable and clinically relevant. The identified semantics methods presented feature-based or transparency-based approaches and were all applied in classification tasks.
Feature-based approaches emphasize individual or groups of features that substantially influence model predictions. These semantic explanations provide insights into the intrinsic decision-making processes of models by correlating computational assessments with clinically relevant features. The Bag-of-Features (BoF) method transforms complex image data into discrete features known as "visual words," simplifying the interpretation of transformer models’ decisions. The method segments images into local patches and identifies recurrent patterns, creating a vocabulary of visual words that represent clusters of similar patches. These visual words are then used to generate histograms that serve as input to classifiers, allowing models to make predictions based on the distribution of these words. This approach not only simplifies image data but also aligns closely with clinical interpretations, focusing on patterns and textures indicative of pathological conditions [38]. Developed by Zhang et al. (2021), BI-RADS-Net employs BI-RADS descriptors such as shape, margins and densities, as features to elucidate their impact on tumor malignancy classifications. This method leverages standardized clinical lexicons, enhancing the transparency and applicability of AI in clinical settings [52].
The SHAP (SHapley Additive exPlanations) method quantifies the contribution of each input feature to model predictions using Shapley values, a concept from cooperative game theory, to ensure fair and consistent explanations across all possible combinations of feature inputs. SHAP has been applied in various studies to provide quantitative, post-hoc explanations. In Karimzadeh et al., SHAP shows the contribution of each BI-RADS descriptor in MTL breast cancer classifications, offering insights into the significance of ultrasound image features like shape and margin [43]. Lombardi et al. (2023) utilize SHAP to identify key features in dermatoscopic images most indicative of malignancy or benignity, highlighting the diagnostic importance of specific visual patterns [44]. Rezazadeh et al. (2022) apply SHAP to an ensemble model for breast cancer diagnosis, detailing how statistical texture features impact malignant or benign class predictions [48], see Figure 12. These associations supported more informed clinical decisions.
Transparency-based approaches are designed to be inherently explainable or to enhance existing models with additional mechanisms that explain their internal decision processes. These approaches ensure that the features learned by the model are clinically meaningful and do not just represent simulated correlations or artifacts of the training data. The image similarity technique (AIBx) in Thomas et al. (2020) integrated clinically significant patterns and semantic descriptors into AI models. The AI predictions were aligned with medical standards by embedding diagnostic categories, molecular markers, treatment responses, and recurrence status directly into the decision-making process [51]. The LTQ-E method enhances the local texture quantization (LTQ) model by using intermediate decision labels for added transparency. In Morris et al. (2023), LTQ-E extracted and aggregated embeddings from the penultimate layer of each separate decision-label model into a unified feature set. Hereafter, these collected features are used by linear or neural network model classifiers to predict thyroid-related TI-RADS-level labels [46]. Incorporating clinical knowledge into the computational explanation process aligns such methods with clinical reasoning steps to increase the models’ trustworthiness and transparency.
3.6.3. Example-Based
In XAI with example-based functions, methodologies provide insights and understanding about model decisions by highlighting similarities to previously encountered cases, specific features, or patterns that the model has learned are indicative of a particular class or output. Example-based methods allow clinicians to compare the AI’s findings in classification and segmentation tasks with decisive features or established cases, enhancing confidence in and acceptance of model predictions.
Feature attribution approaches included BI-RADS-Net for classification. BI-RADS-Net employed specific descriptors that align with terms derived from medical standards to explain class decisions [52]. Each descriptor acts as a feature example, illustrating how the model classifies breast ultrasound images based on standardized criteria.
Analogical reasoning approaches employed a case-based approach in AIBx and a counterfactual approach in XNML. In Thomas et al. (2020), AIBx actively involved operating clinicians in the decision process by, upon the input of an initial image for analysis, generating a collection of visually and clinically similar images based on previously confirmed cases, alongside an initial classification. Clinicians review these images to confirm or adjust the classification, where the image similarity mirrors clinicians’ memory and expertise to deepen the trust in the AI system [51]. The XNML model leveraged causal and counterfactual explanations to enhance ML models’ explainability. It linked statistical data with clinical outcomes, to provide rationales for each segmentation and to aid anomaly detection [45].
3.7. XAI Advantages and Disadvantages
Comparison of XAI methods reveals relative advantages and disadvantages across visualization, semantics, and example-based functions, highlighting the varied clinical relevance and potential impact of each method.
Visualization methods such as CAM and Grad-CAM provide direct and intuitive visual insights into influential areas within an image, particularly useful for tumor detection or classification tasks. These methods preserve high-resolution spatial information and are class-discriminative, making them suitable for differentiating between various conditions across a wide range of CNN architectures, without the need for architectural modifications. However, their requirement of a CNN architecture (with global average pooling) limits their broader application. This limited choice of algorithms could potentially exclude (neural) networks that could better fit the data. Additionally, saliency-based methods like Grad-CAM and LIME often rely on external validation to verify their accuracy. LIME uses simple models for local approximations, making its explanations easily understandable. The perturbation of the input shows the resultant change in the model output and can be used to explain which regions are driving the predictions directly. Despite being model-agnostic and providing specific, locally focused explanations, LIME may not generalize across different datasets. The method’s reliability heavily depends on how perturbations are implemented, and managing feature contributions in high-dimensional data can be challenging, necessitating careful interpretation to prevent misleading outcomes [42].
Semantic methods in XAI aim to bridge the gap between complex algorithmic image analysis and practical clinical interpretation by incorporating clinically relevant lexicons for higher confidence in class decisions. The Bag-of-Features (BoF) method concentrates on well-defined, localized features for detailed US image analysis. In Basu et al. (2023), BoF was used to identify features unknown to radiologists lexicons, but present in 78% of tumor-labeled cases. This feature could be added to the lexicon after its characterization is determined [38]. Other semantic methods, such as BI-RADS-Net, utilize BI-RADS descriptors to align class predictions more with clinical practice, effectively integrating the explanations into clinical workflows [52]. MT-BI-RADS expands upon this by providing both visual and semantic explanations of the significance of each BI-RADS descriptor in the decision-making processes. The Shapley values offer quantifiable insight into individual feature importance, explaining complex patterns in histopathological images and aiding clinical decision-making [43]. Despite these advantages, the semantic methods identified were mainly developed for classification tasks, which could hinder their applications for segmentation or localization. Additionally, while methods like LTQ-E are effective in pattern extraction for TI-RADS labels at the image level, their complexity may potentially limit routine clinical use [46].
Example-based methods provide substantial educational and practical advantages in AI model validation and debugging by aligning model reasoning with clinical expert judgment. These methods are particularly beneficial in reducing human subjectivity, as demonstrated by the AIBx image similarity in Thomas et al. (2020), which reduced the number of unnecessary biopsies in clinical studies compared to decisions made without similarity support [51]. The task-specific design and use of familiar diagnostic categories for example-based XAI enhance user trust and integration into clinical systems. In addition, example-based methods can potentially serve an educational purpose, providing real-life case studies for less experienced radiologists or students. Nevertheless, the effectiveness of these methods is constrained by the availability and representativeness of example cases. The lack of clinical evaluation and the dependency on high-quality, well-curated databases can obstruct broader adoption.
XAI methods that combine functions can leverage individual strengths of trustworthiness, interpretability, and operational efficiency while addressing limitations such as opacity, limited applicability, and clinical integration challenges. For example, in Karimzadeh et al. (2023), the MT-BI-RADS framework integrated tumor mask visualizations with quantitative SHAP values for breast cancer diagnosis, improving transparency and diagnostic confidence by aligning AI outputs with familiar BI-RADS categories [43]. This method addressed the limitations of opacity in traditional computer-aided diagnosis (CAD) systems by providing both intrinsic and post-hoc insights. Additionally, the image similarity algorithm AIBx in Thomas et al. (2020) provided a valuable decision-support tool for breast cancer that enhanced diagnostic accuracy by correlating semantic image features with clinically relevant analogous examples [51]. Overall, the combined XAI approaches have the potential to improve accuracy, increase efficiency, and facilitate smoother integration of AI models into existing clinical workflows.
3.8. XAI Evaluation
The evaluation process of XAI methods was based on qualitative (QL) and/or quantitative (QT) metrics, as seen in Table 4, with four studies including both QL and QT evaluation metrics [43,44,49,50].
3.8.1. Qualitative
All but one XAI method using QL evaluation performed visual inspections of the XAI output, i.e. saliency maps and segmentation masks, to determine XAI method performance. Visual inspections generally consisted of examining AI-generated saliency maps overlaid on original images to ensure that the highlighted regions in the saliency maps corresponded to medically significant areas, qualitatively validating the model’s focus areas and their alignment with medical knowledge. In the study of Tasnim et al. (2024), the objective was to confirm that the CAMs correctly focused on lesion regions rather than the surrounding tissues to determine reliable diagnosis [50]. Some studies compared visual inspections to previous methods or manual segmentations. For example, Al-Jebrni et al. (2023) showed that their model’s Grad-CAMs consistently and accurately identified thyroid nodules, outperforming previous studies’ Grad-CAMs, which had scattered focus areas [37]. Hassan et al. (2022) compared LIME-generated explanations with radiologist-annotated regions containing malignancy indicators, confirming the model’s predictions [42]. The degree of improvement attributed to applying XAI was not explicitly expressed with a (qualitative) performance metric.
In most studies, clinician involvement within the visual inspections was not mentioned, with the evaluation primarily focused on the technical processes of generating and inspecting the XAI methods’ computational means. However, manual segmentations [39] or ROI annotations [38,42] by experienced radiologists during the dataset preparation phase indicated some clinical input in multiple studies. Formalized evaluations of XAI contributions with standardized questions or metrics were often lacking. Zheng et al. (2024) analyzed how the model’s attention shifted during different diagnostic stages, comparing this to the step-by-step approach of human experts [53]. Experts provided qualitative feedback on the Grad-CAM heat maps’ clarity and relevance, assessing whether these visual explanations improved their understanding of the model’s decisions and clinical decision-making. Interpretability scores were given, although specific details on the scoring were not mentioned.
3.8.2. Quantitative
The QT metrics focused mainly on semantics and generally comprised standardized performance metrics in the field of AI-based image analysis. Classification performance was quantified by confusion matrix scores e.g. accuracy, precision, sensitivity, specificity, F1-score, or Area Under the Receiver Operating Characteristic (AUROC). Accuracy was the most common and provided a general indication of the proportion of correct predictions (true positives and true negatives) out of all class predictions made. Segmentation performance was quantified using DSC, determining the overlap between the predicted and ground truth mask segments. Scores ranged from 0 (no overlap) to 1 (perfect overlap), indicating the model’s success in delineating the tumor boundaries within the images. Localization performance was quantified with the common Intersection over Union (IoU) metric. The metric evaluated how precise the tumors were localized within the image, considering both the accuracy of the boundary box and the class prediction. These standard metrics provide quantitative insights by statistically evaluating the AI model’s performance in intended tasks. They are essential for tuning the model, understanding its strengths and weaknesses, and comparing its performance with other AI models. However, these metrics primarily measure the performance of AI models itself and do not quantify the impact of XAI on improving model explainability in these evaluations.
A few studies involved clinicians during the XAI evaluation phase [40,44,47,49,53]. Song et al. (2023) conducted reader studies with nine physicians who used heat maps generated by their XAI Explainer method to assist in diagnosing 200 test set US images (100 malignant) [49]. The physicians initially diagnosed without XAI assistance to establish a baseline, hereafter they used the heat maps to aid their decisions. Performance improvements were measured using accuracy, precision, recall, F1-score, and AUROC curves, showing higher performance with the Explainer visualizations, especially among junior physicians. In Qian et al. (2021), a two-part reader study with seven radiologists (14 years of experience on average) compared the performance of BI-RADS-Net with and without Grad-CAM heat maps. Reviewing 152 breast lesions (44 malignant) from 141 patients in the test set, the radiologists initially diagnosed without XAI assistance and then reassessed using the heat maps. Their study found that visualizations with heat maps improved sensitivity, specificity, and overall diagnostic accuracy, highlighting the technique’s added value in clinical practice [47].
Uncommon QT evaluation metrics for XAI methods were found in several studies:
- Shapley values are derived from game theory and provide a method to distribute the impact among contributors (features) in a cooperative game (prediction model). Each feature value’s contribution is determined by assessing the change in prediction when a feature is added or removed for all possible combinations of features. The aim is to fairly attribute the model’s output to its input features, providing insights into which features are most important for predictions. In three studies, SHAP values are used to determine which clinical features (e.g. tumor size, shape, or texture) most significantly impact the models’ classification of a tumor as benign or malignant [43,44,48].
- The Zero-mean Normalized Cross-Correlation (ZNCC) score presents a statistical measure to assess the similarity between two images. It calculates the degree of similarity between two images through a normalized cross-correlation measurement formula, subtracting their mean and dividing by their standard deviation. The ZNCC score ranges from -1 to 1, where 1 indicates perfect correlation, 0 indicates no correlation, and -1 indicates perfect inverse correlation. In Tasnim et al. (2024) the ZNCC score quantitatively assessed the feature separation ability of the Activation Maximization generated images in a benign-malignant (i.e. binary) classification problem [50].
- The Pointing game metric is a QT evaluation method used to assess how well the areas identified by saliency maps align with relevant regions in medical images. It evaluates whether the most significant activation points in the saliency map correspond to specific anatomical or pathological features in the analyzed images. Byra et al. (2022) used the pointing game to verify if the CAM saliency maps highlighted significant regions for accurate diagnosis i.e. breast mass region, peritumoral region, or region below the breast mass [39], see Figure 13.
- The Resemblance votes metric is used in Dong et al. (2021) for QT evaluation of how well the ROE identified by the AI aligns with the regions considered important by physicians for making diagnostic decisions [40]. The metric categorizes the ROE into three resemblance levels as perceived by clinicians: High Resemblance (HR), where the ROE closely matches the features used by physicians; Medium Resemblance (MR), where the ROE partially matches; and Low Resemblance (LR), where there is little to no match. Considering the perceived resemblance of AI predictions actively included clinicians and can aid in validating and improving the model’s explainability and utility in clinical practice.
Regarding the additional QT metrics identified, the ZNCC score primarily evaluates the AI model’s performance in terms of image similarity and feature activation. The evaluation contributes to understanding model behavior by illustrating AI model responses to variations in input, however, it does not directly assess the explainability. The Pointing Game specifically evaluates the explainability, as it measures the alignment between the model’s focus (saliency maps) and the clinically relevant areas in the images. Similarly, the Resemblance votes method evaluates the explainability as it quantifies the correspondence between the ROE and the diagnostic areas identified by physicians, rather than the accuracy of the underlying AI system. Comparably, the Shapley values quantify the contribution of individual clinical features to the output. These explanations of which features the model uses to make a specific decision are as important as the decision itself.
4. Discussion
4.1. Key Findings
This systematic literature review aimed to investigate the use of explainable AI in oncological ultrasound image analysis, given the need for transparent and trustworthy AI systems in healthcare. Specifically, it sought to provide an overview of the identified XAI methods, including their operational mechanisms, explanatory function, and evaluation metrics. Additionally, the review aimed to compare the advantages and disadvantages of these XAI methods for clinical use.
Fourteen different XAI methods were identified. Most methods employed visualization functions that intuitively highlight influential image areas in prediction processes. However, these methods typically required specific architectures and depended on external validation, potentially limiting their broader application. Other methods incorporated semantic or example-based functions, aligning with clinical reasoning to reduce human subjectivity. Despite their advantages, semantic methods often face challenges in more complex tasks and the effectiveness of example-based methods depends on the quality of examples used. Hybrid approaches that combine multiple explanatory functions have shown promise in leveraging the strengths and mitigating the limitations of individual methods, thus enhancing user trust and understanding.
Integrating XAI into oncological imaging, particularly in real-time applications, holds significant potential for enhancing analysis accuracy, surgical precision, and clinical decision-making. For example, Song et al. (2023) showed performance improvements in US-based thyroid cancer diagnosis using their XAI Explainer method, particularly benefiting junior physicians [49]. In the study of Qian et al. (2021), breast lesion diagnosis aided by Grad-CAM heat map visualizations improved sensitivity, specificity, and overall diagnostic accuracy, highlighting the technique’s added value in clinical practice [47]. Zheng et al. (2024) demonstrated that XAI during live endoscopic US procedures can improve diagnostic accuracy by identifying discriminative tumor features in US images, supporting real-time surgical decisions and outcomes, particularly in distinguishing between visually similar tumors [53].
A significant gap identified in the current literature is the absence of standardized evaluation metrics that specifically quantify the impact of explanations provided by XAI methods in cancer-focused image analysis utilizing real-time ultrasound data. Current studies predominantly employ subjective assessments that rely on visual inspections to evaluate XAI methods. Researchers typically conducted these qualitative assessments without the involvement of clinical end-users. This approach limits the practical applicability and relevance of such evaluations. Some subjective assessments attempt to integrate quantitative metrics, such as the Pointing Game metric, which aligns network attention with clinical expectations to enhance trust in AI decisions. This metric is designed to elucidate why a model makes certain decisions, addressing the "black box" nature of models [39]. However, inconsistency in the application of these evaluations complicates comparisons across studies. The traditional quantitative evaluative metrics used (e.g. confusion matrix, DSC, IoU) are indispensable for objectively describing the accuracy and reliability of AI models, but they primarily focus on the AI model’s performance itself rather than the explainability aspects of XAI outputs. There is, thus, a need for metrics specifically designed to assess how transparent and interpretable AI models are to clinical end-users. Such metrics could include user studies or (subjective) clinical ratings of the transparency and effectiveness of explanatory tools. Currently, to our best knowledge, no comprehensive benchmark exists that specifically addresses XAI evaluation for medical image analysis. Although a pioneering evaluative benchmark designed for XAI visualization in general image analysis tasks is noted [54], it lacks a focus on medical or cancer applications and does not consider semantic or example-based XAI.
Moreover, evaluations often miss objective judgments and feedback from clinical end-users, though crucial components for practical implementation. Studies using tailored quantitative metrics such as ZNCC scores focus more on technical validation, while methods involving clinicians ensure AI aligns with clinical reasoning, stimulating better integration [38]. Only a few studies actively incorporate clinicians in their XAI evaluations [40,44,46,47,49,53]. Dong et al. (2021) actively involved physicians in assessing the resemblance levels of the ROE to ensure that AI-generated evidence was clinically relevant and aligned with their diagnostic criteria [40]. Additionally, three studies [44,46,49] iteratively consulted clinicians in the development of the XAI, to ensure explanations were clinically relevant and useful. Clinicians participated in usability testing sessions to evaluate the effectiveness and clarity of the explanations provided by the XAI systems. Hereafter, their feedback was used to refine the explanations to match clinical needs better [46,49]. Lombardi et al. (2023) specifically employed a human-centered design to involve healthcare professionals throughout the design, implementation, and evaluation phases of the proposed XAI pipeline [44]. The remaining two studies solely incorporated radiologists [47] or endoscopists [53] to qualitatively assess models’ performance in providing understandable visual outputs.
4.2. Comparison with Existing Literature
Despite broad interest in XAI method development, it remains challenging to compare different evaluations due to the absence of standardized evaluation metrics. This need for a common framework of metrics that can be applied universally is repeatedly concluded in the literature [12,16,55]. Similar to our findings, Abrantes et al. (2024) mention a focus on visual and post-hoc explanations, pointing out the unclear impact these explanations have on clinical outcomes. Additionally, they note the risk of over-reliance on the model when providing users with insubstantial explanations, potentially even reducing decision performance. They emphasize the importance of improving AI’s operational transparency in future XAI developments [12]. Similarly, Antoniadi et al. (2021) observed that XAI could boost clinicians’ confidence and generate causal hypotheses in clinical decision support systems, increasing the systems’ trustworthiness and acceptability. However, they mention a distinct shortage in XAI evaluations, particularly in user studies that address clinician needs [16]. In support, Amann et al. (2020) argue that neglecting explainability in clinical decision support systems poses a threat to individual and public health [55]. The variability and scarcity of objective evaluations complicate effective comparisons of XAI methods’ impacts. Developing standardized, clinically relevant evaluation metrics for XAI is needed to assess both the technical performance and explainability of AI models.
4.3. Limitations
The results of the review should be interpreted taking several limitations into account. No articles were identified that applied XAI for intra-operative margin assessments. The ambiguous taxonomy of XAI might have resulted in missed studies during our search strategy, despite efforts to create a broad search string to minimize this risk. The heterogeneity of study designs and outcomes among the included studies further complicates the synthesis of results.
The included studies focused on certain cancer types with tailored imaging approaches leading to the development of specialized XAI systems. This, however, limits their general application. The proposed XAI methods may require extensive adjustments for new data and applications. Furthermore, many XAI methods have not been evaluated in real clinical settings, limiting their practical adoption. This lack of comprehensive clinical assessment and insufficient end-user feedback during the development and evaluation of XAI methods represents a significant gap. The lack of discussion on computational time in the studies is also concerning. Many existing XAI methods use parts of the data or derivatives of real-time images. Time is an essential feature in real-time environments. Consequently, our conclusions regarding the expected clinical potential and impact of XAI in cancer-based image analysis remain uncertain. Future XAI methods should focus on developing approaches that can handle dynamic and complex image data e.g. for better integration into oncological surgery.
4.4. Strengths
This systematic review has several strengths regarding comprehensiveness and relevance. The identification of 14 methods and their categorization into three main XAI functions (visualization, semantics, example-based) aligns with existing literature [14,32]. The extracted characteristics of XAI methods show a similar distribution to those in the study by Van der Velden et al. (2022), which surveyed over 200 papers on XAI for DL-based medical image analysis. This study found that most XAI methods provided CNN-specific, local, post-hoc explanations using saliency maps [32]. Reflecting these findings reinforces the relevance of the categorized XAI methods.
Another notable strength of this review is the provided overview comparing XAI methods for cancer-focused image analysis tasks, encompassing classification, segmentation, and localization. To the best of our knowledge, this is the first review to specifically address XAI for real-time ultrasound imaging in cancer applications.
Additionally, the review underscores the need for standardized and widely accepted evaluative metrics in XAI, which are currently missing. It reinforces the need for clinical end-user integration in developing and evaluating XAI methods, consistent with previous research [12,16,55]. Addressing existing gaps and aligning with established literature, this review provides a foundation for future advancements in XAI for cancer-focused image analysis.
4.5. Implications & Future Research
The findings in this review have several implications for current research, development, and clinical implementation of XAI. XAI has shown the potential to enhance clinician confidence and act as a second reader, improving clinical accuracy and decision-making. However, while explainability can improve transparency, it can lead to over-reliance on AI systems. This is problematic when models are uncertain or incorrect, potentially reducing the decision performance [12]. Therefore, it is necessary to integrate clinical end-users in the development and evaluation processes, focusing on the quality and utility of the explanations provided. Future research should prioritize this by creating "explainability for end-users". Interactive explanations, where end-users can refine and adjust explanations, should be explored. Additionally. the traditional XAI methods like LIME or SHAP focus on feature attributions, which may not align with human conceptual reasoning. Future research should explore concept-based XAI methods, as proposed by Longo et al. (2024) [21]. These explanations embed human-understandable concepts into AI outputs, facilitating the integration of expert clinical knowledge. These methods should be developed for tasks beyond computer vision applications, such as classification and regression in oncological contexts. Initial examples can already be seen in the BoF [38] and BI-RADS-Net [52] methods.
XAI methods combining functions and scopes can provide rich explanations that align more closely with human cognitive processes [21]. Such hybrid methods ensure technical accuracy whilst enhancing transparency and user trust, particularly important in critical care areas such as oncology. However, many XAI methods identified present generalization issues across different datasets or conditions, indicating the need for further refinement of XAI to ensure robustness and sophistication. Policymakers should consider the balance between the benefits of explainability and the potential monetary and safety costs [15].
Future research should address identified shortcomings to advance the application and effectiveness of XAI in cancer-focused ultrasound image analysis. These include the need for standardized evaluation metrics and the development of an evaluation framework that addresses the clinically relevant impact of the explanations provided. Such a framework should ensure that XAI methods are consistently and quantitatively evaluated for increased reliability and comparability.
5. Conclusions
In conclusion, this review provides an overview of various XAI methods applied to cancer-focused image analysis using real-time ultrasound imaging data, aimed at addressing the "black box" nature of advanced AI models. The enhanced transparency resulting from XAI implementations can help clinicians make more informed decisions, foster trust, and facilitate the integration of AI into clinical workflows. The identified XAI methods show promise, particularly when combining functions and actively incorporating clinical end-users. However, challenges remain regarding the XAI method’s novelty, ambiguous evaluations, and data dependency. Addressing the identified gaps and proposing methodological improvements will be essential for promoting the practical implementation and clinical efficacy of XAI. The expansion of XAI towards real-time cancer applications and developing standardized quantitative evaluative metrics are crucial steps in this advancement.
Author Contributions
Conceptualization, F.G. and B.D.; methodology, L.S.W., L.M.K., M.W., F.G. and B.D.; software, L.S.W.; validation, L.S.W., L.M.K., M.W., F.G. and B.D.; formal analysis, L.S.W., F.G. and B.D.; investigation, L.S.W. and F.G.; resources, B.D.; data curation, L.S.W. and F.G.; writing—original draft preparation, L.S.W. and F.G.; writing—review and editing, L.S.W., L.M.K., M.W., F.G. and B.D.; visualization, L.S.W. and F.G.; supervision, F.G. and B.D.; project administration, B.D. All authors have read and agreed to the published version of the manuscript.
Funding
This research received no external funding.
Institutional Review Board Statement
Not applicable.
Informed Consent Statement
Not applicable.
Data Availability Statement
Not applicable.
Acknowledgments
Research at the Netherlands Cancer Institute is supported by institutional grants of the Dutch Cancer Society and of the Dutch Ministry of Health, Welfare and Sport.
Conflicts of Interest
The authors declare no conflicts of interest.
Appendix A
Medline search string:
((((explainab*) ADJ12 (artificial-intelligen* OR AI OR deep-learn* OR machine-learn* OR neural-network* OR machine-intellig* OR automated-reason* OR machine-reason*)) OR XAI).ab,ti,kf.) AND (exp Ultrasonography/ OR Ultrasonics/ OR (ultrasound* OR ultrasonic OR echograph* OR ultrasonograph*).ab,ti,kf.) AND (Classification/ OR exp Neoplasm Staging/ OR Margins of Excision/ OR (segmentat* or classificat* OR margin* OR delineation* OR staging).ab,ti,kf.)
Scopus search string:
TITLE-ABS-KEY(((((explainab*) W/12 (artificial-intelligen* OR AI OR deep-learn* OR machine-learn* OR neural-network* OR machine-intellig* OR automated-reason* OR machine-reason*)) OR XAI)) AND ((ultrasound* OR ultrasonic OR echograph* OR ultrasonograph*)) AND ((segmentat* or classificat* OR margin* OR delineation* OR staging)))
Appendix B

Table A1.
Characteristics of ultrasound imaging systems utilized per study
| Author (year) | US Modality | System (Manufacturer) | Probe / Transducer | Frequency | Acquisition |
|---|---|---|---|---|---|
| Al-Jebrni, A.H. (2023) [37] | US | EPIQ 7 (Philips) + DU8 (Technos) | NA | NA | Continuous |
| lightgrayBasu, S. (2023) [38] | Transabdominal US | Logic S8 (GE Healthcare) | Convex low-frequency | 1.0–5.0 MHz | Multiple shot, static B-mode |
| Byra, M. (2022) [39] | Breast US | SonixTouch Research (Ultrasonix) | L14-5/38 linear probe | 10 MHz | Single shot, static B-mode |
| Dong, F. (2021) [40] | US | Resona 7 (Mindray) | L11-3U linear array | 2.0–11 MHz | Continuous |
| Han, X. (2022) [41] | US | NA (Siemens), NA (Philips) | NA | NA | Continuous |
| Hassan, M. R. (2022) [42] | Transrectal US | Hi-Vision 5500 (Hitachi) | NA | 7.5 MHz | Continuous |
| C41V end-fire probe (Nobulus) | NA | 2.0–10 MHz | Continuous | ||
| Karimzadeh, M. (2023) [43] | Breast US | LOGIQ E9 + LOGIQ E9 Agile (GE Healthcare) | ML6-15-D Matrix linear probe | NA | Continuous |
| VIVID 7 (GE Healthcare), LOGIQ E9 (GE Healthcare), EUB-6500 (Hitachi), iU22 (Philips), ACUSON S2000 (Siemens) | NA | NA | Continuous | ||
| Lombardi, A. (2023) [44] | Transvaginal or transabdominal US & 3D US | NA | NA | 5.0–9.0 MHz (transvaginal), 3.5–5.0 MHz (transabdominal) | Continuous or 3D volume scan |
| Martizzi, D. (2021) [45] | Quantitative Transmission US | NA | NA | NA | 3D volume scan |
| Morris, J. (2023) [46] | US | NA | NA | NA | Continuous |
| Qian, X. (2021) [47] | US | Aixplorer (SuperSonic) | NA | NA | Continuous |
| Rezazadeh, A. (2022) [48] | Breast US | LOGIQ E9 (GE Healthcare) + LOGIQ E9 Agile (GE Healthcare) | ML6-15-D Matrix linear probe | 1.0–5.0 MHz | Continuous |
| Song, D. (2023) [49] | US | NA | NA | NA | Single shot |
| Tasnim, J. (2024) [50] | Quantitative US | LOGIQ E9 + LOGIQ E9 Agile (GE Healthcare) | ML6-15-D Matrix linear probe | 1.0–5.0 MHz | Continuous |
| Voluson730 scanner (GE Healthcare) | S-VNW5-10 small-part transducer | 5.0–10 MHz | Continuous | ||
| ACUSON Sequoia C512 (Siemens) | 17L5 HD linear array transducer | 8.5 MHz | Continuous | ||
| iU22 (Philips) | Linear probe | 7.0–15 MHz | Continuous | ||
| Sonix-Touch Research (Ultrasonix) | L14-5/38 linear transducer | 10 MHz | Continuous | ||
| Thomas, J. (2020) [51] | US | NA (GE Healthcare), NA (Philips), NA (Sonosite) | NA | 8.0–13 MHz | Continuous |
| Zhang, B. (2021) [52] | Breast US | LOGIQ E9 + LOGIQ E9 Agile (GE Healthcare) | ML6-15-D Matrix linear probe | 1.0–5.0 MHz | Continuous |
| VIVID 7 (GE Healthcare), LOGIQ E9 (GE Healthcare), EUB-6500 (Hitachi), iU22 (Philips), ACUSON S2000 (Siemens) | L11-3U linear array | 1.0–5.0 MHz | Continuous | ||
| Zheng, H. (2024) [53] | Endoscopic US | NA | NA | NA | Continuous |
= Not Available, = Ultrasound
References
- Grand View Research. AI In Healthcare Market Size, Share & Trends Analysis Report By Component (Hardware, Services), By Application, By End-use, By Technology, By Region, And Segment Forecasts, 2024 - 2030. https://www.grandviewresearch.com/industry-analysis/artificial-intelligence-ai-healthcare-market, 2024.
- Sanskrutisathe. AI in Healthcare Market Size and Growth. https://medium.com/@sanskrutisathe01/ai-in-healthcare-market-size-and-growth-2ae9b8463121, 2024.
- World Health Organization. Global strategy on human resources for health: Workforce 2030. https://apps.who.int/iris/bitstream/handle/10665/250368/9789241511131-eng.pdf, 2016.
- Choi, M.; Sempungu, J.K.; Lee, E.H.; Lee, Y.H. Living longer but in poor health: healthcare system responses to ageing populations in industrialised countries based on the Findings from the Global Burden of Disease Study 2019. BMC Public Health 2024, 24, 576. [Google Scholar] [CrossRef] [PubMed]
- Atkinson, S.; Jackson, C. Three in five globally say their healthcare system is overstretched. https://www.ipsos.com/en/three-five-globally-say-their-healthcare-system-overstretched, 2022.
- Page, B.; Irving, D.; Amalberti, R.; Vincent, C. Health services under pressure: a scoping review and development of a taxonomy of adaptive strategies. BMJ Quality & Safety. [CrossRef]
- Bohr, A.; Memarzadeh, K. Chapter 2 - The rise of artificial intelligence in healthcare applications. In Artificial Intelligence in Healthcare; Academic Press, 2020; pp. 25–60. [CrossRef]
- Zhang, B.; Shi, H.; Wang, H. Machine Learning and AI in Cancer Prognosis, Prediction, and Treatment Selection: A Critical Approach. Journal of Multidisciplinary Healthcare 2023, 16, 1779–1791. [Google Scholar] [CrossRef] [PubMed]
- Wolff, J.; Pauling, J.; Keck, A.; Baumbach, J. The Economic Impact of Artificial Intelligence in Health Care: Systematic Review. J Med Internet Res 2020, 22, e16866. [Google Scholar] [CrossRef] [PubMed]
- Pinto-Coelho, L. How Artificial Intelligence Is Shaping Medical Imaging Technology: A Survey of Innovations and Applications. Bioengineering 2023, 10, 1435. [Google Scholar] [CrossRef] [PubMed]
- Borys, K.; Schmitt, Y.A.; Nauta, M.; Seifert, C.; Krämer, N.; Friedrich, C.M.; Nensa, F. Explainable AI in medical imaging: An overview for clinical practitioners – Saliency-based XAI approaches. European Journal of Radiology 2023, 162, 110787. [Google Scholar] [CrossRef] [PubMed]
- Abrantes, J.; Rouzrokh, P. Explaining explainability: The role of XAI in medical imaging. European Journal of Radiology 2024, 173, 111389. [Google Scholar] [CrossRef]
- Singh, A.; Sengupta, S.; Lakshminarayanan, V. Explainable Deep Learning Models in Medical Image Analysis. Journal of Imaging 2020, 6, 52. [Google Scholar] [CrossRef] [PubMed]
- Reyes, M.; Meier, R.; Pereira, S.; Silva, C.A.; Dahlweid, F.M.; Tengg-Kobligk, H.v.; Summers, R.M.; Wiest, R. On the Interpretability of Artificial Intelligence in Radiology: Challenges and Opportunities. Radiology: Artificial Intelligence 2020, 2, e190043. [Google Scholar] [CrossRef] [PubMed]
- Hacker, P.; Passoth, J.H. , Varieties of AI Explanations Under the Law. From the GDPR to the AIA, and Beyond. In xxAI - Beyond Explainable AI, Lecture Notes in Artificial Intelligence; Springer International Publishing, 2022; pp. 343–373. [CrossRef]
- Antoniadi, A.M.; Du, Y.; Guendouz, Y.; Wei, L.; Mazo, C.; Becker, B.A.; Mooney, C. Current Challenges and Future Opportunities for XAI in Machine Learning-Based Clinical Decision Support Systems: A Systematic Review. Applied Sciences 2021, 11, 5088. [Google Scholar] [CrossRef]
- Barredo Arrieta, A.; Díaz-Rodríguez, N.; Del Ser, J.; Bennetot, A.; Tabik, S.; Barbado, A.; Garcia, S.; Gil-Lopez, S.; Molina, D.; Benjamins, R.; et al. Explainable Artificial Intelligence (XAI): Concepts, taxonomies, opportunities and challenges toward responsible AI. Information Fusion 2020, 58, 82–115. [Google Scholar] [CrossRef]
- Linardatos, P.; Papastefanopoulos, V.; Kotsiantis, S. Explainable AI: A Review of Machine Learning Interpretability Methods. Entropy 2020, 23, 18. [Google Scholar] [CrossRef] [PubMed]
- Thormundsson, B. Global explainable AI market revenues 2022. https://www.statista.com/statistics/1256246/worldwide-explainable-ai-market-revenues/, 2024.
- Jacovi, A. Trends in explainable AI (XAI) literature. https://medium.com/@alonjacovi/trends-in-explainable-ai-xai-literature-a1db485e871, 2023.
- Longo, L.; Brcic, M.; Cabitza, F.; Choi, J.; Confalonieri, R.; Ser, J.D.; Guidotti, R.; Hayashi, Y.; Herrera, F.; Holzinger, A.; et al. Explainable Artificial Intelligence (XAI) 2.0: A manifesto of open challenges and interdisciplinary research directions. Information Fusion 2024, 106, 102301. [Google Scholar] [CrossRef]
- Ali, S.; Abuhmed, T.; El-Sappagh, S.; Muhammad, K.; Alonso-Moral, J.M.; Confalonieri, R.; Guidotti, R.; Del Ser, J.; Díaz-Rodríguez, N.; Herrera, F. Explainable Artificial Intelligence (XAI): What we know and what is left to attain Trustworthy Artificial Intelligence. Information Fusion 2023, 99, 101805. [Google Scholar] [CrossRef]
- World Health Organization. Global cancer burden growing, amidst mounting need for services. https://www.who.int/news/item/01-02-2024-global-cancer-burden-growing–amidst-mounting-need-for-services, 2024.
- Weerarathna, I.N.; Kamble, A.R.; Luharia, A. Artificial Intelligence Applications for Biomedical Cancer Research: A Review. Cureus 2023, 15, e48307. [Google Scholar] [CrossRef] [PubMed]
- Jaber, N. Can Artificial Intelligence Help See Cancer in New, and Better, Ways? National Cancer Institute 2022. [Google Scholar]
- Wijkhuizen, M.; van Karnenbeek, L.; Geldof, F.; Ruers, T.J.; Dashtbozorg, B. Ultrasound tumor detection using an adapted Mask-RCNN with a continuous objectness score. In Proceedings of the Medical Imaging with Deep Learning; 2024. [Google Scholar]
- Natali, T.; Wijkhuizen, M.; Kurucz, L.; Fusaglia, M.; van Leeuwen, P.J.; Ruers, T.J.; Dashtbozorg, B. Automatic real-time prostate detection in transabdominal ultrasound images. In Proceedings of the Medical Imaging with Deep Learning; 2024. [Google Scholar]
- Hoogteijling, N.; Veluponnar, D.; de Boer, L.; Dashtbozorg, B.; Peeters, M.J.V.; van Duijnhoven, F.; Ruers, T. Toward automatic surgical margin assessment using ultrasound imaging during breast cancer surgery. European Journal of Surgical Oncology 2023, 49, e108–e109. [Google Scholar] [CrossRef]
- Veluponnar, D.; de Boer, L.L.; Geldof, F.; Jong, L.J.S.; Da Silva Guimaraes, M.; Vrancken Peeters, M.J.T.; van Duijnhoven, F.; Ruers, T.; Dashtbozorg, B. Toward intraoperative margin assessment using a deep learning-based approach for automatic tumor segmentation in breast lumpectomy ultrasound images. Cancers 2023, 15, 1652. [Google Scholar] [CrossRef]
- Geldof, F.; Pruijssers, C.W.; Jong, L.J.S.; Veluponnar, D.; Ruers, T.J.; Dashtbozorg, B. Tumor Segmentation in Colorectal Ultrasound Images Using an Ensemble Transfer Learning Model: Towards Intra-Operative Margin Assessment. Diagnostics 2023, 13, 3595. [Google Scholar] [CrossRef] [PubMed]
- Weld, A.; Dixon, L.; Anichini, G.; Dyck, M.; Ranne, A.; Camp, S.; Giannarou, S. Identifying Visible Tissue in Intraoperative Ultrasound Images during Brain Surgery: A Method and Application. arXiv preprint arXiv:2306.01190, arXiv:2306.01190 2023. [CrossRef]
- van der Velden, B.H.; Kuijf, H.J.; Gilhuijs, K.G.; Viergever, M.A. Explainable artificial intelligence (XAI) in deep learning-based medical image analysis. Medical Image Analysis 2022, 79, 102470. [Google Scholar] [CrossRef]
- Medline Embase Database. https://www.embase.com.
- Scopus Bibliographic Database. https://www.scopus.com.
- Page, M.J.; McKenzie, J.E.; Bossuyt, P.M.; Boutron, I.; Hoffmann, T.C.; Mulrow, C.D.; Shamseer, L.; Tetzlaff, J.M.; Akl, E.A.; Brennan, S.E.; et al. The PRISMA 2020 statement: an updated guideline for reporting systematic reviews. Systematic Reviews 2021, 10, 89. [Google Scholar] [CrossRef]
- Visani, G. Explainable Machine Learning, XAI Review: Model Agnostic Tools. https://towardsdatascience.com/explainable-machine-learning-9d1ca0547ae0, 2020.
- Al-Jebrni, A.H.; Ali, S.G.; Li, H.; Lin, X.; Li, P.; Jung, Y.; Kim, J.; Feng, D.D.; Sheng, B.; Jiang, L.; et al. SThy-Net: a feature fusion-enhanced dense-branched modules network for small thyroid nodule classification from ultrasound images. The Visual Computer 2023, 39, 3675–3689. [Google Scholar] [CrossRef]
- Basu, S.; Gupta, M.; Rana, P.; Gupta, P.; Arora, C. RadFormer: Transformers with global–local attention for interpretable and accurate Gallbladder Cancer detection. Medical Image Analysis 2023, 83, 102676. [Google Scholar] [CrossRef] [PubMed]
- Byra, M.; Dobruch-Sobczak, K.; Piotrzkowska-Wroblewska, H.; Klimonda, Z.; Litniewski, J. Explaining a Deep Learning Based Breast Ultrasound Image Classifier with Saliency Maps. Journal of Ultrasonography 2022, 22, 70–75. [Google Scholar] [CrossRef] [PubMed]
- Dong, F.; She, R.; Cui, C.; Shi, S.; Hu, X.; Zeng, J.; Wu, H.; Xu, J.; Zhang, Y. One step further into the blackbox: a pilot study of how to build more confidence around an AI-based decision system of breast nodule assessment in 2D ultrasound. European Radiology 2021, 31, 4991–5000. [Google Scholar] [CrossRef] [PubMed]
- Han, X.; Chang, L.; Song, K.; Cheng, L.; Li, M.; Wei, X. Multitask network for thyroid nodule diagnosis based on TI-RADS. Medical Physics 2022, 49, 5064–5080. [Google Scholar] [CrossRef] [PubMed]
- Hassan, M.R.; Islam, M.F.; Uddin, M.Z.; Ghoshal, G.; Hassan, M.M.; Huda, S.; Fortino, G. Prostate cancer classification from ultrasound and MRI images using deep learning based Explainable Artificial Intelligence. Future Generation Computer Systems 2022, 127, 462–472. [Google Scholar] [CrossRef]
- Karimzadeh, M.; Vakanski, A.; Xian, M.; Zhang, B. Post-Hoc Explainability of BI-RADS Descriptors in a Multi-Task Framework for Breast Cancer Detection and Segmentation. In Proceedings of the 2023 IEEE 33rd International Workshop on Machine Learning for Signal Processing (MLSP). IEEE Computer Society; 2023. [Google Scholar] [CrossRef]
- Lombardi, A.; Arezzo, F.; Sciascio, E.D.; Ardito, C.; Mongelli, M.; Lillo, N.D.; Fascilla, F.D.; Silvestris, E.; Kardhashi, A.; Putino, C.; et al. A human-interpretable machine learning pipeline based on ultrasound to support leiomyosarcoma diagnosis. Artificial Intelligence in Medicine 2023, 146, 102697. [Google Scholar] [CrossRef]
- Martizzi, D.; Huang, Y.; Malik, B.; Ray, P.D. Breast mass detection and classification using PRISM™ eXplainable Network based Machine Learning (XNML™) platform for Quantitative Transmission (QT) ultrasound tomography. In Proceedings of the Proc. SPIE 11602, Medical Imaging 2021: Ultrasonic Imaging and Tomography, 2021, Vol. 11602. [CrossRef]
- Morris, J.; Liu, Z.; Liang, H.; Nagala, S.; Hong, X. ThyExp: An explainable AI-assisted Decision Making Toolkit for Thyroid Nodule Diagnosis based on Ultra-sound Images. In Proceedings of the Proceedings of the 32nd ACM International Conference on Information and Knowledge Management.; pp. 20235371–5375. [CrossRef]
- Qian, X.; Pei, J.; Zheng, H.; Xie, X.; Yan, L.; Zhang, H.; Han, C.; Gao, X.; Zhang, H.; Zheng, W.; et al. Prospective assessment of breast cancer risk from multimodal multiview ultrasound images via clinically applicable deep learning. Nature Biomedical Engineering 2021, 5, 522–532. [Google Scholar] [CrossRef]
- Rezazadeh, A.; Jafarian, Y.; Kord, A. Explainable Ensemble Machine Learning for Breast Cancer Diagnosis Based on Ultrasound Image Texture Features. Forecasting 2022, 4, 262–274. [Google Scholar] [CrossRef]
- Song, D.; Yao, J.; Jiang, Y.; Shi, S.; Cui, C.; Wang, L.; Wang, L.; Wu, H.; Tian, H.; Ye, X.; et al. A new xAI framework with feature explainability for tumors decision-making in Ultrasound data: comparing with Grad-CAM. Computer Methods and Programs in Biomedicine 2023, 235, 107527. [Google Scholar] [CrossRef]
- Tasnim, J.; Hasan, M.K. CAM-QUS guided self-tuning modular CNNs with multi-loss functions for fully automated breast lesion classification in ultrasound images. Physics in Medicine and Biology 2024, 69, 015018. [Google Scholar] [CrossRef] [PubMed]
- Thomas, J.; Haertling, T. AIBx, Artificial Intelligence Model to Risk Stratify Thyroid Nodules. Thyroid 2020, 30, 878–884. [Google Scholar] [CrossRef] [PubMed]
- Zhang, B.; Vakanski, A.; Xian, M. Bi-Rads-Net: An Explainable Multitask Learning Approach for Cancer Diagnosis in Breast Ultrasound Images. In Proceedings of the 2021 IEEE 31st International Workshop on Machine Learning for Signal Processing (MLSP); 2021. [Google Scholar] [CrossRef]
- Zheng, H.; Dong, Z.; Liu, T.; Zheng, H.; Wan, X.; Bao, J. Enhancing gastrointestinal submucosal tumor recognition in endoscopic ultrasonography: A novel multi-attribute guided contextual attention network. Expert Systems with Applications 2024, 242, 122725. [Google Scholar] [CrossRef]
- Zhang, Y.; Gu, S.; Song, J.; Pan, B.; Bai, G.; Zhao, L. XAI Benchmark for Visual Explanation. arXiv preprint arXiv:2310.08537, arXiv:2310.08537 2023. [CrossRef]
- Amann, J.; Blasimme, A.; Vayena, E.; Frey, D.; Madai, V.I. Explainability for artificial intelligence in healthcare: a multidisciplinary perspective. BMC Medical Informatics and Decision Making 2020, 20, 310. [Google Scholar] [CrossRef] [PubMed]
Figure 1.
Schematic representation of XAI methods with model-specific (left) or model-agnostic (right) dependencies.
Figure 1.
Schematic representation of XAI methods with model-specific (left) or model-agnostic (right) dependencies.
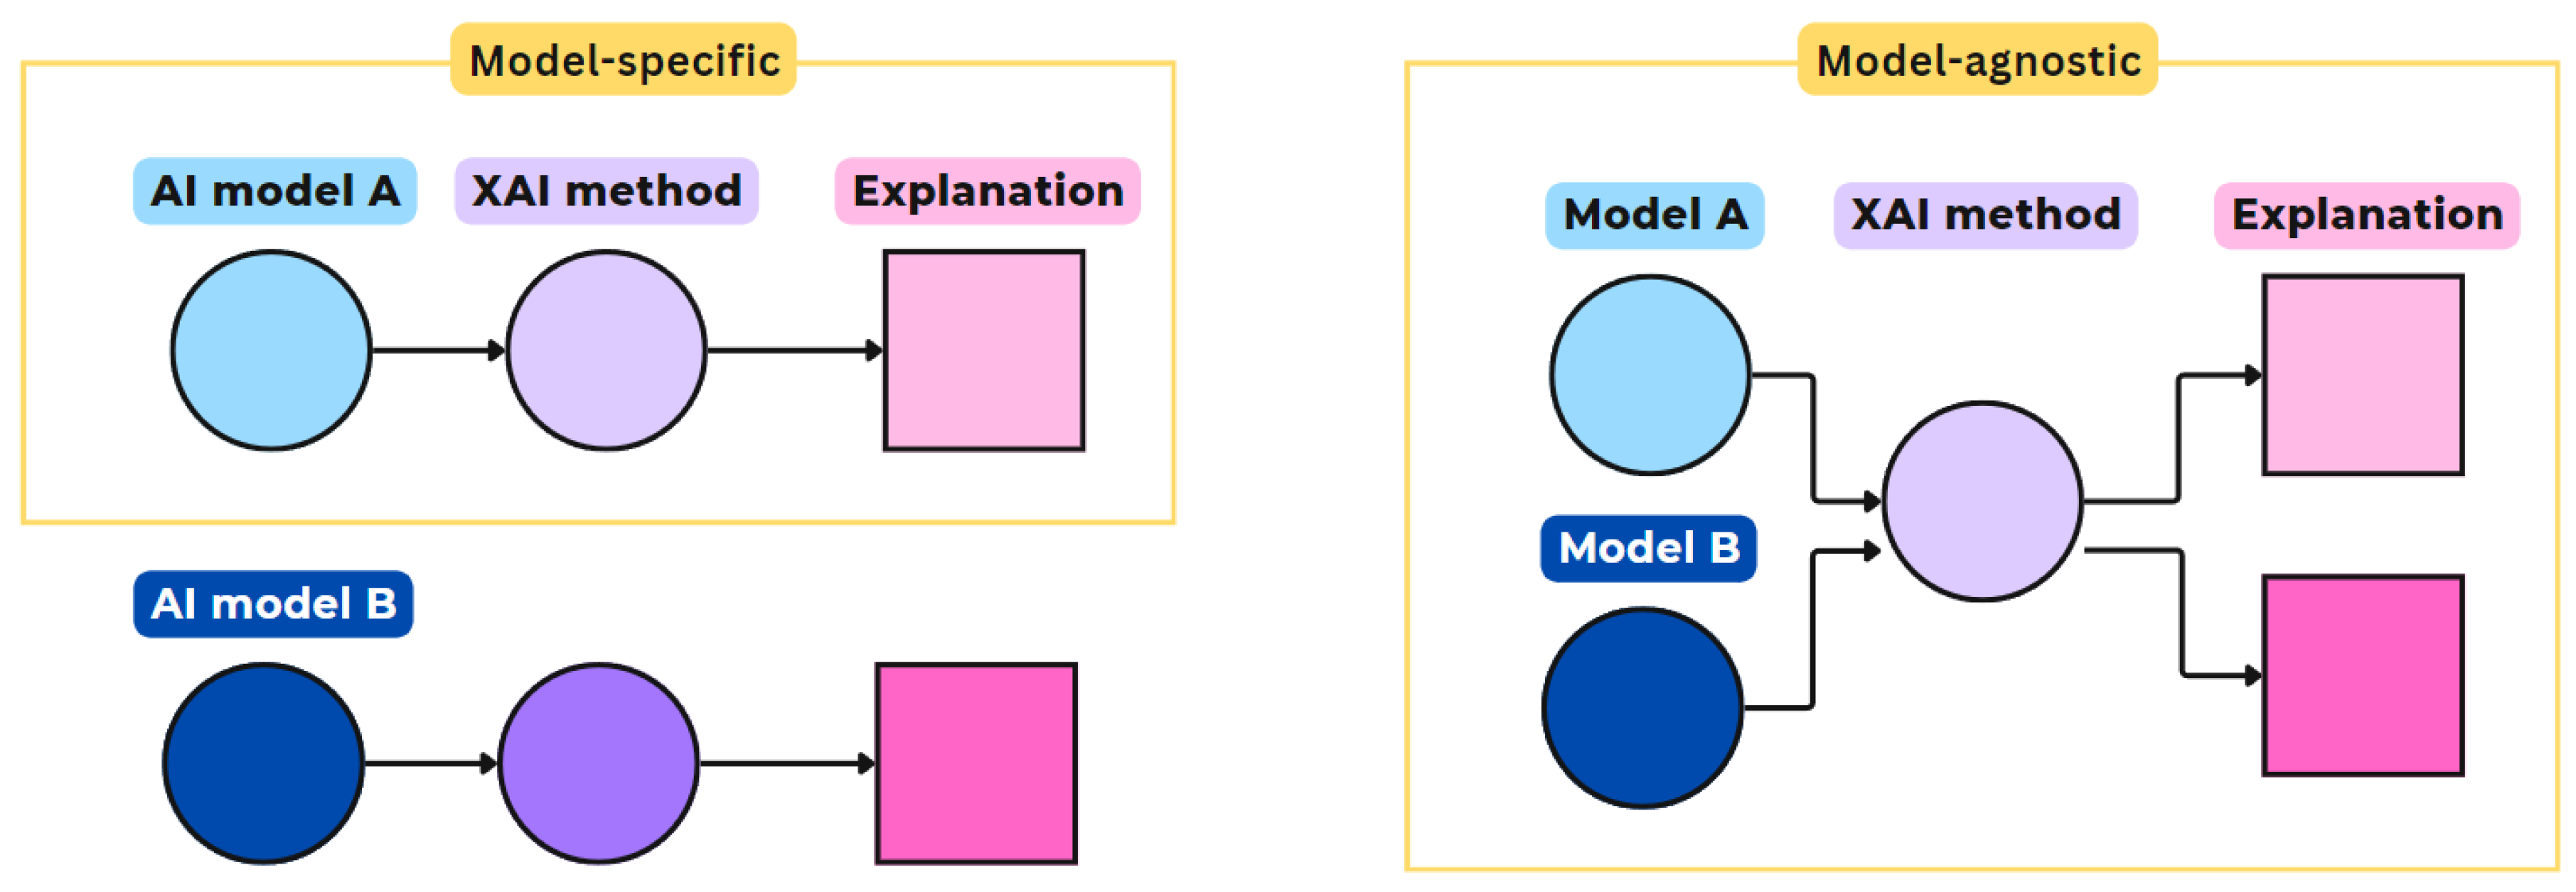
Figure 2.
Schematic representation of XAI methods with global (left) or local (right) scopes.
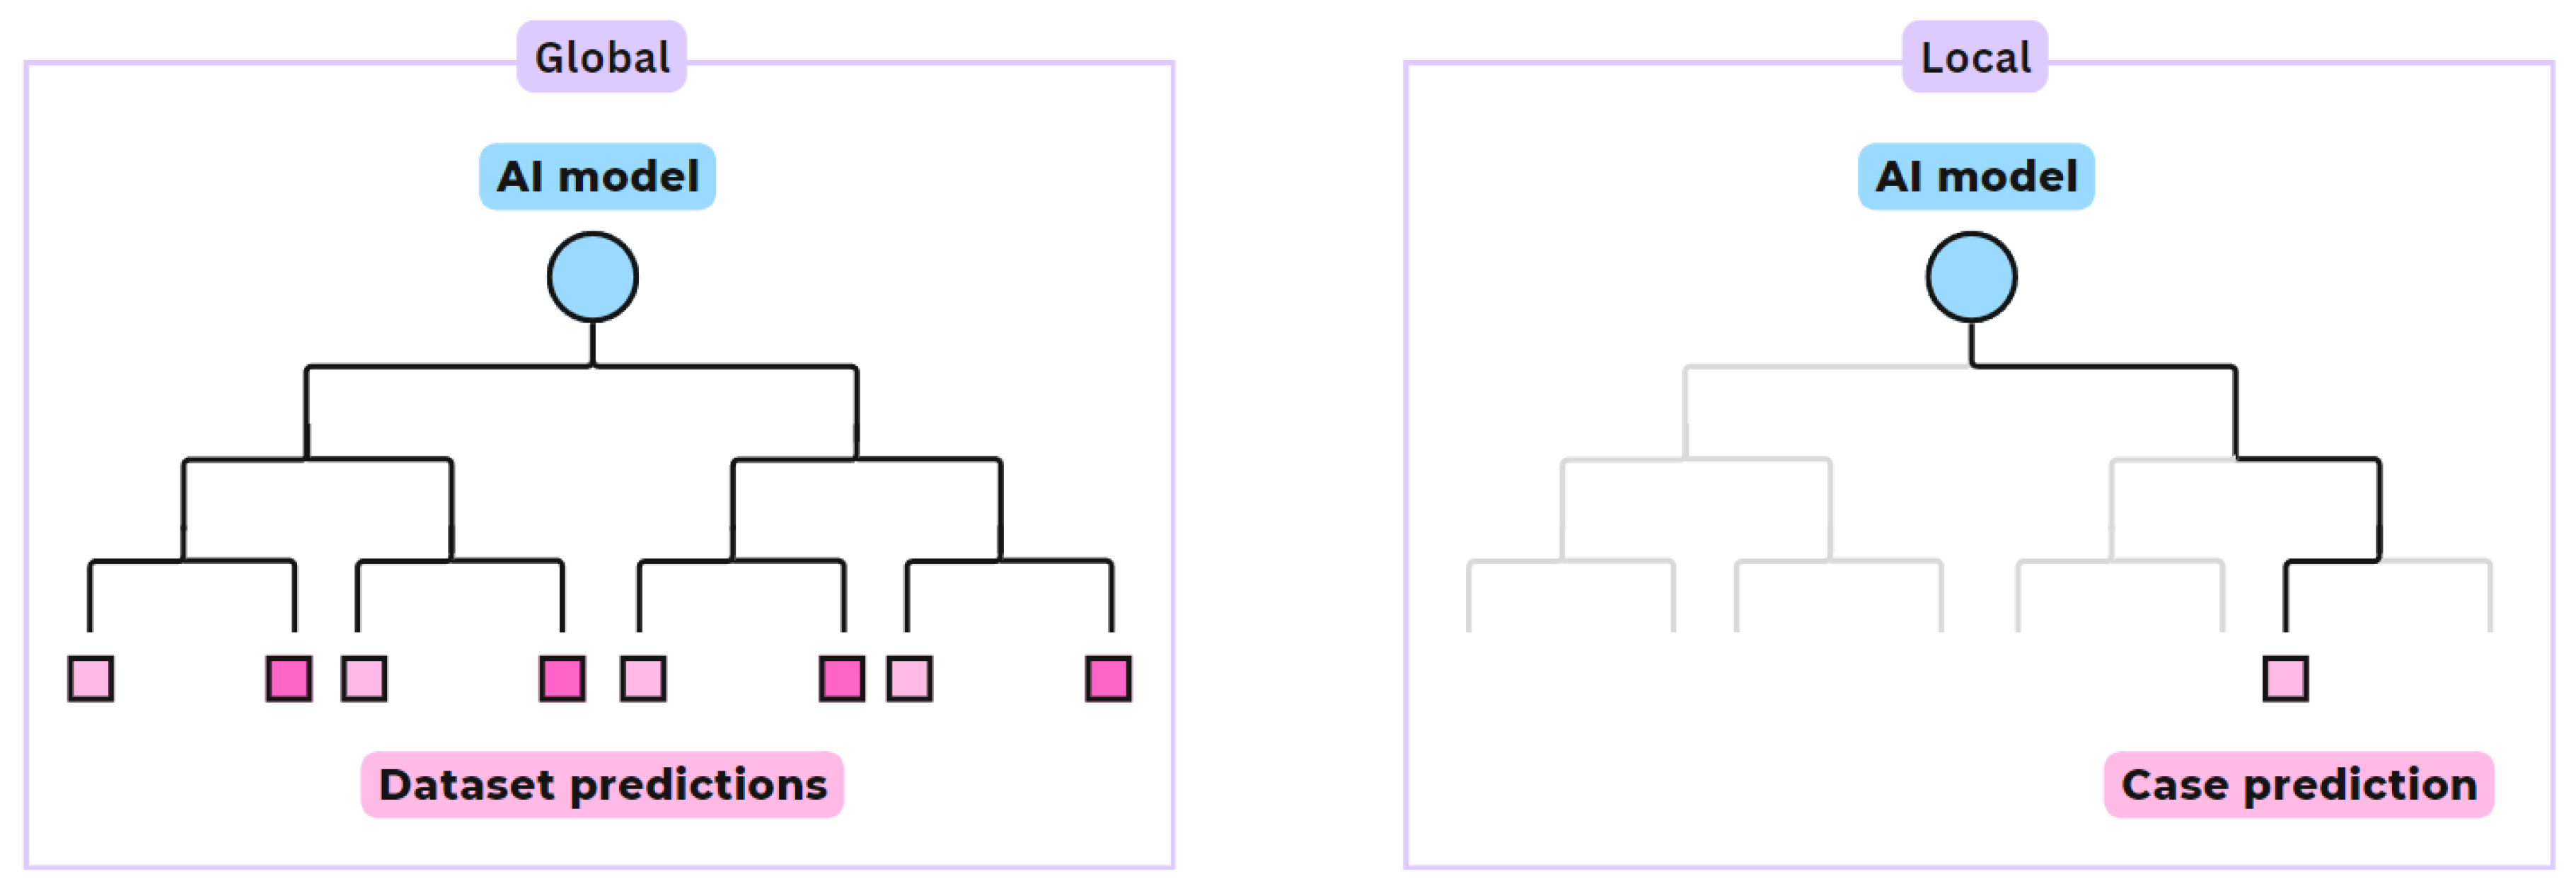
Figure 3.
Schematic representation of XAI methods with intrinsic (bottom) or post-hoc (top) applications.
Figure 3.
Schematic representation of XAI methods with intrinsic (bottom) or post-hoc (top) applications.
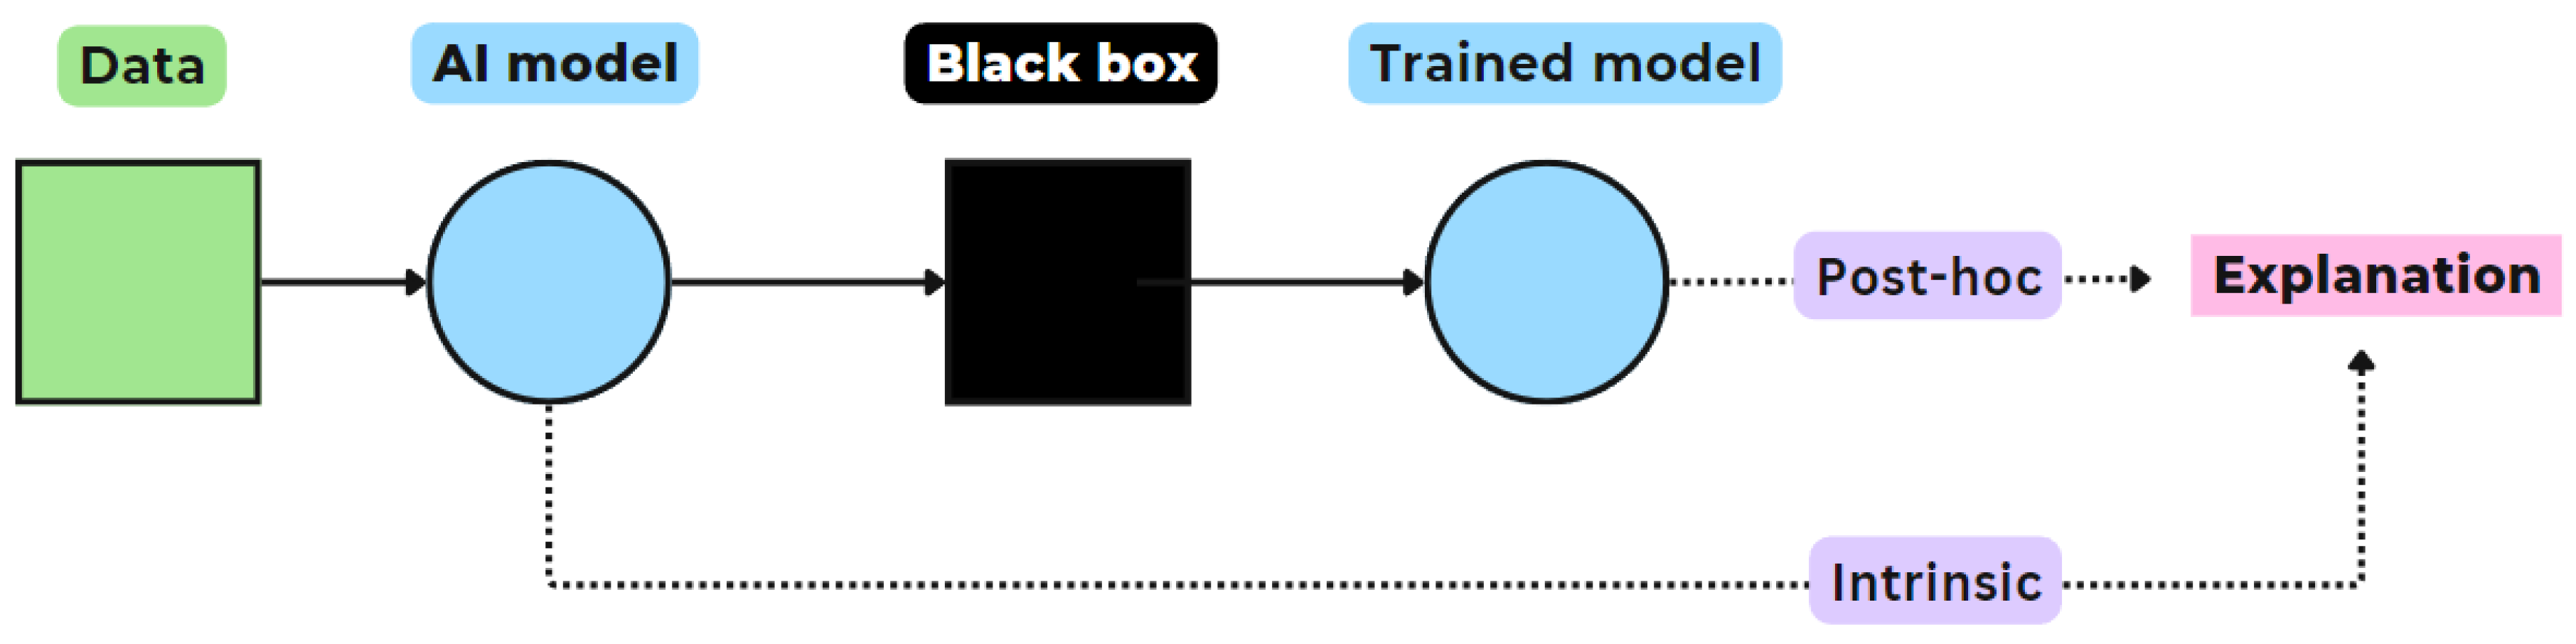
Figure 4.
Flowchart visualizing the results of the PRISMA-based article selection process.
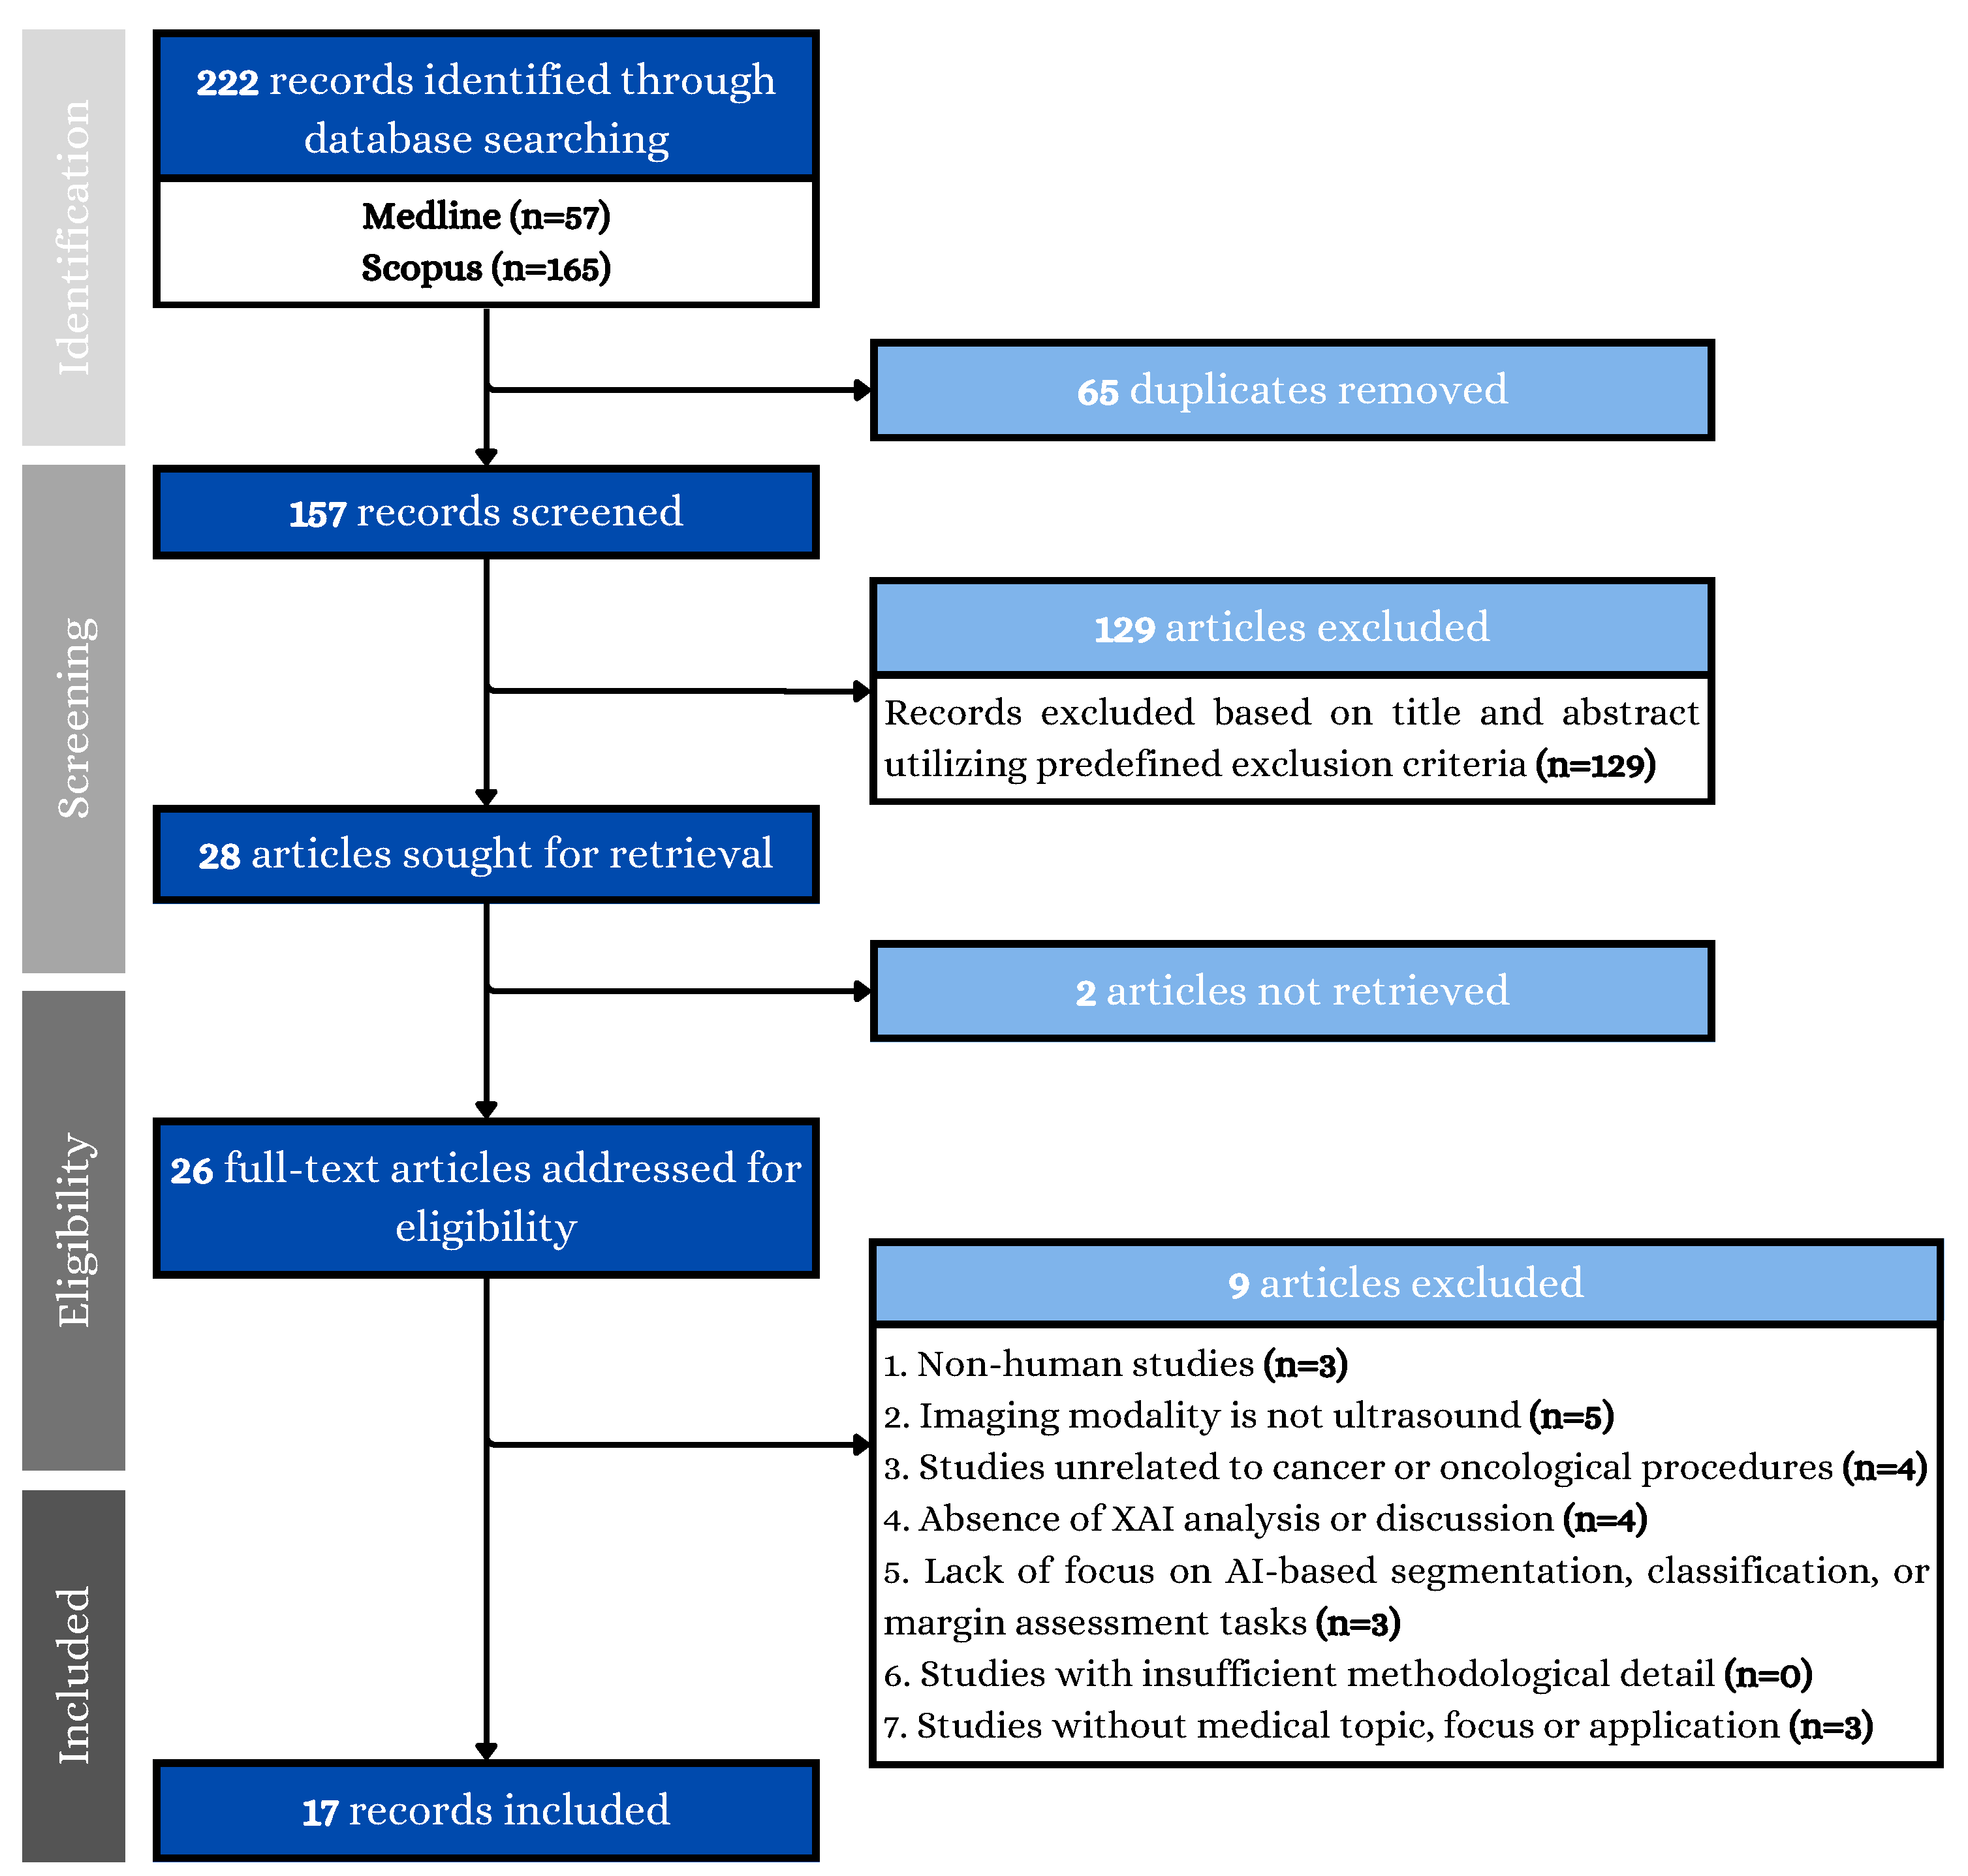
Figure 5.
Division of AI-based image analysis tasks in the included studies.
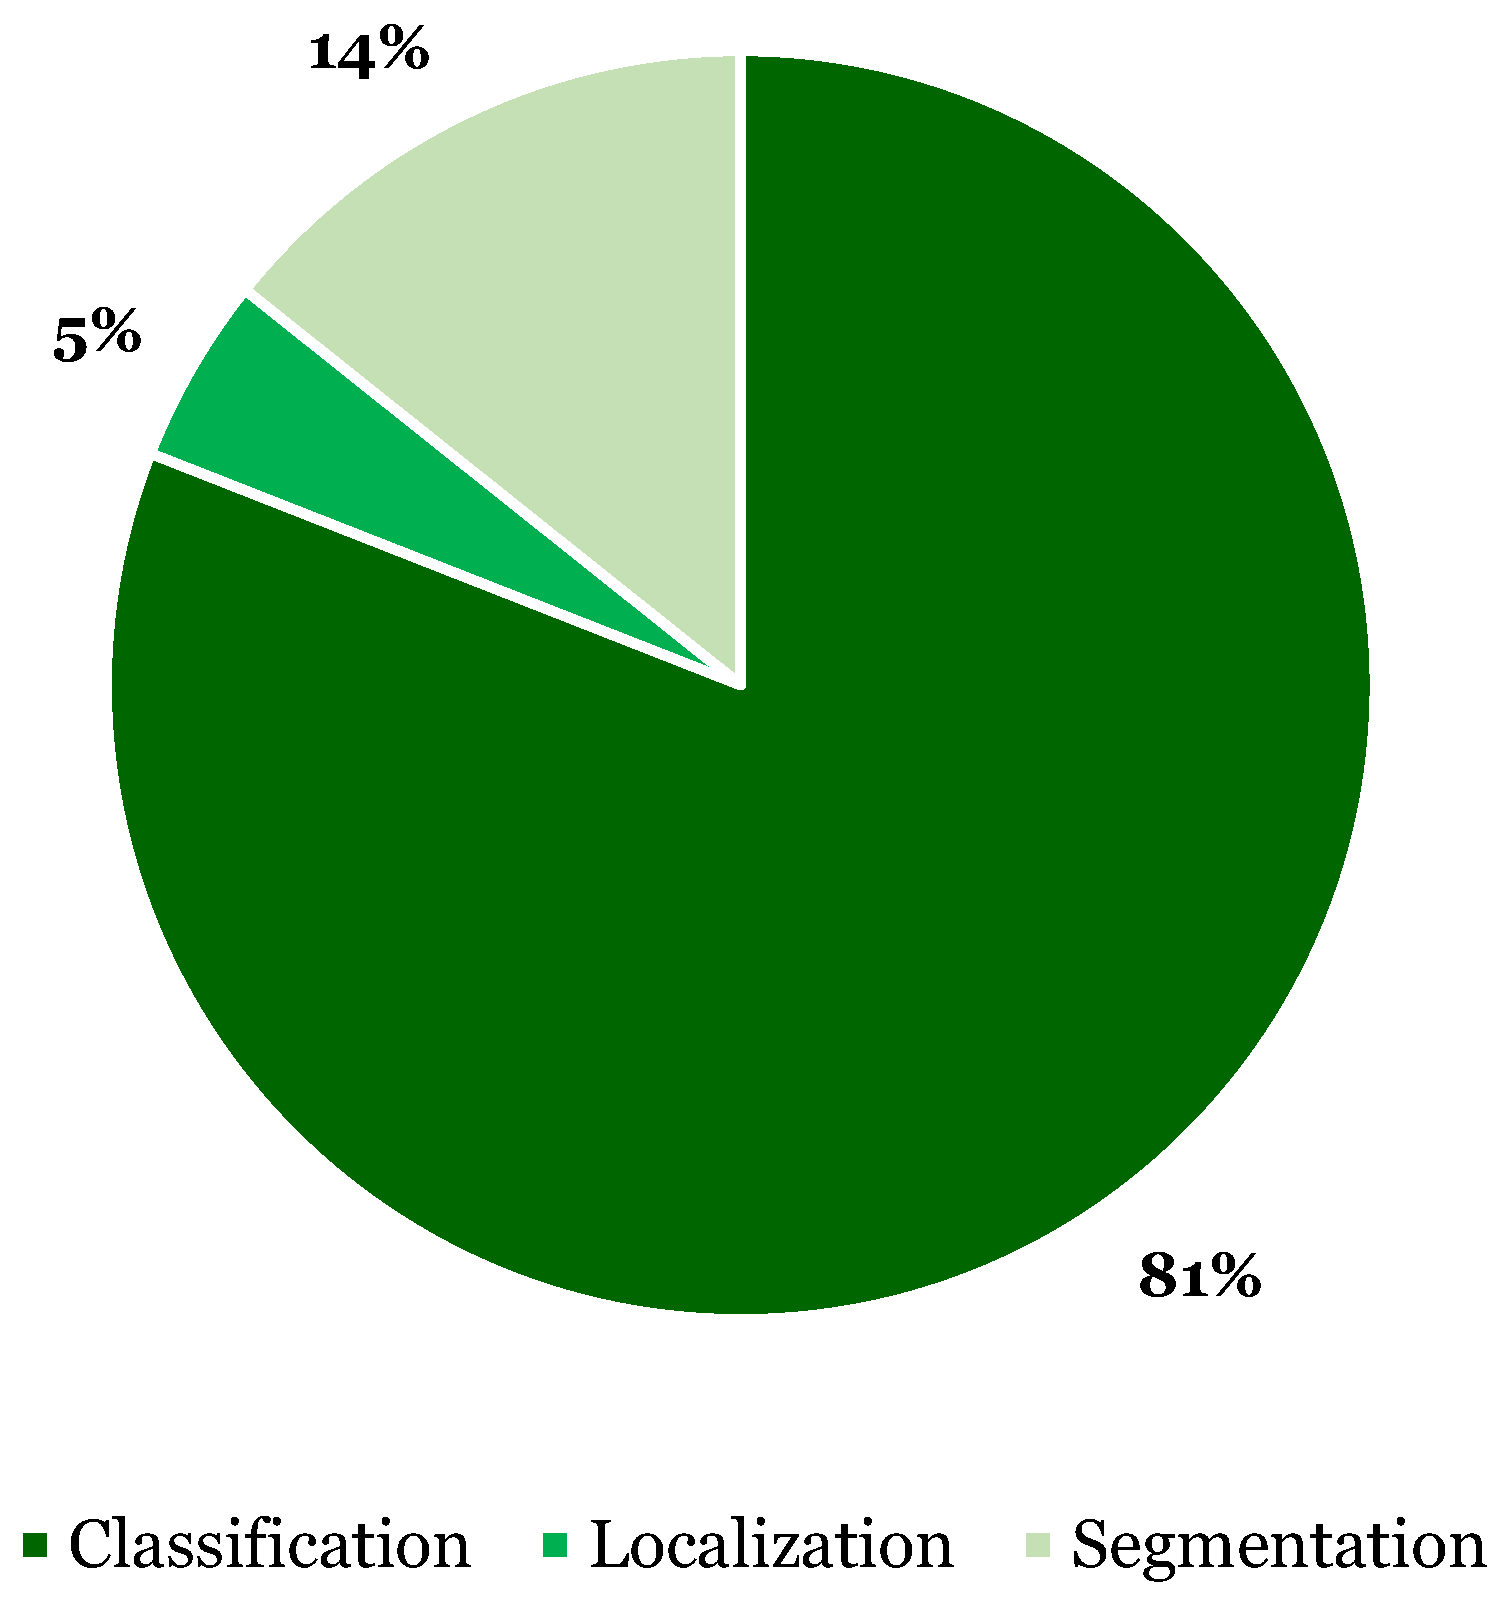
Figure 6.
Frequency of various compositions of XAI methods’ scope and application in the included studies, categorized by function. Note that some XAI methods served multiple functions and were used in multiple studies, hence the total counts in this figure exceed the number of studies and XAI methods listed previously.
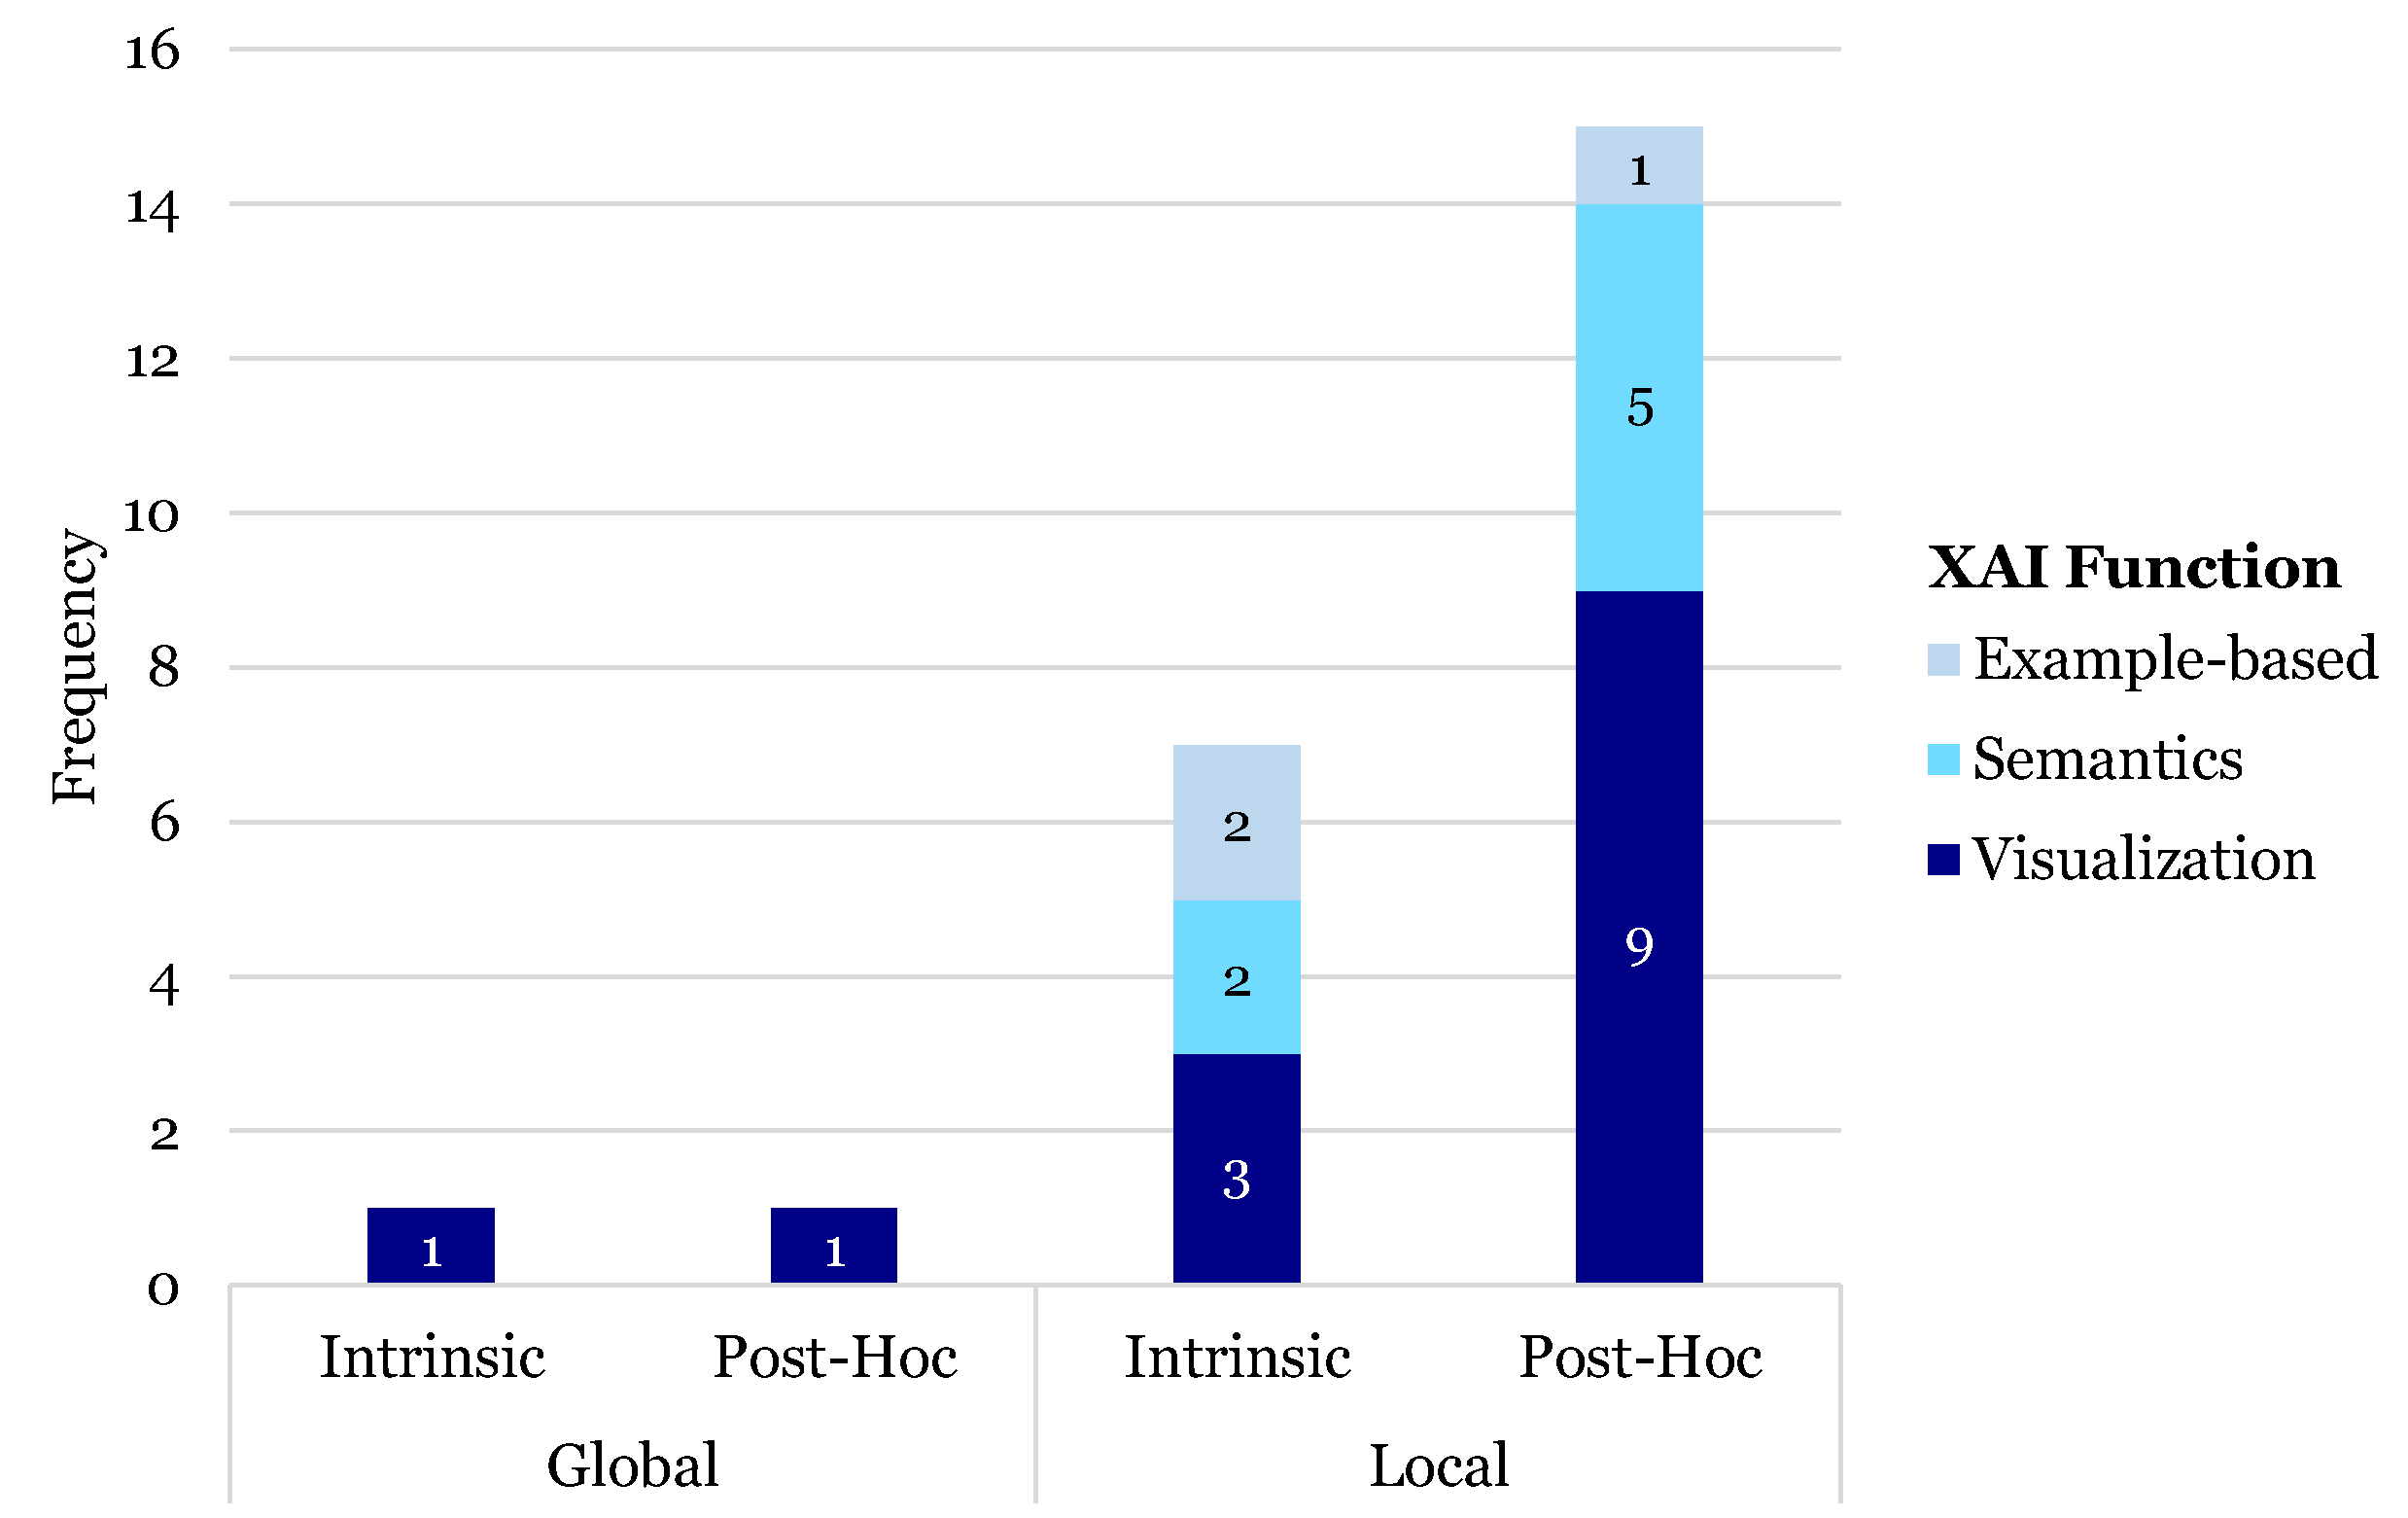
Figure 7.
Division of XAI method’s functions.
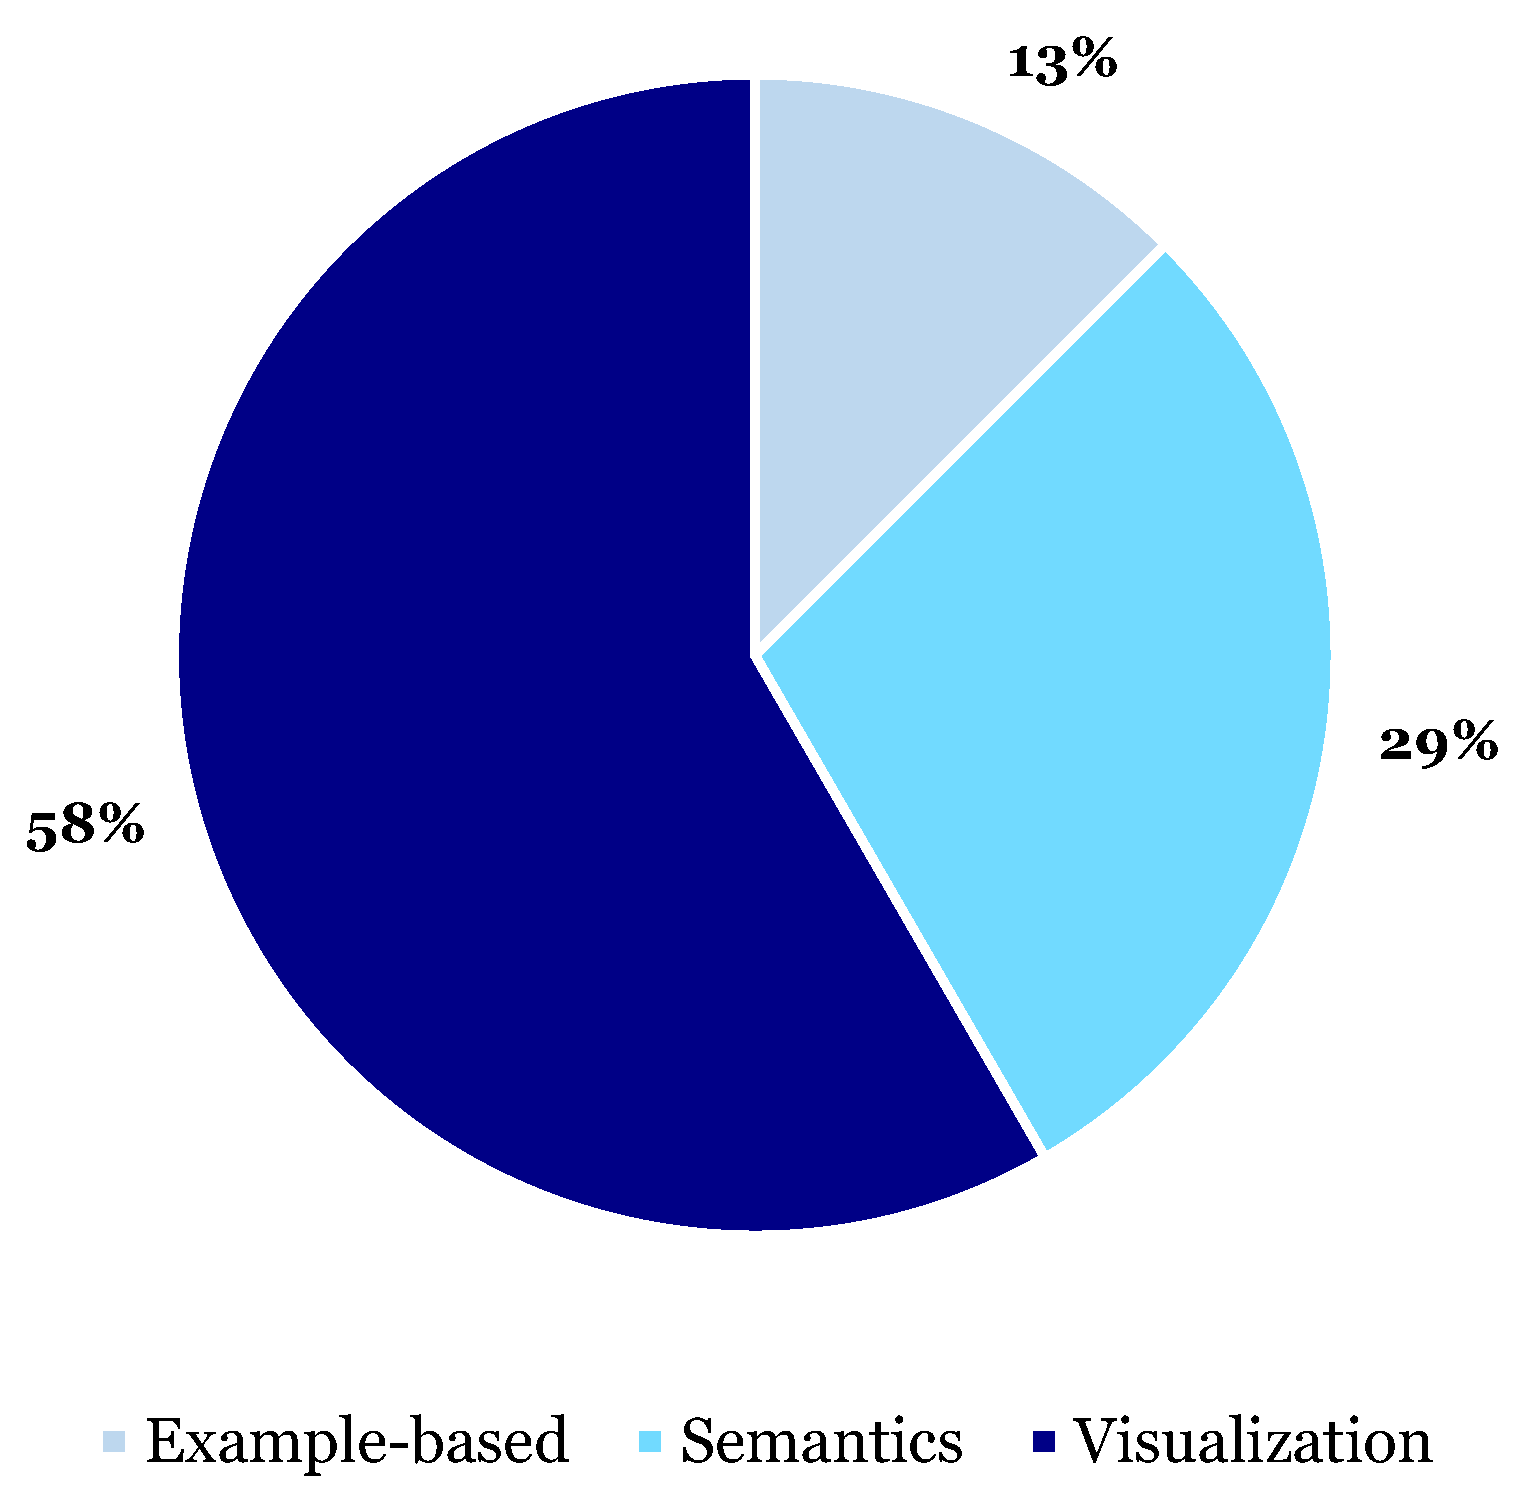
Figure 8.
Frequency of identified XAI functions in the included studies, categorized by image analysis task. Note that some XAI methods served multiple functions and were used in multiple studies, hence the total counts in this figure exceed the number of studies and XAI methods listed previously.
Figure 8.
Frequency of identified XAI functions in the included studies, categorized by image analysis task. Note that some XAI methods served multiple functions and were used in multiple studies, hence the total counts in this figure exceed the number of studies and XAI methods listed previously.
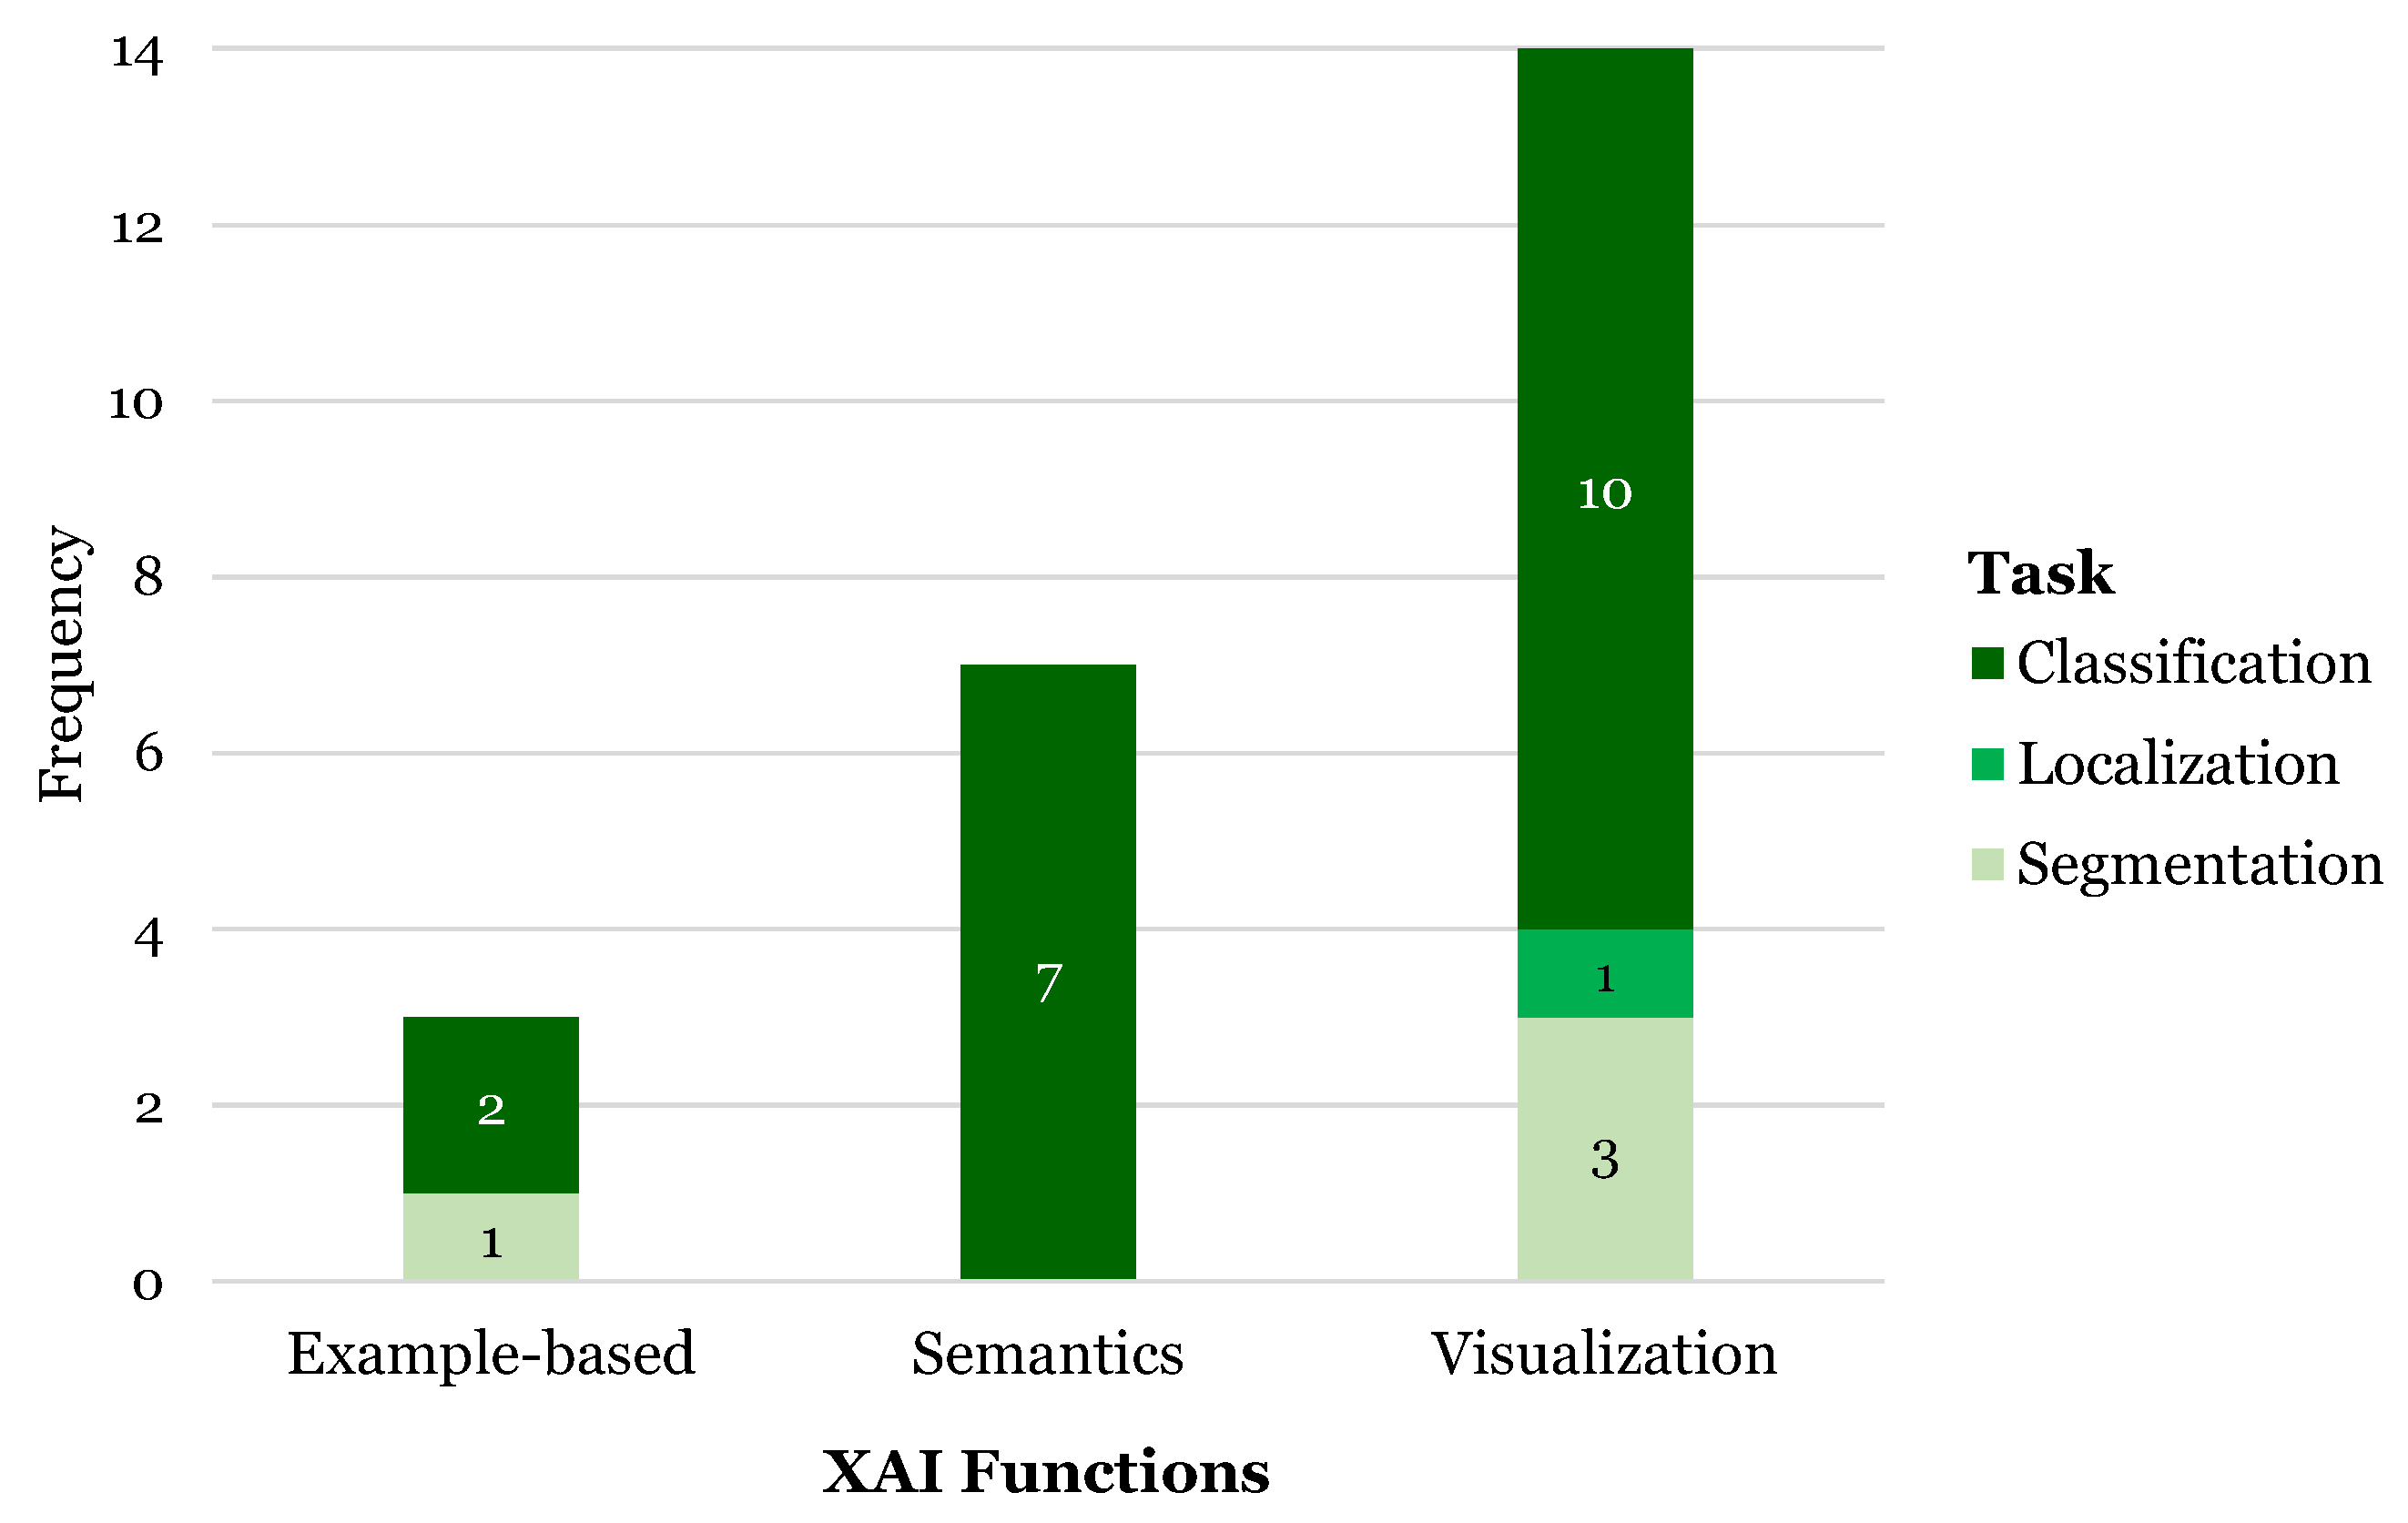
Figure 9.
Visualization examples for GIST, leiomyoma and pancreatic rest tumors with the Grad-CAM plots generated by different methods reflecting the decision basis of different models. The first column presents the original US image. The 2nd column shows the expert annotations. The 3rd-6th columns present the generated Grad-CAM saliency maps using a baseline model, a Multi-Attribute Guided Network (MAG), a contextual attention network (CA) and a combined MAG-CA network. Adapted from Zheng et al. (2024) [53], with permission from Elsevier.
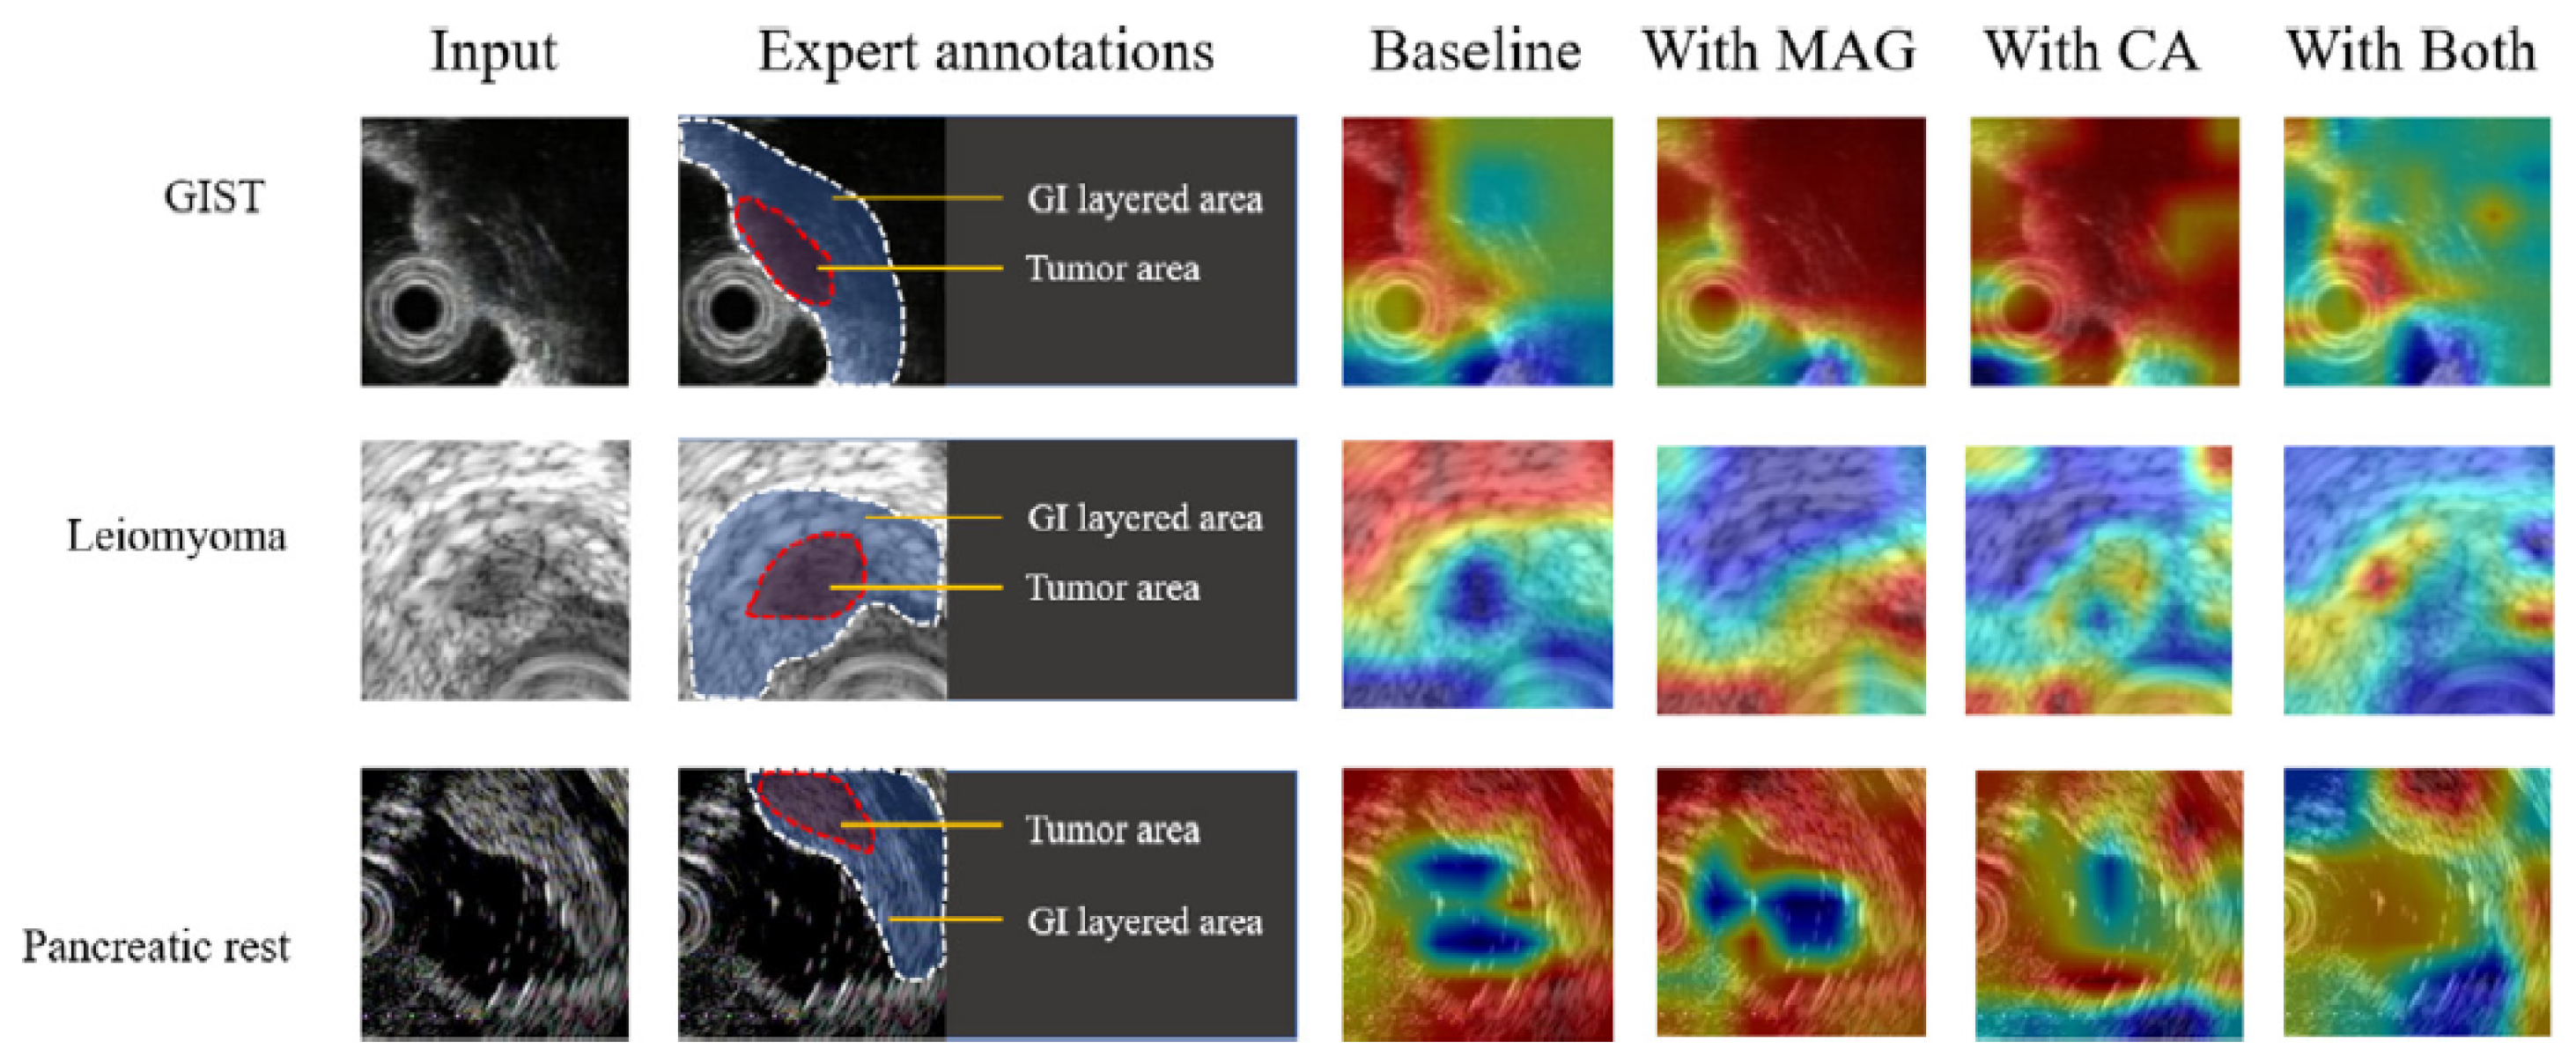
Figure 10.
Input of the (a) original input image and (b) radiologist highlighted region of hypoechoic lesion with mixed echogenicity prostate for malignant case, compared to the resultant (c) simulated image by LIME which initially locates the regions that could be worth of investigation given the input image and (d) the final generated image by LIME explaining why the case was classified as malignant. Adapted from Hassan et al. (2022) [42], with permission from Elsevier.
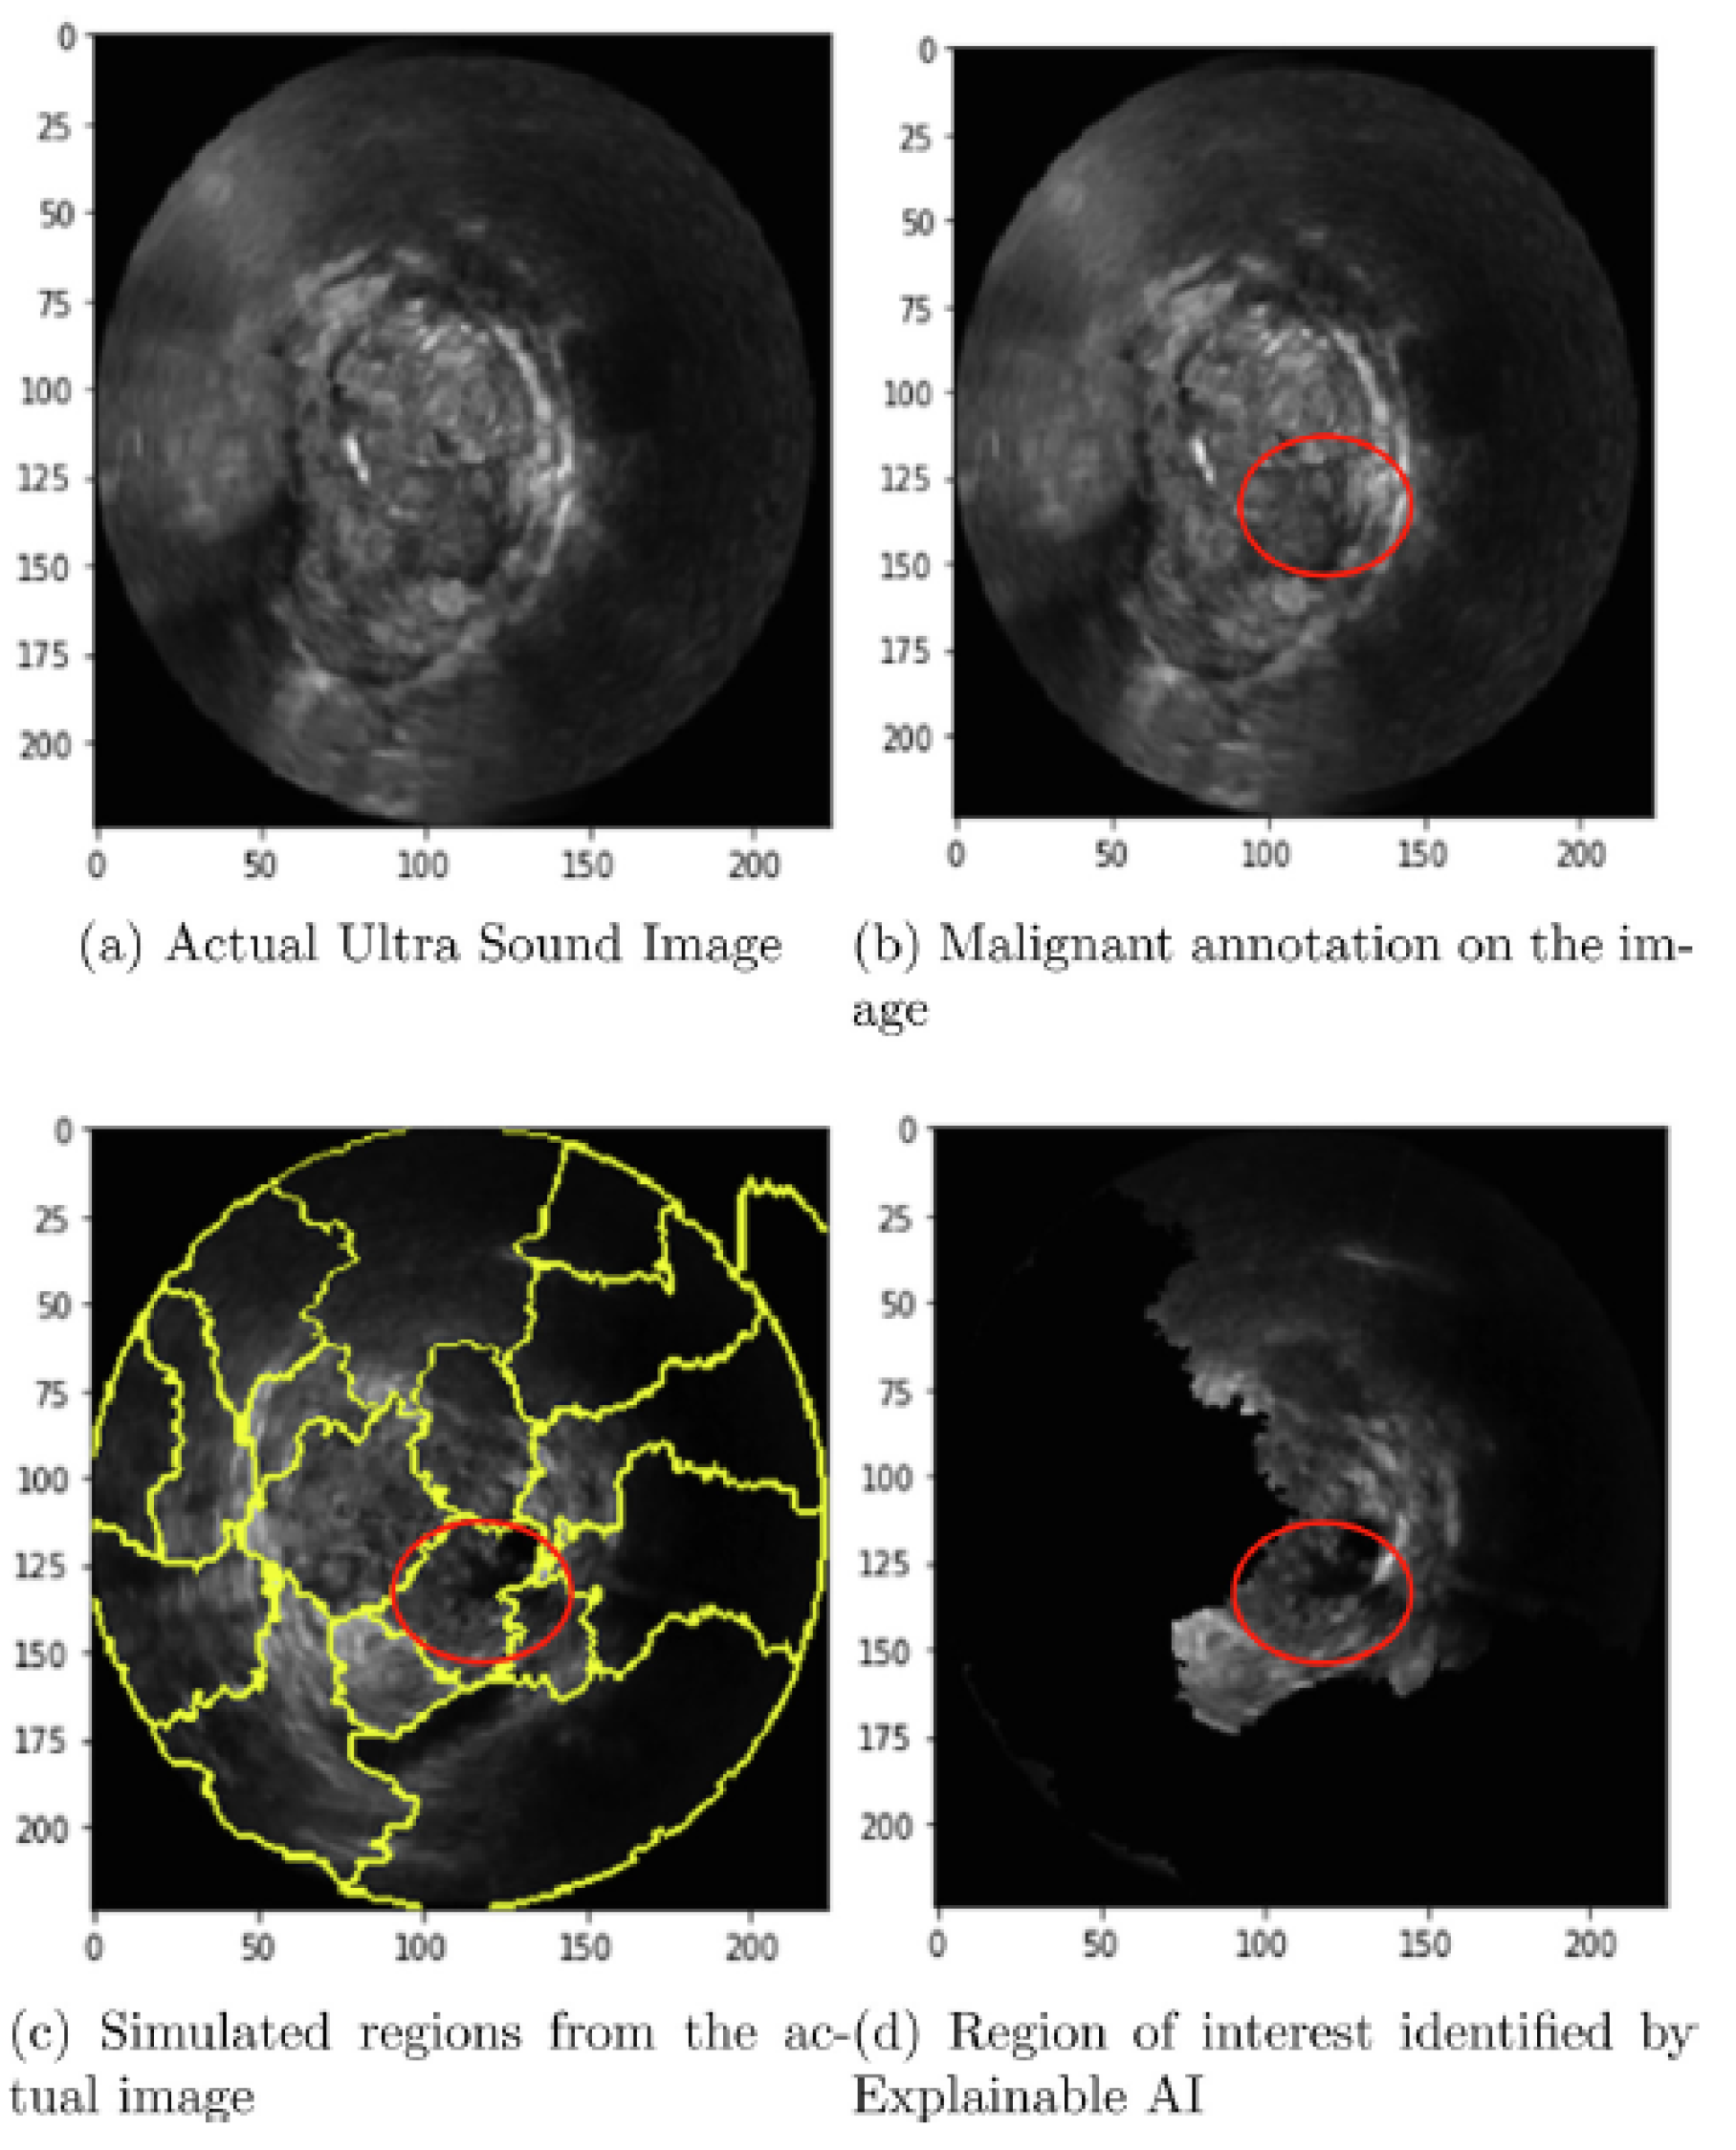
Figure 11.
Generation of the ROI and the local patches from the images using the global features. (a) The original image to be used as the input for the global branch. (b) The generated Activation heat map of the features. (c) The binarized heat map and the bounding box spanning it. (d) The cropped local patch to be used as the input to the local branch. Adapted from Basu et al. (2023) [38], with permission from Elsevier.
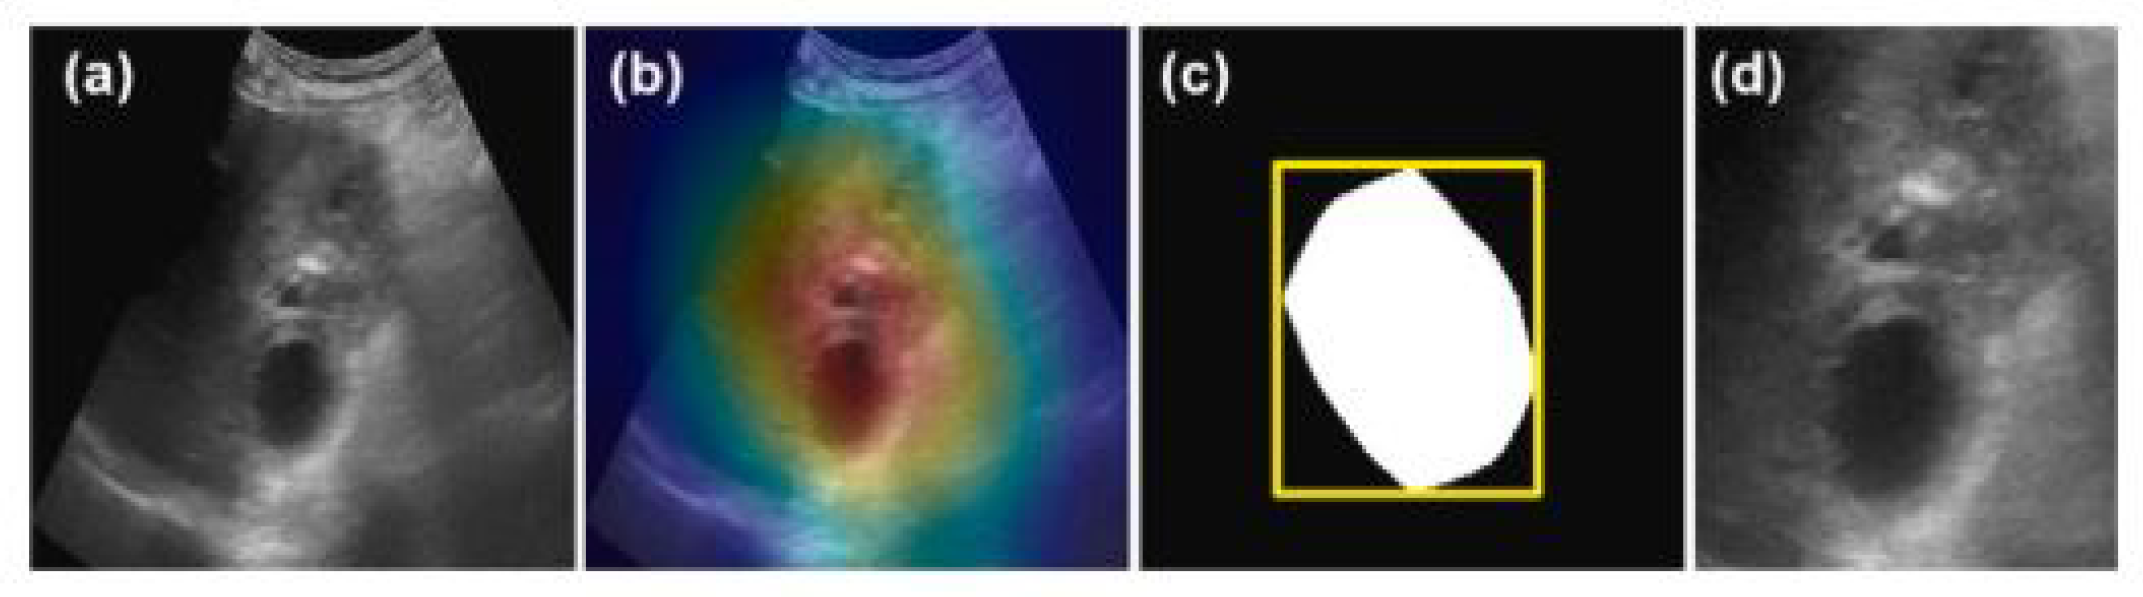
Figure 12.
SHAP explanation example: Results of a malignant case in breast ultrasound images in which the trained ensemble model can be analyzed to provide explainable decision paths within a series of decision trees. In each tree classifier, orange arrows indicate the decision path. The model compares the texture features from the input image (represented by orange numbers at the bottom of each dashed box) with the learned thresholds (indicated by black triangles on each histogram) at each node of the decision tree. Adapted from Rezazadeh et al. (2022) [48] Licensee MDPI, Basel, Switzerland. This article is an open access article distributed under the terms and conditions of the Creative Commons Attribution (CC BY) license.
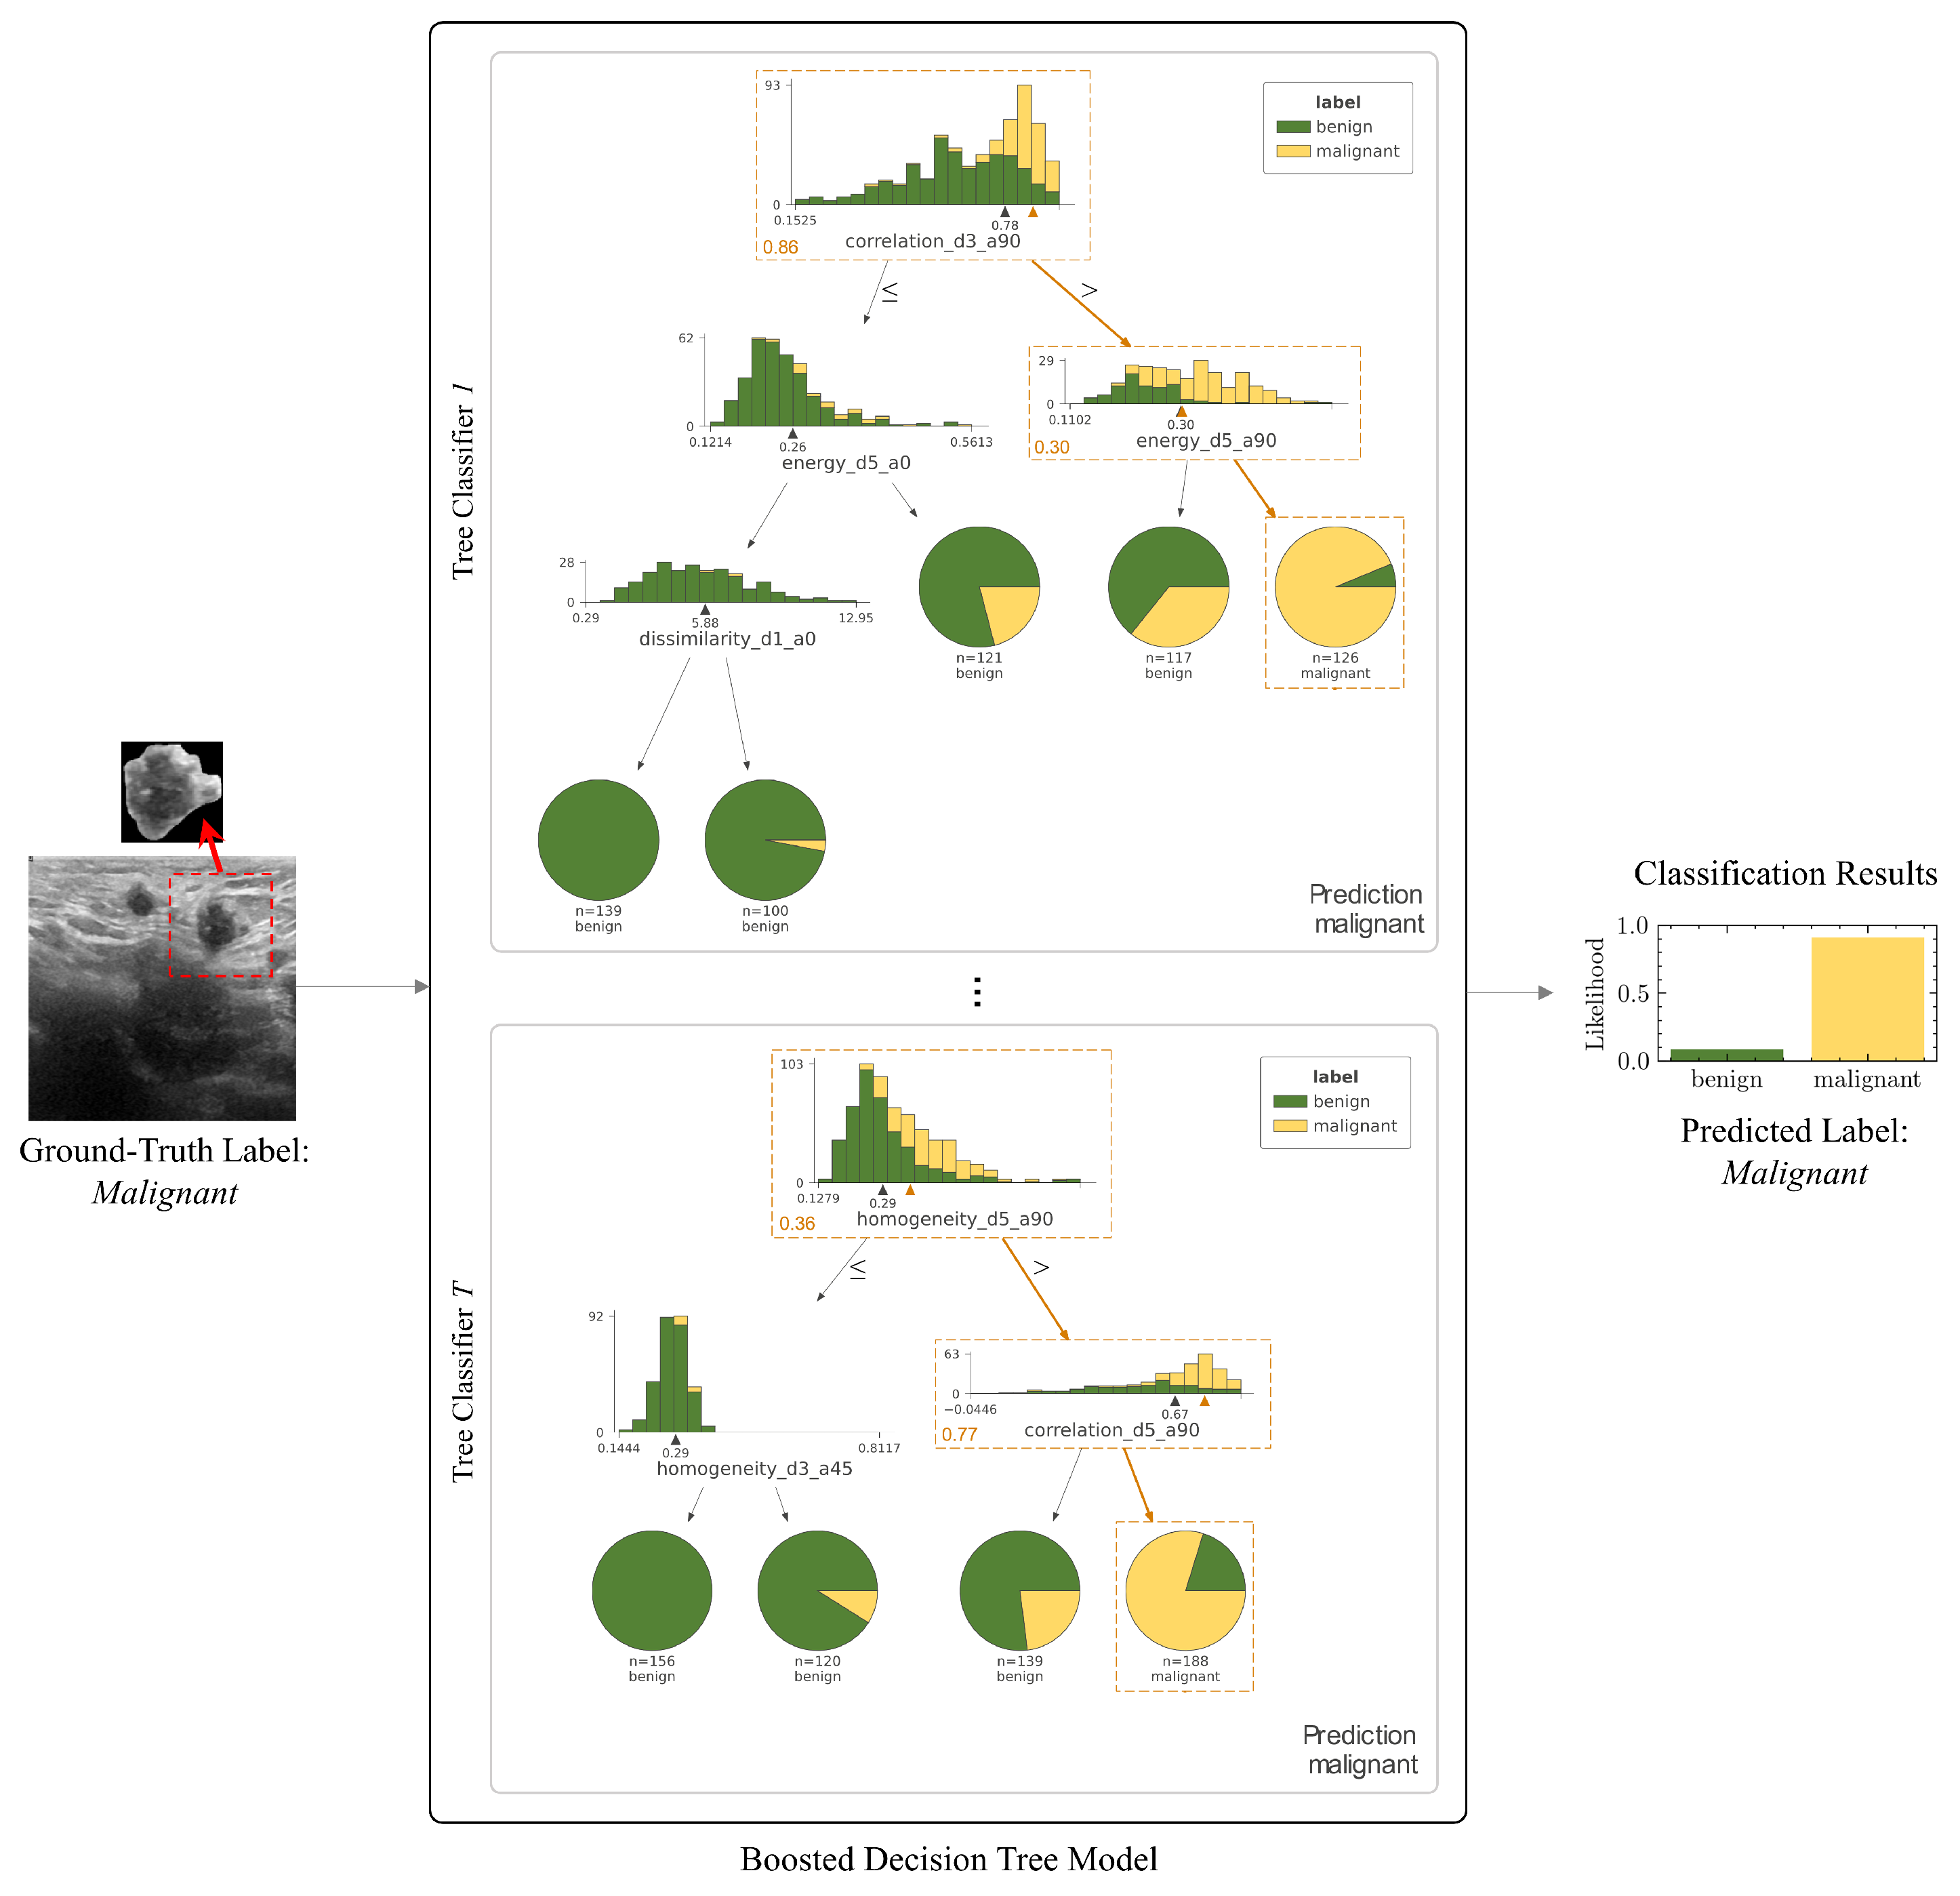
Figure 13.
US images presenting benign (left) and malignant (right) breast masses and the corresponding CAM-generated saliency maps pointing out the three pre-determined regions in US images. The white cross indicates the extreme activation value of CAM responsible for the particular pointing game result. Adapted from Byra et al. (2022) [39], an open-access article distributed under the terms of the Creative Commons Attribution-NonCommercial-NoDerivatives License (CC BY-NC-ND).
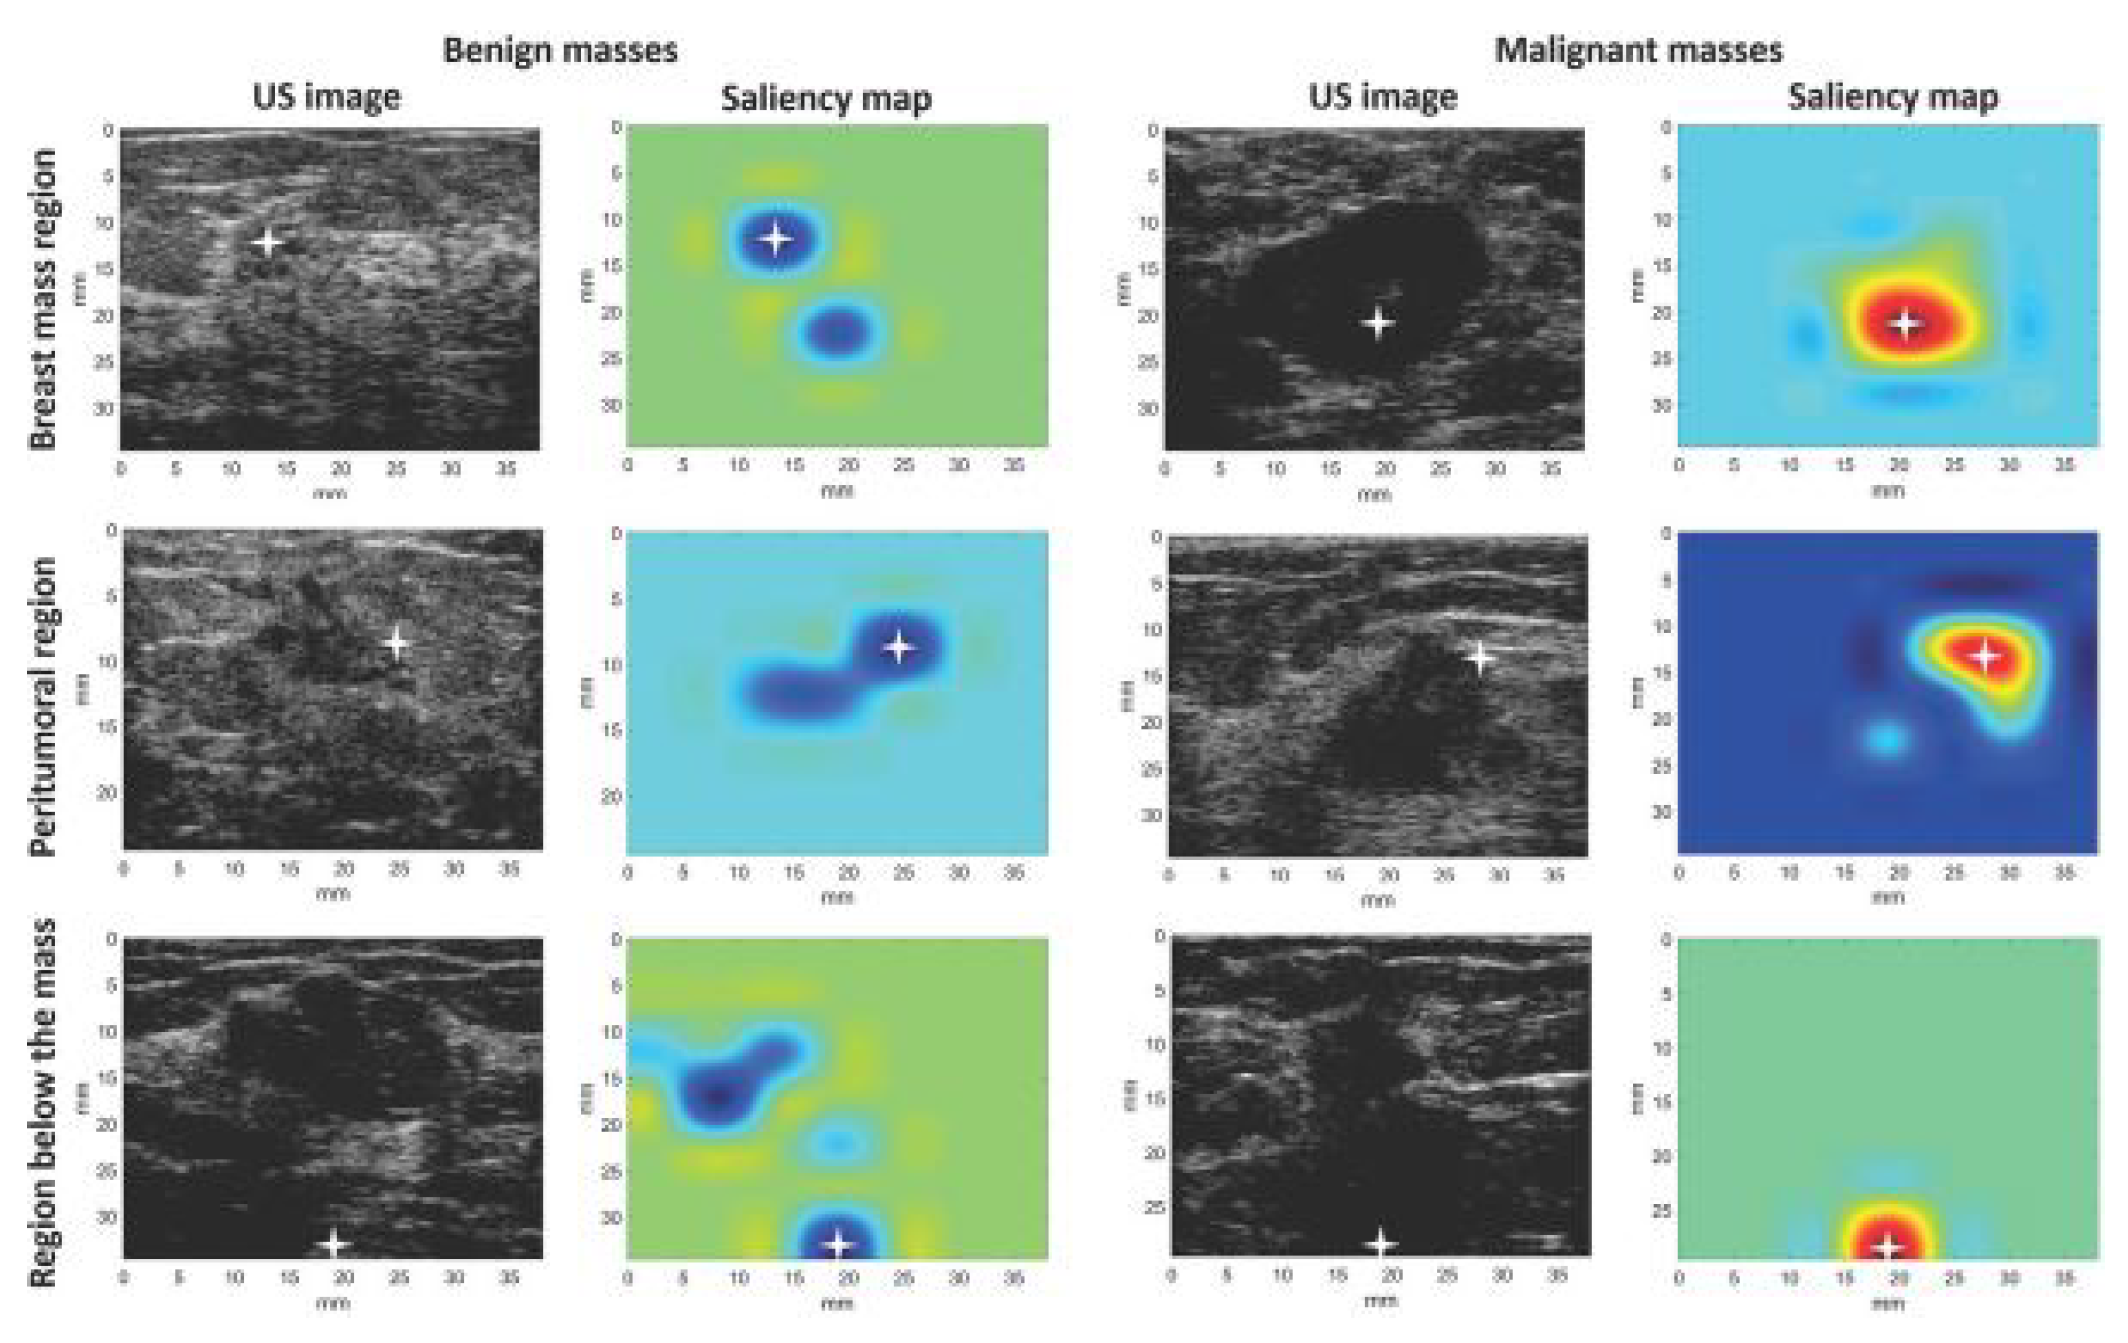
Table 1.
General characteristics of included studies
| Author (year) | Cancer Type | Clinical Application | Study Type | Imaging | Acquisition Type | Dataset | Total Patients (Lesions) | Total Images | Healthy Images (%) | Benign Images (%) | Malignant Images (%) |
|---|---|---|---|---|---|---|---|---|---|---|---|
| Al-Jebrni A.H. (2023) [37] | Thyroid | Diagnosis | R | US | Continuous | STNU | 1810 (2068) | 4136 | - | 1884 (45.6%) | 2252 (54.4%) |
| lightgrayBasu S. (2023) [38] | Gallbladder | Diagnosis | R | US | Single shot | GBUS | 218 (147) | 1255 | 432 (34.4%) | 558 (44.5%) | 265 (21.1%) |
| Byra, M. (2022) [39] | Breast | Diagnosis | R | US | Single shot | Clinical | NA (272) | 272 | - | 149 (54.8%) | 123 (45.2%) |
| Dong, F. (2021) [40] | Breast | Diagnosis | R | US | Continuous | Clinical | 367 (785) | 579 | - | 247 (42.7%) | 332 (57.3%) |
| Han, X. (2022) [41] | Thyroid | Diagnosis | P | US | Single Continuous | Clinical | 3906 (3906) | 3906 | - | 1696 (43.4%) | 2210 (56.6%) |
| Hassan, M. R. (2022) [42] | Prostate | Diagnosis | R | US + MRI | Continuous (US) + Static slice (MRI) | Cancer Imaging Archive | 1151 (NA) | 611119 | - | NA | NA |
| Karimzadeh, M. (2023) [43] | Breast | Screening | R | US | Continuous | BUSI, BUSIS, HMSS | NA (2917) | 2186 | - | NA | NA |
| Lombardi, A. (2023) [44] | Leiomyogenic | Surgery (pre-operative) | R | US | Continuous, 3D volume scan | Clinical | 68 (68) | 68 | - | 60 (88.2%) | 8 (11.8%) |
| Martizzi, D. (2021) [45] | Breast | Screening | P | US | 3D volume scan | Clinical | 70 (60) | 70 | 10 (14.3%) | 41 (58.6%) | 19 (27.1%) |
| Morris, J. (2023) [46] | Thyroid | Diagnosis | R | US | Continuous | Clinical | 307 (831) | 831 | - | NA | NA |
| Qian, X. (2021) [47] | Breast | Screening | P | US | Continuous | Clinical | 634 (721) | 10815 | - | NA | NA |
| Rezazadeh, A. (2022) [48] | Breast | Diagnosis | R | US | Continuous | Public | 600 (697) | 780 | 133 (17.1%) | 210 (26.9%) | 487 (62.4%) |
| Song, D. (2023) [49] | Thyroid | Screening | R | US | Single shot | Clinical | 7236 (19341) | 19341 | - | 12943 (66.9%) | 6398 (33.1%) |
| Tasnim, J. (2024) [50] | Breast | Diagnosis | R | US | Continuous | BUSI, Mendeley, UDIAT, OMI, BUET-BUSD | NA (1494) | 1494 | - | 901 (60.3%) | 593 (39.7%) |
| Thomas, J. (2020) [51] | Thyroid | Surgery (pre-operative) | R | US | Continuous | Clinical | 402 (482) | 2025 | - | NA | NA |
| Zhang, B. (2021) [52] | Breast | Diagnosis | R | US | Continuous | BUSI, BUSIS | NA (1192) | 1192 | - | 727 (61.0%) | 465 (39.0%) |
| Zheng, H. (2024) [53] | Gastrointestinal stromal tumors | Diagnosis | R | US | Continuous | Clinical | 261 (261) | 1900 | - | - | 1900 (100%) |
= Not Available, P = Prospective, R = Retrospective, = Ultrasound, = Magnetic Resonance Imaging
Table 2.
Properties of AI models for classification
| Classification (n=16) | ||||||
|---|---|---|---|---|---|---|
| Author (year) | Architecture | Task | Ground Truth | Accuracy | AUROC | Other Performance |
| Al-Jebrni, A.H. (2023) [37] | Inception-V3 | Tumor class benign or malignant | Clinical diagnosis | 0.874 | 0.905 | Sens 0.895, Spec 0.858 |
| lightgrayBasu, S. (2023)* [38] | BagNets33 | Tumor class benign or malignant (local-level) | Histopathology + Radiologist assigned lexicons | 0.921 | 0.971 | Sens 0.923, Spec 0.961 |
| Byra, M. (2022) [39] | ResNet | Tumor class benign or malignant | Pathology | 0.887 | 0.835 | Sens 0.801, Spec 0.868 |
| Dong, F. (2021) [40] | DenseNet-121 | Tumor class benign or malignant | Histopathology | 0.884 | 0.899 | Sens 0.879, Spec 0.892 |
| Han, X. (2022) [41] | DenseNets + SGE attention module | TI-RADS risk level (multi-class) & | Clinical diagnosis | 0.780 (w) | - | MAE 1.30 |
| Tumor class benign or malignant | Histopathology | 0.954 | 0.981 | Sens 0.988, Spec 0.912, PPV 0.928, NPV 0.985 | ||
| Hassan, M. R. (2022) [42] | VGG-16 + Random Forest | Tumor class benign or malignant | Radiologist manual annotation | 0.875 | - | - |
| Karimzadeh, M. (2023)* [43] | VGG-16 | BI-RADS risk level (multi-class) & | Clinical diagnosis | 0.852 (w) | - | - |
| Tumor class benign or malignant | Clinical diagnosis | 0.913 | - | Sens 0.940, Spec 0.858 | ||
| Lombardi, A. (2023) [44] | XGBoost | Tumor class benign or malignant | Clinical diagnosis | - | 0.994 | Sens 0.875, Spec 0.983, F1-score 0.875, Brier score 0.0187 |
| Morris, J. (2023) [46] | Local texture quantization | TI-RADS risk level (multi-class) | Clinical diagnosis | >0.80 | - | - |
| Qian, X. (2021) [47] | ResNet-18 + SENet | BI-RADS risk level (multi-class) | Histopathology | - | 0.955 | - |
| Rezazadeh, A. (2022) [48] | LightGBM | Tumor class benign or malignant | Clinical diagnosis | 0.91 | 0.93 | Prec 0.94, Rec 0.93, F1-score 0.93 |
| Song, D. (2023) [49] | DenseNet-121 | Tumor class benign or malignant | Pathology / Clinical diagnosis | NA | - | - |
| Tasnim, J. (2024) [50] | ResNet-18 + InceptionV3 | Tumor class benign or malignant | Clinical diagnosis | 0.915 | 0.952 | Sens 0.894, Spec 0.929, F1-score 0.893, MCC 0.824 |
| Thomas, J. (2020) [51] | ResNet 34 | Tumor class benign or malignant | Histopathology | 0.777 | - | Sens 0.849, Spec 0.743, PPV 0.609, NPV 0.912 |
| Zhang, B. (2021) [52] | VGG-16 | BI-RADS risk level (multi-class) & | Clinical diagnosis | 0.843 (w) | - | - |
| Tumor class benign or malignant & | Clinical diagnosis | 0.889 | - | Sens 0.838, Spec 0.923 | ||
| Likelihood of malignancy | Clinical diagnosis | - | - | R2 0.671, MSE 0.153 | ||
| Zheng, H. (2024) [53] | VGG-16 | Tumor class benign or malignant | Pathology | 0.932 | - | Prec 0.932, Rec 0.932, F1-score 0.932 |
* = Study with AI model encompassing multiple tasks, = Not Available, = weighted score, = Area Under the Receiver-Operator Curve, = Sensitivity, = Specificity, = Mean absolute error, = positive predictive value, = negative predictive value, = Matthew’s correlation coefficient, = Recall, = mean squared error
Table 3.
Properties of AI models for segmentation and localization
| Segmentation (n=2) | ||||
|---|---|---|---|---|
| Author (year) | Architecture | Task | Ground Truth | Performance |
| Karimzadeh, M. (2023)* [43] | U-Net | Lesion mask | NA | DSC 0.827 |
| lightgrayMartizzi, D. (2021) [45] | Gaussian Mixture Models + Blob detection | ROI mask | Radiologist manual annotation of ROI | Recall 0.83 (benign) Recall 0.95 (malignant) |
| Localization (n=1) | ||||
| Author (year) | Architecture | Task | Ground Truth | Performance |
| Basu, S. (2023)* [38] | ResNet-50 | ROI identification (global-level) | Radiologist bounding box annotation | Mean IoU 0.484 Mean Intersection 0.934 |
* = Study with AI model encompassing multiple tasks, = Not Available, = Dice Similarity Coefficient, = Intersection over Union
Table 4.
Characteristics of identified XAI methods
| XAI Method | Model Specific | Scope | Explanation | AI Task | XAI Function | XAI Input | XAI Output | Analysis Type | Evaluation |
|---|---|---|---|---|---|---|---|---|---|
| Activation heat map [38] | No | Global | Intrinsic | Localization | Visualization | Images | Heat map with top activated image features | Visual inspection | QL |
| lightgrayActivation Maximization [50] | CNNs | Global | Post-hoc | Classification | Visualization | Feature maps | Activation maximizing output image patterns | Visual inspection, ZNCC score | QL, QT |
| Bag-of-Features [38] | Transformers | Local | Intrinsic | Classification | Semantics | ROI in US images | Most discriminative features for class prediction | Features mapped to radiological lexicon | QL |
| BI-RADS-Net [52] | MTL using CNNs | Local | Intrinsic | Classification | Semantics, Example based | Breast US images + feature maps | Predicted class probability + morphological feature explanations | Accuracy, Sensitivity and Specificity | QT |
| CAM [39,50] | CNNs | Local | Post-hoc | Classification | Visualization | Images | Saliency map | Visual inspection, Pointing game | QL, QT |
| Explainer [49] | CNNs | Local | Intrinsic | Classification | Visualization | Images + convoluted feature maps | Features the model uses to make the predictions | Visual inspection, Accuracy, Precision, Sensitivity, Specificity, F1-score, AUROC | QL, QT |
| Grad-CAM [37,41,47,49,53] | CNNs | Local | Post-hoc | Classification (n=6), Segmentation (n=1) | Visualization | Images | Saliency map | Visual inspection | QL |
| Image similarity AIBx [51]) | CNNs | Local | Post-hoc | Classification | Semantics, Example based | Images | Most similar images in database with known diagnoses | Confusion matrix | QT |
| LIME [42] | No | Local | Post-hoc | Classification | Visualization | Images | ROI identified | Visual inspection | QL |
| LTQ-E [46] | No | Local | Post-hoc | Classification | Semantics | US image + Embedded decision label model | Predicted class + morphological feature explanations | Accuracy | QT |
| MT-BI-RADS [43] | MTL using CNNs | Local | Intrinsic | Segmentation | Visualization | Breast US images | Tumor mask | Visual inspection, DSC | QL, QT |
| Region of Evidence (ROE) [40] | CNNs | Local | Post-hoc | Classification | Visualization | Images | Saliency map + Resemblance vote by expert physicians | Confusion matrix + breakdown in resemblance votes | QT |
| SHAP [43,44,48] | No | Local | Post-hoc | Classification | Semantics | Image + feature map | Significance (Shapley) value per feature | Shapley values, Confusion matrix | QL, QT |
| XNML [45] | PRISMTM platform (ML) | Local | Intrinsic | Segmentation | Visualization, Example based | 3D Quantitative Transmission US speed-of-sound maps | Color-coded segmentations | Visual inspection | QL |
= Qualitative, = Quantitative, = Multi-Task Learning
Disclaimer/Publisher’s Note: The statements, opinions and data contained in all publications are solely those of the individual author(s) and contributor(s) and not of MDPI and/or the editor(s). MDPI and/or the editor(s) disclaim responsibility for any injury to people or property resulting from any ideas, methods, instructions or products referred to in the content. |
© 2024 by the authors. Licensee MDPI, Basel, Switzerland. This article is an open access article distributed under the terms and conditions of the Creative Commons Attribution (CC BY) license (http://creativecommons.org/licenses/by/4.0/).
Copyright: This open access article is published under a Creative Commons CC BY 4.0 license, which permit the free download, distribution, and reuse, provided that the author and preprint are cited in any reuse.


