Submitted:
28 June 2024
Posted:
01 July 2024
Read the latest preprint version here
Abstract
The fixed offshore platforms in Mexico produce approximately 1.90 million barrels of oil daily, valued at about 1.5 million dollars, positioning Mexico as a significant oil-producing nation globally. Ensuring the structural integrity of these platforms is highly complex due to various factors, including operational loads, meteorological conditions, extreme storms, seismic activity, and fatigue in tubular joints. Consequently, in situ studies have been conducted, focusing on operational analysis, static storm conditions, dynamic seismic strength, ductility, ultimate wave resistance, and spectral fatigue analysis. These six analyses (three linear, two nonlinear, and one spectral fatigue) provide insights into the structural behavior under different loading conditions and allow evaluation against current standards to conclude their structural integrity. The results obtained confirm that the structural integrity is adequate, as they meet current regulations and standards.
Keywords:
Jacket-type offshore platform
; Structural integrity
; Linear analysis
; Nonlinear analysis
; Spectral fatigue
1. Introduction
The major function of the fixed offshore platforms in the Gulf of Mexico is the extraction of hydrocarbons, producing about 1.9 million barrels of oil daily [1]. These production volumes place Mexico as one of the most important oil-producing countries in the world; crude oil exports reach 1.2 million barrels per day [2], with a value of 1,459 million dollars [3].
The country of Mexico was facing a drop in its oil production, it was in 2019 that it stopped it and within the framework of the General Strategy for Exploration and Production of oil and gas, Pemex set a goal to reach a production of 2.65 million barrels per day by 2024, for which, from 2019 to 2024 it is estimated to drill around 500 wells, build over 100 offshore production platforms and install over four thousand kilometers of pipelines, generating around 47 thousand jobs on average per year [4]. Under the need to increase current hydrocarbon production, it is necessary to install new drilling platforms, both in existing and future fields. As regards civil engineering, the design and construction of structures on which exploitation and production works can be carried out has been one of the major problems to be solved, under the premise of economy and safety.
The analysis, design and construction of offshore platforms is a very demanding and specialized task for a civil engineer, these structures, being in the sea, face difficult loads such as hurricanes (16 mts waves), earthquakes, drilling equipment loads (5,000 ton), hydrostatic collapse of the elements because of hydrostatic pressure and fatigue in tubular joints produced by the waves over the years, making it a difficult problem to solve; In view of the need of Mexico and the world to continue installing such structures at sea, currently in the literature there are books such as Ageing and Life Extension of Offshore Structures [5]. In previous discussions introducing new physical concepts such as the analysis and design of offshore platforms, we aimed to outline the key characteristics of the equations used to mathematically formulate these ideas, referencing works [6, 7, 8, 9, 10, 11, 12, 13, 14, 15, 16, 17, 18, 19, and 20] only briefly.
In Mexico, there are currently no works that show as an example how the structural behavior changes during different load stresses before storm events such as hurricanes, earthquakes and fatigue, using a drilling platform with a 50-meter water depth.
Therefore, the main contribution is to propose a method for performing the six on-site analyzes (static operation and storm analysis, dynamic storm analysis, strength level seismic analysis, ductility level seismic analysis, ultimate wave resistance analysis and spectral fatigue analysis) aimed at determining the structural integrity of jacket-type fixed offshore drilling platforms installed in Mexican waters [21].
Getting the results allowed us to know at all times the structural behavior of the platform during the different load cases to compare it with the current regulations, observing that the established parameters and factors were always met, in order to determine that the platform complies with the structural integrity, i.e., it does not represent a risk to people and equipment, therefore it is reliable to operate during its useful life.
The rest of the paper is organized as follows; a brief literature review is given in section 2; and in section 3, we provide the description of the problem and the methodology formulations. Section 4 presents results and discussion of the main results. Finally, section 5 presents our conclusions and outlines future work.
1. Related Works
The structural integrity of offshore jacket structures has been extensively studied, with numerous papers highlighting that the concept is more complex than initially assumed. Key challenges identified include the nonlinearity effects in structural integrity monitoring methods for offshore jacket-type structures, specifically those based on principal component analysis. To address this, a stochastic autoregressive moving average with exogenous input (ARMAX) model was employed [22]. Additionally, the stress concentration factors (SCFs) induced by out-of-plane bending loads in ring-stiffened tubular KT-joints of jacket structures have been examined, leading to the development of a new set of SCF parametric formulas for the fatigue design of ring-stiffened KT-joints under such loads [23,24]. In ship structural integrity, new stiffened plates were introduced with the aim of enhancing the strength-to-weight ratio [25]. For indirect damage detection in jacket-type offshore platforms, using the rate of signal energy via wavelet packet transform has proven effective in accurately predicting damage location [26]. Furthermore, a proposed time-domain fatigue analysis method, when compared to spectral fatigue assessment, has demonstrated that analyzing only a limited number of sea states is necessary to achieve an accurate solution for an offshore jacket structure [27]. Lastly, the Damage Submatrices Method, which focuses on stiffness degradation, has been applied to detect damage in offshore jacket platforms with limited modal information, successfully identifying damaged elements [28].
Another reported approach involves assessing the structural integrity of aging offshore jacket structures for life extension, offering recommendations for simulating structural degradation, loading history, and fatigue strength for corroded components [29]. Some researchers suggest conducting parametric studies on the structural behavior of tubular K-joints under axial loading at fire-induced elevated temperatures through nonlinear regression analyses to determine the ultimate strength of K-joints under balanced axial loads at such temperatures [30].
In addition, a wave analysis framework has been proposed for the probabilistic assessment of structural integrity in offshore platforms. This framework incorporates uncertainties in the nonlinear dynamic time-domain modeling of the structure [31]. A large-scale wave slam experiment has also been performed to develop a global slamming force model for offshore wind jacket structures, using data collected under various wave conditions [32].
Regarding regulations, a review of risk-based structural integrity management for offshore jacket platforms has been conducted in line with international standards [33]. For conceptual design, an arrangement of braces in jacket platforms based on strength and ductility has been proposed, highlighting the importance of the initial design stage [34]. Additionally, repair systems for grouted connections in offshore structures have been proposed, with studies focusing on their development and experimental verification [35].
Data collected through a questionnaire from experts in the field identified three crucial factors influencing the inspection of fixed offshore platforms: environmental conditions, structural design, and anomalies/defects. The significance of each factor varies according to the respondents' perspectives [47].
Furthermore, researchers have emphasized the importance of renewable energy sources and the necessity of well-designed offshore structures to mitigate environmental damage. This includes the application of various offshore platforms in oil and gas exploration, wind energy generation, and other industries [46].
Several studies have been conducted to address structural integrity issues in offshore environments, contributing to solutions for these complex challenges [36,37,38,39]. However, the literature review reveals a gap: no studies have specifically addressed the application of six types of analyses three linear, two nonlinear, and spectral fatigue to evaluate the structural integrity of jacket-type offshore platforms through on-site analysis.
2. Material and Methods
For the development of this work, previous research on the type of jacket type fixed offshore platforms and the current regulations applicable to the Gulf of Mexico has been carried out. In order to particularize the case study, a drilling platform has been considered, which will have a 50,400 m tie-back, with capacity to accommodate 12 conductors, which will be drilled with fixed equipment and will have two productions and drilling decks. The structural parts that make up the fixed offshore platforms are piles, jacket and topside. The main loads are gravity and environmental, according to Figure 1.
The environmental loads depend on the meteorological and oceanographic conditions of each region, the most representative are waves, currents and wind, the characteristics of the loads are based on the guidelines proposed by the API RP 2A-WSD 22 ed [40] and will be complemented with the environmental parameters established in the Pemex technical specification "P.2.0130.01- 2015" [41], the loads generated are static forces acting on the structure and are applied in eight directions at every 45.0°, below are the environmental parameters for the Operation and Storm condition and Ultimate Surge Resistance, as illustrated in Table 1.
The background of the values in Table 2 includes the selection of the corresponding stream function, which is generally assumed according to the stream function defined by Equation 1,
where N is the order of the stream function and k is the wave number.
For regular stream function theory, the input is simply the wave height, period and water depth as with other wave theories. For irregular stream function theory, the free surface profile for one cycle of the wave becomes a constraint as well.
Particular solutions involve solving equation (1) for the cases of linear theory, applicable to scenarios such as steady-state wave analysis, fatigue analysis, regular and uniform wave conditions, floating and fixed structures where inertial effects dominate; second-order Stokes theory, recommended for analyzing tendons in TLP (Tension Leg Platform) structures; stream function theory or fifth-order Stokes theory, applicable for storm wave conditions. Additional aspects of particular solutions and applicability are discussed in API (2007), Fenton (1979), Atkins (1990), and Chakrabarti (2005). In order to choose the appropriate order of the stream function theory in a particular application, one should consult the data on fig. 5.3 (API, 2014).
Additional parameters, such as drag coefficients, blockage factors, marine growth and shape coefficients, were also considered in Table 2.
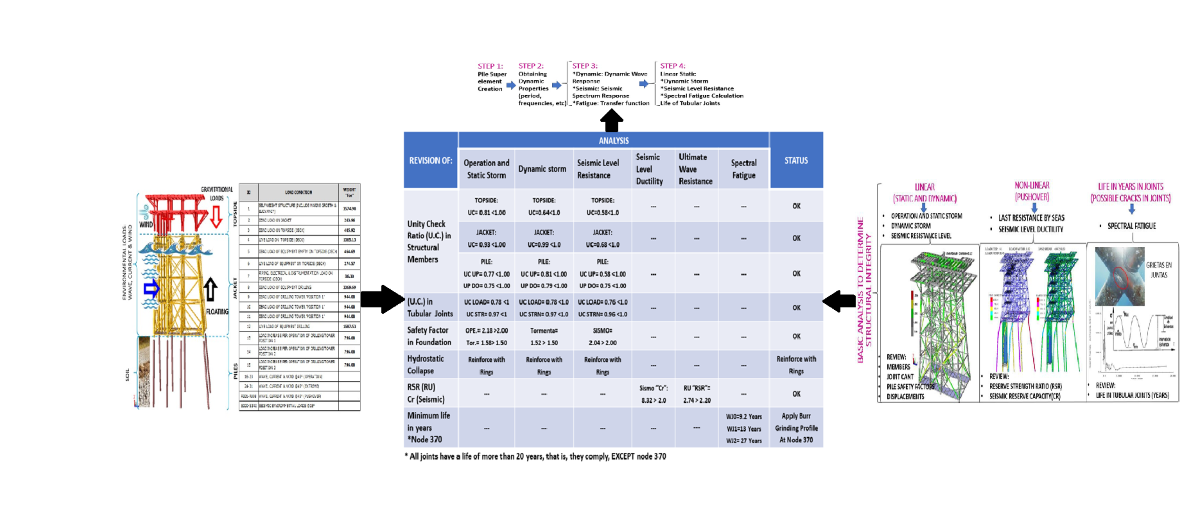
In order to determine the structural integrity, it is necessary to develop the six on-site analyzes, which can be categorized into 3 groups; 1st group Linear (operation and static storm, Dynamic storm, Earthquake Resistance Level), 2nd group Non-linear (Ultimate Surge Resistance, Earthquake Ductility Level) and 3rd group Spectral Fatigue, in agreement with Figure 2.
The operation and static storm analysis is performed in a single step, the dynamic storm, seismic resistance level and spectral fatigue analyzes follow a process of steps to get the results which are shown and described below, for the ultimate wave resistance and seismic ductility level analyzes are performed with the method known as pushover, are given in Figure 3 below.
Step "1" Linearization of the Foundation, (applies to dynamic storm, seismic resistance and fatigue): Since the analyzes are of the dynamic order performed in Sac's software, it is necessary that the soil-pile interaction be modeled linearly, even though in reality the soil-pile behavior is not; therefore, it is necessary to linearize the foundation. This is done by creating fictitious "super- elements" at the head of each pile, whose function is to describe the equivalent non-linear behavior of each pile head by a linear stiffness matrix. These matrices are got with the help of Sac's software.
Step "2" getting the Dynamic Properties (applies to dynamic storm, seismic resistance and fatigue): To calculate the dynamic properties of the structure, it is necessary to run a dynamic analysis in the Dynpac module of Sac's software; this module uses a set of master nodes with degrees of freedom (assigned by the user) to generate dynamic characteristics, including Eigen values (periods) and Eigen vectors (modal shapes), which are extracted using the standard Hogar-Givens extraction technique. However, the stiffness and mass matrix are reduced to master nodes using
the standard matrix condensation and Guyan reduction methods respectively, assuming that stiffness and mass are distributed similarly. All degrees of freedom that are non-inertial (no mass value) must be slave nodes. Master nodes have been established in the structural model, represented through 222000 which are at the intercepts of the alphabetic axes with the number of axes at each bracing level, which describe the configuration of the system with the masses concentrated at those points, it is worth mentioning that all stiffness and mass properties associated to the Slave nodes are included in the Eigen extraction procedure.
Step "3" Dynamic Storm Analysis, Wave Response: To get the dynamic response to the forces because of the velocity and acceleration of the water particles resulting from wave and current action, it is necessary to generate equivalent static loads that represent the forces on the structure because of fluid motion, including the relative motion between the platform, fluid and inertia. Although, these static loads are composed of hydrodynamic loads and inertia loads: The inertia loads are determined from the modal accelerations, while the hydrodynamic loads represent the acting forces of the fluid because of the movement of the fluid and the platform. It is worth mentioning that the equivalent loads are determined using the "equivalent static load" method through the "Wave Response" module of Sac's program, which produces a file with equivalent static loads for each of the wave and current incidences corresponding to the storm conditions used in the On-Site Analysis, which will be added to the gravity and wind loads for the elaboration of the final static analysis.
Step "4" Resistance Level, Spectral Modal Seismic Analysis: The dynamic response module of SACS calculates the dynamic responses of a structure subjected to dynamic excitation due to base motion as in an earthquake, generating the equivalent static seismic forces, for this case in 20 different directions every 18º. Therefore, it is possible to determine in which of them the greatest effects of the earthquake on the structure occur.
The Response Spectrum method was used, the design spectrum used is shown in the table below and was applied in both horizontal directions and the complete quadratic combination method (complete quadratic combination CQC) was used, to combine the modal responses and the square root of the sum of the squares SRSS; the spectrum will be applied simultaneously and complete for two horizontal orthogonal directions and at 50% for the vertical direction, the Pemex technical specification "P.2 .0130.01-2015" establishes that the Resistance Level Analysis shall be done with the loads got from the acceleration spectrum as described in Table 3.
Step "5" Spectral Fatigue Analysis, Transfer Functions: A transfer function defines the relationship between the stress range cycles and the wave height as a function of frequency (usually for a wave direction). The difference between the maximum and minimum stress, called the stress range, is determined for each cycle. For this case study, it was determined at every 22.5° of wave incidence, i.e., 18 directions are given in the following Figure 4.
The values of the transfer function are got by dividing the stress interval or amplitude by the wave height that produces it and represents the relationship between a sea state defined by a wave and its period, as well as the amplitude of stresses produced at the critical point.
For example, cyclic wind loading, its defined by a mechanical transfer function for each mode. The mechanical transfer function for any mode, H(f), defines the ratio of the range of cyclic stress as a function of the wind frequency and the mode natural frequency by (2).
where Ki is the generalized stiffness, fn is the natural frequency and c is the percent damping.
The transfer functions are calculated at every 22.5° and correspond to the total vectors of the oceanographic information in table C.9 (Areas as: May, Yum, Coastal) of the Pemex specification; it is necessary to generate the response of the structure to the wave loads for each direction. Then, 16 independent functions are needed, one in each direction, for which, the orientation of the structure regarding the North and regarding the X, Y coordinate axes of the model are considered. 40 waves are used, starting with 6 waves with 12.5 sec and period decrements of 1.0 sec, and then 4 waves starting at 6.5 sec, and separated at 0.5 sec. Next, to cover the region close to the natural frequencies of the structure, 4, 7, 7, 6 and 6 waves are applied, with decrements of 0.2, 0.15, 0.05, 0.1 and 0.2 seconds, and starting at 4.5, 3.7, 2.75, 2.35 and 1.7 seconds, respectively.
4. The Ultimate Strength Analysis
This analysis was performed by applying an incremental load until the platform collapse mechanism was produced, using the nonlinear method of load increment (pushover). This method was generated with the "collapse" module of the SACS program, which considers the nonlinearity in the structure and foundation, the product of the analysis is determined the Resistance Reserve Factor (RSR) which relates the lateral basal shear with which the structure collapses (ultimate design wave resistance) and the reference shear product of the design wave, the RSR must be calculated for 8 different directions of incidence of the wave; i.e. at every 45° in all cases the RSR got must be greater than the minimum specified in standard 2. 2, The procedure used in each of the eight analyzes is presented below
- The Reference Basal Shear is got from the analysis in Operation and Static Storm site, for the eight directions of incidence in Storm conditions considered in the analysis.
- Gradual application of Gravity Loads (Self Weight, Dead Loads and Live Loads) on the platform. It is applied, for example, in 10 steps with a 10% increment.
- Gradual application of the meteorological loads for the Ultimate Strength Analysis.
- Increments of 2% in the magnitude of such loads have been defined; so that to reach 140%, 70 steps are needed. The percentage of 100% corresponds to the magnitude of the loads defined in table A.1.1 of the Pemex standards for Ultimate Strength.
- Identification of the platform collapse mechanism in each direction.
- Getting the basal shear and RSR for the meteorological conditions that generate platform collapse.
- The ductility analysis should be performed by an ultimate strength analysis using an incremental load (pushover) method. Cr is defined as the ratio between the ultimate lateral load resisting the platform before collapse (obtained in this analysis) and the reference lateral load (calculated in the seismic analysis by resistance), it has been performed for each of the 20 directions of occurrence, the analysis has been executed as follows.
- The gravity load is applied in 10% increments until 100% of the gravity load is reached.
- The seismic load is applied in 5% increments until 100% of the seismic load is reached.
- Seismic loading continues to be applied in 5% increments until the collapse mechanism of the structure is reached.
5. Results and Discussion
5.1. Operational and Static Storm Analysis
This analysis is required to ensure that the design of the platform complies with all the applicable regulations in force, in terms of loads and stress, both in the substructure and superstructure, as well as in the piles.
The present analysis has been carried out with the SACS (Structural Analysis Computer System) program by which the mechanical elements in the structural elements, the stress ratios of elements (Unity Check), as well as the review of the piles (including the non-linear soil-pile interaction), the analysis by hydrostatic collapse, and the analysis of joints "by penetration" and "by resistance" have been obtained, the above based on the API-RP-2A -WSD, AISC and IMCA. The results of the operation and static storm analysis are shown below. However, the summary of static storm and operation analysis results is given in Figure 5.
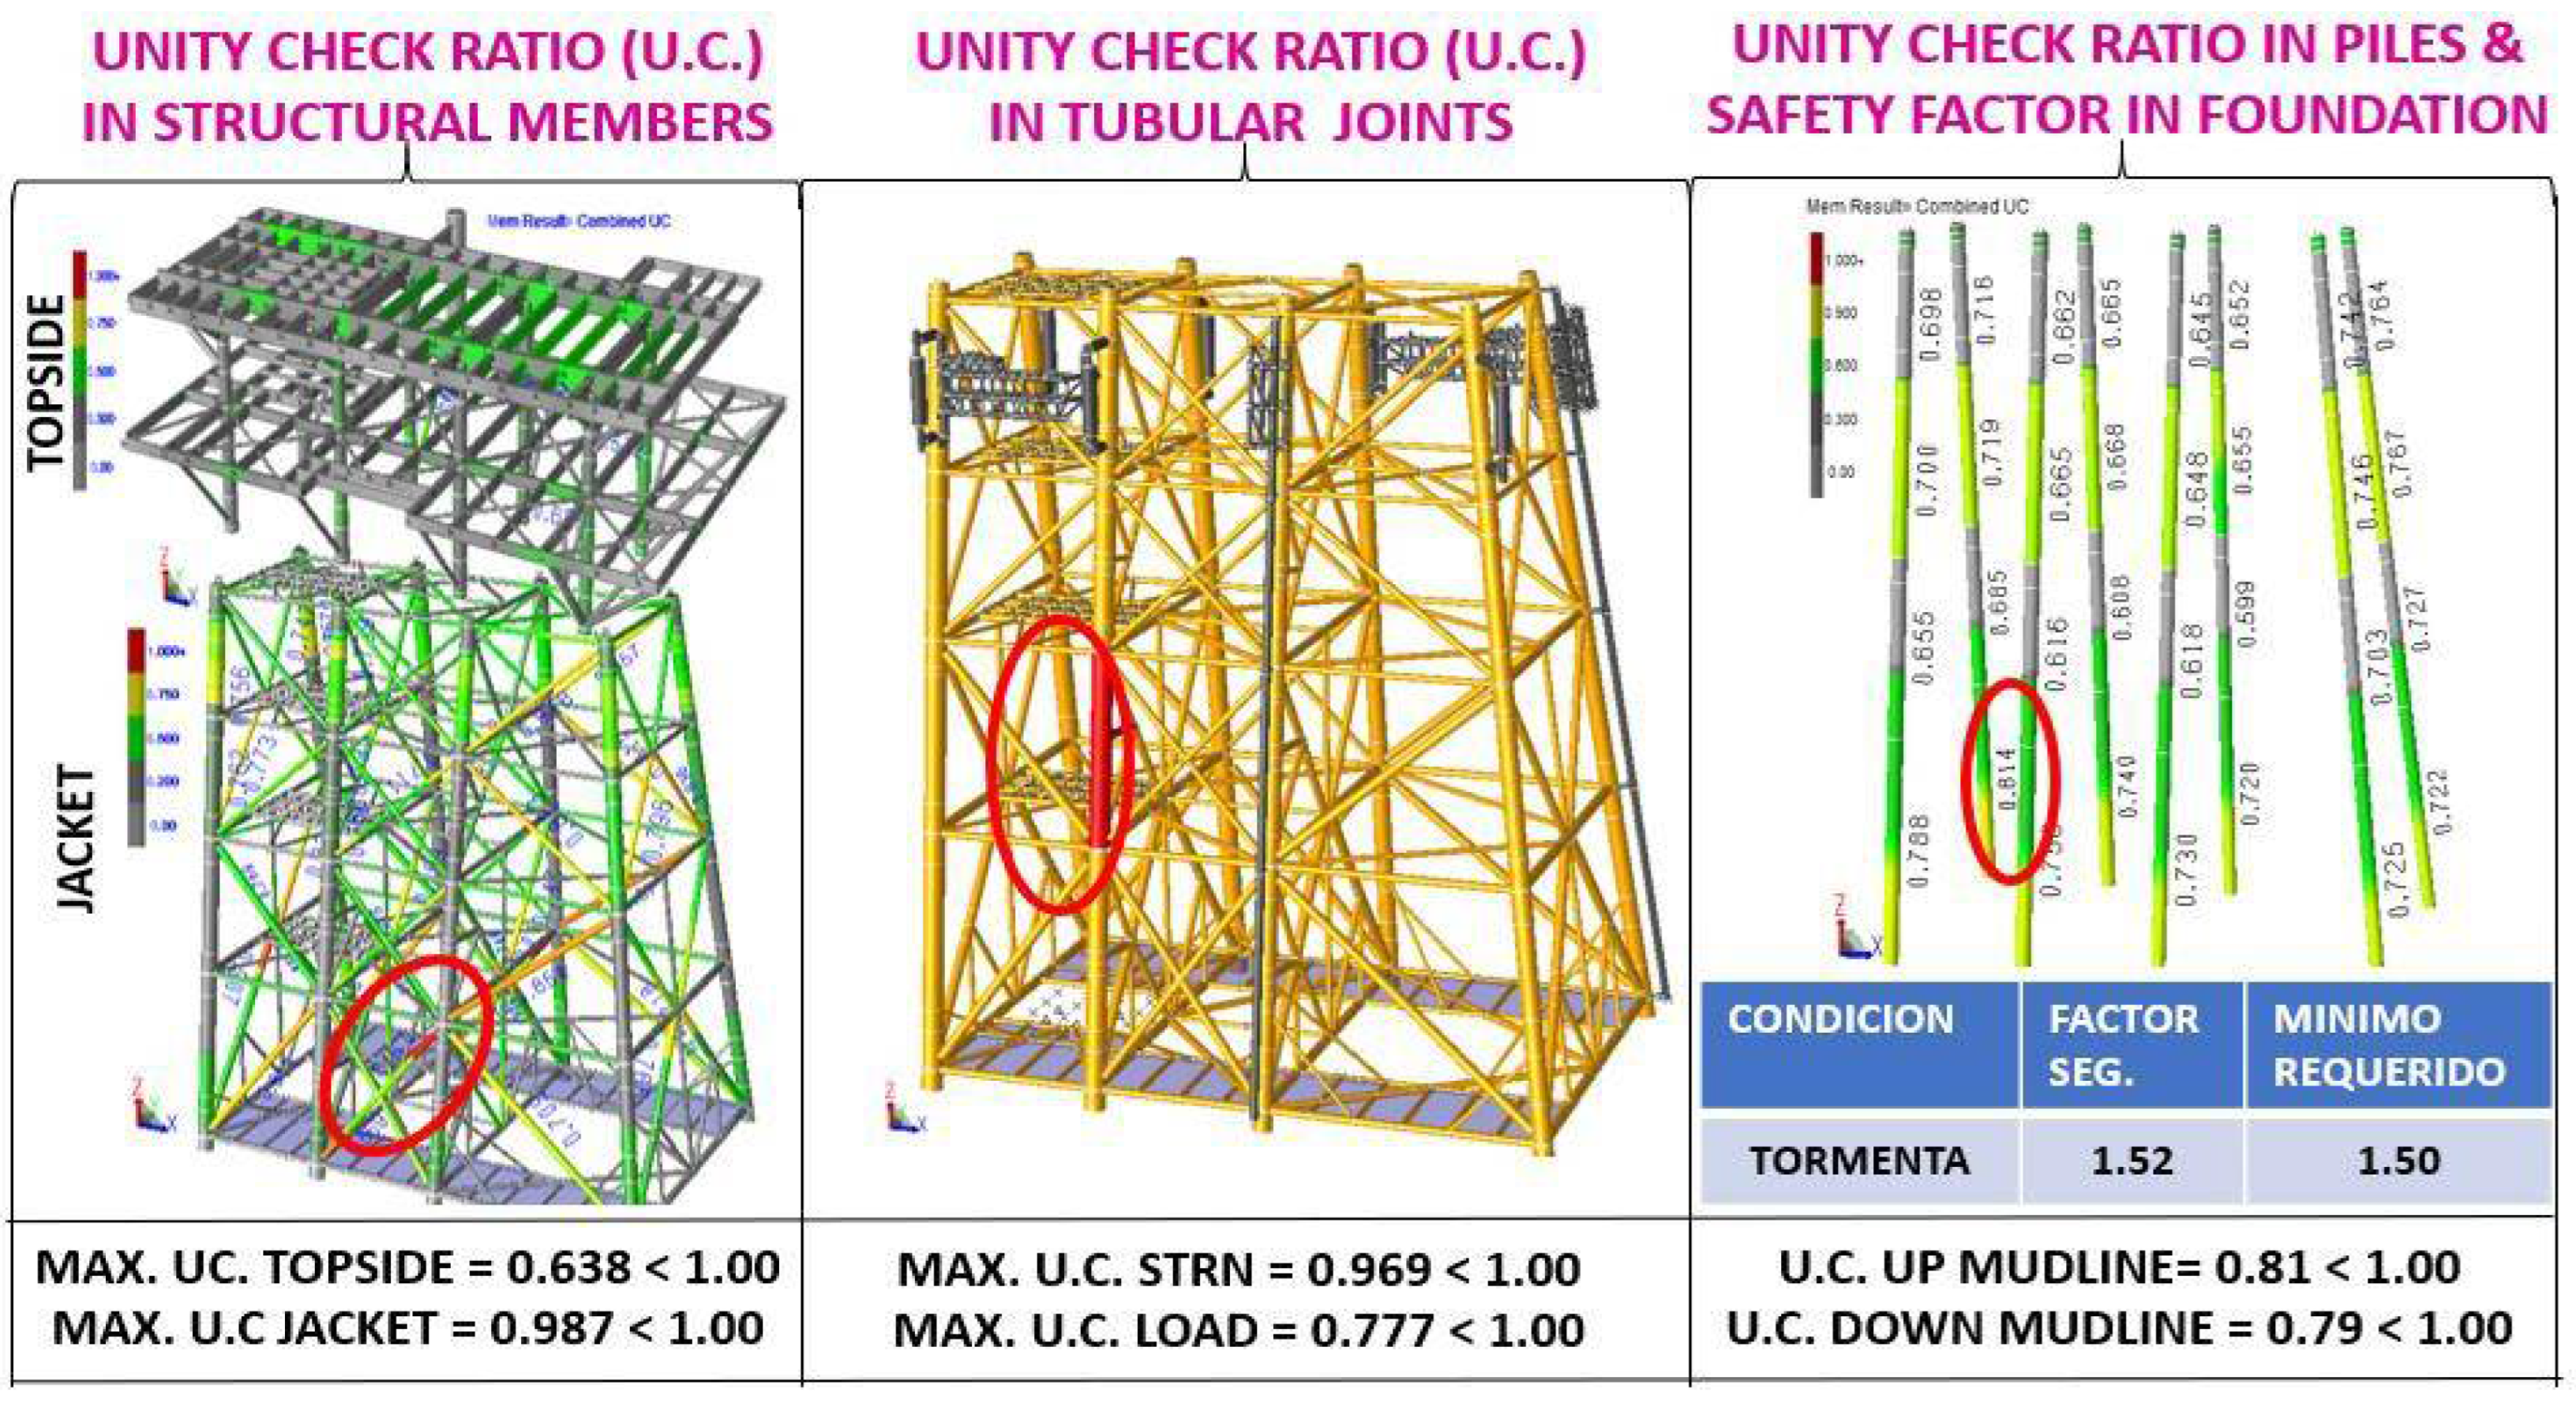
- UC stress interaction relationships: The maximum UC was presented in the substructure (jacket) with a value of 0.93, and in the superstructure (topside) with a value of 0.81, both cases less than 1.0, the UC are less than unity, thus complying with current regulations.
- Tubular Joint Penetration: Tubular joints were checked for penetration (Load) and resistance (STRN), getting values of 0.968 and 0.783 respectively, in both cases, the UC. In both cases, the UC are less than the unit, so they comply with current standards.
- Stress Interaction Relationships U.C. in Piles and Load Safety Factors in the foundation: The piles were reviewed, for the piles above the seabed (mudline) the U.C. max was 0.774 and for the piles below the seabed the U.C. max was 0.754, both cases less than unity. 754, both cases less than unity, as regards the safety factors for axial load on the piles the values are higher than the minimum required by the standard had factors for operation of 2.18 >
- 2.00 (min required) and for storm of 1.58 > 1.50 (min required), which shows that the foundation complies with the parameters established in the standards in force.
- Hydrostatic collapse: there are over stresses in the columns of axis 1 and 2, for which the following solutions can be recommended:
- ➢
- Rings of 1.00" (25.4 mm) thick by 12" (305 mm), for the separation of the rings you
- ➢
- can use as a guide the separation proposed by the program in the redesign that the Sac's program performs, the above for the cases of structures already built but not installed, i.e.: Relocations and service changes, this type of solution is complicated in structures already installed because of the cost of underwater welding.
- ➢
- With offshore platforms that are in the design phase, the proposed solution is to
- ➢
- redesign the elements, i.e. to increase the thickness of the pipe or to install anchor bolts.
- ➢
- For structures already installed on site, the solution may be to cement the elements, as this solution increases the properties of the element.
- ➢
- It is worth mentioning that this document shows the results of a structural proposal and intends to show the solutions, the structural civil engineer together with his working group will determine which is the best technical and economical solution for the
- ➢
- project, in this case study hydrostatic collapse rings will be used as a solution.
5.2. Dynamic Storm Analysis
Due to the fact that the height of the structure, and its stiffness and mass characteristics, it can be considered as an "inverted pendulum", i.e., most of its mass is kept at the top, hence its dynamic behavior shows tendencies to "pitch" when subjected to wave loads. When the waves hit the structure, it deforms in the same direction as the waves.
The present analysis aims to know the behavior of the platform in storm conditions, considering its dynamic properties and the movement of the water particles, which can cause relative displacements between the platform and the fluid. These movements can have a negative effect on the behavior of the platform, which is not possible to know through static analysis. On the other hand, according to API recommendations [Ref. 8], structures with natural period of vibration of three (3) seconds or more, shall be analyzed through a dynamic wave analysis, considering extreme sea states, gravity loads and attached mass.
- U.C. stress interaction ratios: The maximum U.C. occurred in the substructure (jacket) with a value of 0.987, and in the superstructure with a value of 0.638, both cases less than 1.0, the U.C. are less than unity, thus complying with current regulations.
- Tubular Joint Penetration: Tubular joints were checked for penetration (Load) and resistance (STRN), getting values of 0.777 and 0.969 respectively, in both cases, the UC. They are less than the unit, so they comply with the current standards.
- Stress Interaction Relationships U.C. in Piles and Load Safety Factors in the foundation: The piles were reviewed, for the piles above the seabed (mudline) the U.C. max was 0.81 and for the piles below the seabed a U.C. max of 0.79, both cases less than unity. 79, both cases less than the unit, regarding the safety factors for axial load on the piles, a value for storm of 1.52 > 1.50 (min required) was obtained, which shows that the foundation complies with the parameters established in the current standards, described in Figure 6.
The strength level analysis is required to ensure that the platform has adequate strength and stiffness levels to avoid significant structural damage in the presence of an earthquake. The proposed seismic design acceleration spectra correspond to the envelope of the expected value (average) of the maximum accelerations of the structure in the zone of interest and not to the envelope of the maximum of the maximum accelerations. This condition requires that the structure be reviewed by an ultimate strength analysis to ensure adequate safety factors (reliability indices). The seismic design acceleration spectra at the strength level correspond to 20 years.
Figure 6.
Dynamic storm analysis results summary.
Seismic Resistance Analysis has been carried out with the SACS (Structural Analysis Computer System) program through its modules PSI, DYNPAC, DYNAMIC RESPONSE, SACS IV and JOINT CAN with which the fundamental period of the structure, the mechanical elements in the structural members, the nodal displacements, the stress ratios in elements (Unity Check), as well as the revision of the piles and the analysis of joints under shear stresses by penetration (Punching Shear) have been obtained.
U.C. stress interaction relationships: The maximum U.C. was presented in the substructure (jacket) with a value of 0.677, and in the superstructure (topside) with a value of 0.579, both cases less than 1.0, the U.C. are less than unity, thus complying with current regulations.
Tubular Joint Penetration: Tubular joints were checked for penetration (Load) and resistance (STRN), getting values of 0.956 and 0.765 respectively, in both cases, the UC. In both cases, the UC are less than the unit, so they comply with current standards. Stress Interaction Relationships
U.C. in Piles and Load Safety Factors in the foundation: The piles were reviewed, for the piles located above the seabed (mudline) the U.C. max was 0.575 and for the piles below the seabed a
U.C. max of 0.754, both cases less than unity. max of 0.754, both cases less than the unit, with respect to the safety factor for axial load in the piles, the value was 2.04 > 2.00 (min required), which shows that the foundation complies with the parameters established in the current standards are shown by Figure 7.
The seismic analysis by ductility is required to guarantee that the platform and its foundations can resist the equivalent of an earthquake of exceptional intensity, the aim is to determine the seismic reserve capacity factor, (Cr), by an incremental analysis of gravity and seismic loads (pushover), which must comply with the current regulations (Table 11.3-1 of ISO 19902: 2007). For knowing the collapse mechanism that will occur in the structure after having applied the incremental pushover analysis in the gravity and seismic loading conditions.
The seismic reserve capacity factor, Cr. This factor represents the capacity of a structure to sustain ground motions due to an earthquake beyond the reference level. It is defined as the ratio of spectral acceleration that causes structural collapse or catastrophic failure of the system to the spectral acceleration. For fixed steel offshore structures, the representative value of Cr can be estimated from the general design characteristics of a structure according to Table 11.3-1 of ISO 19902: 2007 "Petroleum and natural gas industries Fixed steel offshore structures." the analysis has been performed for each of the 20 incident directions, has been shown by Figure 8.
5.2. Ultimate Wave Resistance Analysis
The ultimate wave resistance was performed by applying an incremental load until the collapse mechanism of the platform was produced, using the nonlinear method of load increment (pushover), which was generated with the "COLLAPSE" module of the SACS (Structural Analysis Computer System) program, which considers the nonlinearity in the structure and foundation, because of the analysis, the Resistance Reserve Factor (RSR) is determined, which relates the lateral basal shear with which the structure collapses (ultimate design resistance wave) and the reference shear resulting from the design wave. The results of the lowest RSR got for the 0° direction are shown below. In addition, Figure 9 demonstrates graphically these results.
The purpose of the fatigue spectral analysis is to evaluate the stresses because of repeated or cyclic loads acting on the connections of the tubular elements that make up the structure, caused by the action of the gravity and environmental loads acting during its useful life, and to determine the design fatigue life of each joint and member, which should not be less than the expected useful life of the structure multiplied by a safety factor.
The theory based on the accumulation of fatigue damage (D) of Palmgren-miner, states that the amount of fatigue damage is got from the ratio between the number of cycles (lowest number that produces failure) of a stress range acting on a structure, n(s), and the number of cycles to the corresponding failure of the same, N(s). When the sum of the damage associated with each stress range is equal to or greater than unity, fatigue failure occurs.
The fatigue spectral method makes use of the wave incidence probability to determine the stress intervals and the number of cycles associated with these intervals, which act on the welds of the tubular joints of the structure. When the number of cycles of the stress intervals acting on the material is determined, it is possible to determine the damage they will produce by comparing them with the allowable cycles according to the data indicated in the S-N curves (Stress Interval vs. Number of Cycles).
Fatigue is calculated from the S-N curves of API RP 2A-WSD, 22nd Ed. From which 4 specific curves are obtained, which are named WJ for tubular connections with steels with yield strength lower than 72 ksi, the first one is considered suitable for conventional tubular joints without strict weld control (WJT), the other three are applied for concave profiled welds whose values vary according to the technique used (WJ1, WJ2 and WJ3).
The results of the spectral fatigue analysis are shown below, as illustrated Figure 10.
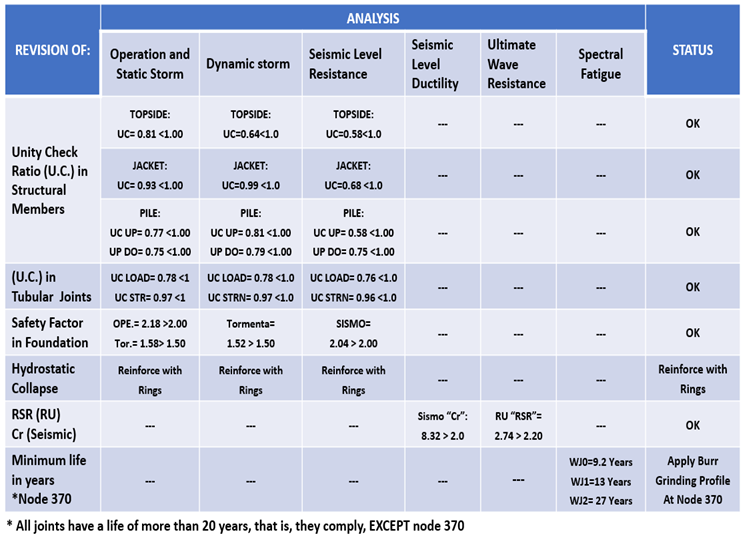
A summary of the analyzes is shown below, where the differences in the results can be observed, i.e., its structural behavior through the different scenarios that the platform will face during its useful life as illustrated into Table 4.
6. Conclusions
In this paper, it can be seen how the stress interaction relationships in UC elements of the jacket, piles and safety factors in the foundation, are more unfavorable for the dynamic storm analysis, which considers the periods and percentages of mass participation, compared to the static operation and storm, which does not consider it; We can see that the joints have an almost identical behavior in the revision by resistance (revision without considering the acting load), where a greater change is appreciated is in the revision by penetration which considers the difference of loads acting on the element, finally we see how the hydrostatic collapse is presented in the three scenarios, this is because the collapse depends on the depth at which the submerged element is located, to solve this problem of collapse 1" rings are proposed to prevent the pipes from collapsing.
In the nonlinear analysis, it is observed that there is a large safety factor in the earthquake, compared to the ultimate wave resistance, proving that the greatest load that governs the design of offshore platforms in the Campeche Sound is the wave, i.e. the earthquake is not the most critical condition to design this type of structures.
In the predictive fatigue analysis, we observed that applying the first S-N curve (this analysis does not consider a control of the most unfavorable scenario weld) as all the joints comply with the minimum useful life, except joint 370, for this joint two additional analyzes were performed by changing the S-N curves (as marked by the API) getting that joint 370 will comply with the minimum design life by applying a profiling control called "Burr Grinding".
Based on the above, we can qualify the results as satisfactory and recommend that it is necessary to perform the 6 basic analyzes to always know the structural behavior of the platform during its useful life to determine its structural integrity. Finally, this investigation proposed the necessity to install offshore platforms in new fields of exploitation.
References
- Kaiser, M.J.; Liu, M. Decommissioning cost estimation in the deepwater U.S. Gulf of Mexico Fixed platforms and compliant towers. Marine Structures 2014, 37, 1–32. [Google Scholar] [CrossRef]
- Abbas, M.; Shafiee, M. An overview of maintenance management strategies for corroded steel structures in extreme marine environments. Marine Structures 2020, 71, 102718. [Google Scholar] [CrossRef]
- Baldassino, N.; Zordan, M.; Zandonini, R. Experimental study of the shear behavior of floor diaphragms in light steel residential buildings. Thin-Walled Structures 2021, 167, 108099. [Google Scholar] [CrossRef]
- Sobhaniaragh, B.; Afzalimir, S.H.; Ruggieri, C. Towards the prediction of hydrogen–induced crack growth in high–graded strength steels. Thin-Walled Structures 2021, 159, 107245. [Google Scholar] [CrossRef]
- Dai, Z.; Pang, S.D.; Liew, J.Y. Axial load resistance of grouted sleeve connection for modular construction. Thin-Walled Structures 2020, 154, 106883. [Google Scholar] [CrossRef]
- Viero, P.F.; Roitman, N. Application of some damage identification methods in offshore platforms. Marine Structures 1999, 12, 107–126. [Google Scholar] [CrossRef]
- Onoufriou, T. Reliability based inspection planning of offshore structures. Marine Structures 1999, 12, 521–539. [Google Scholar] [CrossRef]
- Lotsberg, I.; Sigurdsson, G.; Fjeldstad, A.; et al. Probabilistic methods for planning of inspection for fatigue cracks in offshore structures. Marine Structures 2016, 46, 167–192. [Google Scholar] [CrossRef]
- Mojtahedi, A.; Yaghin, M.A.L.; Ettefagh, M.M.; et al. Detection of nonlinearity effects in structural integrity monitoring methods for offshore jacket-type structures based on principal component analysis. Marine Structures 2013, 33, 100–119. [Google Scholar] [CrossRef]
- Mousavi, M.; Gardoni, P. A simplified method for reliability- and integrity-based design of engineering systems and its application to offshore mooring systems. Marine Structures 2014, 36, 88–104. [Google Scholar] [CrossRef]
- Lotsberg, I.; Olufsen, O.; Solland, G.; et al. Risk assessment of loss of structural integrity of a floating production platform due to gross errors. Marine Structures 2004, 17, 551–573. [Google Scholar] [CrossRef]
- Aeran, A.; Siriwardane, S.C.; Mikkelsen, O.; et al. A framework to assess structural integrity of ageing offshore jacket structures for life extension. Marine Structures 2017, 56, 37–259. [Google Scholar] [CrossRef]
- Ramasamy, R.; Ibrahim, Z.; Chai, H.K. Screening method for platform conductor integrity assessment for life extension prioritisation. Marine Structures 2018, 58, 136–153. [Google Scholar] [CrossRef]
- Vaz, M.A.; Cyrino, C.R.; Hernández, I.D.; et al. Experimental and numerical analyses of the ultimate compressive strength of perforated offshore tubular members. Marine Structures 2018, 58, 1–17. [Google Scholar] [CrossRef]
- Zeinoddini, M.; Namin, Y.Y.; Nikoo, H.M.; et al. An EWA framework for the probabilistic-based structural integrity assessment of offshore platforms. Marine Structures 2018, 59, 60–79. [Google Scholar] [CrossRef]
- Guédé, F. Risk-based structural integrity management for offshore jacket platforms. Marine Structures 2019, 444–446. [Google Scholar] [CrossRef]
- Tabeshpour, R.; Fatemi, M. Optimum arrangement of braces in jacket platform based on strength and ductility. Marine Structures 2020, 71, 102734. [Google Scholar] [CrossRef]
- Adamkowski, A.; Lewandowski, M. Stanisław Lewandowski, Fatigue life analysis of hydropower pipelines using the analytical model of stress concentration in welded joints with angular distortions and considering the influence of water hammer damping. Thin-Walled Structures 2021, 159, 107350. [Google Scholar] [CrossRef]
- Gao, S.; Guo, L.; Zhang, S.; et al. Performance degradation of circular thin-walled CFST stub columns in high-latitude offshore region. Thin-Walled Structures 2020, 154, 106906. [Google Scholar] [CrossRef]
- Liu, L.; Yang, D.Y.; Frangopol, D.M. Ship service life extension considering ship condition and remaining design life. Marine Structures 2021, 78, 102940. [Google Scholar] [CrossRef]
- Tabeshpour, M.R.; Fatemi, M. Optimum arrangement of braces in jacket platform based on strength and ductility. Marine Structures 2020, 71, 102734. [Google Scholar] [CrossRef]
- Mojtahedi, A.; Yaghin, M.A.L.; Ettefagh, M.M.; et al. Detection of nonlinearity effects in structural integrity monitoring methods for offshore jacket-type structures based on principal component analysis. Marine Structures 2013, 33, 100–119. [Google Scholar] [CrossRef]
- Ahmadi, H.; Zavvar, E. Stress concentration factors induced by out-of-plane bending loads in ring-stiffened tubular KT-joints of jacket structures. Thin-Walled Structures 2015, 91, 82–95. [Google Scholar] [CrossRef]
- Ahmadi, H.; Mohammadi, A.H.; Yeganeh, A. Probability density functions of SCFs in internally ring-stiffened tubular KT-joints of offshore structures subjected to axial loading. Thin- Walled Structures 2015, 94, 485–499. [Google Scholar] [CrossRef]
- Leheta, H.W.; Badran, S.F.; Elhanafi, A.S. Ship structural integrity using new stiffened plates. Thin-Walled Structures 2015, 94, 545–561. [Google Scholar] [CrossRef]
- Asgarian, B.; Aghaeidoost, V.; Shokrgozar, H.R. Damage detection of jacket type offshore platforms using rate of signal energy using wavelet packet transform. Marine Structures 2016, 45, 1–21. [Google Scholar] [CrossRef]
- Mohammadi, S.F.; Galgoul, N.S.; Starossek, U.; et al. An efficient time domain fatigue analysis and its comparison to spectral fatigue assessment for an offshore jacket structure. Marine Structures 2016, 49, 97–115. [Google Scholar] [CrossRef]
- Pérez, R.; Rodríguez, R.; Vázquez-Hernández, A.O. Damage detection in offshore jacket platforms with limited modal information using the Damage Submatrices Method. Marine Structures 2017, 55, 78–103. [Google Scholar] [CrossRef]
- Aeran, A.; Siriwardanea, S.C.; Mikkelsen, O.; et al. A framework to assess structural integrity of ageing offshore jacket structures for life extension. Marine Structures 2017, 56, 237–259. [Google Scholar] [CrossRef]
- Dodaran, N.A.; Ahmadi, H.; Lotfollahi-Yaghin, M. Parametric study on structural behavior of tubular K-joints under axial loading at fire-induced elevated temperatures. Thin- Walled Structures 2018, 130, 467–486. [Google Scholar] [CrossRef]
- Zeinoddini, M.; Namin, Y.Y.; Nikoo, H.M.; et al. An EWA framework for the probabilistic-based structural integrity assessment of offshore platforms. Marine Structures 2018, 59, 60–79. [Google Scholar] [CrossRef]
- Tu, Y.; Cheng, Z.; Muskulus, M. A global slamming force model for offshore wind jacket structures, Marine Structures 2018, 60, 201–217.
- Guéde, F. Risk-based structural integrity management for offshore jacket platforms. Marine Structures 2019, 63, 444–461. [Google Scholar] [CrossRef]
- Tabeshpour, M.; Fatemi, M. Optimum arrangement of braces in jacket platform based on strength and ductility. Marine Structures 2020, 71, 102734. [Google Scholar] [CrossRef]
- Hüsken, G.; Shamsuddoha, M.; Pirskawetz, S.; et al. Potential of a repair system for grouted connections in offshore structures: Development and experimental verification. Marine Structures 2021, 77, 102934. [Google Scholar] [CrossRef]
- Almeida-Fernandes, L.; Silvestre, N.; Correia, R.; et al. Fracture toughness-based models for damage simulation of pultruded GFRP materials. Composites Part B: Engineering 2020, 186, 107818. [Google Scholar] [CrossRef]
- Martins, D.; Gonilha, J.; Correia, J.R.; et al. Exterior beam-to-column bolted connections between GFRP I-shaped pultruded profiles using stainless steel cleats, Part 2: Prediction of initial stiffness and strength. Thin-Walled Structures 2021, 164, 107762. [Google Scholar] [CrossRef]
- Rahmanli, U.; Becque, J. . Stress concentration factors for multi-planar DKT tubular truss joints under axially balanced loads. Journal of Constructional Steel Research 2021, 184, 106781. [Google Scholar] [CrossRef]
- Han, F.; et al. Experimental and Numerical Investigations of Octagonal High- Strength Steel Tubular Stub Columns under Combined Compression and Bending. Journal of Structural Engineering American Society of Civil Engineers 2021, 147, 04020282. [Google Scholar]
- Pemex. Petróleos Mexicanos. Estadísticas petroleras [in Spanish]. 2021.
- Pemex. Informe mensual sobre producción y comercio de hidrocarburos [in Spanish]. 2021.
- Atkins Engineering Services (1990). Fluid Loading on Fixed Offshore Structures, OTH 90 322. URL: https://core.ac.uk/download/pdf/237397122.pdf.1990.
- API (2014). American Petroleum Institute, Recommended Practice for Planning, Designing and Constructing Fixed Offshore Platforms –Working Stress Design, API RP 2A-WSD, Twenty-second edition, November 2014. Recuperado 23 de julio del 2024, URL: https://store.accuristech.com/api/standards/api-rp-2a-wsd-r2020?product_id=1886617.
- Chakrabarti, S.K. (2005). Handbook of offshore engineering. Vol. 1. ELSEVIER.
- Fenton, J.D. A high-order cnoidal wave theory. Journal of Fluid Mechanics 1979, 94, 129–161. [Google Scholar] [CrossRef]
- Amaechi, C.V.; Reda, A.; Butler, H.O.; Ja’e, I.A.; An, C. Review on Fixed and Floating Offshore Structures. Part I: Types of Platforms with Some Applications. J. Mar. Sci. Eng. 2022, 10, 1074. [Google Scholar] [CrossRef]
- Sidiq, R.B.; Utomo, C.; Silvianita. Determining Factors of Fixed Offshore Platform Inspections in Indonesia. Appl. Sci. 2023, 13, 737. [Google Scholar] [CrossRef]
Figure 1.
Components and loads of a Jacket Type Marine Platform.
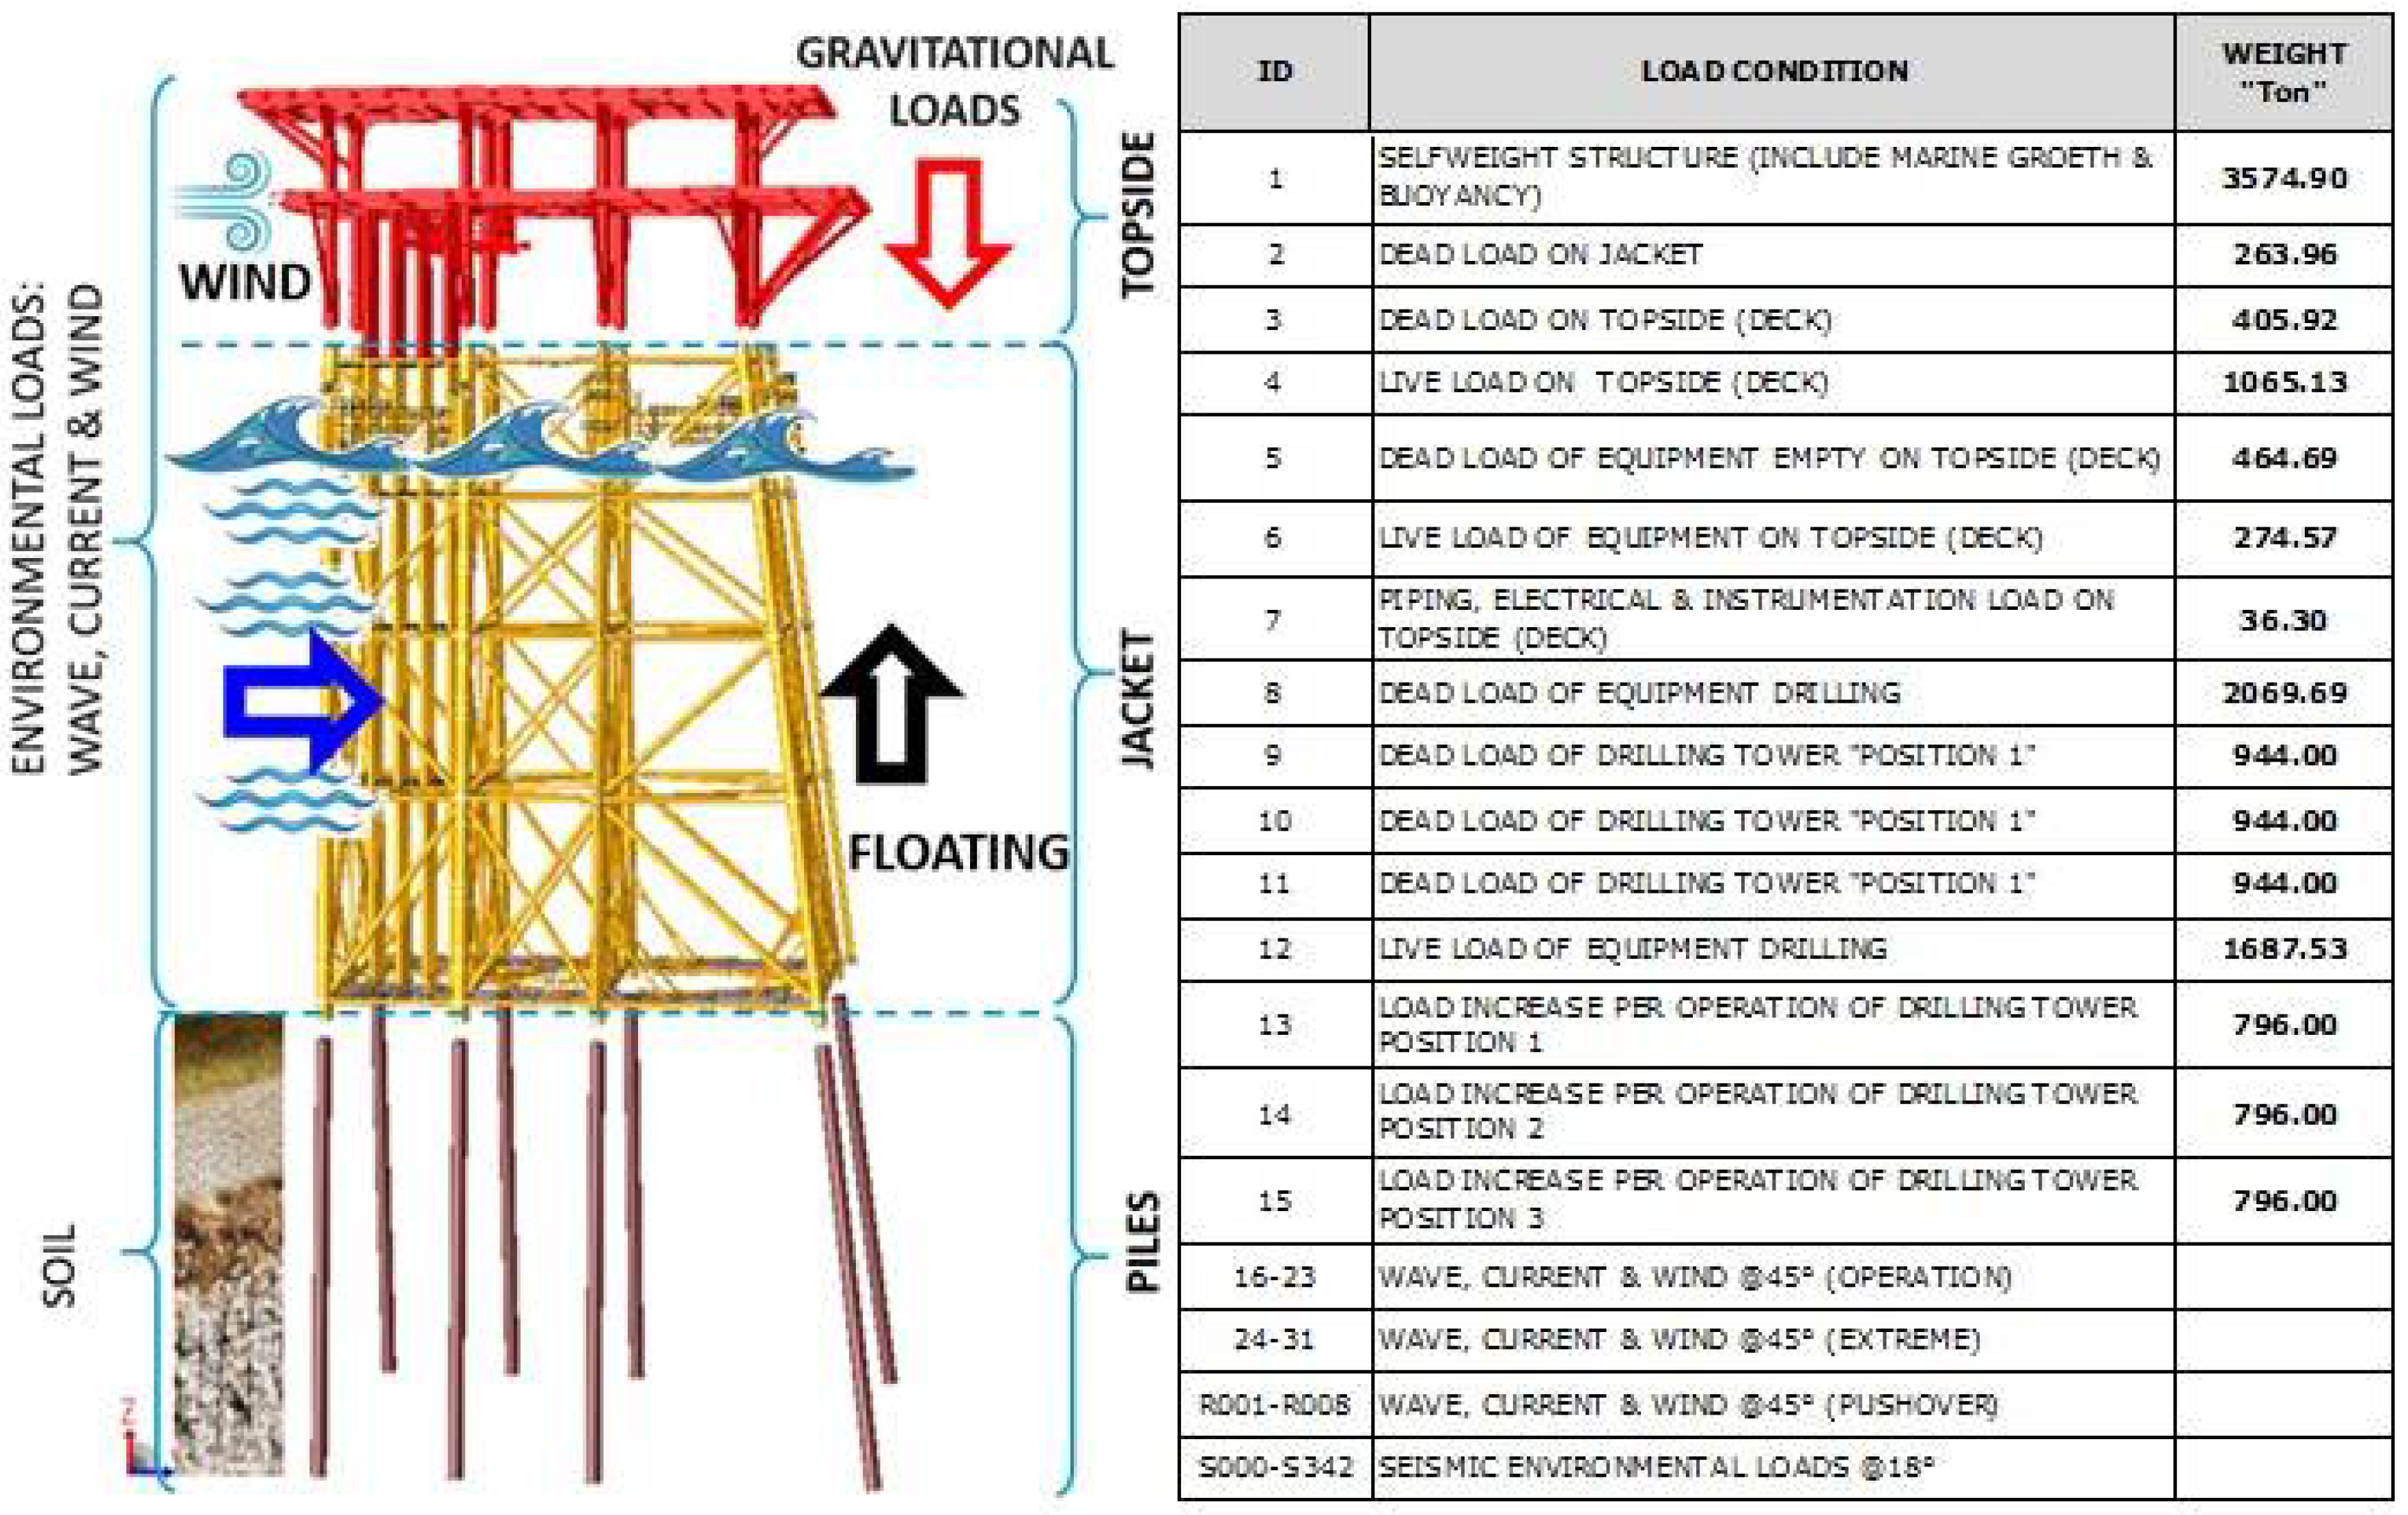
Figure 2.
Basic Analysis to Determine Structural Integrity.
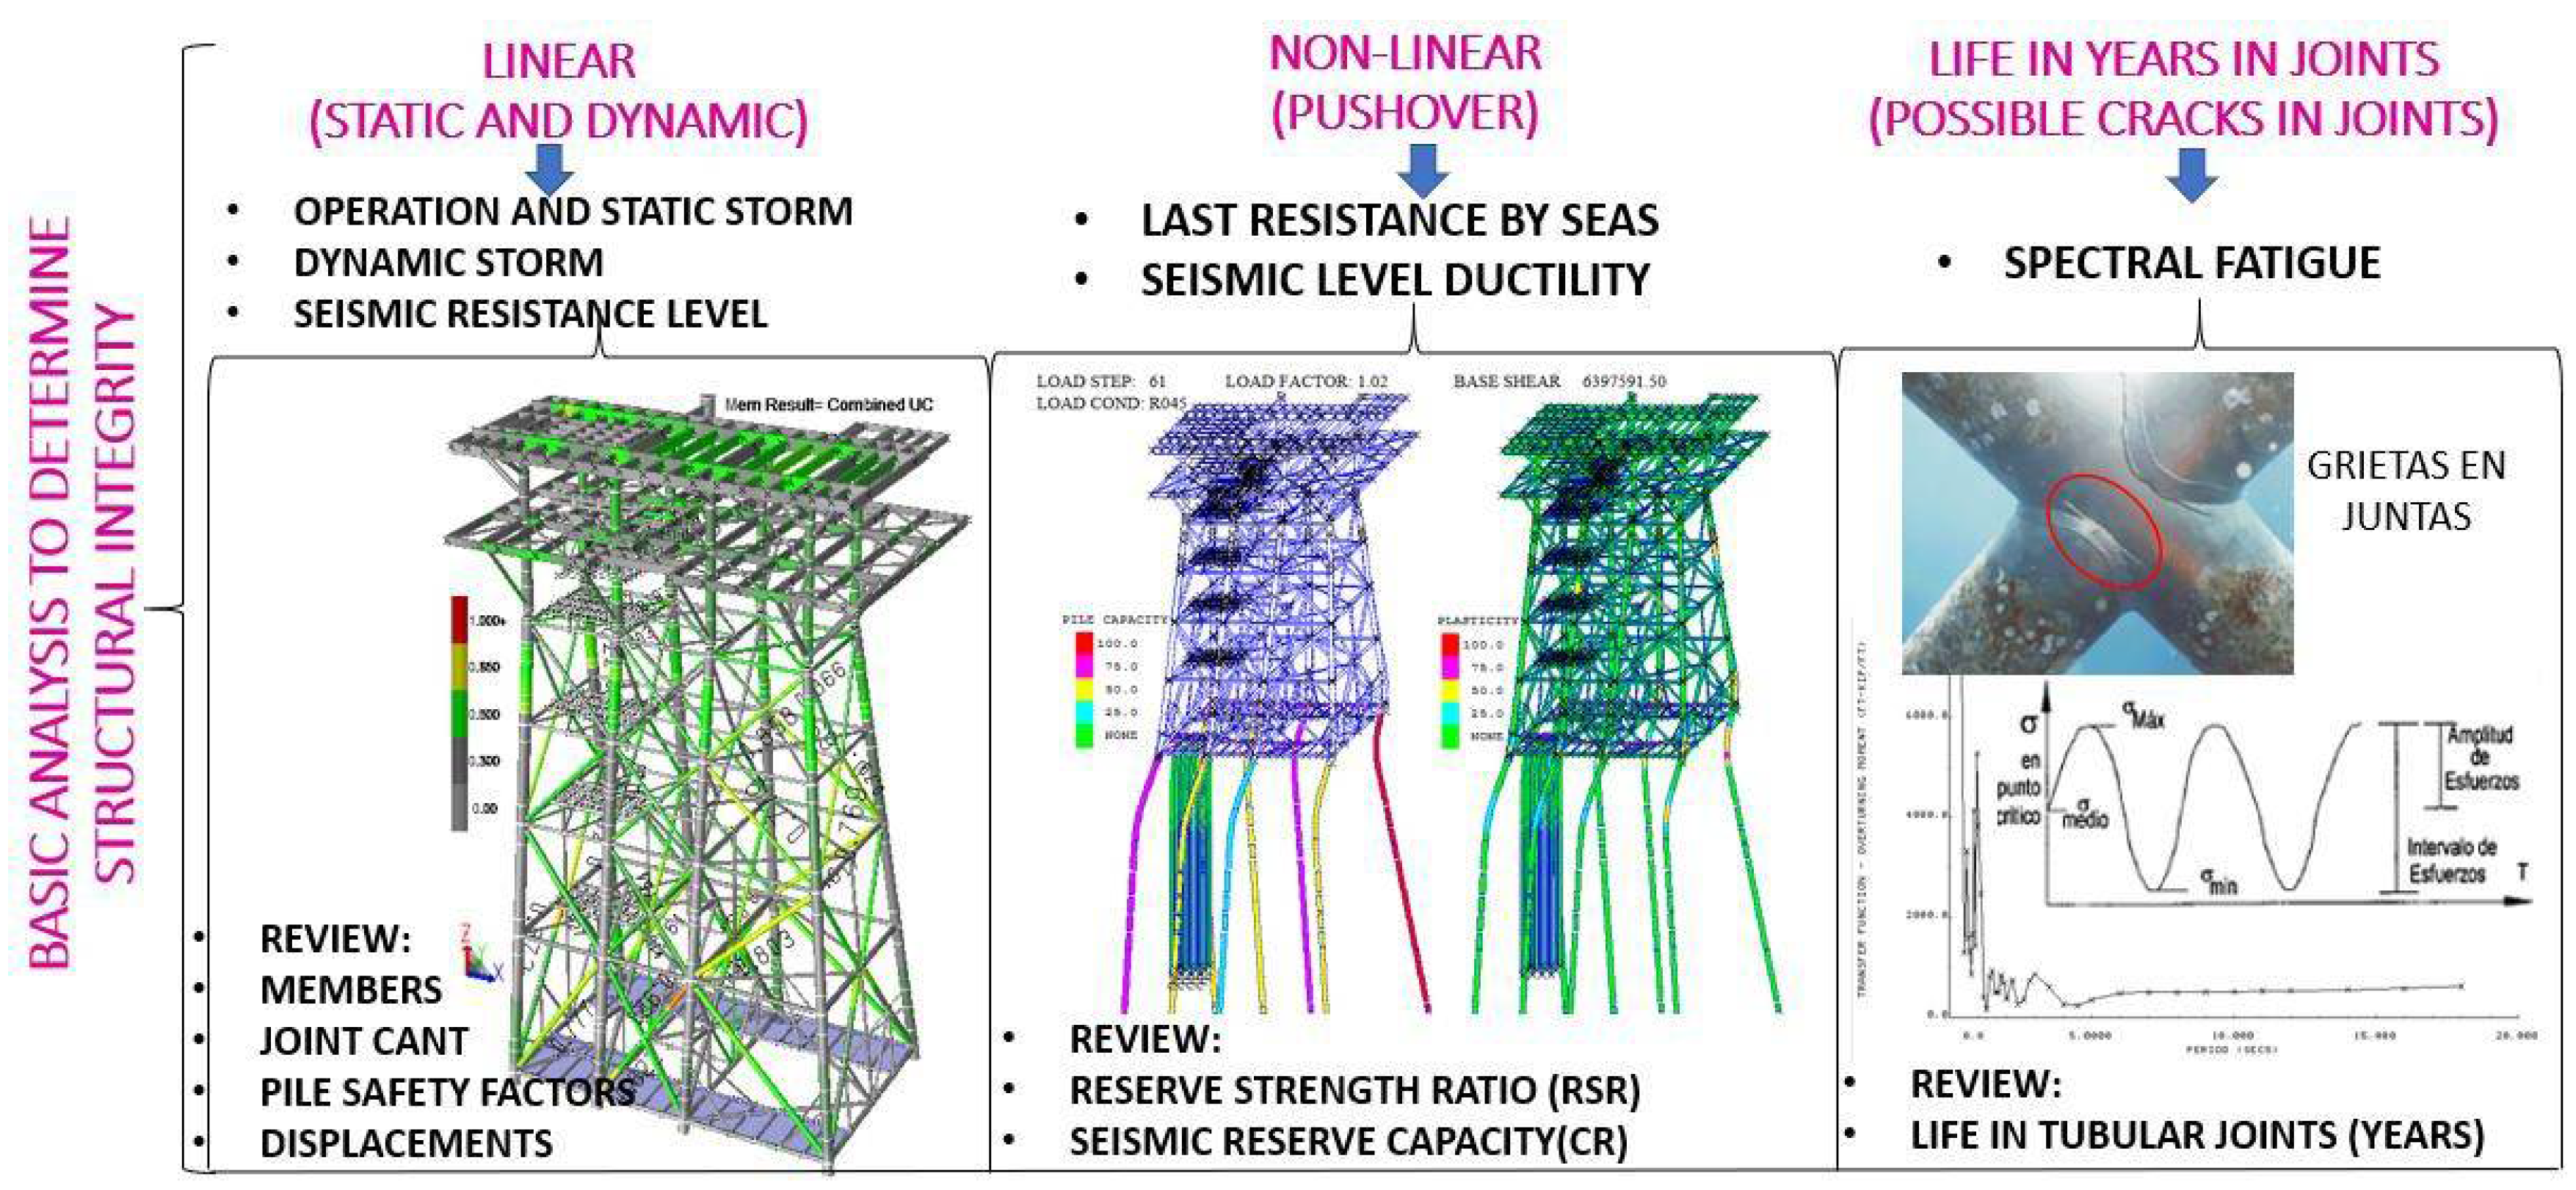
Figure 3.
Sequence of execution of analyzes in sacs software.
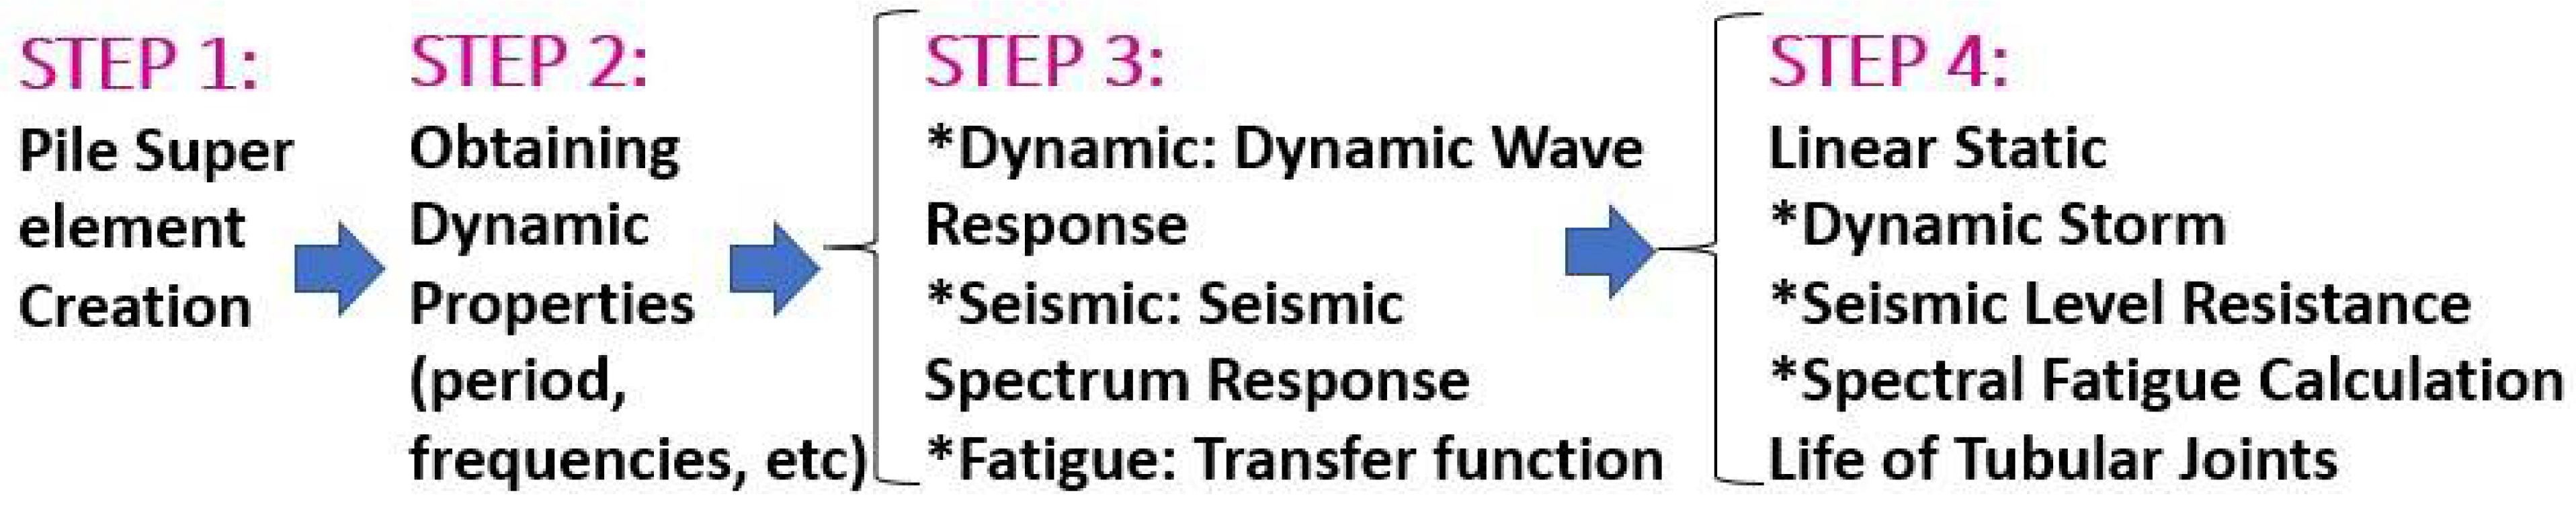
Figure 4.
Graph of obtaining range of stress.
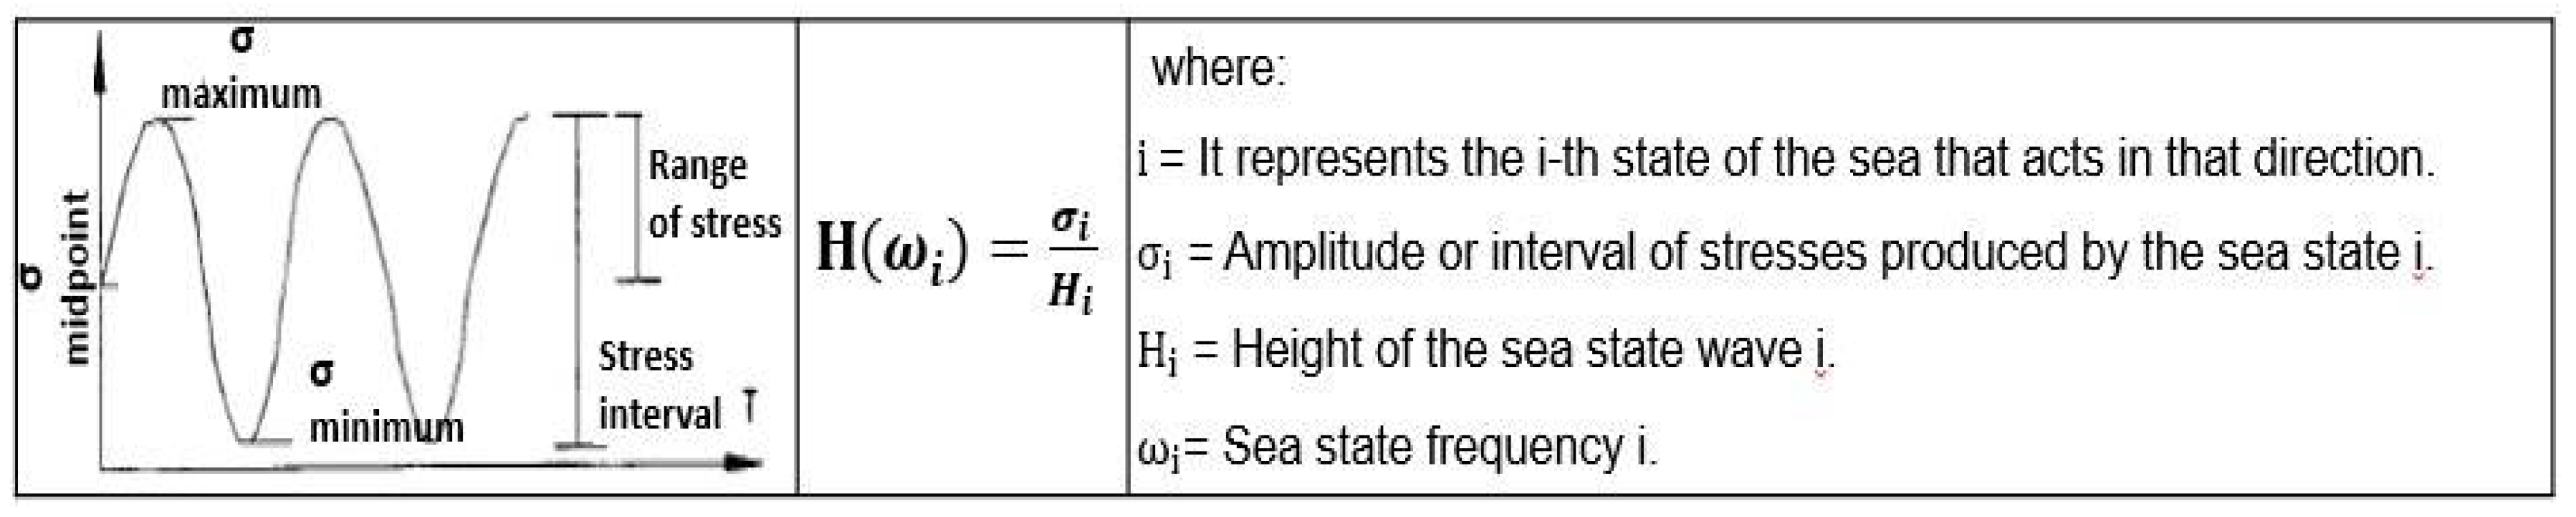
Figure 5.
Summary of static storm and operation analysis results.
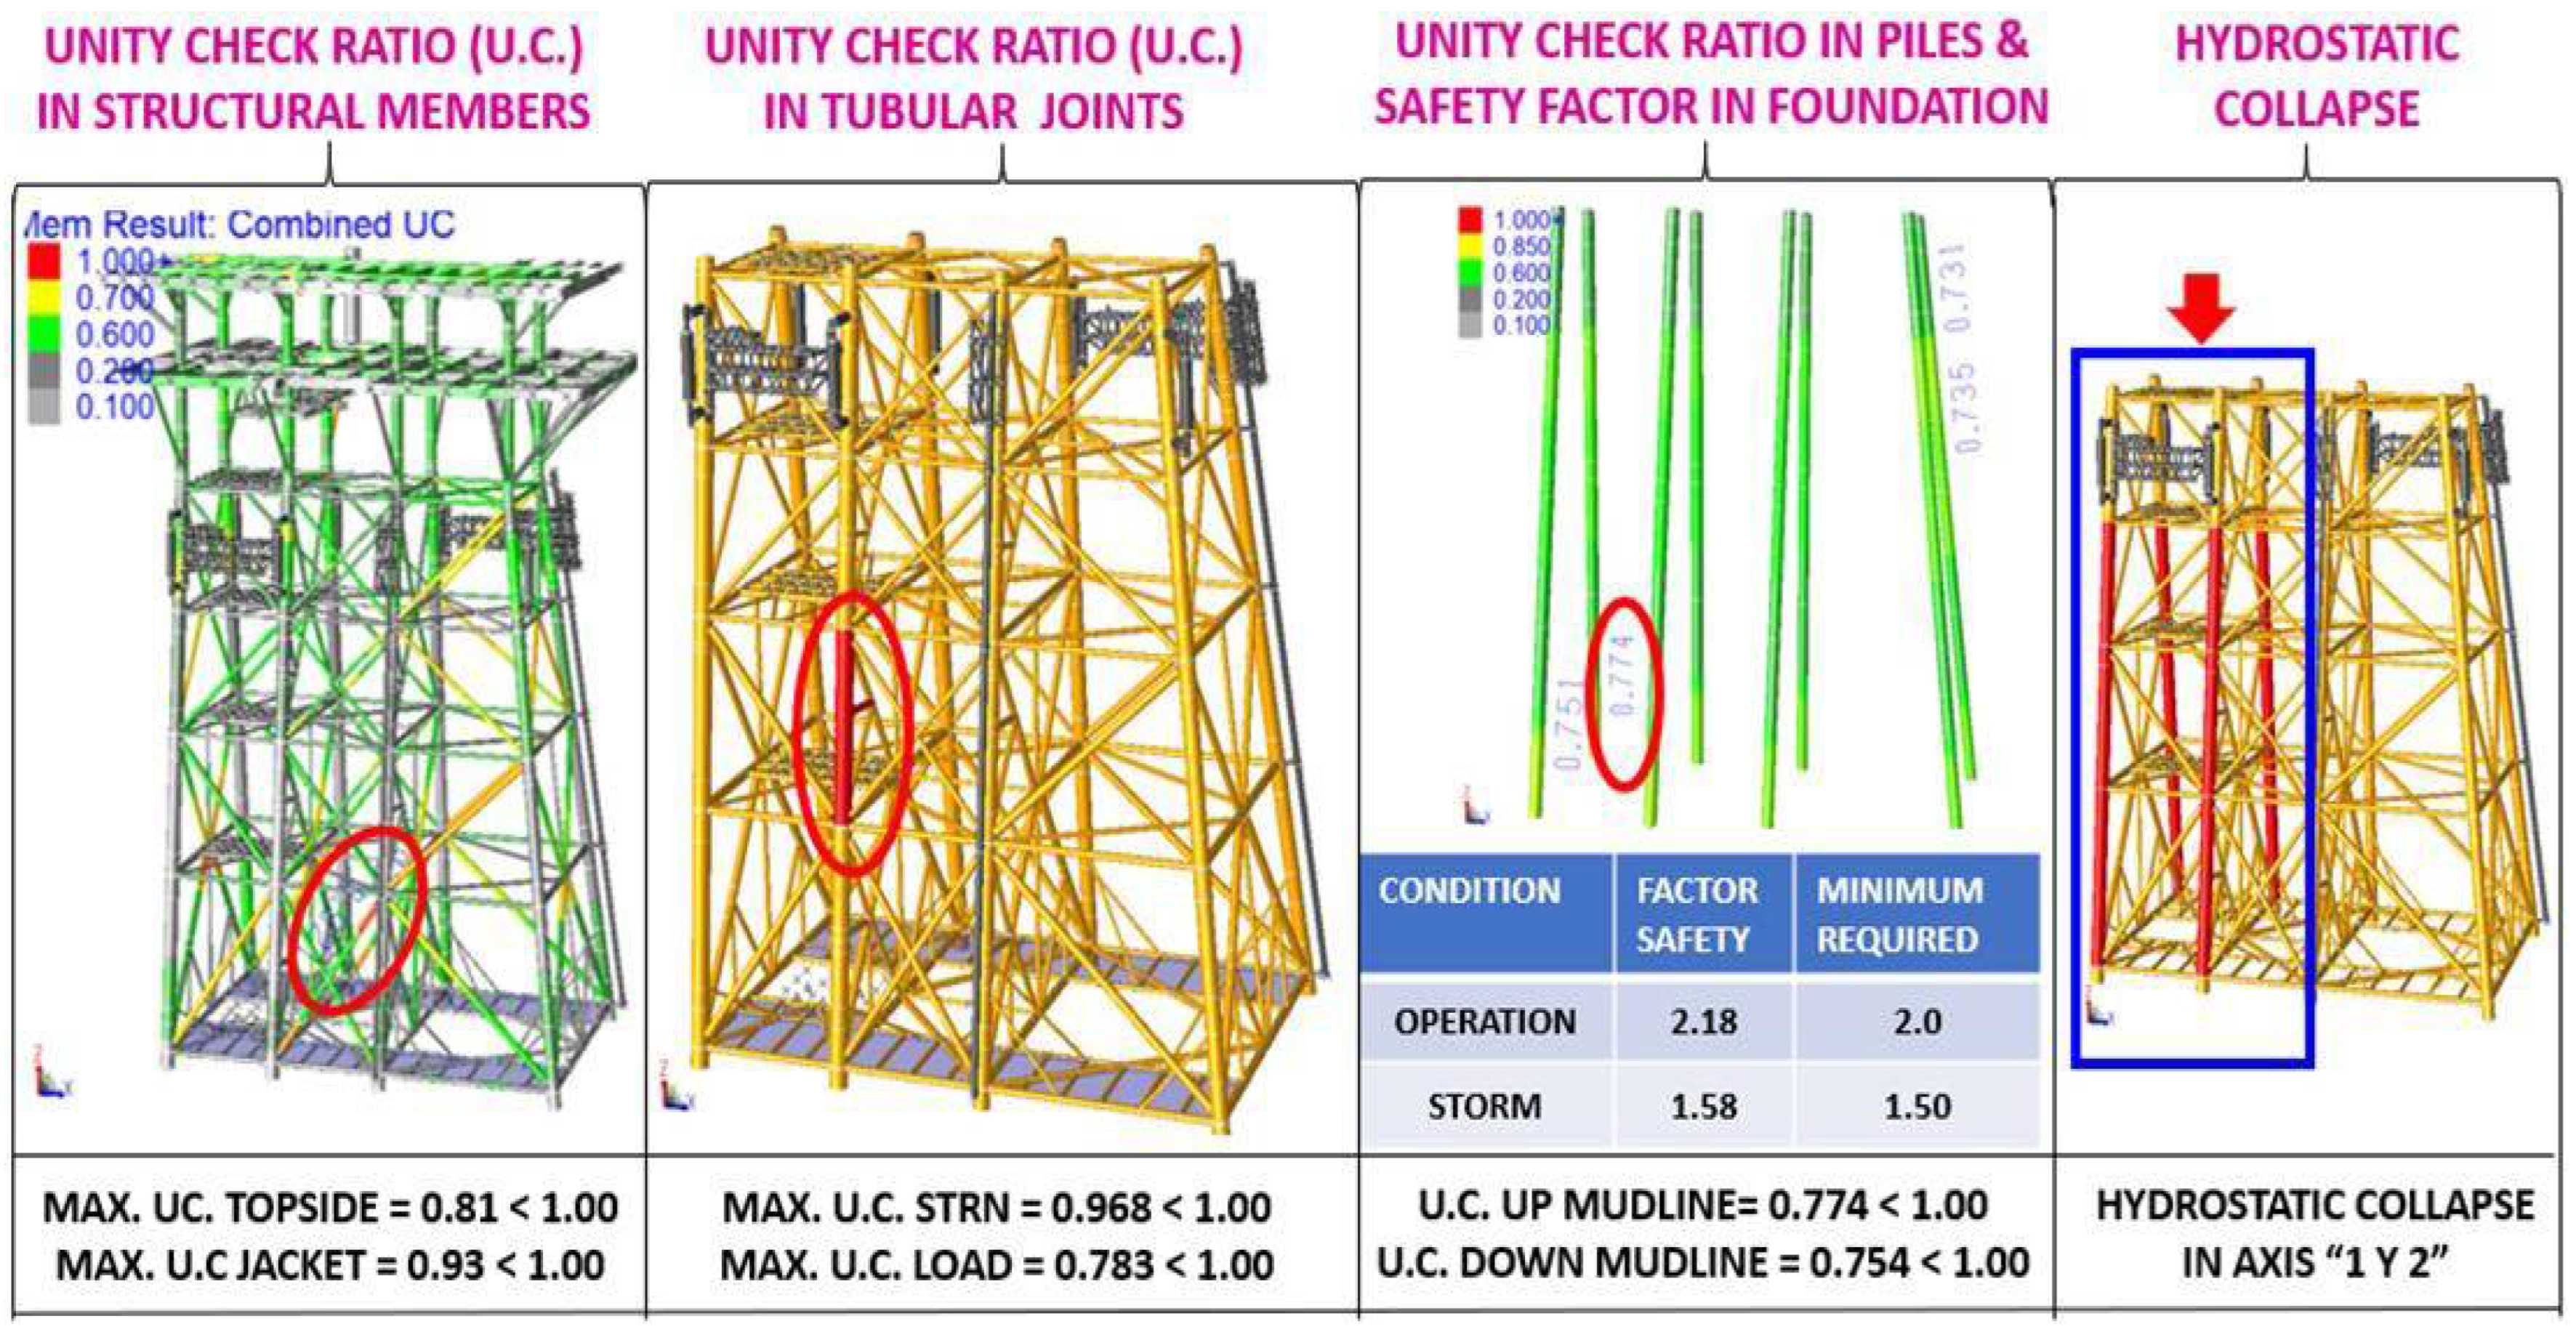
Figure 7.
Summary of resistance level seismic analysis results.
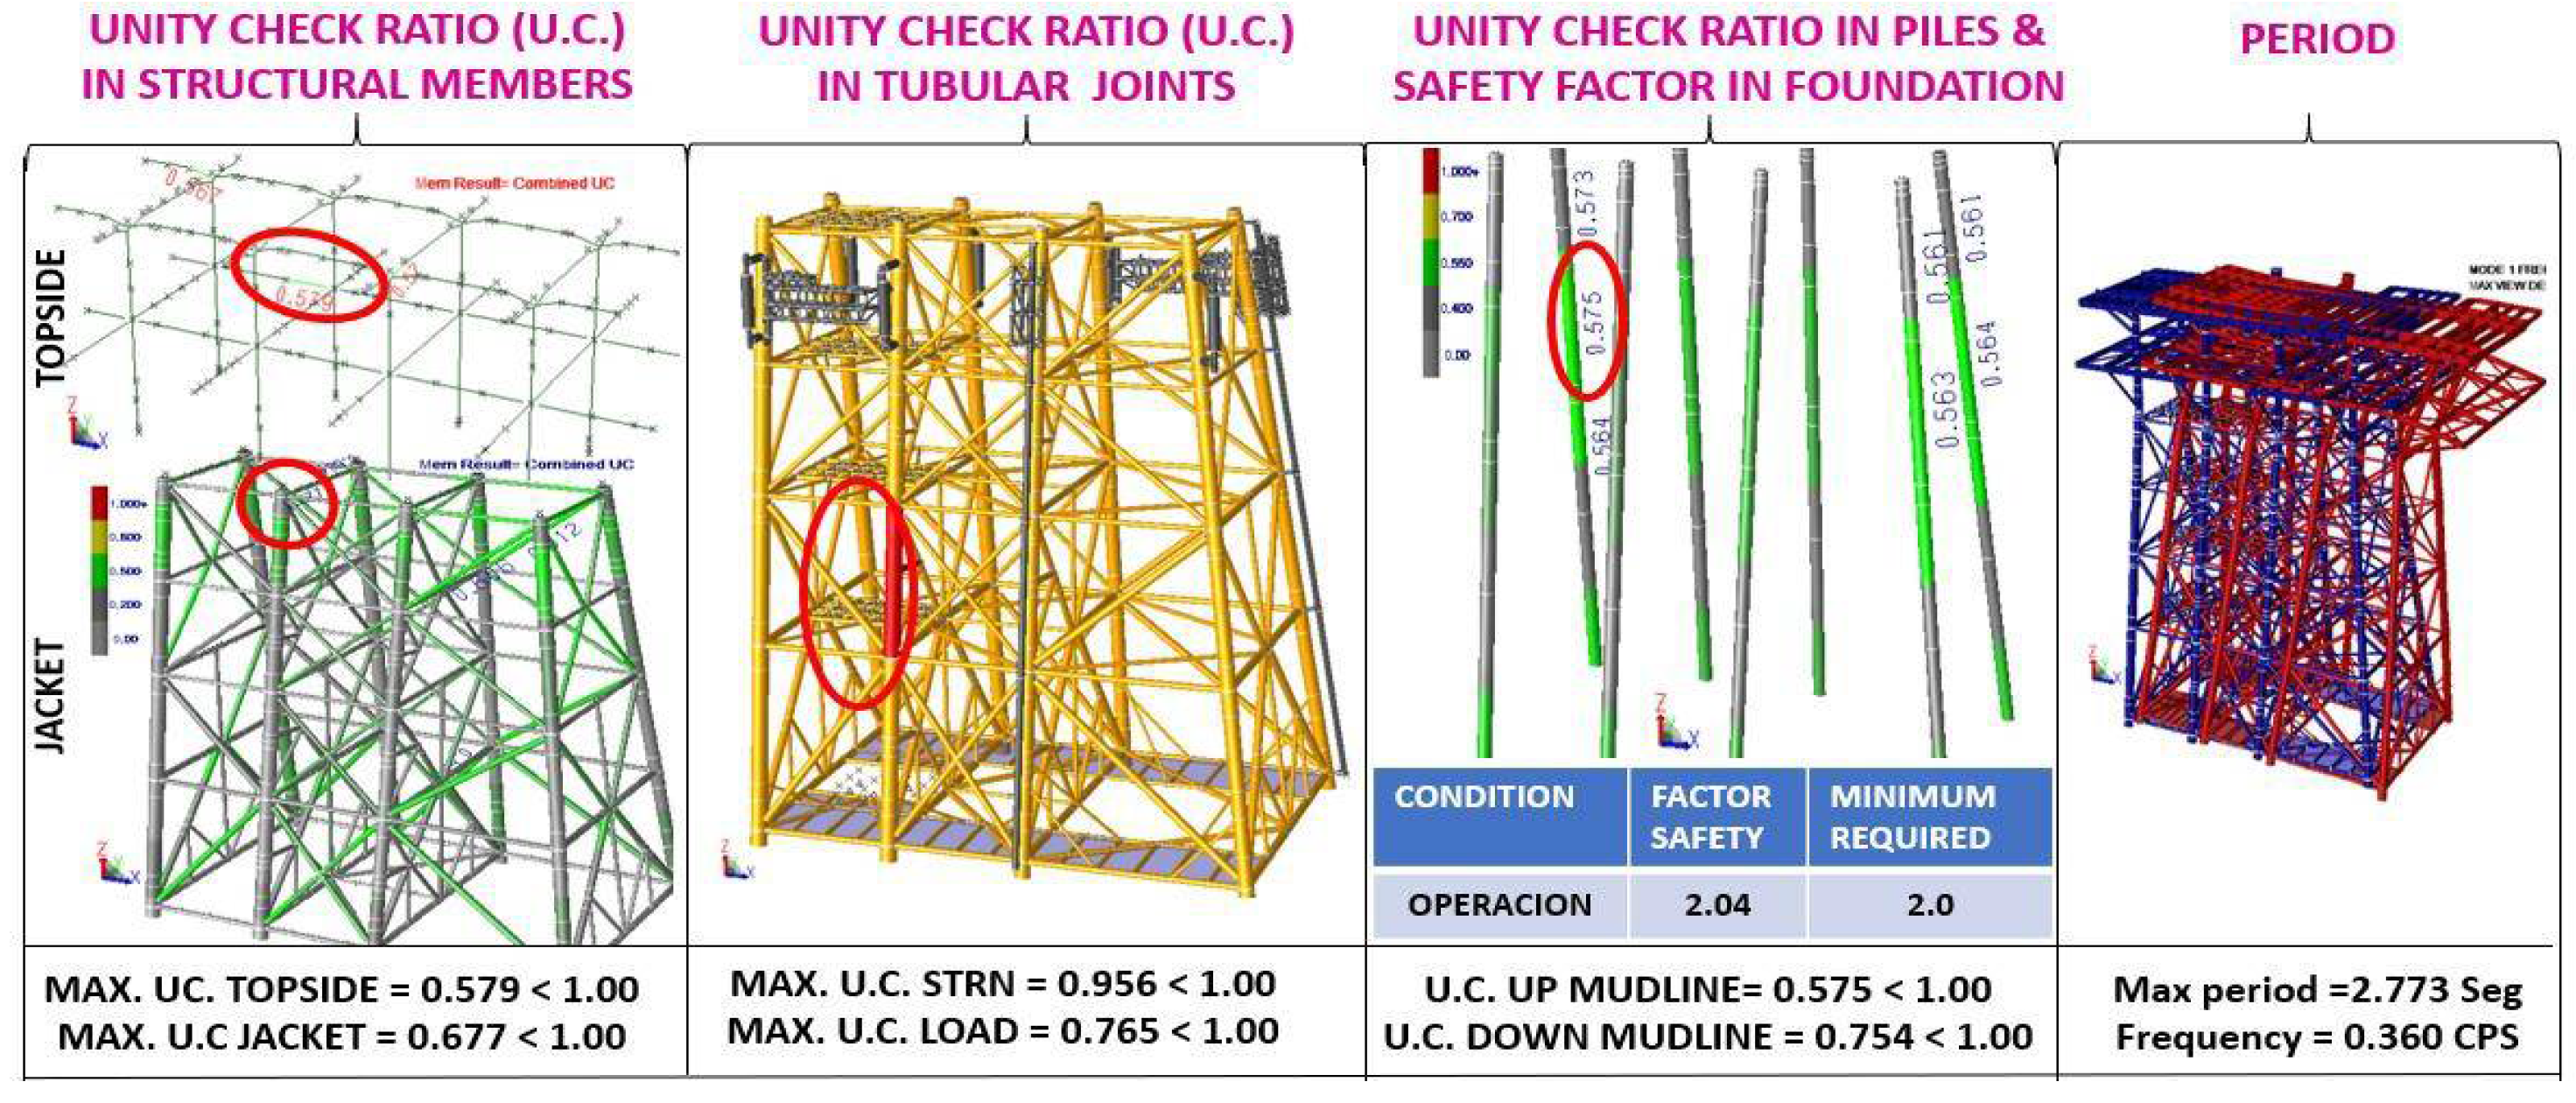
Figure 8.
Summary of ductility level seismic analysis results.
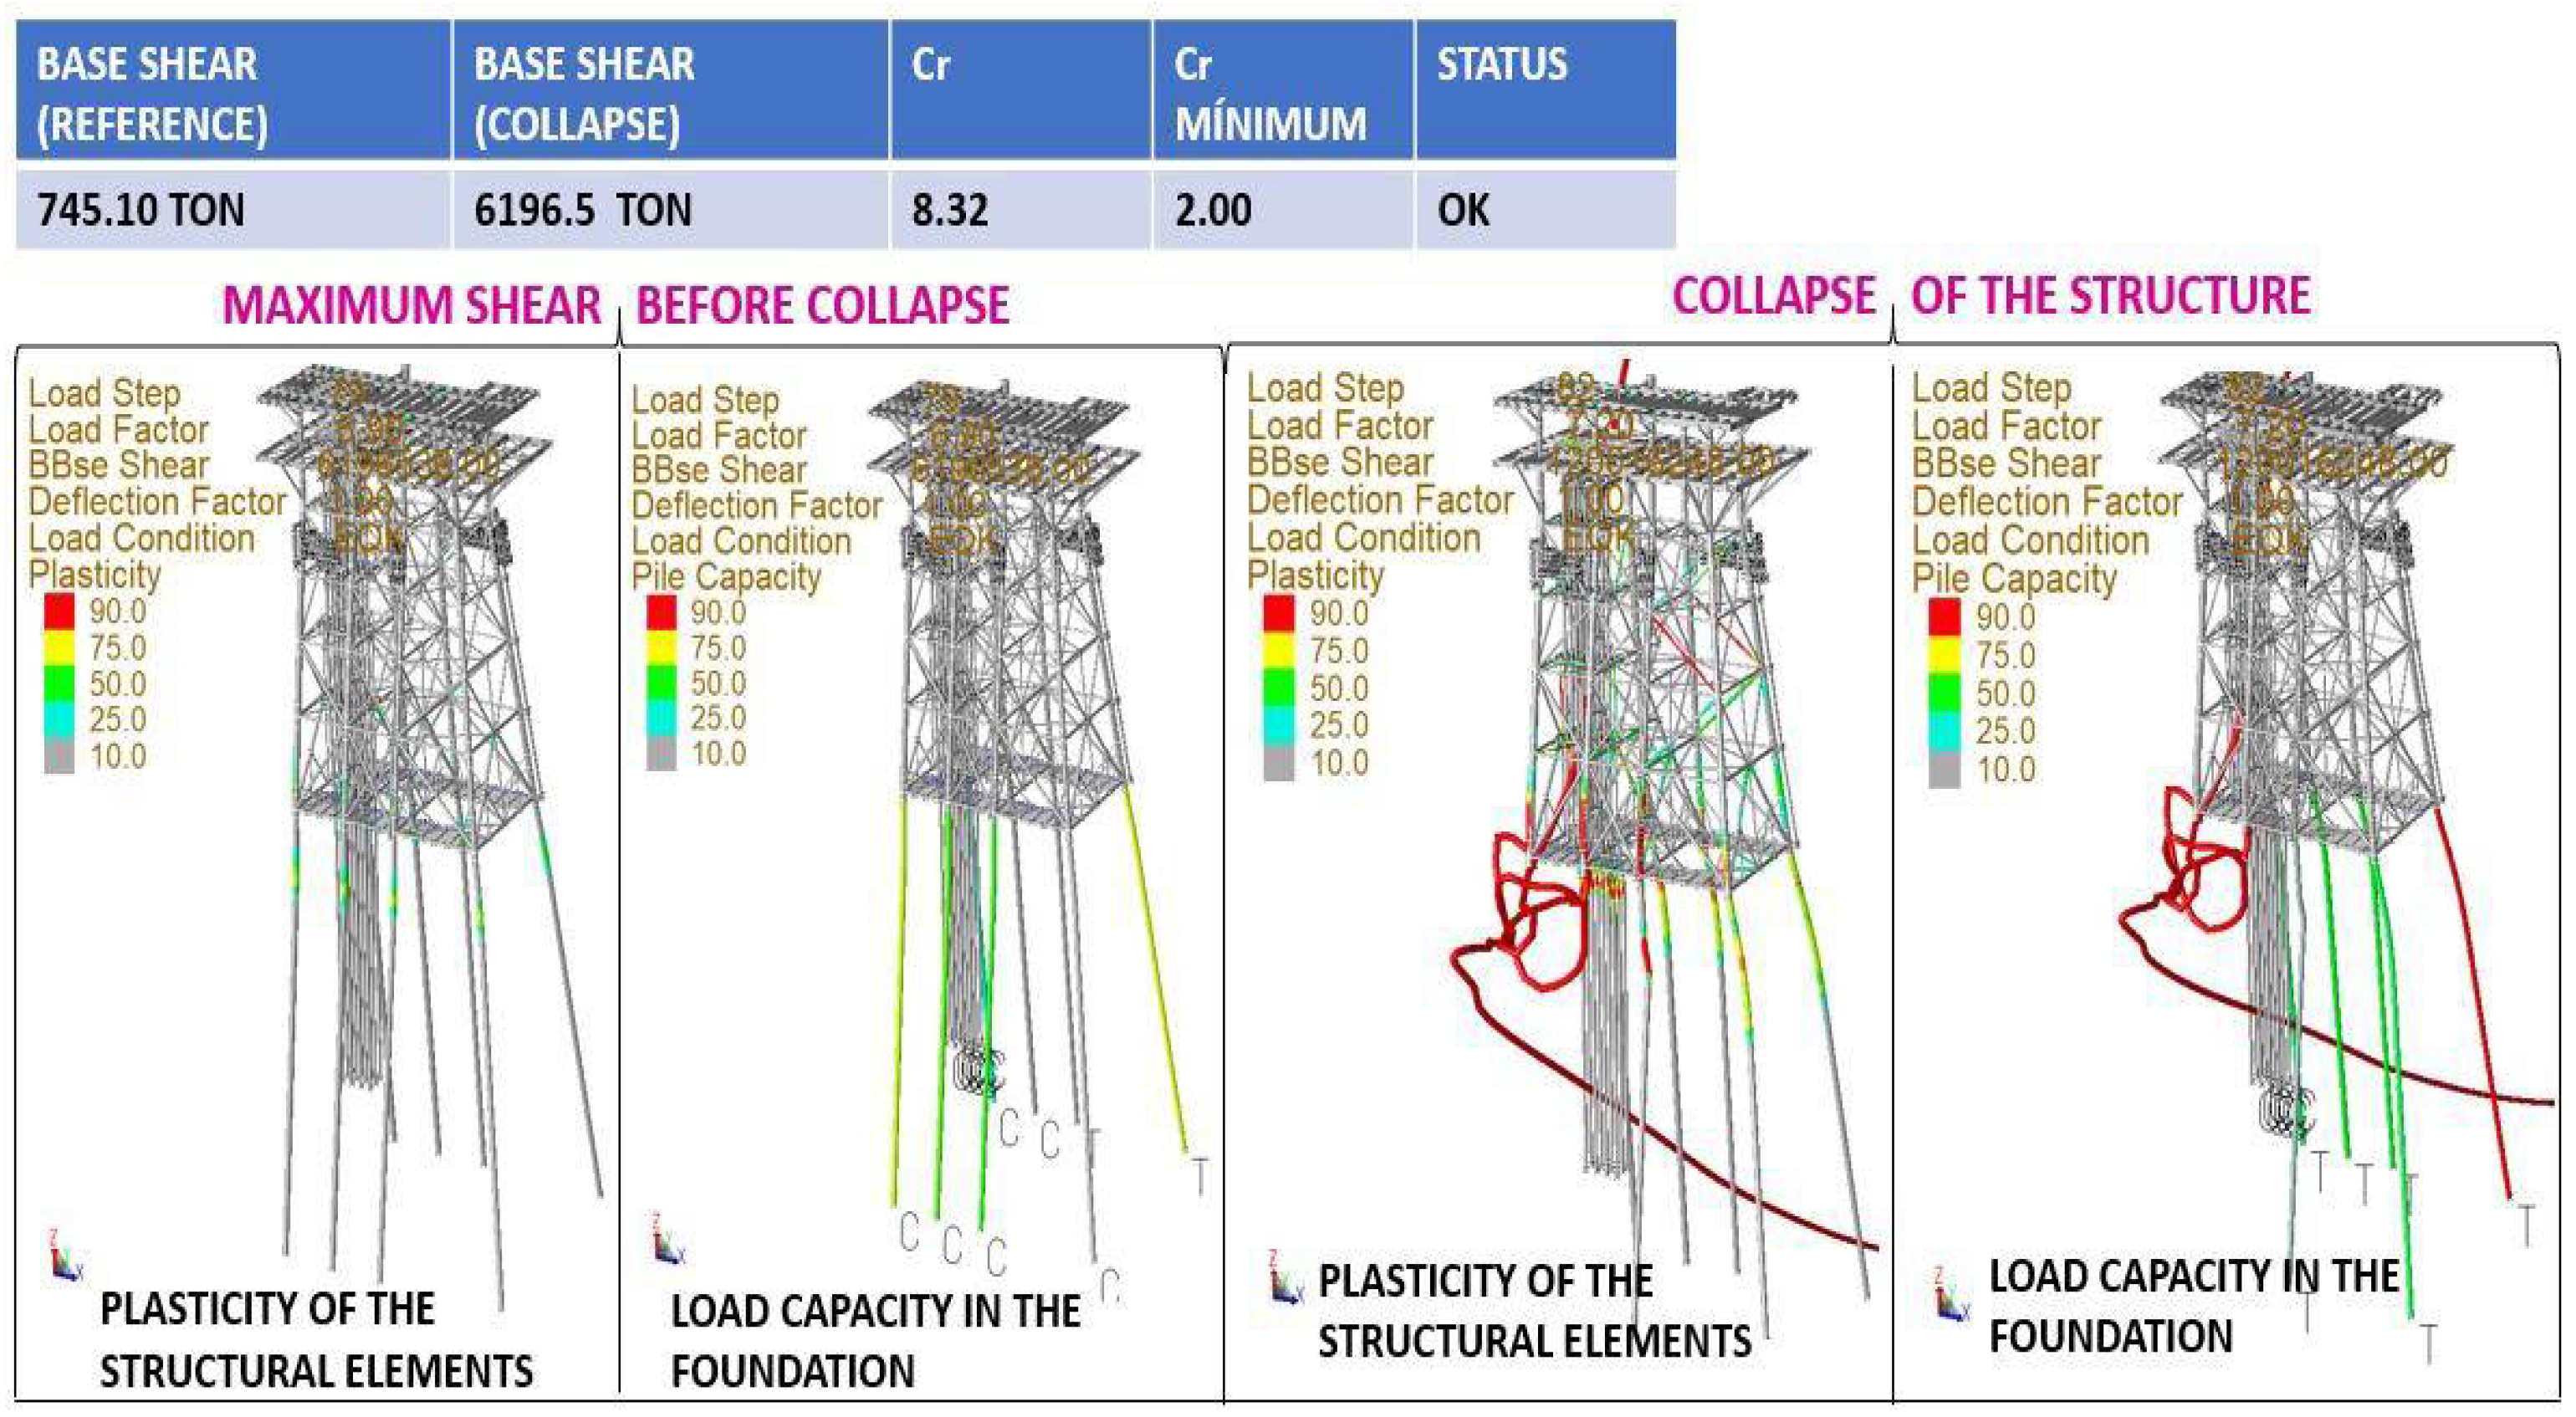
Figure 9.
Summary results of the ultimate wave resistance analysis.
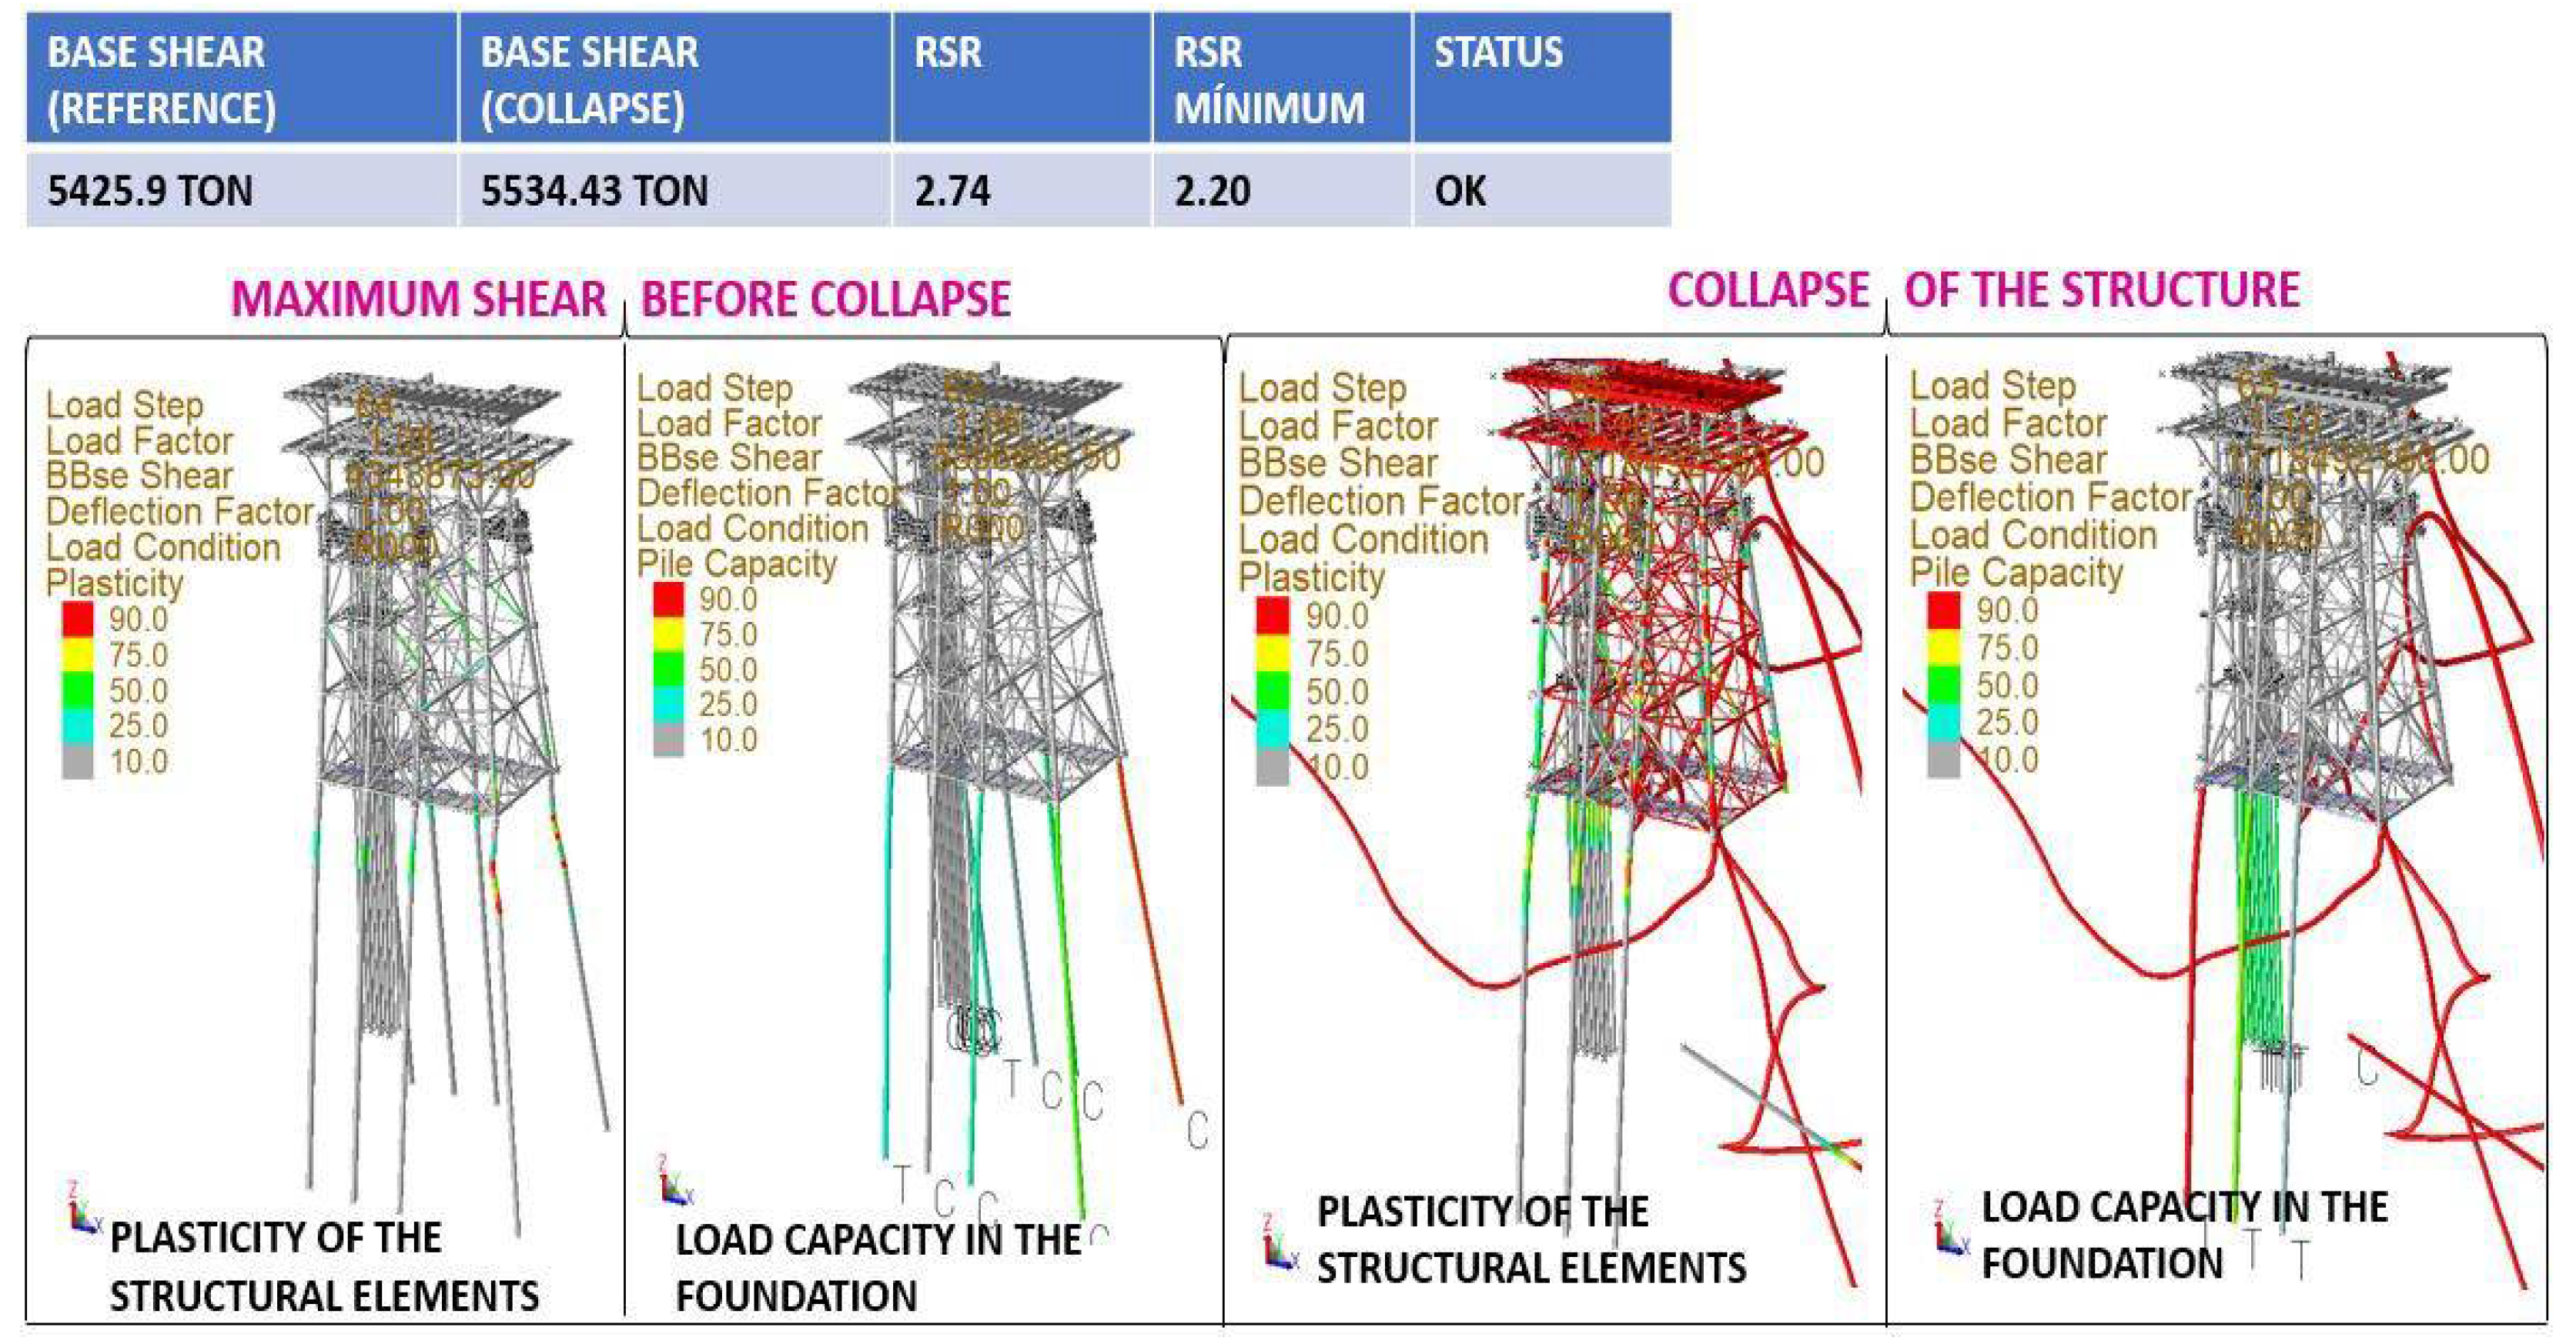
Figure 10.
Summary estimated life (Years) using API S-N curves.
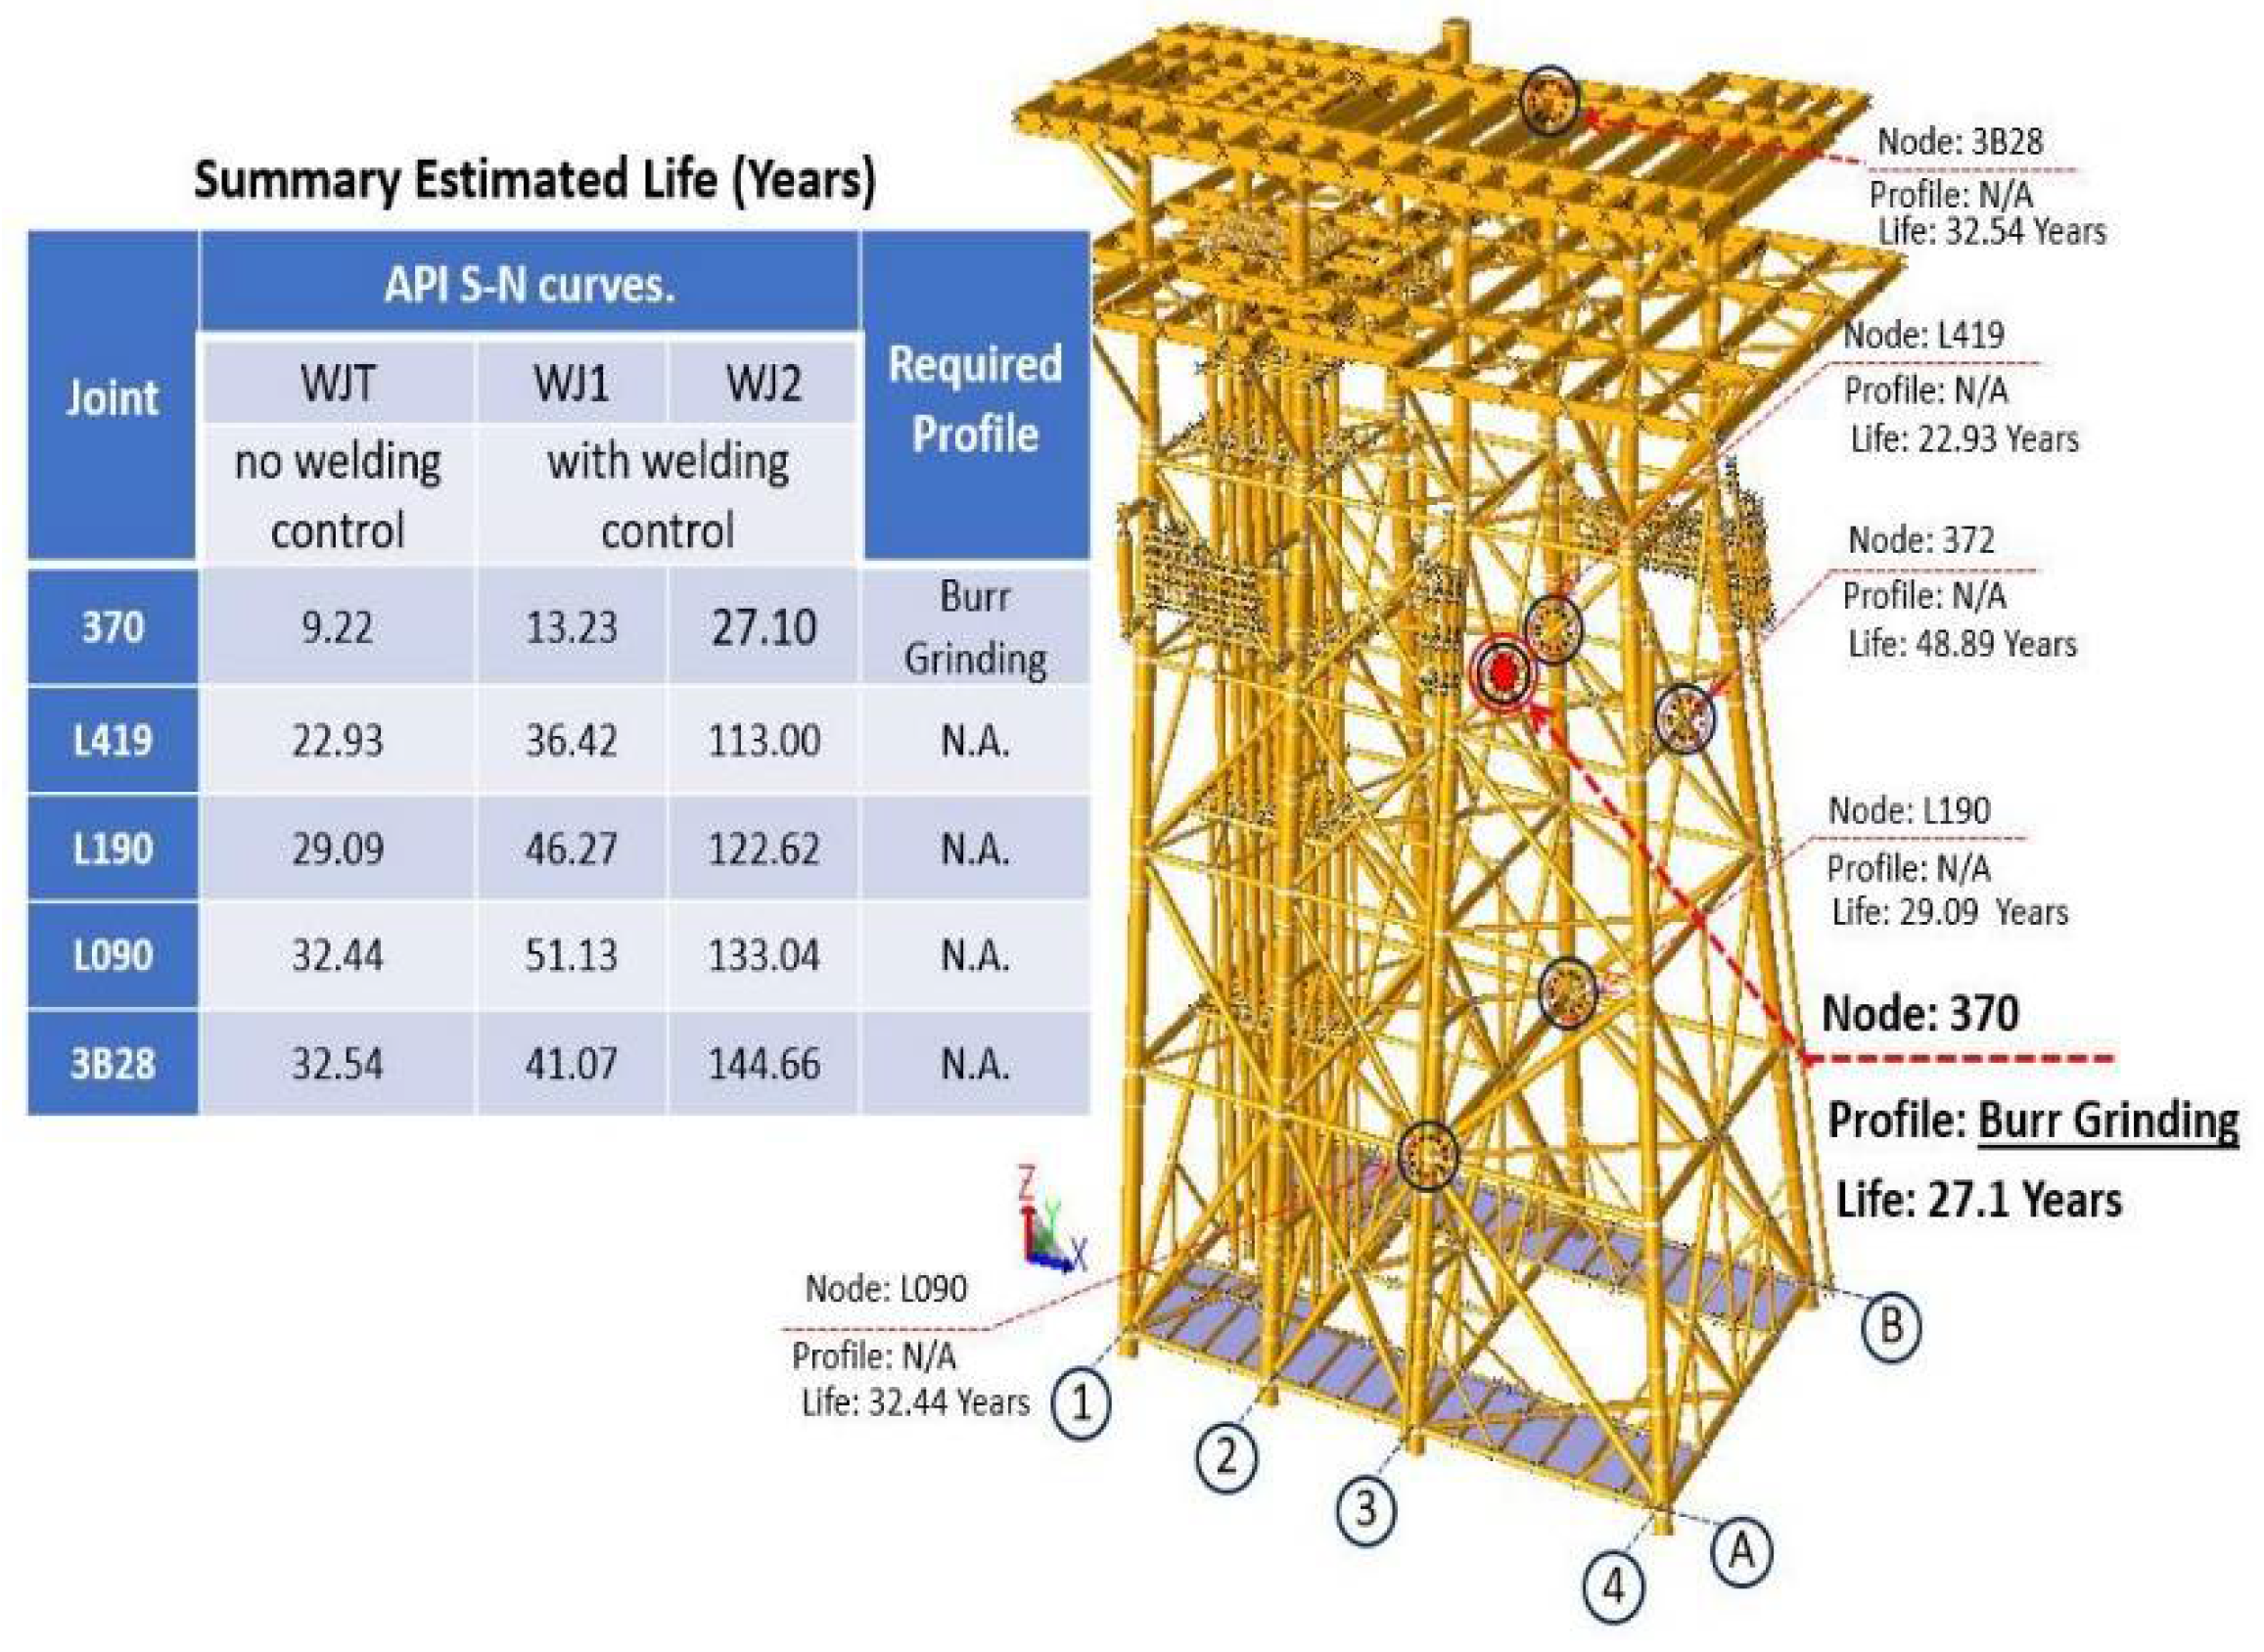

Table 1.
Environmental parameters.
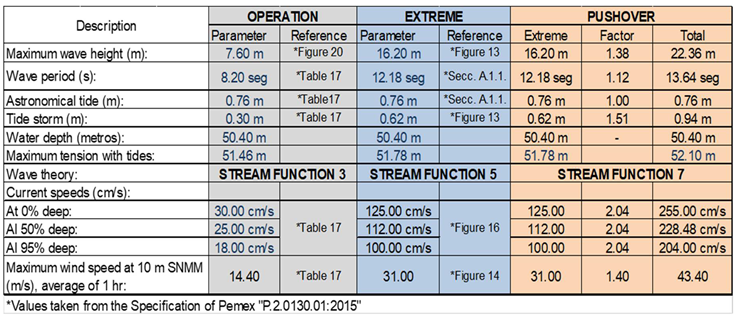
Table 2.
Coefficient parameters.
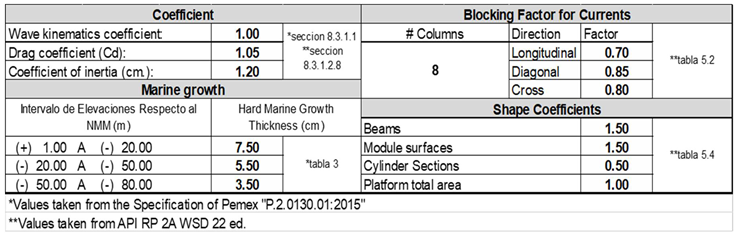
Table 3.
Numerical data of the acceleration spectrum.
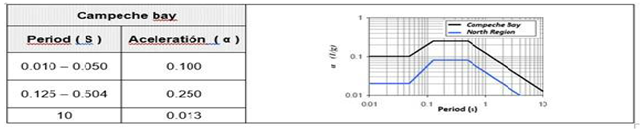
Table 4.
Summary results of the structural analysis.
Disclaimer/Publisher’s Note: The statements, opinions and data contained in all publications are solely those of the individual author(s) and contributor(s) and not of MDPI and/or the editor(s). MDPI and/or the editor(s) disclaim responsibility for any injury to people or property resulting from any ideas, methods, instructions or products referred to in the content. |
© 2024 by the authors. Licensee MDPI, Basel, Switzerland. This article is an open access article distributed under the terms and conditions of the Creative Commons Attribution (CC BY) license (http://creativecommons.org/licenses/by/4.0/).
Copyright: This open access article is published under a Creative Commons CC BY 4.0 license, which permit the free download, distribution, and reuse, provided that the author and preprint are cited in any reuse.


