Submitted:
27 June 2024
Posted:
28 June 2024
You are already at the latest version
Abstract
This report is on magneto-electric (ME) interactions in bulk composites with coaxial nanofibers of nickel zinc ferrite and PZT. Core-shell fibers of PZT and Ni1-x Znx Fe2 O4 (NZFO) with x = 0-0.5 were made by electrospinning. Both kind of fibers, either with ferrite- or PZT-core and with diameters in the range 1-3 m were made. Electron- and scanning probe microscopy images indicted well-formed fibers with uniform core and shell structures and defect free interface. X-ray diffraction data for fibers annealed at 700-900 C did not show any impurity phases. Magnetization, magnetostriction, ferromagnetic resonance, and polarization P versus electric field E measurements confirmed the ferroic nature of the fibers. For ME measurements the fibers were pressed into disks and rectangular platelets and then annealed at 900-1000 C for densification. Strengths of strain mediated ME coupling were measured by H-induced changes in remnant polarization Pr and by low-frequency ME voltage coefficient (MEVC). The fractional change in Pr under H increased in magnitude, from +3% for disks of NFO– PZT to -82% for NZFO (x=0.3)-PZT, and further increase in x resulted in a decrease to a value of -3% for x=0.5. Low-frequency MEVC measured in disks of the core-shell fibers ranged from 6 mV/cm Oe to 37 mV/cm Oe. The fractional changes in Pr and the MEVC values were an order of magnitude higher than for bulk samples containing mixed fibers with random distribution of NZFO and PZT. The bulk composites with coaxial fibers have the potential for use as magnetic field sensors and in energy harvesting applications.
Keywords:
Ferrite
; Ferroelectric
; PZT: Nanofiber
; Direct Magnetoelectric Effects
1. Introduction
Ferromagnetic-ferroelectric composites have been studied extensively for an understanding of the nature of magneto-electric (ME) interactions between the two ferroic phases and for their potential for use in a variety of applications [1,2,3,4]. Most of the studies in the past on the mechanical strain mediated coupling were on composites with 3d-transition metals/alloys, rare-earths, or ferrimagnetic oxides for the magnetic phase and PZT or PMN-PT for the ferroelectric phase and were aimed at achieving composites with strong ME coupling for use in sensors, energy harvesting, gyrators, and high frequency devices [5,6,7,8,9,10]. A variety of thin films, thick films, bilayers, and multilayer composites were investigated [1,2,3,4,11,12]. Thin films and nanopillars on a substrate in particular are susceptible to clamping due to the substrate, resulting in a reduction in the strength of magnetostrictive or piezoelectric deformation in the films and weakening of ME coupling strengths. Nanowires and core-shell composites that are free of such clamping are of importance in this regard [13,14,15]. In addition, a very high surface area to volume ratio in these structures is a key ingredient for achieving strong ME coupling.
Nanowires, nanotubes, and coaxial fibers can be prepared by a variety of techniques including template-assisted electro-deposition, chemical vapor deposition, and electrospinning.[15,16,17]. These techniques were widely employed for the synthesis of magnetic materials [18,19], ferroelectrics [20,21], and core-shell ferroic composites [22,23,24,25]. The primary focus of this report is on the nature of ME interactions in ferromagnetic-ferroelectric bulk composites consisting of core-shell structures. Early reports on core-shell fibers were on cobalt substituted nickel ferrite and barium titanate prepared by sol-gel and thermal decomposition processes [26,27], nickel ferrite-PZT nanowires prepared by template assisted sol-gel-electrodeposition [28], and spinel ferrite-PZT fibers by electrospinning [29,30]. Xie, et.al., utilized piezoresponse force microscopy (PFM) to measure the ME coupling in individual spinel ferrite-PZT fibers [29]. The PFM techniques were also used for estimates of ME coupling in a core-shell fiber of nickel ferrite-PZT and PVDF- Fe3O4 [31].
We previously reported on the synthesis of coaxial fibers of spinel ferrites or hexagonal M-, Y-, and W-type ferrites and ferroelectrics by electrospinning [25,31,32]. The core-shell structure was confirmed by electron microscopy and scanning microwave microscopy (SMM). The strength of direct ME effects (influence of magnetic field H on ferroelectric order parameters) and the converse ME effects (influence of electric filed E on magnetic parameters) were measured by low-frequency ME voltage coefficient (MEVC), H induced variations in the ferroelectric remanant polarization Pr, magneto-dielectric effects, and E-induced variations in the ferromagnetic resonance (FMR) frequency or field. Evidence for strong ME interactions were inferred from measurements on individual fibers and on 2D- and 3D-films of the fibers assembled in a magnetic field.
Here we report on a giant H-induced variation in Pr in a bulk composite with ferrite-ferroelectric core-shell fibers. There have been very few studies so far on such composites. Heinrichs, et al., recently reported on in-situ synthesis of a bulk composite with cobalt ferrite (CFO) cores and shells of a lead-free ferroelectric [33]. They inferred strong ME effects from piezo-force microscopy and reported evidence for a ferroelectric polarization in the ferrimagnetic CFO cores. In this work bulk composites of NZFO-PZT were prepared using core-shell fibers synthesized by electrospinning. Measurements of ME coupling by P vs E under H on disks of the composites revealed variations in Pr as high as -82%. Low-frequency MEVC data were also indicative of strong ME interactions in the system. The ME coupling strengths were found to be much stronger than in bulk composite made of mixed fibers with random distribution of NZFO and PZT. Details on the synthesis of the fibers and structural, magnetic, ferroelectric, and ME characterization are provided in the sections that follow.
2. Experiment
The procedure employed for the synthesis of the fibers was similar to the ones described in detail in our previous reports [32,34]. Briefly, the synthesis was done in three steps: preparation of individual sol-gels of PbZr0.52 Ti 0.48 O3 and Ni1-x Znx Fe2O4 (x = 0-0.5), dispensing the sols in syringes with a syringe pump through a metallic coaxial needle, and collection of fibers formed in the presence of a strong electric field on a rotating aluminum drum. The NZFO sol was prepared by dissolving a mixture of metal acetates or nitrates and poly(vinylpyrroli-done) (PVP, Mw~1,300,000) in a solution of ethanol and distilled water, followed by magnetic stirring for several hours until a homogeneous sol was formed. Similarly, PZT sol was prepared by dissolving a mixture of lead acetate, zirconium n-propoxide, titanium isopropoxide, and PVP in a solution of methanol and ethanol and was stirred for several hours.
Fiber synthesis was carried out in an enclosed, humidity-controlled chamber. For core-shell fibers, the PZT and NZFO sols were loaded on to two separate syringes and mounted in a syringe pump capable of dispensing the sols at a set rate through a coaxial stainless-steel needle. Fibers were formed under an electric field E=1.5-2.0 kV/cm present in the region between the needle and a rotating aluminum that served as the collector. The chamber humidity was kept at 30-40%. The fiber parameters such as the diameter of the core and shell thickness was dependent on the needle inner and outer diameters, sol viscosity, sol pumping rate, electric field E, and chamber humidity. For mixed fibers with random distribution of NZFO and PZT equal volumes of the two sols were mixed together and dispensed through a needle. The fibers were dried at 40 C for 24 hours and annealed for 1 hour at a temperature 700-900°C in air under a heating and cooling rate of 1°C/min. For magnetic, ferroelectric, and ME measurements on bulk composites the fibers were pressed into disks and rectangular platelets and annealed at 900-1000 C.
Structural measurements were carried out on annealed fibers by X-ray diffraction, SEM, SPM, and scanning microwave microscopy (SMM). Ferromagnetic characterization involved both magnetization with a Faraday balance and FMR with the use of a coplanar waveguide and vector network analyzers (VNA). Ferroelectric polarization vs electric field E was measured with a (Radiant Technologies) Ferroelectric Tester. Strengths of direct-ME effects were measured through (i) changes in remnant polarization Pr caused by a static magnetic field H and (ii) low-frequency ME voltage coefficient.
3. Results
3.1. Structural Measurements
Results of structural measurements with XRD and SEM for representative core-shell fibers are shown in Figure 1 (also in Supplement: Figures S1–S4). The XRD patterns in Figure 1a,b for annealed fibers of NZFO with x=0 and 0.3 and PZT show diffraction peaks corresponding to the ferrite and PZT and are labeled in the figures. There was no indication of the presence of impurity phases in the data. The SEM image for a collection of fibers are shown in Figure 1c. Fibers with diameters ranging from 250 nm to 3 μm and of various lengths are seen. The measurements revealed that 60% of the fibers had diameters over a narrow 500 to 1500 nm range, but were free of any defects such as bubbles or discontinuities. It is also evident from the SEM image for a single fiber in Figure 1d that a uniform core and shell structure with a well-defined interface is present in the fibers.
Scanning probe microscopy was utilized to examine the annealed fibers. Figure 2 shows such images for a single fiber of NFO shell-PZT core. The AFM topography image in Figure 2a reveals a well-formed uniform, defect-free fiber. The core-shell structure with PZT core and NFO shell is seen in the magnetic force microscopy (MFM) image in Figure 2b. Both the core diameter and the shell thickness are uniform throughout the length of the fiber. The capacitance image at 10 GHz in Figure 2c acquired with a SMM also shows the desired core and shell structure for the fiber. Similar scanning probe microscopy images were seen for NZFO (x=0.1-0.5)-PZT fibers.
3.2. Magnetic Characterization
For characterization in terms of magnetization, FMR, and magnetostriction, the fibers were pressed into thin platelets or circular discs and annealed at 1000 C. Samples with fibers of both ferrite cores as well as PZT cores were made for these measurements. A Faraday balance was used to measure the magnetization M as a function of static magnetic field H. Data on M vs H are shown in Figure 3 for representative samples with ferrite core and PZT shell. Similar magnetization data for fibers with PZT cores and for all other fibers studied are shown in the supplement figures F5 and F6. A typical M vs H expected for a ferromagnet is seen in the figures and the saturation of M occurs for most of the fibers for H > 2 kOe. The saturation magnetization M0 values for the fibers (from Figures 3, S5 and S6) vary from 5 emu/g to 24 emu/g that are smaller than reported values of 50 emu/g for x=0 to 80 emu/g for x=0.5 for bulk polycrystalline ferrites NiZn-ferrites vary from [35]. A comparison of M0-values for the NIZn ferrite-PZT fibers with reported values for polycrystalline ferrites is complicated by the fact that there is a significant variation in the NZFO content among the fibers with a specific Zn substitution as well as in fibers with different Zn substitutions.
Ferromagnetic resonance was done on NZFO-PZT fibers pressed into a thin rectangular platelet and annealed at 1000 C. The sample was placed on top of a coplanar waveguide. With a static magnetic field H applied parallel to the sample plane, a VNA was used for excitation with the microwave power and to record the amplitude of the scattering matrix S21 as a function of the frequency f of the microwave power. Figure 4 and Figure 5 show profiles of S21 vs f for a series of H-values for samples of NZFO core-PZT shell for x=0.2 and 0.3, respectively. FMR is seen as absorption of microwave power in the profiles and power absorbed increases with increase in H and is accompanied by narrowing of the absorption peaks. The half-power frequency-widths of the resonances are on the order of 5-8 GHz that are very high as expected for nanofibers of NZFO.
Similar characteristics are also observed in the FMR profiles for NZFO-PZT that are shown in the supplement (Figures S7–S9). One can determine the gyromagnetic ratio γ and the effective magnetization 4πMeff = 4πM0 + Ha, where Ha is the anisotropy field, by fitting the resonance frequency fr versus H data (obtained from the profiles as in Figure 4 and Figure 5) to the Kittle equation,
(fr/γ)2 = H (H + 4πMeff ).
The gyromagnetic ratio γ values for fibers are in the range from 2.54 GHz/kOe to 3.13 GHz/kOe and are comparable to 3.0 to 3.2 GHz/kOe reported for polycrystalline nickel zinc ferrites [35,36,37]. The values of 4πMeff for the fiber samples vary from a minimum of 250 G for x=0 to a maximum of 3.07 kG for x=0.2. We did not estimate Ha from 4πMeff and measured values of Mo due to the fact that the powder samples of fibers used for magnetization measurements could have significantly different ferrite contents than the platelet used for FMR.
Magnetostriction is a key parameter that determines the strength of ME coupling in NZFO-PZT composites and was measured in the platelets of the fiber samples. A strain gage, bonded to the sample surface with a thin 2-part epoxy (M-bond 600, Micro Measurements) and a strain indicator were used for the measurements of magnetostriction λ11 parallel to the sample length and to the applied static magnetic field H. Figure 6 shows λ11 vs H data for samples of NZFO (x=0.5) – PZT and NZFO (x=0.4) and for fibers with both ferrite cores as well as PZT cores. The magnetostriction for NZFO(x=0.5)-PZT with ferrite core is negative, as is the case for bulk polycrystalline samples, and increases in magnitude with increasing H [38]. When H is decreased back to zero a hysteresis in λ11 is evident. When H is reversed is λ11 is negative and its overall field dependence stays the same as for H > 0. For the composite of x=0.5 with PZT core, however, λ11 is positive with its magnitude increasing with H to 11 ppm for H = 2.5 kOe. When H is decreased back to zero, λ11 continues to increase to a maximum of 13 ppm for H = 1 kOe and then decreases to a remnant value of 10 ppm. Upon reversal of the direction of H, λ11 continues to decreases to 5 ppm for H = -2.5 kOe. For fibers with x=0.4 and NZFO core the magnetostriction is negative with a maximum value of -5 ppm, and its H-dependence is the same as for the fibers with x=0.5. For fibers of x=0.5 with PZT core λ11 is negative and increase in magnitude 3 ppm for H = 2.5 kOe. When H is decreased to zero, λ11 decreases to zero for H ~ 1 kOe, and shows a sign reversal and a peak value of 5 ppm for H~ 0. Upon reversal of direction of H λ11 decreases to zero as H is increased to -2.5 kOe.
Similar λ11 vs H data for NZFO-PZT with x = 0.3 and 0.2 are shown in Figure 7. The key features of the results are as follows. (i) Samples with x = 0.3 show a hysteresis in λ11 vs H data with a maximum value of around -2 ppm and a sign reversal to a peak value of 1 ppm. (ii) Fibers with x = 0.2 shows the maximum value of λ11= - 8 ppm for fibers with ferrite core and -11 ppm for fibers sample with PZT core. The results in Figure 6 and Figure 7 also indicate an overall increase in the maximum value of λ11 with decreasing Zn content in NZFO. Finally, the magnetostriction data for x = 0.1 (shown in the supplement Figure S10) show similar hysteresis in its H-dependence and a variation in the peak values of from -6 ppm to + 6 ppm for the sample with the ferrite core whereas the sample with PZT core has a maximum magnetostriction of around 2 ppm.
3.3. Ferroelectric and Magneto-Electric Characterization
Discs made of the core-shell fibers were used for studies on ferroelectric characterization by measuring the polarization P as a function of applied static electric field E using a (Radiant Technologies) ferroelectric tester. The strength of direct-ME interactions, i.e., the influence of H on ferroelectric order parameters, was determined by measuring the fractional change in the remnant polarization ΔPr/Pr under H by measuring P vs E as a function of H. Figure 8a–d show P vs E for a series of H values for NZFO (x = 0.5) -PZT for samples with both ferrite core as well as PZT core and for increasing and decreasing magnitudes of ±H. Variation in P with E in Figure 8 is typical of ferroelectrics, but the P-values are rather small compared to reported values for pure PZT nanofiber samples and thin films [20,21]. The maximum value of P in Figure 8 is 8 nC/cm2 for samples containing ferrite or PZT cores. The low P-values could be attributed to anticipated large leakage currents since the samples are essentially bulk composites with low resistivity ferrite cores or shells. Figure 8e shows the fractional H-induced variation ΔPr/Pr with H determined from P vs E data. A general decrease in Pr with H is evident from the data except for ΔPr/Pr = +2.5% at H = 2 kOe for the sample with ferrite core.
Measurements on discs of fibers with NZFO (x=0.4)-PZT and NZFO (x=0.3)-PZT show evidence for a giant H-induced variation in ΔPr/Pr as discussed next. Figure 9 shows results on P vs E as a function of H and ΔPr/Pr vs H for samples of NZFO (x=0.4)-PZT. The maximum values of P are 15 nC/cm2 for samples with ferrite core and 20 nC/cm2 for the disc with PZT cores and are much higher than for the samples with x=0.5. For both samples there is a decrease in Pr upon the application of H. Figure 9e shows estimated ΔPr/Pr vs H. For the sample made of fibers with ferrite core, one observes a near-linear decrease in Pr with increasing H and ΔPr/Pr reaches a value of -15% for H=5 kOe. When H is decreased from 5 kOe to 0, ΔPr/Pr shows a further linear decrease to -24 % for H=0. A much higher decrease in ΔPr/Pr with H is observed Figure 9e for the sample containing fibers with PZT core. With increasing H, ΔPr/Pr decreases rapidly to a value of -44% at H=5 kOe and then a further decline to -64% when H is decreased back to zero.
Figure 10 shows P vs E under H and results on ΔPr/Pr vs. H for discs with NZFO (x=0.3)-PZT fibers. The maximum P-value of 80 nC/cm2 is a factor 2 to 4 higher than for samples with fibers of x = 0.5 and 0.4. Application of H leads to a sharp decrease in Pr and ΔPr/Pr for the sample with ferrite core decreases by 70% as H is increased to 5 kOe. With a subsequent decrease in H ΔPr/Pr decreases by 83% for H=0. The sample with PZT core shows a similar behavior with an identical decrease in Pr with a net decrease of 83% in ΔPr/Pr.
We carried out similar measurements on discs with fibers of NZFO (x=0.2,0.1 and 0)-PZT and the results are shown in the supplement Figures S11–S13. The maximum P-value decreases to 20nC/cm2 and 8 nC/m2, respectively, or samples with x=0.2 and 0.1 and ΔPr/Pr values are found to be in the range -2% to + 5%, much smaller than for samples with x=0.3 and 0.4 and. Figure 11 summarizes results of H induced variations in Pr for NZFO-PZT fibers with Zn concentration from 0 to 0.5. The maximum change in ΔPr/Pr is plotted as a function of x. The ferroelectric remnant polarization for the fiber discs under a static magnetic field shows a relatively small change with Zn content in the ferrite with the exception of Zn content x = 0.3 and 0.4. Thus there is evidence for a giant ME coupling in the bulk composites with NZFO-PZT fiber, in particular for Zn concentration x=0.3 and 0.4.
We also performed low-frequency magneto-electric voltage coefficient (MEVC) for characterization of direct-ME effects. The measurements were done on rectangular platelets of the fibers. A static field H and an AC magnetic field h at 100 Hz were applied parallel to each other and to the sample plane and along the length of the sample. The ME voltage V induced in the sample was measured with a lock-in amplifier. The ME coefficient α31 = V/(t h), where t is the sample thickness, was measured as a function of H. Figure 12 shows α31 vs H data measured with h=5 Oe at 100 Hz for samples with fibers of NZFO (x=0.5)-PZT and NZFO (x=0.4) – PZT. As H is increased from zero, one notices a sharp jump in α31 to a large value of ~ 6 mV/cm Oe for x=0.5. The H dependence of α31 is rather weak with a small decrease for the maximum H value of 2.5 kOe. When H is decreased back to zero, in addition to a hysteresis α31 at H=0 as a high its maximum value. Reversal of H direction is accompanied by a 180 deg phase difference in α31, but the its magnitude and H-dependence remain the same as for +H. For the sample with x = 0.4, the data in Figure 12 shows hysteresis and a large zero-field MEVC, similar to the H dependence for x=0.5. The maximum values of α31 are 5.5 mV/cm Oe for the sample with NZFO core and 12 mV/cm Oe for the sample with PZT core which is a factor to two higher than for the sample with x = 0.5.
Low-frequency MEVC data for samples with NZFO-PZT with x = 0.3 and 0.2 are shown in Figure 13. The overall H-dependence of α31 with hysteresis and a large zero-field MEVC when H is decreased back to zero are the same as for the results for x=0.4 and 0.5 in Figure 12, but the ME coefficients are relatively high. The sample of x=0.2 with PZT core shows the highest α31 value of ~40 MV/cm Oe among the systems studied. Similar measurements for NZFO (x=0.1)-PZT showed a maximum α31 of ~ 10 mV/cm Oe (Supplement Figure S14). Finally, MEVC data for the sample of NFO-PZT in Figure 14 also shows significant hysteresis and a large zero-field ME coefficient. Unlike the case of thick film and thin film layered ferrite-PZT composites that show a gradual increase in α31 to a maximum followed by a decrease to zero for high H-values, the bulk composites with core-shell fibers in this study reveal very weak H-dependence.
4. Discussion
Nanofibers of nickel zinc ferrite and PZT with core-shell structures were synthesized by electrospinning. Fibers annealed at high temperatures were free of any impurity phases and electron and scanning probe microscopy images showed fibers of uniform diameter with well-formed cores and shells. A ferromagnetic character for the fibers was evident from magnetization and ferromagnetic resonance measurements. The gyromagnetic ratio γ for the fibers was in the range 2.5-3.1 GHz/kOe, in general agreement with reported values of 3.0 – 3.3 GHz/kOe for NiZn ferrites [36,37]. Determination of values of other ferromagnetic order parameters such as saturation magnetization and magnetic anisotropy field for the fibers for comparison with pure NiZn-ferrite, however, was not feasible due to the wide distribution in the core diameters and shell thicknesses and difficulties with the determination of volume or weight fraction of ferrite in the fibers.
Magnetostriction measured in platelets of the fibers showed the following important features. (i) Strong hysteresis and remanence were seen in λ11 vs H for all of the Zn substitutions. (ii) The maximum magnetostriction values were much smaller than reported values of -15 ppm to -30 ppm for polycrystalline NiZn ferrites [38]. (iii) Samples with NZFO cores had maximum value of λ11 = -2 ppm for x=0.5 to -8 ppm for x=0.2. (iv) Platelets with fibers of PZT cores had the maximum value of λ11 = -12 ppm for x=0.2. (v) The positive value of magnetostriction for fibers with NZFO (x = 0.4 and 0.5) shell- PZT core is rather unique and its cause needs to be understood.
Results on P vs E confirm the ferroelectric nature of the fibers. The maximum values of P, in the range 8-80 nC/cm2, are comparable to reported values of 80-90 nC/cm2 for NFO-PZT [34]. The polarization values, however, are smaller than 2-3 μC/cm2 measured in NFO-barium titanate (BTO) fibers [39] and two orders of magnitude smaller than for bulk and thin film PZT [21] that could be attributed to large leakage current due to the presence low resistivity NiZn ferrites in the fibers. The most significant aspect in the present study is the strength of ME coupling by static magnetic field induced ferroelectric polarization, i.e., the very large reduction in Pr, on the order of 64% to 83%, in the fibers with x = 0.3 and 0.4 which is probably highest ever reported. Past reports include ΔPr/Pr ~ 5% for NFO-PZT [34], 3% - 6% for NFO-BTO [39], and -22% in strontium ferrite-ferroelectric core-shell fiber samples [25]. Recent studies on core shell fibers of Y-type hexagonal ferrites and PZT reported fractional decrease in Pr on the order of 12%-20% [40,41]. The H-induced polarization variations in NZFO-PZT coaxial fibers is the highest reported so far.
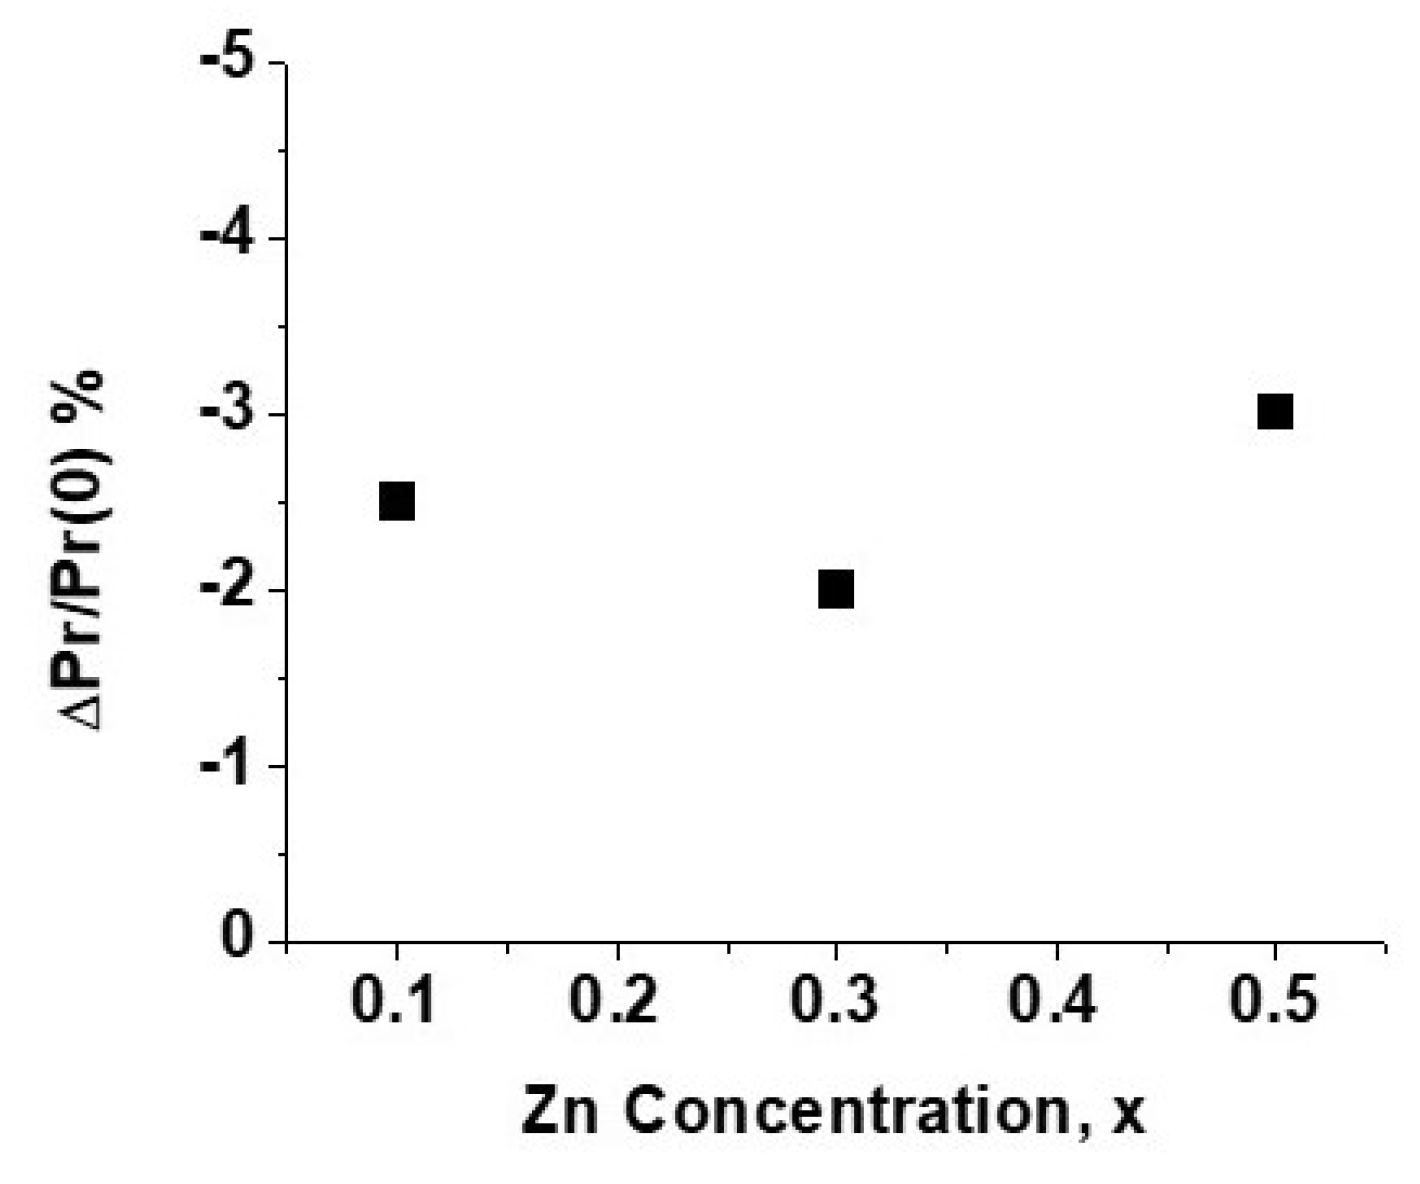
An important question to be addressed in regard to the giant H-induced reduction Pr is the phenomenon related specifically to the core-shell structure for the fibers. In order to address this, we prepared fibers with random distribution of NZFO and PZT by using a sol containing equal volumes of NZFO (x=0.1, 0.3 and 0.5) and PZT and characterized in terms of structural and magnetic parameters (Supplement Figures S15 and S16). H-induced change in Pr was measured in discs of the fibers (Figure S17). Figure 15 shows the maximum variation in ΔPr/Pr with x. It is obvious from the -2% to -3% variation in ΔPr/Pr for mixed NZFO-PZT fiber samples that the giant H-induced change in Pr for core-shell fiber samples with x = 0.3 and 0.4 (Figure 11) is indeed unique to the core-shell structure for the composite. A follow up study on core-shell composites of NZFO-PZT with x = 0.25 to 0.45 (in steps of 0.05) may be essential in this regard.
Finally, we discuss results of low-frequency ME effects in the core-shell fiber samples. Significant inferences from the data in Figure 12, Figure 13 and Figure 14 are as follows. (i) H-dependence of α31 shows hysteresis and remanence and a large zero-bias ME coefficient. (ii) Sample with NZFO (x=0.2) – PZT show the highest value of α31 = 37 mV/cm Oe. (iii) ME coefficients for the core-shell samples are much higher than = 3-4 mV/cm Oe measured in fiber samples with randomly distributed NZFO and PZT (data shown in supplement Figure S17) and compares favorably with reported α31 values of 12-24 mV/cm Oe for NFO-hexagonal ferrite fibers and much higher than ~ 0.5 mV/cm Oe for NFO-BTO fiber samples [24,39].
5. Conclusions
Studies on the nature of ME effects were performed on coaxial nanofibers of NZFO with Zn substitutions from 0 to 0.5 and PZT prepared by electrospinning. The fibers annealed at high temperatures were free of impurity phases and of uniform diameter and defect free core-shell interface. Magnetization measured on fibers with a Faraday balance and ferromagnetic resonance on platelets of pressed and annealed fibers confirmed the ferromagnetic nature of NZFO. The ferroelectric polarization measured on fiber discs was found to be small compared to values reported for thin films of PZT. Results on H-induced variation in the remnant polarization in the composites were indicative of a giant ME coupling, in particular in discs of fibers with NZFO with Zn substitutions of 0.3 and 0.4. We also inferred a strong ME coupling in the composites from measured low-frequency ME voltage coefficients that were as high as 40 mV/cm Oe. A strong ME response even without an external magnetic field was also evident from the present study. Overall, this study suggests that coaxial nanofibers of nickel zinc ferrites and ferroelectrics are promising candidates for applications in magnetic sensors due to their strong magneto-electric coupling.
Supplementary Materials
The following supporting information can be downloaded at the website of this paper posted on Preprints.org.
Author Contributions
B. G, S. S, S. A., and C. K. synthesized the nanofibers; B. G, S. S, S. M., were involved structural measurements and characterization; J. Z., M. J., M. R. P., and G.S acquired funding and managed the project, all the authors were involved in manuscript preparation.
Funding
The research at Oakland University was supported by grants from the National Science Foundation (NSF) (ECCS-1923732, ECCS-EAGER-2236879), and the Air Force Office of Scientific Research (AFOSR) Award No. FA9550-20-1-0114. Efforts at University of Connecticut was supported by an NSF Grant (ECCS-EAGER-2236879) The research at AFRL was supported by a grant from the AFOSR (Award No. FA9550-23RXCOR001).
Data Availability
The datasets generated during and/or analyzed during the current study are available from the corresponding author on reasonable request.
Conflicts of Interest
The contents of this report reflect the views of the author(s) who are responsible for the facts and the accuracy of the data presented herein. The contents do not necessarily reflect the views of any of the author institutions. This report does not constitute a standard, specification, or regulation. While trade names may be used in this report, it is not intended as an endorsement of any machine, contractor, process, or product.
References
- Sun, N.; Priya, S.; Srinivasan, G. (Eds.) Composite magnetoelectrics: materials, structures, and applications; Elsevier: New York, 2015. [Google Scholar]
- Hu, J.M.; Nan, C.W. Opportunities and challenges for magnetoelectric devices. APL Materials. 2019, 7, 080905. [Google Scholar] [CrossRef]
- Bichurin, M.; Petrov, R.; Sokolov, O.; Leontiev, V.; Kuts, V.; Kiselev, D.; Wang, Y. Magnetoelectric magnetic field sensors: A review. Sensors. 2021, 21, 6232. [Google Scholar] [CrossRef] [PubMed]
- Herrera Diez, L.; Kruk, R.; Leistner, K.; Sort, J. Magnetoelectric materials, phenomena, and devices. APL Materials. 2021, 9, 05040. [Google Scholar] [CrossRef]
- Narita, F.; Fox, M. A review on piezoelectric, magnetostrictive, and magnetoelectric materials and device technologies for energy harvesting applications. Advanced Engineering Materials. 2018, 20, 1700743. [Google Scholar] [CrossRef]
- Annapureddy, V.; Palneedi, H.; Hwang, G.T.; Peddigari, M.; Jeong, D.Y.; Yoon, W.H.; Kim, K.H.; Ryu, J. Magnetic energy harvesting with magnetoelectrics: an emerging technology for self-powered autonomous systems. Sustainable Energy & Fuels. 2017, 1, 2039–2052. [Google Scholar]
- Leung, C.M.; Li, J.; Viehland, D.; Zhuang, X. A review on applications of magnetoelectric composites: From heterostructural uncooled magnetic sensors, energy harvesters to highly efficient power converters. Journal of Physics D: Applied Physics. 2018, 51, 263002. [Google Scholar] [CrossRef]
- Wang, Y.J.; Gao, J.Q.; Li, M.H.; Shen, Y.; Hasanyan, D.; Li, J.F.; Viehland, D. A review on equivalent magnetic noise of magnetoelectric laminate sensors. Philosophical Transactions of the Royal Society A: Mathematical, Physical and Engineering Sciences. 2014, 372, 20120455. [Google Scholar] [CrossRef] [PubMed]
- Yan, Y.; Geng, L.D.; Tan, Y.; Ma, J.; Zhang, L.; Sanghadasa, M.; Ngo, K.; Ghosh, A.W.; Wang, Y.U.; Priya, S. Colossal tunability in high frequency magnetoelectric voltage tunable inductors. Nature communications. 2018, 9, 4998. [Google Scholar] [CrossRef] [PubMed]
- Liang, X.; Chen, H.; Sun, N.X. Magnetoelectric materials and devices. APL Materials. 2021, 9. [Google Scholar] [CrossRef]
- Palneedi, H.; Maurya, D.; Kim, G.Y.; Annapureddy, V.; Noh, M.S.; Kang, C.Y.; Kim, J.W.; Choi, J.J.; Choi, S.Y.; Chung, S.Y.; Kang, S.J. Unleashing the full potential of magnetoelectric coupling in film heterostructures. Advanced Materials. 2017, 29, 1605688. [Google Scholar] [CrossRef]
- Liang, X.; Dong, C.; Chen, H.; Wang, J.; Wei, Y.; Zaeimbashi, M.; He, Y.; Matyushov, A.; Sun, C.; Sun, N. A review of thin-film magnetoelastic materials for magnetoelectric applications. Sensors. 2020, 20, 1532. [Google Scholar] [CrossRef] [PubMed]
- Xie, S.H.; Liu, Y.Y.; Li, J.Y. Synthesis, microstructures, and magnetoelectric couplings of electrospun multiferroic nanofibers. Frontiers of Physics. 2012, 7, 399–407. [Google Scholar] [CrossRef]
- Viehland, D.; Li, J.F.; Yang, Y.; Costanzo, T.; Yourdkhani, A.; Caruntu, G.; Zhou, P.; Zhang, T.; Li, T.; Gupta, A.; Popov, M.; et al. Tutorial: Product properties in multiferroic nanocomposites. Journal of Applied Physics 2018, 124. [Google Scholar] [CrossRef]
- Wang, N.; Cai, Y.; Zhang, R.Q. Growth of nanowires. Materials Science and Engineering: R: Reports. 2008, 60, 1–51. [Google Scholar] [CrossRef]
- Pant, M.; Singh, R.; Negi, P.; Tiwari, K.; Singh, Y. A comprehensive review on carbon nano-tube synthesis using chemical vapor deposition. Materials Today: Proceedings. 2021, 46, 11250–11253. [Google Scholar] [CrossRef]
- Li, Y.; Zhu, J.; Cheng, H.; Li, G.; Cho, H.; Jiang, M.; Gao, Q.; Zhang, X. Developments of advanced electrospinning techniques: A critical review. Advanced Materials Technologies. 2021, 6, 2100410. [Google Scholar] [CrossRef]
- Piraux, L. Magnetic nanowires. Applied Sciences. 2020, 10, 1832. [Google Scholar] [CrossRef]
- Jia, Y.; Yang, C.; Chen, X.; Xue, W.; Hutchins-Crawford, H.J.; Yu, Q.; Topham, P.D.; Wang, L. A review on electrospun magnetic nanomaterials: methods, properties and applications. Journal of Materials Chemistry C. 2021, 9, 9042–9082. [Google Scholar] [CrossRef]
- Liang, L.; Kang, X.; Sang, Y.; Liu, H. One-dimensional ferroelectric nanostructures: synthesis, properties, and applications. Advanced Science. 2016, 3, 1500358. [Google Scholar] [CrossRef]
- Sharma, S. Ferrolectric nanofibers: principle, processing and applications. Advanced Materials Letters. 2013, 4, 522–533. [Google Scholar] [CrossRef]
- Wen, X.; Dai, J.; Feng, W.; Cheng, C.; Huang, D. SrFe12O19@ ZnFe2O4 core–shell composite fiber with enhanced exchange coupling interaction. Journal of Magnetism and Magnetic Materials. 2023, 568, 170278. [Google Scholar] [CrossRef]
- Dai, J.; Wen, X.; Feng, W.; Cheng, C.; Huang, D. Correlation of the heat treatment feature and magnetic properties of the SrFe12O19@ ZnFe2O4 core-shell nanofibers. Materials Chemistry and Physics. 2022, 276, 125393. [Google Scholar] [CrossRef]
- Huang, D.; Wen, X.; Dai, J.; Wang, Q.; Liu, H.; Li, Z. Magnetic Properties and Exchange Coupling Effects of SrFe12O19@ MFe2O4 (M= Co, Ni, Zn) as Hard-Soft Magnetic Ferrite Core–Shell Nanofibers. Journal of Superconductivity and Novel Magnetism. 2023, 36, 711–719. [Google Scholar] [CrossRef]
- Srinivasan, G.; Liu, Y.; Zhang, T. Magneto-electric effects in coaxial nanofibers of hexagonal ferrites and ferroelectrics. Ferroelectrics. 2023, 611, 161–170. [Google Scholar] [CrossRef]
- Shen, X.; Zhou, Z.; Song, F.; Meng, X. Synthesis and magnetic properties of nanocomposite Ni1− x CoxFe2O4–BaTiO3 fibers by organic gel-thermal decomposition process. Journal of sol-gel science and technology. 2010, 53, 405–411. [Google Scholar] [CrossRef]
- Schileo, G. Recent developments in ceramic multiferroic composites based on core/shell and other heterostructures obtained by sol–gel routes. Progress in Solid State Chemistry. 2013, 41, 87–98. [Google Scholar] [CrossRef]
- Liu, M.; Li, X.; Imrane, H.; Chen, Y.; Goodrich, T.; Cai, Z.; Ziemer, K.S.; Huang, J.Y.; Sun, N.X. Synthesis of ordered arrays of multiferroic NiFe2O4-Pb (Zr0.52 Ti0.48) O3 core-shell nanowires. Applied physics letters. 2007, 90, 152501. [Google Scholar]
- Zheng, J.C.; Shen, X.Q.; Min, C.Y.; Meng, X.F.; Liang, Q.R. Fabrication and characterization of heterostructural CoFe2O4/Pb (Zr0.52 Ti0.48) O3 nanofibers by electrospinning. Journal of composite materials. 2010, 44, 2135–2144. [Google Scholar]
- Xie, S.H.; Liu, Y.Y.; Li, J.Y. Synthesis, microstructures, and magnetoelectric couplings of electrospun multiferroic nanofibers. Frontiers of Physics. 2012, 7, 399–407. [Google Scholar] [CrossRef]
- Viehland, D.; Li, J.F.; Yang, Y.; Costanzo, T.; Yourdkhani, A.; Caruntu, G.; Zhou, P.; Zhang, T.; Li, T.; Gupta, A.; Popov, M.; et al. Tutorial: Product properties in multiferroic nanocomposites. Journal of Applied Physics 2018, 124, 061101. [Google Scholar] [CrossRef]
- Liu, Y.; Zhou, P.; Ge, B.; Liu, J.; Zhang, J.; Zhang, W.; Zhang, T.; Srinivasan, G. Strain-mediated magneto-electric effects in coaxial nanofibers of Y/W-type hexagonal ferrites and ferroelectrics. Journal of Composites Science. 2021, 5, 268. [Google Scholar] [CrossRef]
- Henrichs, L.F.; Mu, X.; Scherer, T.; Gerhards, U.; Schuppler, S.; Nagel, P.; Merz, M.; Kübel, C.; Fawey, M.H.; Hansen, T.C.; Hahn, H. First-time synthesis of a magnetoelectric core–shell composite via conventional solid-state reaction. Nanoscale 2020, 12, 15677–15686. [Google Scholar] [CrossRef] [PubMed]
- Sreenivasulu, G.; Popov, M.; Zhang, R.; Sharma, K.; Janes, C.; Mukundan, A.; Srinivasan, G. Magnetic field assisted self-assembly of ferrite-ferroelectric core-shell nanofibers and studies on magneto-electric interactions. Applied Physics Letters 2014, 104. [Google Scholar] [CrossRef]
- Smit, J.; Wijn, H. P. J. Ferrites; Wiley: New York, 1959. [Google Scholar]
- Harris, V.G. Modern microwave ferrites. IEEE Transactions on Magnetics 2011, 48, 1075–1104. [Google Scholar] [CrossRef]
- Thakur, P.; Taneja, S.; Chahar, D.; Ravelo, B.; Thakur, A. Recent advances on synthesis, characterization and high frequency applications of Ni-Zn ferrite nanoparticles. Journal of Magnetism and Magnetic Materials 2021, 530, 167925. [Google Scholar] [CrossRef]
- Arai, K. I.; Tsuya, N. Magnetostriction measurements of Ni-Zn ferrite single crystals. Journal of Physics and Chemistry of Solids 1975, 36, 463–465. [Google Scholar] [CrossRef]
- Sreenivasulu, G.; Zhang, J.; Zhang, R.; Popov, M.; Petrov, V.; Srinivasan, G. Multiferroic core-shell nanofibers, assembly in a magnetic field, and studies on magneto-electric interactions. Materials 2017, 11, 18. [Google Scholar] [CrossRef] [PubMed]
- Yadav, S.K.; Hemalatha, J. Direct magnetoelectric and magnetodielectric studies of electrospun Ba2Ni2Fe12O22–Pb (Zr0. 52 Ti0. 48) O3 core–shell nanofibers. Journal of Magnetism and Magnetic Materials. 2022, 564, 170174. [Google Scholar] [CrossRef]
- Yadav, S.K.; Hemalatha, J. Synthesis and characterization of magnetoelectric Ba2Zn2Fe12O22–PbZr0. 52 Ti0. 48 O3 electrospun core–shell nanofibers for the AC/DC magnetic field sensor application. Applied Physics A. 2024, 130, 67. [Google Scholar] [CrossRef]
Figure 1.
X-ray diffraction patterns for coaxial nanofibers of (a) NZFO (x=0)-PZT and (b) NZFO (x=0.3)-PZT. (c) SEM image showing a collection of fibers of NFO-PZT. (d) SEM image showing the core and shell structure for a NFO-PZT fiber.
Figure 1.
X-ray diffraction patterns for coaxial nanofibers of (a) NZFO (x=0)-PZT and (b) NZFO (x=0.3)-PZT. (c) SEM image showing a collection of fibers of NFO-PZT. (d) SEM image showing the core and shell structure for a NFO-PZT fiber.
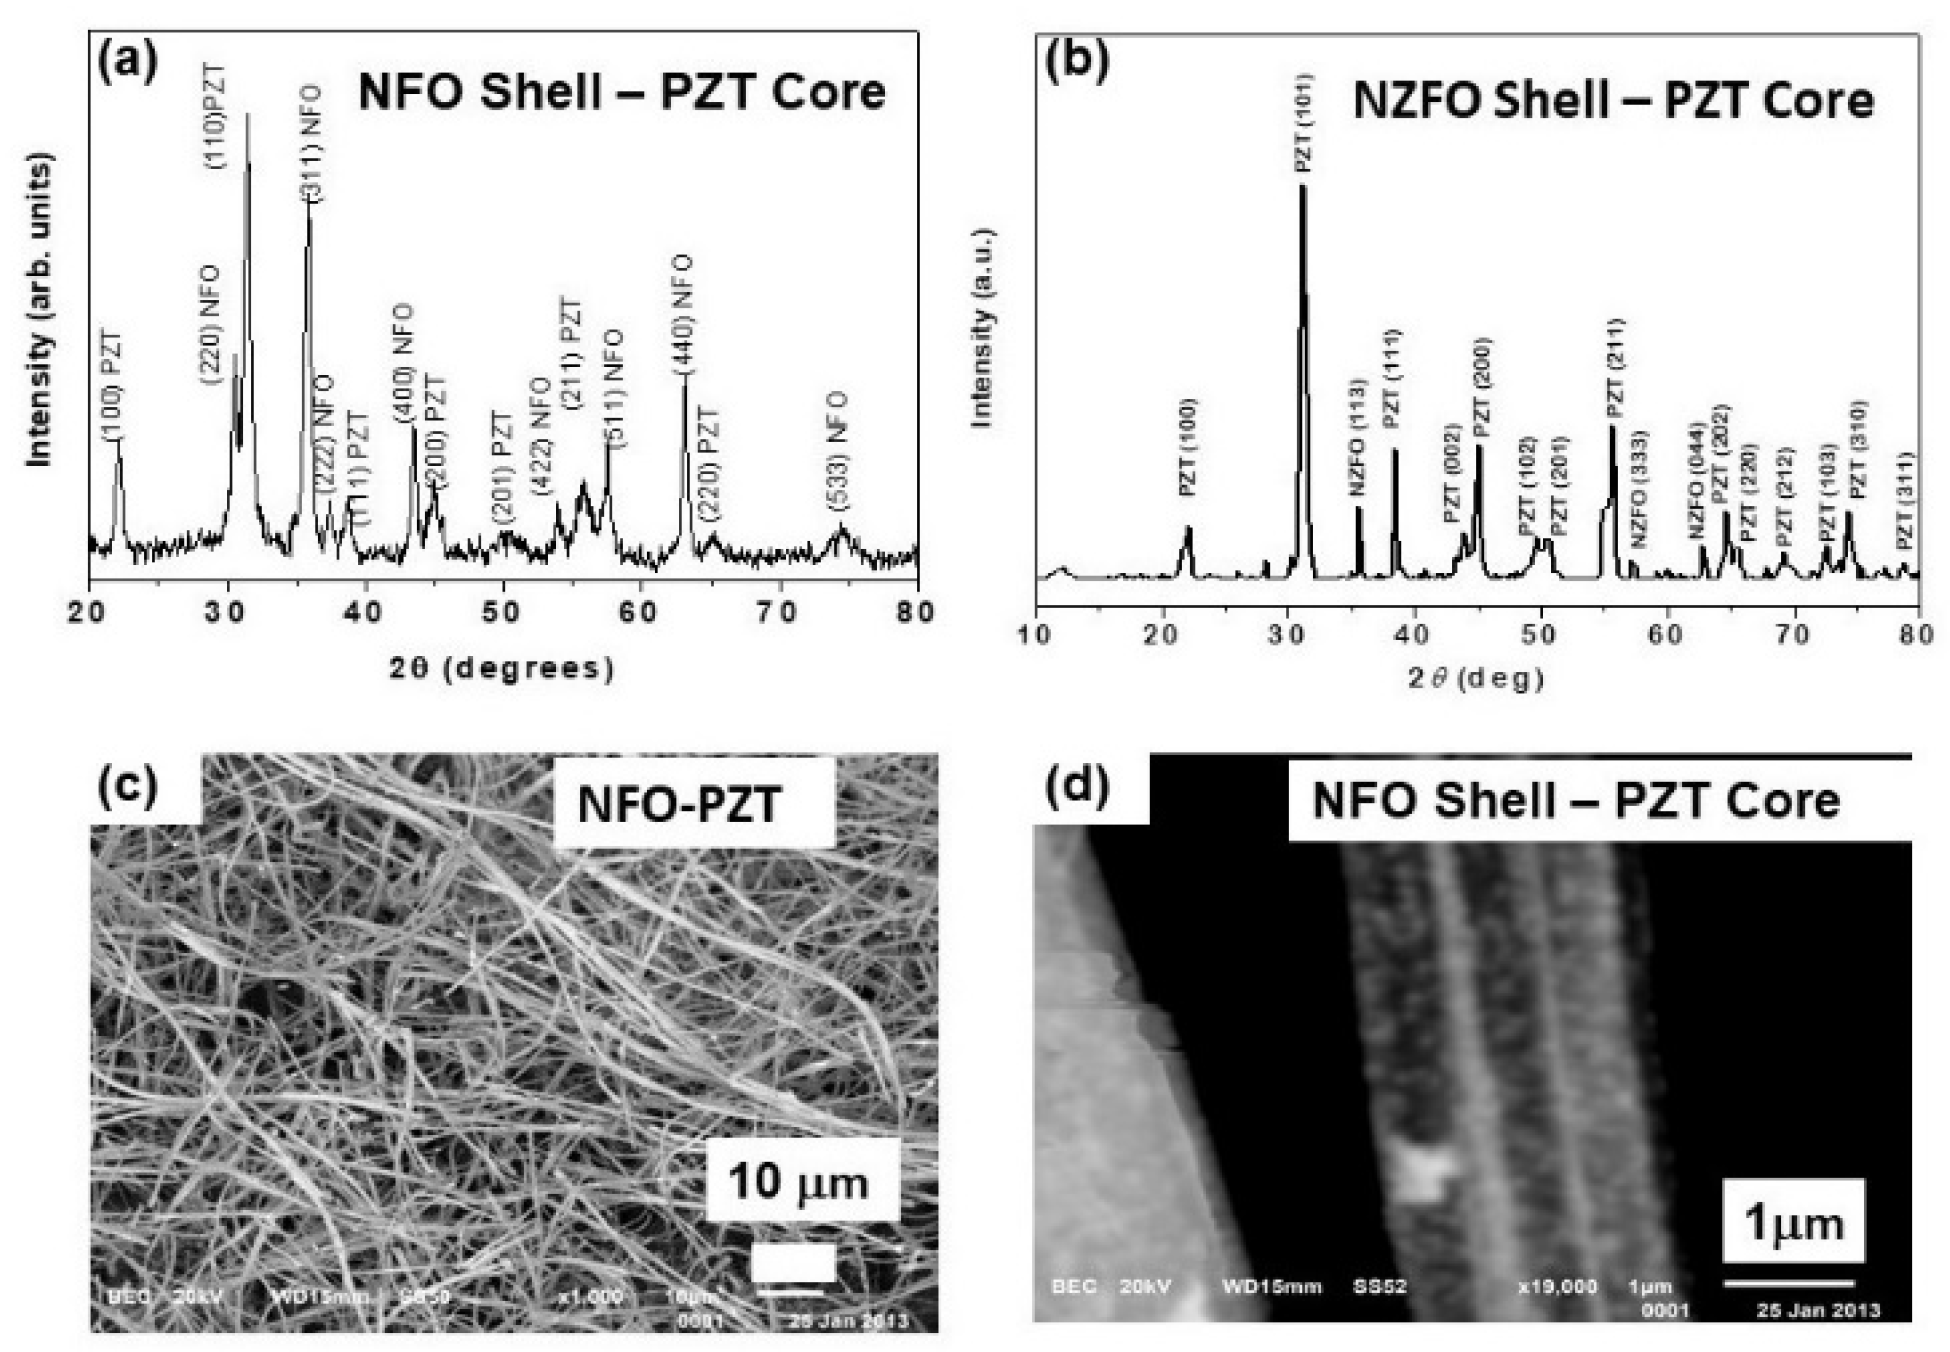
Figure 2.
(a) Atomic force microscopy image of an isolated coaxial fiber of NFO-PZT. (b) Magnetic force microscopy for a fiber of NFO shell-PZT core. (c) Scanning microwave microscopy (SMM) capacitance image at 10 GHz for NFO-PZT fiber.
Figure 2.
(a) Atomic force microscopy image of an isolated coaxial fiber of NFO-PZT. (b) Magnetic force microscopy for a fiber of NFO shell-PZT core. (c) Scanning microwave microscopy (SMM) capacitance image at 10 GHz for NFO-PZT fiber.
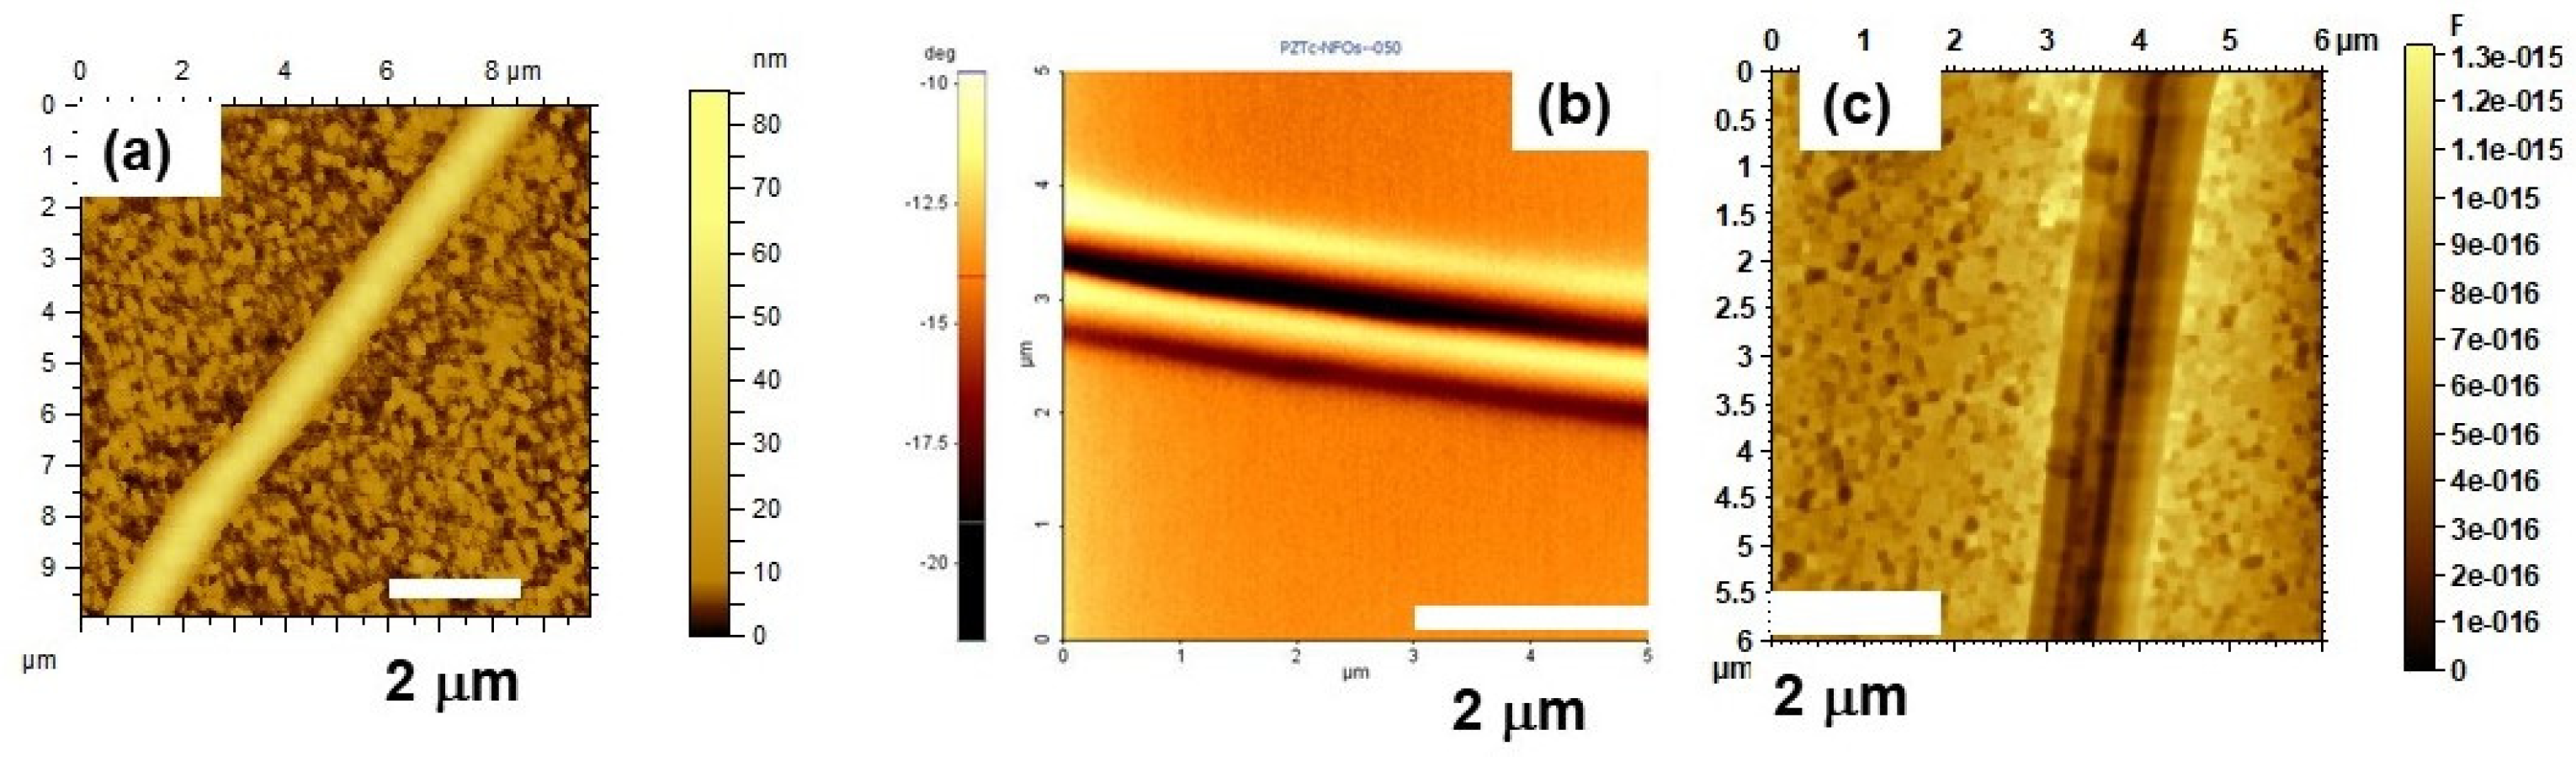
Figure 3.
Magnetization vs static magnetic field H data for bulk samples with fibers of (a) NFO-PZT, (b) NZFO (x=0.2) –PZT, and (c) NZFO (x = 0.4)- PZT. The data are for samples with ferrite core and PZT shell.
Figure 3.
Magnetization vs static magnetic field H data for bulk samples with fibers of (a) NFO-PZT, (b) NZFO (x=0.2) –PZT, and (c) NZFO (x = 0.4)- PZT. The data are for samples with ferrite core and PZT shell.
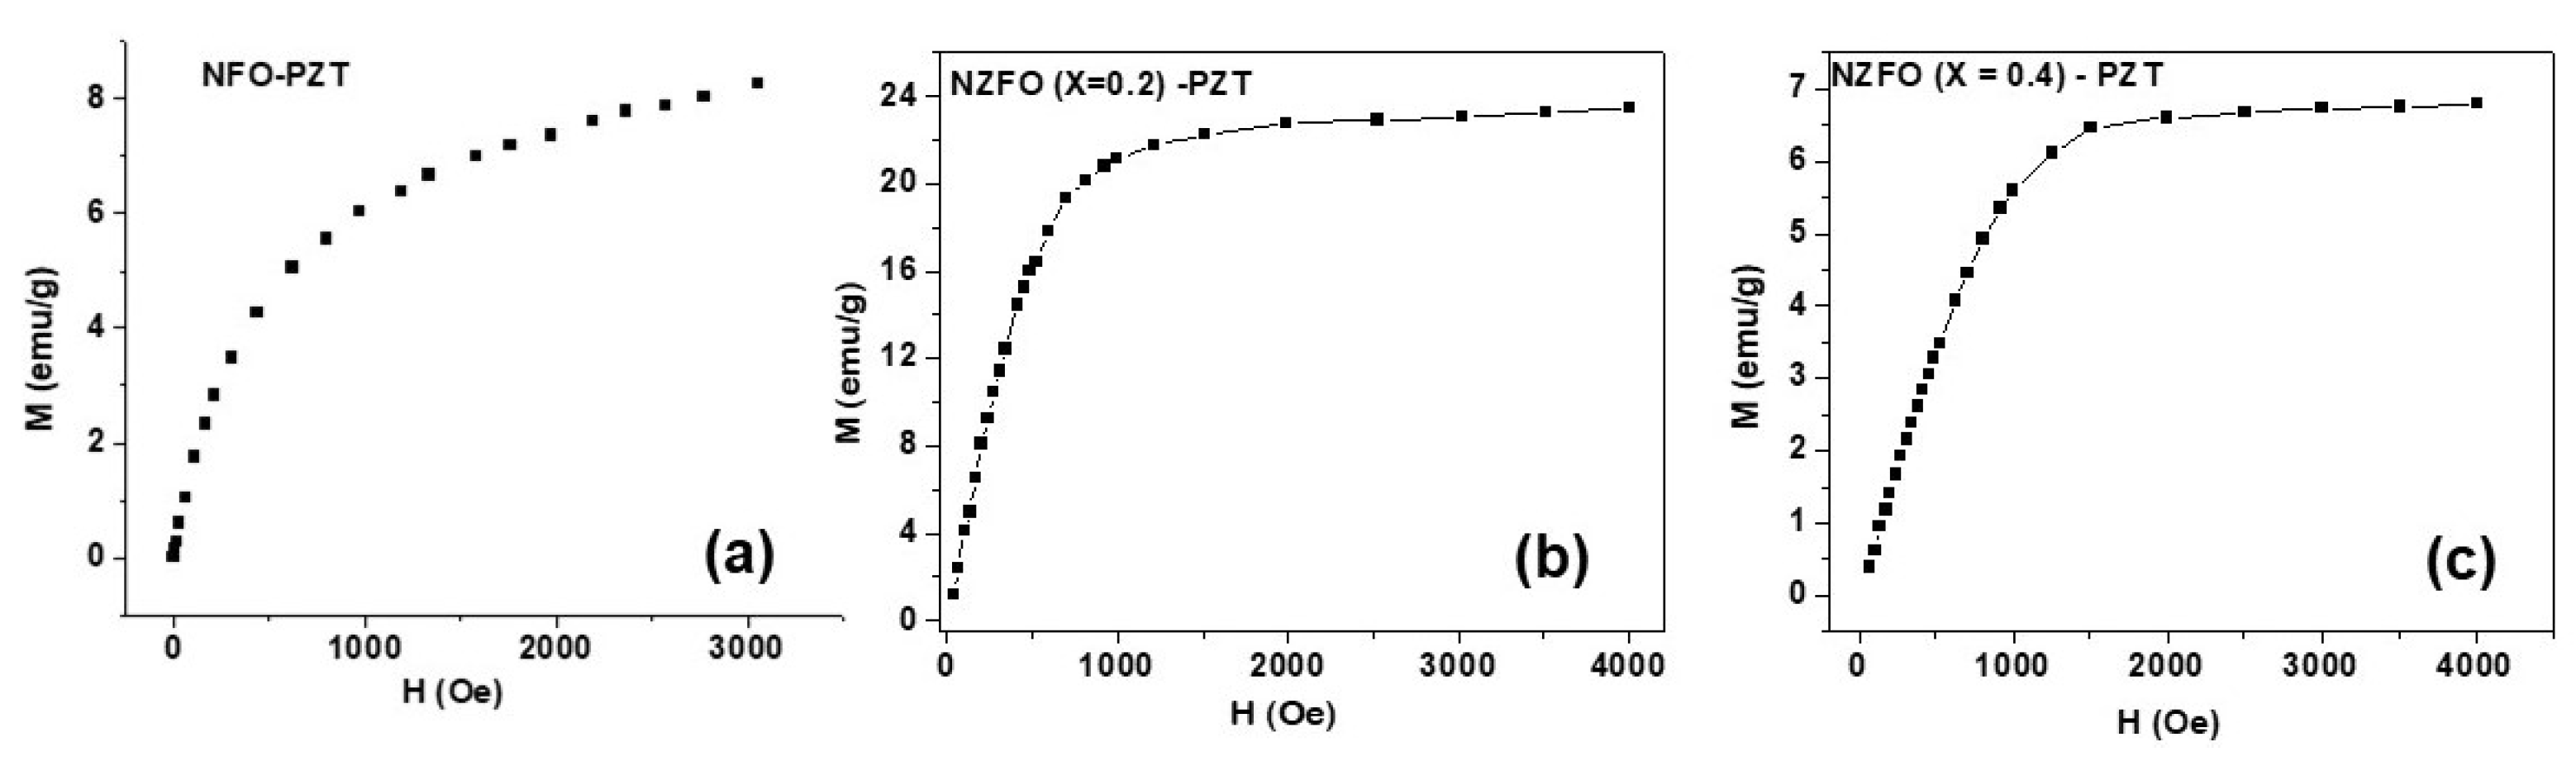
Figure 4.
(Left) Scattering matrix parameter S11 vs frequency f for ferromagnetic resonance (FMR) for a series of in-plane static magnetic field H. The data are for a rectangular platelet of coaxial fibers of NZFO (x=0.2) and PZT. (Right) Fitting of the resonance frequency fr vs H to the Kittel’s equation to determine the gyromagnetic ratio γ and the effective saturation induction 4πMeff.
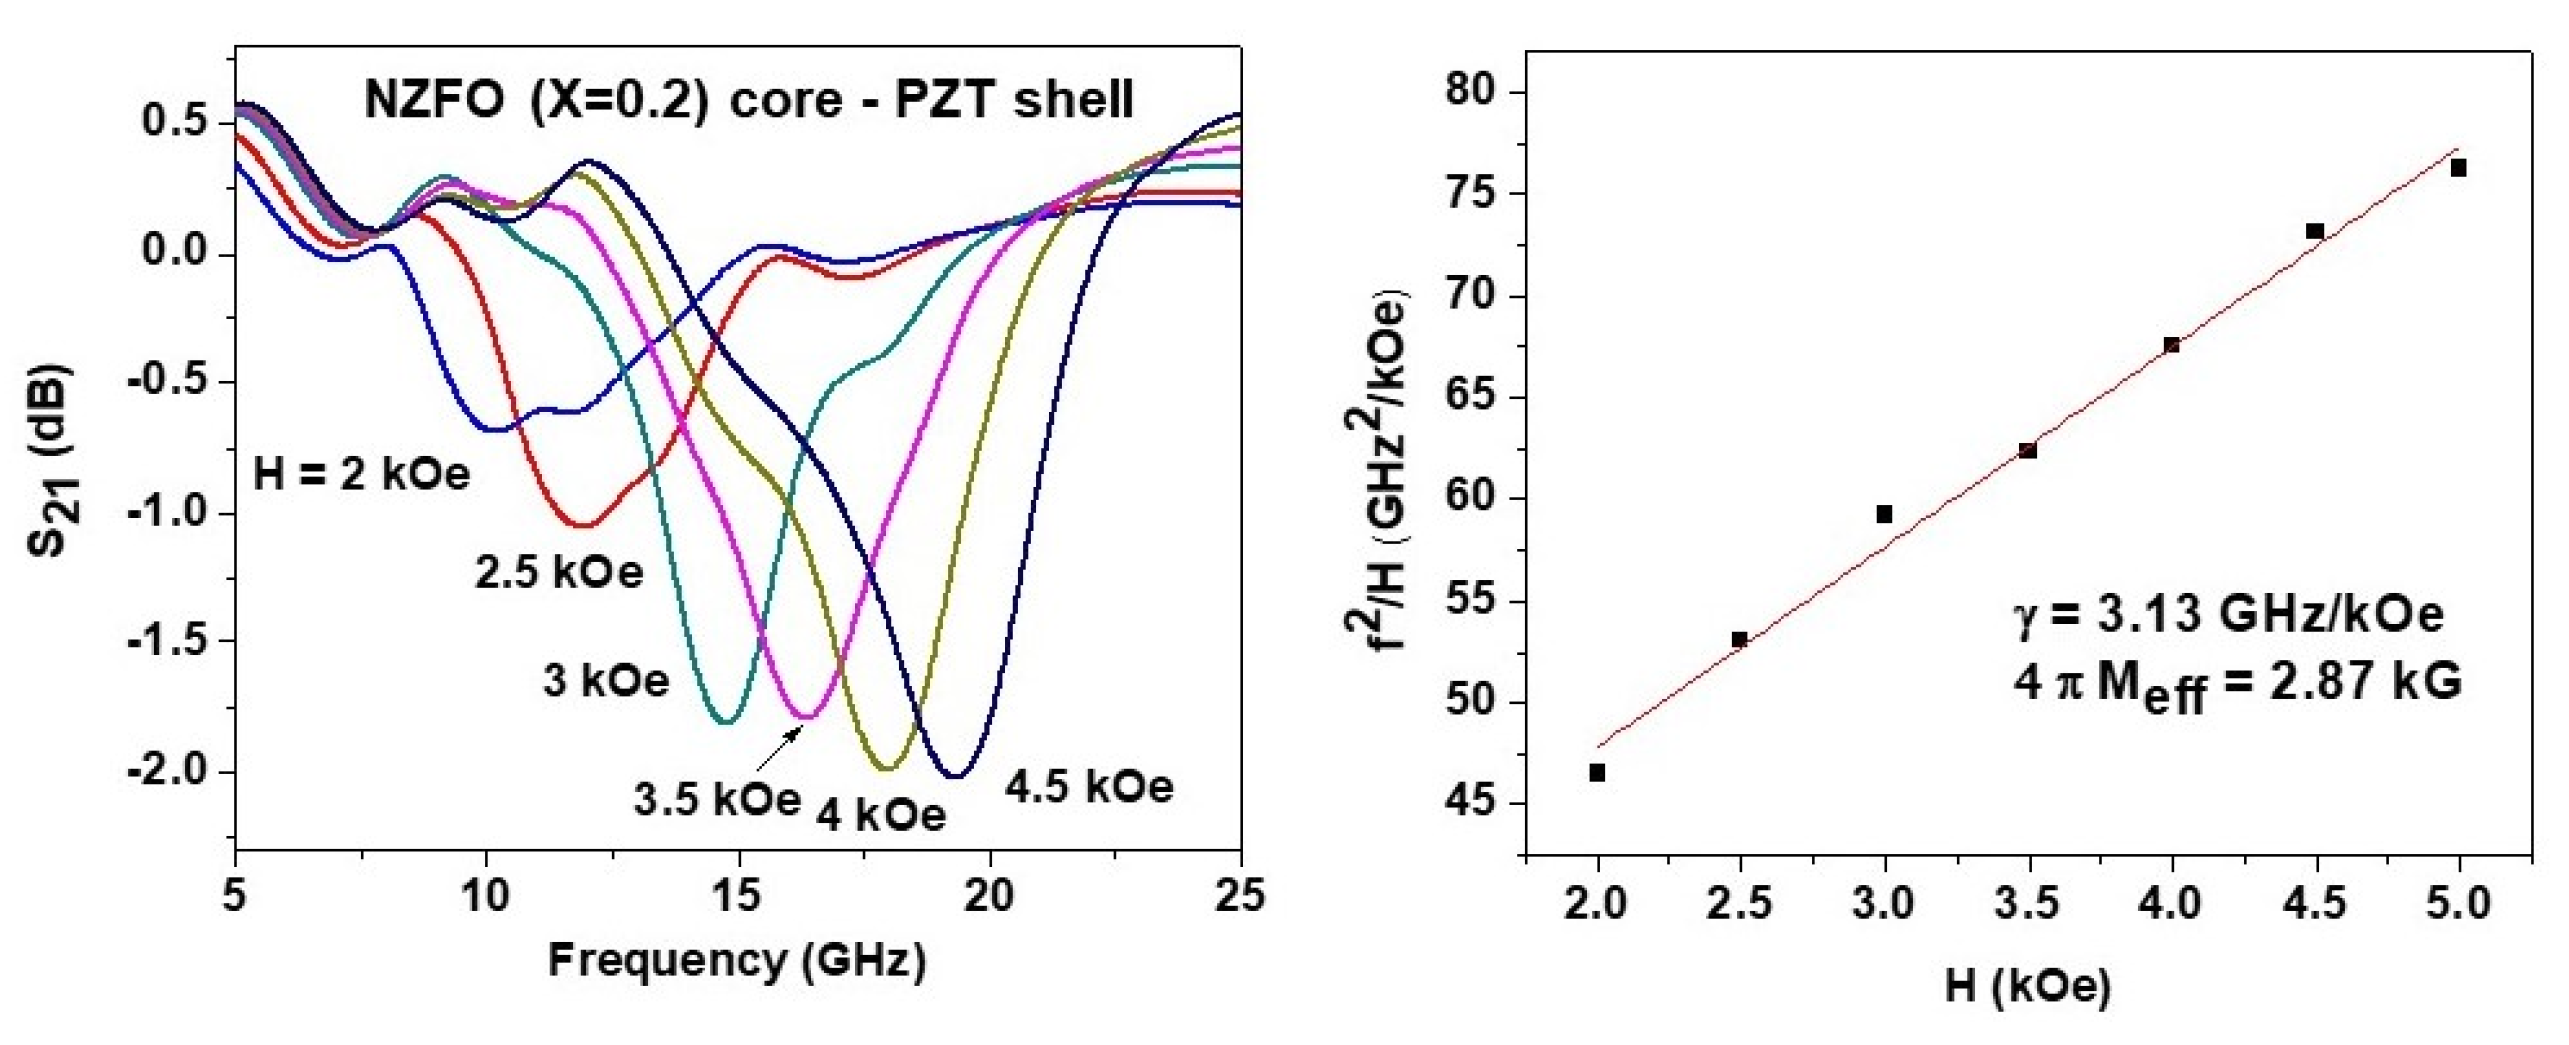
Figure 5.
Profiles showing FMR and fitting of fr vs H data to Kittel’s equation as in Figure 4 for a platelet with fibers of NZFO(x=0.3)-PZT.
Figure 5.
Profiles showing FMR and fitting of fr vs H data to Kittel’s equation as in Figure 4 for a platelet with fibers of NZFO(x=0.3)-PZT.
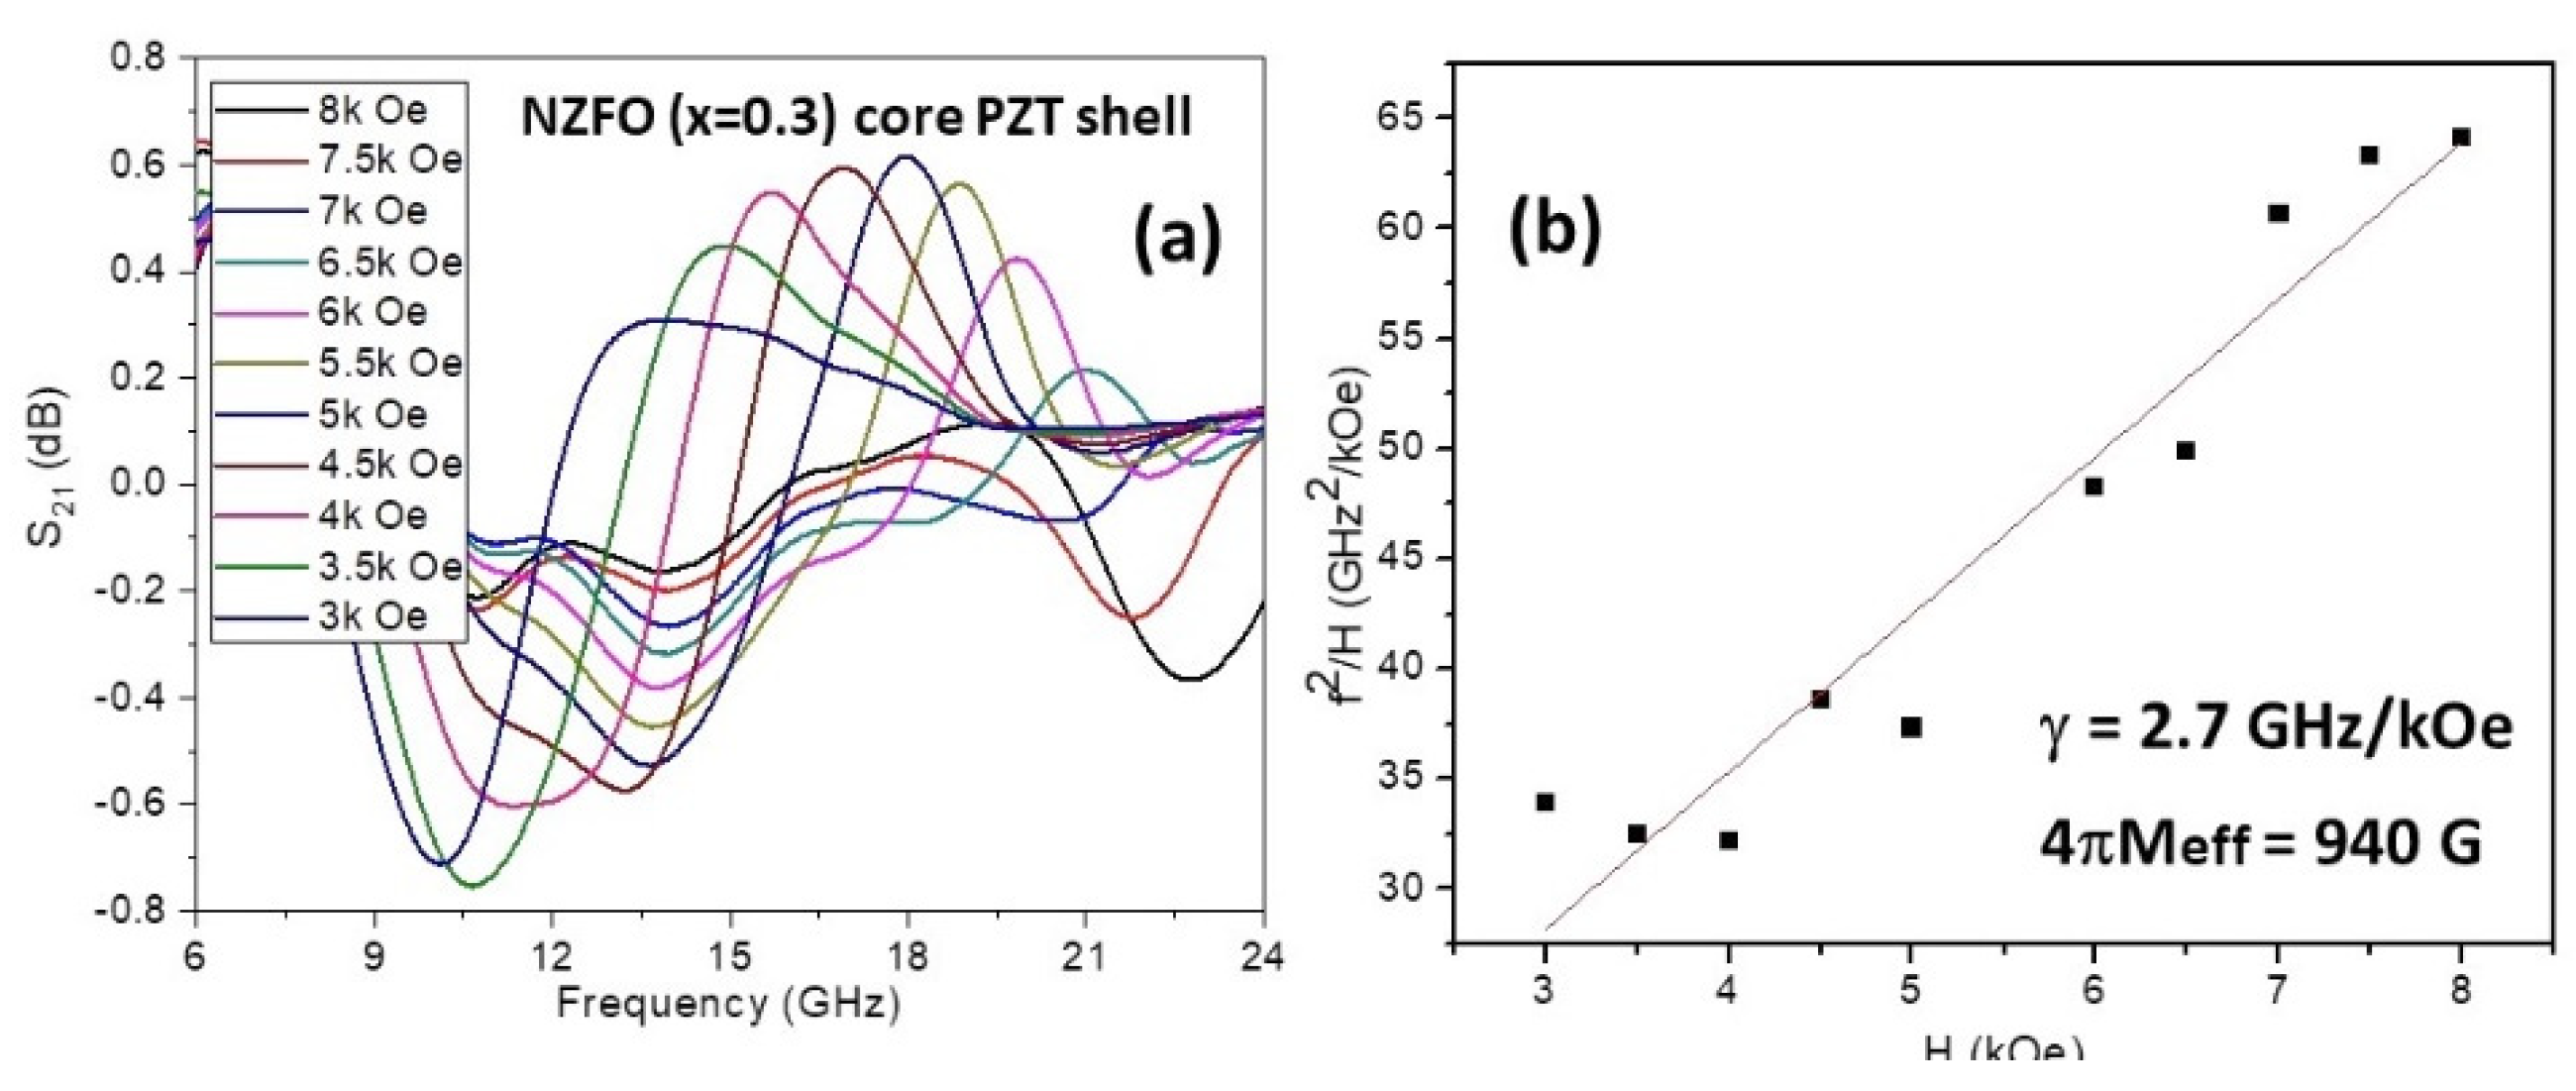
Figure 6.
Magnetostriction λ11 measured parallel to the applied in-plane static magnetic field H. The data are for a rectangular platelet made of coaxial fibers of NZFO (x=0.5)- PZT [(a) and (b)] and NZFO (x=0.4) – PZT [(c) and (d)]. Arrows indicate increasing or decreasing H direction.
Figure 6.
Magnetostriction λ11 measured parallel to the applied in-plane static magnetic field H. The data are for a rectangular platelet made of coaxial fibers of NZFO (x=0.5)- PZT [(a) and (b)] and NZFO (x=0.4) – PZT [(c) and (d)]. Arrows indicate increasing or decreasing H direction.
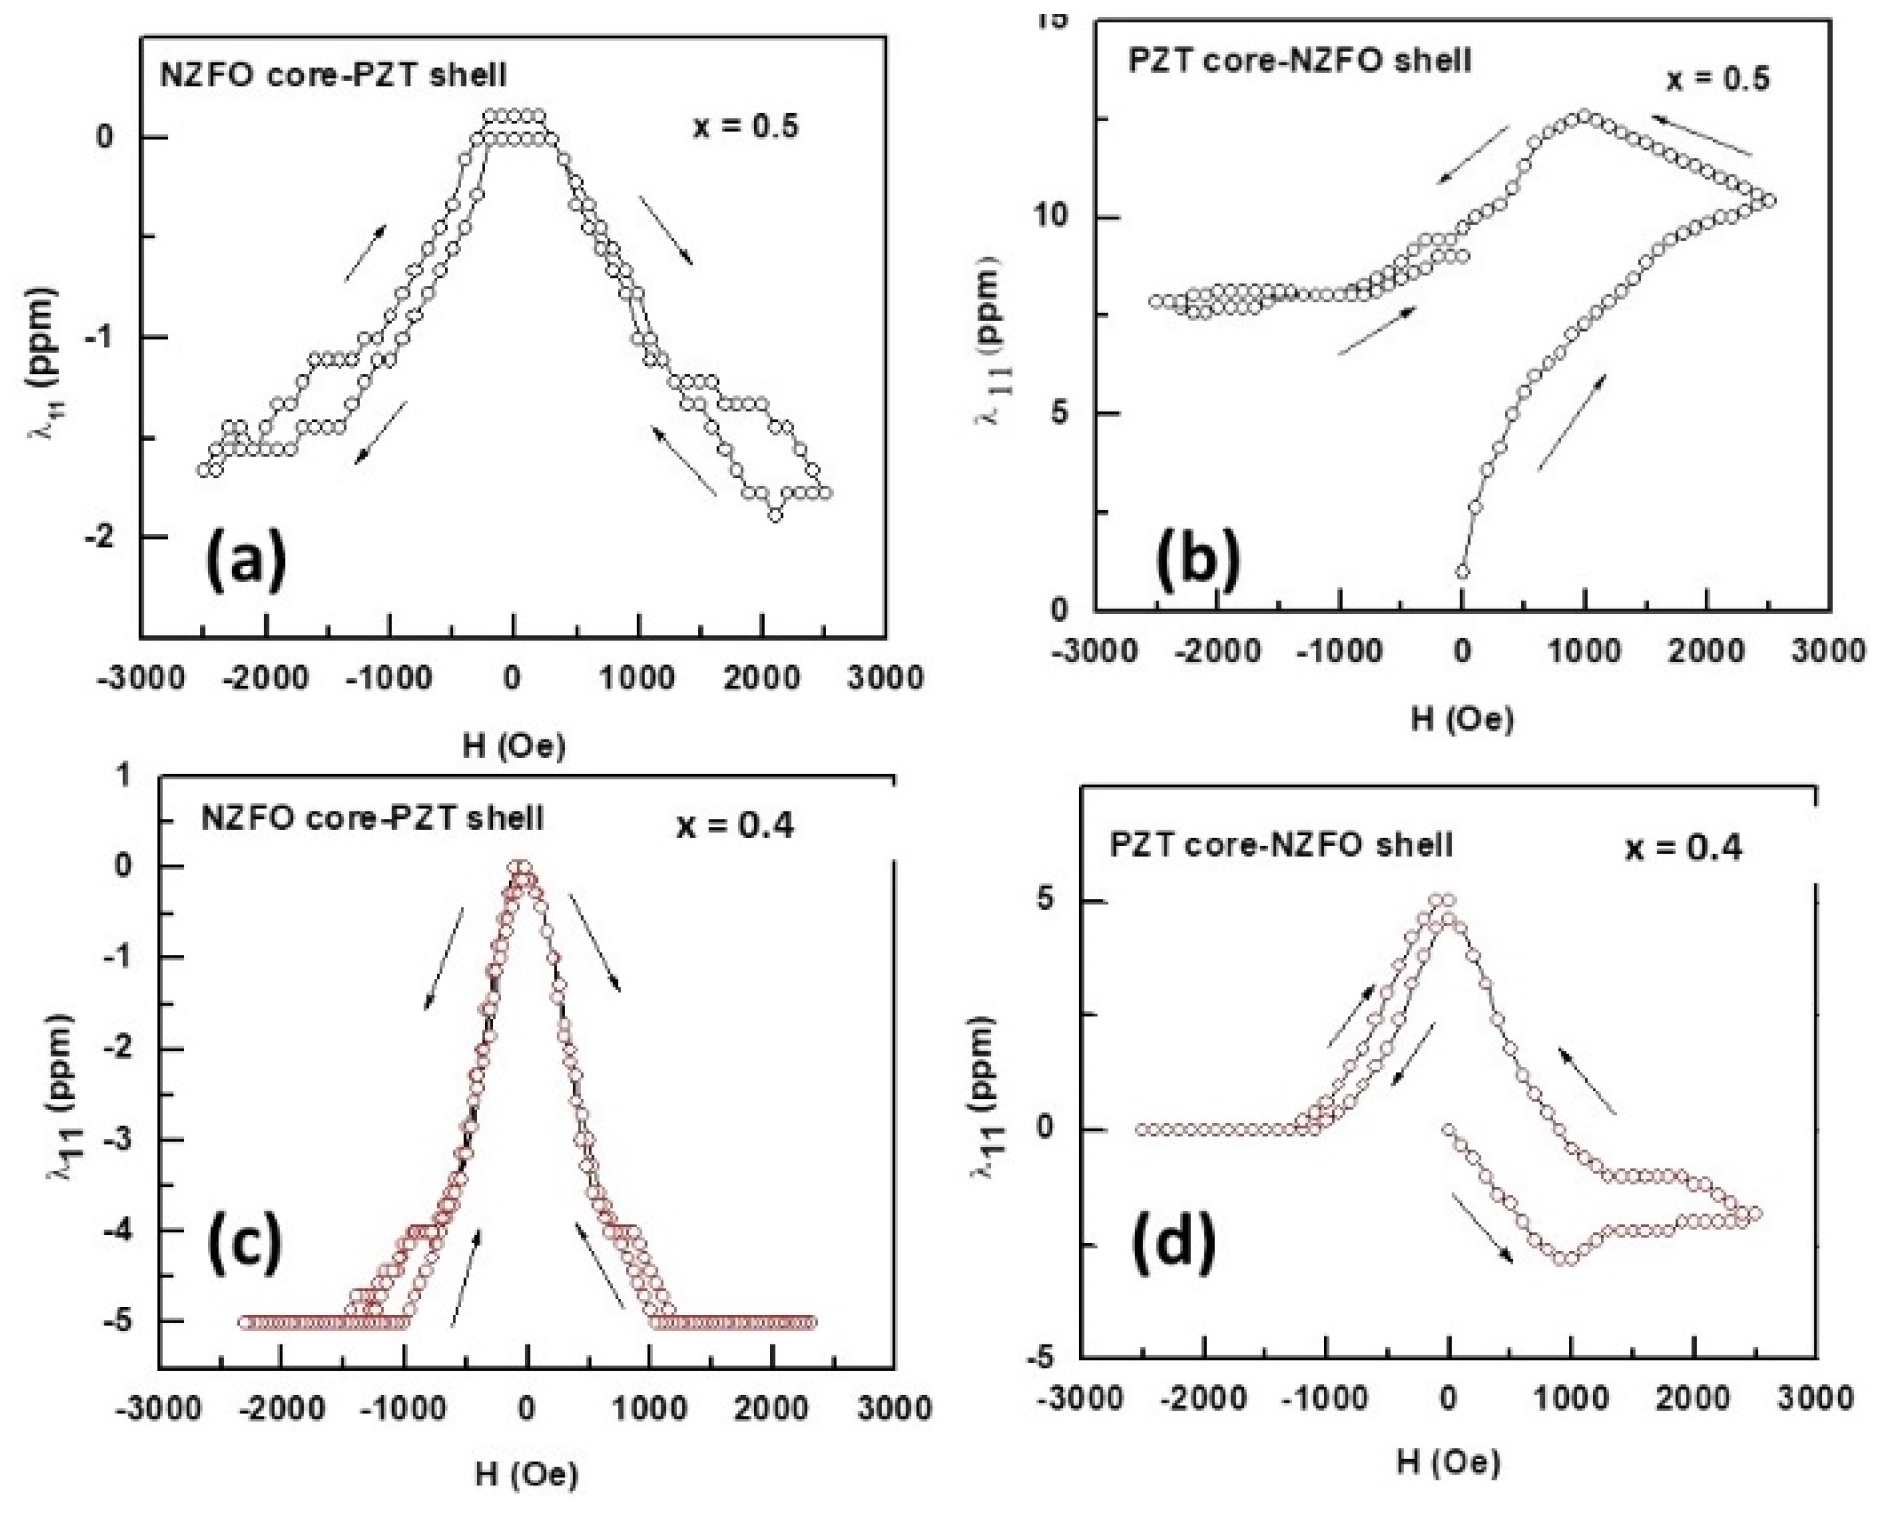
Figure 7.
λ11 vs H data as in Figure 4 for NZFO (x=0.3)-PZT [(a) and (b)] and NZFO (x=0.2) – PZT [(c) and (d)].
Figure 7.
λ11 vs H data as in Figure 4 for NZFO (x=0.3)-PZT [(a) and (b)] and NZFO (x=0.2) – PZT [(c) and (d)].
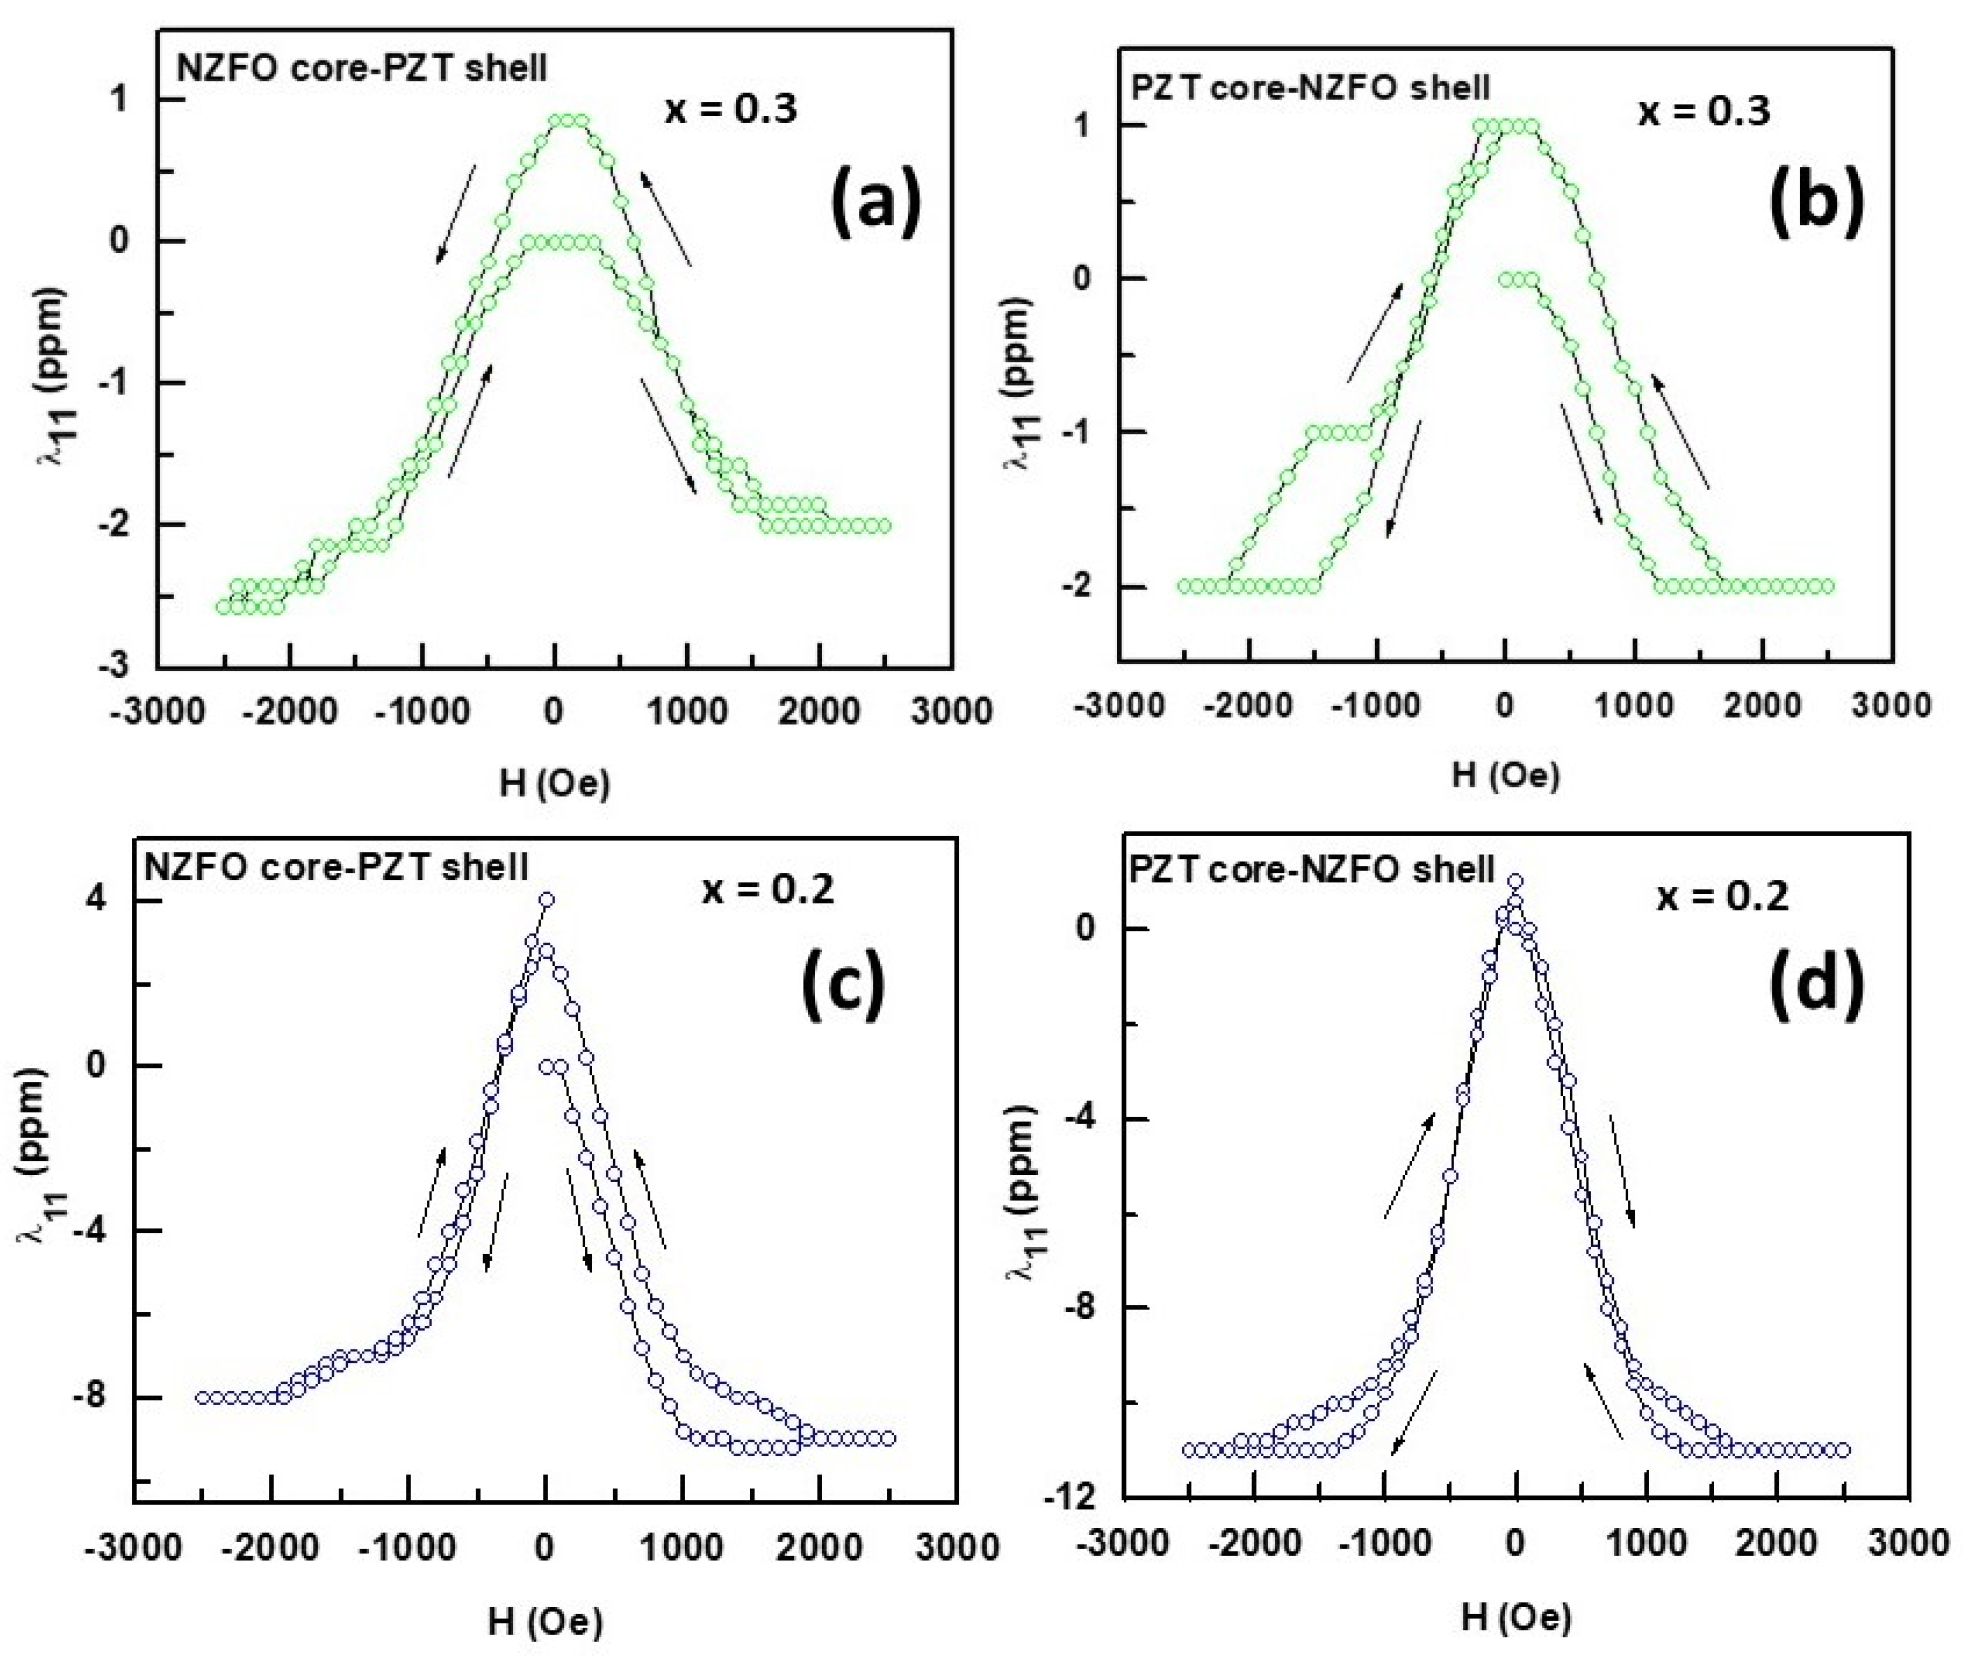
Figure 8.
Polarization P as a function of electric field E for a series of applied static magnetic field H for a disc with fibers of NZFO (x=0.5) core-PZT shell for (a) increasing H and (b) decreasing H. (c) and (d) show similar results for fibers with PZT core and NZFO (x=0.5) shell. The insets show P vs E in expanded scale. (e) Fractional change in the remnant polarization Pr as a function of H for increasing and decreasing H.
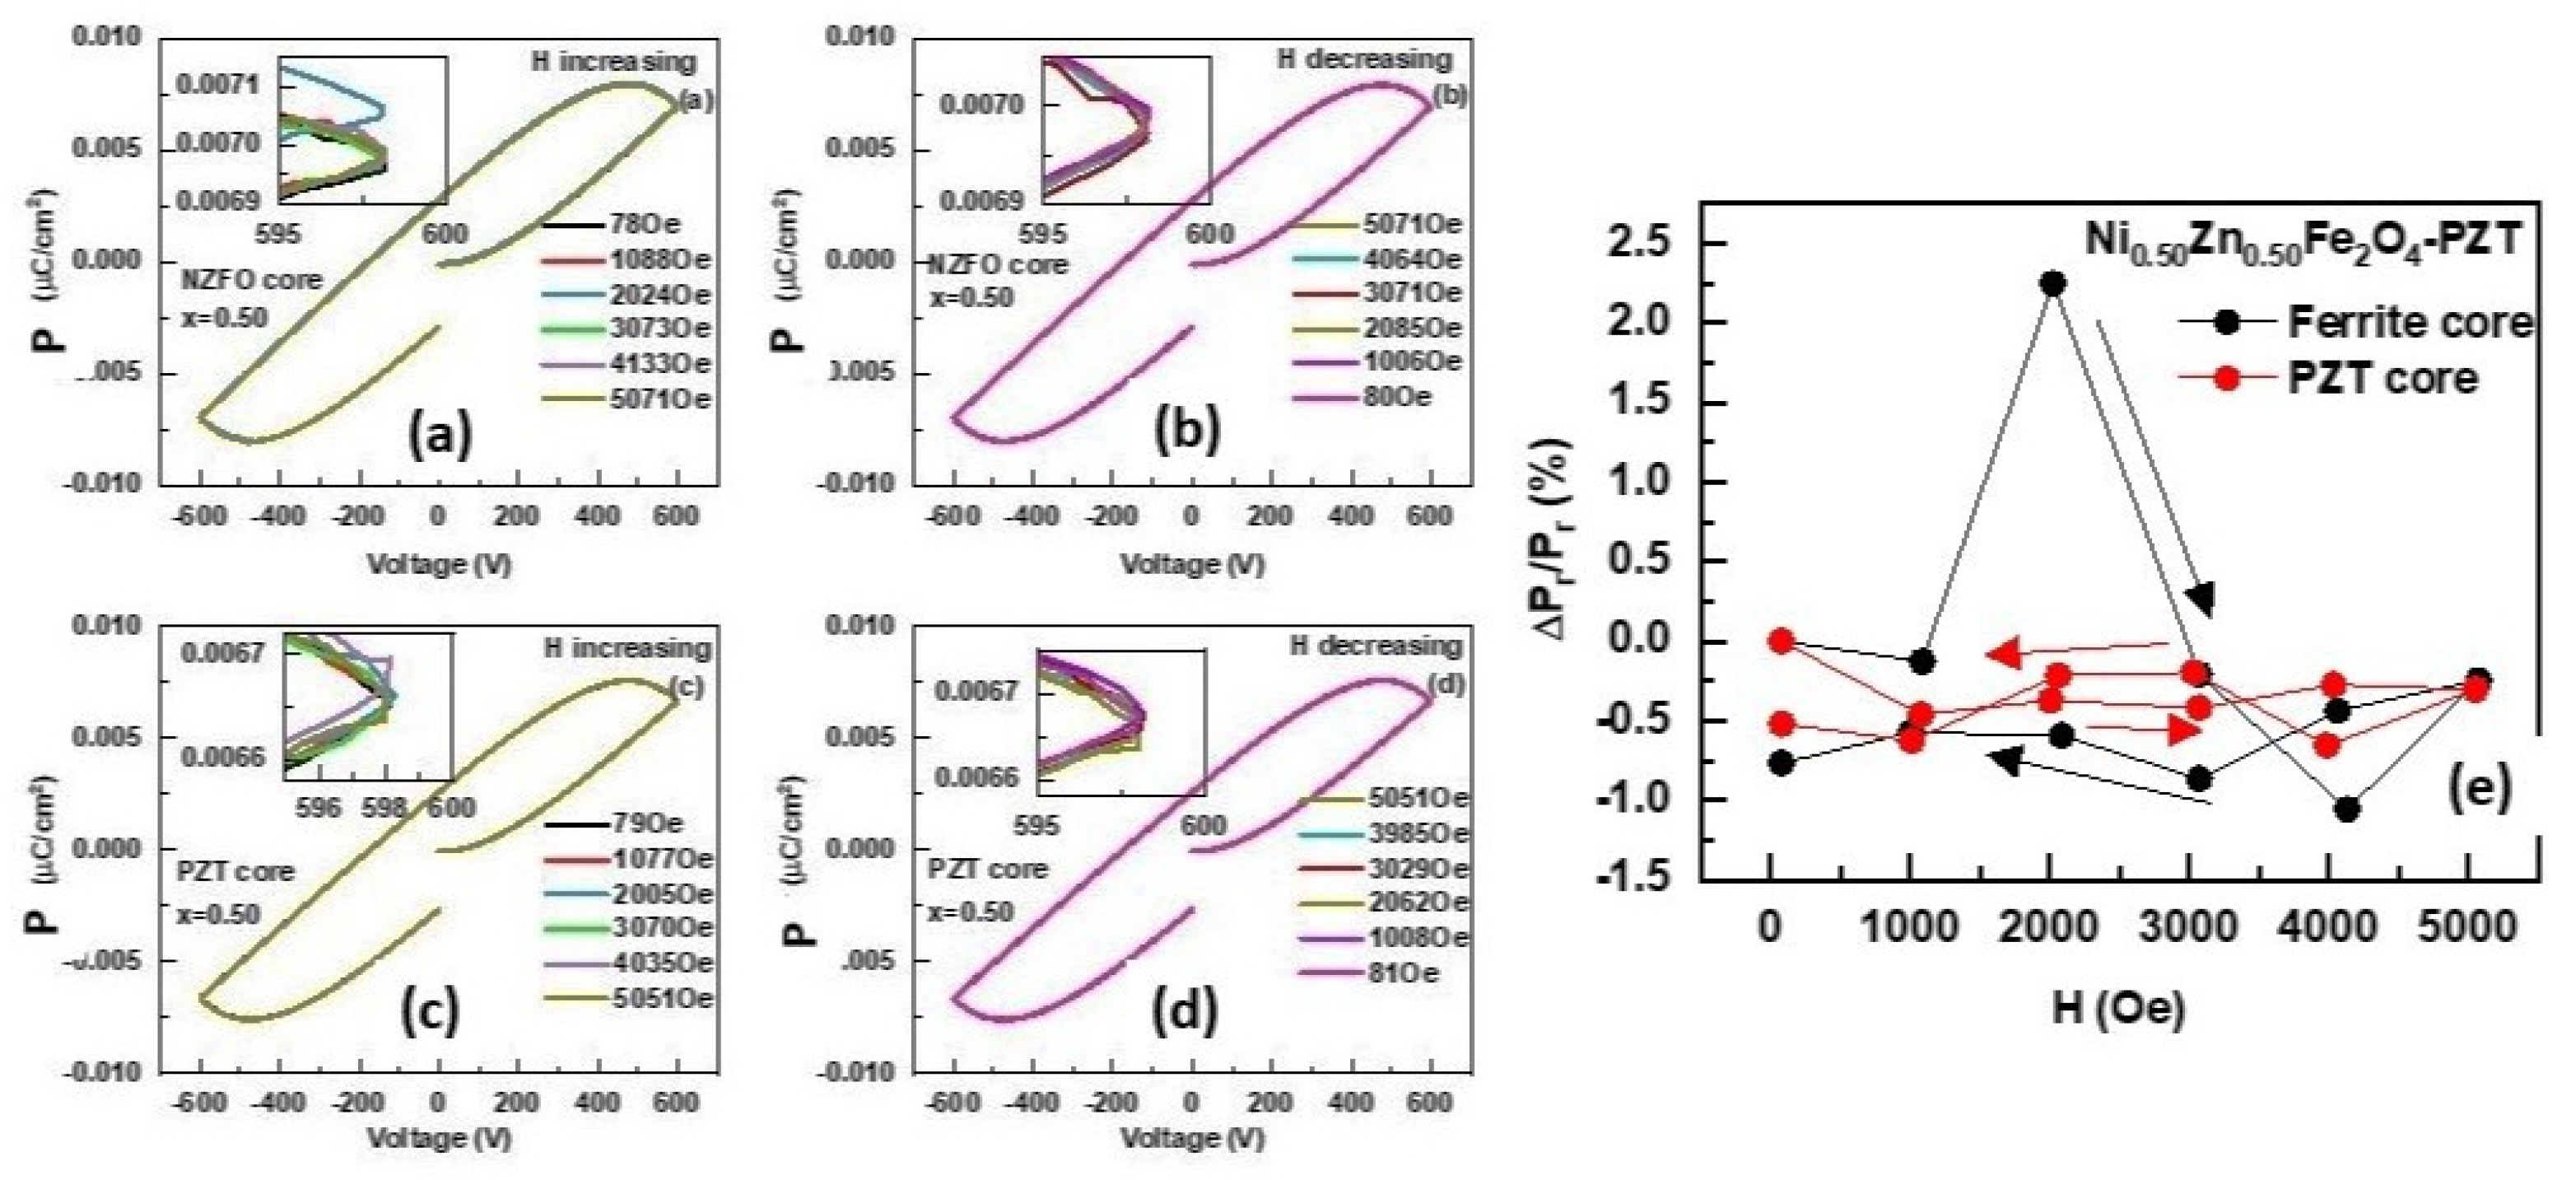
Figure 9.
Results as in Figure 8 for a disc with core-shell fibers of NZFO (x=0.4) -PZT.
Figure 9.
Results as in Figure 8 for a disc with core-shell fibers of NZFO (x=0.4) -PZT.
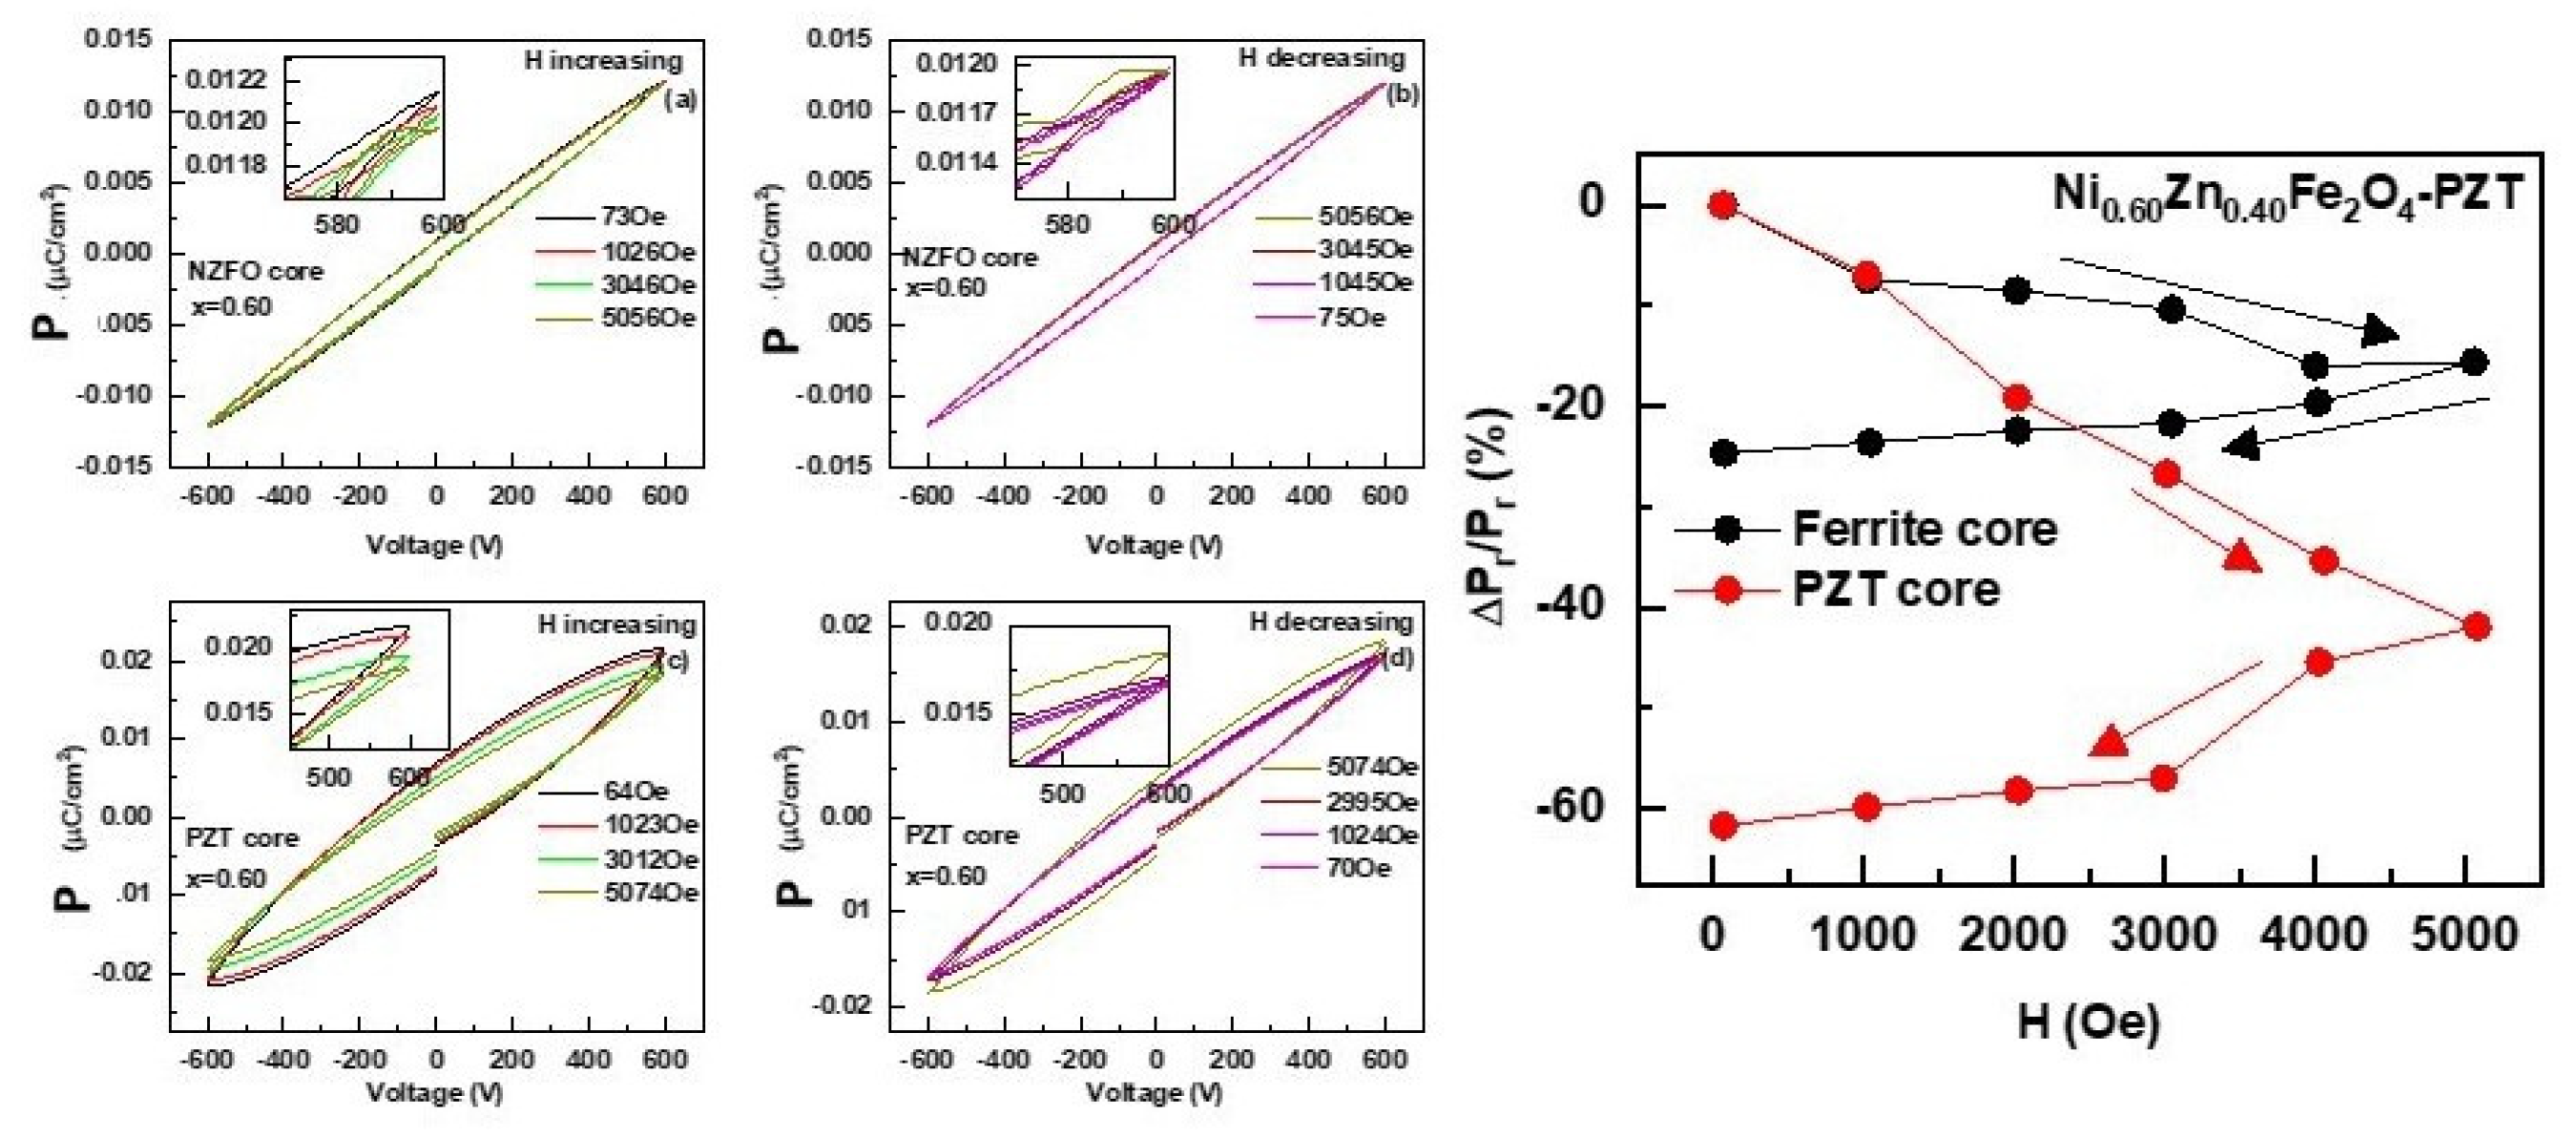
Figure 10.
Results as in Figure 8 for a platelet with core-shell fibers of NZFO (x=0.3) -PZT.
Figure 10.
Results as in Figure 8 for a platelet with core-shell fibers of NZFO (x=0.3) -PZT.
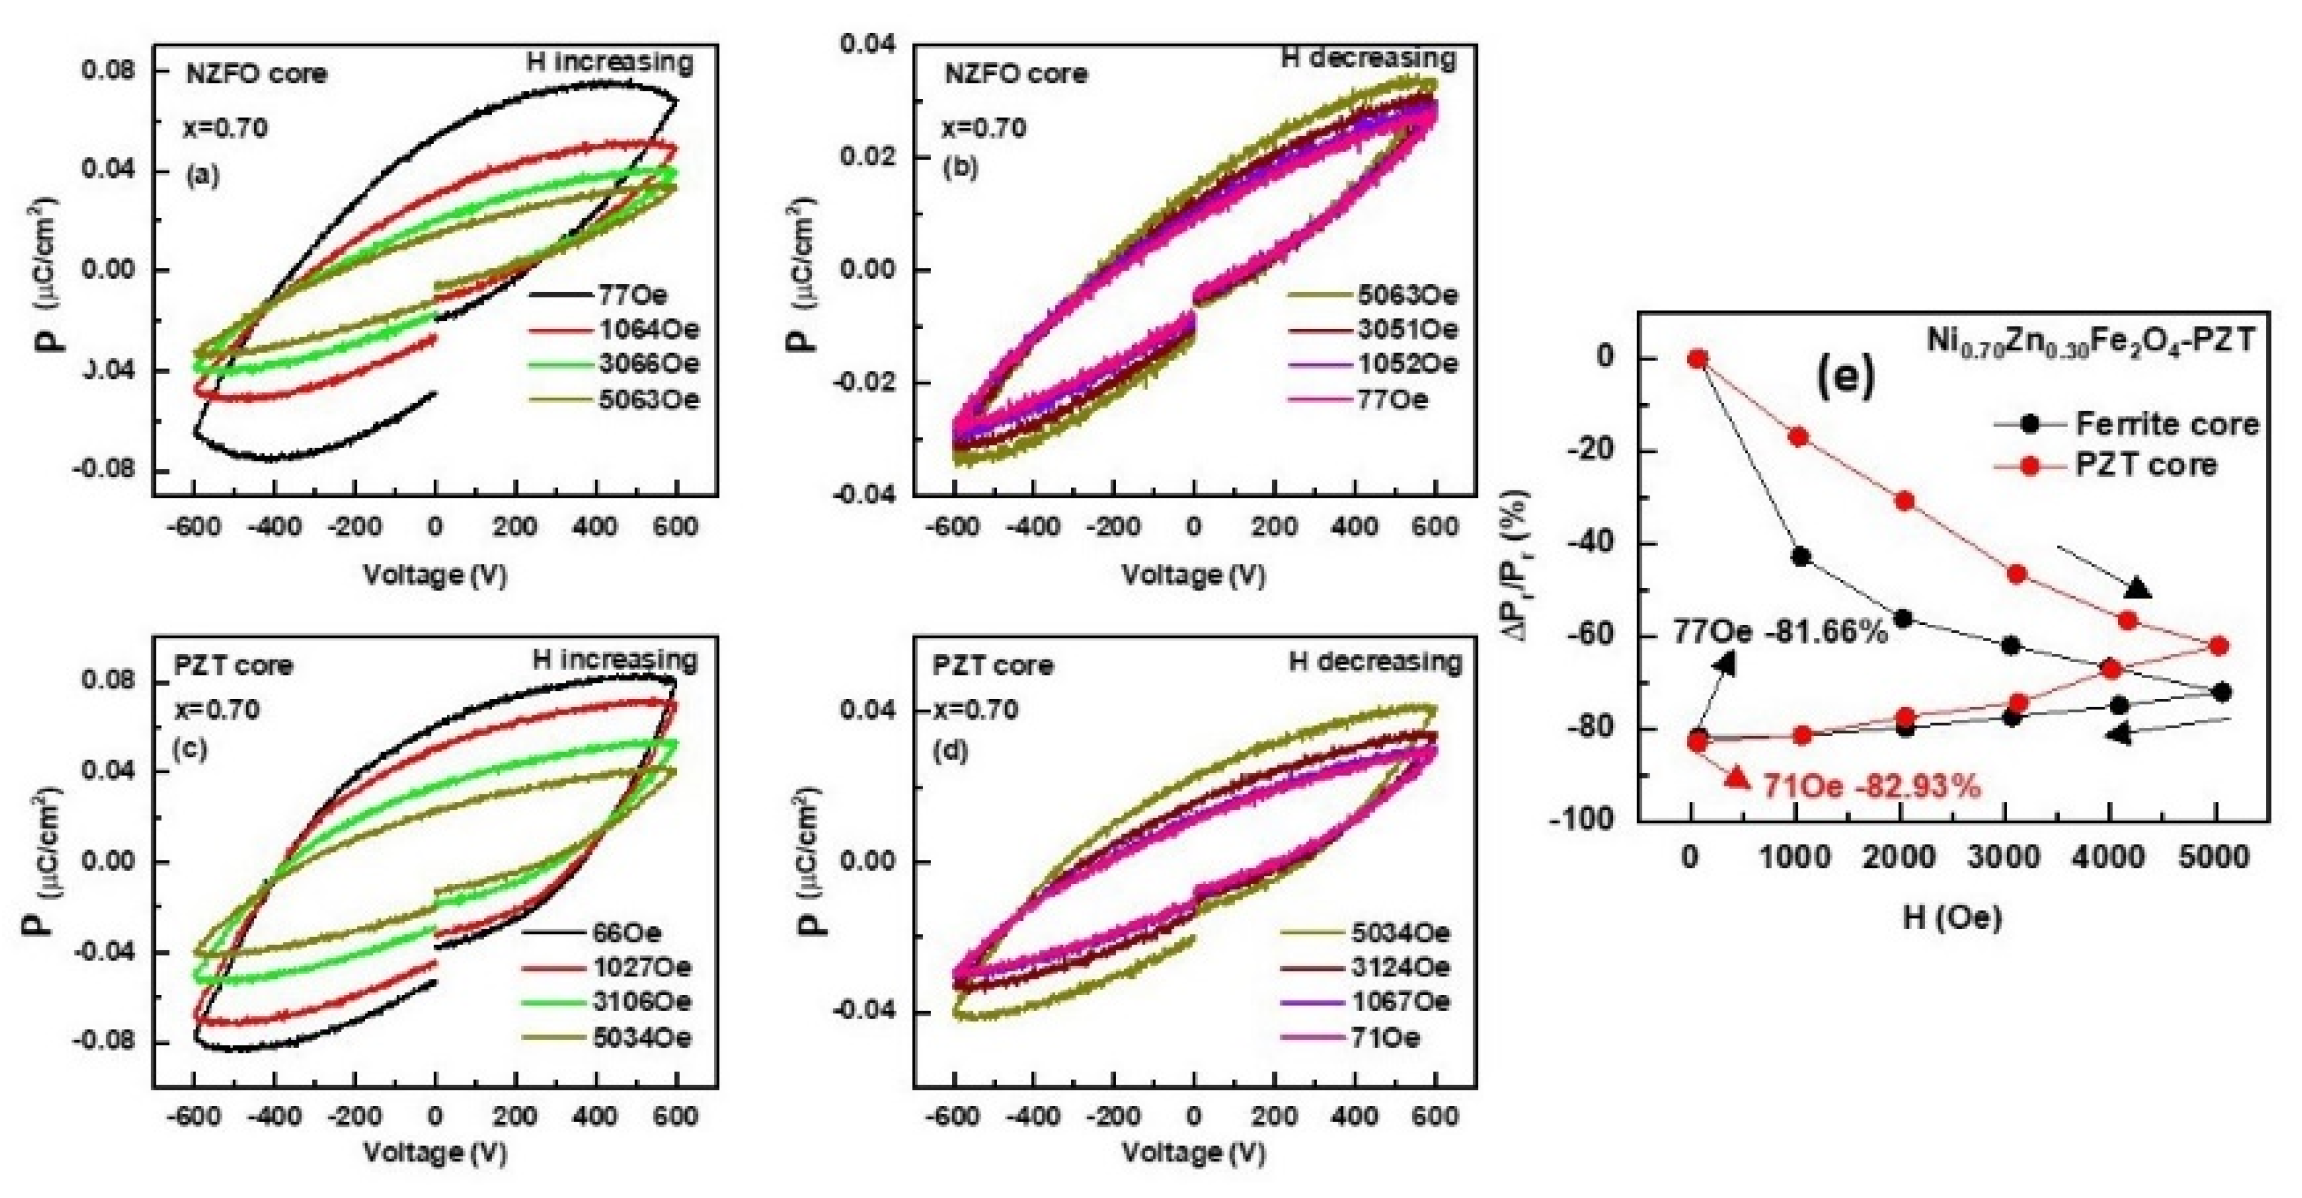
Figure 11.
Zn concentration x dependence of the maximum fractional variation in the remnant polarization in bulk composites with NZFO-PZT core-shell fibers.
Figure 11.
Zn concentration x dependence of the maximum fractional variation in the remnant polarization in bulk composites with NZFO-PZT core-shell fibers.
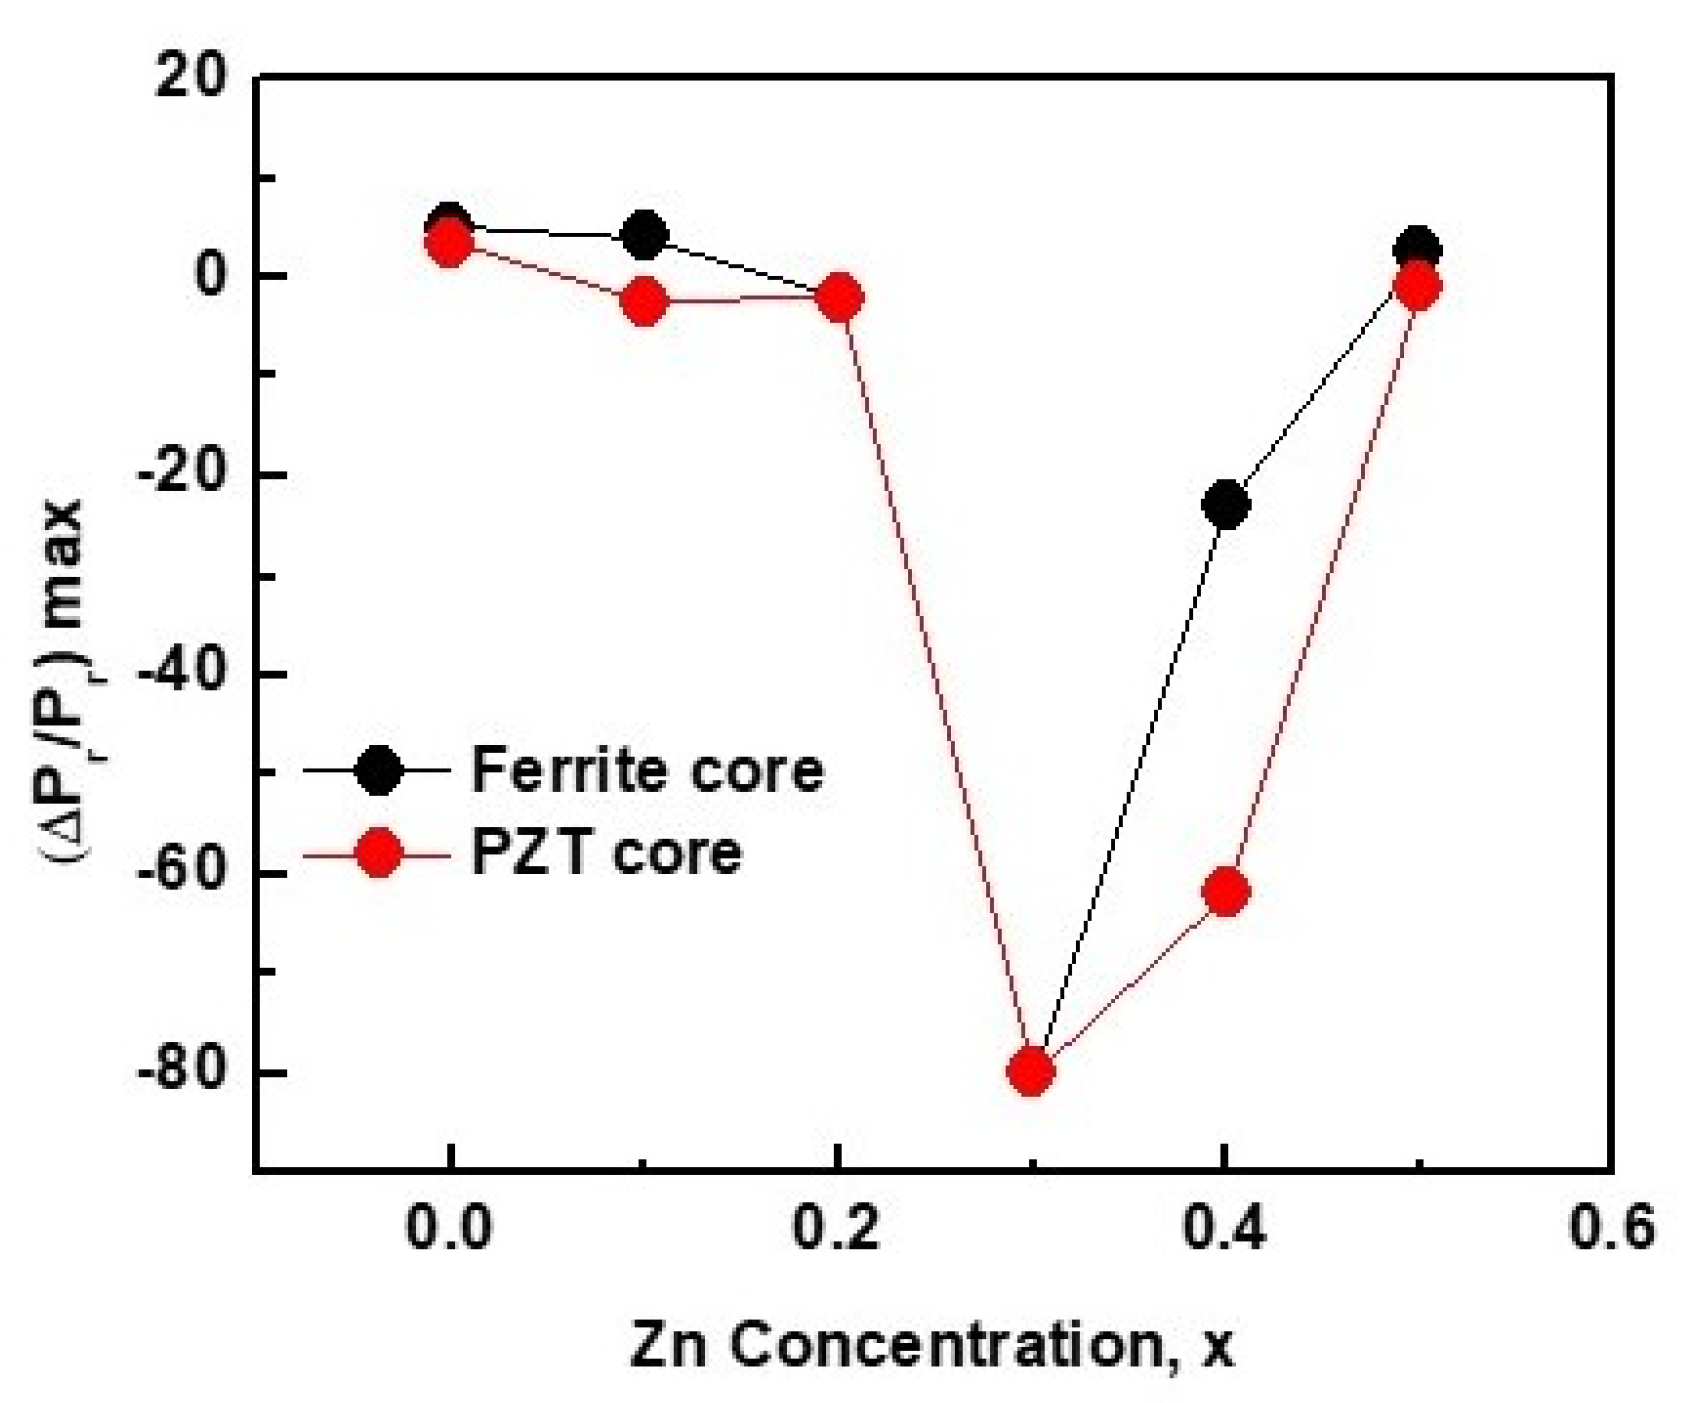
Figure 12.
ME voltage coefficient α31 measured at 100 Hz as a function of bias field H for samples with fibers of NZFO (x=0.5) – PZT and NZFO (x=0.4)-PZT. The insets show the H dependence of α31 on an expanded scale for H < 1 kOe.
Figure 12.
ME voltage coefficient α31 measured at 100 Hz as a function of bias field H for samples with fibers of NZFO (x=0.5) – PZT and NZFO (x=0.4)-PZT. The insets show the H dependence of α31 on an expanded scale for H < 1 kOe.
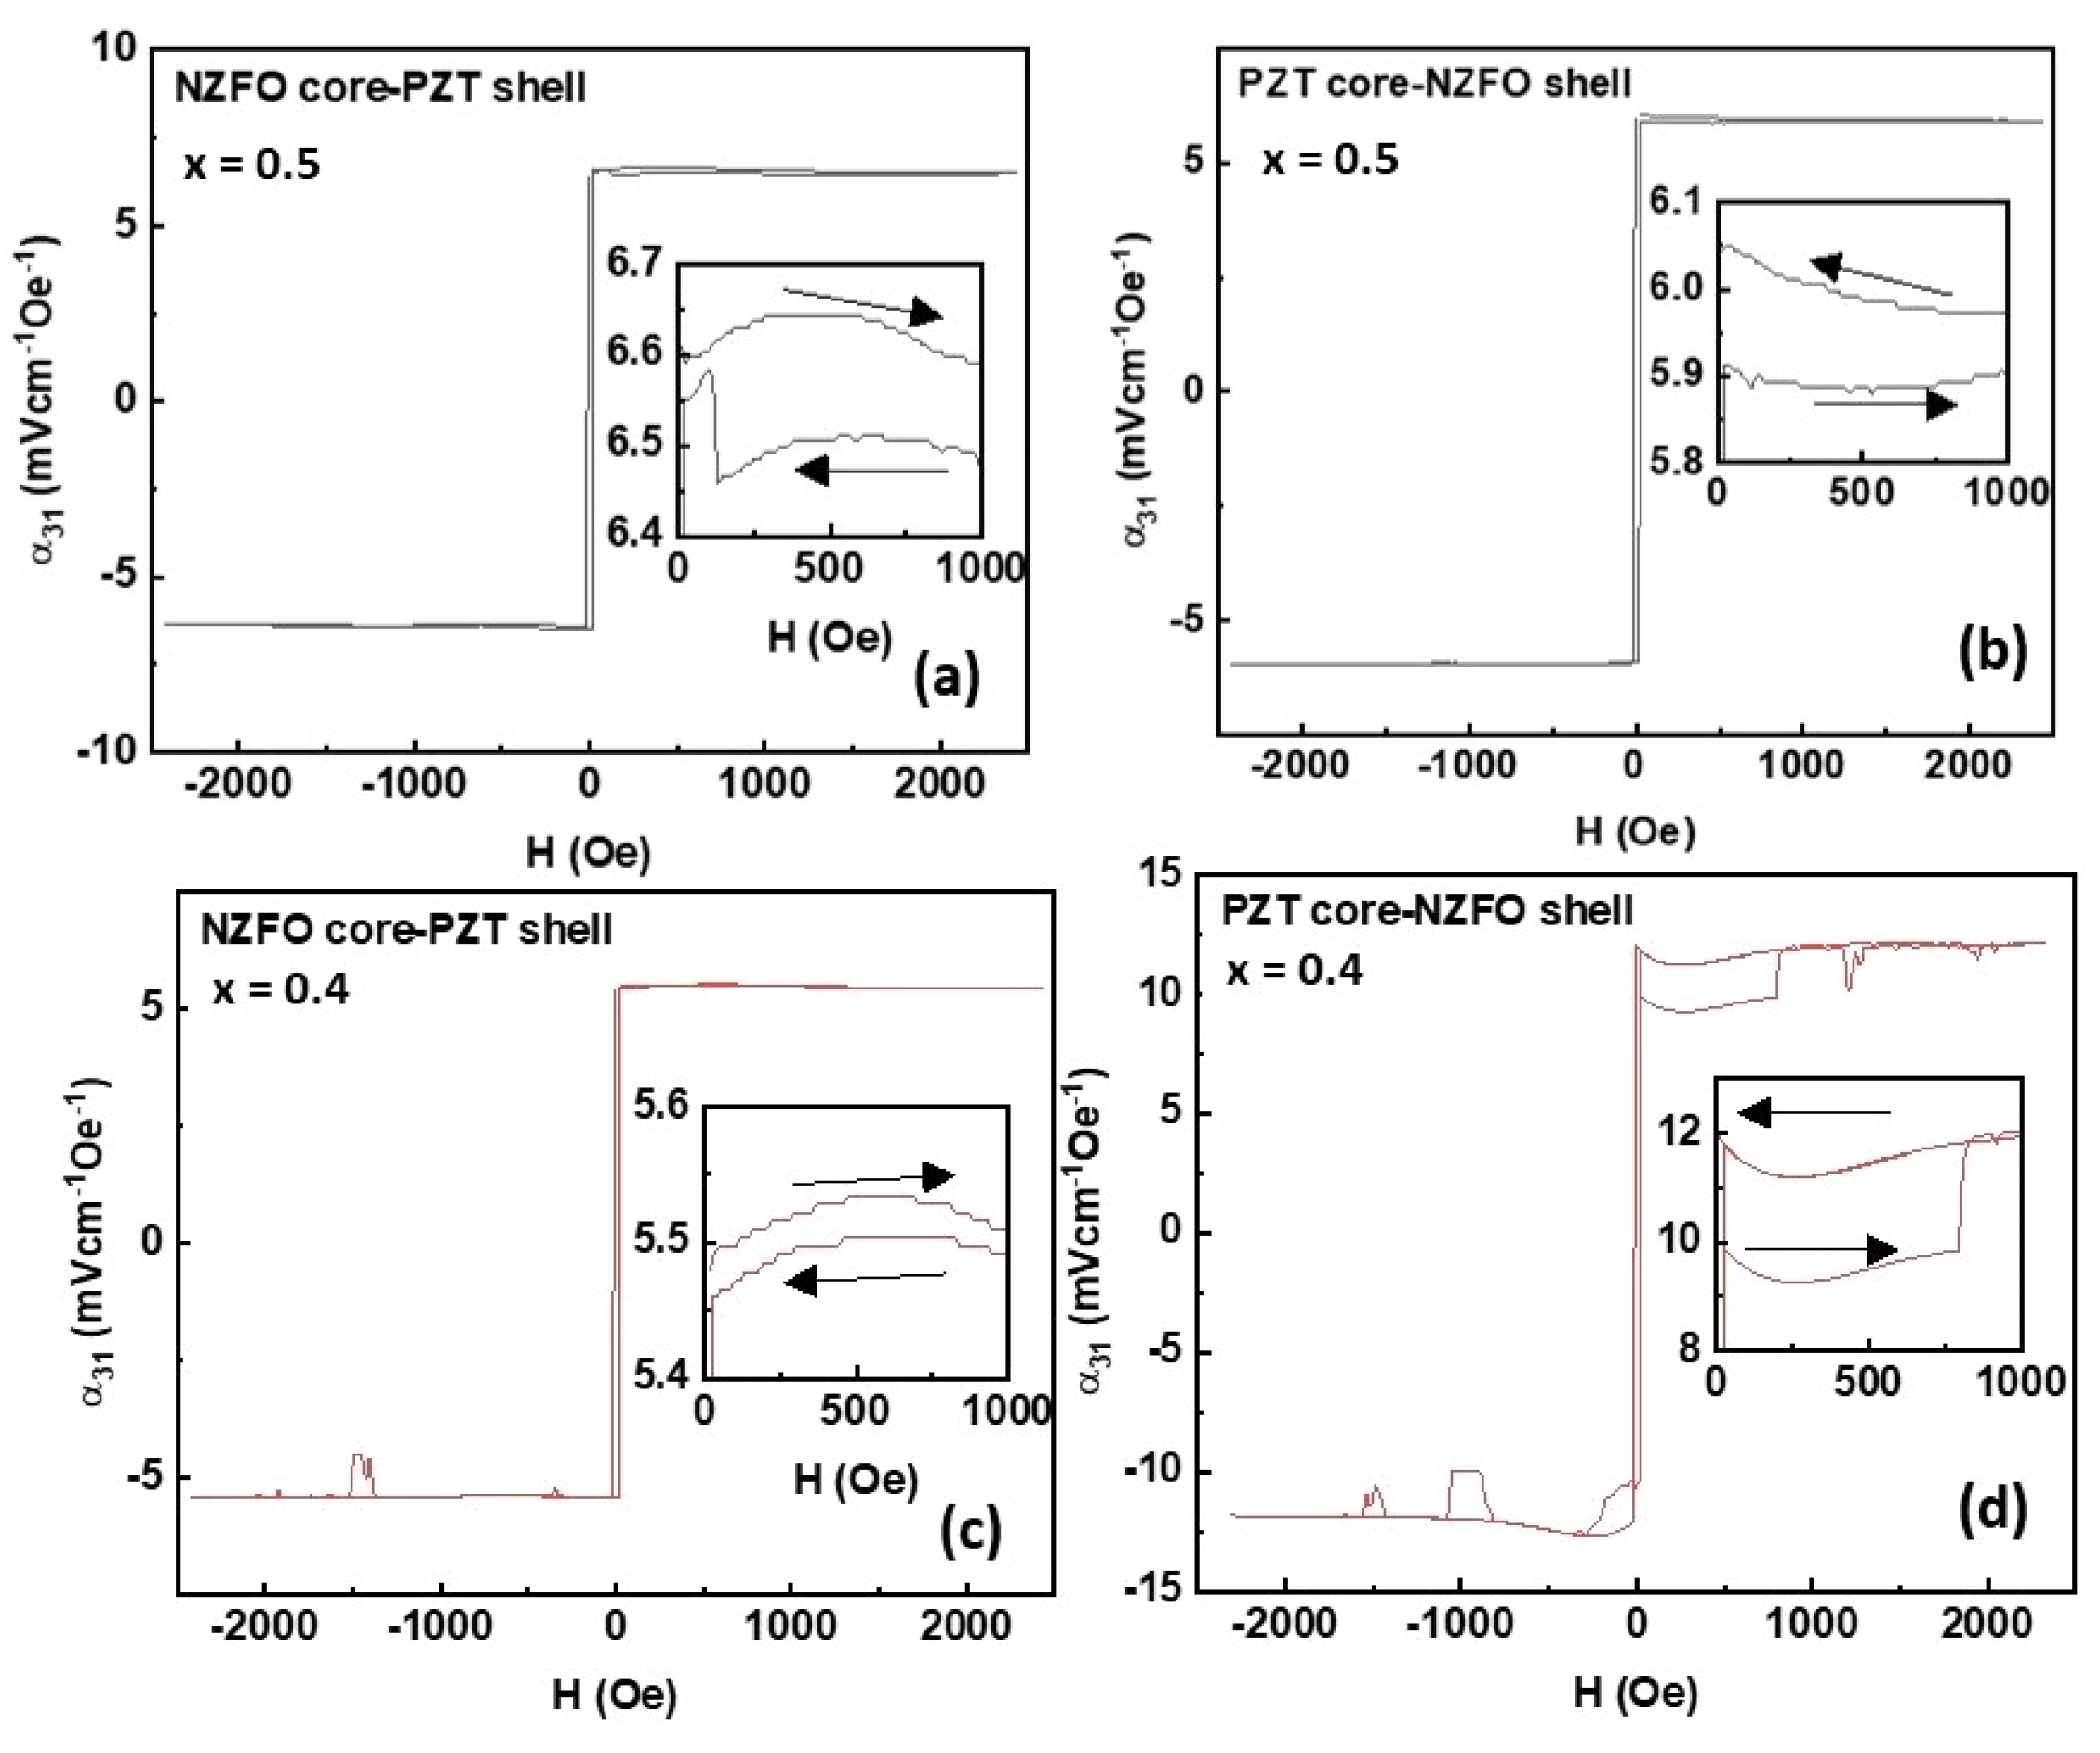
Figure 13.
Data as in Figure 12 for samples of NZFO (x=0.3) – PZT and NZFO (x=0.2) – PZT.
Figure 13.
Data as in Figure 12 for samples of NZFO (x=0.3) – PZT and NZFO (x=0.2) – PZT.
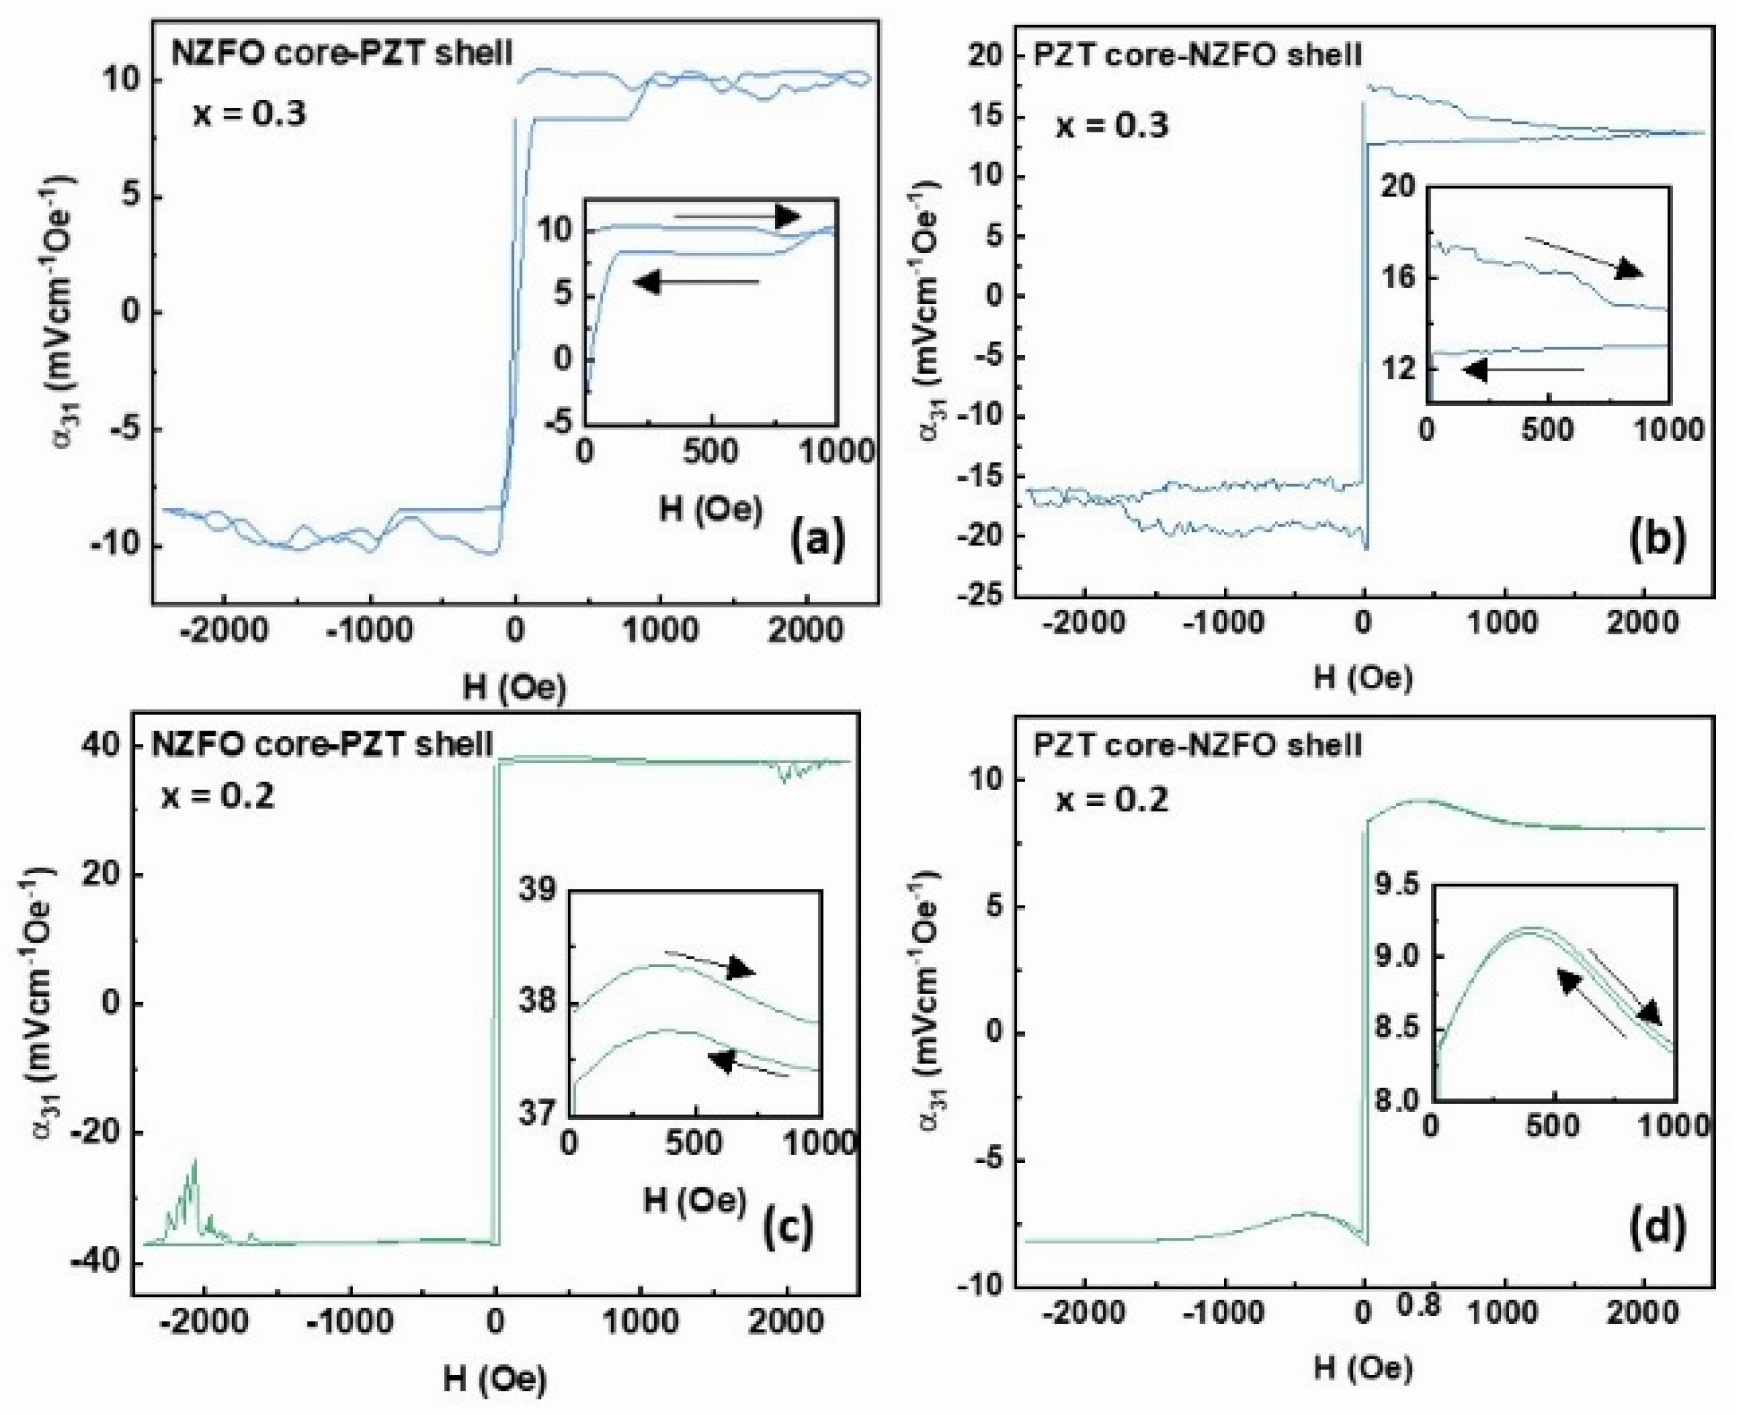
Figure 14.
Data as in Figure 12 for bulk composites with NFO-PZT fibers.
Figure 14.
Data as in Figure 12 for bulk composites with NFO-PZT fibers.
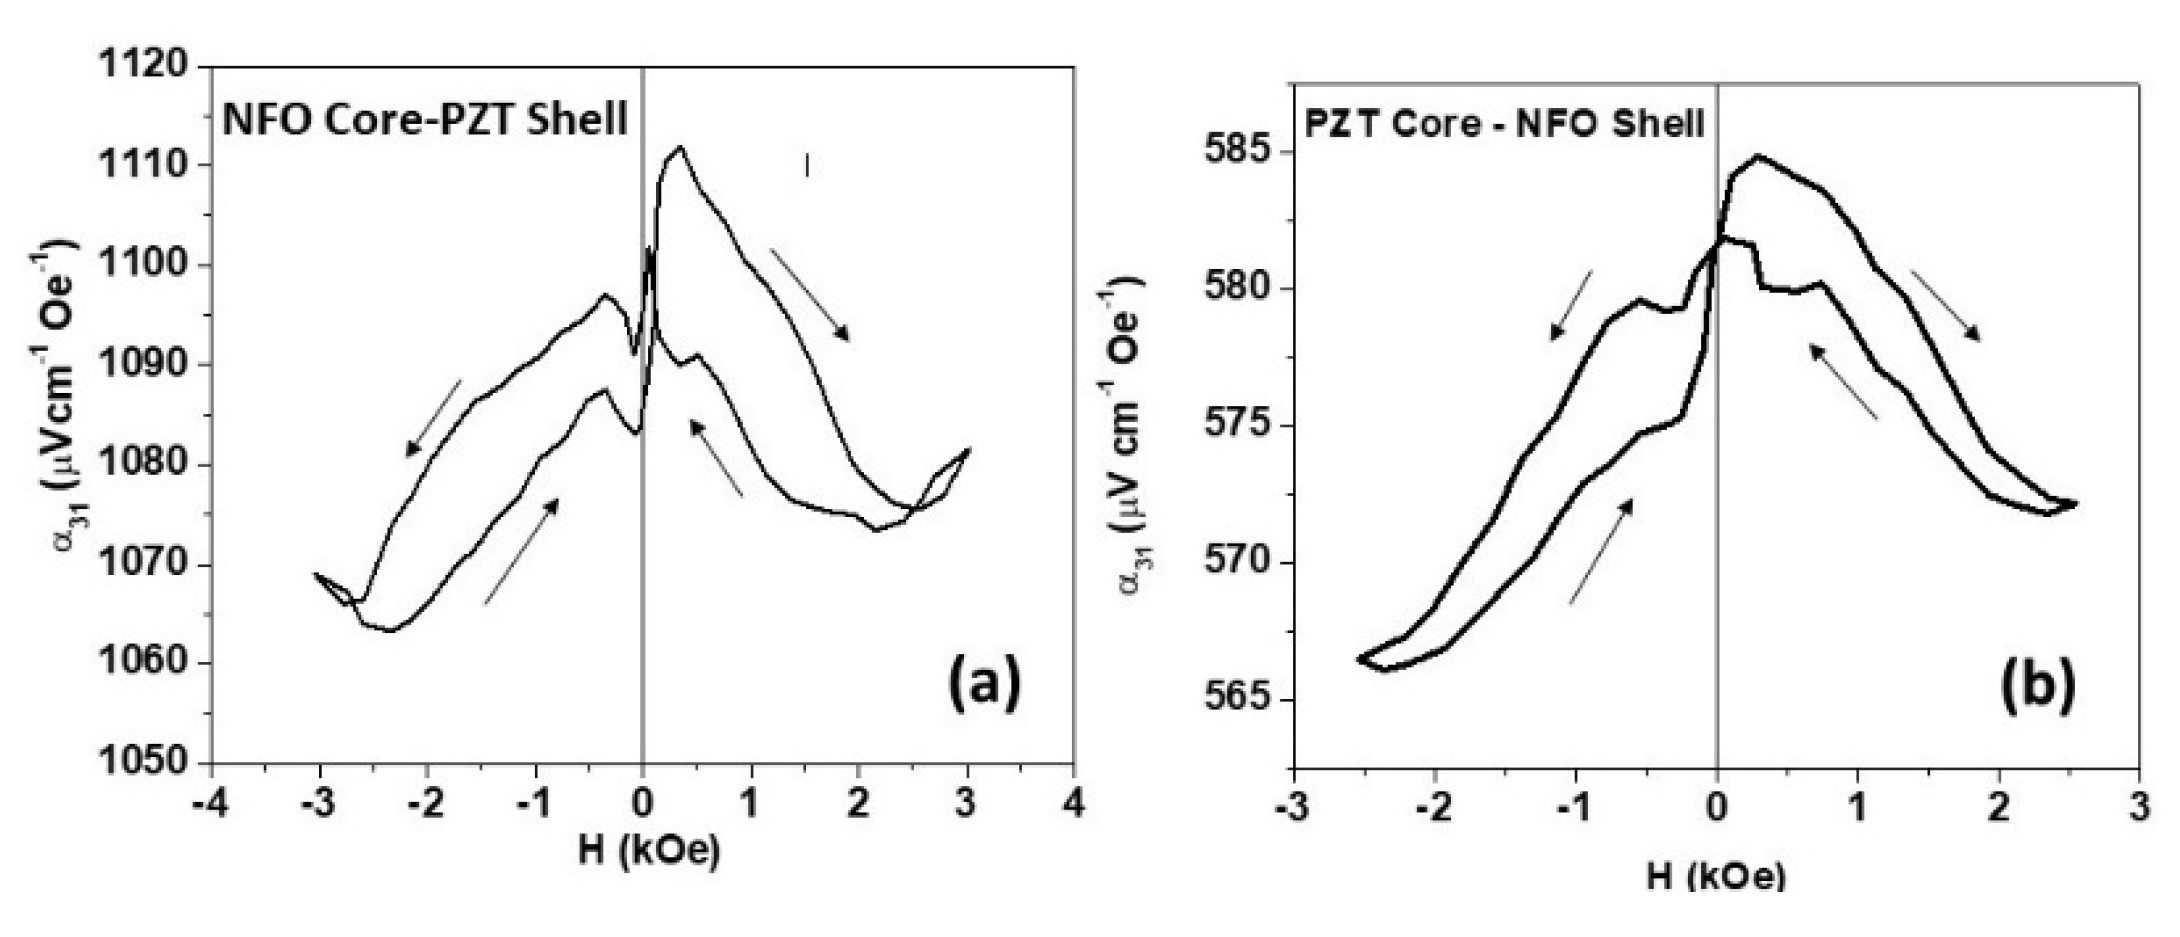
Figure 15.
Maximum fractional H-induced change in Pr as a function of x in fiber samples with randomly distributed NZFO-PZT.
Figure 15.
Maximum fractional H-induced change in Pr as a function of x in fiber samples with randomly distributed NZFO-PZT.
Disclaimer/Publisher’s Note: The statements, opinions and data contained in all publications are solely those of the individual author(s) and contributor(s) and not of MDPI and/or the editor(s). MDPI and/or the editor(s) disclaim responsibility for any injury to people or property resulting from any ideas, methods, instructions or products referred to in the content. |
© 2024 by the authors. Licensee MDPI, Basel, Switzerland. This article is an open access article distributed under the terms and conditions of the Creative Commons Attribution (CC BY) license (http://creativecommons.org/licenses/by/4.0/).
Copyright: This open access article is published under a Creative Commons CC BY 4.0 license, which permit the free download, distribution, and reuse, provided that the author and preprint are cited in any reuse.


