
Submitted:
25 June 2024
Posted:
26 June 2024
You are already at the latest version
Abstract
It is estimated that 3 billion tons of concrete are used globally each year. Cement is a critical component of concrete, and its production accounts for nearly 5-7% of global carbon dioxide (CO2) emissions. Producing one ton of concrete (OPC) releases approximately one ton of CO2. These CO2 emissions contribute to the greenhouse effect, leading to global warming, polar ice cap melting, sea level rise, coastal city flooding, land desertification, decreased agricultural productivity, ecosystem damage, and adverse effects on human health. This situation is concerning, and there is an urgent need to minimize CO2 emissions from the cement industry. This paper focuses on incorporating various materials into concrete to increase its strength and reduce emissions of CO2 and other harmful substances, thereby mitigating the impacts of the greenhouse effect and achieving the great vision of carbon neutrality. The study theoretically analyzes the issues of coconut shell disposal in Southeast Asia and waste tire disposal in Europe and the United States. This paper uses Abaqus to model and analyze various green concretes and compares the data with that of ordinary concrete.
Keywords:
concrete
; construction
; sustainable
; waster waste
; coconut fiber reinforced concrete(CFRC)
; Crumb rubber concrete (CRC)
; Water treatment sludge concrete (WTSC)
; Mining concrete (MC)
; Oyster Shells waste concrete (OSWC)
1. Intraduction
After forty years of reform and opening, China's economy has experienced rapid development and made significant achievements in infrastructure. This is because both infrastructure development and the construction of high-rise buildings require a substantial amount of concrete. It's estimated that the world uses 3 billion tons of concrete annually. Cement is a crucial component of concrete, and the carbon dioxide (CO2) emissions from cement production account for nearly 5-7% of global CO2 emissions. Producing one ton of concrete (OPC) releases approximately one ton of CO2. [2]These CO2 emissions contribute to the greenhouse effect, [3]which leads to global warming, melting polar ice caps, rising sea levels, the inundation of coastal cities, land desertification, decreased agricultural productivity, disruption of ecosystems, and harm to human health, among other consequences. This situation is a cause for concern, and there is an urgent need to minimize carbon dioxide emissions from the cement industry.
Various industrial waste and natural materials are extensively utilized as cementitious supplementary materials or aggregates to reduce the environmental footprint in concrete production, including energy consumption, pollution, waste disposal, resource depletion, and global warming. A significant amount of industrial waste, primarily from construction and demolition, as well as natural resources like coconut shells, oyster shells, and bamboo, which were once considered waste materials, are now being repurposed.
The issues arising from the construction and automotive industries have become significant concerns for governments worldwide. Recently, there has been extensive exploration into the use of recycled aggregates from waste materials as supplements to cement and aggregates.
In recent years, alternatives to traditional cement concrete aggregates, such as rubber tire particles, mining waste, and natural waste materials, have emerged. Due to the development of transportation and rapid population growth, the production of car tires has increased significantly, resulting in a substantial increase in the generation of used tires and their rubber waste. The management of rubber waste has become a significant environmental issue worldwide. Adding rubber particles produced by grinding old tires into concrete can reduce the amount of cement required, thereby reducing carbon dioxide emissions and pollution from used tires.
Concrete is one of the most widely used construction materials due to its strength, durability, and versatility. However, traditional concrete has limitations in terms of tensile strength, cracking, and overall performance under various conditions. [6]To address these limitations and enhance the sustainability of construction practices, there is a growing interest in incorporating composite materials into concrete mixtures. Composite materials, such as fibers, nanoparticles, and recycled components, offer the potential to improve the mechanical properties, durability, and sustainability of concrete structures.
Addressing these challenges and research gaps will facilitate the successful incorporation of composite materials in concrete construction. It will lead to the development of more resilient, durable, and sustainable concrete structures that can meet the evolving demands of the construction industry and reduce its environmental footprint.
In conclusion, the incorporation of waste materials into concrete is a multifaceted approach that offers numerous advantages, including environmental benefits, improved construction materials, and alignment with sustainability objectives. This practice not only reduces the environmental footprint of the construction industry but also promotes responsible and resilient building practices for a more sustainable future.
Experiments and Methods
2. Materials
2.1. Composite Materials
The mechanical properties of fiber composites are much higher than those of other materials. Research shows that the tensile strength of fiber composite materials is significantly stronger than that of ordinary steel bars for construction projects the tensile strength of fiber composite materials is 2~10 times higher than that of ordinary steel bars for construction projects [7]; at the same time, fiber composite materials do not show plastic deformation in tensile experiments because of meeting the standard value of tensile strength. Therefore, researchers conclude that steel reinforcement materials can be replaced by fiber composites in civil engineering constructionto further optimize the quality of construction projects and meet the needs of modern society.
Fiber composite materials have better safety properties than traditional construction materials, such as reinforced concrete. Compared to traditional construction materials, the use of fiber composites in civil engineering does not compromise the safety of the entire building even if the total weight of the building exceeds its limits. [9]Because the internal independent fibers of fiber composites can take more weight and redistribute the weight[10], which can effectively protect the whole building, and at the same time, even if the fiber breaks and damages, it can effectively protect the safety of the project.
Figure 1.
Fiber orientation types.
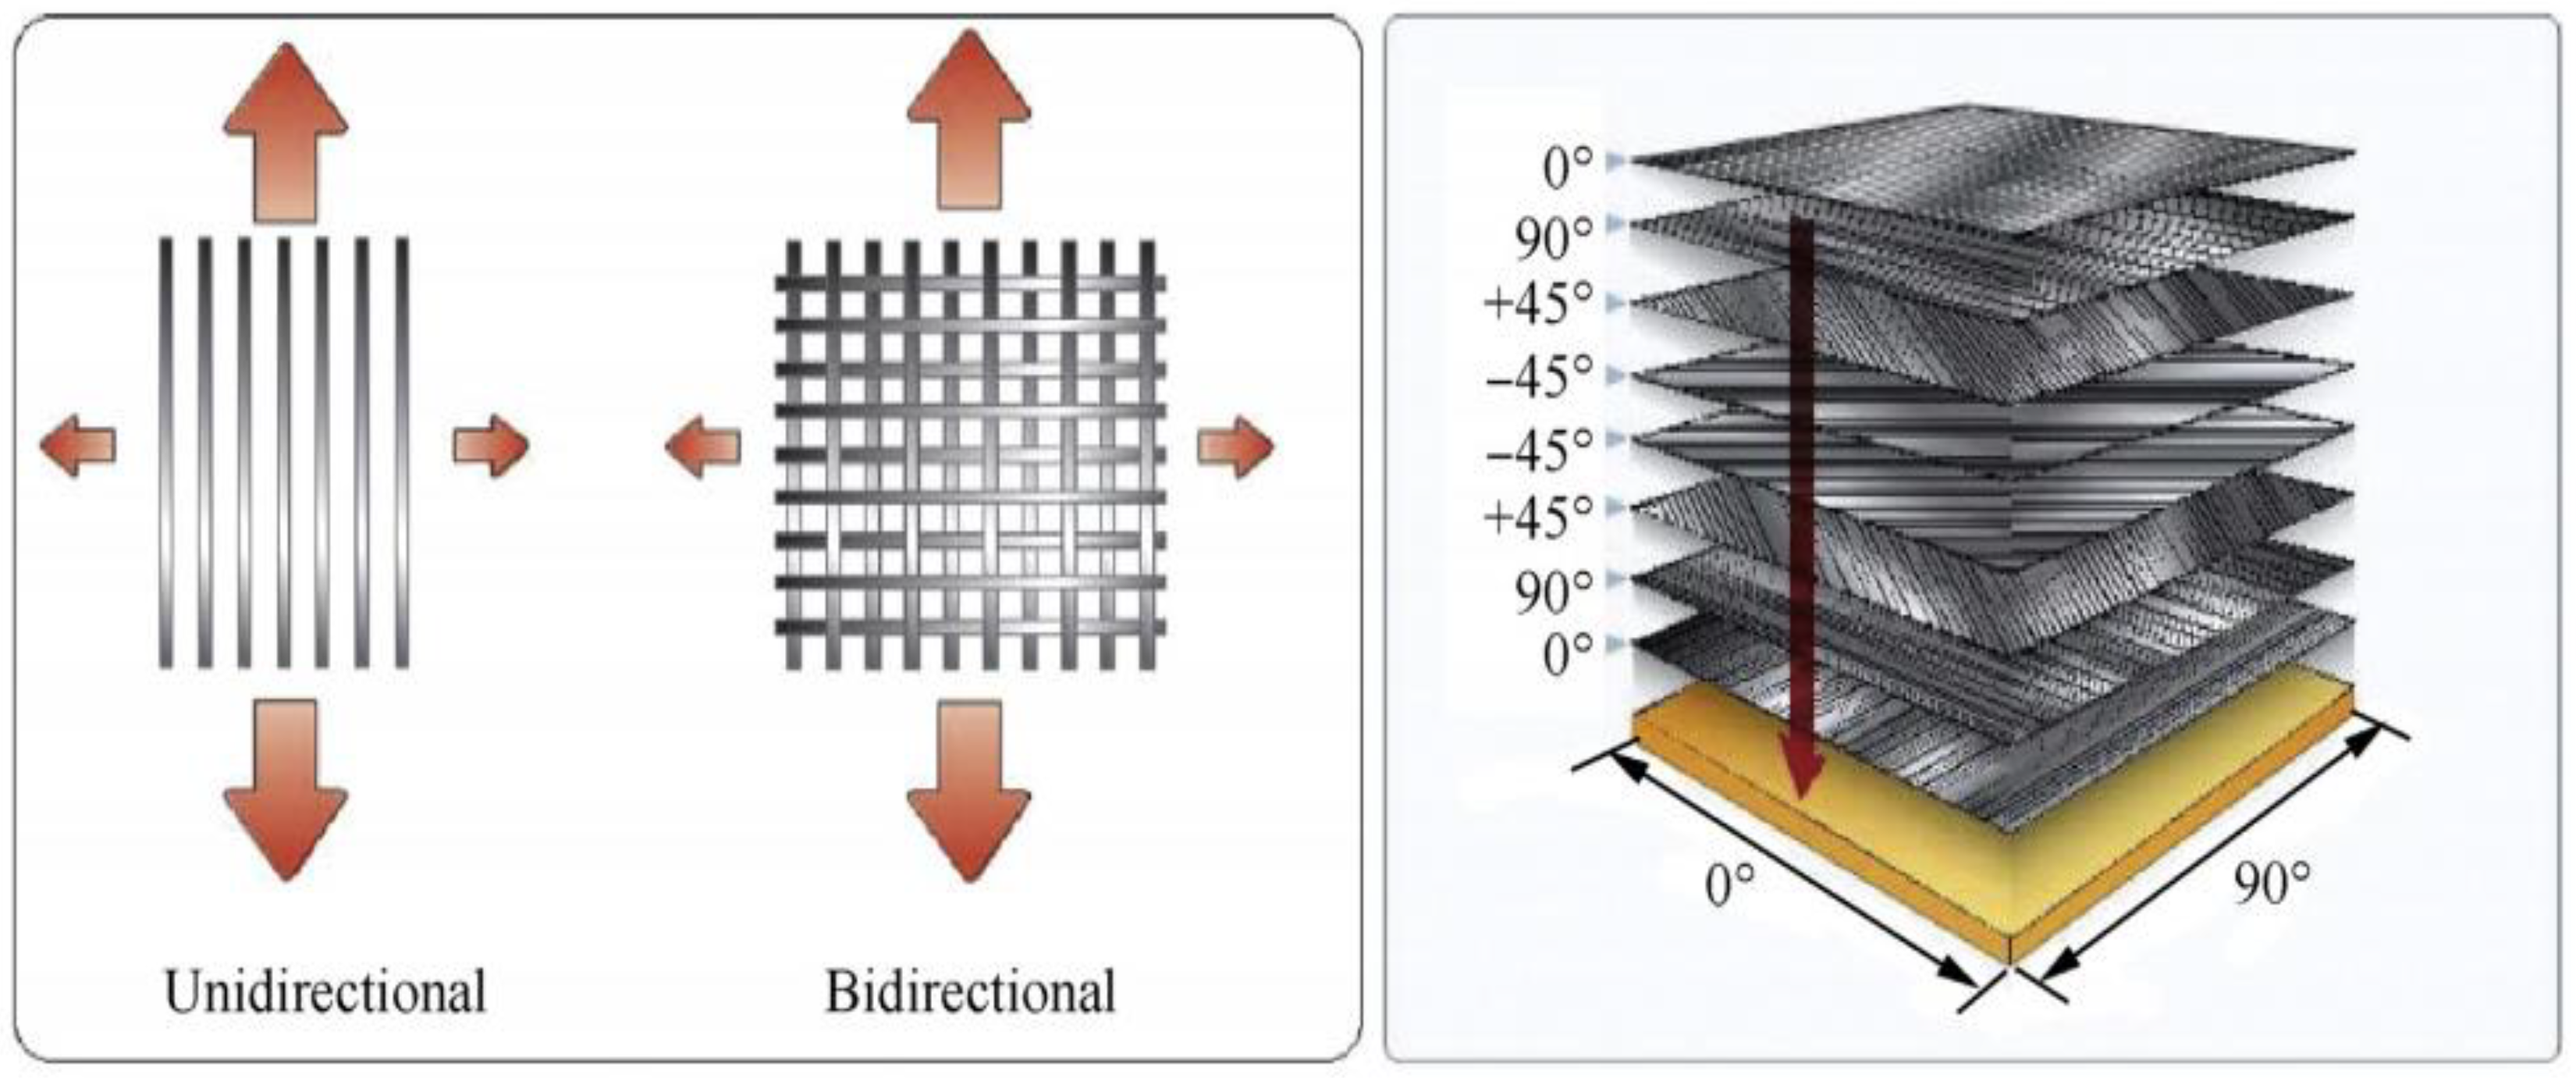
There are huge differences between fiber composites and traditional building engineering materials. The production of fiber composites needs to be completed by fiber materials, and then adding matrix materials, and building comprehensive materials through effective mixing, which exhibits the production of fiber composites requires the fiber material to be completed, and then the matrix material is added to build a comprehensive material by effective mixing[11], which shows the good adaptability of the material and the strong design. Fiber composites materials have been promoted in civil engineering and construction. During construction period, some buildings require special shapes or strength requirements of construction materials, so the construction designers and construction technicians must consider the actual construction of the whole project[12], scientific and reasonable the use of fiber composite materials, to meet the needs of the entire construction project This can meet the needs of the whole construction project and ensure the construction quality of the whole construction project. Fiber composite materials in construction the application of fiber composite materials in construction engineering makes up for the shortcomings of traditional building construction materials and at the same time[13], the value of construction materials is fully highlighted, and the construction cost is reduced.
Natural Fibers
Numerous industrial advances are now feasible because to fiber-reinforced composites. Currently, many structural applications employ composite materials reinforced with glass and carbon fibers[14]. But there are also issues with the economy and the environment. Given that they are comprised of chemicals sourced from refined petroleum, the majority of synthetic fibers are challenging to recycle[15]. Additionally, the energy-intensive nature of their manufacturing methods. Composites made from synthetic inorganic fibers are therefore pricy and inappropriate for the environment. Using natural fibers in place of synthetic, inorganic fibers is a promising substitute. Their quantity, renewable nature, biodegradability, and reduced cost make them superior to synthetic fibers. Bamboo has emerged as a cost-effective and ecological alternative to other natural fibers[16].
2.2. Synthetic Fiber
Synthetic fibers, chemically synthesized by human manufacture, as opposed to natural fibers are derived directly from living organisms. They are created via considerable study because of experts working with grown animal and plant fibers that are found naturally[17]. Typically, fiber-forming material is extruded through a spinneret to create synthetic fibers. These are referred to as synthetic or man-made fibers. When monomers are combined to form long chains or polymers, a process known as polymerization is used to create synthetic fibers.
Synthetic fibers are made from synthetic, small molecules polymers. Petrochemicals or chemicals based on petroleum are examples of the raw sources from which the compounds utilized to create these fibers are produced. These substances undergo polymerization to form chemical compounds that pair together two nearby carbon atoms[18]. Different chemical substances are employed to create various types of synthetic fibers. Nearly half of all fibers are synthetic, which is employed in every aspect of fiber and textile technology. Four different types of fibers—nylon, polyester, acrylic, and polyolefin—dominate the market despite the fact that several synthetic polymer-based fiber types have been assessed as potentially important commercial goods. Around 98% of synthetic fiber manufacturing is made up of these four items, with polyester making up about 60%.
Many synthetic fibers are more stain- and water-resistant than natural fibers. Some have even been strengthened specially to withstand harm from stains or water[19].
2.3. Mixed Fibers
To achieve the necessary qualities, hybrid composites are composite materials made up of two or more fibers in a reinforced matrix. material has an advantage over other kinds of composite materials in that its mechanical behavior is the result of the qualities of each fiber component added together. Reinforcing materials are used to create hybrid composites. shortcomings of the mechanical characteristics of other types of fibers can be strengthened by combining two or more distinct types of fiber[20].

Table 1.
Mechanical properties of fiber-reinforced concrete in different experiments.
| Author | Year | Materials | Advance | Influence Factor |
|---|---|---|---|---|
| [14] | 2019 | GF/CF | Strength刘Stiffness | It has good flexibility and tensile strength, while also being very light in weight, making it a high-performance reinforcing material. |
| 2020 | GF/CF | Strength刘Stiffness | Carbon fiber resists chemical and environmental corrosion, extending its lifespan in harsh conditions. | |
| 2023 | NF | Strength刘Stiffness刘Economic | Using natural fibers instead of synthetic, inorganic fibers is a promising substitute due to their renewable nature, biodegradability, reduced cost, and abundance. | |
| [17] | 2021 | SF | Strength刘Stiffness | Compared to traditional metals, nylon composites offer similar strength and stiffness at a lower density, reducing overall weight. |
| [18] | 2021 | SF | Strength刘Stiffness | Nylon composites resist chemicals and solvents well, maintaining performance in harsh environments. |
| [19] | 2023 | SF | Strength刘Stiffness | Nylon composites are cost-effective compared to high-performance alternatives, making them a practical choice for various applications. |
| [20] | 2021 | MF | Strength刘Stiffness | Reinforcing materials in hybrid composites strengthen weaknesses in mechanical characteristics by combining different fiber types. |
| [21] | 2021 | CF | Strength刘Stiffness | Tension weakness can be addressed by traditional reinforcement materials and, partially, by adding a few randomly dispersed fibers to concrete mixtures. |
| 2019 | FRC | Strength | It might include volcanic ash and other additives found in regular concrete to enhance workability and strength. | |
| [23] | 2020 | FRC | Strength | Adding fibers to concrete enhances strength, elasticity, ductility, crack control, and overall structural performance. |
2.4. Waste Tires
A significant factor in assessing concrete's dynamic performance is whether it has good impact resistance. Rubber has a higher ability to absorb energy than regular concrete, hence rubber concrete has better impact qualities. Chen G They found through experiments that the bridging effect of rubber in concrete can increase the tensile strength of concrete, thus increasing its flexural strength. And fiber reinforced rubberized concrete (RFRRC) has more prospective uses in seismic buildings, concrete pavements, specific data is provided in Table 2, impact barriers, playground floors, crash piers, etc. because it has superior ductility, bending toughness, impact resistance, and energy absorption capacity.
Kazmi S M S found that under the same rubber replacement ratio conditions, the concrete strengths of all compressed rubber concrete specimens were significantly higher than those of uncompressed rubber concrete specimens. It was shown that the compression approach increased the tensile strength of rubber concrete in Figure 2.
CRC is more elastic, and durable compared to traditional concrete. It can withstand heavy loads and traffic, reducing wear and tear over time. Adding rubber particles to concrete mixtures can reduce the formation of cracks, making pavements or structures more long-lasting. One of the primary advantages of rubberized concrete is its contribution to recycling old tires, reducing the environmental impact of waste tires, specific data is provided in Table By recycling old tires and extending the lifespan of road surfaces, rubberized concrete has a positive environmental impact, including reduced energy consumption, resource conservation, and less waste in landfills.
2.5. Water Treatment Sludge(WTS)
Senior C and his team found that sludge from water and wastewater treatment plants, as well as coal residues, can be used as raw materials to produce paving concrete blocks. The compressive strength of these eco-friendly concrete blocks produced using these waste materials is 36 MPa, meeting the standard specifications for paving bricks in Hong Kong.
Research indicates that the compressive strength of concrete mixtures in Table 4, in which coal bottom ash is used as a replacement for fine aggregates, is higher than that of concrete mixtures composed of sand. This is because the pozzolanic reaction of coal bottom ash begins to influence the chemical reactions within the concrete, thereby enhancing its performance.
Due to its unique characteristics, WTS can be incorporated into building materials such as bricks, ceramics, lightweight aggregates (LWA), cement, and geopolymer. Adding up to 10% aluminum-based sludge to ceramic tiles is satisfactory, with a slight decrease in mechanical performance, while compared to clay bricks, iron-based sludge can enhance mechanical strength. For concrete, substituting 5% of cement or sand with WTS is considered an ideal choice for various structural and non-structural applications without adverse effects on mechanical performance. The significant differences in the physical and chemical properties of WTS and organic content present challenges that could potentially affect the structural integrity and performance of the product. Specific data is provided in Table 4 It is recommended to sinter at temperatures above 1000°C to completely immobilize heavy metals in the WTS-modified product, preventing environmental pollution.
Table 2.
Mechanical parameters and PFC result[25].
Table 2.
Mechanical parameters and PFC result[25].
| Group | Compressive strength (MPa) | Peak strain刘(%) | Elasticity modulus(GPa) | Poisson ration | |
|---|---|---|---|---|---|
| 0% | Laboratory | 38.58 | 0.843 | 5.77 | 0.265 |
| Simulation | 38.9 | 0.915 | 5.72 | 0.261 | |
| 4% | Laboratory | 1.15 | 1.63 | 0.065 | 0.386 |
| Simulation | 1.097 | 1.57 | 0.069 | 0.392 | |
Figure 2.
The best-fit curve between Young’s modulus of CRC and the change of rubber content[26].
Figure 2.
The best-fit curve between Young’s modulus of CRC and the change of rubber content[26].
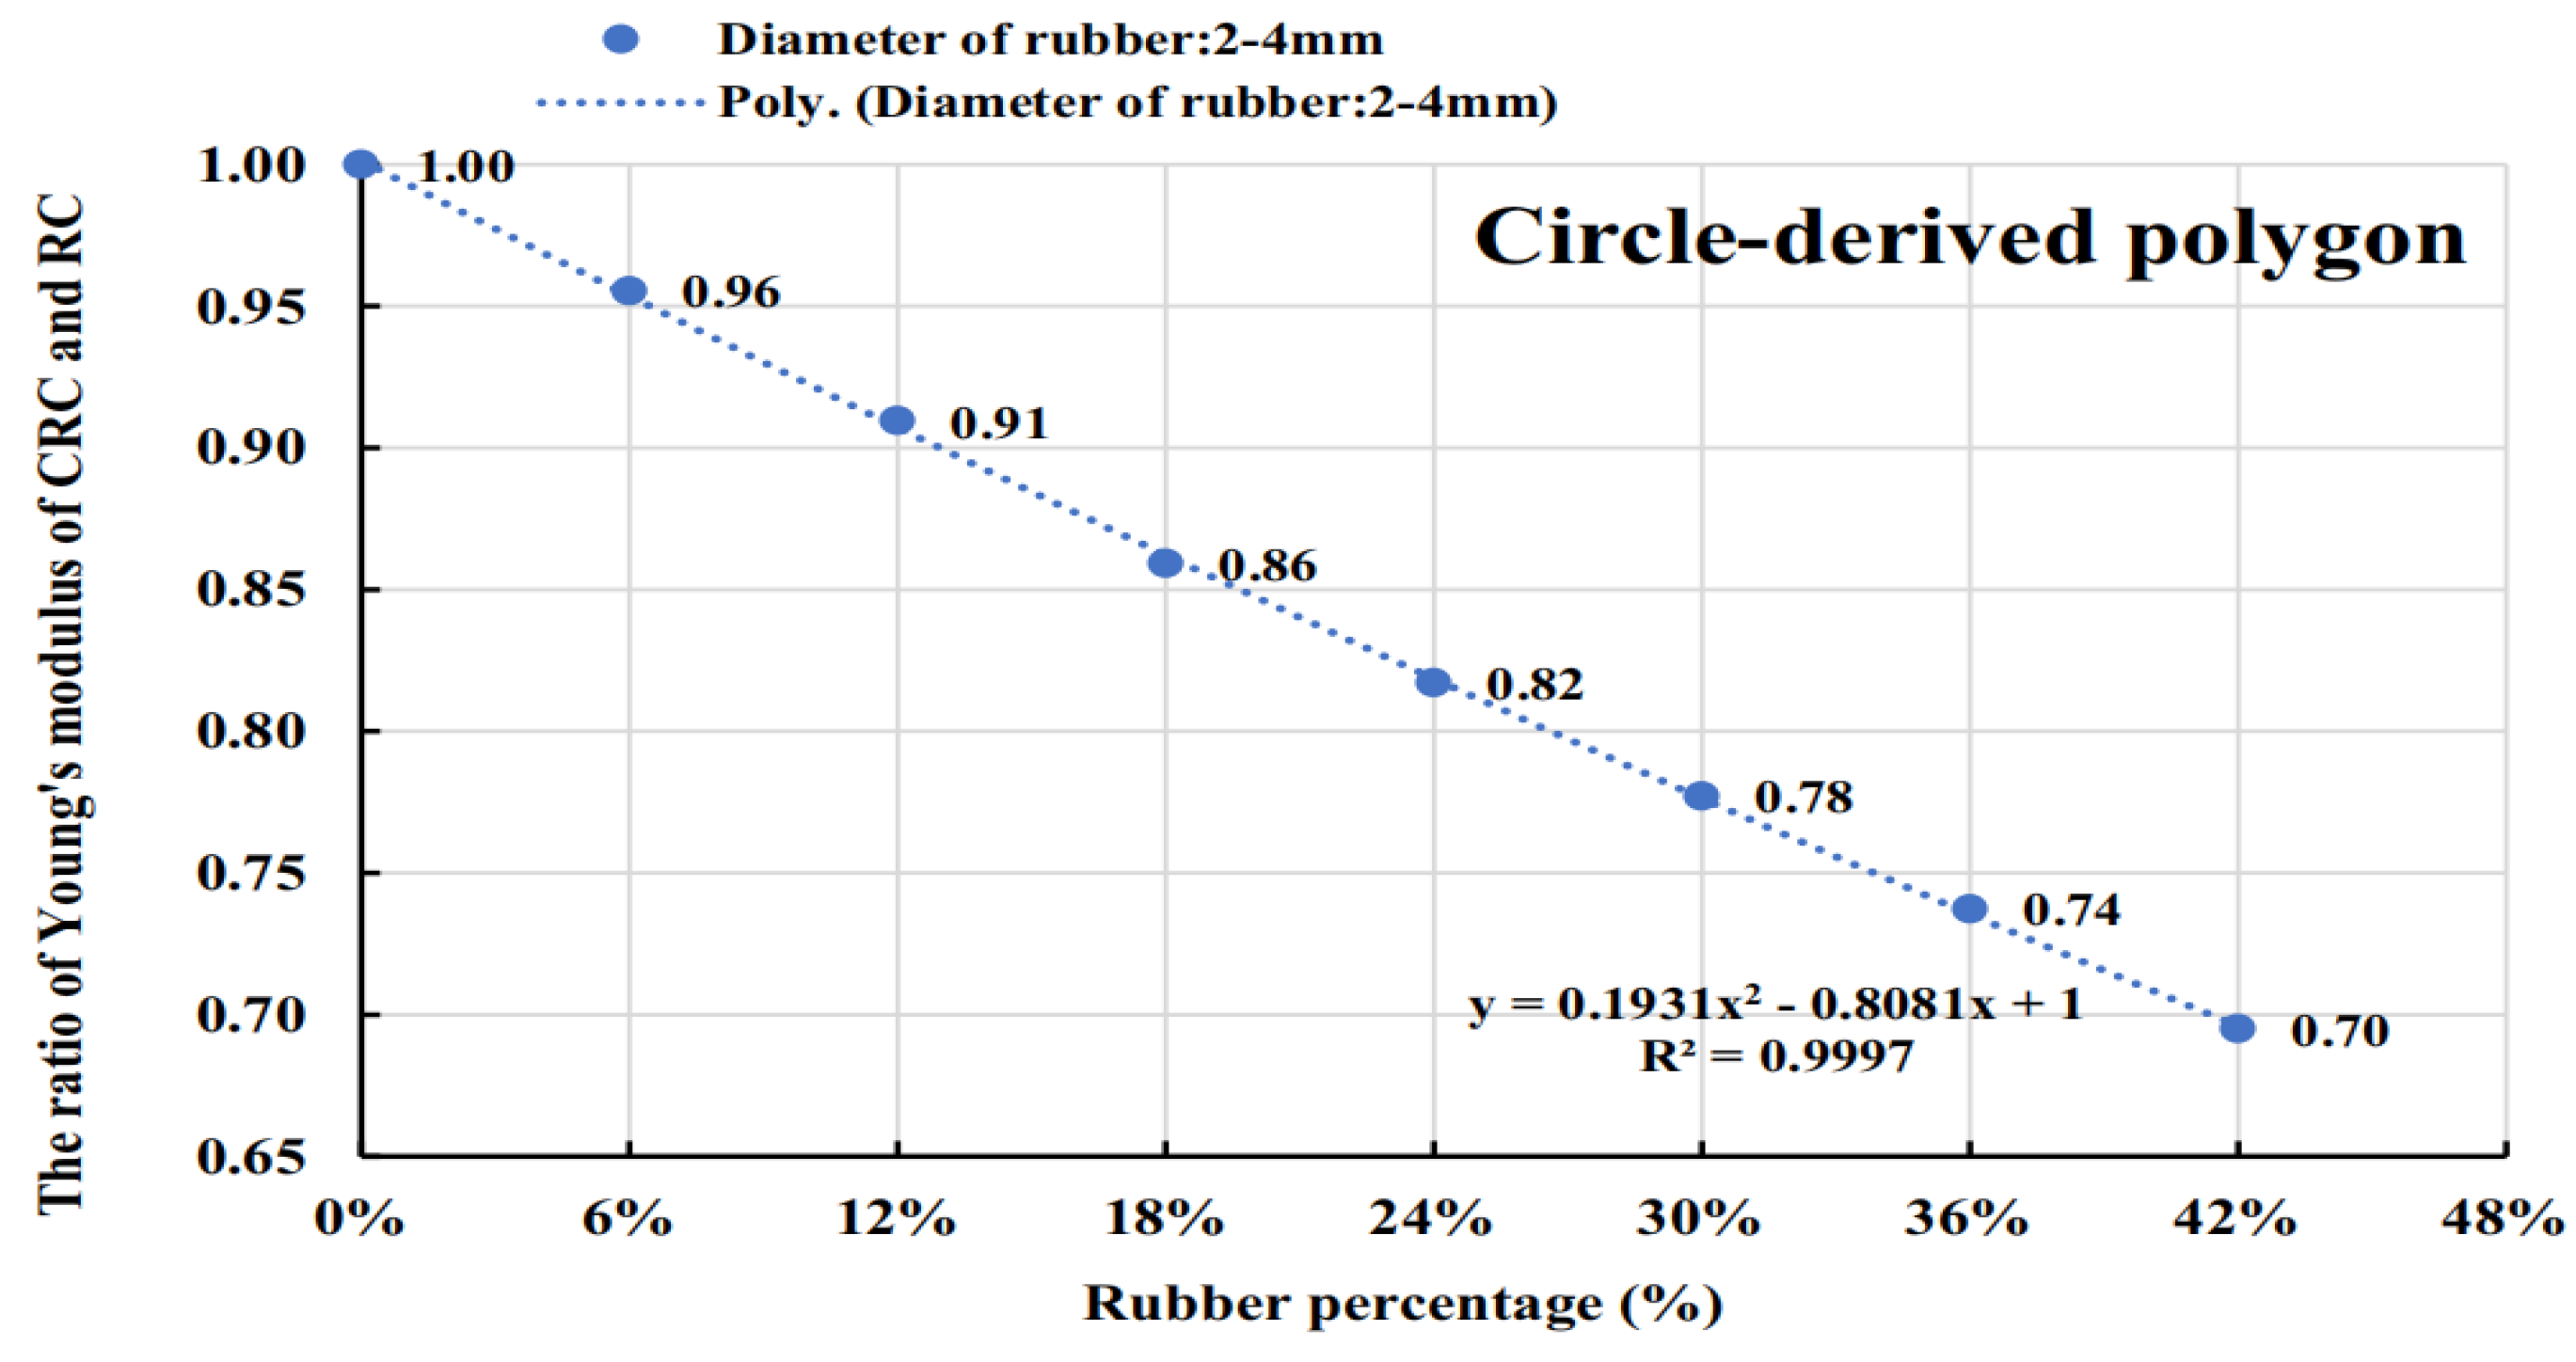
Table 3.
Main geotechnical properties of WTS.
| Property | Unit | Alum sludge | Ferric sludge | Lime sludge |
|---|---|---|---|---|
| Liquid limit | % | 80-550 | 108 | 38-72 |
| Plastic limit | % | 60-325 | 47 | 32-53 |
| Plasticity index | % | 20-225 | 61 | 4-19 |
| Specific gravity | g/cm3 | 1.86-2.33 | 2.26-2.72 | 2.57-2.62 |
| Solid classification(USCS) | High-plasticity clay | High-plasticity clay | Low-plasticity clay | |
| Loss on ignition | % | 15-57 | 24-50 | 35-40 |
| Reference | [30] | [31] | [32] |
2.6. Mining Waste Material
The researchers discovered that the addition of slag to concrete has two significant effects on its workability and mechanics [33]. First is incorporation of slag will influence the flow and setting time of cementitious sand. Slag increases the fluidity of cementitious sand greatly for the same quantity of water, which prolongs the time it takes for cement to set. The workability during construction has substantially improved due to the enhanced fluidity. The extended curing period for mass concrete placing enables a less concentrated release of heat, which is particularly advantageous for the concrete's final strength [34]. Second is the strength of cementitious sand will be influenced by the mixing of slag. For the analysis of the strength performance of concrete after slag incorporation, the compressive strength of concrete decreases significantly with the increase of blast furnace slag powder incorporation. The addition of blast furnace slag affects the workability and setting time of the concrete, thus significantly affecting the initial setting strength of the concrete[35].
When we looked at the properties and water resistance of slag concrete, we discovered that whether fly ash was combined with mineral powder or mineral powder was used alone, the concrete's degree of seepage resistance was much increased [36]. The secondary hydration of the cement, which further hydrates the concrete and causes the voids to become denser and the concrete to be dense, is further encouraged when admixtures like mineral powder or fly ash are added to the concrete. This significantly increases the impermeability of the concrete [37].
Due to the hydration of the cement, a significant quantity of heat is generated while the concrete hardens. Because of its great thermal resistance, concrete cannot quickly transfer heat into the surrounding air [38]. Due to the temperature differential between the interior and outside of the building, this will cause heat to build up inside the concrete structure, resulting in uneven temperature deformation and temperature strains. The key factor for concrete to fracture early is the buildup of these pressures, which will ultimately cause microcracks to form and even grow into macrocracks [39].
The optimal mixture with the best performance consists of a 0.67:0.33 ratio of biochar to slag, with a dosage of 10% [40]. This study demonstrates that biochar-slag binder holds promising prospects in soil stabilization, replacing Portland cement, reducing the carbon footprint of the construction industry, and enhancing the potential for a circular economy. specific data is provided in Table 5.
The safe consolidation of mining residues to produce construction products can be a key factor in the sustainable construction sector, addressing the issue of overexploitation of primary resources and contributing to research and innovation projects in line with the EU Circular Economy Strategy.
2.7. Coconut Shell
In a study by Abiodun, J, and Kilani [42], it was found that the addition of banana fibers improves the compressive strength of concrete blocks. As the compressive load increases, it triggers the development of cracks within the concrete structure. When cracks approach the location of the fibers, the fiber-matrix interface begins to debone due to stresses perpendicular to the crack path. The production of significant tensile stresses within the concrete subsequently leads to microcracks. This phenomenon suggests that the incorporation of isotropic fibers enhances the fiber-matrix interface of the concrete, thereby increasing its compressive strength.
Lightweight concrete (LWC) typically has weaker tensile strength. Therefore, adding fiber materials is a promising technique to overcome the low tensile strength performance of lightweight concrete, especially in terms of splitting tensile strength, without exceeding the density limits of LWC. Steel fiber-reinforced conventional concrete (CS concrete) has shown a significant improvement in splitting tensile strength [43]. The inclusion of polypropylene fibers has also increased the splitting tensile strength of CS concrete by 22%.[44]
The safe consolidation of mining residues to produce construction products can be a key factor in the sustainable construction sector, addressing the issue of overexploitation of primary resources and contributing to research and innovation projects in line with the EU Circular Economy Strategy, specific data is provided in Table 6.
CFRC can exhibit higher toughness and impact resistance, making it suitable for critical applications where impact and stress resistance are essential, such as pedestrian walkways and road construction. Coconut fibers can enhance the concrete's crack resistance, making it more durable and less prone to shrinkage cracks, especially in harsh environmental conditions. Using coconut fibers as reinforcement is a sustainable choice as they are renewable resources, biodegradable, and environmentally non-hazardous. This can reduce the environmental impact of construction projects as shown in Table 7.
To prepare CFRC, coat a pan with a layer of coconut fiber, then sprinkle it with aggregate, sand, and cement. Cover the first layer of fiber with dry concrete materials using a shovel. Next, add another layer of coconut fiber, followed by a layer of aggregate, sand, and cement. Repeat this process until the remaining materials are put into the mixer. Add about three-quarters of the water (water-cement ratio of 0.48, the same as regular concrete) and rotate the mixer for 2 minutes. Then, add the remaining water and rotate the mixer again for 2 minutes. refer to Figure 3 and Figure 4 for details.
Table 4.
Mining concrete (MC) constituents [41].
Table 4.
Mining concrete (MC) constituents [41].
| COMPONENTS | FUNCTIONS | SELECTION PARAMETERS | TYPES |
|---|---|---|---|
| CEMENT | Binding material, formation of primary hydrates | C3A: 3.8%; C2S: 22%; C3S: 60%; C4AF: 7.4%. (maximum) | OPC, Medium fineness |
| SEND | Give strength, aggregate | Moderate hardness easily found and less expensive | Natural, Crushed |
| A GOLD MINING WASTES | Have similar properties to刘common concrete | 20% of mine residues achieved higher strengths | Mining wastes |
| FIBERS | Improve ductility | 1% fiber content | Procured from industry |
Table 5.
Physical properties of coconut shell aggregate [45].
Table 5.
Physical properties of coconut shell aggregate [45].
| Properties | values |
|---|---|
| Maximum and minimum size (mm) | 12 and 4.75 |
| Thickness (mm) | 3-8 |
| Water absorption (%) | 25 |
| Specific gravity | 1.11 |
| Fineness modulus | 6.25 |
| Bulk density (g/cm3) | 0.65 |
| Void ratio | 0.64 |
| Crushing value (%) | 2.59 |
| Abrasion value (%) | 2.0 |
| Impact value (%) | 7.9 |
| Moisture content (%) | 3.8 |
Table 6.
Properties of plain concrete (PC) and coconut fiber reinforced concrete (CFRC) according to Baruah and Talukdar [46].
Table 6.
Properties of plain concrete (PC) and coconut fiber reinforced concrete (CFRC) according to Baruah and Talukdar [46].
| Fiber volume fraction刘(%) | Compressive strength刘(MPa) | Split tensile strength刘(MPa) | Modulus of rupture刘(MPa) | Shear strength刘(MPa) | Toughness index刘(I5) | Toughness index刘(I10) |
|---|---|---|---|---|---|---|
| - | 21.42 | 2.88 | 3.25 | 6.18 | 1.934 | 1.934 |
| 0.5 | 21.70 | 3.02 | 3.38 | 6.47 | 2.165 | 2.270 |
| 1.0 | 22.74 | 3.18 | 3.68 | 6.81 | 2.109 | 2.773 |
| 1.5 | 25.10 | 3.37 | 4.07 | 8.18 | 2.706 | 4.274 |
| 2.0 | 24.35 | 3.54 | 4.16 | 8.21 | 2.345 | 3.452 |
Figure 3.
Effect of fiber (a) content and (b) length on water ratio.
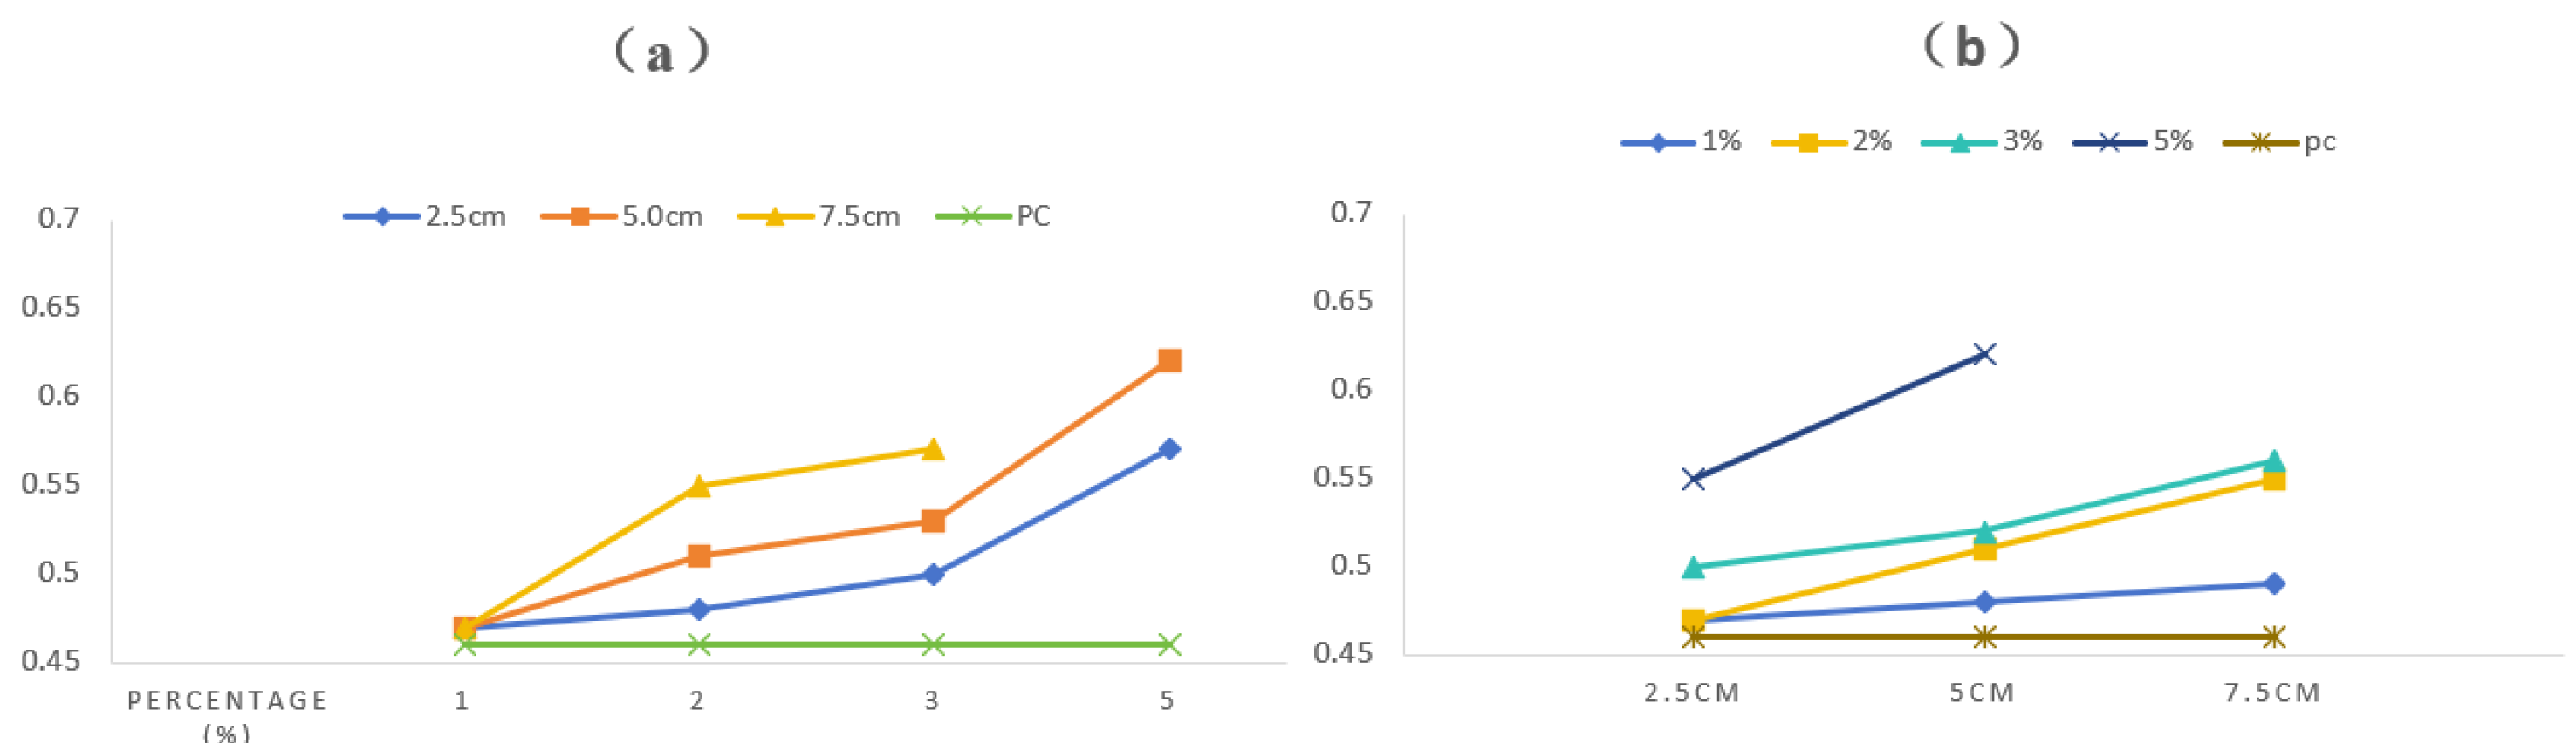
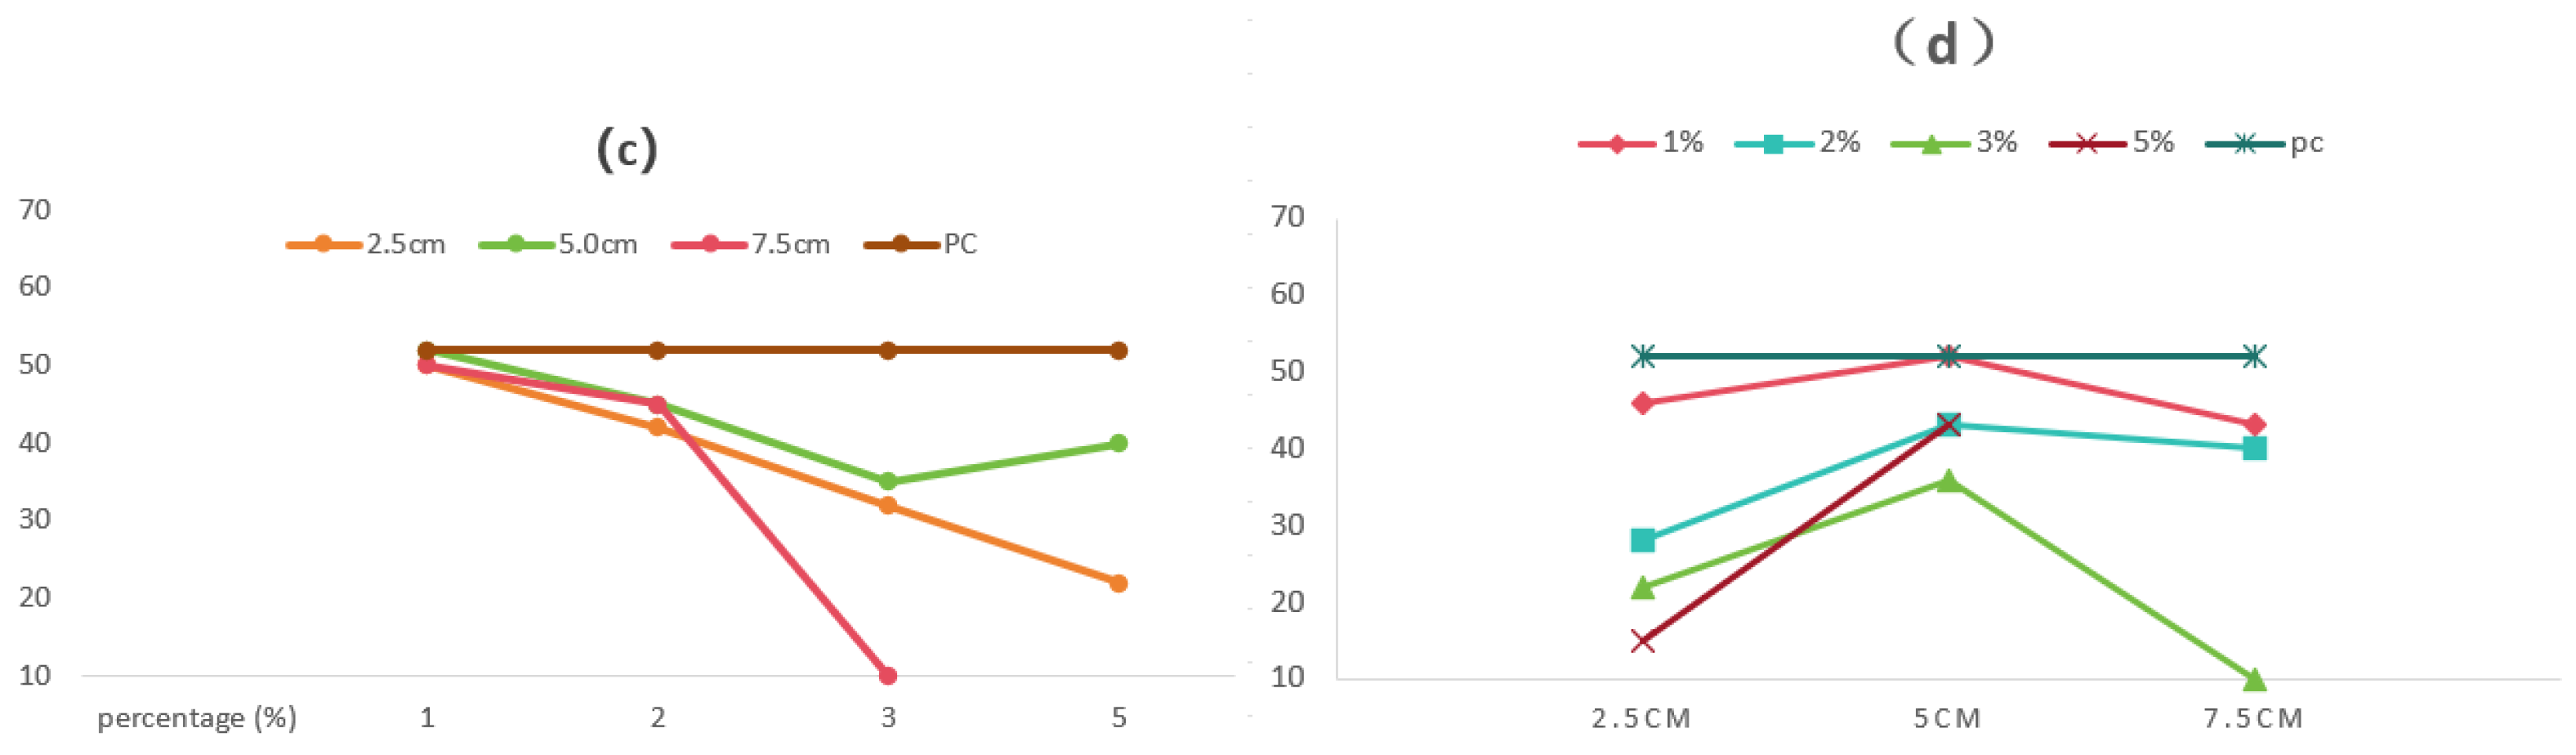
Figure 4.
Influence of fiber (a) content and (b) length on slump.
2.8. Shell Waste
It appears that concrete composed of crushed CSS does not exhibit significant changes in tensile splitting strength when compared to concrete composed of sand. The splitting tensile strength of concrete is based on the strength of the matrix, and CSS particles do not appear to affect this resistance. It can also be confirmed that the adhesion of CSS particles to the cement paste is like that of natural aggregates, despite one side of their shell being smooth. [49]
These findings suggest that CSS can be a suitable replacement for traditional sand in concrete mixes without compromising the tensile splitting strength of the concrete, and it maintains good adhesion properties with the cement paste.
Researchers have demonstrated that easily cleanable crushed CSS can replace traditional fine aggregates in concrete within standard ranges. With a simple washing or drying process, appropriate CSS aggregates can be obtained for use as a replacement for traditional fine aggregates in concrete. This highlights the potential ease of integrating CSS into concrete production processes as a sustainable alternative.
Recycling oyster shells as construction materials can help reduce waste and promote sustainability by reusing waste that might otherwise end up in landfills as shown in Table Oyster shells, after proper processing and incorporation into concrete, can enhance its compressive strength, making it a more durable construction material. Using oyster shells can reduce the demand for traditional aggregates like sand and gravel, which can have significant environmental impacts due to the extraction process. This, in turn, reduces the consumption of natural resources. In oyster shell-rich regions, they can be an economically efficient alternative to traditional aggregates, potentially lowering construction costs.
Table 7.
Oyster Shells waste concrete (OSWC) constituents [50].
Table 7.
Oyster Shells waste concrete (OSWC) constituents [50].
| COMPONENTS | FUNCTIONS | SELECTION PARAMETERS | TYPES |
|---|---|---|---|
| CEMENT | Binding material, formation of primary hydrates | C3A: 3.8%; C2S: 22%; C3S: 60%; C4AF: 7.4%. (maximum) | OPC, Medium fineness |
| SEND | Give strength, aggregate | Moderate hardness easily found and less expensive | Natural, Crushed |
| OSW | Improve durability, frost resistance, carbon resistance, and porosity. | Converting them to powder form | Obtained from breeding areas |
| FIBERS | Improve ductility | 1% fiber content | Procured from industry |
3. Methods and Casting
The research methodology focusing on modeling using Abaqus. Problem Modeling and Preparation: Initially, researchers need to model the research object and determine the required boundary conditions, material parameters, etc. This includes selecting appropriate finite element models, meshing, and loading conditions. Simulation Setup: Once the modeling preparation is complete, simulation parameters need to be set, including time step size, convergence criteria, solver options, etc. These settings affect the accuracy and computational efficiency of the simulation. Simulation Execution: After completing the simulation setup, run the Abaqus simulation program for computation. Depending on the complexity of the problem and computational resource limitations, parallel computing or staged computation may be required. Result Analysis: Upon completion of the simulation, analyze the results. This includes analyzing physical quantities such as displacement, stress, strain, etc., and evaluating the validity and credibility of the simulation results. Parameter Study and Optimization: In some cases, researchers may conduct parameter studies or optimizations to assess the impact of different parameters on system behavior or to find the optimal design solution. Documentation Writing and Reporting: Finally, researchers need to write documentation and reports on the simulation results, presenting the modeling and simulation process, result analysis, and conclusions clearly.
3.1. Experimental Set-up
Designing an Abaqus model involves several steps, from creating the geometry to defining material properties, meshing, applying boundary conditions, and setting up the analysis.
3.2. Pre-Processing
- A.
- Geometry modeling
Geometry modeling: This refers to the process of using the geometric modeling tools provided by Abaqus to create complex geometric models, which are typically used for Finite Element Analysis (FEA). During this process, users can utilize Abaqus functionalities to draw, modify, and edit geometric shapes, defining the dimensions, shapes, and geometric features of objects. Therefore, our model adopts millimeters (mm) for length and megapascals (MPa) for strength to ensure consistency and accuracy of model parameters. These geometric models may include parts, assemblies, or other complex structures. The model framework is a three-dimensional solid with extrusion dimensions of 3600mm*500mm*120mm.
- B.
- Definition
Definition of the material parameters: This refers to the process of defining material properties for use in finite element analysis. These material properties describe the mechanical behavior of the materials used in the simulation, such as elastic modulus, Poisson's ratio, density, yield stress, etc. These properties are crucial for the accuracy of the simulation, as they determine the material's response during loading.
- C.
- Layering method
Layering method: This refers to the approach of dividing a structure or material into different layers or levels during model construction and specifying specific material properties or geometric features for each layer. This method is commonly used for simulating composite materials, laminated plates, or other materials or structures with layered configurations. Through the Layering method, users can define different material properties for each layer, such as elastic modulus, Poisson's ratio, density, etc., as well as different geometric features, such as thickness, interfacial layers, etc.
- D.
- Construction of the mesh system
Assembly and meshing: Once the geometric model is constructed, it's assembled to constitute a comprehensive system. Subsequently, the system undergoes meshing to convert the geometric model into finite element meshes for discretization. During the assembly stage, users combine various parts of the model to form a complete structure. This may involve placing different components or parts in their correct positions and ensuring they have appropriate contacts, constraints, and boundary conditions. In complex assemblies, defining contact behaviors between parts, such as friction, separation, etc., may be necessary, along with adding appropriate boundary conditions and constraints to simulate real-world scenarios. Once the model is correctly assembled, the next step is to convert the geometry of the model into a mesh consisting of finite elements.
Material property definition: Material properties for different elements within the system are specified, encompassing attributes like material type, elastic modulus, Poisson's ratio, density, among others. To input properties such as elastic modulus, Poisson's ratio, density, etc., for CFRC, CRC, MC, OSWC, and WTCS into Abaqus.
3.3. Solve the Equation
- A.
- Solver setup
Solver setup: This refers to the process of configuring solver parameters and options. The solver is the numerical method used to solve finite element models, calculating the response of the model based on user-defined boundary conditions, material properties, and loading conditions. In the Solver setup, users need to set various parameters to ensure that the solver can handle the model correctly and produce accurate results.
- B.
- Parallel Computing Setting
Parallel Computing Setting: For large models or cases requiring faster computation, the solver can be configured to utilize parallel computing resources. This includes setting the type of parallel computing, the number of processes, etc. Other Parameter Setting: Depending on the requirements, other parameters such as output options, result file formats, storage options, etc., can also be set.
- C.
- Connectivity Relationship Building
Connectivity Relationship Building: in Abaqus refers to the process of constructing the model by defining the connectivity between nodes and elements. In finite element analysis, the geometric shape of the model is discretized into a series of nodes and elements, and the connectivity between these nodes and elements determines the structure and behavior of the model.
- D.
- Node Definition
Node Definition: Firstly, users need to define the nodes in the model, which represent discrete points in the geometric structure of the model, such as intersections, corners, etc.
- E.
- Element Definition
Element Definition: Next, users define the elements in the model, which are basic building blocks used to approximate the geometric shape and physical behavior of the model. When defining elements, appropriate element types are selected, and the connectivity between nodes for each element is determined.
- F.
- Connectivity
Connectivity: After defining the elements, users need to establish the connectivity between nodes and elements. This involves assigning nodes to the vertices of elements and ensuring correct connectivity between elements to build a complete model.
- G.
- Contact Definition
Contact Definition: In some cases, different parts of the model may come into contact or interact with each other. Therefore, users also need to define contact conditions to describe the contact behavior between these parts and ensure the accuracy and realism of the model. By establishing the correct connectivity relationships, the model accurately describes the geometric shape and physical behavior of the actual system, providing a reliable basis for subsequent finite element analysis.
- H.
- Boundary condition setting
Boundary condition setting: This refers to the process of defining constraints and loading conditions at the boundaries of the model. Boundary conditions are crucial in finite element analysis as they determine the behavior of the model at its boundaries, thus influencing the overall response of the model.
- I.
- Constraints
Constraints: Defining constraints at the boundaries of the model to simulate real-world constraints. This includes fixing boundaries, fixing degrees of freedom, defining constraint relationships, etc. For example, certain nodes' displacements can be set to zero to simulate fixed boundaries.
- J.
- Loads
Loads: Defining loading conditions at the boundaries of the model to simulate external forces, pressures, temperatures, etc. This includes applying forces, pressures, thermal fluxes, etc. For example, pressure or forces can be applied to the surface of the model to simulate external loads. By properly setting boundary conditions, the model can more accurately reflect the behavior of the actual system and produce reliable analysis results.
In Abaqus, users can define and set boundary conditions through the graphical user interface (GUI) or by inputting keywords.
3.4. Repossessing
- A.
- Abaqus analysis results output as images
Abaqus analysis results output as images: This means generating visual representations of the analysis results in the form of images. In finite element analysis, Abaqus can produce various images to visualize the simulation results, typically including deformation, stress, strain, temperature distributions, etc.
- B.
- Deformation plots
Deformation plots: These show the deformation of the model after applying loads or boundary conditions, providing insight into the model's behavior under load.
- C.
- Stress plots
Stress plots: These display the distribution of stresses throughout the model, aiding in the assessment of material capacity and structural safety. Strain plots: These illustrate the distribution of strains across the model, helping understand material deformation and structural stability.
- D.
- Temperature plots
Temperature plots: These demonstrate
the temperature distribution across different locations in the model, essential for thermal conduction analysis and thermal stress analysis.
- E.
- Contour plots
Contour plots: These represent the distribution of various physical quantities, such as temperature, using contour lines. They offer a comprehensive understanding of the model's behavior.
4. Composite Materials Result and Analysis
Figure 5.
Finite element model diagram.
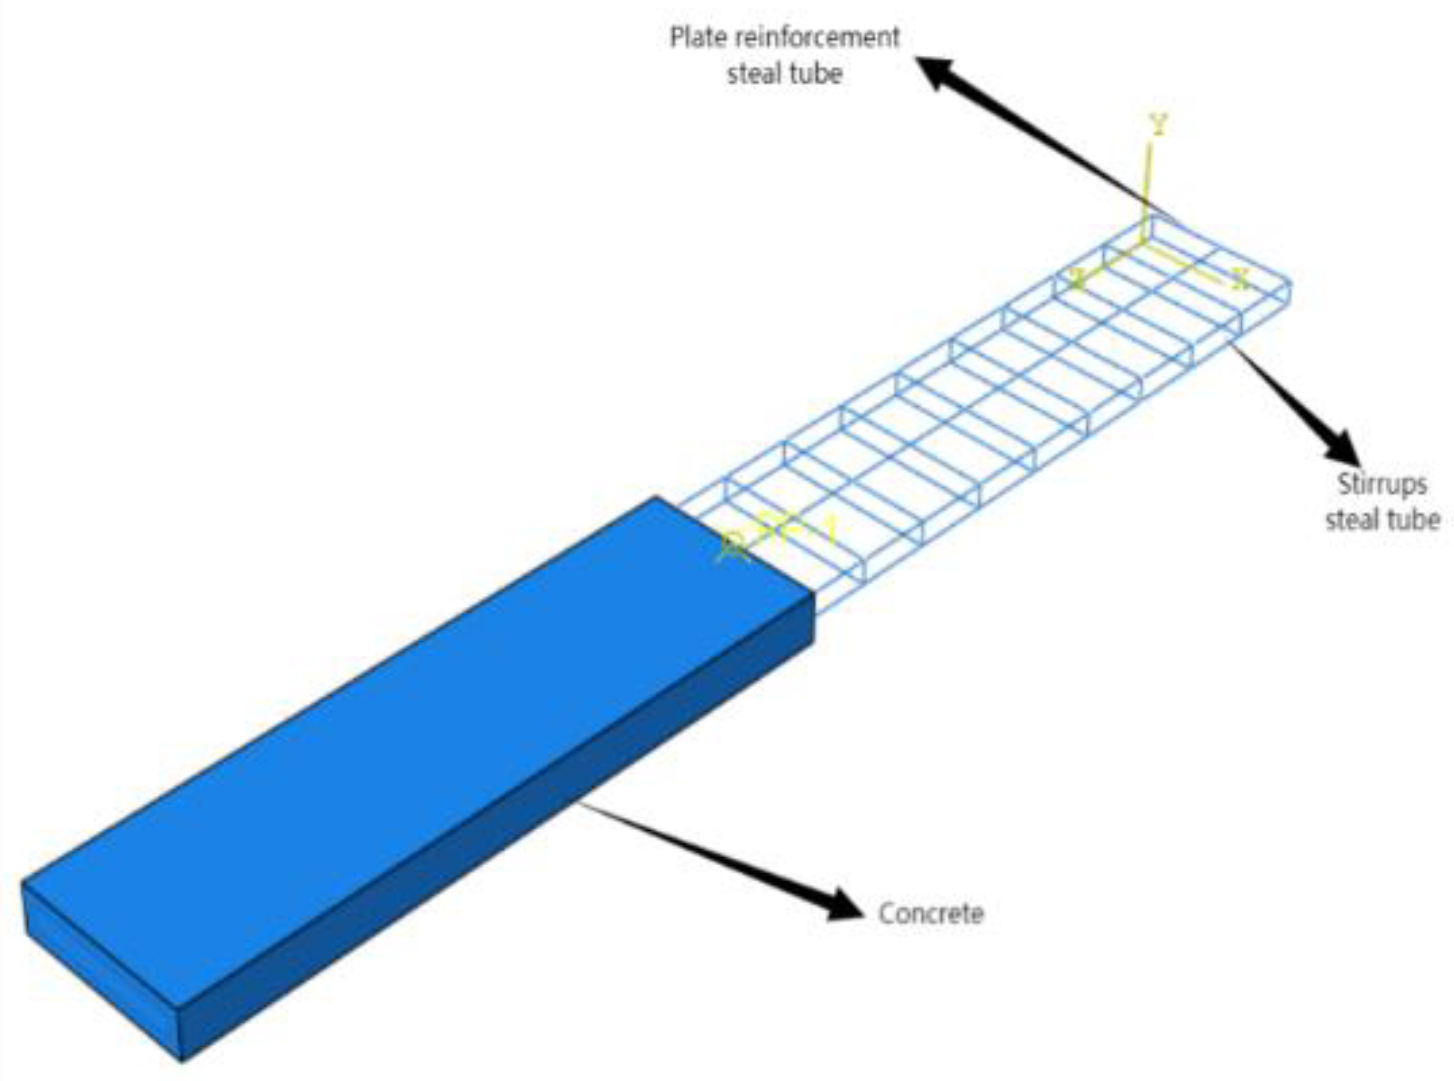
The article uses numerical simulation software ABAQUS to study the axial compression mechanical properties of square steel pipes filled with initial stress and initial defects in reinforced concrete slabs. The established numerical model consists of two parts: steel pipes and concrete. All members are represented as solid elements using 8-node simplified integrated three-dimensional solid elements (C3D8R).Finite element analysis is carried out in two steps. In the first step, the initial stress and material data are applied to the components, and the method of applying initial stress to the steel pipes is adopted. Firstly, the initial stress coefficient is determined, and the simulated steel pipe initial stress field is imported into the axial compression model. Then, the finite element simulation analysis of the bearing capacity under initial stress axial compression conditions is carried out. The modeling of steel pipes and steel cores is provided using the isotropic elastoplastic model provided by ABAQUS finite element software.
The interaction between steel pipes and concrete is simulated using the normal and tangential surface contact method. The tangential behavior is described using the Coulomb friction model with a friction coefficient of 0.The normal behavior is set as hard contact. The steel pipes are embedded in the concrete matrix using the embedding method, and the interactions between the end plates and other components are modeled using straps. Boundary conditions include four-point fixation, and forces or displacements are applied at the top end based on the loading process. The schematic model is shown in Figure 5.
4.1.Model Parameter Selection
Based on the numerical model validated above, a rectangular concrete slab model with embedded steel pipes was established. The mechanical properties under the influence of initial stress were analyzed. The yield strengths of the steel pipes and structural reinforced concrete are 400MPa and 238MPa, respectively. The concrete design strength is CHRB400(HRB400 is a hot-rolled ribbed steel bar, also known as grade 3 steel. Its yield strength standard value is 400MPa, and its tensile strength standard value is 540MPa.) was used, with a vertical reinforcement arrangement of three reinforcing bars above and two below, uniformly distributed. The length of the vertical reinforcement is 3600mm, and the diameter is 12mm. The dimensions of the stirrup reinforcement are 440*60mm, with a diameter of 6mm. Both the vertical reinforcement and stirrup reinforcement are made of HRB400.
The true stress and true strain are obtained from the stress and strain data obtained by modeling through the following formulas. The calculation formulas for true stress and true strain are as follows:
In which, σ is the initial stress of the model, ε is the initial strain of the model, σT is the true stress of the model, and εT is the true strain of the model.
4.2. Load Displacement Curve Analysis
Longitudinal compression damage of concrete slabs: Under compression loads, concrete slabs experience compression along their length. This compression causes bending in the central region of the slab and may lead to cracking or rupture in the central area. Additionally, because the compressive strength of concrete is much higher than its tensile strength, during compression, if the slab experiences uneven pressure, local cracks may develop.
Significant changes in damage patterns: In the low-load stage, concrete slabs may only experience minor deformation and surface cracks. However, as the load increases, there may be greater bending and compression, leading to more severe cracking and structural damage. This change is caused by the nonlinear stress and strain behavior of the material.
Load-displacement curve: This curve displays the displacement behavior of a component under different loads. In the low-load stage, the curve may be relatively flat, indicating that the component can easily withstand this load. However, as the load increases, displacement may increase rapidly, and the curve may exhibit sharp upward or downward trends. This indicates that the stiffness of the component is changing, and it may be approaching or exceeding its load limit.
In the initial loading stage, the bearing capacity of the specimen is mainly maintained by concrete and steel pipes. In the later stage of loading, due to strain softening of concrete, its bearing capacity decreases, and steel pipes become the main load-bearing unit. When the relative displacement in the loading stage is zero, the component has already been affected by the load. When the yield strength is reached, the steel pipe has not yet exerted complete restraint on the concrete. The triaxial stress state in the concrete is weak, which leads to a overall decrease in the bearing capacity of the component. In the later stage of loading, the bending of the steel pipe weakens its circumferential effect on the concrete. At the same time, due to the bending deformation of the component, the loading on the concrete cross section becomes uneven. This leads to a rapid decrease in the cross-sectional bearing capacity of both steel pipes and concrete, resulting in a decrease in ductility performance of the specimen. Buckling failure prevents the component from reaching its ultimate strength stress state, thereby reducing the impact of initial stress in steel pipes on the bearing performance of the component.
Reinforced concrete components under different concrete materials exhibit load-displacement curves as shown in .
In Figure 6, during the initial loading stage, the Poisson's ratio of C35 concrete components is higher than that of CFRC concrete components, leading to smaller lateral deformation in CFRC concrete components compared to C35 concrete components. Therefore, in this stage, the load-displacement curve of CFRC concrete components lies below that of C35 concrete components. However, when the concrete components are reloaded, the Poisson's ratio of CFRC concrete components increases rapidly. The load-displacement curve of CFRC concrete components then lies above that of C35 concrete components and continues to rise. In Figure 7, we can observe the following: In the initial loading stage, the Poisson's ratio of C35 concrete components is higher than that of CRC concrete components.
As a result, the lateral deformation of CRC concrete components is smaller than that of C35 concrete components. Therefore, in this stage, the load-displacement curve of CRC concrete components lies below that of C35 concrete components. In Figure 8, we can observe the following: In the initial loading stage, the Poisson's ratio of C35 concrete components is higher than that of MC concrete components. As a result, the lateral deformation of MC concrete components is smaller than that of C35 concrete components. Therefore, in this stage, the load-displacement curve of MC concrete components lies below that of C35 concrete components. In Figure 9, we can observe the following: In the initial loading stage, the Poisson's ratio of C35 concrete components is higher than that of OSWC concrete components. As a result, the lateral deformation of OSWC concrete components is smaller than that of C35 concrete components. Therefore, in this stage, the load-displacement curve of OSWC concrete components lies below that of C35 concrete components. In Figure 10, we can observe the following: In the initial loading stage, the Poisson's ratio of WTSC concrete components is lower than that of C35 concrete components. As a result, the lateral deformation of WTSC concrete components is smaller than that of C35 concrete components. Therefore, in this stage, the load-displacement curve of WTSC concrete components lies above that of C35 concrete components.
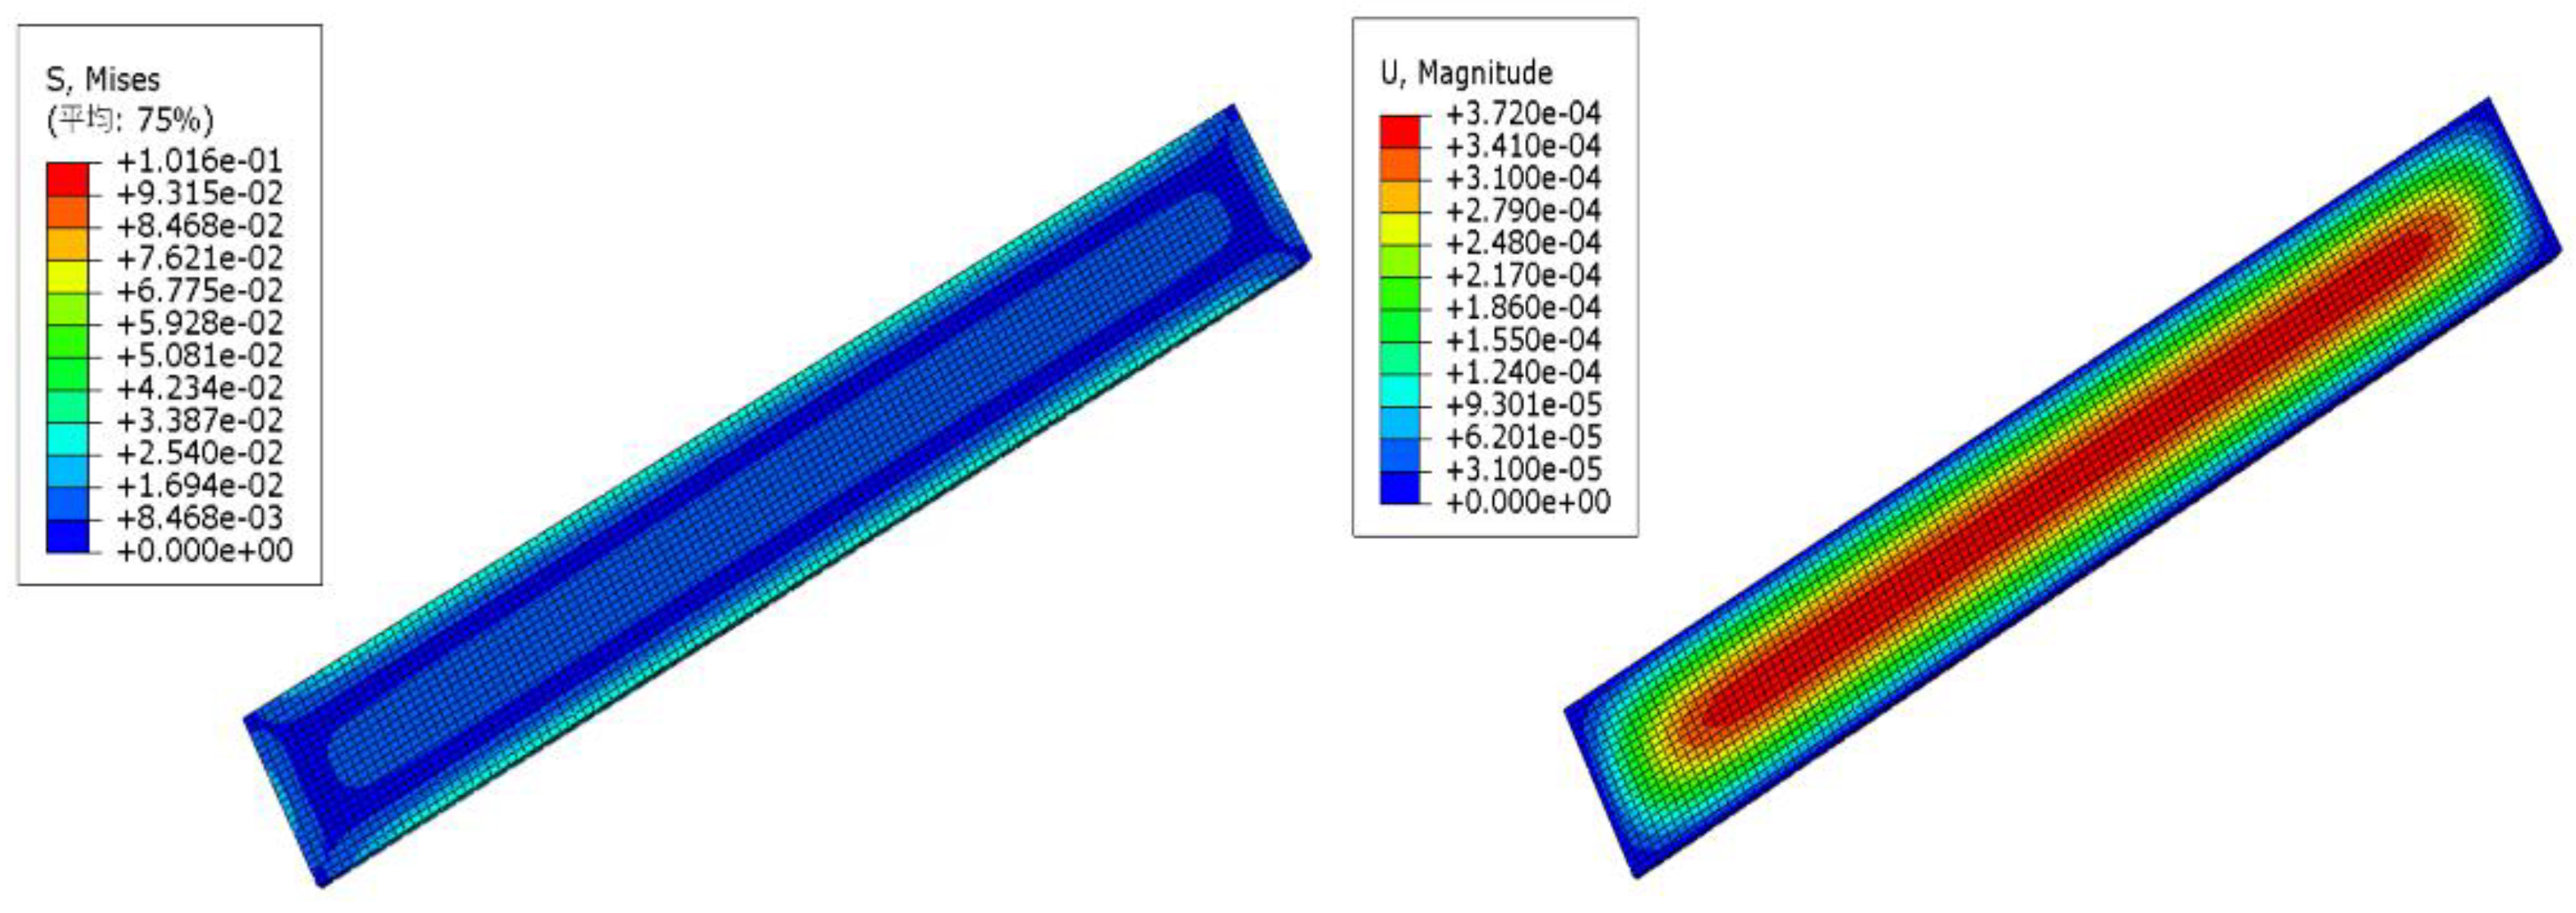
Figure 11, Figure 12, Figure 13, Figure 14 and Figure 15 shows the longitudinal stress profile of concrete under end-loading conditions. Compared to normal loads, it is evident that specimens with an initial stress state exhibit a higher ultimate longitudinal stress in concrete. This is due to the restraining effect of reinforcing steel on the concrete, leading to an increase in the peak strength of concrete near the steel. This observation indicates that when designing concrete structures, considering the initial stress state and the restraining effect of reinforcing steel is crucial for ensuring structural stability and safety. Therefore, engineers and designers need to fully understand and consider these factors to ensure that the designed concrete structures perform well and reliably in actual use.
Based on the provided data, describing the stress magnitudes and distributions for five different structural schemes: Stress Magnitudes: Among the five schemes, the highest stress is observed in Figure 15 (0.1016 MPa), which is the WSTC scheme. The lowest stress is in Figure 12 (0.06044 MPa), which represents the CRC scheme.
Stress Concentration: Across all schemes, the stress concentration areas are similar, generally located at the bending parts of the profile, especially where vertical ribs meet the panel. This indicates that these areas might be the weak points of the structure, suggesting a need for further attention and potential reinforcement.
Stress Distribution: Although the stress concentration areas are consistent, there's a difference in the stress distribution across the schemes: Figures 11, 13, and 14 show more concentrated stress distribution, indicating that certain localized areas may bear higher stress, raising concerns about potential material fatigue or structural damage. Figure 12 and Figure 15 have more even Mises stress distribution, suggesting that these schemes might better distribute stress, potentially indicating a more robust structure.
These analyses could serve as a reference for further structural optimization and design improvements. By comparing the stress magnitudes and distributions across different schemes, it is possible to optimize structural design, reduce stress concentration areas, and ensure safety and reliability.
Based on the provided data, the strain magnitudes, and distributions for five different structural schemes can be described as follows:
Strain Magnitudes:
Strain Distribution:
Across the five schemes, the distribution of equivalent strain is generally quite uniform. This indicates that strain is relatively evenly distributed within the structures, reducing the risk of localized strain concentration. Such uniform distribution suggests higher structural stability, with lower chances of localized deformation or failure.
Overall, despite differences in strain magnitudes across the schemes, the uniform distribution indicates that these structural designs are relatively robust. The data provide a basis for further analysis and structural optimization to ensure stability and reliability, reducing the potential for strain concentration or localized deformation.
4.3. Conclusion and Recommendation
This study demonstrates the feasibility of using industrial waste and natural materials in concrete production to reduce its environmental footprint. Experimental results show that green concrete, made by blending waste and natural materials, can match or exceed the performance of traditional concrete. This approach offers environmental protection, resource conservation, and economic benefits while maintaining structural performance. However, there are limitations regarding the variability in performance based on the type and proportion of waste materials and uncertainties in long-term durability. Further research is needed to explore these aspects and optimize material combinations.
5. Recommendations
5.1. Selection of Waste Materials:
A. Coconut Fiber: Improves impact resistance and reduces maintenance costs.
B. Crumb Rubber: Enhances durability, elasticity, and reduces cement usage.
C. Mining Waste: Promotes sustainable construction by repurposing residues.
D. Oyster Shell Waste: Strengthens concrete and lowers construction costs.
E. Water Treatment Sludge: Replaces traditional aggregates and reduces landfill waste.
5.2. Methodology and Analysis:
A. Use FEA software like ABAQUS for stress-strain analysis.
B. Develop standardized mix designs for consistency.
C. Investigate mechanical properties under various conditions.
5.3. Expected Benefits:
A. Conserves natural resources.
B. Enhances compressive and tensile strength.
C. Aligns with sustainability certifications (LEED, BREEAM).
D. Reduces waste sent to landfills.
5.4. Challenges and Considerations:
A. Need for guidelines on optimal material selection.
B. Focus on long-term durability research.
C. Assess economic viability and cost-effectiveness.
D. Ensure quality control in handling and mixing.
5.5. Environmental and Economic Impact:
A. Lowers CO2 emissions and construction costs.
B. Supports UN Sustainable Development Goals through environmental protection and resource conservation.
Conflicts of Interest
There is no conflict of interest.
References
- Balasubramanian, M. Composite Materials and Processing; CRC Press: Boca Raton, FL, USA, 2013. [Google Scholar]
- Thomas B S, Yang J, Bahurudeen A, et al. A: Geopolymer concrete incorporating recycled aggregates.
- Mikhaylov A, Moiseev N, Aleshin K, et al. Global climate change and greenhouse effect. Entrepreneurship and Sustainability Issues, 2020, 7, 2897.
- Golewski G, L. Green concrete based on quaternary binders with significant reduced of CO2 emissions. Energies, 2021, 14, 4558. [Google Scholar] [CrossRef]
- Qaidi S M A, Dinkha Y Z, Haido J H, et al. Engineering properties of sustainable green concrete incorporating eco-friendly aggregate of crumb rubber: A review. Journal of Cleaner Production, 2021, 324, 129251.
- Habert G, Miller S A, John V M, et al. Environmental impacts and decarbonization strategies in the cement and concrete industries. Nature Reviews Earth & Environment, 2020, 1, 559–573.
- Sarikaya E, Çallioğlu H, Demirel H. Production of epoxy composites reinforced by different natural fibers and their mechanical properties. Composites Part B: Engineering, 2019, 167, 461–466.
- Akeed M H, Qaidi S, Ahmed H U, et al. Ultra-high-performance fiber-reinforced concrete. Part IV: Durability properties, cost assessment, applications, and challenges. Case Studies in Construction Materials, 2022, 17, e01271.
- Marmol G, Ferreira D P, Fangueiro R. Automotive and construction applications of fiber reinforced composites[M]//Fiber Reinforced Composites. Woodhead Publishing, 2021: 785-819. [CrossRef]
- Yang G, Park M, Park S J. Recent progresses of fabrication and characterization of fibers-reinforced composites: A review. Composites communications, 2019, 14, 34–42.
- Sair S, Mandili B, Taqi M, et al. Development of a new eco-friendly composite material based on gypsum reinforced with a mixture of cork fibre and cardboard waste for building thermal insulation. Composites Communications, 2019, 16, 20–24.
- Hamidi F, Aslani F. Additive manufacturing of cementitious composites: Materials, methods, potentials, and challenges. Construction and Building Materials, 2019, 218, 582–609.
- Akeed M H, Qaidi S, Ahmed H U, et al. Ultra-high-performance fiber-reinforced concrete. Part IV: Durability properties, cost assessment, applications, and challenges. Case Studies in Construction Materials, 2022, 17, e01271.
- Zhang J, Chevali V S, Wang H, et al. Current status of carbon fibre and carbon fibre composites recycling. Composites Part B: Engineering, 2020, 193, 108053.
- Thiounn T, Smith R C. Advances and approaches for chemical recycling of plastic waste. Journal of Polymer Science, 2020, 58, 1347–1364.
- Hasan K M F, Al Hasan K M N, Ahmed T, et al. Sustainable bamboo fiber reinforced polymeric composites for structural applications: A mini review of recent advances and future prospects. Case Stud. Chem. Environ. Eng. 2023, 8, 100362. [Google Scholar] [CrossRef]
- Khalid M Y, Al Rashid A, Arif Z U, et al. Natural fiber reinforced composites: Sustainable materials for emerging applications. Results in Engineering, 2021, 11, 100263.
- Jönsson C, Wei R, Biundo A, et al. Biocatalysis in the recycling landscape for synthetic polymers and plastics towards circular textiles. ChemSusChem, 2021, 14, 4028–4040.
- Ali T, Najam-ul-Haq M, Mohyuddin A, et al. Next-generation functional nanotextiles—Prospects and challenges. Sustainable Materials and Technologies, 2023, 36, e00640. [CrossRef]
- Prabhu L, Krishnaraj V, Sathish S, et al. A review on natural fiber reinforced hybrid composites: Chemical treatments, manufacturing methods and potential applications. Materials Today: Proceedings, 2021, 45, 8080–8085.
- Das S C, Paul D, Grammatikos S A, et al. Effect of stacking sequence on the performance of hybrid natural/synthetic fiber reinforced polymer composite laminates. Composite Structures, 2021, 276, 114525.
- Yan P, Chen B, Afgan S, et al. Experimental research on ductility enhancement of ultra-high performance concrete incorporation with basalt fibre, polypropylene fibre and glass fibre. Construction and Building Materials, 2021, 279, 122489.
- Ding T, Xiao J, Zou S, et al. Anisotropic behavior in bending of 3D printed concrete reinforced with fibers. Composite Structures, 2020, 254, 112808.
- Su J, Chen G, Pan H, et al. Rubber modified high strength-high ductility concrete: Effect of rubber replacement ratio and fiber length. Construction and Building Materials, 2023, 404, 133243.
- S. Mater. Sci. Eng. ( 2018. [CrossRef]
- Kazmi S M S, Munir M J, Wu Y F. Application of waste tire rubber and recycled aggregates in concrete products: A new compression casting approach. Resources, Conservation and Recycling, 2021, 167: 105353.
- Senior C, Granite E, Linak W, et al. Chemistry of trace inorganic elements in coal combustion systems: A century of discovery. Energy & Fuels, 2020, 34, 15141–15168.
- Hasim A M, Shahid K A, Ariffin N F, et al. Properties of high volume coal bottom ash in concrete production. Materials Today: Proceedings, 2022, 48, 1861–1867.
- Onyelowe K C, Onyia M E, Bui Van D, et al. Pozzolanic reaction in clayey soils for stabilization purposes: a classical overview of sustainable transport geotechnics. Advances in Materials Science and Engineering, 2021, 2021, 1–7.
- Komlos, J.; Welker, A.; Punzi, V.; Traver, R. Feasibility Study of As-Received and Modified (Dried/Baked) Water Treatment Plant Residuals for Use in Storm-Water Control Measures. J. Environ. Eng. 2013, 139, 1237–1245. [Google Scholar] [CrossRef]
- Baker, R.J. , White, D.J., Leeuwen, J.V., Applications for Reuse of Lime Sludge from Water Softening (IHRB Project TR-535). Department of Civil, Construction and Environmental Engineering, Iowa State University.
- Kashyap, S.; Datta, D. Reusing industrial lime sludge waste as a filler in polymeric composites. Mater. Today: Proc. 2017, 4, 2946–2955. [Google Scholar] [CrossRef]
- Oderji S Y, Chen B, Shakya C, et al. Influence of superplasticizers and retarders on the workability and strength of one-part alkali-activated fly ash/slag binders cured at room temperature. Construction and Building Materials, 2019, 229, 116891.
- Amran M, Debbarma S, Ozbakkaloglu T. Fly ash-based eco-friendly geopolymer concrete: A critical review of the long-term durability properties. Construction and Building Materials, 2021, 270, 121857.
- Ting L, Qiang W, Shiyu Z. Effects of ultra-fine ground granulated blast-furnace slag on initial setting time, fluidity and rheological properties of cement pastes. Powder Technology, 2019, 345, 54–63.
- Dobiszewska M, Bagcal O, Beycioğlu A, et al. Utilization of rock dust as cement replacement in cement composites: An alternative approach to sustainable mortar and concrete productions. J. Build. Eng. 2023, 69, 106180. [Google Scholar] [CrossRef]
- Amran M, Debbarma S, Ozbakkaloglu T. Fly ash-based eco-friendly geopolymer concrete: A critical review of the long-term durability properties. Construction and Building Materials, 2021, 270, 121857.
- Wang J, Xu H, Xu D, et al. Accelerated carbonation of hardened cement pastes: Influence of porosity. Construction and Building Materials, 2019, 225, 159–169.
- Golewski G, L. The phenomenon of cracking in cement concretes and reinforced concrete structures: the mechanism of cracks formation, causes of their initiation, types and places of occurrence, and methods of detection—a review. Buildings, 2023, 13, 765. [Google Scholar] [CrossRef]
- Rezende M A M, Gromboni P P, Corradini P G, et al. Evaluation of Reinforcement Corrosion in Cementitious Composites Modified with Water Treatment Sludge. Journal of the Brazilian Chemical Society, 2023, 34, 1100–1108.
- Almeida J, Ribeiro A B, Silva A S, et al. Overview of mining residues incorporation in construction materials and barriers for full-scale application. Journal of Building Engineering, 2020, 29, 101215.
- Abiodun, J, Kilani., Ademilade, Olubambi̇., B., D., Ikotun., Oluwatobi, Adeleke., Oluwaseun, A., Adetayo. (2022). Structural Performance of Concrete Reinforced with Banana and Orange Peel Fibers -A Review. Journal of sustainable construction materials and technologies. [CrossRef]
- Wang X, Fan F, Lai J, et al. Steel fiber reinforced concrete: A review of its material properties and usage in tunnel lining[C]//Structures. Elsevier, 2021, 34, 1080–1098.
- Bayraktar O Y, Eshtewı S S T, Benli A, et al. The impact of RCA and fly ash on the mechanical and durability properties of polypropylene fibre-reinforced concrete exposed to freeze-thaw cycles and MgSO4 with ANN modeling. Construction and Building Materials, 2021, 313, 125508.
- Palanisamy M, Kolandasamy P, Awoyera P, et al. Permeability properties of lightweight self-consolidating concrete made with coconut shell aggregate. Journal of Materials research and Technology, 2020, 9, 3547–3557.
- Akhtar M E, Elavenil S. Experimental study on coir blended concrete strengthened with fly-ash and granite powder. 2006. [CrossRef]
- Monita, Olivia., Annisa, Arifandita, Mifshella., Lita, Darmayanti. (2015). Mechanical Properties of Seashell Concrete. Procedia Engineering. [CrossRef]
- Varhen C, Carrillo S, Ruiz G. Experimental investigation of Peruvian scallop used as fine aggregate in concrete. Construction and Building Materials, 2017, 136, 533–540.
- Bamigboye G O, Okara O, Bassey D E, et al. The use of Senilia senilis seashells as a substitute for coarse aggregate in eco-friendly concrete. Journal of Building Engineering, 2020, 32, 101811.
- Shu H, Zhang P, Chang C C, et al. Agricultural waste. Water Environment Research, 2015, 87, 1256–1285.
Figure 6.
C35-CFRC load-displacement curve .
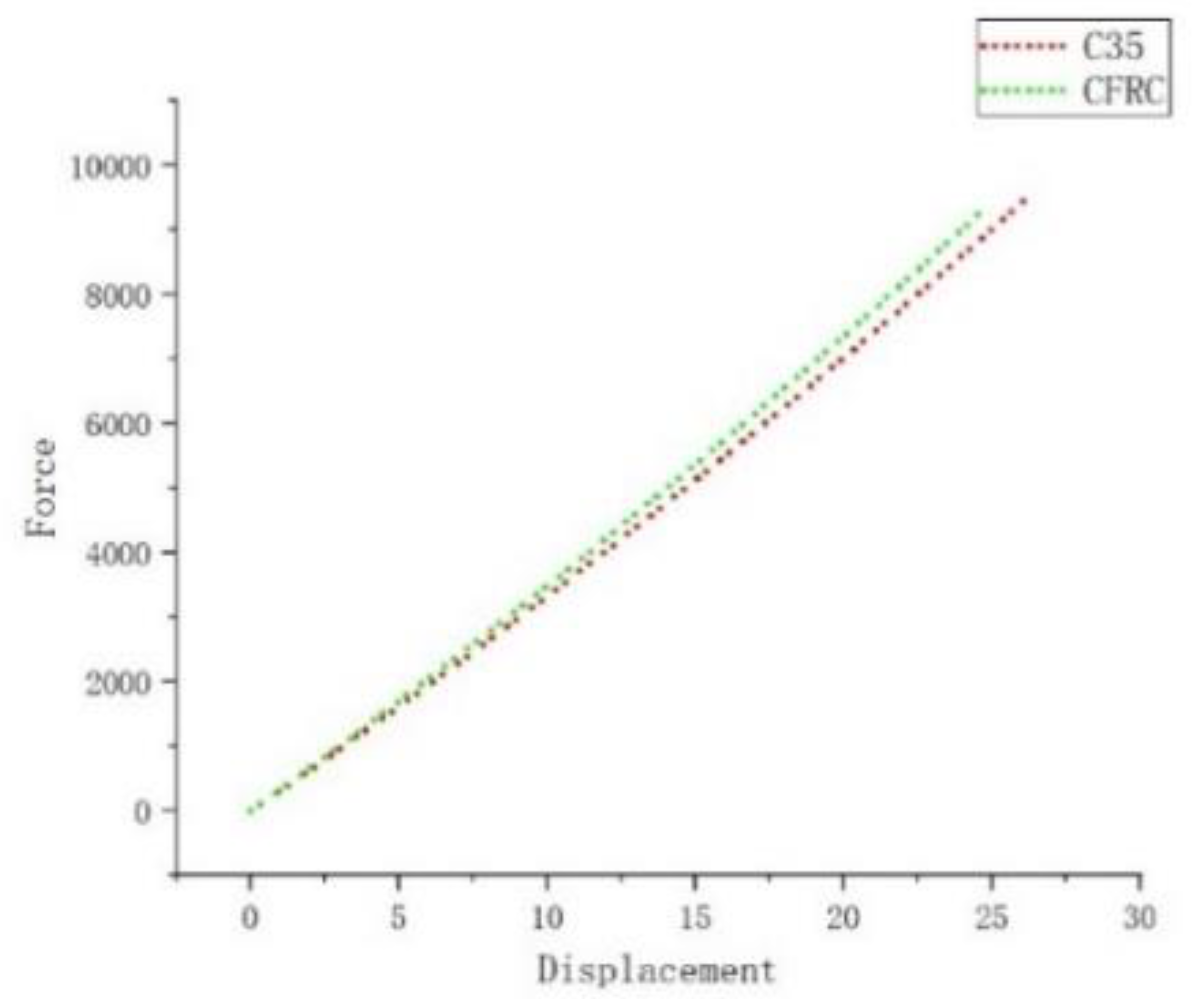
Figure 7.
C35-CRC load-displacement curve.
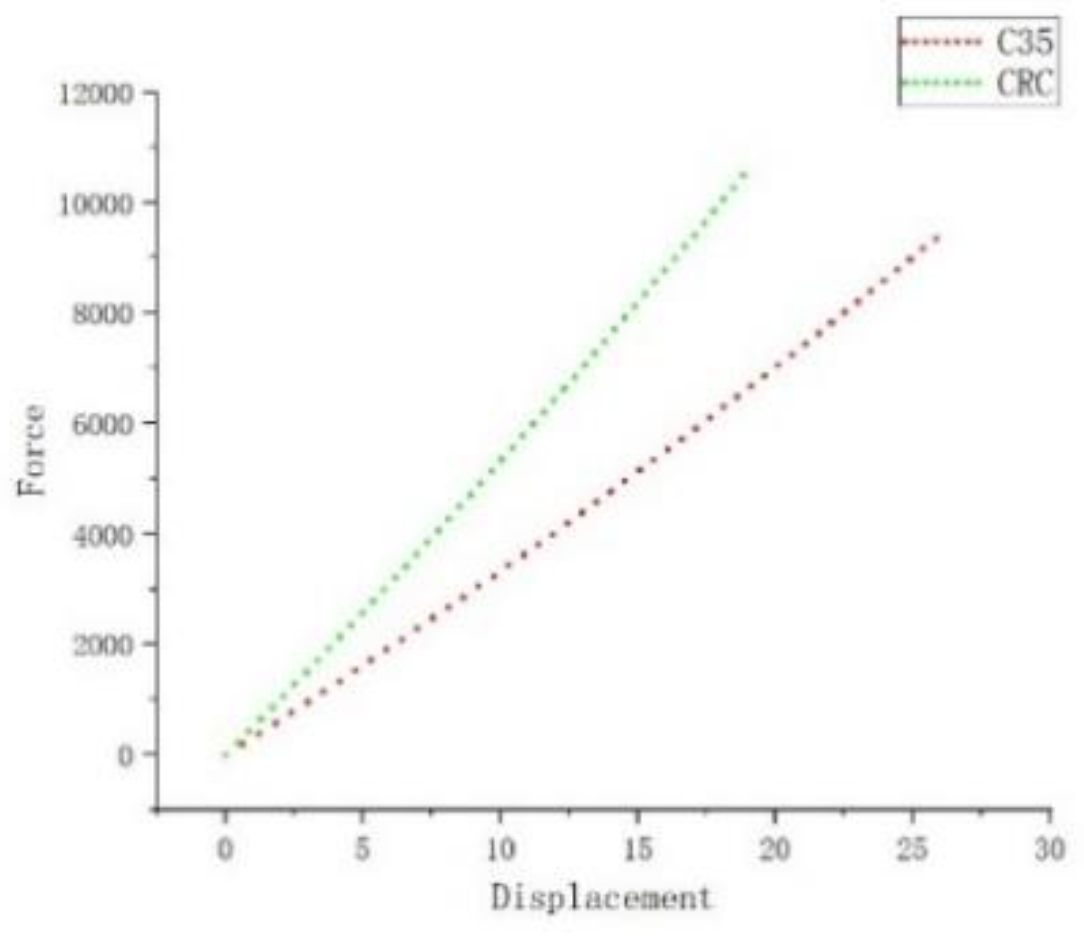
Figure 8.
C35-MC load-displacement curve .
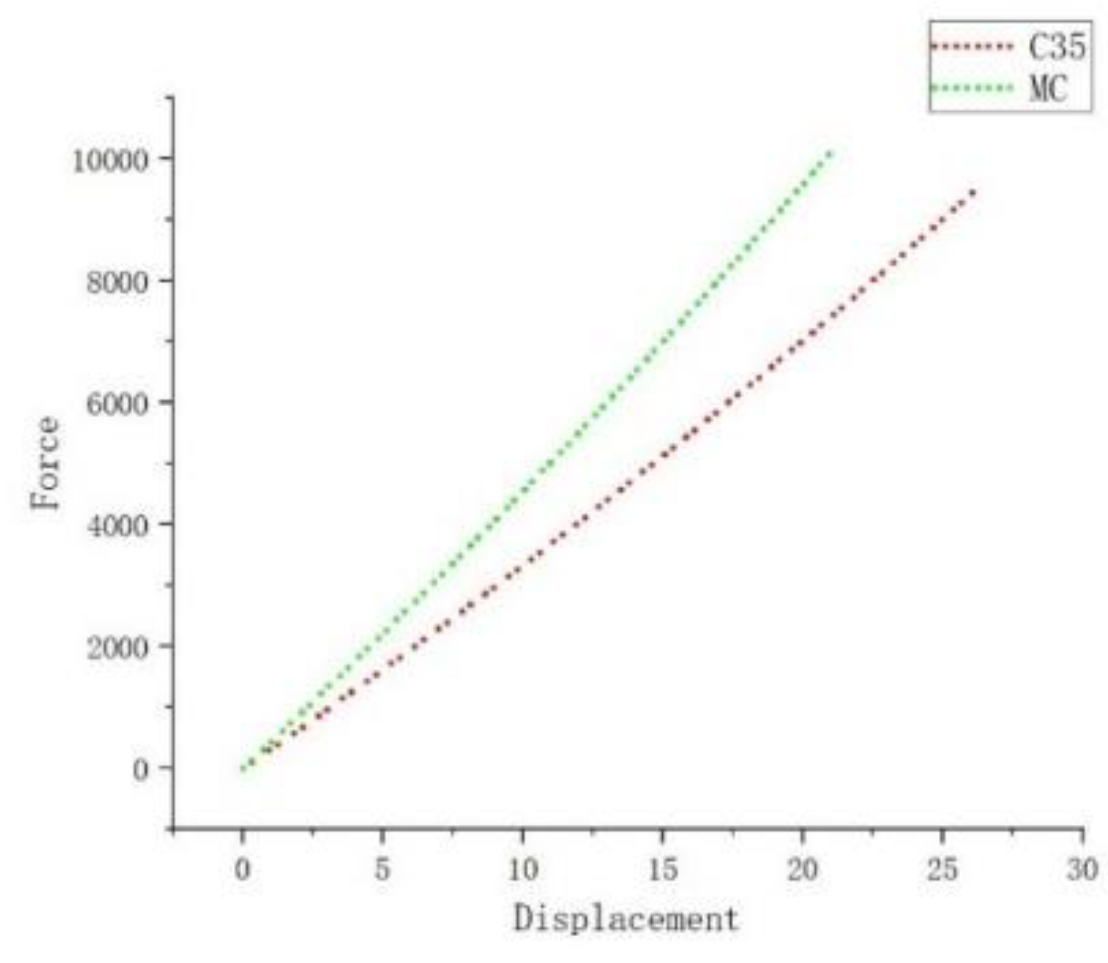
Figure 9.
C35-OSWC load-displacement curve.
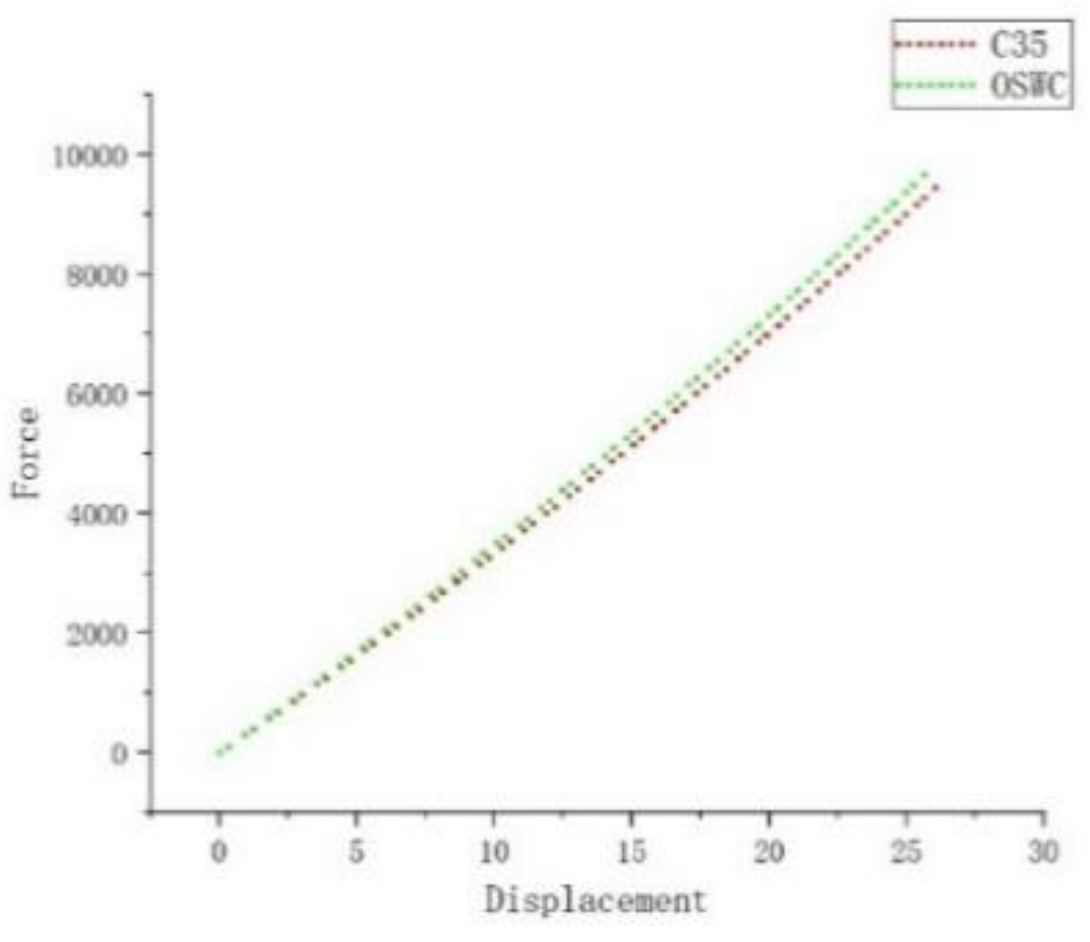
Figure 10.
C35-WSTC load-displacement curve.
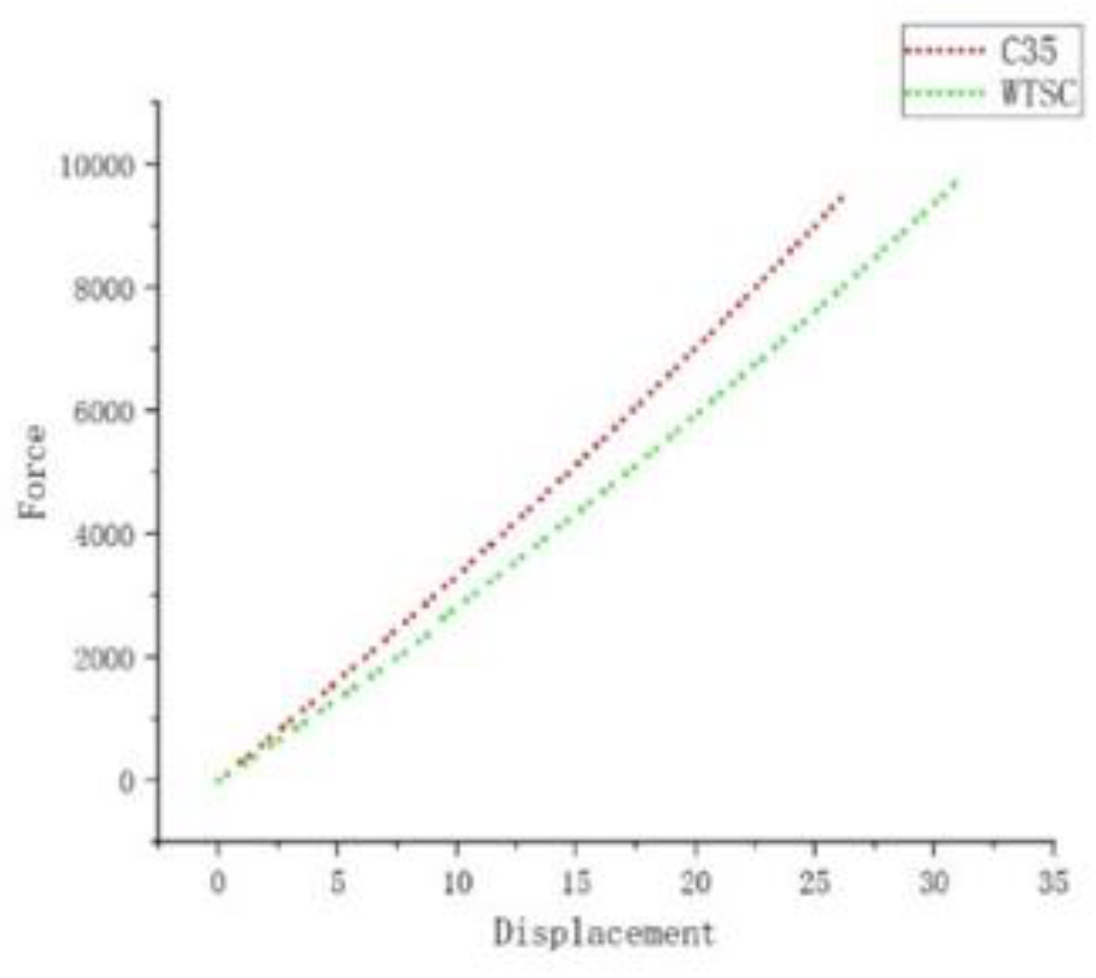
Figure 11.
Concrete contact pressure profile diagram and Longitudinal stress profile diagram of concrete about the CFRC.
Figure 11.
Concrete contact pressure profile diagram and Longitudinal stress profile diagram of concrete about the CFRC.
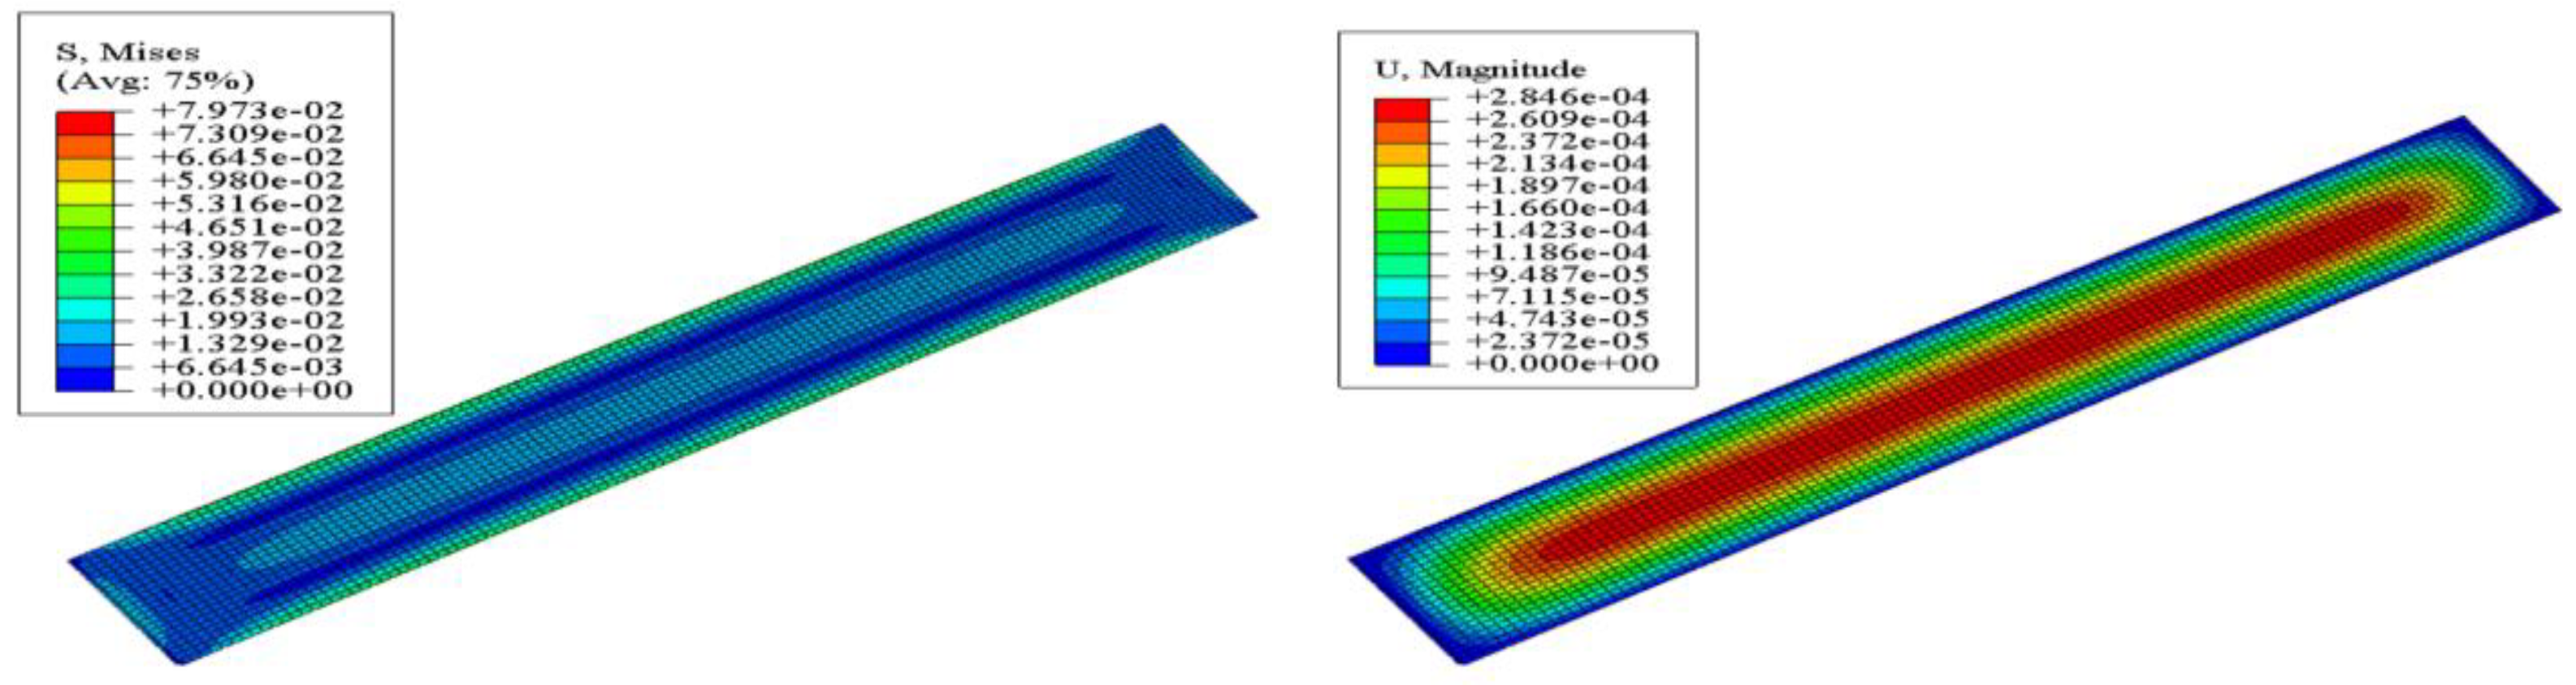
Figure 12.
Concrete contact pressure profile diagram and Longitudinal stress profile diagram of concrete about the CRC.
Figure 12.
Concrete contact pressure profile diagram and Longitudinal stress profile diagram of concrete about the CRC.
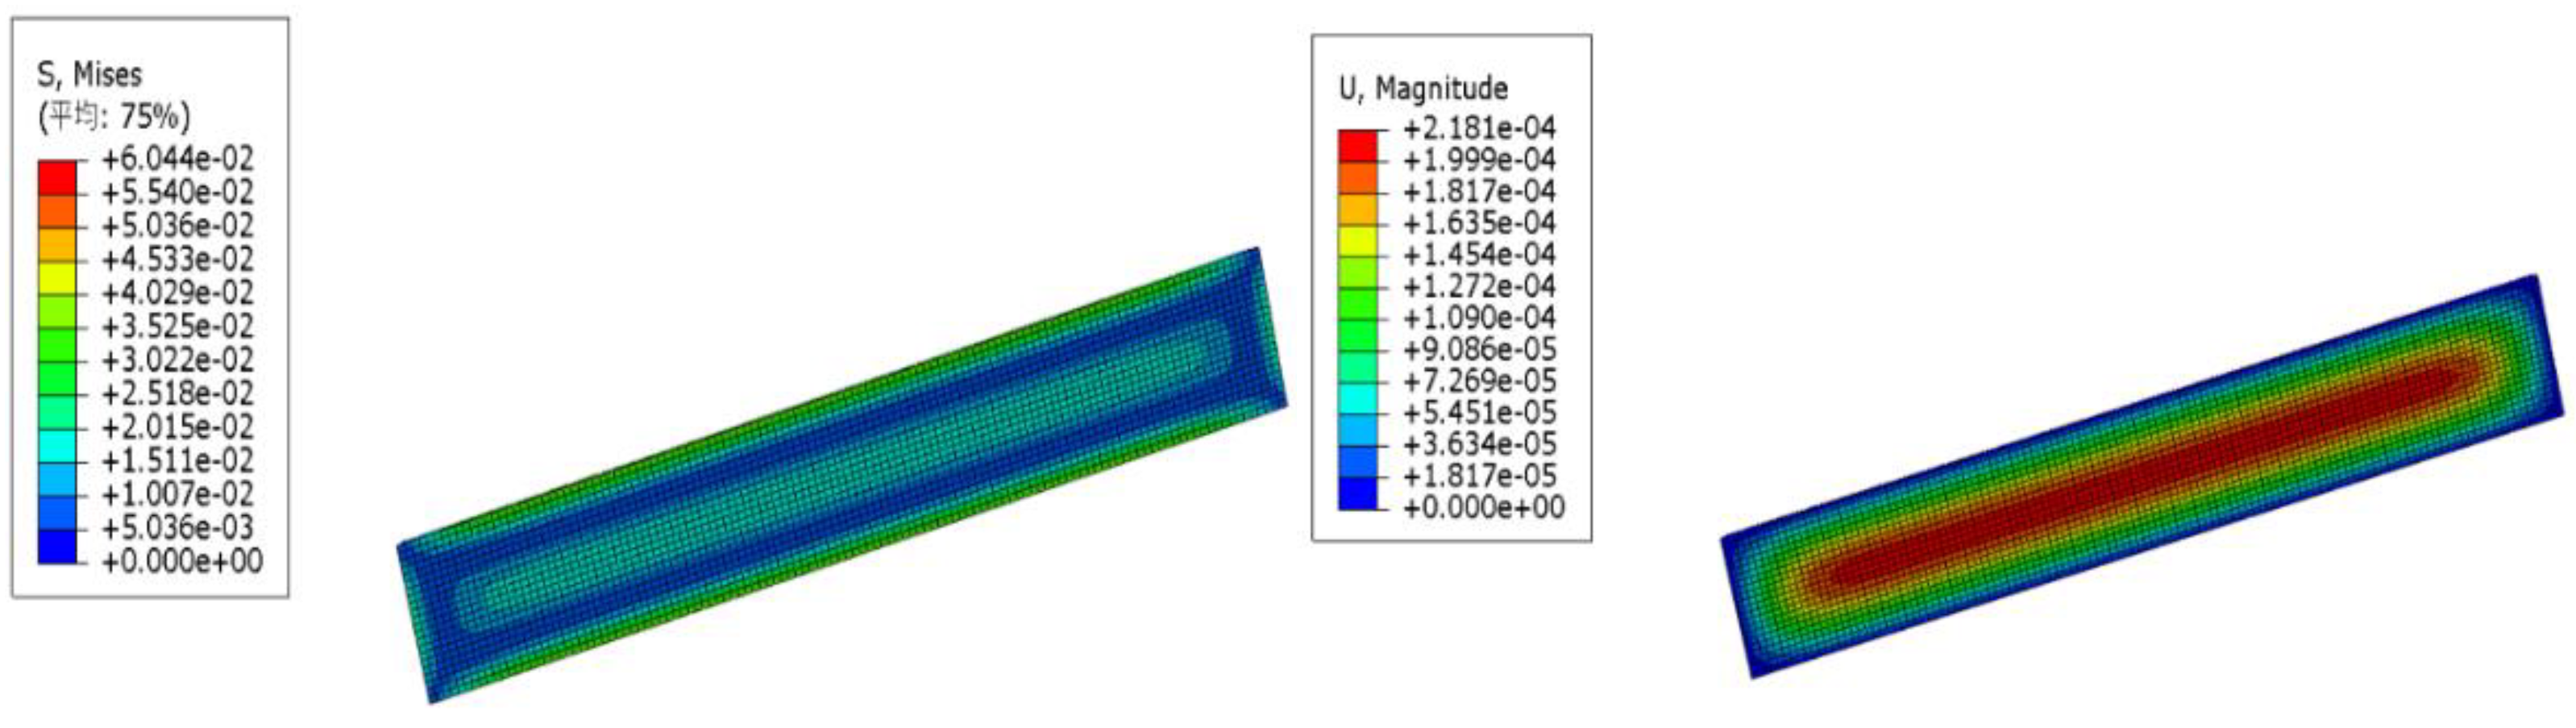
Figure 13.
Concrete contact pressure profile diagram and Longitudinal stress profile diagram of concrete about the MC.
Figure 13.
Concrete contact pressure profile diagram and Longitudinal stress profile diagram of concrete about the MC.
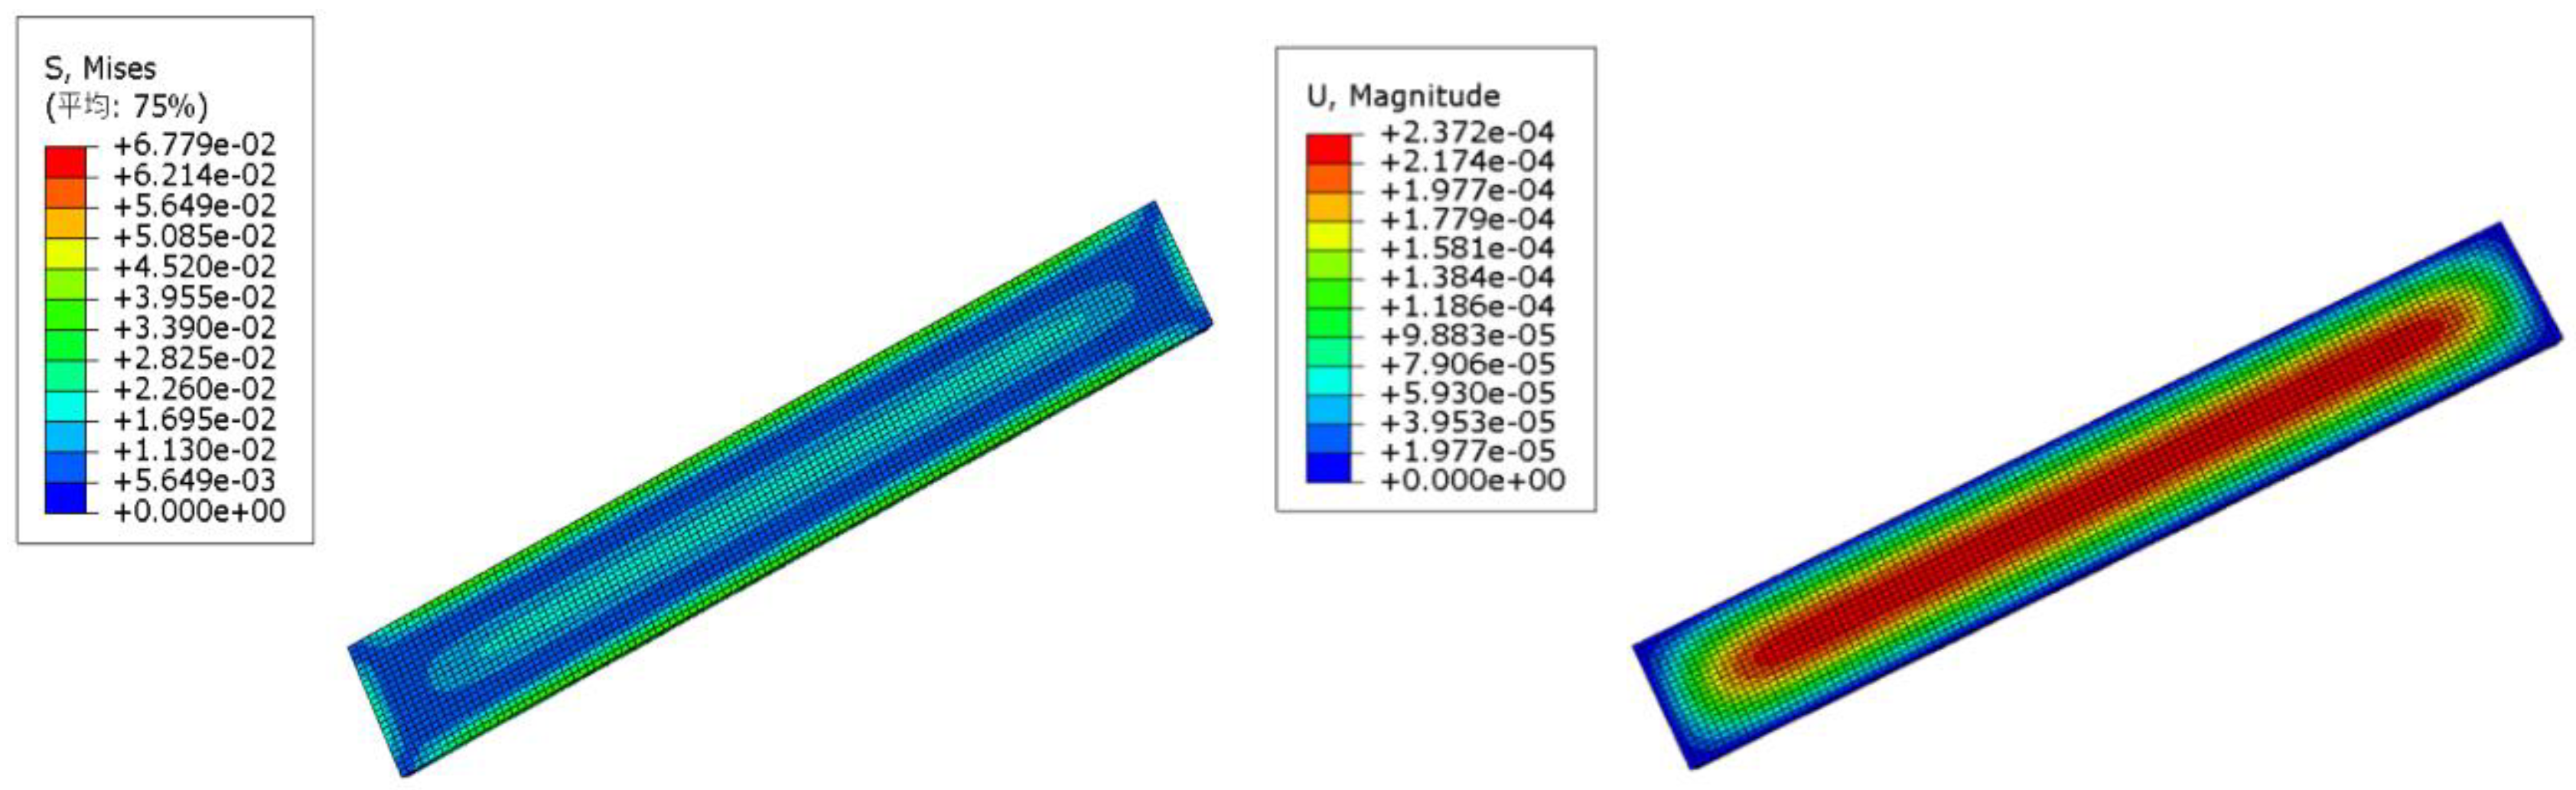
Figure 14.
Concrete contact pressure profile diagram and Longitudinal stress profile diagram of concrete about the OSWC.
Figure 14.
Concrete contact pressure profile diagram and Longitudinal stress profile diagram of concrete about the OSWC.
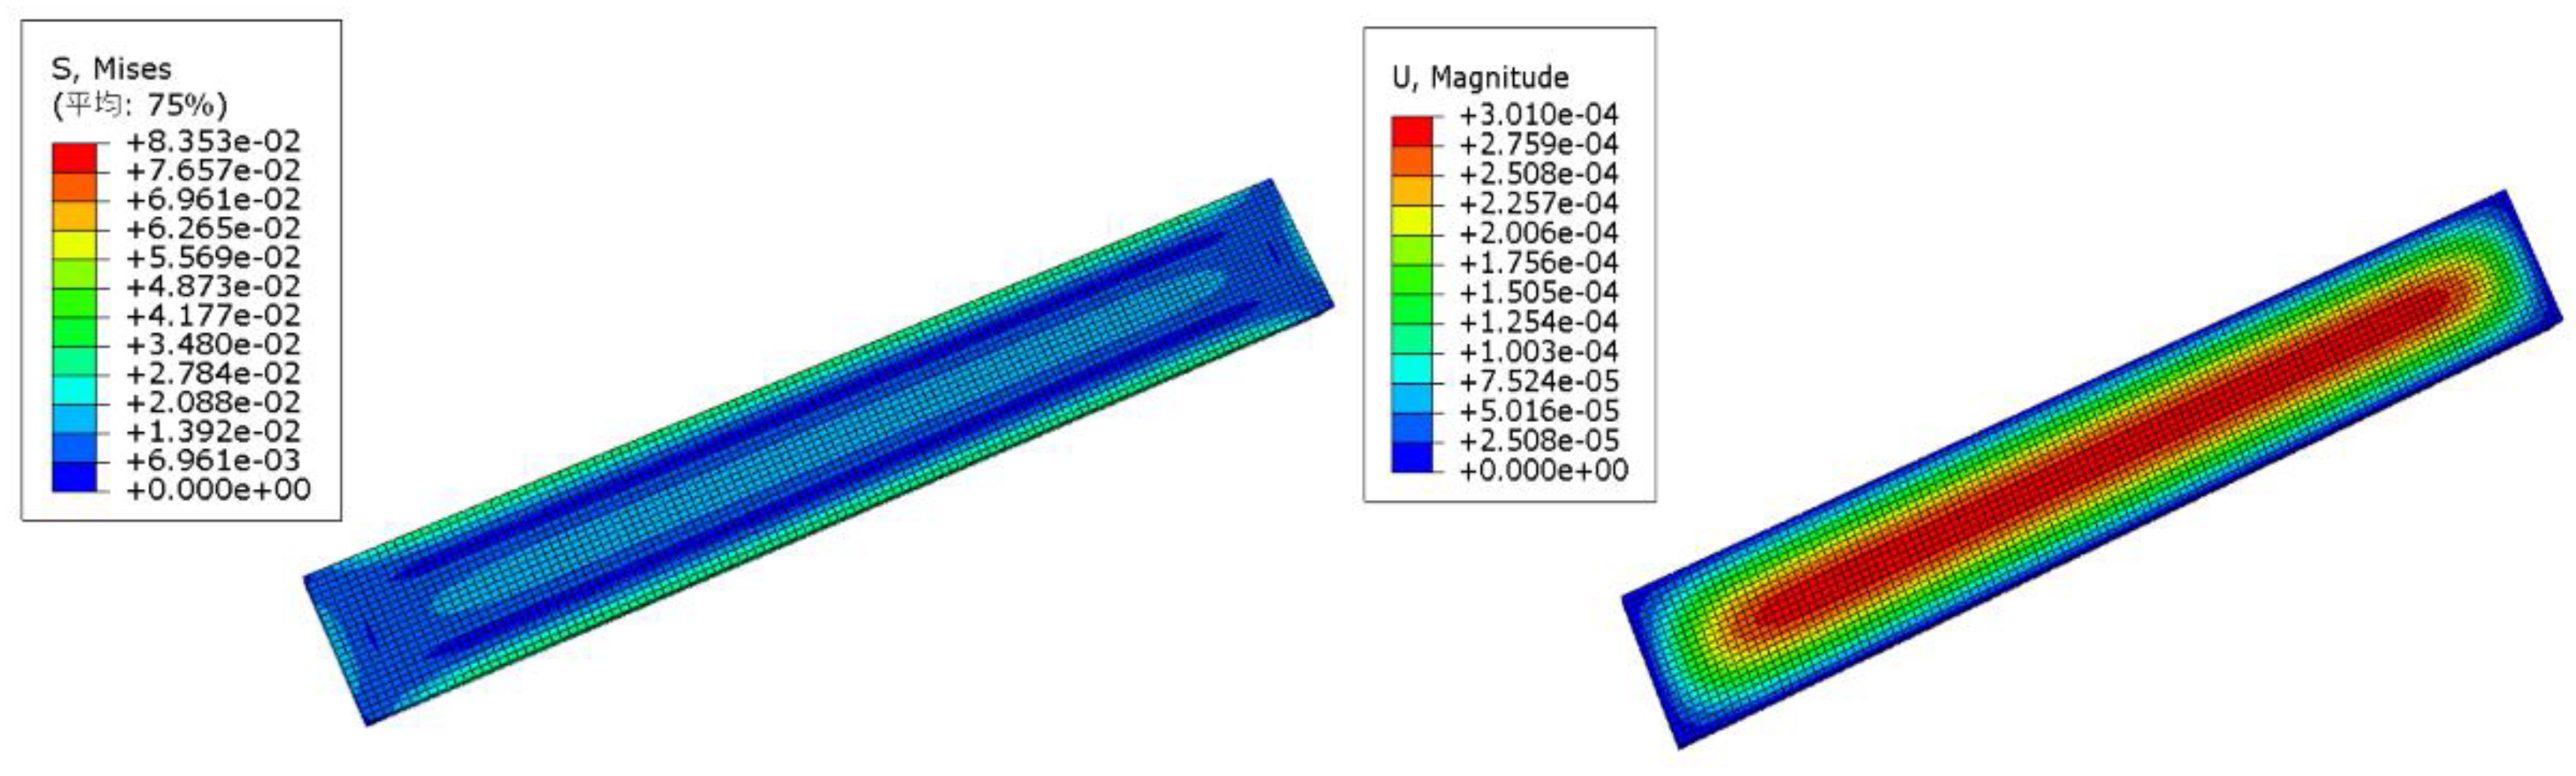
Figure 15.
Concrete contact pressure profile diagram and Longitudinal stress profile diagram of concrete about the WTSC.
Figure 15.
Concrete contact pressure profile diagram and Longitudinal stress profile diagram of concrete about the WTSC.
Disclaimer/Publisher’s Note: The statements, opinions and data contained in all publications are solely those of the individual author(s) and contributor(s) and not of MDPI and/or the editor(s). MDPI and/or the editor(s) disclaim responsibility for any injury to people or property resulting from any ideas, methods, instructions or products referred to in the content. |
© 2024 by the authors. Licensee MDPI, Basel, Switzerland. This article is an open access article distributed under the terms and conditions of the Creative Commons Attribution (CC BY) license (https://creativecommons.org/licenses/by/4.0/).
Copyright: This open access article is published under a Creative Commons CC BY 4.0 license, which permit the free download, distribution, and reuse, provided that the author and preprint are cited in any reuse.


