

Submitted:
25 June 2024
Posted:
26 June 2024
You are already at the latest version
Abstract
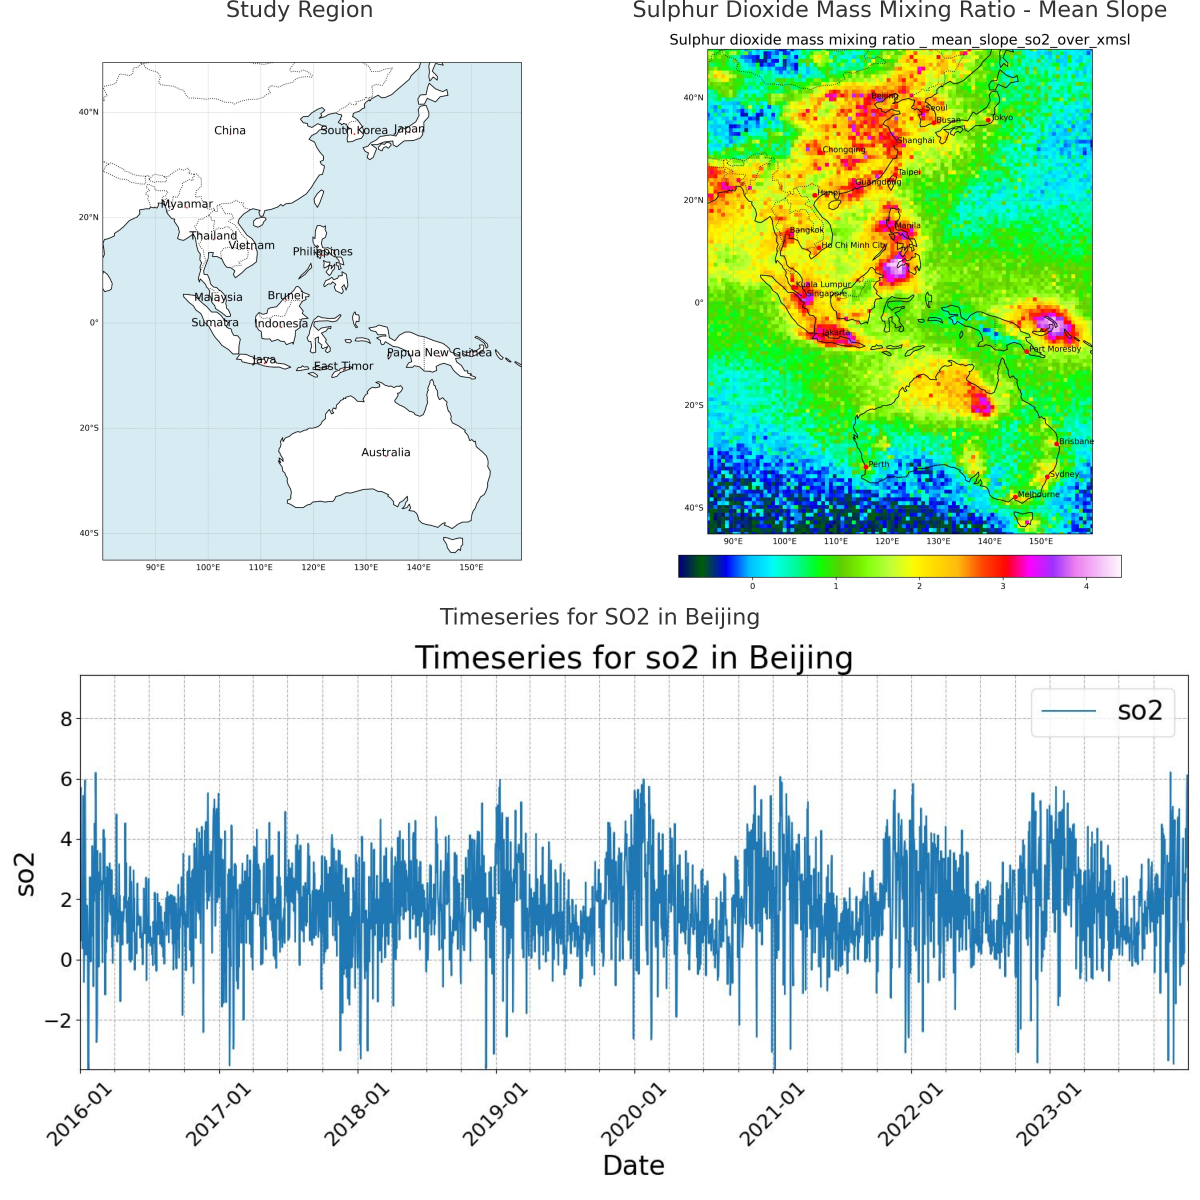
This study evaluated ground-level concentrations (GLCs) of aerosols and criteria pollutants using the Copernicus Atmosphere Monitoring Service (CAMS) reanalysis dataset over the Himawari-8 observational land area, including China, Indonesia, and Australia, for the past eight years. A square root transformation of the data was used to normalize and mitigate skewness. Monthly-hourly long-term averages were subtracted to determine abnormalities and identify significant pollution events. Geographic Weighted Regression (GWR) and the Jacobian matrix (dY/dX) methods were used to determine the spatial variability in pollutant concentrations and correlations with meteorological factors. The findings revealed complex interactions between atmospheric dynamics, such as wind components, specific humidity, and pollutant distribution. The analysis highlighted the limitations of traditional point monitoring methods and the need for incident-based spatiotemporal approaches to understand pollution dynamics. This comprehensive evaluation, covering roughly 10% of the globe, demonstrated CAMS's effectiveness in providing detailed insights into air quality trends, which can support targeted public health interventions and compliance with sustainability goals. Integrating CAMS data with high-resolution satellite data like Himawari-8 could revolutionize air quality monitoring by delivering dynamic, near real-time outputs with high spatiotemporal resolution.
Keywords:
CAMS Reanalysis
; Ground-Level Concentrations (GLCs)
; Geographic Weighted Regression (GWR)
; Jacobian Matrix
; Data Normalization
; Spatiotemporal Analysis
; Aerosol
1. Introduction
Ground-level concentrations (GLC) of air pollutants are critical for human health [1], yet accurate monitoring remains challenging due to sparse surface measurements and modelling uncertainties [2]. Air pollution is a significant global issue, impacting public health, climate change, and economies worldwide. Effective monitoring and management of GLCs are essential for mitigating these impacts. This study evaluates the Copernicus Atmosphere Monitoring Service (CAMS) reanalysis dataset [3] over an eight-year period for the Himawari-8 Observational Area [4], which includes China, Indonesia, and Australia. This region faces significant pollution from both natural and anthropogenic sources [1,5], making accurate GLC monitoring essential for public health and policy-making. Current methods for GLC monitoring, including surface measurements [6] and traditional modelling [7,8], often carry significant uncertainties. The CAMS reanalysis dataset, as a merger of multiple datasets, provides a comprehensive resource for determining pollution dynamics in regions where traditional methods are insufficient [9].
This study aims to assess the accuracy and resolution of CAMS in capturing annual, seasonal, and episodic pollution trends. A recent review has advocated for more use of satellite remote sensing for monitoring air pollution and sustainable development goals [10]. It is hypothesized that CAMS, through its integration of satellite data, ground-based observations, and advanced modeling, can provide a reliable framework for air quality monitoring. The aim is to evaluate the validity and precision of CAMS modeled estimates. Geographic Weighted Regression (GWR) and the Jacobian matrix (dY/dX) methods have been used to determine the accuracy of pollutant concentration determinations as a function of aerosol speciation and Himawari infrared geostationary satellite data [11].
The methodology focused on normalizing data using a square root transformation to mitigate skewness and subtracting the monthly-hourly long-term average to determine abnormalities and identify significant pollution events. GWR and the Jacobian matrix (dY/dX) methods were employed to determine the spatial variability in pollutant concentrations and their correlations with meteorological factors. Key results include statistical summaries, compositional analyses, vertical profile analysis of GLC-AOD ratios, and identification of significant pollution events and trends.
1.1. Context and Importance of Air Pollution Monitoring and Modelling
Effective air quality monitoring and modeling are essential for protecting public health and formulating environmental policies. Ground-level concentrations (GLCs) of air pollutants, such as particulate matter (PM1, PM2.5, and PM10) and gases (ozone, nitrogen oxides, and sulfur dioxide), directly impact human health, especially in urban areas where pollution levels are higher [1]. Traditional ground-based monitoring systems cover limited areas, lack real-time data reporting, and can miss episodic pollution events like wildfires or industrial emissions [2]. These systems also face logistical and financial challenges in maintaining widespread sensor networks, particularly in remote or underdeveloped regions [12].
The Copernicus Atmosphere Monitoring Service (CAMS) reanalysis dataset integrates satellite remote sensing, ground-based measurements, and atmospheric modelling to create a detailed and consistent global dataset [9]. CAMS provides comprehensive air quality information, tracking air quality across local and regional scales and assessing the effectiveness of environmental policies. CAMS monitors air quality trends, detects transient pollution spikes, and provides data essential for timely public health responses [3].
The Himawari-8 satellite, operational from mid-2015, provides ten-minute near-real-time monitoring of the observational area at a 2 km resolution (at Nadir) [4]. This capability offers instantaneous updates on events like wildfires, dust storms, and volcanic eruptions, providing unparalleled temporal resolution. This region faces significant pollution from both natural and anthropogenic sources, making accurate GLC monitoring essential for public health and policy-making [5].
The study period spans eight years, from 2016 to 2023, capturing significant global events like the 2019/2020 Australian bushfires and the COVID-19 pandemic. These occurrences provide scenarios to observe natural and anthropogenic impacts on air quality, essential for evaluating CAMS efficacy in varied environmental conditions. By addressing challenges of sparse surface measurements and modelling uncertainties, this study aims to enhance understanding of air quality dynamics and support targeted public health interventions and robust environmental policies [7].
1.2. Challenges in Modern Air Quality Monitoring and Determining GLCs
Modern air quality monitoring systems struggle to provide comprehensive, real-time data. Traditional monitoring relies on fixed ground stations, which are limited in coverage and often located in urban areas, leaving data gaps in rural regions. This leads to underreporting of air quality issues and delayed responses to pollution episodes.
Fixed monitoring stations focus on common pollutants like sulfur dioxide, nitrogen oxides, and particulate matter, while overlooking harmful substances like volatile organic compounds and ultrafine particles. These pollutants can impact health, and their omission creates gaps in public health data. Traditional methods also struggle to adapt to rapid changes in air quality due to weather, traffic, and industrial activities. Continuous, real-time monitoring is challenging due to the high costs of expanding and maintaining a dense network of monitoring stations.
Air pollution modelling has evolved with advanced methods like Land Use Regression (LUR) [13], which uses homogeneous assumptions Y = f(X), and Geographically Weighted Regression (GWR), which operates on a per-point basis Yi = fi(Xi) where fi is a function of the temporal correlation of Yi with Xi [14]. These methods predict pollution levels but often focus on long-term averages [15], overlooking short-term incidents crucial for public health. They fail to incorporate dynamic variables like atmospheric pressure changes that drive wind patterns and turbulence—key in pollutant dispersion. Regressors like terrain height [16], wind direction (through north) [17], or categorical data [18] can misrepresent pollution drivers due to their static nature. These models may also ignore source-receptor contributions, assuming homogeneous concentration [19] proportional to wind speed and ignoring emission strength [20].
Recent critiques highlight that both LUR and GWR can suffer when foundational atmospheric dynamics are overlooked. This study integrates meteorological data with pollutant concentration metrics, focusing on environmental factors' influence on pollution events. By exploring the application of the Jacobian matrix, which evaluates the sensitivity of model outputs to various input parameters [21,22], the aim is to refine pollution models' predictive capabilities. This approach helps identify significant factors affecting air quality, thereby enhancing the accuracy and reliability of models.
Traditional methods for estimating GLCs of pollutants face challenges. Dispersion models rely on input data that can be inaccurate due to changes in weather, traffic, and industrial activity. Remote sensing techniques, particularly those using satellite data, offer broader coverage but struggle to accurately assess ground-level pollutants due to their columnar nature. Aerosol Optical Depth (AOD) measurements from remote sensing estimate particulate matter concentrations but face difficulties due to variability in aerosol types and sizes, atmospheric conditions, and cloud cover uncertainties [23]. AOD data requires complex algorithms to infer ground-level concentrations, often leading to uncertainties.
1.3. CAMS Reanalysis: Rationale and Limitations
The Copernicus Atmosphere Monitoring Service (CAMS) reanalysis integrates satellite and ground-based observational data with numerical models, creating a consistent atmospheric dataset. CAMS uses 4D-Var data assimilation to enhance model accuracy [3]. Studies have used ERA5 reanalysis data to predict tropical cyclones with high accuracy, demonstrating reanalysis data's utility in severe weather forecasting [24]. CAMS provides meteorological variables such as wind components, temperature, Mean Sea Level Pressure, and relative humidity. Studies have confirmed CAMS data's reliability for environmental AI and stochastic modelling [25].
CAMS offers atmospheric composition data crucial for air quality and climate studies, including gases like Carbon Monoxide, Isoprene, Formaldehyde, Nitrogen Dioxide, Nitrogen Monoxide, Ozone, Sulphur Dioxide, and aerosols such as Dust, Sea Salt, Hydrophilic and Hydrophobic Black Carbon, and Organic Matter [3].
Meteorological data in CAMS is more reliable for model validation compared to atmospheric chemistry data due to its easier measurability, greater number of measurement sites, and global data assimilation. This supports methodology testing and predictive capability enhancement [26,27].
CAMS uses advanced data assimilation techniques, integrating satellite observations with ground data, improving pollution estimates. CAMS leverages machine learning models for higher precision in predicting GLCs, processing large datasets efficiently and adapting to environmental changes. These innovations make CAMS a powerful tool for air quality monitoring, addressing traditional methods' limitations.
1.4. Specific Problems in Environmental Modelling
This section addresses methodological challenges and solutions for accurate environmental modelling and analysis, focusing on data normalization, advanced regression techniques, and evaluating large spatiotemporal datasets.
Normalizing atmospheric concentration data is crucial for modeling pollutant dispersion across diverse geographical scales. Emission sources and environmental conditions vary widely, necessitating standardization to manage the exponential decay in pollutant dispersal, as described by Gaussian dispersion models. Normalization mitigates biases and enhances the comparability of datasets from different sources and times. Without normalization, variations in data scales can obscure actual environmental patterns and trends. Employing normalization ensures conclusions reflect actual atmospheric behaviors rather than data variability [28].
Gaussian dispersion models describe the spread of pollutants in the atmosphere as a bell-shaped curve, proportional to the exponential of the square of the distance from the source [29,30,31]. The square root transformation addresses the skewed distribution of concentrations typically observed downwind from emission sources. Unlike logarithmic transformations, which can create errors by attempting to process log (0), the square root transformation maintains zero values—sqrt (0) remains zero. This adjustment scales dispersion to a more linear scale, reducing the range and impact of extreme values and simplifying computational analysis. This method maintains accuracy in datasets with zero values, avoiding distortions in environmental data analysis.
Large spatiotemporal datasets generated by CAMS require accurate validation. Metrics like Root Mean Square Error (RMSE) and Mean Absolute Error (MAE) quantify prediction errors. Studies such as [32] have used these measures to evaluate atmospheric models across varied pollutants. However, metrics like RMSE and MAE are point-based and do not capture spatiotemporal interdependencies within large datasets. Advanced techniques such as spatiotemporal cross-validation highlight the importance of assessing model robustness [33]. The accuracy of Land Use Regression (LUR) models, which typically assume homogeneity (i.e., pollution concentrations are a global function of parameters), improves by considering localized anomalies like specific source-receptor high-concentration pollution plumes and using high-resolution spatiotemporal data to capture atmospheric dynamics [34].
Visualization tools like Taylor plots compare model predictions with actual observations, providing insights into model performance through visual representations of correlation, RMSE, and standard deviation. These tools facilitate targeted improvements in environmental modeling, ensuring realistic representation of observed data [35].
The Jacobian matrix (dY/dX) evaluates the sensitivity of model outputs to various input parameters. This identifies significant factors affecting air quality and assists in fine-tuning models to improve predictions [36]. Geographic Weighted Regression (GWR) assesses spatial variability in pollutant concentrations. GWR represents how pollutants disperse and accumulate across localized regions, preserving requirements for homogeneity [37].
1.5. Research Question and Hypothesis
This research evaluates the capability of CAMS reanalysis data in capturing temporal and seasonal air quality trends and major pollution events. It investigates the accuracy of CAMS in documenting incidents like the 2019 Australian bushfires, pollution episodes in cities like Beijing, and reduced emissions during the COVID-19 lockdowns. The hypothesis is that CAMS, through its integration of satellite data, ground-based observations, and advanced modeling, can provide a reliable framework for air quality monitoring. The aim is to evaluate the validity and precision of CAMS modeled estimates.
This study employs methods like Geographic Weighted Regression (GWR) and the Jacobian matrix (dY/dX) to assess the spatial variability in pollutant concentrations and their correlations with meteorological factors. Additionally, vertical profiles of ground-level concentration (GLC) to Aerosol Optical Depth (AOD) ratios are analyzed to understand the relationship between ground-level pollution and columnar aerosol measurements. Spatiotemporal pollution episodes with significant short-term impacts on air quality are investigated, evaluating CAMS' response to sudden atmospheric changes caused by extreme weather and large-scale human activities.
2. Materials and Methods
2.1. Study Area and Timeframe
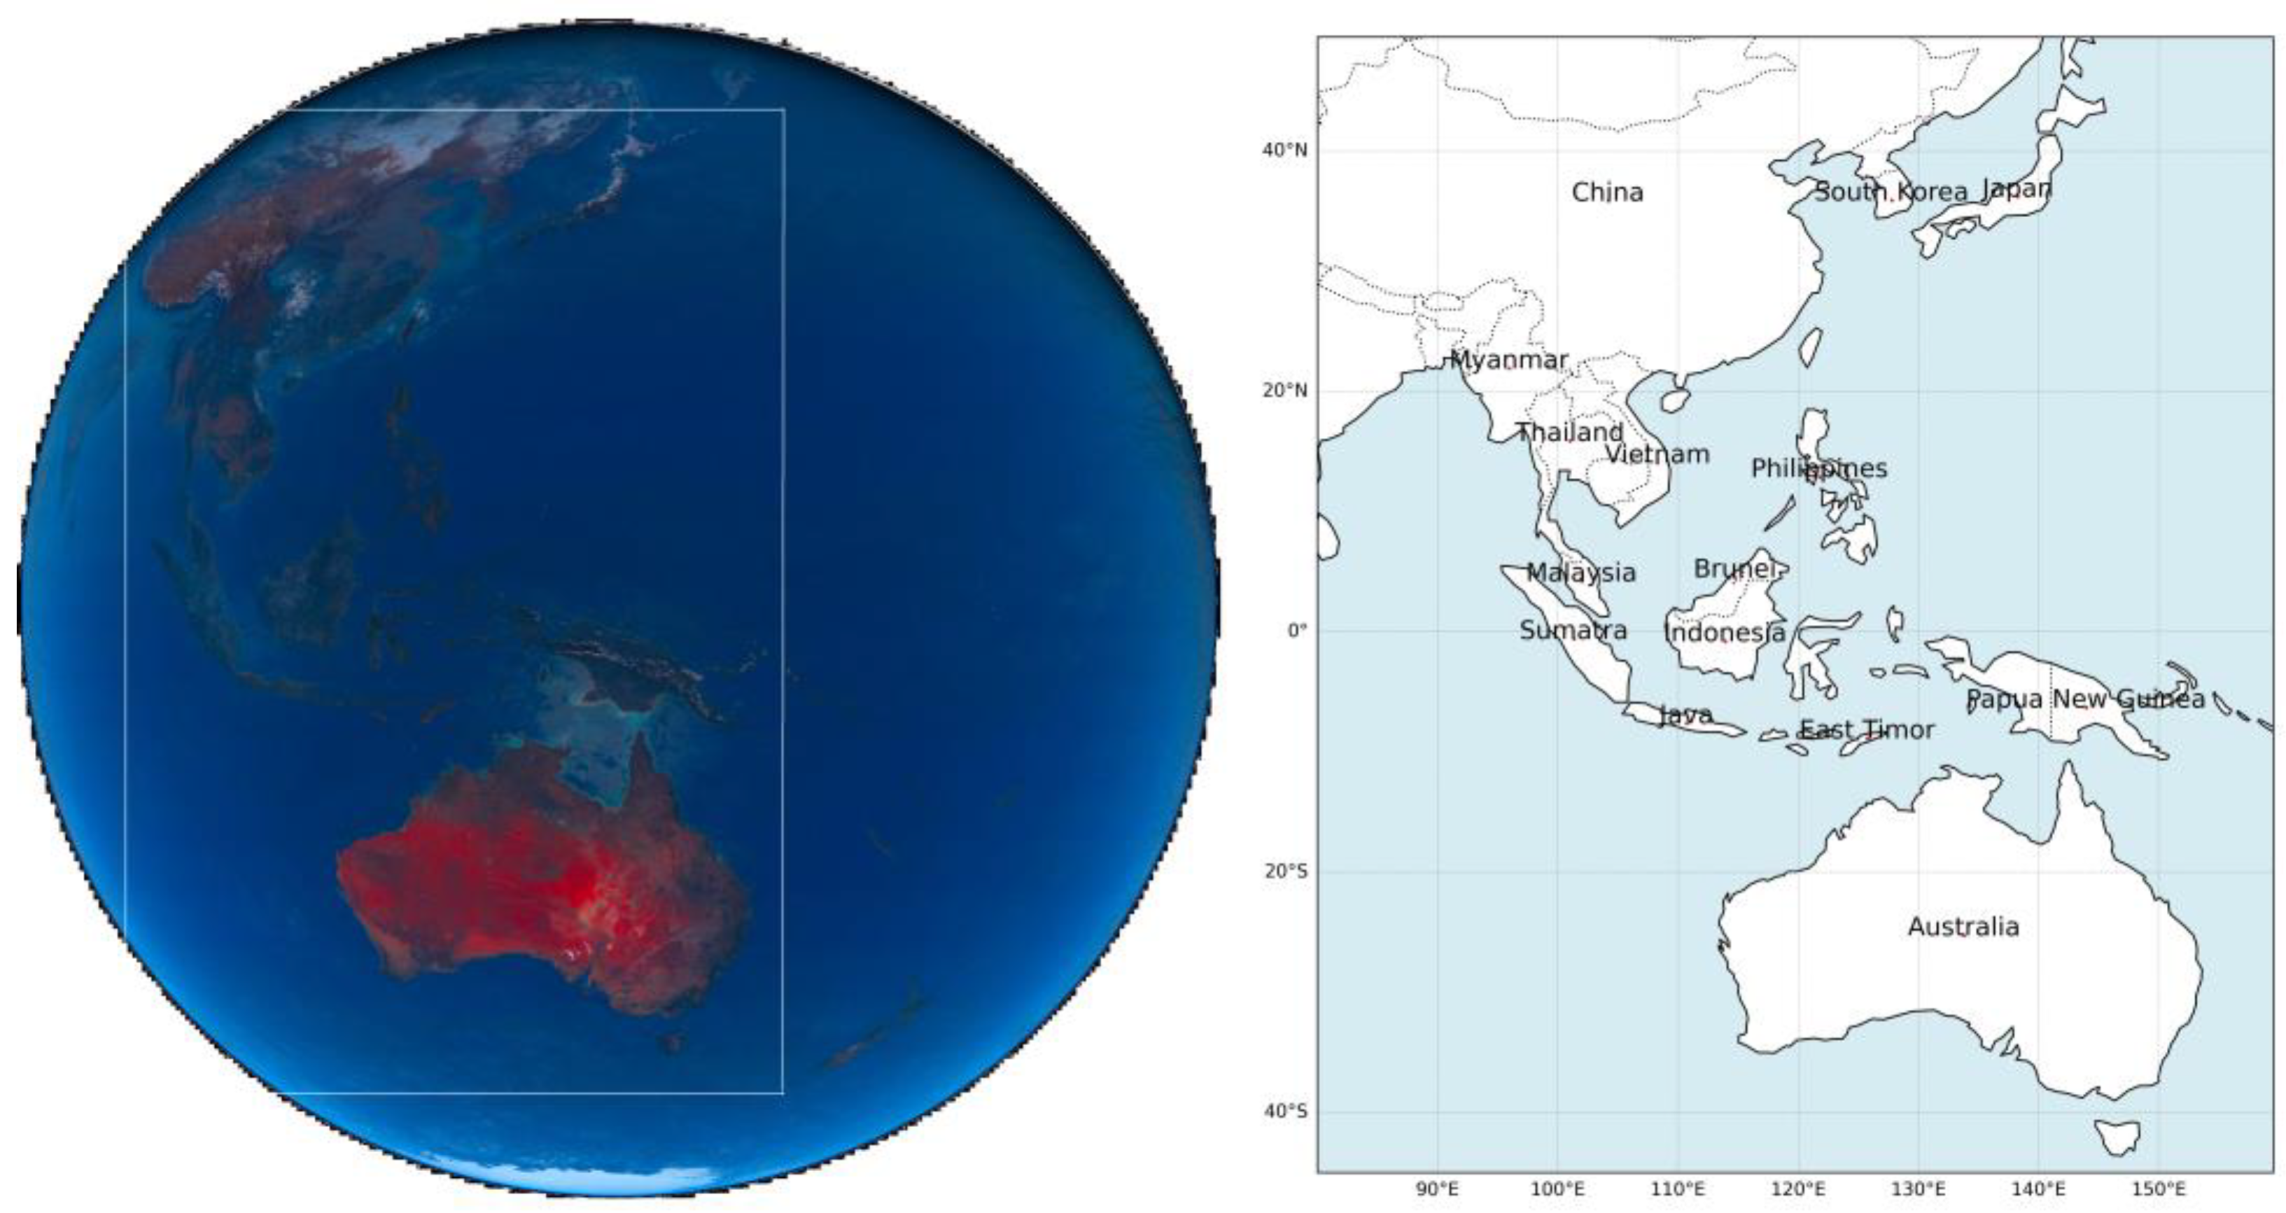
The study focuses on the observational area of the Himawari-8 satellite, which provides high spatiotemporal resolution data. The area was cropped to reduce non-habitable areas (sea, space, and earth curvature), resulting in a dataset approximately 45% the size of the original Himawari-8 dataset. The selected region extends from 85° to 160° east longitude and from -45° to 50° north latitude, covering Australia, Indonesia, and significant portions of China, each with unique environmental characteristics impacting air quality:
Australia features diverse climates from deserts to forests, affecting local and regional air quality. Topography influences pollutant dispersion, especially from bushfires and mining. Coastal areas, particularly in the southeast, experience marine aerosol influxes that interact with urban pollution. Indonesia is an archipelago of over 17,000 islands that experiences volcanic activity and burning that generates significant particulate matter, and the coastal nature impacts dispersion. China has experienced rapid industrialization and urbanization that causes severe pollution in cities like Beijing and Shanghai. Large mountain ranges influence atmospheric circulation, affecting pollutant transport. Seasonal winds and dust storms from northern deserts impact air quality variability.
The dataset covers the eight-year period from 2016 to 2023 and includes major environmental events like the 2019 Southeast Asia haze, the 2019/2020 Australian bushfires, Melbourne's 2016 pollen events, and industrial reductions during the 2020 COVID-19 lockdowns. These events offer insights into aerosol composition variability and its impact on regional and global climate patterns. The careful selection of geographical extent and timeframe ensures a detailed analysis of pollution sources and environmental conditions in China, Indonesia, and Australia.
2.2. Study Area and Timeframe
This study uses CAMS reanalysis data, integrating extensive observational data with advanced numerical models for a consistent dataset crucial for global air quality and climate studies. The data, accessed on 26 April 2024, includes three-hour timesteps saved into eight yearly netCDF files, covering a comprehensive range of atmospheric composition and meteorological variables. The dataset includes single-level data for surface and columnar parameters, and multi-level data with 60 atmospheric pressure levels for detailed vertical profile analysis. Key variables include wind components, temperature, Mean Sea Level Pressure (MSLP), relative humidity, Carbon Monoxide, Nitrogen Oxides, Sulfur Dioxide, and various particulates.
Variables were chosen based on their relevance to the study’s goals—examining temporal and spatial trends in air pollution and assessing atmospheric responses to significant pollution events. Ground-level air quality is prioritized, excluding vertical profile data and secondary pollutants to focus on aerosols and criteria pollutants that provide insights into regional air quality dynamics.
While the study relies on CAMS reanalysis data, supplementary ground-based data from monitoring stations and AERONET were considered but not used. AERONET's 17 Australian sites provide insufficient AOD coverage, and the focus was on GLCs, not columnar AOD. Australian surface data is too sparse, and while China's extensive monitoring network could verify grid variability, data access issues prevented its use. Furthermore, the mismatch between point-based ground data and CAMS grid size further complicates direct calibration. The study acknowledges these constraints and highlights the need for improved data availability to enhance verification and air quality modelling.
Figure 1.
a) Himawari-8 observational area and study domain (cropped at [500,3500;500,5000] to exclude outer edges), and b) Geographic extent of the study area from 85°E to 160°E and 45°S to 50°N.
Figure 1.
a) Himawari-8 observational area and study domain (cropped at [500,3500;500,5000] to exclude outer edges), and b) Geographic extent of the study area from 85°E to 160°E and 45°S to 50°N.
2.3. Detailed Methodological Approach
This study processed and analyzed atmospheric data from the CAMS Reanalysis Dataset using BASH and Python scripts as provided in the supplementary files. Key steps include data normalization, statistical summarization, compositional analysis, anomaly detection, and visualization. Data were processed annually from 2016 to 2023. Ground-level and total column data were downloaded into annual files from the CAMS servers. CDO (Climate Data Operators) commands were used to adjust units and standardize atmospheric parameters to common units [38].
Normalization was performed using the square root transformation to mitigate skewness and handle zero values, thus avoiding computational challenges. Visual examination shows a balanced representation across the domain of concentration levels, highlighting significant pollution areas. Monthly-hourly means were calculated for each month and hour combination and subtracted from the normalized values to reduce background variation and focus on air quality changes.
In-depth statistical analyses were conducted on the consolidated datasets, including metrics such as maximum, mean, minimum, and standard deviation over the study period. This was achieved using CDO operations like timmax, timmean, timmin, and timstd, with data divided into smaller segments (monthly, daily, hourly) using splitmon, splitday, and splithour commands. Monthly datasets examined variations and anomalies and identified significant deviations that indicated unusual pollution events or changes in atmospheric conditions. Composition spatiotemporal analysis identified short-term, seasonal and long-term pollution trends.
The dataset included concentrations of sulfur dioxide (SO2), nitrogen oxides (NOx), carbon monoxide (CO), ozone (O3), and speciated aerosols like sulphate, nitrate, ammonium, black carbon, organic carbon, sea salt, and mineral dust. This provided a comprehensive view of pollutant distribution and concentrations over time. Mean Sea Level Pressure (MSLP) and specific humidity were evaluated for their impact on air pollution dynamics. MSLP influences air mass movement and stability, while specific humidity impacts cloud formation and precipitation, crucial for pollutant dispersion and removal. Carbon Monoxide (CO) and ground-level Ozone (O3) concentrations were analyzed, focusing on urban and industrial areas. Nitrogen Dioxide (NO2) and Sulfur Dioxide (SO2) were studied for their anthropogenic sources and impacts on health and the environment. Nitric Oxide (NO) and Isoprene were analyzed to understand their roles in atmospheric photochemical reactions. Particulate matter (PM2.5 and PM10) concentrations were examined across Asia and Australia to understand their sources and impacts. Aerosol speciation considered Black Carbon (BC) and Organic Carbon (OC) aerosols to identify pollution sources, particularly from industrial activities and wildfires. The distribution of sulphate (SU) and sea salt (SS) aerosols was examined to understand their sources and effects.
The relationship between ground-level concentrations (GLC) and Aerosol Optical Depth (AOD) was analyzed to highlight the limitations of using satellite data for ground-level air quality. This included specific humidity, sea salt, dust aerosol, organic matter, black carbon, and sulphate aerosol. The goal was to assess how the vertical distribution of these components is influenced by environmental factors and to evaluate the feasibility of computing GLC data from AOD columnar data.
Anomalies in NO2, SO2, PM10, and Organic Carbon (OC) were analyzed over an eight-year period to identify significant changes and events affecting air quality. Isopleth maps were used to highlight deviations from typical conditions, providing insights into the impacts of events like the COVID-19 pandemic and wildfires on air quality. Maximum hourly concentrations per day for various pollutants were analyzed using time-series plots. The analysis utilized the square root transformation and anomaly removal based on monthly-hour averages to focus on specific pollution incidents rather than long-term averages. This aimed to identify and analyze acute pollution episodes in major cities across the region.
Geographic Weighted Regression (GWR) approaches using the Jacobian Matrix (dY/dX), and temporal correlation was employed to illustrate the spatial variability between air pollutants and meteorological factors across the study domain. GWR operates on a by-pixel basis, making it ideal for capturing local variations in data. This method determines the Jacobian matrix for selected species-factors, highlighting the complexity of air pollution dynamics and the need for localized air quality strategies. The analysis focused on key meteorological variables and GLCs, including specific humidity (q), mean sea level pressure (msl), temperature in Kelvin (1/T), and wind components (U10m and V10m). Pollutants such as Organic Matter (OM, aermr07), Black Carbon (BC, aermr09), Nitrogen Dioxide (NO2), Sulfur Dioxide (SO2), and Particulate Matter (PM1, PM2.5, PM10) were included to assess their responses to environmental changes. The spatial and temporal changes in these parameters, their correlations, and the evolution of the Jacobian matrix (dY/dX) over space and time were examined.
3. Results
Figure 2 presents the normalized maximum hourly concentrations for NO2, SO2, PM10, and OM through isopleth maps. The original, squared, and log-transformed values are depicted for each pollutant. The normalization process highlights distinct spatial patterns and concentration gradients, which are crucial for identifying high-risk areas. The square root transformation effectively maintains a coherent plume and simplifies the identification of pollution hotspots. This approach ensures that significant pollution incidents are clearly visible, making it easier to focus on areas that require targeted interventions.
Using Climate Data Operators (CDO), statistical summaries, including minimum and maximum hourly, maximum daily mean, and annual average and variance for various factors were derived as depicted in Table 1. These environmental parameters were grouped into meteorological parameters, criteria pollutants, particulate matter, aerosol speciation, and other pollutants. The information was depicted spatially in Figure 3, Figure 4, Figure 5, Figure 6 and Figure 7 showing the maximum hourly, maximum daily mean, annual averages, variance, and average monthly (January, April, July, October) isopleths. Figure 3 depicts this for the U and V wind components, mean sea level pressure, and specific humidity and revealed significant spatial and seasonal variations. For example, stronger winds over Australia compared to China indicated differences in pollutant dispersion, while seasonal patterns showed how variations in wind strength and direction impacted pollutant transport.
Figure 4 depicts isopleths of CO, O3, NO2, and SO2 exhibiting distinct spatial and temporal patterns. CO and NO2 levels were highest in urban and industrial areas, particularly in China. Seasonal variations highlighted the influence of heating emissions and atmospheric conditions on pollutant levels. For example, higher levels of NO2 during winter months were associated with increased heating activities and stable atmospheric conditions that trap pollutants close to the ground.
The isopleths of CO, O3, NO2 and SO2 in Figure 4 reveals significant regional differences and seasonal variations. China shows the highest pollutant levels, driven by industrial and urban activities. Seasonal peaks are evident for different pollutants, emphasizing the need for targeted air quality management strategies. Indonesia and Australia have lower pollutant levels, with specific events like regional fires influencing local air quality.
Figure 5 depicts isopleths of particulate matter (PM1, PM2.5, PM10), and dust aerosols. Visual analysis reveals that non-industrial sources such as wind-blown dust and fires significantly contribute to high PM concentrations in Australia and northern China. Seasonal variations indicate consistent high concentrations in interior Australia, with transient dust events from fires and storms impacting short-term readings. In contrast, long-term averages highlight persistent industrial emissions, particularly in China, where industrial areas show consistently higher concentrations.
Isopleths of Black Carbon (BC), Organic Carbon (OC), sulphate, and sea salt aerosols in Figure 6, revealed the influence of both anthropogenic and natural sources. Higher BC and OC concentrations were observed in industrial regions, while sea salt aerosols were prominent in coastal areas. Other pollutants, including NO, isoprene, formaldehyde, and ethane, showed Figure 7, significant spatial and temporal variability. Higher concentrations were observed in urban and industrial regions, influenced by both anthropogenic and biogenic sources.
Figure 8 depicts the vertical distribution ratio of specific humidity, sea spray, dust aerosol, organic material, black carbon, and sulphate aerosol, highlighting the interaction between natural and anthropogenic sources and the ratio of ground-level concentration (GLC) to aerosol optical depth (AOD). This ratio is not spatially constant, and varies by four orders of magnitude across parameters, indicating that calibration must be location and parameter specific, thus supporting the use of Geographic Weighted Regression (GWR) over Land Use Regression (LUR). The ratio reaches a maximum correlating with specific events such as fires and dust storms as evident by the different maxima across the panels. It is the temporal variation of source strengths that dictates this ratio, causing it to change both spatially and temporally as the plume dissipates.
Anomalies from monthly-hourly means for NO2, SO2, PM2.5, and PM10 over an eight-year period (2016-2023) Figure 9 highlighted significant changes and events affecting air quality. The analysis revealed the impact of events such as the COVID-19 pandemic (2020 column five) and wildfires (2019 column four) on pollutant levels and lower 2023 (column eight) levels.
Timeseries plots in Figure 10 of maximum hourly concentration per day for different pollutants revealed distinct pollution patterns in cities across Australia, China, and Southeast Asia. The 2019/2020 Australian bushfires and the COVID-19 lockdown's impact on pollution levels were evident in the data. These plots illustrated how specific events lead to sharp increases or decreases in pollutant concentrations, providing valuable insights for air quality management.
Geographic Weighted Regression (GWR) analysis illustrated the spatial variability of the correlation in Figure 11 between air pollutants and meteorological factors. The analysis revealed significant relationships in the Jacobian Matrix (dY/dX) in Figure 12 between wind components, specific humidity, and pollutant concentrations. This highlighted the need for localized air quality management strategies that consider the unique environmental conditions of each region. By understanding these spatial relationships, policymakers can develop more effective interventions to reduce pollution and protect public health.
4. Discussion
This discussion elaborates on our findings, connecting them to the study's initial aims and placing them within the broader context of existing air quality monitoring methods. The integration of CAMS data has provided a robust framework for enhancing air quality monitoring capabilities and informing policymaking. Significant outcomes of the normalization techniques, the interactions between atmospheric dynamics and pollutant distribution, and the broader environmental implications are addressed, while also discussing potential limitations and suggesting future research directions.
The normalization techniques, particularly the square root transformation, were critical in our environmental monitoring efforts. This method effectively reduced the skewness caused by low means and facilitated the identification of critical pollution incidents, often orders of magnitude above mean values. By preserving zero values and offering a more intuitive understanding of x2, compared to 10x the square root transformation allowed for detailed visualization and analysis of pollution events, enhancing data clarity and enabling timely and precise interventions to improve public health outcomes and environmental quality.
Our study illuminated complex interactions between atmospheric dynamics, such as wind components, humidity levels, and pollutant distribution. By analyzing U and V wind components, we gained insights into pollutant pathways, crucial for forecasting pollution events and tailoring environmental policies. For example, strong easterly and northerly winds in China during January, indicative of the winter monsoon, significantly shape pollutant distribution. Understanding these dynamics aids in refining air quality models and developing effective policies to mitigate high pollution concentrations and associated public health risks. The analysis of mean sea level pressure (MSLP) and specific humidity further underscored their roles in air pollution. High-pressure systems often lead to pollutant accumulation, while low-pressure systems enhance dispersion. Specific humidity's impact on cloud formation affects photochemical reactions and pollutant dispersion, highlighting the necessity of integrating these variables into air quality models for accurate predictions.
The analysis of CO and ground-level O3 provided insights into urban air pollution dynamics. High CO levels in urban areas of China and Southeast Asia indicated significant vehicular and industrial emissions, which are also precursors for ozone formation. This dual focus enhances our understanding of urban pollution sources and supports the development of targeted policies to reduce exposure to harmful pollutants. Similarly, mapping NO2 and SO2 concentrations identified combustion-related pollution hotspots, emphasizing the need for interventions like stricter vehicle emission standards and cleaner industrial technologies.
Our analysis of PM2.5 and PM10 highlighted distinct geographic distribution patterns influenced by regional industrial activity and natural phenomena. Elevated particulate matter levels in Asia reflected intense industrial activity and urbanization, while natural sources like the 2019/2020 Australian bushfires significantly impacted particulate matter levels in Australia. These findings underscore the importance of integrating dynamic meteorological data into air pollution models to capture the interactions between environmental conditions and pollutant behaviors.
The study's findings on aerosol speciation, particularly BC, OC, sulphate, and sea salt aerosols, revealed the influence of both anthropogenic and natural sources on air quality. The complex source-receptor relationships highlighted the necessity of sophisticated analytical approaches like Geographic Weighted Regression (GWR) to understand the non-homogeneous nature of air pollution. GWR's ability to account for spatial variability contrasts with the limitations of Land Use Regression (LUR), which assumes homogeneity and often misinterprets the factors influencing pollutant dispersion.
The vertical profile analysis provided a comprehensive understanding of how specific atmospheric components, such as specific humidity and dust aerosols, vary spatially and temporally. These insights are critical for developing air quality management strategies that consider both surface-level and vertical distribution of pollutants. The significant spatial and temporal variations observed underscore the importance of integrating multiple atmospheric variables to fully understand air quality dynamics.
Analyzing anomalies in air quality data over eight years revealed correlations with major regional events, such as the decrease in pollutant levels during the COVID-19 pandemic and the impact of natural events like wildfires. These findings demonstrate the utility of anomaly analysis in providing a clearer picture of environmental disruptions and their broader implications for air quality. The significant reduction in pollutant levels during 2020, except for regions affected by the Australian wildfires, highlights the dual impact of reduced human activity and natural pollution sources.
A major contribution of this study is the use of Jacobian matrix analysis to evaluate the sensitivity of pollutants to various atmospheric factors, providing a detailed understanding of source-receptor influences. This approach revealed significant spatial correlations and the impact of regional differences on pollutant distribution. Unlike LUR, which assumes homogeneity, the Jacobian matrix and GWR, which uses a per-pixel approach, highlighted the non-linear and location-specific relationships between emission sources and pollutant concentrations. However, addressing the sporadic nature of air quality incidents is essential since these incidents, rather than mean values, pose significant health risks. These findings demonstrate the importance of considering spatial variability and local conditions in air quality models, which is crucial for accurate forecasting and effective policymaking.
Figure 11 illustrates that LUR fails to account for the heterogeneous nature of air quality. GWR, which uses a per-pixel approach, is more effective in capturing the spatial variability of pollutants. Furthermore, as shown in Figure 12, the Jacobian matrix is not constant and varies both spatially and temporally. This variability indicates that relying on small datasets for developing global air quality methodologies is insufficient. Advanced methods are needed to account for these variations. Finally, scatter plots with limited domains do not adequately capture the complex interactions in air quality data. Comprehensive analyses using GWR and the Jacobian matrix are necessary for a more accurate understanding of pollutant dynamics.
These insights underscore the need for advanced, location-specific air quality modeling approaches to better inform public health interventions and environmental policies. The study's findings have broader implications for climate change, public health, and economic factors. Improved air quality monitoring can lead to more effective climate action by identifying sources of greenhouse gases and particulate matter. Enhanced air quality directly correlates with reduced respiratory and cardiovascular diseases, potentially decreasing healthcare costs and improving community health. Economically, targeted air pollution control measures can lead to cost savings for governments and improve workforce productivity by reducing pollution-related illnesses. While the resolution of CAMS data is sufficient for large-scale analysis, it may not capture fine-scale pollution dynamics critical for local policy decisions. Integrating higher-resolution data sources, such as Himawari-8, could provide more detailed insights. Future research should explore the feasibility of such integrations and assess their added value in operational settings. Additionally, further studies should investigate the application of advanced data normalization techniques across different datasets to evaluate their adaptability to various pollutants and atmospheric conditions.
By discussing these aspects in the context of specific results and broader implications, this section provides deeper insights into the effectiveness and limitations of the CAMS dataset in real-world applications, guiding future efforts in air quality monitoring and environmental science.
5. Conclusions
The Copernicus Atmosphere Monitoring Service (CAMS) is essential for understanding regional air pollution and assessing transboundary pollutant effects. This study highlights CAMS' critical role in enhancing air quality monitoring and management, providing detailed insights into the dynamics of various pollutants and atmospheric conditions.
Key findings include the effective application of normalization techniques, particularly the square root transformation, which significantly improved data clarity and utility. This method enabled more precise identification of pollution events, facilitating targeted air quality interventions. Additionally, the analysis of atmospheric dynamics—such as wind components, specific humidity, and mean sea level pressure—has shown their substantial influence on pollutant distribution and concentrations. These insights are crucial for accurately forecasting pollution events and tailoring environmental policies to mitigate adverse health and environmental effects.
Our study underscores the complexities involved in analyzing air quality over a vast region like China to Australia. The significant spatial and temporal variability in air quality parameters precludes the effective use of traditional statistical methods that rely on mean values. The findings suggest that alternative approaches focusing on incident-based analysis may be more appropriate for capturing the true dynamics of air pollution. Future studies should develop methodologies that can effectively identify and analyze pollution episodes, providing a more accurate and actionable understanding of air quality conditions across large regions.
The study's analysis using the Jacobian matrix revealed that the sensitivity of pollutants to various atmospheric factors is highly variable both spatially and temporally. This variability underscores the inadequacy of traditional Land Use Regression (LUR) models, which assume homogeneous air quality conditions. Instead, Geographic Weighted Regression (GWR) provides a more accurate approach by accounting for local variability. Additionally, the correlation analysis demonstrated that scatter plots with limited domains do not capture the complex interactions between pollutants and atmospheric factors. These findings emphasize the need for advanced, location-specific air quality models that can accommodate the dynamic nature of air pollution. This approach is crucial for developing effective public health interventions and environmental policies.
Integrating CAMS data with Himawari-8’s high-resolution satellite data, which offers 16 wavelength channels, could revolutionize air quality monitoring by providing dynamic, near real-time outputs with fine spatial resolution. This integration promises to significantly enhance our ability to monitor air pollution events as they occur, especially in areas with limited ground monitoring infrastructure. Operational implementation of these findings includes developing an integrated monitoring platform that combines CAMS data with Himawari-8 imagery. Such a platform would support environmental agencies and policymakers by delivering more accurate and timely data, enabling quicker responses to air quality deteriorations and fostering informed decision-making. The insights from this study could also refine existing air quality models, enhancing their predictive accuracy and reliability.
Ultimately, this research underscores the necessity of leveraging continuous monitoring and advanced modeling capabilities of CAMS to improve our understanding of air quality challenges. By integrating these tools with cutting-edge satellite imagery like that from Himawari-8, we can create a more dynamic and responsive air quality monitoring system. This proactive approach will ensure that environmental policies and public health interventions are founded on robust scientific evidence, leading to more effective air quality management globally.
Supplementary Materials
The following supporting information can be downloaded at https://github.com/MilesSowden/CAMS_Him8/blob/main/Cams.sh, the main processing code; https://github.com/MilesSowden/CAMS_Him8/blob/main/PlotStats.sh the plotting code; https://github.com/MilesSowden/CAMS_Him8/blob/main/plot_netcdf.py the python script; https://github.com/MilesSowden/CAMS_Him8/blob/main/plot_timeseries.py timeseries and https://github.com/MilesSowden/CAMS_Him8/blob/main/gws.sh, the GWR code.
Author Contributions
Sole-author was responsible for all aspects of the article, including conceptualization, methodology, software, validation, formal analysis, investigation, resources, data curation, writing—original draft preparation, writing—review and editing, visualization, supervision, and project administration. The author has read and agreed to the published version of the manuscript.
Funding
This research received no funding and was conducted independently of all funding or affiliation by the corresponding author.
Data Availability Statement
The data supporting the reported results can be accessed from the Copernicus Atmosphere Monitoring Service (CAMS) by request. For more information and to access the data, please visit https://ads.atmosphere.copernicus.eu/cdsapp#!/dataset/cams-global-reanalysis-eac4?tab=form. Date accessed: 26 April 2024.
Conflicts of Interest
The author declares no conflicts of interest.
References
- K.M., E. and M.D. Keywood, Australia State of the Environment. 2021. [CrossRef]
- Sowden, M. and D. Blake, Using infrared geostationary remote sensing to determine particulate matter ground-level composition and concentration. Air Qual Atmos Health, 2021: p. 1-10. [CrossRef]
- Inness, A., et al., The CAMS reanalysis of atmospheric composition. Atmospheric Chemistry and Physics, 2019. 19(6): p. 3515-3556. [CrossRef]
- JMA. Meteorological Satellite Center, Himawari Real-Time Image. 2024; Available from: https://www.data.jma.go.jp/mscweb/data/himawari/sat_img.php?area=fd_.
- CNEMC. China National Environmental Monitoring Centre. 2024; Available from: https://www.cnemc.cn/.
- Marvin, M.R., et al., Uncertainties from biomass burning aerosols in air quality models obscure public health impacts in Southeast Asia. Atmospheric Chemistry and Physics, 2024. 24(6): p. 3699-3715. [CrossRef]
- Cheng, M., et al., Assessing uncertainty and heterogeneity in machine learning-based spatiotemporal ozone prediction in Beijing-Tianjin- Hebei region in China. Sci Total Environ, 2023. 881: p. 163146. [CrossRef]
- Gokhale, S. and R. Patil, Uncertainty in modelling PM10 and PM2.5 at a non-signalized traffic roundabout. Atmospheric Pollution Research, 2010. 1(2): p. 59-70. [CrossRef]
- ECMWF. CAMS Reanalysis data documentation. 2024; Available from: https://confluence.ecmwf.int/display/CKB/CAMS%3A+Reanalysis+data+documentation.
- Stratoulias, D., et al., Recent developments in satellite remote sensing for air pollution surveillance in support of Sustainable Development Goals. Remote Sensing, 2024. 16(Under review): p. 3070374.
- Sun, H., et al., Quantifying the Impact of Aerosols on Geostationary Satellite Infrared Radiance Simulations: A Study with Himawari-8 AHI. Remote Sensing, 2024. 16(12). [CrossRef]
- Pinder, R.W., et al., Opportunities and Challenges for Filling the Air Quality Data Gap in Low- and Middle-Income Countries. Atmos Environ (1994), 2019. 215. [CrossRef]
- Azmi, W.N.F.W., et al., Application of land use regression model to assess outdoor air pollution exposure: A review. Environmental Advances, 2023. 11. [CrossRef]
- Zhou, Q., C. Wang, and S. Fang, Application of geographically weighted regression (GWR) in the analysis of the cause of haze pollution in China. Atmospheric Pollution Research, 2019. 10(3): p. 835-846. [CrossRef]
- Peng, B., et al., Enhancing Seasonal PM2.5 Estimations in China through Terrain–Wind–Rained Index (TWRI): A Geographically Weighted Regression Approach. Remote Sensing, 2024. 16(12). [CrossRef]
- Zhang, Y., et al., High Temporal Resolution Land Use Regression Models with POI Characteristics of the PM(2.5) Distribution in Beijing, China. Int J Environ Res Public Health, 2021. 18(11). [CrossRef]
- Patton, A.P., et al., Transferability and generalizability of regression models of ultrafine particles in urban neighborhoods in the Boston area. Environ Sci Technol, 2015. 49(10): p. 6051-60. [CrossRef]
- Ghassoun, Y., M.-O. Löwner, and S. Weber, Wind direction related parameters improve the performance of a land use regression model for ultrafine particles. Atmospheric Pollution Research, 2019. 10(4): p. 1180-1189. [CrossRef]
- Mölter, A. and S. Lindley, Developing land use regression models for environmental science research using the XLUR tool – More than a one-trick pony. Environmental Modelling & Software, 2021. 143. [CrossRef]
- Li, Z., et al., Development and intercity transferability of land-use regression models for predicting ambient PM10, PM2.5, NO2 and O3 concentrations in northern Taiwan. Atmospheric Chemistry and Physics, 2021. 21(6): p. 5063-5078. [CrossRef]
- Nesser, H., et al., Reduced-cost construction of Jacobian matrices for high-resolution inversions of satellite observations of atmospheric composition. Atmospheric Measurement Techniques, 2021. 14(8): p. 5521-5534. [CrossRef]
- Jacobson, M.Z., et al., Development and application of a new air pollution modeling system-part I: Gas-phase simulations. Atmospheric Environment, 1996. 30(12): p. 1939-1963. [CrossRef]
- Petrenko, M., et al., The use of satellite-measured aerosol optical depth to constrain biomass burning emissions source strength in the global model GOCART. Journal of Geophysical Research: Atmospheres, 2012. 117(D18). [CrossRef]
- Kumar, S., K. Biswas, and P. Ashish, Forecasting formation of a Tropical Cyclone Using Reanalysis Data. arXiv, Atmospheric and Oceanic Physics, 2022. 2212.06149 . [CrossRef]
- https://doi.org/10.48550/arXiv.2212.06149.
- Chen, X., et al., On the Stochasticity of Reanalysis Outputs of 4D-Var. arXiv, Statistical Theory. 2304.03648.
- Baklanov, A., et al., Key Issues for Seamless Integrated Chemistry-Meteorology Modeling. Bull Am Meteorol Soc, 2018. 98: p. 2285-2292. [CrossRef]
- Bocquet, M., et al., Data assimilation in atmospheric chemistry models: current status and future prospects for coupled chemistry meteorology models. Atmospheric Chemistry and Physics, 2015. 15(10): p. 5325-5358. [CrossRef]
- Peterson, R.A., Finding Optimal Normalizing Transformations via best Normalize. The R Journal, 2021. 13:(1): p. 310-329.
- A&WMA, Theories, Methodologies, Computational Techniques, and Available Databases and Software Vol IV. 2010.
- Leelőssy, Á., et al., Dispersion modeling of air pollutants in the atmosphere: a review. Open Geosciences, 2014. 6(3). [CrossRef]
- IASTATE. Dispersion for point sources. CE 424 2011; Available from: https://www.engineering.iastate.edu/~leeuwen/CE%20524/Notes/Dispersion_Handout.pdf.
- Gleckler, P.J., K.E. Taylor, and C. Doutriaux, Performance metrics for climate models. Journal of Geophysical Research: Atmospheres, 2008. 113(D6). [CrossRef]
- Cenita, J.A., P.R. Asuncion, and J. Victoriano, Performance Evaluation of Regression Models in Predicting the Cost of Medical Insurance. International Journal of Computing Sciences Research, 2023. 7: p. 2052-2065. [CrossRef]
- Hoek, G., et al., A review of land-use regression models to assess spatial variation of outdoor air pollution. Atmospheric Environment, 2008. 42(33): p. 7561-7578. [CrossRef]
- Taylor, K.E., Summarizing multiple aspects of model performance in a single diagram. Journal of Geophysical Research: Atmospheres, 2001. 106(D7): p. 7183-7192. [CrossRef]
- Eslahchi, M.R., M. Dehghan, and S. Ahmadi Asl, The general Jacobi matrix method for solving some nonlinear ordinary differential equations. Applied Mathematical Modelling, 2012. 36(8): p. 3387-3398. [CrossRef]
- Fotheringham, A.S., M.E. Charlton, and C. Brunsdon, Geographically Weighted Regression: A Natural Evolution of the Expansion Method for Spatial Data Analysis. Environment and Planning A: Economy and Space, 1998. 30(11): p. 1905-1927. [CrossRef]
- Schulzweida, U. CDO User Guide (2.3.0) 2023; Available from: https://code.mpimet.mpg.de/projects/cdo/wiki. [CrossRef]
Figure 2.
Data Normalization (depicting maximum hour) Columns left to right are NO2, SO2, PM10 and OM, Rows top to bottom are X, square root (X), Log10 (X).
Figure 2.
Data Normalization (depicting maximum hour) Columns left to right are NO2, SO2, PM10 and OM, Rows top to bottom are X, square root (X), Log10 (X).
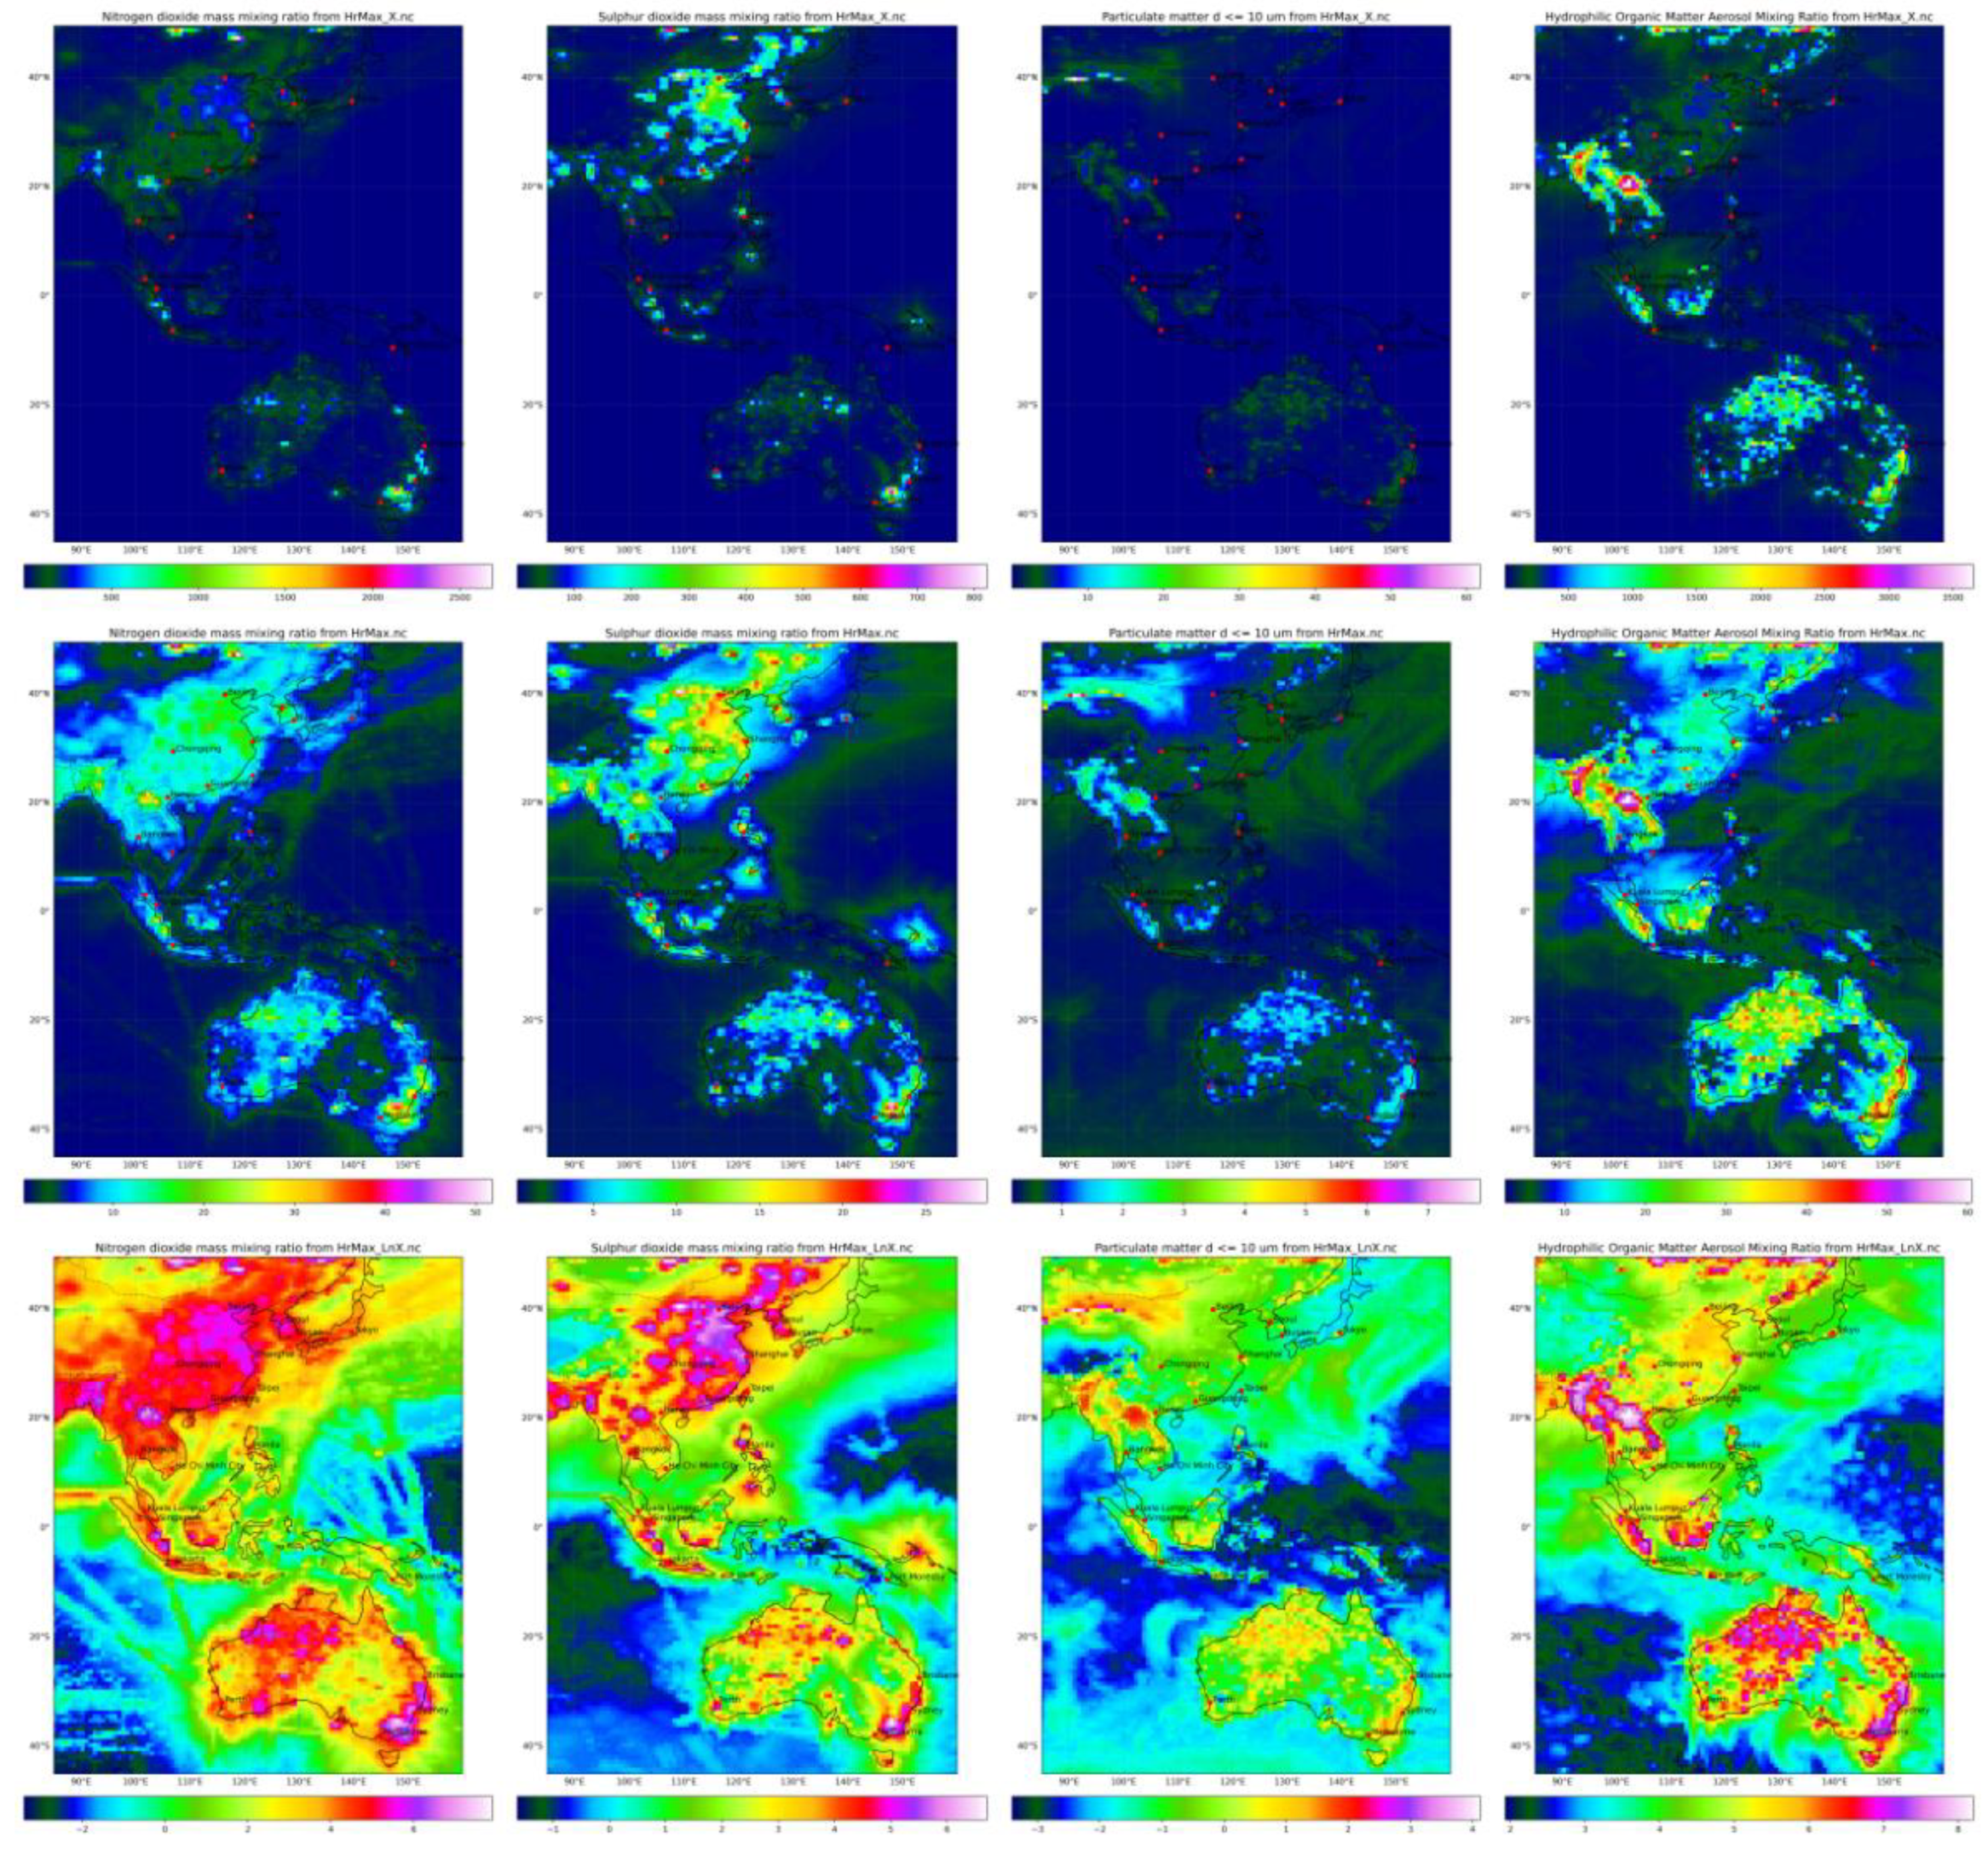
Figure 3.
Spatiotemporal variation by row of U, V, MSLP, and specific humidity Columns are Max hourly, Max daily, Annual average, Std Dev, Mean: January, April, July, October.
Figure 3.
Spatiotemporal variation by row of U, V, MSLP, and specific humidity Columns are Max hourly, Max daily, Annual average, Std Dev, Mean: January, April, July, October.
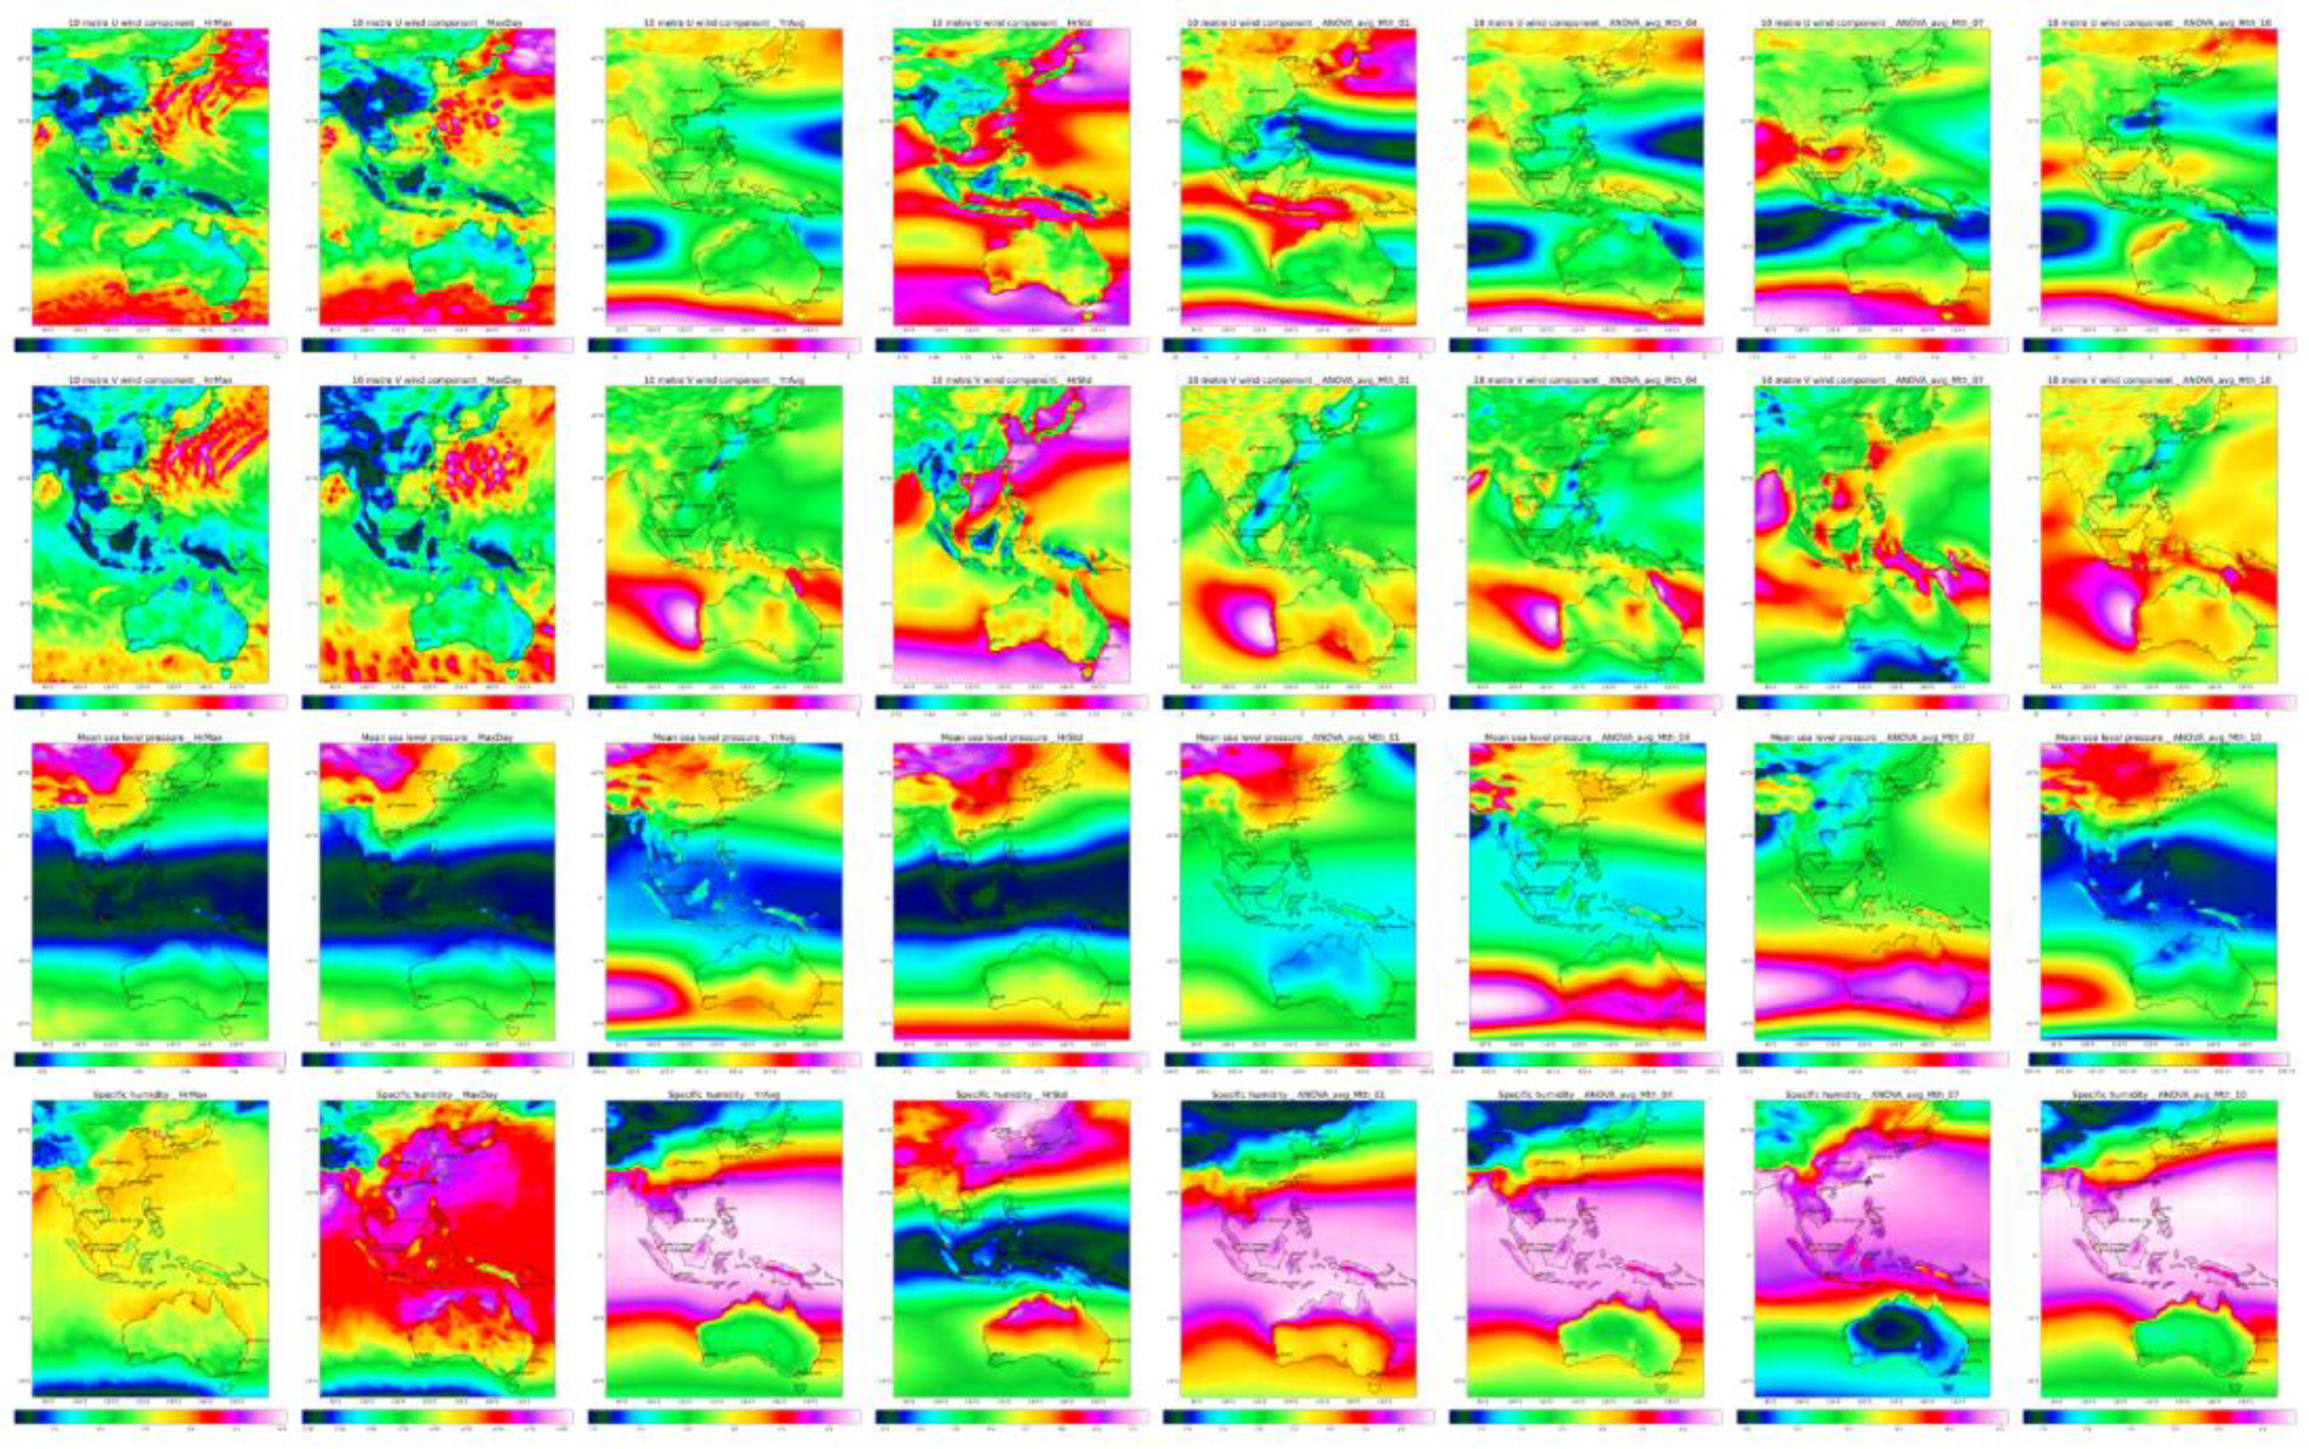
Figure 4.
Isopleths CO, O3, NO2 and SO2 (by row) Columns are Max hourly, Max daily, Annual average, Std Dev, Mean: January, April, July, October.
Figure 4.
Isopleths CO, O3, NO2 and SO2 (by row) Columns are Max hourly, Max daily, Annual average, Std Dev, Mean: January, April, July, October.
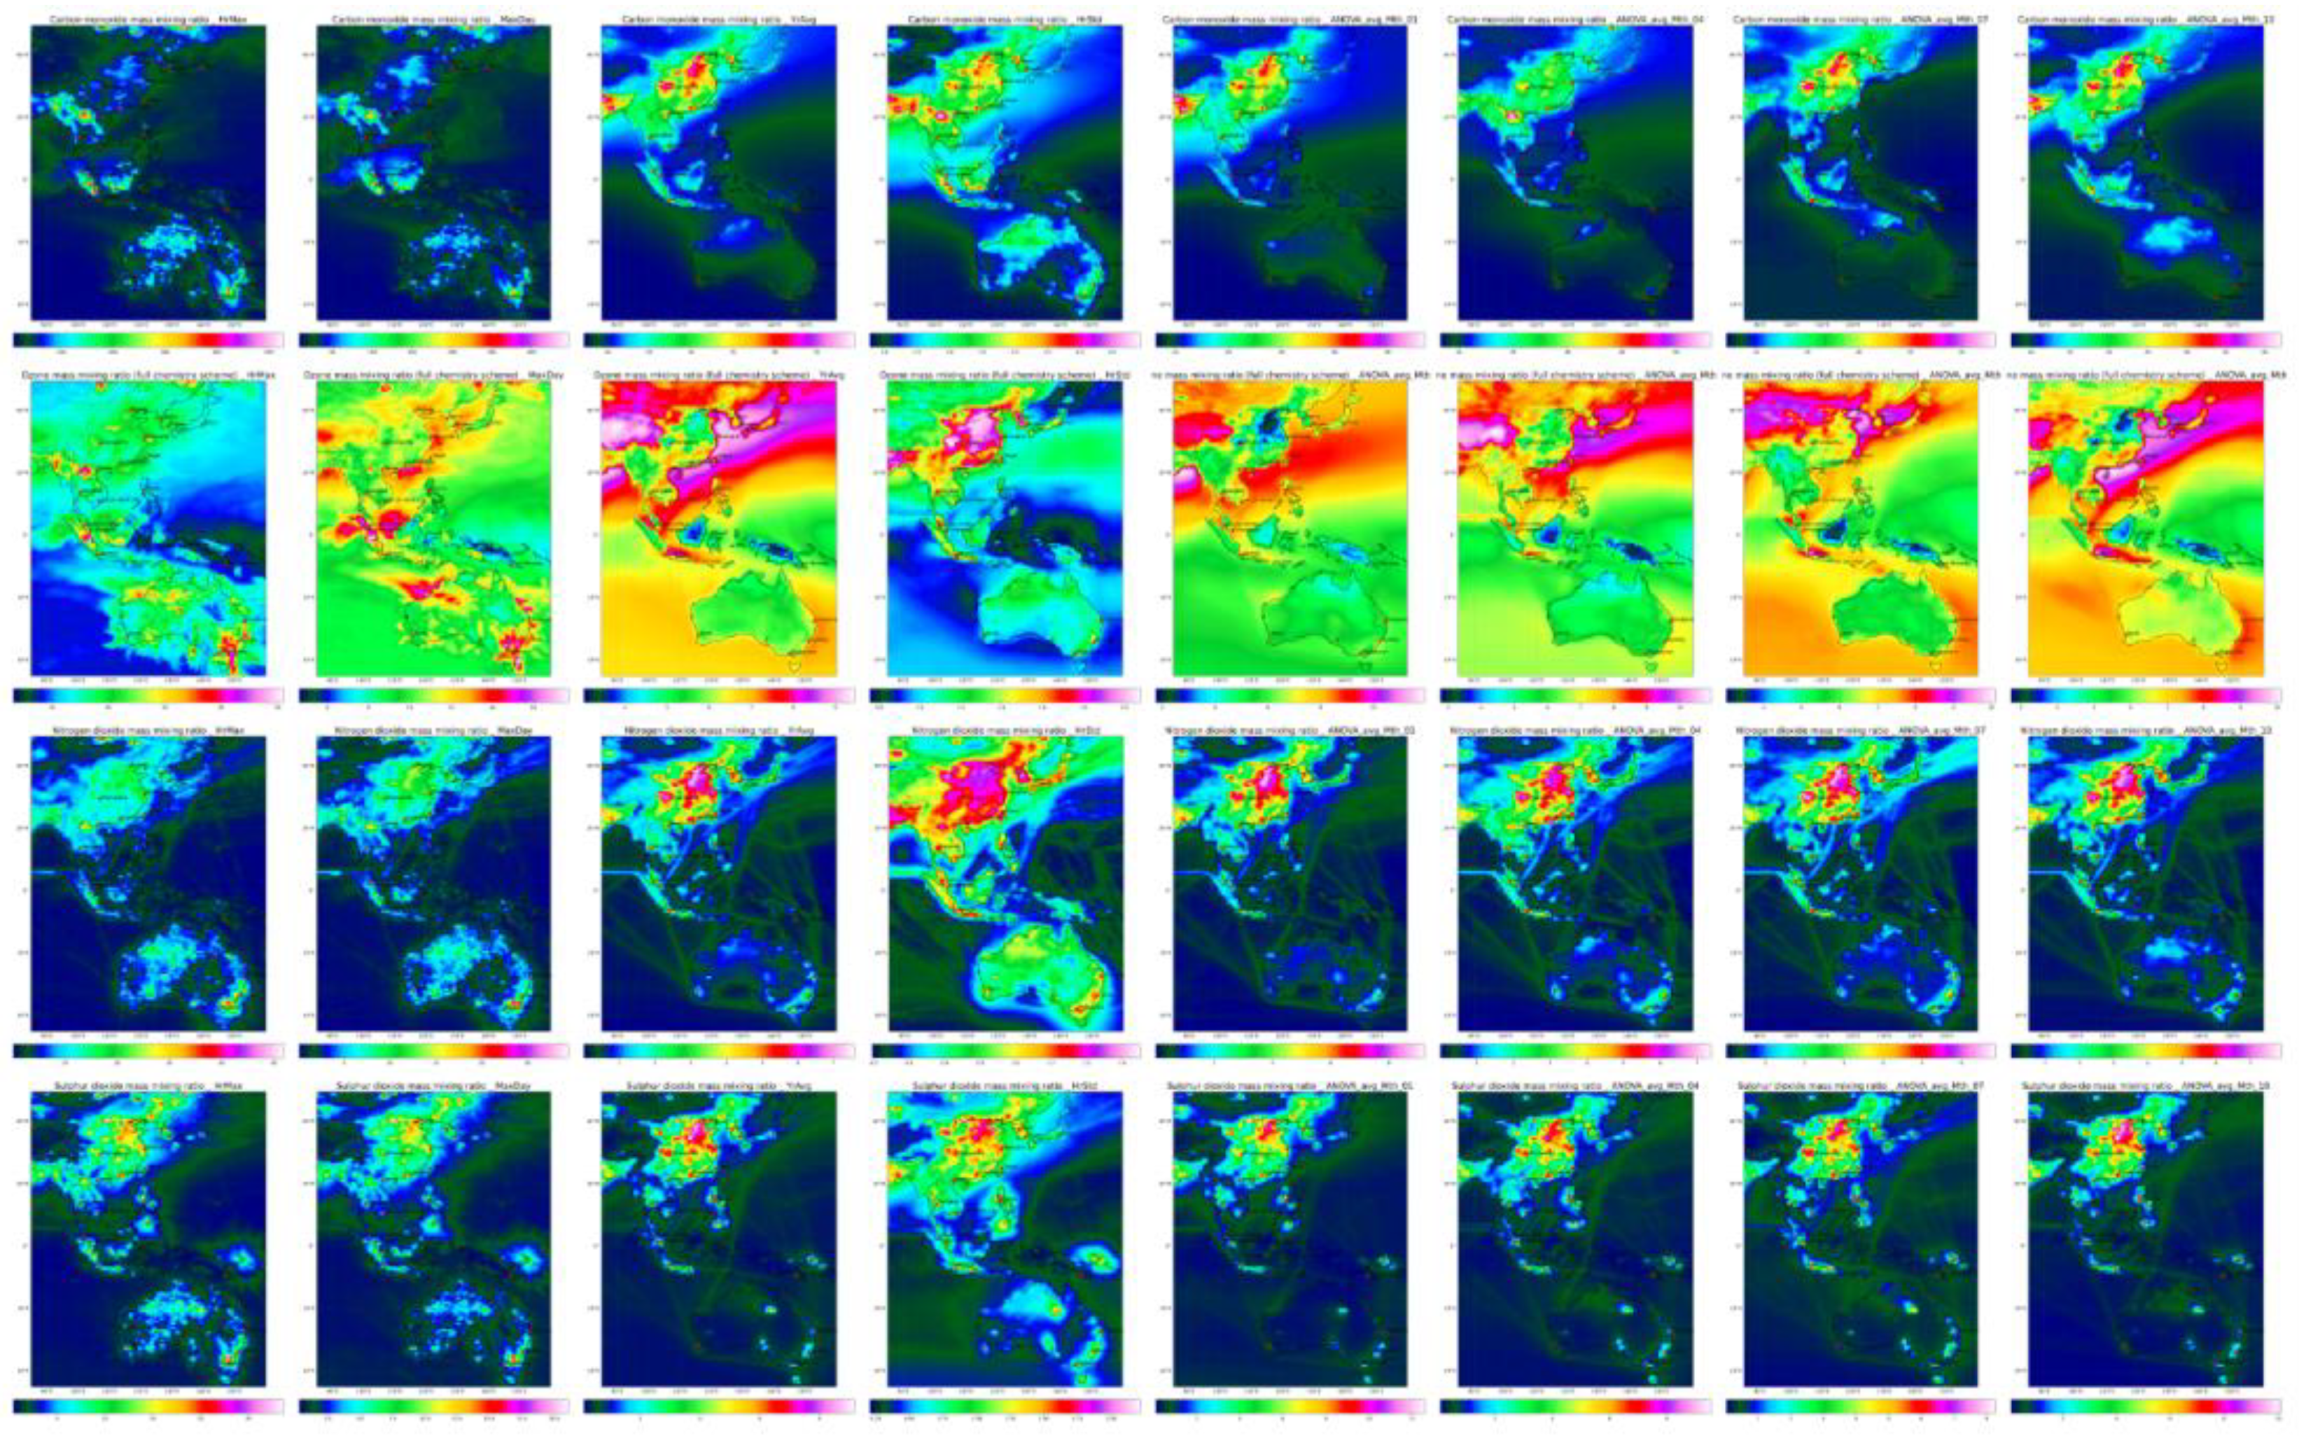
Figure 5.
Isopleths of PM1, PM2.5, PM10 and Dust aerosol2.5 (by row) Columns are Max hourly, Max daily, Annual average, Std Dev, Mean: January, April, July, October.
Figure 5.
Isopleths of PM1, PM2.5, PM10 and Dust aerosol2.5 (by row) Columns are Max hourly, Max daily, Annual average, Std Dev, Mean: January, April, July, October.
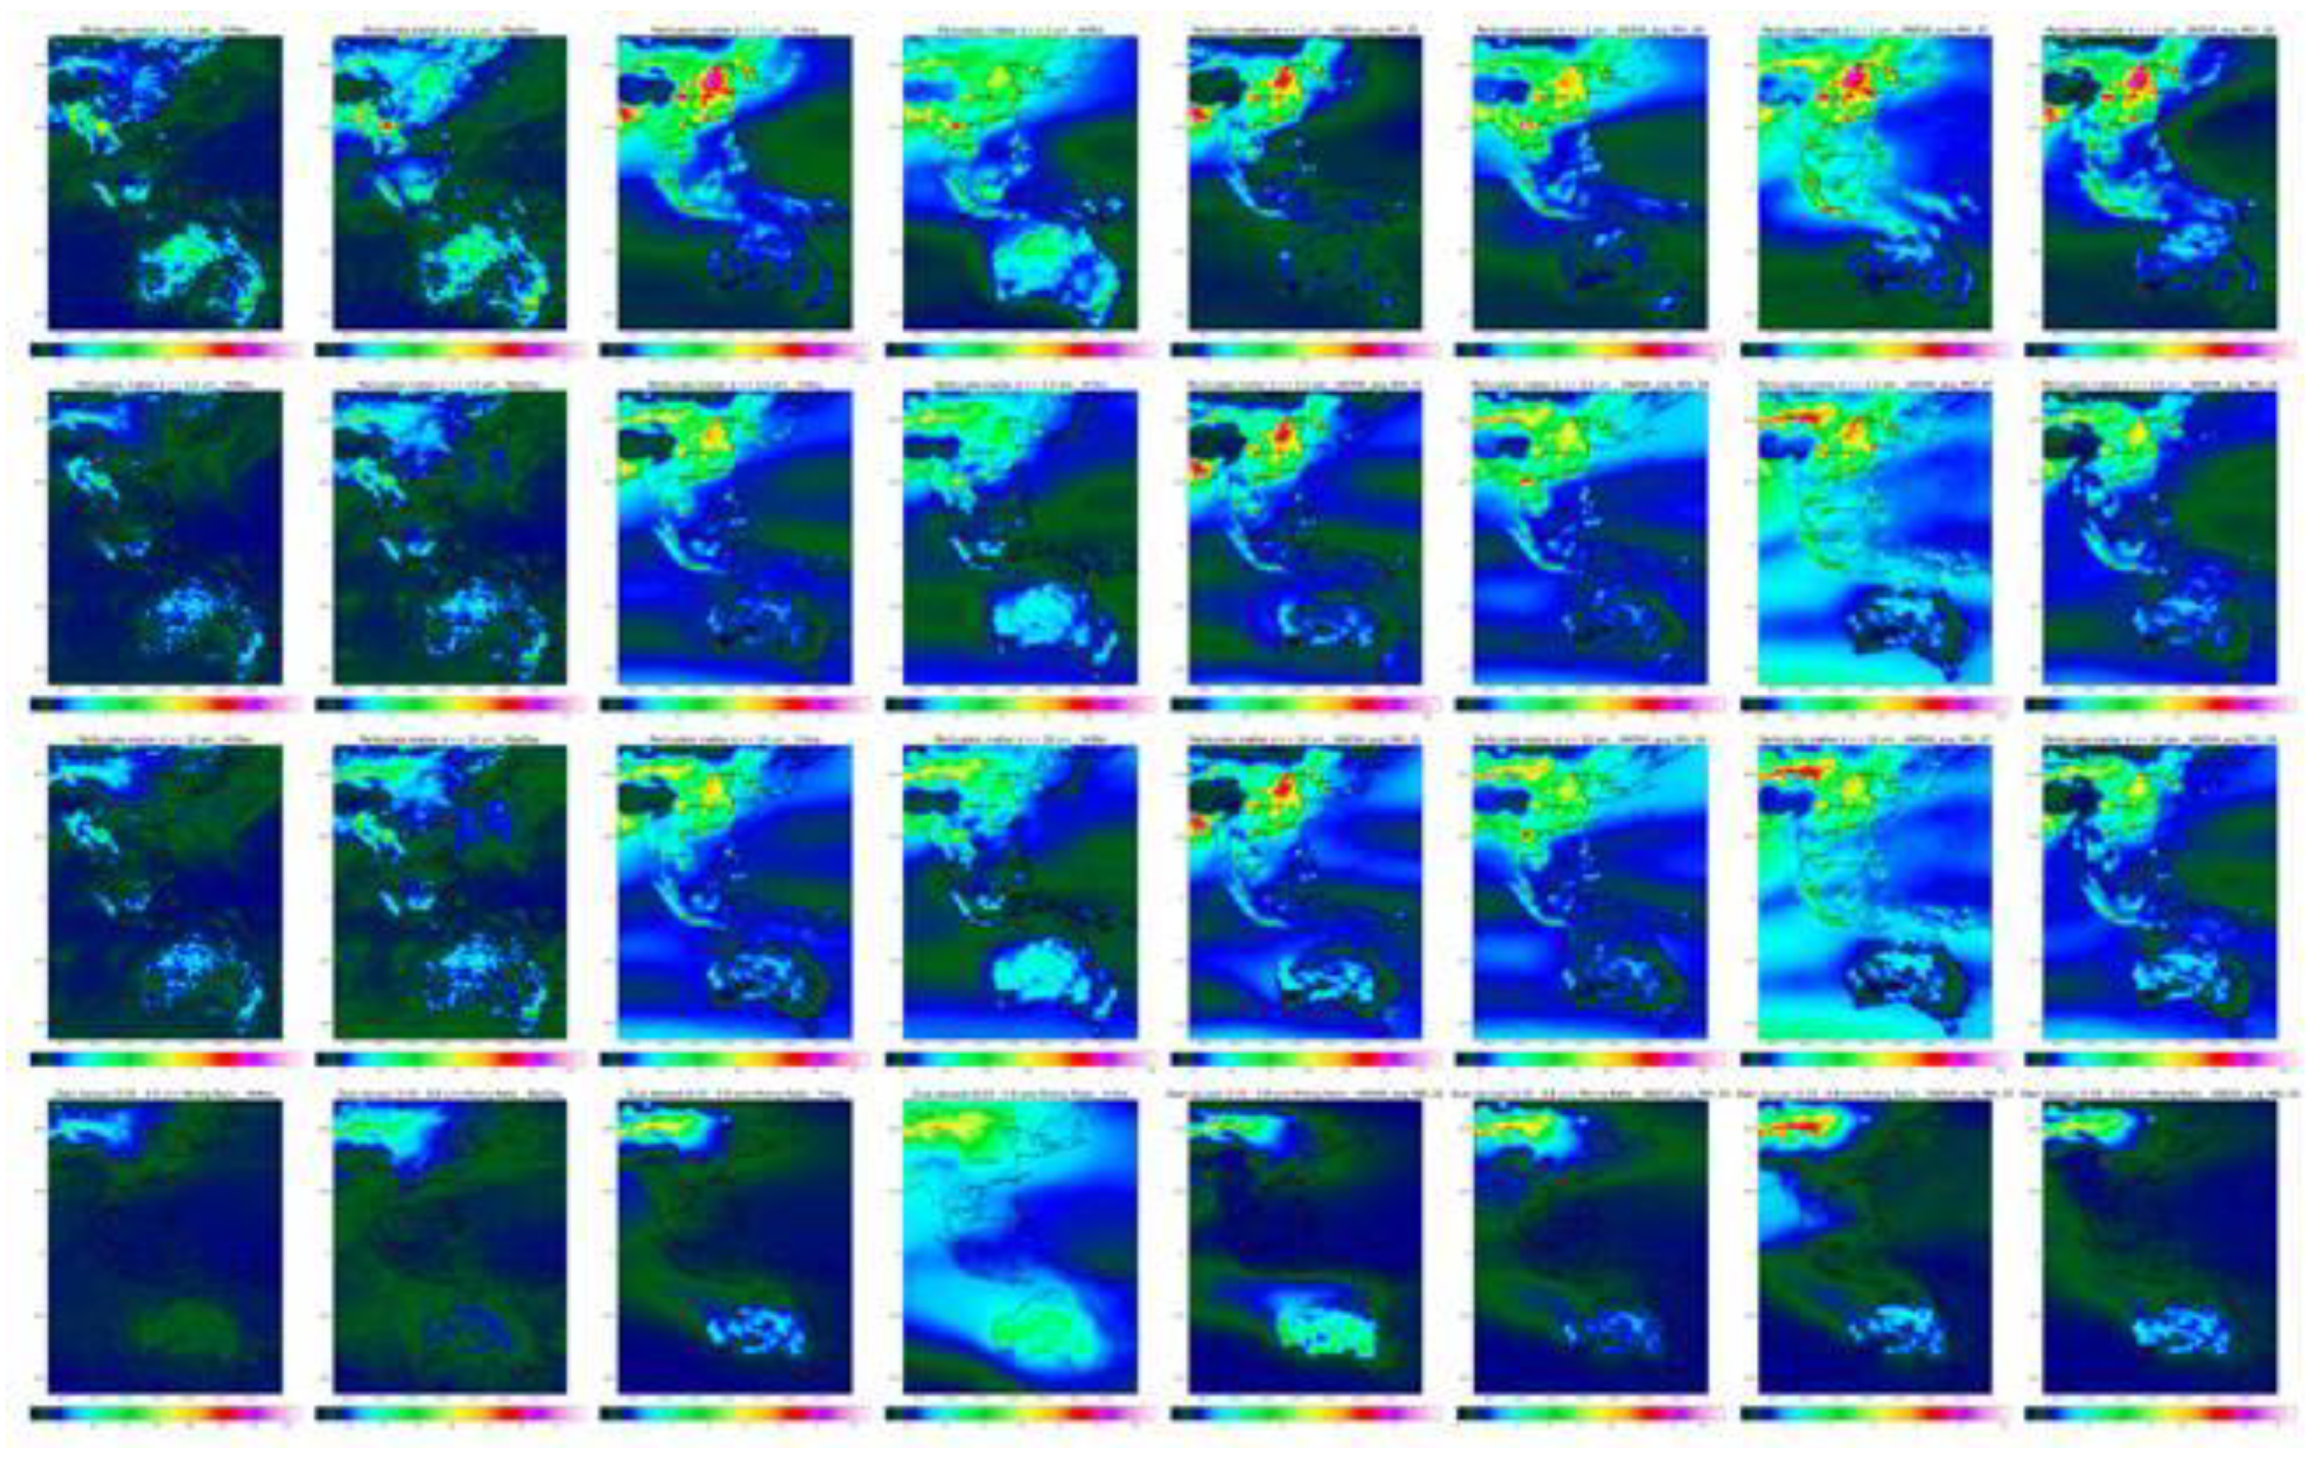
Figure 6.
Isopleths of BC, OC, SU, and SS aerosols (by row) Columns are Max hourly, Max daily, Annual average, Std Dev, Mean: January, April, July, October.
Figure 6.
Isopleths of BC, OC, SU, and SS aerosols (by row) Columns are Max hourly, Max daily, Annual average, Std Dev, Mean: January, April, July, October.
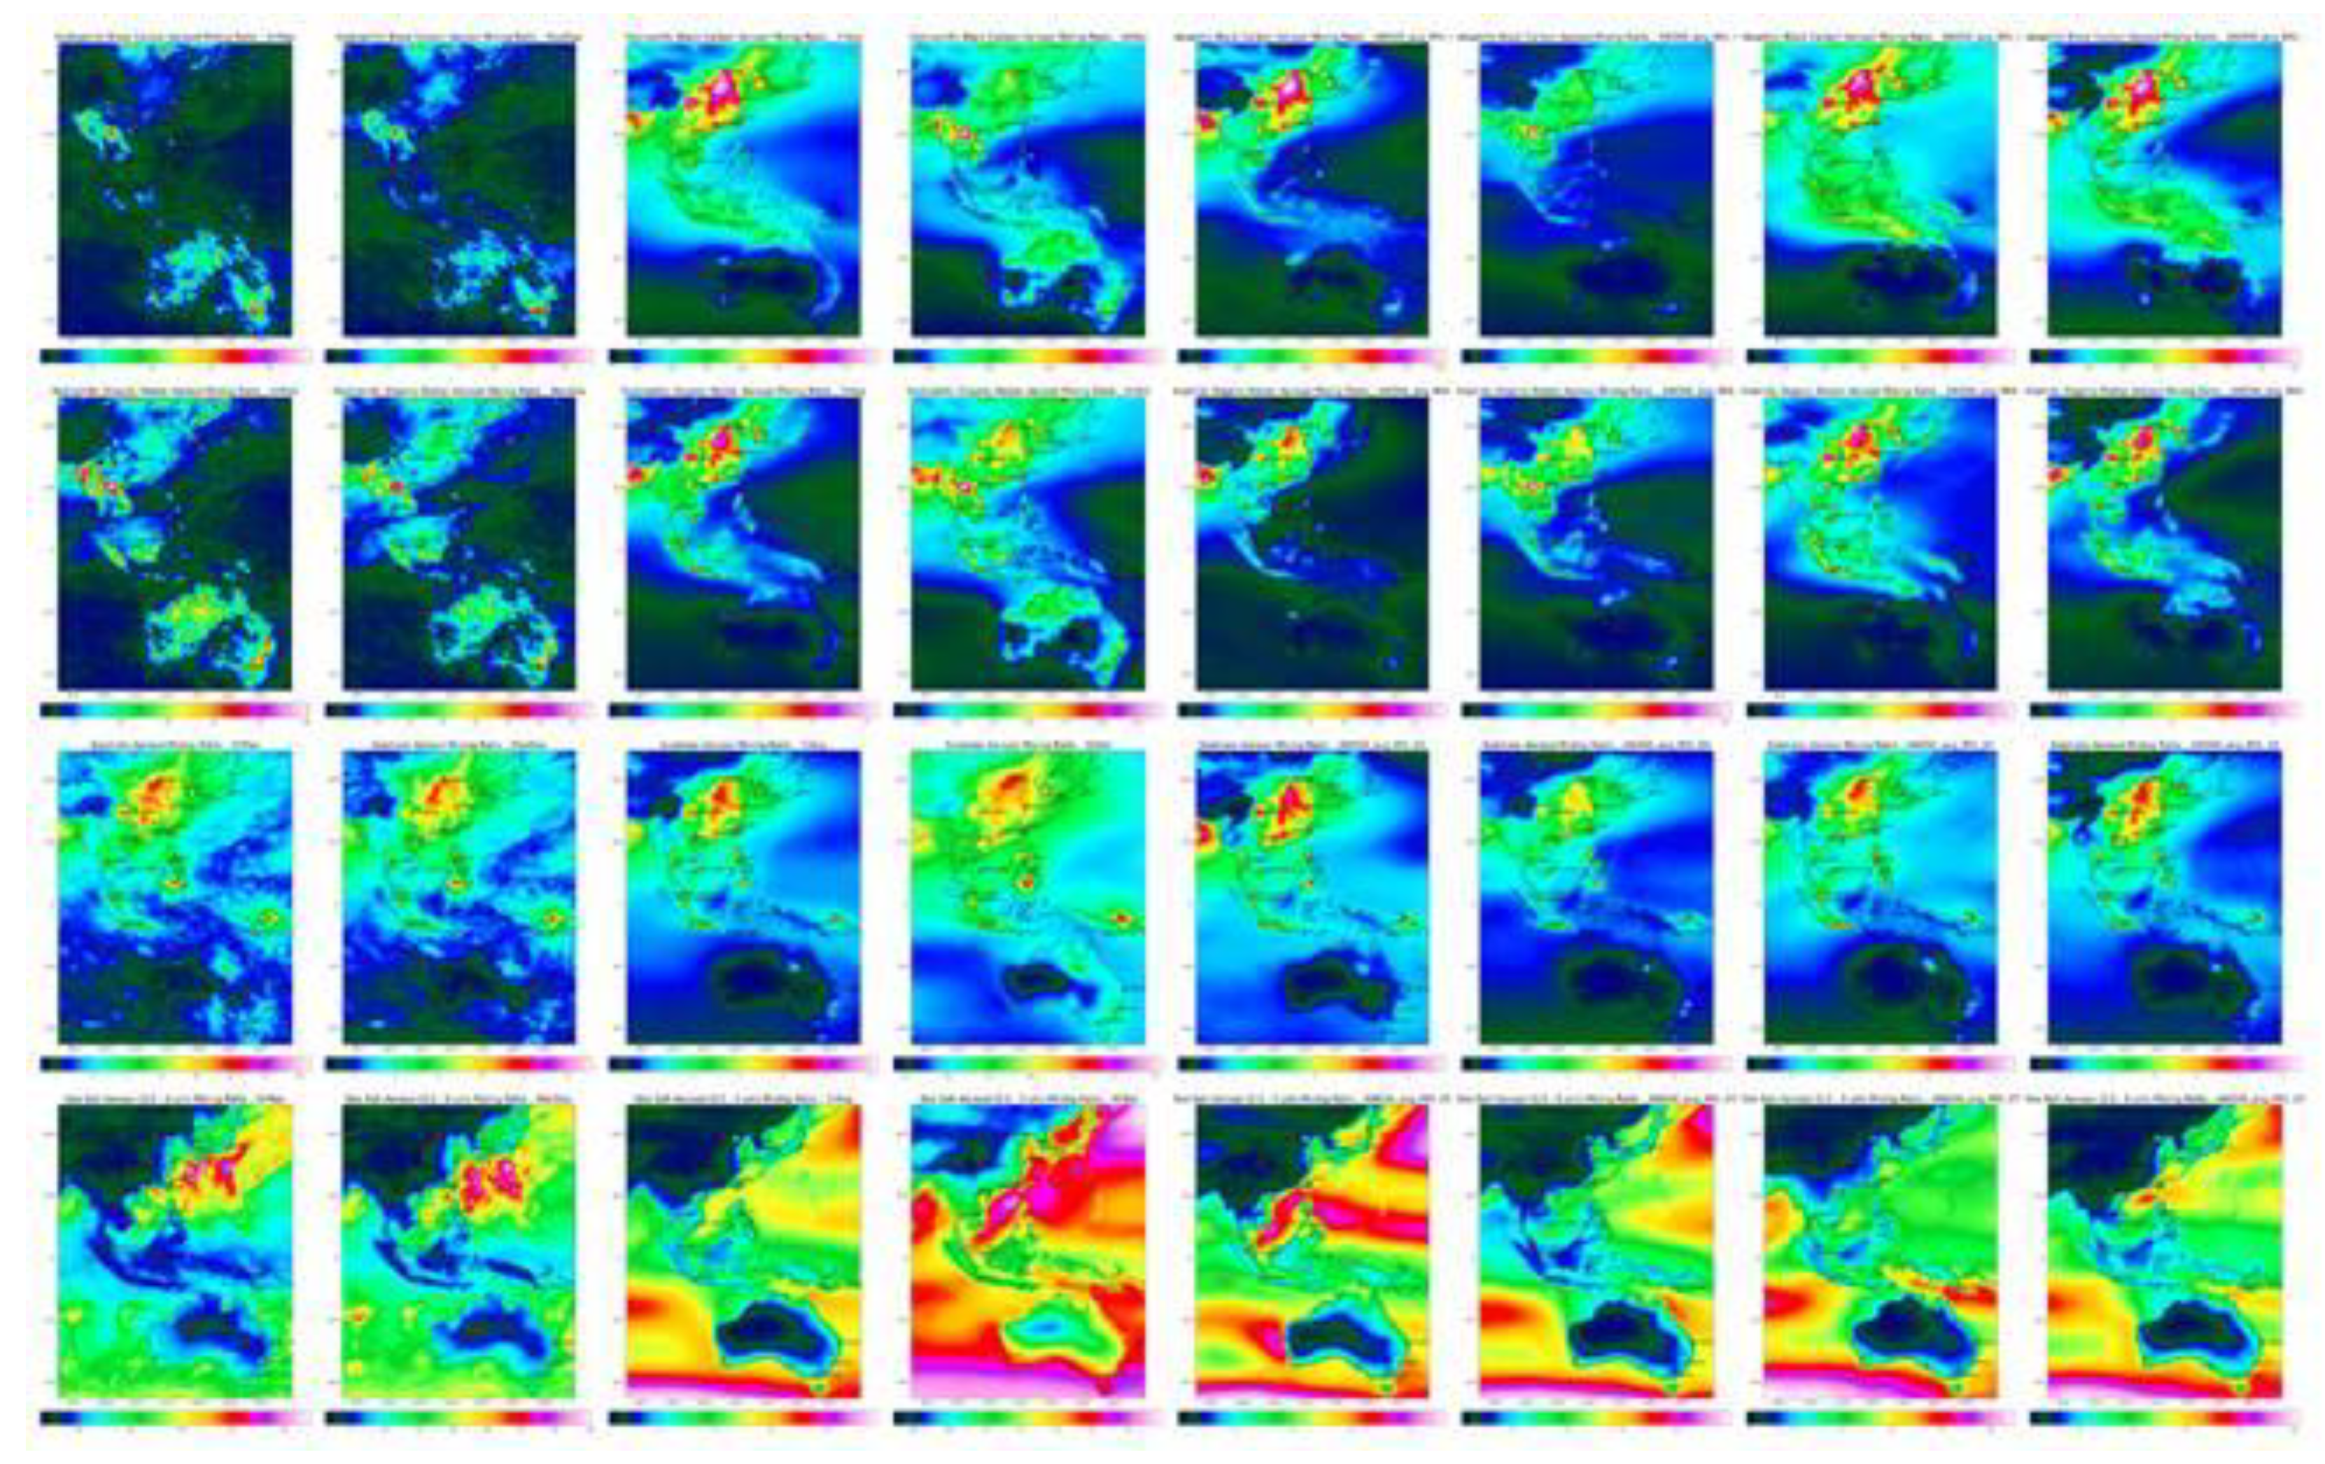
Figure 7.
Isopleths of NO, isoprene, formaldehyde, and ethane (by row) Columns are Max hourly, Max daily, Annual average, Std Dev, Mean: January, April, July, October.
Figure 7.
Isopleths of NO, isoprene, formaldehyde, and ethane (by row) Columns are Max hourly, Max daily, Annual average, Std Dev, Mean: January, April, July, October.
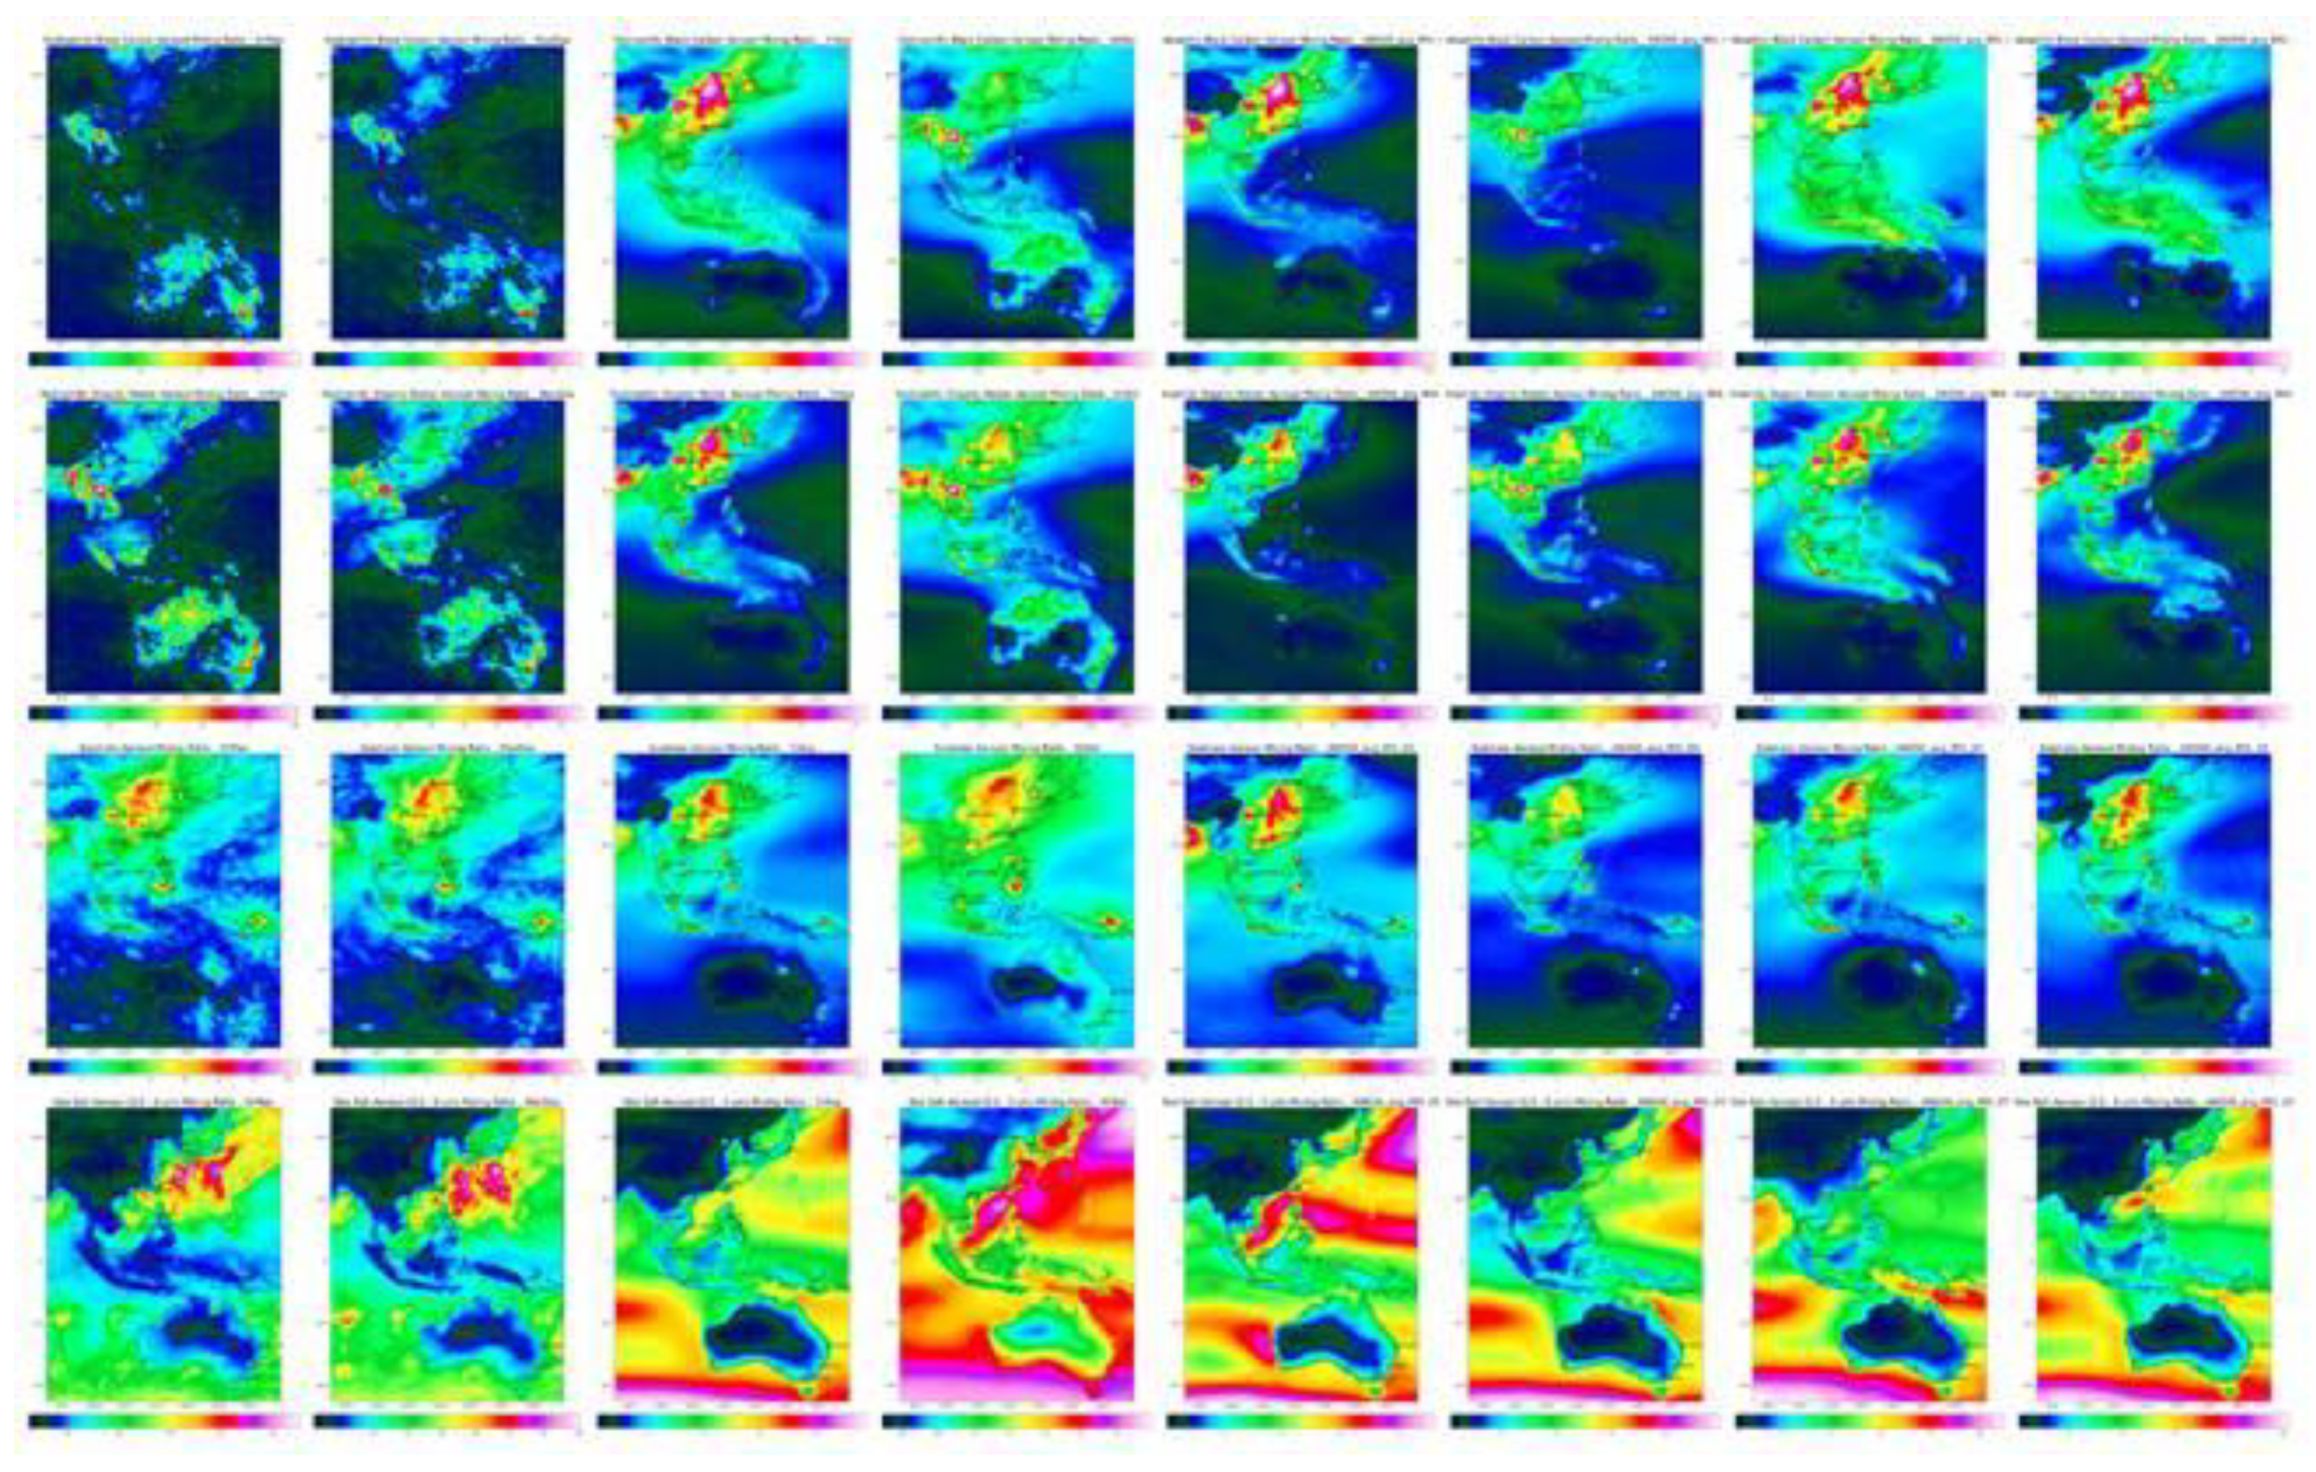
Figure 8.
Vertical distribution ratio GLC/AOD of specific humidity (g/m2), sea spray, dust aerosol, organic material, black carbon, and sulphate aerosol (unitless 0 to 1 E6).
Figure 8.
Vertical distribution ratio GLC/AOD of specific humidity (g/m2), sea spray, dust aerosol, organic material, black carbon, and sulphate aerosol (unitless 0 to 1 E6).
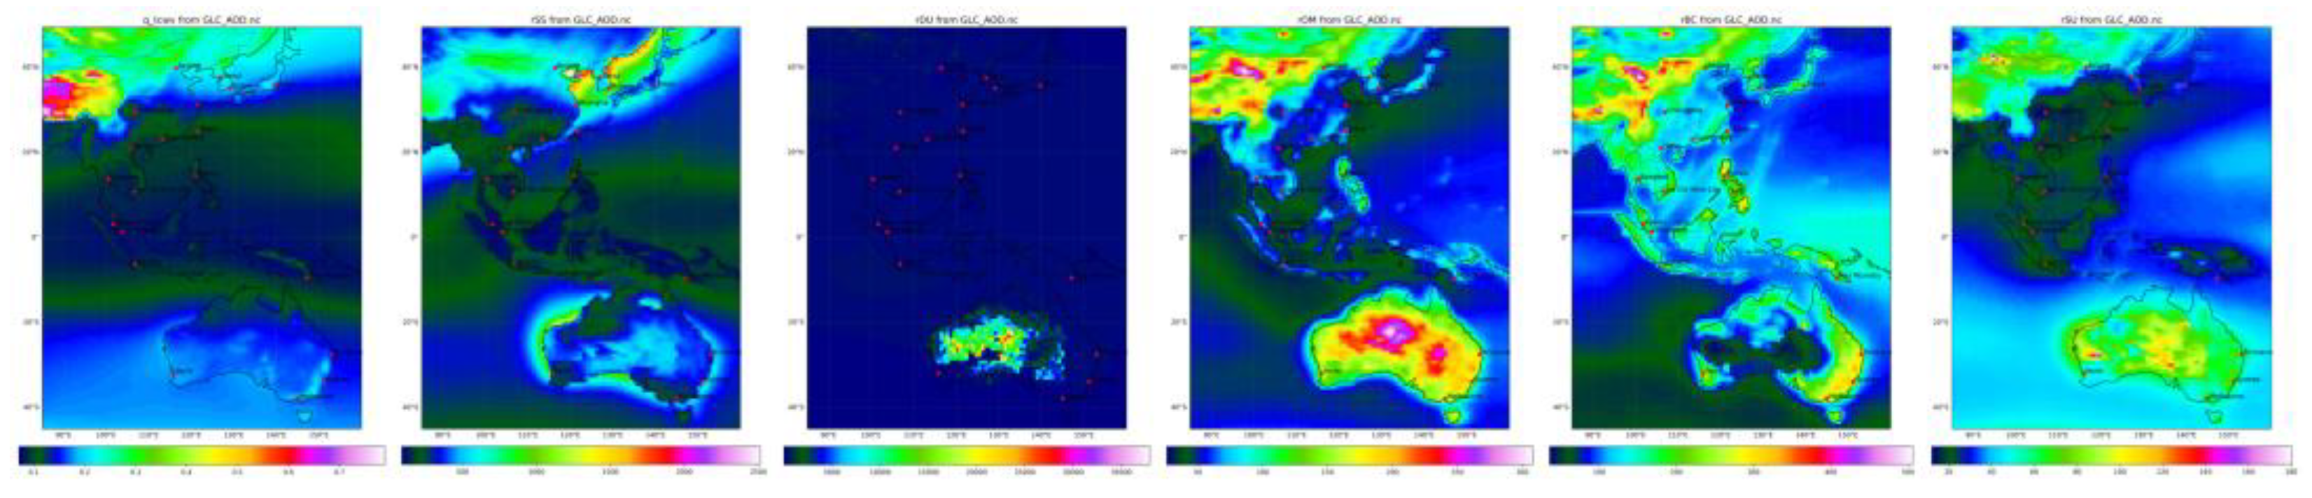
Figure 9.
Annual Analysis of Anomalies for 2016 to 2023 (columns) for the criteria pollutants NO2, SO2, PM2.5, PM10.
Figure 9.
Annual Analysis of Anomalies for 2016 to 2023 (columns) for the criteria pollutants NO2, SO2, PM2.5, PM10.
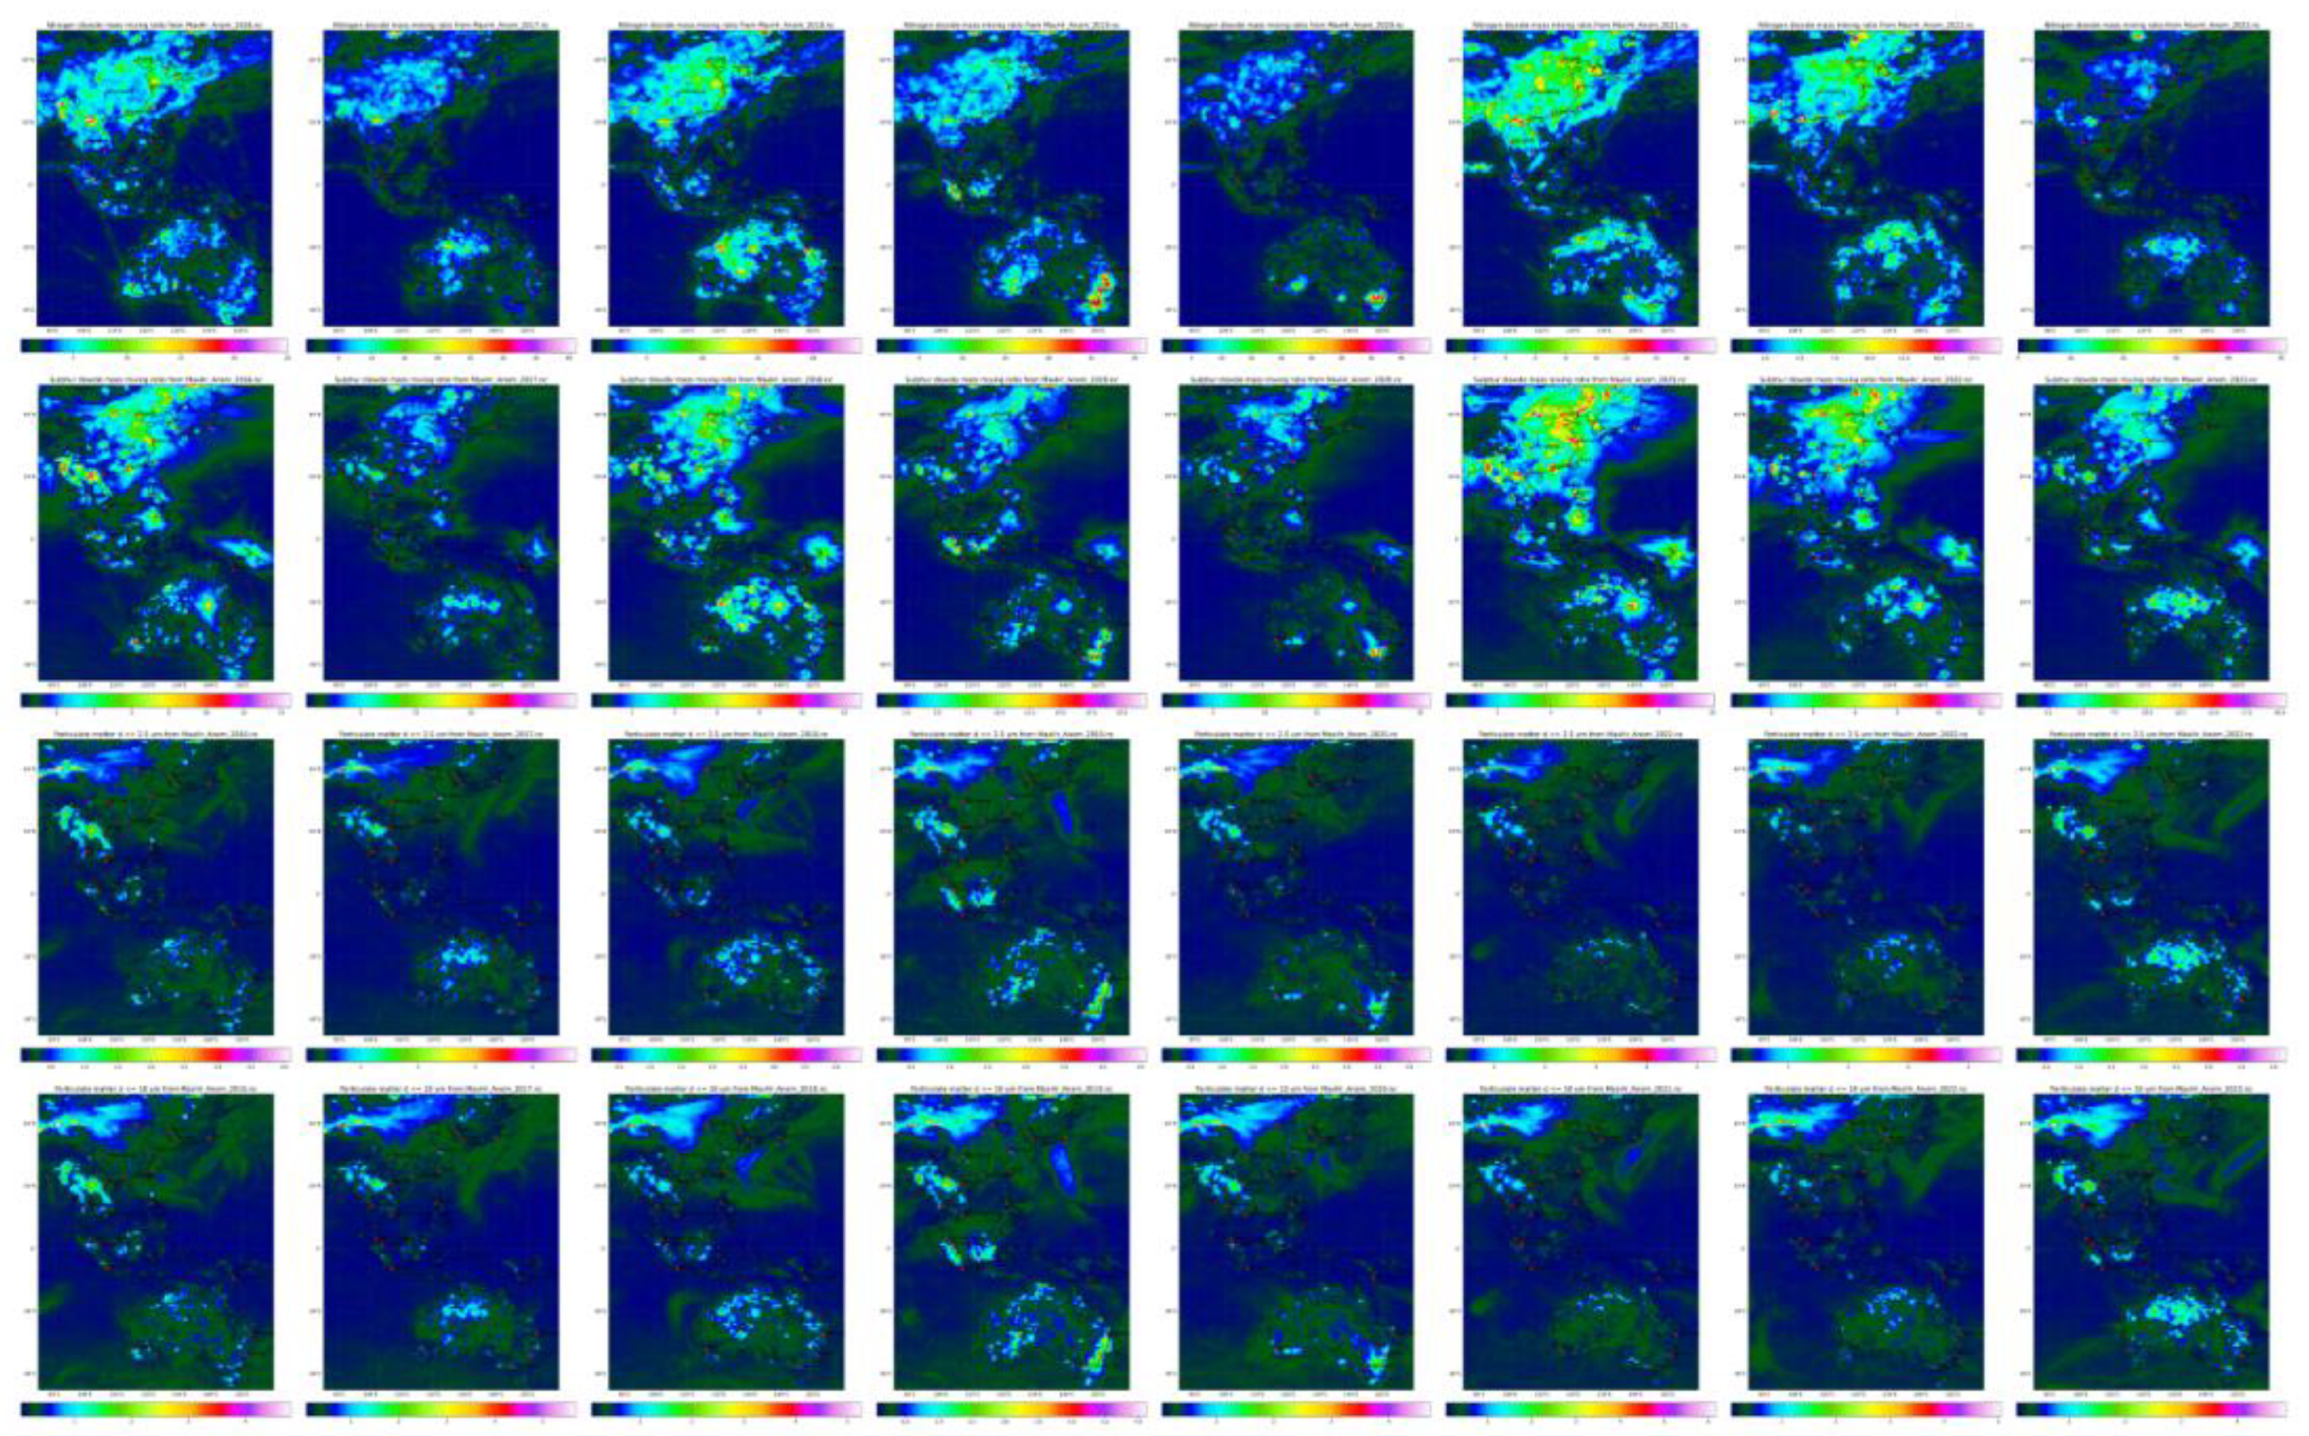
Figure 10.
Timeseries of Maximum Hourly Concentration per Day for the pollutants (columns) NO2, SO2, PM2.5, PM10, OC, BC for the cities (rows) Sydney, Melbourne, Perth, Beijing, Shanghai, Guangdong, Kuala Lumpur, Bangkok, Hanoi over the eight-year period.
Figure 10.
Timeseries of Maximum Hourly Concentration per Day for the pollutants (columns) NO2, SO2, PM2.5, PM10, OC, BC for the cities (rows) Sydney, Melbourne, Perth, Beijing, Shanghai, Guangdong, Kuala Lumpur, Bangkok, Hanoi over the eight-year period.
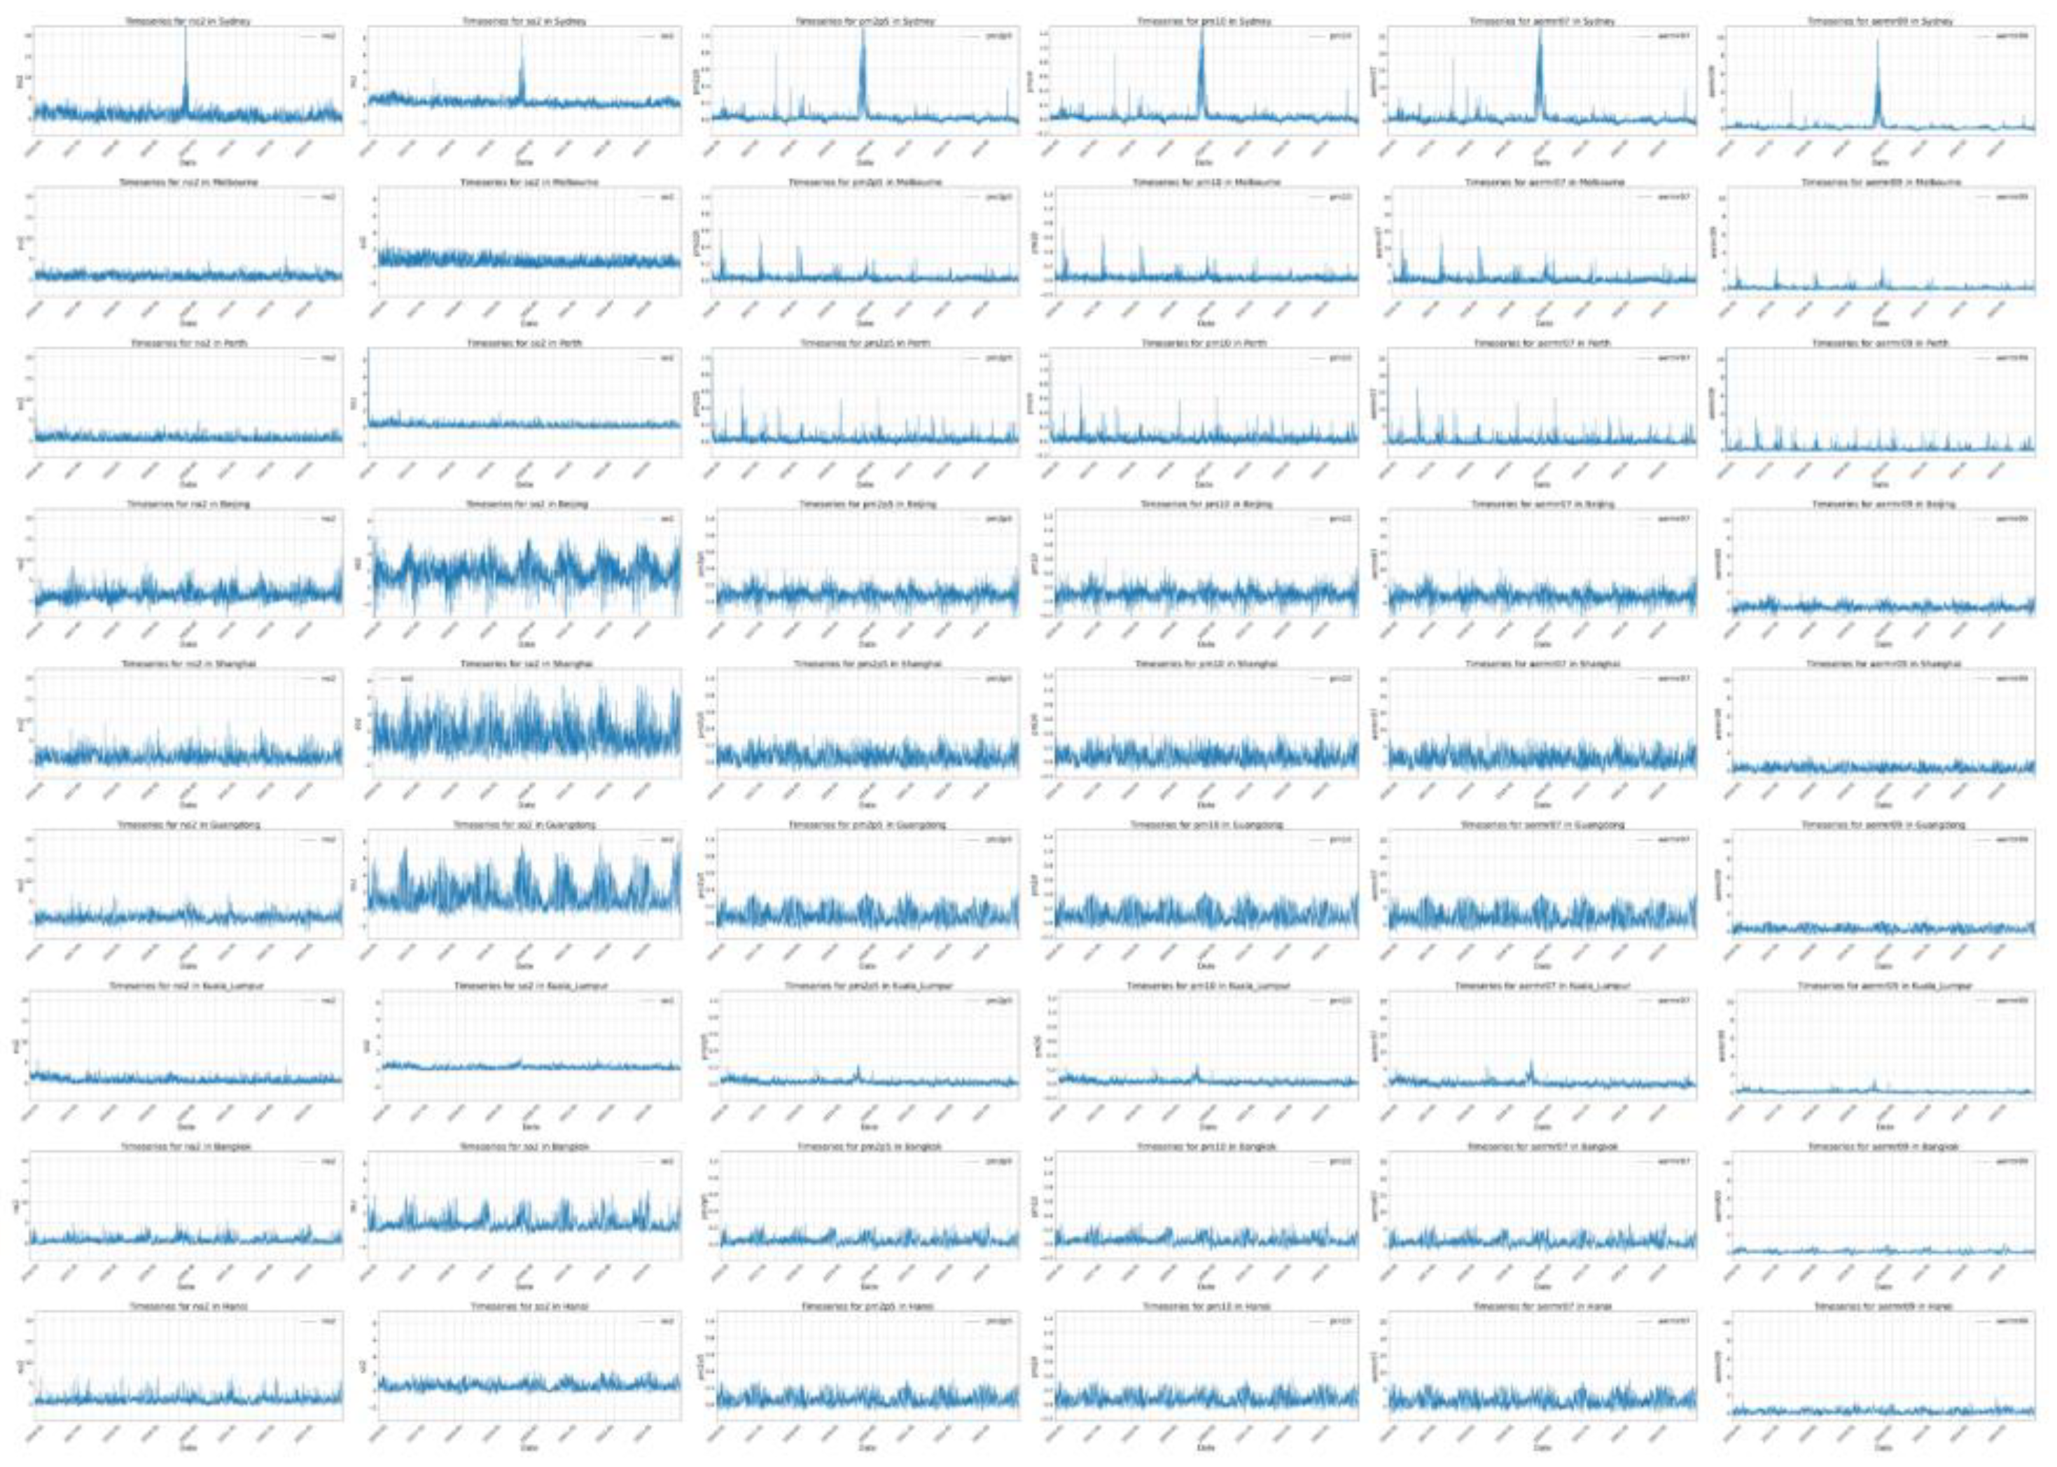
Figure 11.
Correlation Matrix analysis for the meteorological parameters (columns=X) of msl, 1/T (Kelvin), U10, V10, q and the GLC (rows=Y) of NO2, SO2, PM1, PM2.5, PM10 over the eight-year period.
Figure 11.
Correlation Matrix analysis for the meteorological parameters (columns=X) of msl, 1/T (Kelvin), U10, V10, q and the GLC (rows=Y) of NO2, SO2, PM1, PM2.5, PM10 over the eight-year period.

Figure 12.
Jacobian Matrix (LOG dY/dX) analysis for the meteorological parameters (columns=X) of msl, 1/T (Kelvin), U10, V10, q and the GLC (rows=Y) of NO2, SO2, PM1, PM2.5, PM10 over the eight-year period.
Figure 12.
Jacobian Matrix (LOG dY/dX) analysis for the meteorological parameters (columns=X) of msl, 1/T (Kelvin), U10, V10, q and the GLC (rows=Y) of NO2, SO2, PM1, PM2.5, PM10 over the eight-year period.


Table 1.
Data Statistics across the study region.
| Parameter | CAMS | HourMin | HourMax | DayMax | YearMean | Hour Std |
|---|---|---|---|---|---|---|
| Meteorological parameters | ||||||
| 2 metre dewpoint temperature (°C ) | d2m | -1.36 | 24.49 | 23.51 | 14.54 | 1.96 |
| Mean sea level pressure (kPa) | msl | 98.93 | 103.08 | 102.87 | 101.33 | 0.71 |
| Specific humidity (g/kg) | q | 2.07 | 4.39 | 4.28 | 3.31 | 0.62 |
| Temperature (°C ) | t | 7.13 | 30.55 | 28.22 | 19.85 | 1.85 |
| 2 metre temperature (°C ) | t2m | 7.25 | 31.02 | 28.34 | 20.10 | 1.87 |
| Total column water vapour (kg/m2) | tcwv | 9.60 | 65.39 | 61.05 | 31.86 | 3.09 |
| 10 metre U wind component (m/s) | u10 | -13.02 | 14.25 | 11.00 | -0.54 | 1.85 |
| 10 metre V wind component (m/s) | v10 | -13.25 | 13.53 | 10.48 | 0.48 | 1.81 |
| Criteria Pollutants (µg/kg PM µg/m3) | ||||||
| Carbon monoxide mass mixing ratio | co | 38.05 | 1373.0 | 754.93 | 110.44 | 1.89 |
| Ozone mass mixing ratio (full chemistry scheme) | go3 | 8.84 | 142.44 | 105.97 | 45.80 | 1.14 |
| Nitrogen dioxide mass mixing ratio | no2 | 0.00 | 18.65 | 6.77 | 0.69 | 0.30 |
| Particulate matter d <= 1 um | pm1 | 0.00 | 116.92 | 60.84 | 4.99 | 29.05 |
| Particulate matter d <= 2.5 um | pm2p5 | 0.00 | 198.35 | 105.16 | 11.24 | 41.80 |
| Particulate matter d <= 10 um | pm10 | 0.00 | 315.69 | 166.03 | 17.86 | 53.80 |
| Sulphur dioxide mass mixing ratio | so2 | 0.02 | 8.47 | 4.34 | 0.63 | 0.25 |
| Other Pollutants (µg/kg) | ||||||
| Ethane | c2h6 | 0.15 | 8.73 | 4.55 | 0.47 | 0.16 |
| Propane | c3h8 | 0.02 | 4.50 | 2.24 | 0.14 | 0.12 |
| Isoprene | c5h8 | 0.04 | 36.63 | 13.52 | 1.47 | 0.42 |
| Hydrogen peroxide | h2o2 | 0.00 | 6.10 | 3.64 | 0.67 | 0.30 |
| Formaldehyde | hcho | 0.14 | 10.67 | 5.17 | 0.78 | 0.22 |
| Nitric acid | hno3 | 0.00 | 8.19 | 3.79 | 0.21 | 0.23 |
| Nitrogen monoxide mass mixing ratio | no | 0.00 | 12.77 | 2.58 | 0.05 | 0.16 |
| Hydroxyl radical | oh | 0.00 | 0.00 | 0.00 | 0.00 | 0.00 |
| Peroxyacetyl nitrate | pan | 0.01 | 9.51 | 4.80 | 0.41 | 0.26 |
| GLC-AOD | ||||||
| Sea Salt Aerosol (0.03 - 0.5 um) Mixing Ratio | aermr01 | 0.00 | 3.02 | 1.82 | 0.17 | 0.20 |
| Sea Salt Aerosol (0.5 - 5 um) Mixing Ratio | aermr02 | 0.00 | 253.32 | 152.47 | 14.51 | 1.79 |
| Sea Salt Aerosol (5 - 20 um) Mixing Ratio | aermr03 | 0.00 | 207.73 | 120.80 | 7.11 | 1.40 |
| Dust Aerosol (0.03 - 0.55 um) Mixing Ratio | aermr04 | 0.00 | 18.22 | 10.63 | 0.29 | 0.45 |
| Dust Aerosol (0.55 - 0.9 um) Mixing Ratio | aermr05 | 0.00 | 38.59 | 21.52 | 0.55 | 0.64 |
| Dust Aerosol (0.9 - 20 um) Mixing Ratio | aermr06 | 0.00 | 80.23 | 35.48 | 0.70 | 0.71 |
| Hydrophilic Organic Matter Aerosol Mixing Ratio | aermr07 | 0.00 | 82.96 | 44.53 | 2.90 | 0.80 |
| Hydrophobic Organic Matter Aerosol Mixing Ratio | aermr08 | 0.00 | 41.80 | 17.78 | 0.84 | 0.43 |
| Hydrophilic Black Carbon Aerosol Mixing Ratio | aermr09 | 0.00 | 4.79 | 2.53 | 0.11 | 0.18 |
| Hydrophobic Black Carbon Aerosol Mixing Ratio | aermr10 | 0.00 | 5.44 | 2.19 | 0.04 | 0.12 |
| Sulphate Aerosol Mixing Ratio | aermr11 | 0.00 | 15.48 | 9.54 | 1.16 | 0.44 |
| Total Column (mg/m2) | ||||||
| GEMS Total column ozone | gtco3 | 4880.98 | 7738.72 | 7520.36 | 6029.06 | 2.68 |
| Total column ethane | tc_c2h6 | 1.42 | 14.35 | 11.19 | 2.79 | 0.24 |
| Total column propane | tc_c3h8 | 0.12 | 6.28 | 4.50 | 0.48 | 0.19 |
| Total column isoprene | tc_c5h8 | 0.02 | 16.10 | 9.37 | 0.64 | 0.33 |
| Total column methane | tc_ch4 | 9415.60 | 9966.03 | 9944.68 | 9713.68 | 0.39 |
| Total column hydrogen peroxide | tc_h2o2 | 0.27 | 34.59 | 28.48 | 6.79 | 0.70 |
| Total column nitric acid | tc_hno3 | 0.36 | 26.86 | 18.99 | 2.53 | 0.44 |
| Total column nitrogen monoxide | tc_no | 0.00 | 3.29 | 0.83 | 0.19 | 0.40 |
| Total column hydroxyl radical | tc_oh | 0.00 | 0.01 | 0.00 | 0.00 | 0.02 |
| Total column peroxyacetyl nitrate | tc_pan | 1.11 | 28.84 | 20.65 | 4.97 | 0.43 |
| Total column Carbon monoxide | tcco | 405.9 | 2678.6 | 2161.8 | 726.7 | 2.7 |
| Total column Formaldehyde | tchcho | 0.61 | 11.89 | 8.04 | 2.07 | 0.27 |
| Total column Nitrogen dioxide | tcno2 | 0.29 | 10.12 | 5.09 | 1.40 | 0.29 |
| Total column Sulphur dioxide | tcso2 | 0.10 | 9.56 | 6.37 | 0.93 | 0.28 |
| AOD | ||||||
| Black Carbon Aerosol Optical Depth at 550nm | bcaod550 | 0.000 | 0.141 | 0.096 | 0.006 | 0.077 |
| Dust Aerosol Optical Depth at 550nm | duaod550 | 0.000 | 0.440 | 0.279 | 0.016 | 0.130 |
| Organic Matter Aerosol Optical Depth at 550nm | omaod550 | 0.002 | 0.845 | 0.606 | 0.062 | 0.218 |
| Sea Salt Aerosol Optical Depth at 550nm | ssaod550 | 0.000 | 0.410 | 0.252 | 0.034 | 0.156 |
| Sulphate Aerosol Optical Depth at 550nm | suaod550 | 0.001 | 0.500 | 0.318 | 0.051 | 0.180 |
| Total Aerosol Optical Depth at 469nm | aod469 | 0.006 | 1.772 | 1.239 | 0.197 | 0.344 |
| Total Aerosol Optical Depth at 670nm | aod670 | 0.004 | 1.261 | 0.857 | 0.139 | 0.291 |
| Total Aerosol Optical Depth at 865nm | aod865 | 0.003 | 1.031 | 0.683 | 0.109 | 0.262 |
| Total Aerosol Optical Depth at 1240nm | aod1240 | 0.002 | 0.847 | 0.542 | 0.079 | 0.231 |
Disclaimer/Publisher’s Note: The statements, opinions and data contained in all publications are solely those of the individual author(s) and contributor(s) and not of MDPI and/or the editor(s). MDPI and/or the editor(s) disclaim responsibility for any injury to people or property resulting from any ideas, methods, instructions or products referred to in the content. |
© 2024 by the authors. Licensee MDPI, Basel, Switzerland. This article is an open access article distributed under the terms and conditions of the Creative Commons Attribution (CC BY) license (http://creativecommons.org/licenses/by/4.0/).
Copyright: This open access article is published under a Creative Commons CC BY 4.0 license, which permit the free download, distribution, and reuse, provided that the author and preprint are cited in any reuse.


