Submitted:
22 June 2024
Posted:
24 June 2024
Read the latest preprint version here
Abstract
The purpose of this study is to investigate the influence of heat stress on some biochemical parameters in the blood of dairy cows raised in Bulgaria. The study was conducted on a dairy farm with a capacity of 500 cows, Holstein breed, raised in free-group housing in individual resting boxes. The research was carried out over three seasons: spring, summer, and autumn, with a total of 90 blood samples collected from the cows raised on the farm - 30 blood samples for each season, including cows from the 30th to the 60th day of lactation. Temperature and humidity data were obtained from the nearest meteorological station to the farm. Based on this data, the minimum, average, and maximum values of the temperature-humidity index were calculated. The analysis of variance revealed that the month of the study significantly influenced the following blood parameters: glucose, urea, total protein, cortisol, prolactin, and Ca (P < 0.001). Analysis of the data expressed by LS mean values clearly shows that during the hot months, dairy cows experience a deficit of energy from carbohydrate sources, which they compensate for from other non-carbohydrate sources. Confirmation of this is seen in the blood glucose values, which during the summer are 1.50 mmol/l, approximately twice as low as the values measured during spring and autumn. Regarding urea concentration, a final product of protein metabolism, the values recorded during the summer are 5.3 mmol/l, 1.5 times higher compared to other study periods. As a result of the metabolic load on the liver, the values of hepatic enzymes (ASAT and ALAT) decrease during the summer months, respectively to 93.92 and 17.68 U/L. Cortisol levels in the blood during the summer were registered at 50.92 nmol/l, indicating that cows are under stress. Values for prolactin are of interest, with the highest values being recorded in spring - 1.09 mlU/I. During the summer and autumn studies, the values are 0.99 and 0.89 mlU/I, respectively. A similar trend of decreasing values from spring to autumn season is observed in total blood protein, namely 89.93; 81.99, and 74.36 g/l.
Keywords:
dairy cows
; heat stress
; blood
; biochemical parameters
1. Introduction
In our time, we are witnessing a noticeable global warming, resulting in an increase in ambient temperature even in more northern latitudes with a moderate climate [1,2,3]. An intergovernmental report on climate change indicates that the Earth’s temperature has risen by 1.2 ºC since the Industrial Revolution to the present day [4]. On the other hand, in recent decades, there has been increasingly intensive selection in dairy cattle farming to increase productivity. The lactation period also significantly affects the metabolism of dairy cows [5]. All of this makes dairy cows increasingly susceptible to the impending climate changes associated with global warming [6], and the welfare of these animals increasingly depends on strategies to alleviate heat stress [7].
Studying the biological mechanisms occurring during heat stress (HS) in cows is of crucial importance for making the right decisions to mitigate the negative impact of HS on animal productivity [6]. Modern dairy cows are highly productive animals with a very intensive metabolism. Therefore, an in-depth analysis of serum parameters can provide explanations for the physiological changes that occur under HS conditions [8]. Blood biochemical parameters provide objective information about the biophysical and biochemical processes occurring in the cows’ bodies [8]. Mylostyvyi & Sejian [9] demonstrate that environmental conditions are one of the main stress factors affecting hematological and chemical parameters in cows’ blood. Blood tests are valuable because they provide information about the cows’ condition before clinical signs of disease or different types of stress occur and can be used for the diagnosis and prevention of these conditions [10].
Given the above and the relatively small number of similar studies in recent years on dairy cows in Bulgaria, it gives us grounds to conduct a study on the influence of heat stress on some blood biochemical parameters in dairy cows raised in Bulgaria
2. Materials and Methods
The study was conducted at a cattle farm located in Central Southern Bulgaria. The farm has a capacity of 500 cows, Holstein breed. The cows are raised in free-group housing in individual boxes in an open-sided barn (shed-type). They are grouped according to lactation period and physiological condition. Feeding is ad libitum with a total mixed ration tailored to their physiological condition and milk yield level. The average milk yield per cow for a 305-day lactation period is 10,000 kg.
The study was conducted over three seasons: spring, summer, and autumn, with 30 blood samples taken in each season, totaling 90 samples from the cows raised on the farm. Due to hemolysis occurring in one of the blood samples taken, it was discarded. Thus, the total number of processed samples was 89. The cows included in the study were from the first to the third lactation, with 31 cows in the first, 28 in the second, and 30 in the third lactation. The cows included in the study were from the 30th to the 90th day of lactation.
Blood samples were taken once for each season from the tail vein during routine veterinary monitoring of the cows’ health status on the farm, specifically on March 17, July 26, and October 21, 2022.
Climate data for the farm area, including temperature and humidity, were obtained from the nearest Meteorological Station, located in the city of Plovdiv. The data are for the year 2022.
Temperature and humidity values were used to calculate the Temperature-Humidity Index (THI) using the formula by Tom (1959):
where: T0 is the air temperature in ºC, B0 is the percentage humidity.
0.8 × T0 + (B0/100) × (T0 + 14.4) + 46.4,
Blood samples were analyzed in a specialized laboratory, Zinvest (Stara Zagora). The following parameters were examined:
- Glucose - hexokinase method,
- Triglycerides - GPO-PAP method,
- Urea - Uryase/GLDH method,
- Total protein - Biuret End Point method,
- ASAT, ALAT, GGT, and alkaline phosphatase - enzymatic IFCC method at 37°C,
- Cortisol - ECLIA method,
- Inorganic phosphorus and calcium - ammonium phosphomolybdate UV method and Arsenaso III method.
For this purpose, Roche Cobas Integra 400+ and Roche Cobas E 411 apparatus were used.
A study was conducted to determine the concentrations of prolactin and cortisol to assess the influence of heat stress on certain hormones, using the Roche Cobas E 411 instrument and ECLIA method.
For basic statistical data processing, the MS Excel package was used, and for obtaining mean values, errors, and analysis of variance, the respective modules of STATISTICA by StatSoft (Copyright 1990-1995 Microsoft Corp.) were used.
To evaluate the influence of controlled factors on all blood parameters, the following model was used:
where:
Yijkl = μ + Mi + Lj + eijkl
Yijkl is the dependent variable (each of the blood parameters), μ is the model mean, Mi is the effect of the month of study, Lj is the effect of lactation order, and eijkl is the random residual effect.
Least squares means (LSM) were obtained by ANOVA for the model based on fixed factor classes.
3. Results
The average values and variation of the main climatic indicators included in the study for the farm area are presented in Table 1. It can be seen that they are characteristic of a moderately continental climate. During the variation of the average daily temperature, only in the summer season are values recorded above the thermal comfort threshold of 25 °C. For maximum air temperatures, values above 25 °C are recorded in all seasons except winter. There are no significant differences in the percentage of air humidity across seasons. The average daily values for the four seasons range from 63.21% to 77%, with the highest average value being in the winter season, as shown in Table 1.
The climatic indicator that more accurately characterizes the environmental conditions is the temperature-humidity index (THI), which is calculated by incorporating both temperature and air humidity percentage. The average daily values of THI indicate that during the summer season, the cows included in the study experience heat stress, with THI values around 72. Maximum THI values above 72 are recorded in all seasons except winter. However, it should be noted that in the spring and autumn seasons, these values are generally recorded for a period of one to three days and are not expected to have a serious impact on the metabolism of the cows included in the study.
Figure 1 presents the maximum and average daily values for the THI by calendar month. The months in which blood samples were taken from the animals included in the study are marked in red. In March, July, and October, when the blood samples were taken, the average THI values were 44.6, 72.8, and 58.1, respectively. The maximum THI values for the same months were 52.0, 85.6, and 70.2, respectively. From the presented data, it can be seen that the cows with blood samples taken in July (summer season) were in conditions of heat stress.
The summarized THI values for the month before and during the study are presented in Table 2. For the samples taken in March, the average daily THI values affecting the cows ranged from 44.2 (in February) to 44.6 (in March), with a maximum of 52.0. For the samples taken in July, the corresponding values ranged from 70.1 (in June) to 72.8 (in July), and from 82 to 85.6, respectively. For the samples taken in November, the average daily values ranged from 50.0 to 58.1 in November and October, respectively, with maximum values from 70.2 to 59.8. Due to the cooling weather in November, it is logical for the THI values in October to be higher than those in November.
Table 3 presents the reference, mean values, and variation of the investigated blood parameters in the cows. From the presented data, it can be seen that the values of triglycerides are significantly lower than the accepted norms. Other indicators showing deviations from the norms include GGT with 32.61 U/I with elevated values, cortisol with 32.9 nmol/l with lower values, and phosphorus with 2.99 mmol/l - higher than the accepted norms. For almost half of the investigated blood parameters, the mean values are within the norm, but individual animals show values outside the norm, both higher and lower. Excessively low values, below the physiological norm, are recorded for blood sugar (up to 0.52 mmol/l), triglycerides (up to 0.03 mmol/l), urea (up to 1.83 mmol/l), cortisol (up to 2.10 mmol/l), and calcium (up to 2.0 mmol/l). High values, above the norm, are recorded for GGT (up to 171.9 U/I) and alkaline phosphatase (up to 185.7 U/I), and for total protein, aspartate aminotransferase (ASAT), alanine aminotransferase (ALAT), cortisol, and phosphorus, values both lower and higher than the physiological norm are recorded.
Table 4 presents an analysis of variance for the influence of controlled factors on the values of the biochemical blood parameters. From this analysis, it is established that the month of the study (THI values) has a significant influence on the investigated indicators. A significant effect of the month of the study is not found only on triglycerides, GGT, alkaline phosphatase, and phosphorus. THI values for the month of the study have a significant effect on the levels of glucose, urea, total protein, prolactin, cortisol, and calcium (P<0.001) and on the levels of ASAT and ALAT in the cows’ blood (P<0.05). The consecutive lactation affects only the values of GGT, ASAT, ALAT, and prolactin (P<0.05).
In order to optimize the graphical representation of the data from the analysis of variance, some indicators that share the same units of measurement are presented in a common figure.
From the data presented in Figure 2, it can be observed that in animals studied in July, the values of glucose in the cows’ blood are very low (1.53 mmol/l) and increase to 2.77 in those studied in November and 3.28 mmol/l in those studied in March, respectively. From the results presented in Figure 2, it is clear that the values of urea in the blood of cows studied in July are much higher compared to those in November and March. The values are 5.30, compared to 3.12 and 3.57 mmol/l, respectively.
Figure 3 presents the least squares mean values of total protein in the blood of cows during the studied months. From the data, it can be seen that the lowest values were recorded in November, while the highest were in March – 74.36 and 89.93 g/l, respectively.
Figure 4 presents the least squares mean values of prolactin in the blood (mIU/L) depending on the month of recording. From the data, it can be seen that the lowest values are recorded in November, while the highest are in March. During the summer, values of 0.99 (mIU/L) were recorded.
Figure 5 presents the data of the least squares mean values of cortisol depending on the month of recording. A clear trend is observed where values are highest in July (50.92 nmol/l), and lowest in November (15.80 nmol/l).
Figure 6 presents the least squares mean values of ALAT and ASAT by months of study. From the data in the figure, it can be seen that the values for March and November for both enzymes are higher than those reported in July. For ASAT, the highest values were reported in November at 115.62, followed by 106.53 in March, and the lowest in July at 93.92. For ALAT, the highest values were recorded in March at 21.19, followed by values in November at 20.98, and the lowest in July at 17.68.
4. Discussion
From the data presented in Table 1, it can be seen that winter is relatively mild – with average daily temperatures around 4 °C, ranging from -4.0 to 12.7 °C, and maximum temperatures reaching up to 21.1 °C. These air temperature values are not problematic for cattle, particularly dairy cows, as they fall within the thermal comfort range of 25 °C. For spring and autumn, high average daily temperatures are not recorded, as both seasons are similar in this regard. However, significant high values are recorded for maximum daily temperatures in both spring – up to 32.4 °C, and autumn – up to 35.9 °C. The most serious problem with air temperatures occurs during the summer season. The average daily temperature for the season is 24.27 °C, reaching an average of 28.6 °C. The average maximum temperature for the season is slightly above 30 °C, reaching up to 38.6 °C.
Environmental temperatures between 0°C and 25°C have been established as optimal for dairy cows [11], but ambient temperatures above 25 °C cause an increase in their body temperature, leading to heat stress. The climate indicator that more accurately characterizes environmental conditions is the temperature-humidity index (THI), calculated by incorporating both temperature and air humidity percentage. Solar radiation, air temperature (T), and humidity percentage (RH) are the most important climatic variables explaining heat stress [12]. Since temperature and humidity are commonly measured variables at every meteorological station, the temperature-humidity index (THI) is the most widely used indicator for assessing heat stress in animals.
For the seasons of spring, autumn, and winter, the average daily THI values are acceptable from the perspective of animal comfort – ranging from 42.91 for winter to 58.23 for autumn. An exception is the summer season, with an average daily THI value of 71.78, reaching up to 76.96. High values are also recorded in spring (up to 71.74) and autumn (up to 72.52). Even more threatening are the maximum THI values reached, especially in summer, averaging 84.78 for the day with maximum values of 94.87. Similarly risky maximum values are recorded in spring – 89.24, and in autumn – 91.85. (Table 1). In most cases, for the spring and autumn seasons, these are values recorded for only a few days (1-3 days), which probably will not affect the metabolism of the cows included in the study.
Gantner et al. [13] state that THI values during spring and summer in the three regions (Eastern, Mediterranean, and Central) of Croatia exceed 72, during which cows are at risk of developing heat stress. During autumn and winter, when THI values are usually lower than 72, cows rarely experience heat stress. Armstrong [14] classifies HS into three types according to THI: mild (72 to 78 units), moderate (79 to 89 units), and severe (90 to 98 units). According to several authors, THI above 72 is considered a threshold for inducing heat stress in the tropics [15,16], while in temperate zones, high-producing cows may be affected by heat stress even at THI values below 60 [17,18]. According to Blond et al. [19], THI values in Serbia, a country neighboring Bulgaria with a similar climate, range between 72 and 90 during June and July, representing moderate to severe heat stress.
Considering the reported THI values in the farm area, during summer, it can be said that cows are almost constantly exposed to thermal stress, and such conditions are noted during isolated periods in spring and autumn. Given that the building provides almost no protection (no shelter) from external conditions, the animals are at risk of HS.
Since blood samples were taken in a specific month of the season, the average daily and maximum THI values for each calendar month are presented in Figure 1, with values for months with blood samples marked in red. For March, both the average daily and maximum THI values are within the optimum range, averaging around and below 50. For November, the maximum THI values are nearly 70, and the daily average is almost 60. For July, both values fall within the risky zone. Daily averages are reported above 70, with maximum values exceeding 80. The model for assessing the effect of THI on blood parameters of cows includes the months when samples were taken. To account for the effect of thermal stress, especially on blood parameters, it needs to act over a certain period of time. This period is not always related to the effect of the entire season. For example, on animals sampled in March, the effect includes conditions from February and March, which have similar THI values (Figure 1), but not April and May (for the spring season), which have significantly higher values. The average daily THI values for the spring season (Table 1) are considerably higher than those for March, respectively - 54.54, compared to 44.6 for March, and maximum values of 65.01 compared to 52 for March.
The presented values in Table 2 show that cows sampled in July were exposed to HS (mild to moderate) long enough to expect consequences not only on physiological parameters but also on parameters related to the animals’ homeostasis. Considering the high milk yield of the cows from the studied farm, HS may also affect them at much lower values than 72. This means that cows in October may have experienced some HS, especially during the day when THI values reach 70.2 (Figure 1).
According to Zimbelman et al. [20], high-producing dairy cows decrease their milk productivity by approximately 68 under THI. It has been proven that cattle become more sensitive to HS with increasing productivity [16]. In fact, increasing daily milk yield from 35 kg to 45 kg increases sensitivity to HS and decreases the threshold temperature by 5°C [21]. This increased sensitivity may be explained by additional heat associated with synthesizing more milk.
Recent studies [22,23] report that a THI of 68 is already a critical value at which dairy cows will begin to show HS symptoms. Another study [24] found HS symptoms in high-producing dairy cows when the mean daily THI is above 68 units or when the minimum THI is above 65 units. The climate in which dairy cows are raised also plays an important role in determining the onset of HS based on THI, with negative effects of HS beginning at THI > 70 units in tropical conditions [16], and in moderate conditions at THI > 60 [25]. This suggests that the pressure from genetic selection for increased milk yield counteracts tolerance to HS in dairy cows [26].
According to Liu et al. [27], it is not suitable for all regions and farms to determine the state of heat stress based on whether THI exceeds 68 or 72 units. Specific issues need to be analyzed individually. Heat stress is the physiological response of a given cow to its thermal environment and is influenced not only by THI values but also varies among breeds, individuals, farms, and the perceived farming technology.
From the presented data (Table 3), it can be seen that triglyceride values are significantly lower than accepted norms. A study by Blond et al. [19] demonstrates a trend of lower values of this indicator in cows at the beginning of lactation at different THI values. In the current study, all investigated cows are at the beginning of lactation. It is striking that the average triglyceride values are significantly below the norms. This is likely due to the fact that most of the studied cows (60 out of 90) calved during months with heat stress or immediately after heat stress. A similar trend is supported by other authors [19,28]. Under conditions of heat stress, the activity of hepatic enzymes intensifies, leading to decreased cholesterol and triglyceride levels. This occurs due to functional loading of the liver combined with a negative energy balance in the early stage of lactation, which is likely present in the current study. The overall protein is slightly higher (82.11 g/l) compared to norms up to 80 (g/l). Our results support the hypothesis of Abbas et al. [29] that heat stress causes cows to catabolize proteins, releasing amino acids that the body uses to convert into glucose and consequently into energy. This is likely the reason for the higher values in this indicator.
As the results presented in Table 3 confirm on one hand and significantly differ from those of other authors on the other, an analysis of variance was conducted as presented in Table 4. This analysis reveals that the month of study (THI values) has a significant influence on the investigated indicators. Only triglycerides, GGT, alkaline phosphatase, and phosphorus do not show a significant effect of the study month. THI values for the study month have a significant effect on glucose, urea, total protein, prolactin, cortisol, and calcium levels (P<0.001) and on the levels of AST and ALT in cow blood (P<0.05). The lactation number only influences the values of GGT, AST, ALT, and prolactin (P<0.05).
Including lactation number as a factor in the model aims to obtain adjusted LS mean values for blood parameters, hence the effect will not be commented on.
Dairy cows in early lactation have little chance to cope with heat stress, and for this reason, it has the strongest effect on animals in the first 60 days after calving. According to Kendall and Webster [30], the season (respectively, the month of study) and the lactation stage significantly influence the regulation of body temperature in dairy cows. The negative energy balance in dairy cows in early lactation is further increased by the creation and emission of a higher amount of heat energy during the period when animals consume less food. This is why high-producing dairy cows are more sensitive to heat stress than cows with lower genetic potential for milk production [31] (Table 4).
The reason for the results presented in Figure 2 can be explained by the effect of heat stress under which the cows are during the summer and to some extent during the fall, as all cows included in the study across different seasons are balanced by lactation period and lactation number. Lipolysis and insulin resistance increase at the beginning of lactation to direct glucose to the udder to maintain lactation, and under heat stress, insulin sensitivity increases while lipolysis decreases, redirecting glucose to tissues [6]. Supporting this hypothesis and our obtained results are studies by Ivanova et al. [8]. The authors found glucose values ranging from 1.38 to 1.60 mmol/l under conditions of moderate heat stress. These results are due to changes in the metabolism of cows subjected to heat stress. It has been proven that under the influence of heat stress, basal insulin concentrations in the blood increase, as well as high values of the glucose tolerance test [32,33]. It is considered that this is an adaptive protective mechanism that occurs under the influence of stress factors [34]. According to Shahzad et al. [35], gluconeogenesis in lactating cows is much more intense during warm periods compared to the cold seasons of the year. Higher values of the temperature-humidity index (THI), according to the authors, force cows to intensify their metabolism while simultaneously reducing feed intake. In addition, the mammary gland requires glucose for lactose synthesis, and the body expends energy to control its body temperature – cooling. All of the above fully explains the low glucose values in the blood of cows during the summer season compared to the other two seasons.
Similar values of blood urea under heat stress are also observed by Blond et al. [19]. Although the recorded results for July do not exceed the accepted norms (2.8-8.5 mmol/l), there is a clear trend in the metabolism of proteins. It is known that amino acids in the blood are the main component for the synthesis of milk proteins. In many studies, changes in circulating amino acids in the blood during catabolic states, including HS, have been demonstrated [36,37] due to insulin resistance in peripheral tissues and the onset of gluconeogenesis from amino acids [38]. Heat stress leads to a decrease in milk protein values, which in turn requires more amino acids to maintain gluconeogenesis, but not for protein in the milk [37]. In the bodies of cows during heat stress, there is insufficient intake of dry matter, which leads to mobilization and utilization of resources from fat and muscle tissue. Similar to our results, Shwartz et al. [39] also demonstrate higher urea values in cows under HS. The main indicators of catabolic processes in muscles are 3-methyl-histidine and creatinine, both of which are elevated under HS according to Schneider et al. [40]. In conclusion, it can be argued that under HS, there is a change in nitrogen metabolism, leading to a decrease in milk protein values and increased blood urea values, and hence in milk [41].
Although the analysis of variance shows a significant influence of the season on blood calcium values (P<0.001), the graphical representation of the variation of this parameter (Figure 2) during the studied months is not substantial. Nevertheless, it should be noted that calcium values in July and November are lower than those in March – 2.33; 2.33 compared to 2.46 mmol/l, respectively. The explanation can be attributed to the occurring metabolic changes during HS, which lead to an increase in cellular concentrations of Ca+ [34] and a decrease in plasma concentrations. In a study by Joo et al. [42], calcium values in the bodies of cows during HS also decreased. According to the authors, HS causes a significant loss of minerals through fluid excretion, and it is known that calcium, along with sodium, are particularly important minerals for dairy cows. There are numerous presumed mechanisms according to which the decrease in blood calcium concentration leads to health problems, decreased uterine contractility, increased risk of negative energy balance, and suppression of immunity [43].
Our results for total blood protein values (Figure 3) confirm the findings of Ivanova et al. [8], who also found that with increasing THI values, total blood protein values decrease. The explanation for the obtained results presented in Figure 3 is related to the previously discussed values of urea, glucose, and gluconeogenesis. Due to the proven lower feed intake of cows during heat stress by many authors and the shortage of energy, it is necessary to be provided from other sources – fats and proteins. Heat stress leads to an increase in cellular permeability to calcium ions, which increases sensitivity to proteins during HS [44]. Thus, the efficiency of energy supply from proteins through gluconeogenesis during HS [45] is much higher compared to thermoneutral conditions, which may explain our results. In support of our claim are the results of Guo et al. [37], which demonstrate an increase in some amino acids and a decrease only in lysine amino acid in the blood of cows during HS. These claims may also explain the lower values of total blood protein in November. We assume that the cows studied in the fall, due to being in a dry period during the summer, have extensively used gluconeogenesis as an energy source for fetal development. It is well known that during the dry period, cows’ diets have low carbohydrate and protein values to prevent obesity and ketosis after calving. We believe that heat stress during the dry period is the main reason for the low values of total blood protein in cows studied in the fall.
Our results regarding the influence of HS on prolactin content in the blood do not confirm the findings of other authors, who demonstrate the opposite trend. The reason for hyperprolactinemia under HS conditions, according to Baumgard and Rhoads [34], is associated with insulin metabolism in cows as described earlier. This dependence between prolactin values and HS has been observed in both sexes [46]. On the other hand, the increase in prolactin values during HS is paradoxical, considering that it is a lactogenic hormone, and as a result of HS, a decrease in milk productivity is observed. The exact reason why HS causes an increase in prolactin is not known, but the following possibilities are presumed: due to increased sweating [47]; formation of heat shock proteins [48]; changes in water metabolism [49], and skin development [50]. According to other authors, the connection of prolactin with HS is related to insulin and proliferation of pancreatic β cells [51,52].
As both the data from this study and the literature review are not unanimous regarding all dependencies between HS and prolactin in the blood, we believe that further additional studies are necessary. Such studies are conducted at the molecular level to understand the connection between the hypothalamic-pituitary-mammary axis on one hand and the regulation of physiological response to heat stress on the other [52]. As a result of our study, it can be argued that prolonged exposure of dairy cows to milking leads to a decrease in prolactin values in the blood.
A similar trend of increasing cortisol levels in the blood during HS, presented in Figure 6, is also demonstrated by Blond et al. [19]. However, the values obtained by us for the month of July are approximately twice as high as the values reported by Blond et al. [19]. This is likely due to the fact that the authors’ study was conducted in the northern part of Serbia, where it is very likely that heat stress is not as pronounced as in our study. From the literature review, it becomes clear that cortisol is known as a stress hormone, playing a primary role in lactogenesis and maintaining lactation [54,55]. Together with prolactin, both hormones play a primary role in the immune response of dairy cows, stimulating proliferation and triggering the inflammatory response of peripheral lymphocytes [56,57,58]. It is well known that HS reduces the immune response of cows [59,60] and increases the secretion of cortisol and prolactin [61]. According to the authors, it is still unknown whether the negative effect of HS on immunity is related to changes in cortisol and prolactin secretion or to their immunomodulatory effects on proliferation or the anti-inflammatory response of immune cells or both taken together. This question has not yet been clarified, but it is a fact that during HS, dairy cows are more susceptible to infections.
The change in metabolic processes due to heat stress is associated with a change in the activity of certain enzymes, such as ALAT and ASAT, indicative of the functional status of the liver [62,63]. Although with lower significance, the THI values during the study months have a significant effect on the levels of ASAT and ALAT in the blood of cows (Figure 6).
According to some authors, during heat stress in dairy cows, the activity of hepatic enzymes increases, indicating functional stress from negative energy balance, inflammatory processes, and early lactation stages in cows [63]. Our results do not support the above statement. The lowest values for both hepatic enzymes are registered during the study in July – 93.92 and 17.68 U/l, respectively for ASAT and ALAT. Our findings support the data presented by Joo et al. [42], who also demonstrate a decrease in the values of both enzymes. The hepatic enzymes considered by us are accepted as indicators of liver function [64] and are associated with metabolic diseases such as ketosis [65]. Therefore, the data from our study presented in Figure 6 show that under HS conditions, dairy cows experience serious metabolic stress, affecting liver function, expressed by a decrease in the values of both hepatic enzymes.
5. Conclusions
The study reveals that high temperatures and subsequent heat stress in the country’s territory cause significant disruptions in the metabolism of dairy cows. These disruptions manifest as disturbances in energy supply from carbohydrate sources, leading to the need for energy provision from other non-carbohydrate sources. Consequently, the accumulation of waste metabolites such as urea is observed, along with potential impairments in liver function, which are evidenced by changes in the values of some hepatic enzymes. As a result of the stress experienced by the animals, changes in cortisol levels in the blood are also recorded, clearly indicating the presence of heat stress during the warm summer months. Regarding prolactin, the results of the current study suggest that further research is needed to fully explain the role of this hormone in the adaptation and response of dairy cows to heat stress.
Author Contributions
Conceptualization, M.S. and T.T.; methodology, T.P. and M.S.; software, M.S.; validation T.P.; formal analysis, T.P.; investigation, M.S.; resources, M.S.; data curation, T.P.; writing—original draft preparation, M.S. and T.P.; writing—review and editing, T.P.; visualization, M.S.; supervision, T.P.; project administration, T.P.; funding acquisition, T.P. All authors have read and agreed to the published version of the manuscript.
Funding
This investigation was funded by the Bulgarian Ministry of Education and Science (MES) in the frames of the Bulgarian National Recovery and Resilience Plan, Component “Innovative Bulgaria,” the Project № BG-RRP-2.004-0006-C02 “Development of research and innovation at Trakia University in service of health and sustainable well-being.”.
Institutional Review Board Statement
Not applicable.
Informed Consent Statement
Not applicable.
Data Availability Statement
All data presented in this study are available on request from the corresponding author.
Acknowledgments
This work was supported and funded by Bulgarian Ministry of Education and Science. Authors acknowledge to Nadejda Ilieva and Veska Stoianova for their technical support. .
Conflicts of Interest
The authors declare no conflict of interest.
References
- Renaudeau, D.; Collin, A.; Yahav, S.; de Basilio, V.; Gourdine, J.L.; Collier, R.J. Adaptation to hot climate and strategies to alleviate heat stress in livestock production. Animal 2012, 6, 707–728. [Google Scholar] [CrossRef] [PubMed]
- Segnalini, M.; Bernabucci, U.; Vitali, A.; et al. Temperature humidity index scenarios in the Mediterranean basin. Int. J Biometeorol. 2013, 57, 451–458. [Google Scholar] [CrossRef] [PubMed]
- Fournel, S.; Ouellet, V.; Charbonneau, É. Practices for Alleviating Heat Stress of Dairy Cows in Humid Continental Climates: A Literature Review. Animals 2017, 7, 37. [Google Scholar] [CrossRef] [PubMed]
- Wankar, A.K.; Rindhe, S.N.; Doijad, N.S. Heat stress in dairy animals and current milk production trends, economics, and future perspectives: The global scenario. Trop. Anim. Health Prod. 2021, 53, 70. [Google Scholar] [CrossRef] [PubMed]
- Mezzetti, M.; Cattaneo, L.; Passamonti, M.M.; Lopreiato, V.; Minuti, A.; Trevisi, E. The transition period updated: A review of the new insights into the adaptation of dairy cows to the new lactation. Dairy 2021, 2, 617–636. [Google Scholar] [CrossRef]
- Sammad, A.; Wang, Y.J.; Umer, S.; Lirong, H.; Khan, I.; Khan, A.; Ahmad, B.; Wang, Y. Nutritional Physiology and Biochemistry of Dairy Cattle under the Influence of Heat Stress: Consequences and Opportunities. Animals 2020, 10, 793. [Google Scholar] [CrossRef]
- Frigeri, K.D.M.; Kachinski, K.D.; Ghisi, N.d.C.; Deniz, M.; Damasceno, F.A.; Barbari, M.; Herbut, P.; Vieira, F.M.C. Effects of Heat Stress in Dairy Cows Raised in the Confined System: A Scientometric Review. Animals 2023, 13, 350. [Google Scholar] [CrossRef]
- Ivanova, R.; Hristev, H.; Gergovska, Z. Influence of the level of daily milk yield on some blood biochemical parameters in dairy cows reared under the same temperature and humidity conditions. Bulg. J. Agric. Sci. 2022, 28 (Suppl. S1), 55–64. [Google Scholar]
- Mylostyvyi, R.V.; Sejian, V. Welfare of dairy cattle in conditions of global climate change. Theor. Appl. Vet. Med. 2019, 7, 47–55. [Google Scholar] [CrossRef]
- Ndlovu, T.; Chimonyo, M.; Okoh, A.I.; Muchenje, V.; Dzama, K.; Raats, J.G. Assessing the nutrititional status of beef cattle: Current practices and future prospects. Afr. J. Biotechnol. 2007, 6, 2727–273. [Google Scholar]
- Correa-Calderon, A.; Armstrong, D.; Ray, D.; DeNise, S.; Enns, M.; Howison, C. Thermoregulatory responses of Holstein and Brown Swiss Heat-Stressed dairy cows to two different cooling systems. Int. J Biometeorol. 2004, 48, 142–148. [Google Scholar] [CrossRef]
- Turner, M.G.; Dale, V.H.; Gardner, R.H. Predicting across scales: Theory development and testing. Landscape ecology 1989, 3, 245–252. [Google Scholar] [CrossRef]
- Gantner, V.; Mijić, P.; Kuterovac, K.; Solić, D.; Gantner, R. Temperature-humidity index values and their significance on the daily production of dairy cattle. Mljekarstvo 2011, 61, 56–63. [Google Scholar]
- Armstrong, D.V. Heat stress interaction with shade and cooling. J. Dairy Sci. 1994, 77, 2044–2050. [Google Scholar] [CrossRef]
- Ravagnolo, O.; Misztal, I.; Hoogenboom, G. Genetic component of heat stress in dairy cattle, development of heat index function. J. Dairy Sci. 2000, 83, 2120–2125. [Google Scholar] [CrossRef] [PubMed]
- Kadzere, C.T.; Murphy MRSilanikove, N.; Maltz, E. Heat stress in lactating dairy cows: A review. Livest. Prod. Sci. 2002, 77, 59–91. [Google Scholar] [CrossRef]
- Brügemann, K.; Gernand, E.; König von Borstel, U.; König, S. Defining and evaluating heat stress thresholds in different dairy cow production systems. Archives Animal Breeding 2012, 55, 13–24. [Google Scholar] [CrossRef]
- Gorniak, T.; Meyer, U.; Südekum, K.H.; Dänicke, S. Impact of mild heat stress on dry matter intake, milk yield and milk composition in mid-lactation Holstein dairy cows in a temperate climate. Arch Anim Nutrit 2014, 68, 358–369. [Google Scholar] [CrossRef]
- Blond, B.; Majkić, M.; Spasojević, J.; Hristov, S.; Radinović, M.; Nikolić, S.; Anđušić, L.; Čukić, A.; Došenović Marinković, M.; Vujanović, B.D.; et al. Influence of Heat Stress on Body Surface Temperature and Blood Metabolic, Endocrine, and Inflammatory Parameters and Their Correlation in Cows. Metabolites 2024, 14, 104. [Google Scholar] [CrossRef]
- Zimbelman, R.B.; Rhoads, R.P.; Rhoads, M.L.; Duff, G.C.; Baumgard, L.H.; Collier, R.J. A re-evaluation of the impact of temperature humidity index (THI) and black globe humidity index (BGHI) on milk production in high producing dairy cows. Pages 158–169 in Proceedings of the Southwest Nutrition Conference. Accessed Feb. 2, 2009.
- Berman, A. Estimates of heat stress relief needs for Holstein dairy cows. J. Anim. Sci. 2005, 83, 1377–1384. [Google Scholar] [CrossRef]
- De Rensis, F.; Garcia-Ispierto, I.; Lopez-Gatius, F. Seasonal heat stress: Clinical implications and hormone treatments for the fertility of dairy cows. Theriogenology 2015, 84, 659–666. [Google Scholar] [CrossRef] [PubMed]
- Avendaño-Reyes, L. Heat stress management for milk production in arid zones. In: Narongsak Chaiyabutr editor. Milk production - An up-to-date overview of animal nutrition, management and health. Intech Open, London UK 2012, 165–184.
- Carter, B.H.; Friend, T.H.; Sawyer, J.A.; Garey, S.M.; Alexander, M.B.; Carter, M.J.; et al. Effect of feed-bunk sprinklers on attendance at unshaded feed bunks in drylot dairies. Prof. Anim. Sci. 2011, 27, 127–132. [Google Scholar] [CrossRef]
- Gorniak, T.; Meyer, U.; Südekum, K.H.; Dänicke, S. Impact of mild heat stress on dry matter intake, milk yield and milk composition in mid-lactation Holstein dairy cows in a temperate climate. Arch Anim Nutrit 2014, 68, 358–369. [Google Scholar] [CrossRef]
- Santana, M.L.; Bignardi, A.B.; Pereira, R.J.; Stefani, G.; El Faro, L. Genetics of heat tolerance for milk yield and quality in Holsteins. Animal 2017, 11, 4–14. [Google Scholar] [CrossRef] [PubMed]
- Liu, J.; Li, L.; Chen, X.; Lu, Y.; Wang, D. Effects of heat stress on body temperature, milk production, and reproduction in dairy cows: A novel idea for monitoring and evaluation of heat stress—A review. Asian Australas. J. Anim. Sci. 2019, 32, 1332. [Google Scholar] [CrossRef] [PubMed]
- Turk, R.; Rošić, N.; Vince, S.; Perkov, S.; Samardžija, M.; Beer-Ljubić, B.; Belić, M.; Robić, M. The influence of heat stress on energy metabolism in Simmental dairy cows during the periparturient period. Vet. Arh. 2020, 90, 1–10. [Google Scholar] [CrossRef]
- Abbas, Z.; Sammad, A.; Hu, L.; Fang, H.; Xu, Q.; Wang, Y. Glucose Metabolism and Dynamics of Facilitative Glucose Transporters (GLUTs) under the Influence of Heat Stress in Dairy Cattle. Metabolites 2020, 10, 312. [Google Scholar] [CrossRef] [PubMed]
- Kendall, P.E.; Webster, J.R. Season and physiological status affects the circadian body temperature rhythm of dairy cows. Livest. Sci. 2009, 125, 155–160. [Google Scholar] [CrossRef]
- Collier, R.J.; Baumgard, L.H.; Lock, A.L.; Bauman, D.E. Physiological limitations, nutrient partitioning. Yield of farmed species. Constraints and opportunities in the 21st Century (ed. R Sylvester-Bradley and J Wiseman) 2005, 351–377.
- Fox, D.G.; Tylutki, T.P. Accounting for the Effects of Environment on the Nutrient Requirements of Dairy Cattle. J. Dairy Sci. 1998, 81, 3085–3095. [Google Scholar] [CrossRef]
- Wheelock, J.B.; Rhoads, R.P.; VanBaale, M.J.; Sanders, S.R.; Baumgard, L.H. Effects of heat stress on energetic metabolism in lactating Holstein cows. J. Dairy Sci. 2010, 93, 644–655. [Google Scholar] [CrossRef]
- Baumgard, L.H.; Rhoads, R.P. Effects of Heat Stress on Postabsorptive Metabolism and Energetics. Annu. Rev. Anim. Biosci. 2013, 1, 311–337. [Google Scholar] [CrossRef] [PubMed]
- Shahzad, K.; Akbar, H.; Vailati-Riboni, M.; Basirico, L.; Morera, P.; Rodriguez-Zas, S.L.; Loor, J.J. The effect of calving in the summer on the hepatic transcriptome of Holstein cows during the peripartal period. J. Dairy Sci. 2015, 98, 5401–5413. [Google Scholar] [CrossRef] [PubMed]
- Zhou, Z.; Loor, J.J.; Piccioli-Cappelli, F.; Librandi, F.; Lobley, G.E.; Trevisi, E. Circulating amino acids in blood plasma during the peripartal period in dairy cows with different liver functionality index. J. Dairy Sci. 2016, 99, 2257–2267. [Google Scholar] [CrossRef] [PubMed]
- Guo, J.; Gao, S.; Quan, S.; Zhang, Y.; Bu, D.; Wang, J. Blood amino acids profile responding to heat stress in dairy cows. Asian-Australas. J. Anim. Sci. 2018, 31, 47–53. [Google Scholar] [CrossRef] [PubMed]
- Bell, A.W.; Burhans, W.S.; Overton, T.R. Protein nutrition in late pregnancy, maternal protein reserves and lactation performance in dairy cows. Proc. Nutr. Soc. 2000, 59, 119–126. [Google Scholar] [CrossRef] [PubMed]
- Shwartz, G.; Rhoads, M.L.; Vanbaale, M.J.; Rhoads, R.P.; Baumgard, L.H. Effects of a supplemental yeast culture on heat-stressed lactating Holstein cows. J. Dairy Sci. 2009, 92, 935–942. [Google Scholar] [CrossRef]
- Schneider, P.L.; Beede, D.K.; Wilcox, C.J. Nycterohemeral Patterns of Acid-Base Status, Mineral Concentrations and Digestive Function of Lactating Cows in Natural or Chamber Heat Stress Environments2. J. Anim. Sci. 1988, 66, 112–125. [Google Scholar] [CrossRef]
- Cowley, F.C.; Barber, D.G.; Houlihan, A.V.; Poppi, D.P. Immediate and residual effects of heat stress and restricted intake on milk protein and casein composition and energy metabolism. J. Dairy Sci. 2015, 98, 2356–2368. [Google Scholar] [CrossRef] [PubMed]
- Joo, S.S.; Lee, S.J.; Park, D.S.; Kim, D.H.; Gu, B.-H.; Park, Y.J.; Rim, C.Y.; Kim, M.; Kim, E.T. Changes in Blood Metabolites and Immune Cells in Holstein and Jersey Dairy Cows by Heat Stress. Animals 2021, 11, 974. [Google Scholar] [CrossRef] [PubMed]
- Mahen, P.J.; Williams, H.J.; Smith, R.F.; Grove-White, D. Effect of blood ionised calcium concentration at calving on fertility outcomes in dairy cattle. Vet. Rec. 2018, 183, 263. [Google Scholar] [CrossRef]
- Roti, J.L. Cellular responses to hyperthermia (40–46°C): Cell killing and molecular events. Int. J. Hyperth. 2008, 24, 3–15. [Google Scholar] [CrossRef] [PubMed]
- Rhoads, R.P.; La Noce, A.J.; Wheelock, J.B.; Baumgard, L.H. Short communication: Alterations in expression of gluconeogenic genes during heat stress and exogenous bovine somatotropin administration. J. Dairy Sci. 2011, 94, 1917–1921. [Google Scholar] [CrossRef]
- Alamer, M. The role of prolactin in thermoregulation and water balance during heat stress in domestic ruminants. Asian J. Anim. Vet. Adv. 2011, 6, 1153–1169. [Google Scholar] [CrossRef]
- Kaufman, S.; Mackay, B.J. Plasma prolactin levels and body fluid deficits in the rat: Causal interactions and control of water intake. J. Physiol. 1983, 336, 73–81. [Google Scholar] [CrossRef] [PubMed]
- Blake, M.J.; Buckley, A.R.; Zhang, M.; Buckley, D.J.; Lavoi, K.P. A novel heat shock response in prolactin-dependent Nb2 node lymphoma cells. J. Biol. Chem. 1995, 270, 29614–29620. [Google Scholar] [CrossRef] [PubMed]
- Collier, R.J.; Beede, D.K.; Thatcher, W.W.; Israel, L.A.; Wilcox, C.J. Influences of environment and its modification on dairy animal health and production. J. Dairy Sci. 1982, 65, 2213–2227. [Google Scholar] [CrossRef] [PubMed]
- Foizik, K.; Langan, E.A.; Paus, R. Prolactin and the skin: A dermatological perspective on an ancient pleiotropic peptide hormone. J. Invest. Dermatol. 2009, 129, 141–147. [Google Scholar] [CrossRef]
- Ben-Jonathan, N.; Hugo, E.R.; Brandebourg, T.D.; LaPensee, C.R. Focus on prolactin as a metabolic hormone. Trends Endocrinol. Metab. 2006, 17, 110–116. [Google Scholar] [CrossRef] [PubMed]
- Arumugam, R.; Horowitz, E.; Noland, R.C.; Lu, D.; Fleenor, D.; Freemark, M. Regulation of islet b-cell pyruvate metabolism: Interactions of prolactin, glucose, and dexamethasone. Endocrinology 2010, 149, 5401–5414. [Google Scholar] [CrossRef]
- Zeng, H.; Li, S.; Zhai, Y.; Chang, H.; Han, Z. Preliminary Transcriptome Analysis of Long Noncoding RNA in Hypothalamic-Pituitary-Mammary Gland Axis of Dairy Cows under Heat Stress. Biomolecules 2023, 13, 390. [Google Scholar] [CrossRef]
- Tucker, H.A. Hormones, mammary growth, and lactation: A 41-year perspective. J. Dairy Sci. 2000, 83, 874–884. [Google Scholar] [CrossRef]
- Lacasse, P.; Zhao, X.; Vanacker, N.; Boutinaud, M. Review: Inhibition of prolactin as a management tool in dairy husbandry. Animal 2019, 13, s35–s41. [Google Scholar] [CrossRef] [PubMed]
- Auchtung, T.L. , and G. E. Dahl. Prolactin mediates photoperiodic immune enhancement: Effects of administration of exogenous prolactin on circulating concentrations, receptor expression, and immune function in steers. Biol. Reprod. 2004, 71, 1913–1918. [Google Scholar] [CrossRef]
- Brand, J.M.; Frohn, C.; Cziupka, K.; Brockmann, C.; Kirchner, H.; Luhm, J. Prolactin triggers pro-inflammatory immune responses in peripheral immune cells. Eur. Cytokine Netw. 2004, 15, 99–104. [Google Scholar] [PubMed]
- Díaz, L.; Muñoz, M.D.; González, L.; Lira-Albarrán, S.; Larrea, F.; Méndez, I. Prolactin in the immune system. In Prolactin.G. M. Nagy and B. E. Toth, ed. Intech Open 2013. [CrossRef]
- do Amaral, B.C.; Connor, E.E.; Tao, S.; Hayen, J.; Bubolz, J.; Dahl, G.E. Heat stress abatement during the dry period influences prolactin signaling in lymphocytes. Domest. Anim. Endocrinol. 2010, 38, 38–45. [Google Scholar] [CrossRef] [PubMed]
- do Amaral, B.C.; Connor, E.E.; Tao, S.; Hayen, M.J.; Bubolz, J.W.; Dahl, G.E. Heat stress abatement during the dry period influences metabolic gene expression and improves immune status in the transition period of dairy cows. J. Dairy Sci. 2011, 94, 86–96. [Google Scholar] [CrossRef] [PubMed]
- Marins, N.T.; Gao, J.; Yang, Q.; Binda, R.M.; Pessoa, C.M.B.; Rivas, R.M.O.; Garrick, M.; Melo, V.H.L.R.; Chen, Y.; Bernard, J.K.; et al. Impact of heat stress and a feed supplement on hormonal and inflammatory responses of dairy cows. J. Dairy Sci. 2011, 104, 8276–8289. [Google Scholar] [CrossRef] [PubMed]
- Cincovic, M.R.; Belic, B.; Toholj, B.; Potkonjak, A.; Stevancevic, M.; Lako, B.; Radovic, I. Metabolic acclimation to heat stress in farm housed Holstein cows with different body condition scores. Afr. J. Biotechnol. 2011, 10, 10293–10303. [Google Scholar]
- Mezzetti, M.; Bionaz, M.; Trevisi, E. Interaction between inflammation and metabolism in periparturient dairy cows. J. Anim. Sci. 2020, 98, S155–S174. [Google Scholar] [CrossRef]
- Du, X.; Chen, L.; Huang, D.; Peng, Z.; Zhao, C.; Zhang, Y.; Zhu, Y.; Wang, Z.; Li, X.; Liu, G. Elevated apoptosis in the liver of dairy cows with ketosis. Cell. Physiol. Biochem. 2017, 43, 568–578. [Google Scholar] [CrossRef]
- Li, Y.; Ding, H.Y.; Wang, X.C.; Feng, S.B.; Li, X.B.; Wang, Z.; Li, X.W. An association between the level of oxidative stress and the concentrations of NEFA and BHBA in the plasma of ketotic dairy cows. J. Anim. Physiol. Anim. Nutr. 2016, 100, 844–851. [Google Scholar] [CrossRef] [PubMed]
Figure 1.
Maximum and average THI values.
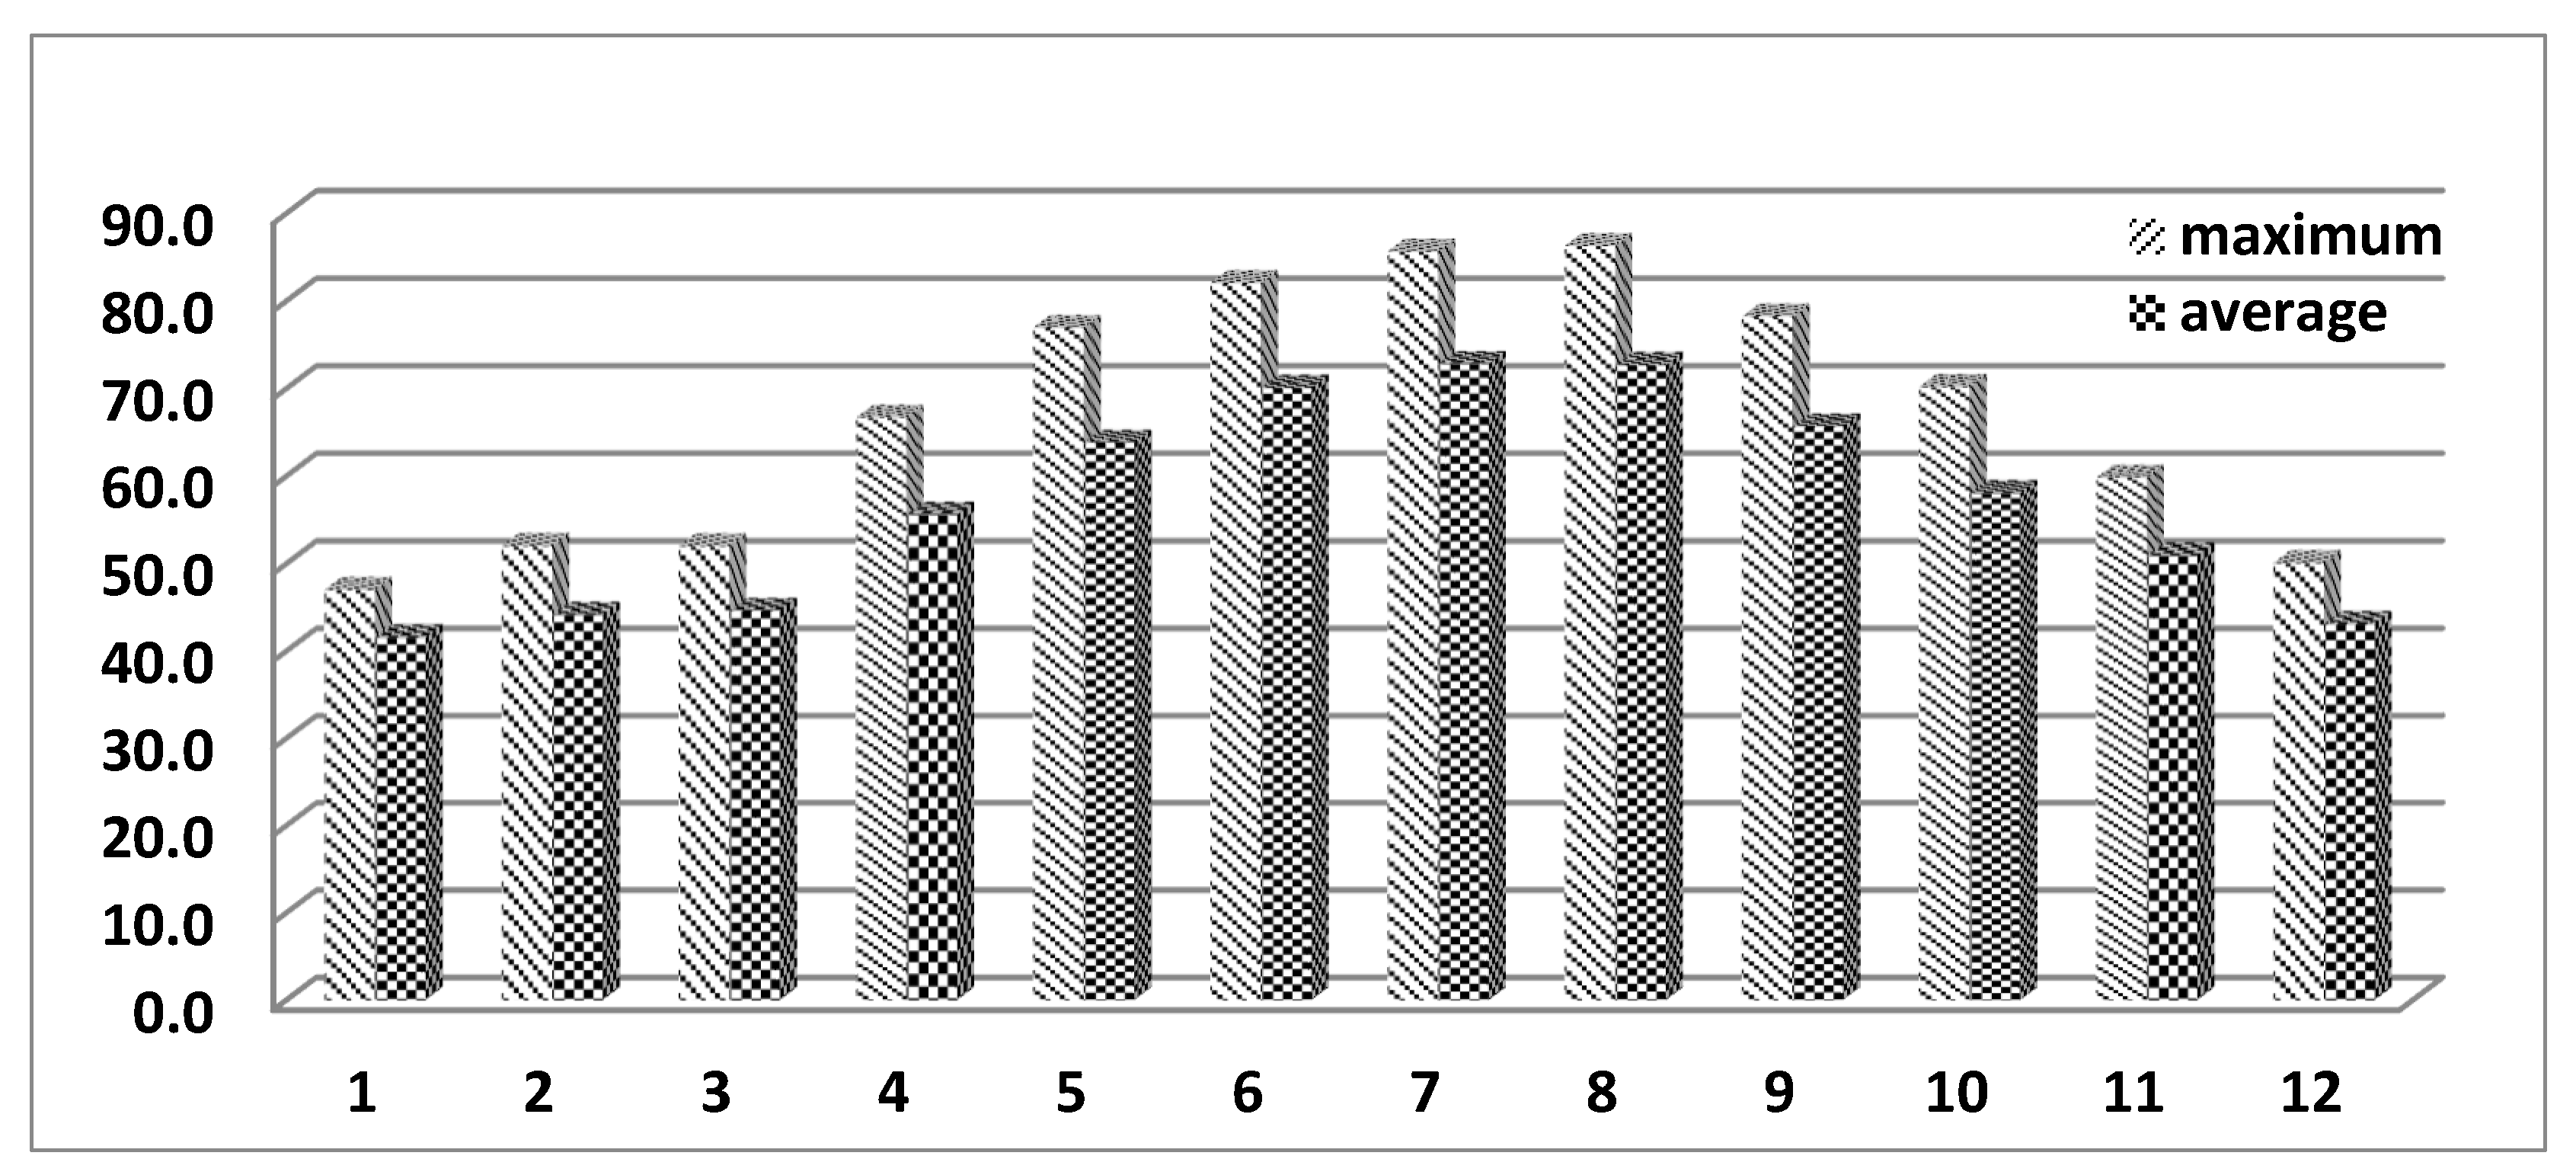
Figure 2.
LS mean values for glucose, urea, and calcium in blood by reporting month (mmol/l).
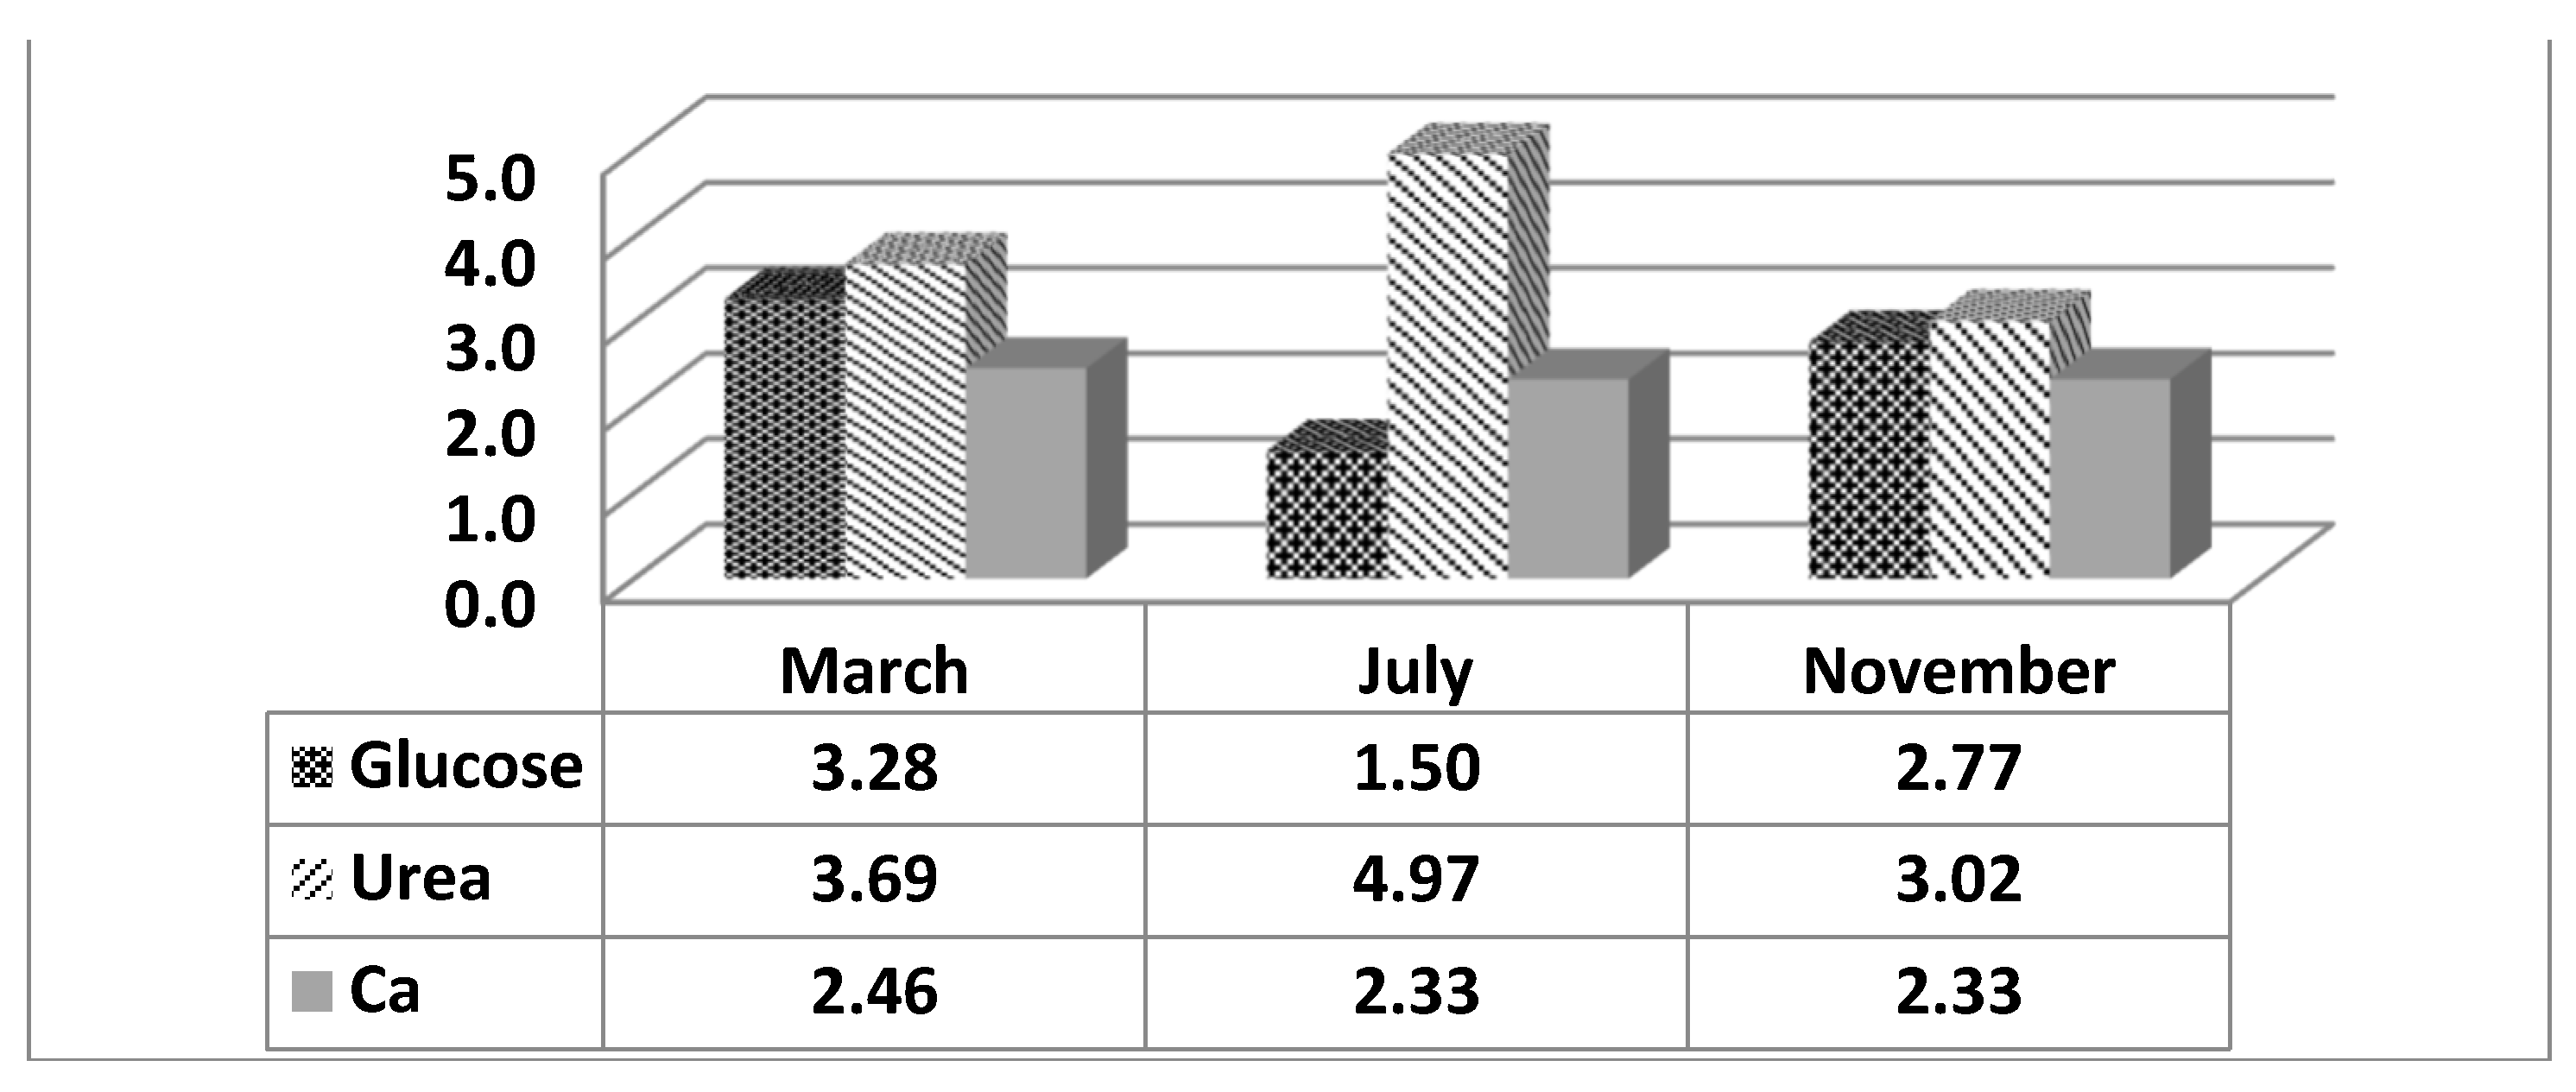
Figure 3.
LS mean values for total protein in the blood by month of study.
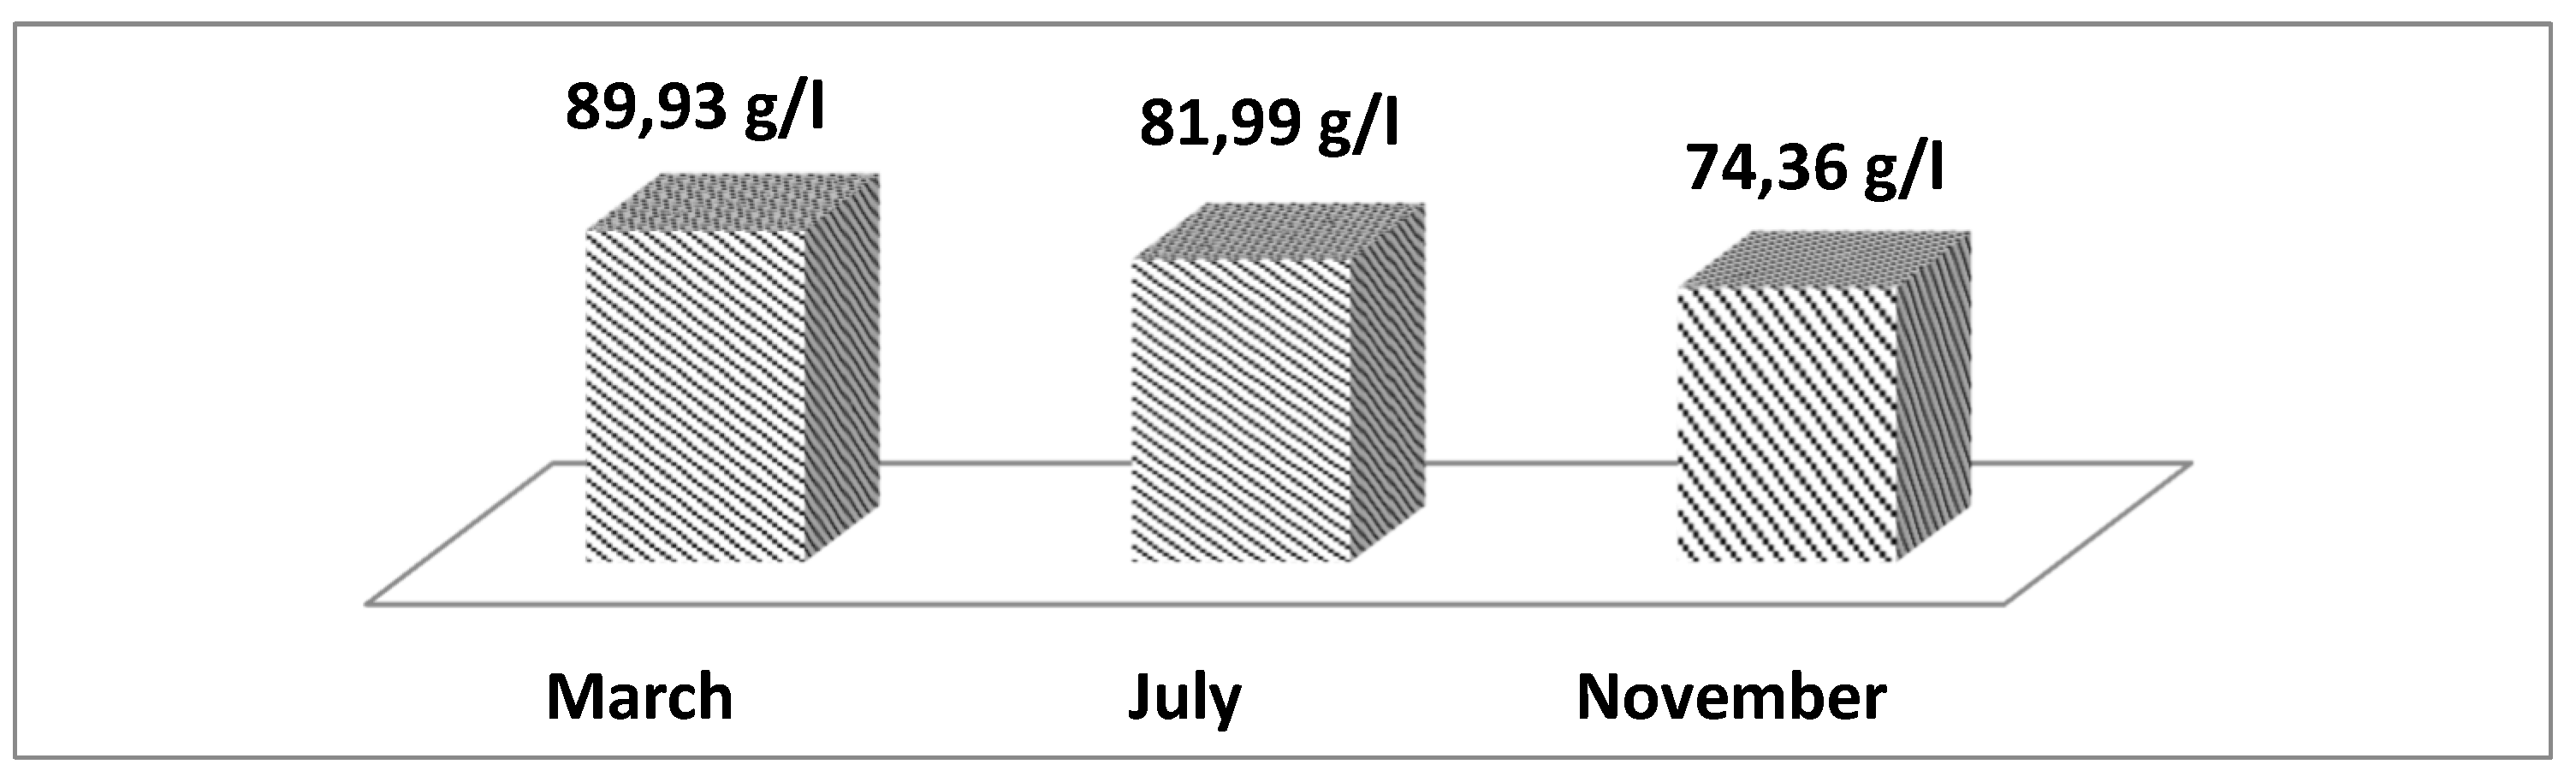
Figure 4.
LS mean values of prolactin in the blood depending on the month of measurement.
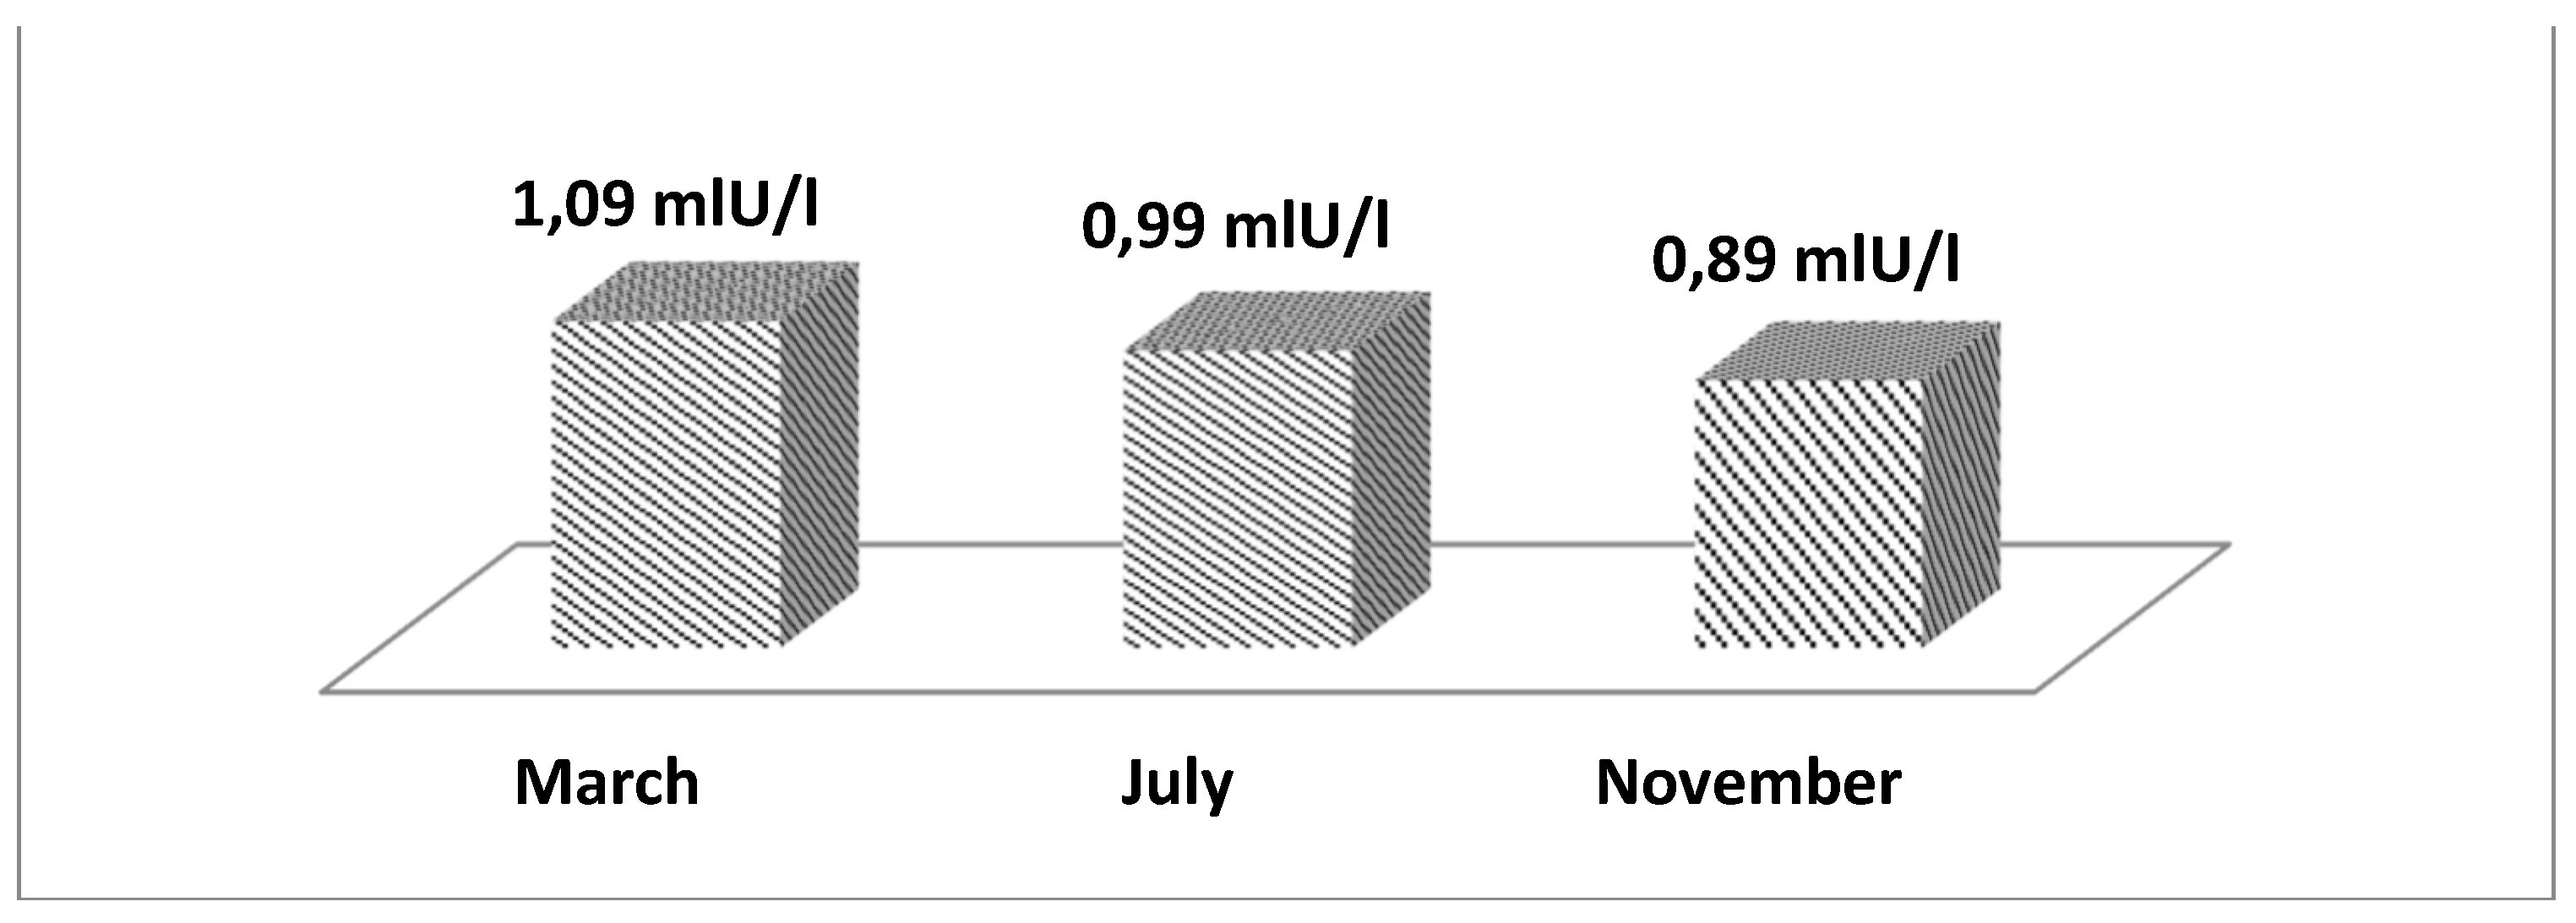
Figure 5.
LS mean values of cortisol depending on the month of recording.
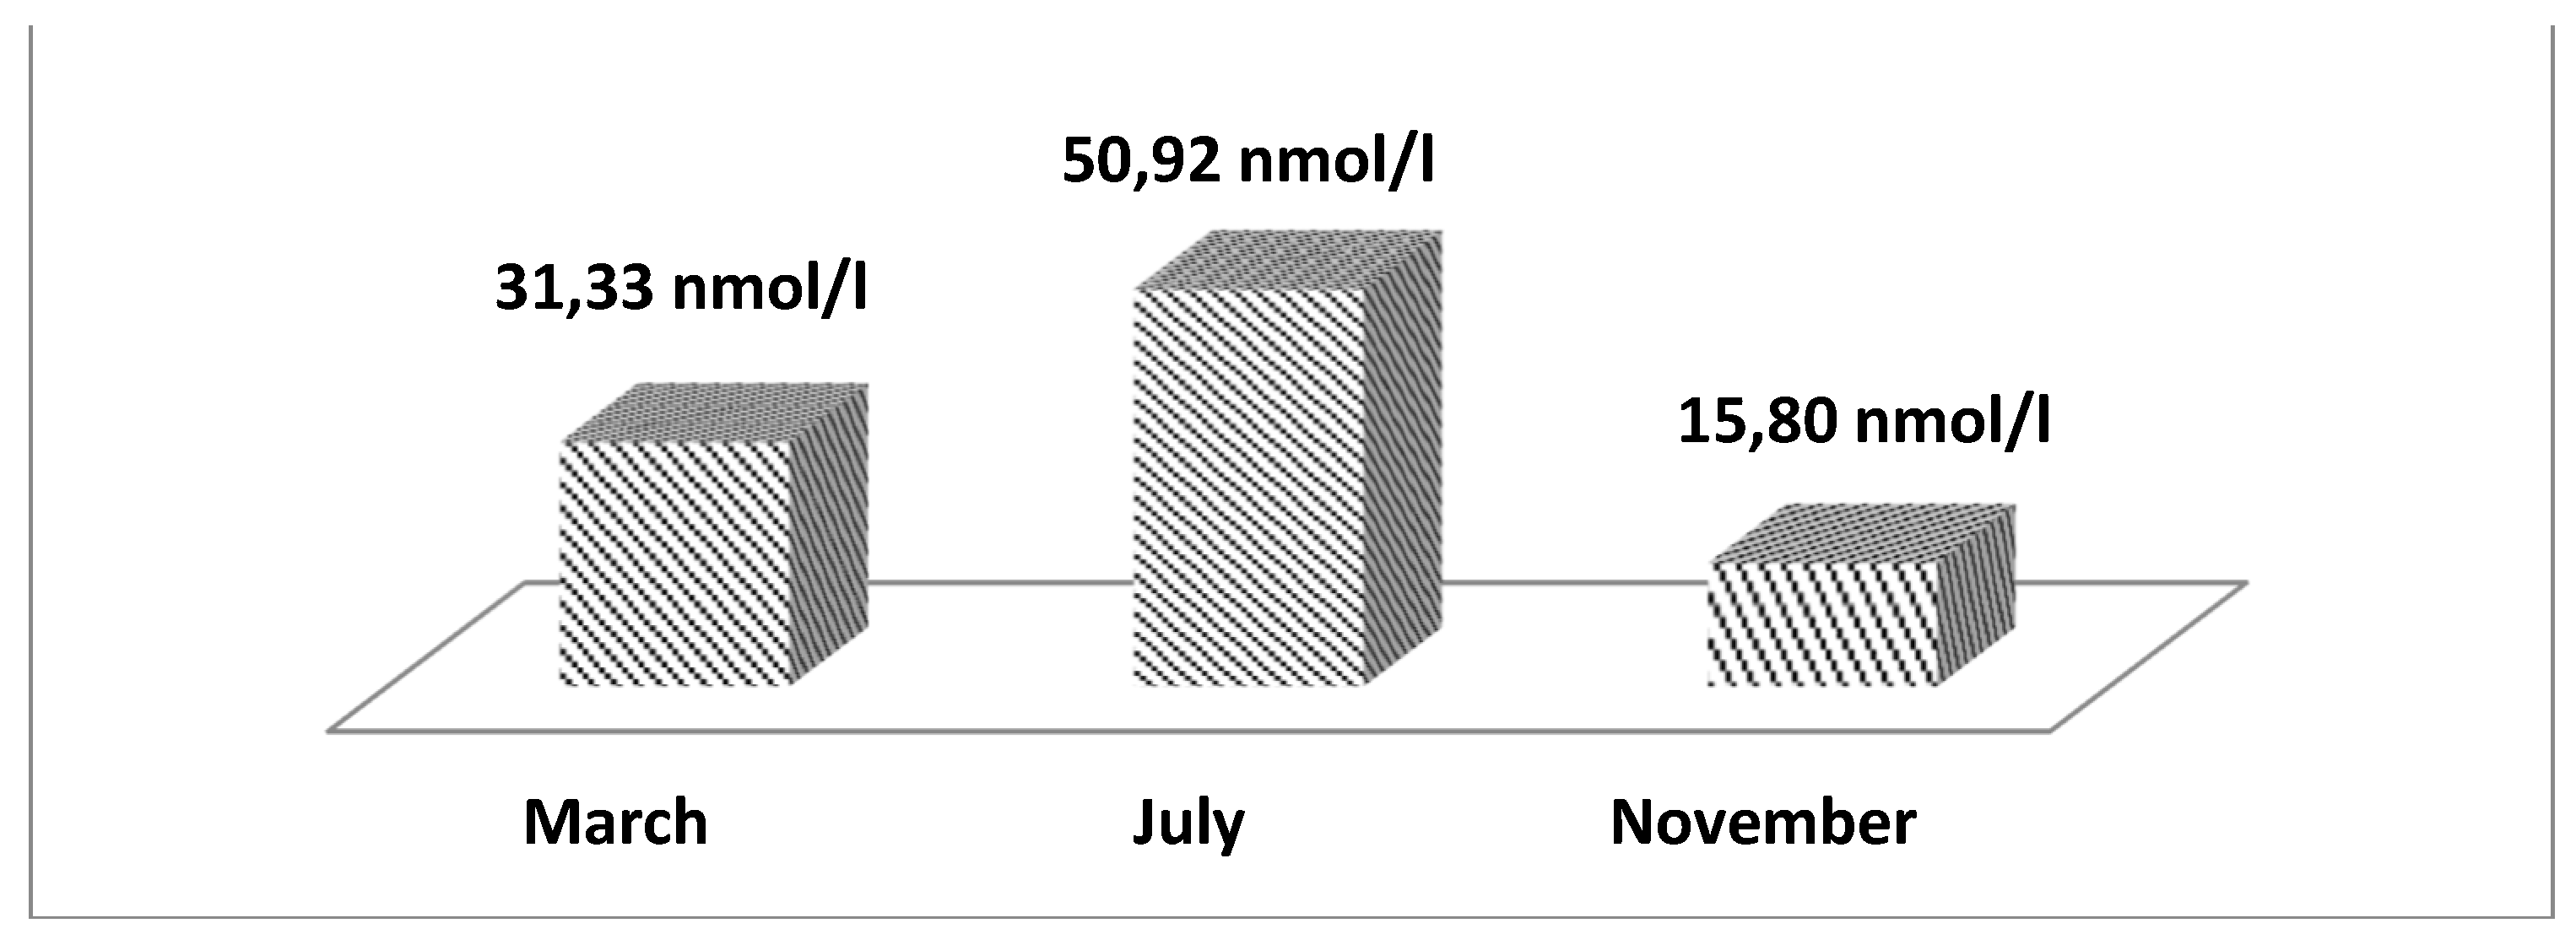
Figure 6.
LS mean values for ASAT and ALAT by months of study.
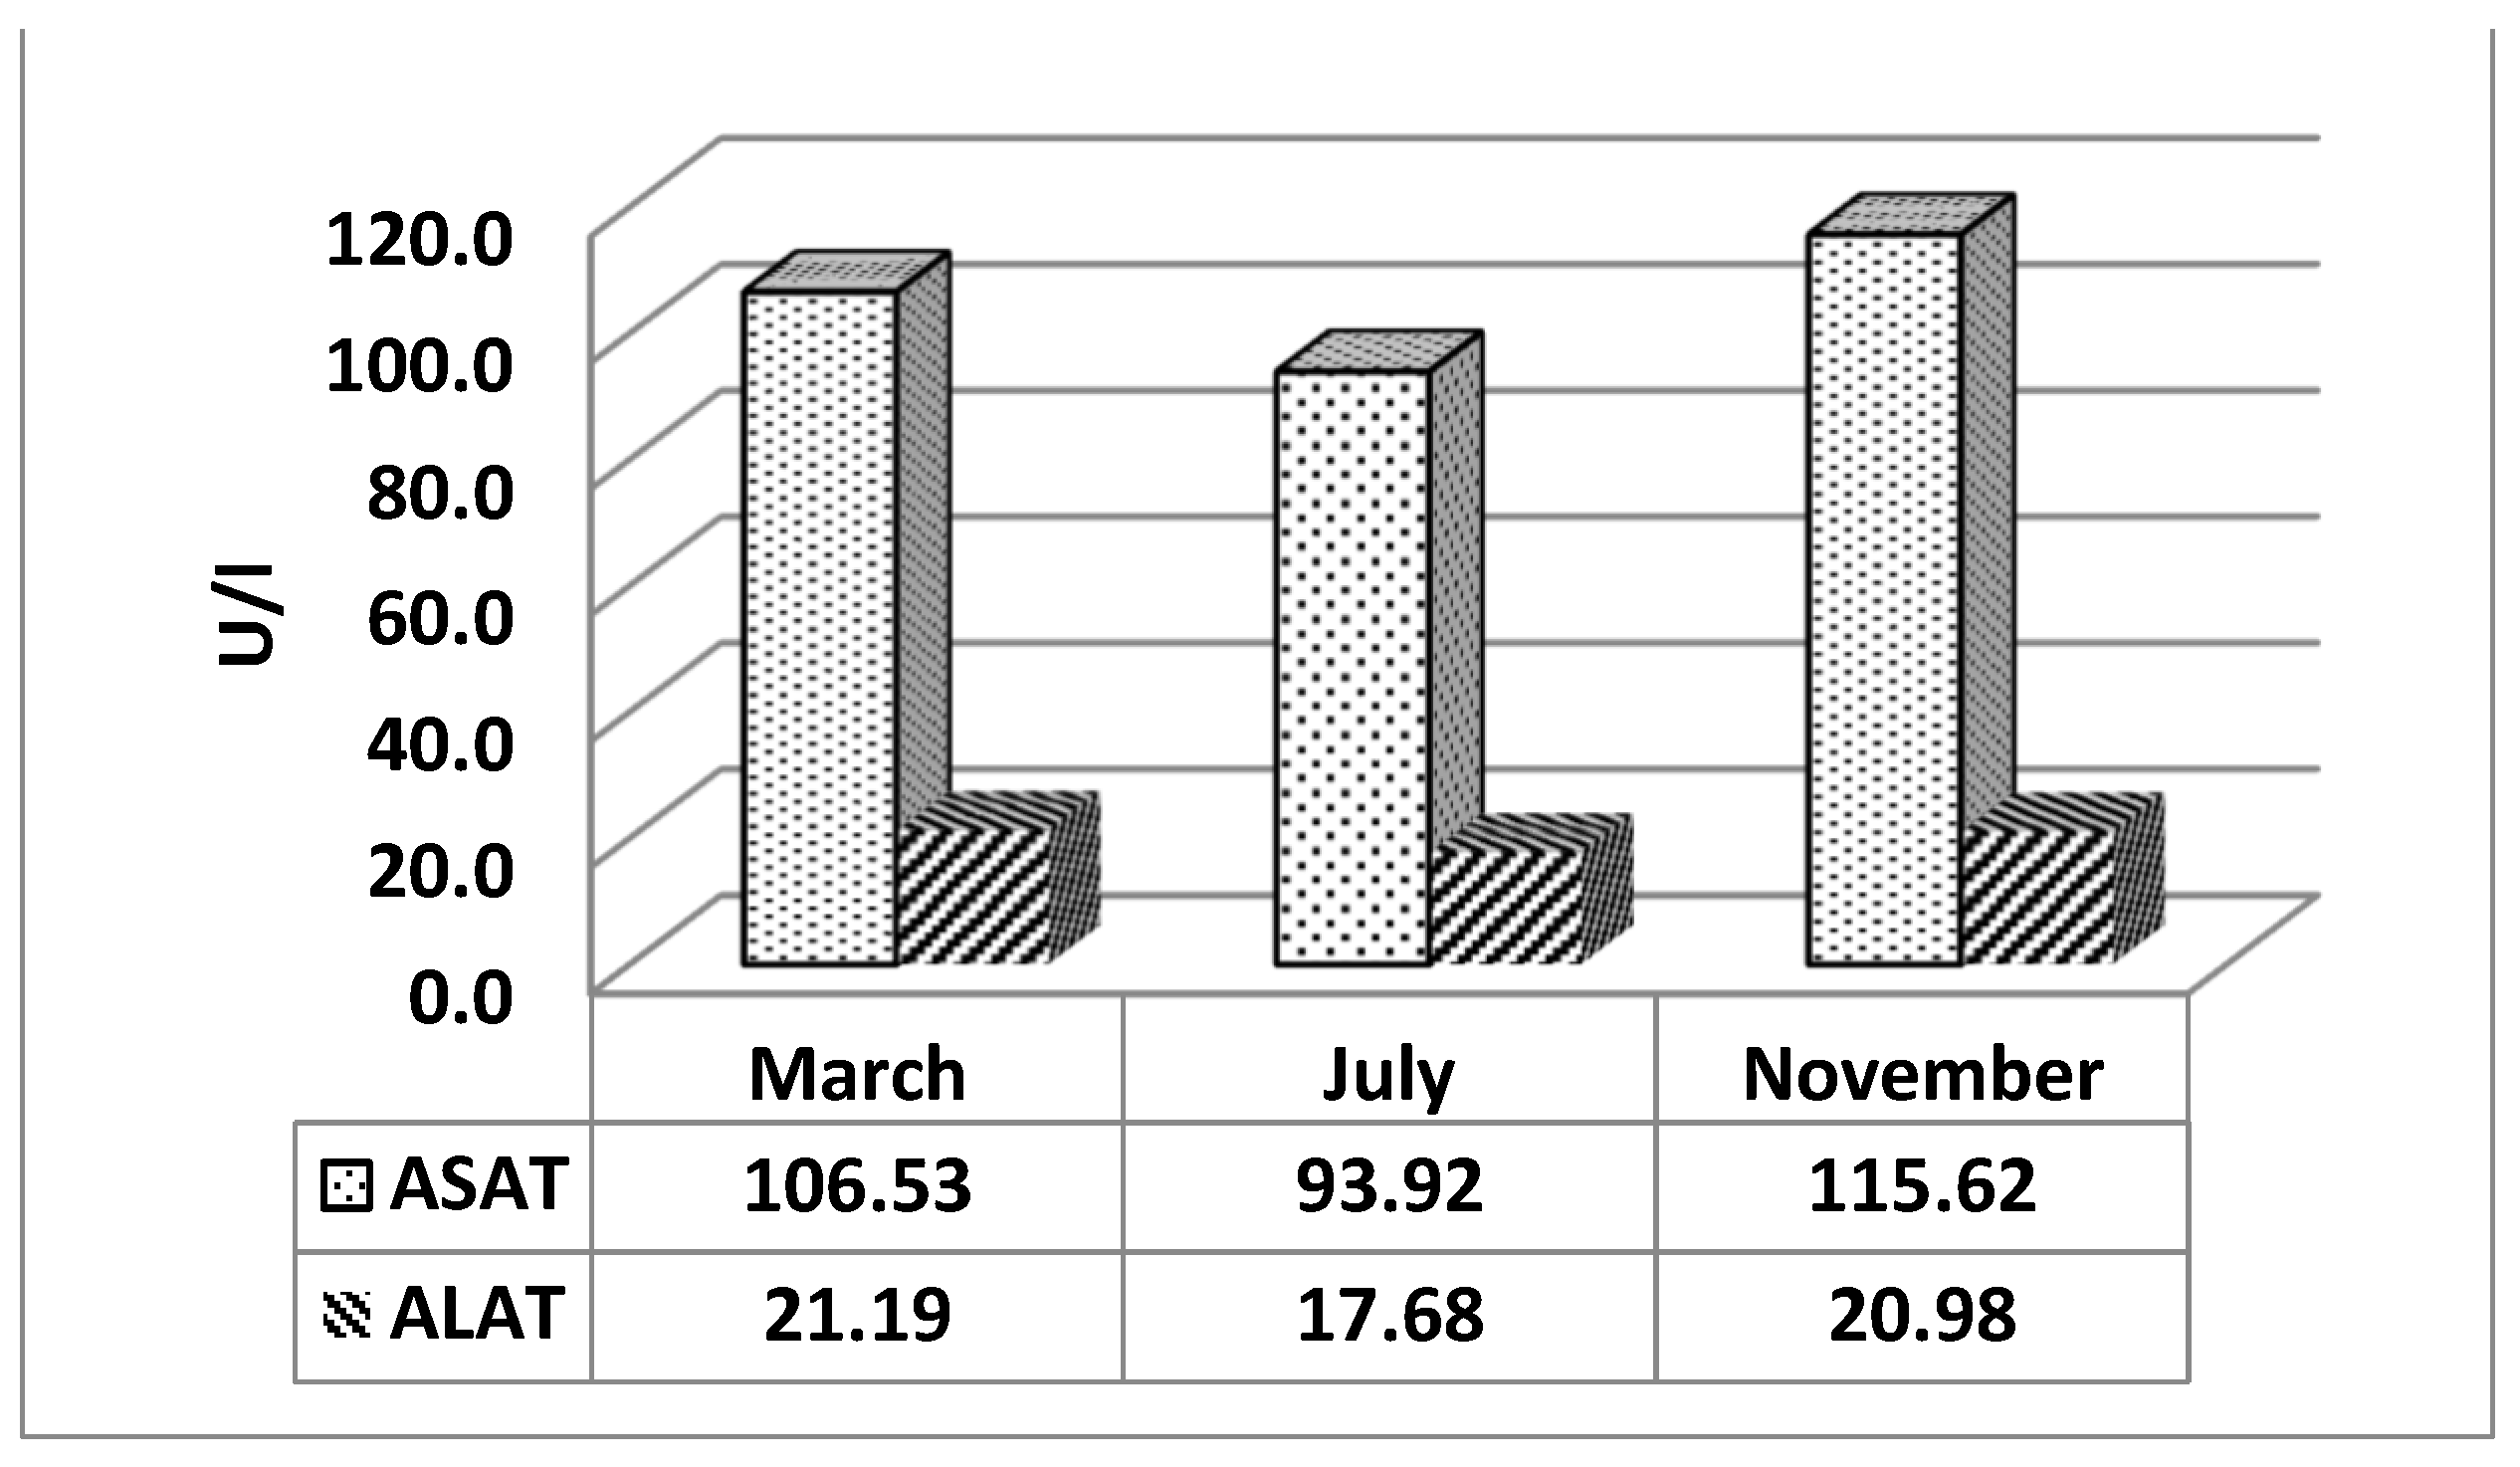

Table 1.
Average values and variation of the main climate indicators for the farm area.
| Season | Number of records | Statistics | |||
| x ± Se | SD | min | max | ||
| Average air temperature, ºC | |||||
| Spring | 82 | 12,28 ± 0,79 | 7,15 | -1,10 | 23,8 |
| Summer | 92 | 24,27 ± 0,25 | 2,40 | 18,0 | 28,6 |
| Autumn | 90 | 14,80 ± 0,52 | 4,95 | 4,70 | 24,9 |
| Winter | 90 | 4,84 ± 0,36 | 3,42 | -4,0 | 12,7 |
| Average maximum air temperatures | |||||
| Spring | 82 | 18,75 ± 0,95 | 8,64 | 1,5 | 32,4 |
| Summer | 92 | 30,89 ± 0,38 | 3,65 | 20,7 | 38,6 |
| Autumn | 90 | 21,51 ± 0,65 | 6,13 | 6,10 | 35,9 |
| Winter | 90 | 9,48 ± 0,47 | 4,44 | -0,60 | 21,10 |
| Average air humidity, % | |||||
| Spring | 82 | 66,32 ± 1,35 | 12,22 | 33 | 96 |
| Summer | 92 | 63,21 ± 1,12 | 10,70 | 45 | 93 |
| Autumn | 90 | 69,16 ± 1,20 | 11,38 | 50 | 96 |
| Winter | 90 | 77,00 ± 1,37 | 12,99 | 46 | 97 |
| Average THI values | |||||
| Spring | 82 | 54,54 ± 1,89 | 10,77 | 34,36 | 71,74 |
| Summer | 92 | 71,78 ± 0,30 | 2,89 | 64,15 | 76,96 |
| Autumn | 90 | 58,23 ± 0,80 | 7,55 | 41,29 | 72,52 |
| Winter | 90 | 42,91 ± 0,56 | 5,36 | 30,97 | 55,37 |
| Average maximum THI values | |||||
| Spring | 82 | 65,01 ± 1,59 | 14,40 | 36,76 | 89,24 |
| Summer | 92 | 84,78 ± 0,58 | 5,55 | 69,07 | 94,97 |
| Autumn | 90 | 69,41 ± 1,07 | 10,17 | 43,31 | 91,85 |
| Winter | 90 | 49,62 ± 0,79 | 7,53 | 32,41 | 69,71 |
Table 2.
THI values with influence on the cows towards the month of blood examination.
| Average values for THI | Study March | Study July | Study November | |||
| February | March | June | July | October | November | |
| Daily | 44,17±0,87 | 44,63±1,39 | 70,09±0,50 | 72,81±0,48 | 58,07±0,65 | 50,95±0,97 |
| MAX | 52,02±1,30 | 52,01±1,98 | 82,04±0,96 | 85,64±1,04 | 70,18±0,74 | 59,81±1,61 |
| MIN | 38,22±0,77 | 39,38±0,84 | 60,78±0,49 | 62,33±0,40 | 49,98±0,76 | 44,95±0,81 |
Table 3.
Reference, mean values, and variation indicators of biochemical blood results (n=89).
| Biochemical indicator | Reference ranges | Variational statistical indicators | |||
| x ± Se | SD | MIN | MAX | ||
| Glucose | 2-3 (mmol/l) | 2,51 ± 0,091 | 0,865 | 0,52 | 3,84 |
| Triglycerides | 0,2-0,5 (mmol/l) | 0,09 ± 0,003 | 0,030 | 0,03 | 0,20 |
| Urea | 2,8-8,5 (mmol/l) | 3,89 ± 0,126 | 1,187 | 1,83 | 7,45 |
| Total protein | 65-80 (g/l) | 82,11 ± 1,058 | 9,986 | 59,73 | 105,53 |
| Asat | 45-110 (U/I) | 104,83 ± 3,704 | 34,941 | 8,13 | 249,04 |
| Alat | 7-35 (U/I) | 19,87 ± 0,661 | 6,234 | 8,55 | 38,47 |
| GGT | 4,9-26 (U/I) | 32,61 ± 2,471 | 23,314 | 6,20 | 171,90 |
| Alkaline posphatase | 18-153 (U/I) | 63,05 ± 2,835 | 26,744 | 2,50 | 186,70 |
| Prolactin | - | 1,01 ± 0,026 | 0,241 | 0,80 | 3,10 |
| Cortisol | 40-50 (nmol/l) | 32,90 ± 2,839 | 26,790 | 2,10 | 129,50 |
| P | 1,52-2,25 (mmol/l) | 2,99 ± 1,125 | 10,616 | 1,19 | 10,20 |
| Ca | 2.3-3.2 (mmol/l) | 2,37 ± 0,014 | 0,128 | 2,00 | 2,66 |
Table 4.
Analysis of variance for the influence of controlled factors on the values of biochemical blood parameters.
Table 4.
Analysis of variance for the influence of controlled factors on the values of biochemical blood parameters.
| Biochemical indicator | Overall for the model | Sample month | Number of lactation | Error | |||
| MS | F P | MS | F P | MS | F P | MS | |
| Glucose | 12,47 | 65,73*** | 24,92 | 131,36*** | 0,19 | 1,01 | 0,190 |
| Triglycerides | 0,0006 | 0,67 | 0,0004 | 0,49 | 0,0008 | 0,86 | 0,001 |
| Urea | 14,75 | 19,03*** | 28,87 | 47,30*** | 1,37 | 1,76 | 0,774 |
| Total protein | 970,50 | 16,66*** | 1786,0 | 30,66*** | 170,0 | 2,92 | 58,2 |
| Asat | 4021,3 | 3,70** | 3484,9 | 3,20* | 4219,8 | 3,88* | 1087,6 |
| Alat | 133,18 | 3,87** | 115,0 | 3,45* | 131,69 | 3,83* | 34,38 |
| GGT | 1421,34 | 2,83* | 768,83 | 1,53 | 1830,1 | 3,85* | 501,84 |
| Alkaline posphatase | 617,44 | 0,78 | 612,3 | 0,75 | 654,5 | 0,91 | 718,9 |
| Prolactin | 0,012 | 9,62*** | 0,089 | 68,78*** | 0,003 | 1,93* | 0,002 |
| Cortisol | 5139,82 | 10,14*** | 9082,6 | 17,91*** | 712,34 | 1,40 | 597,13 |
| P | 0,039 | 0,654 | 0,061 | 1,03 | 0,022 | 0,37 | 0,059 |
| Ca | 0,102 | 8,37*** | 0,166 | 13,48*** | 0,038 | 3,08 | 0,012 |
* - significance at P<0.05; ** - significance at P<0.01; *** - significance at P<0.001; - no significant effect.
Disclaimer/Publisher’s Note: The statements, opinions and data contained in all publications are solely those of the individual author(s) and contributor(s) and not of MDPI and/or the editor(s). MDPI and/or the editor(s) disclaim responsibility for any injury to people or property resulting from any ideas, methods, instructions or products referred to in the content. |
© 2024 by the authors. Licensee MDPI, Basel, Switzerland. This article is an open access article distributed under the terms and conditions of the Creative Commons Attribution (CC BY) license (http://creativecommons.org/licenses/by/4.0/).
Copyright: This open access article is published under a Creative Commons CC BY 4.0 license, which permit the free download, distribution, and reuse, provided that the author and preprint are cited in any reuse.


