
Submitted:
20 June 2024
Posted:
20 June 2024
You are already at the latest version
Abstract
This paper investigates five different GARCH models (GARCH, EGARCH, IGARCH, Component GARCH (CGARCH) and GJR-GARCH) along with six distributions (Normal, Student’s t, GED and their skewed forms), which are used to forecast the volatility for the Bulgarian Stock index SOFIX. We use a GARCH model to predict how much time it will take, after the latest crisis, for the SOFIX index to reach its historical peak once again. The empirical data covers the period between the years 2000 and 2024, including the 2008 financial crisis and the COVID-19 pandemic. The purpose is to answer which of the five models is the best at forecasting the volatility of SOFIX and which distribution is most appropriate. The results, based on BIC and AIC information criteria, show that the ARMA(1,1)-CGARCH(1,1) specification with the Student t-distribution is preferred for forecasting. With the help of 5000 simulations, it is estimated that the chances of Index SOFIX reaching its historical peak value of 1976.73 (08.10.2007) are higher than 90% at 13.08.2087.
Keywords:
SOFIX
; forecasting
; modeling
; GARCH
; EGARCH
; IGARCH
; Component GARCH
; GJR-GARCH
1. Introduction
In econometric studies of time series composed of financial indicators, heteroskedasticity is usually observed in the residuals. This is determined by the fact that some time periods are riskier than others, i.e. fluctuations in terms of random error in one period are more significant compared to fluctuations in another period. This heteroskedasticity of the series and clustering of large fluctuations in certain periods is referred to as volatility clustering in the literature. The parameter estimates obtained with the least squares method are unbiased. However, the standard errors of the parameters are underestimated, and the confidence intervals are in a narrower range, which in turn leads to erroneous decisions about the significance of the parameters.
Financial econometric models are based on different assumptions about the correlation relationships inherent in the time series under analysis, formed by the levels of certain financial indicators (prices, incomes, income growth, etc.). One part of the models assumes that price increases are equivalent to random processes similar in properties to "white noise". This assumption is at the heart of the so-called "random walk hypotheses" (RWH). Three versions of these hypotheses are described in the scientific literature, which differ from each other in the content of the concept of "white noise" (Tikhomirov and Dorokhina 2002, 347).
The versions of the RWH differ from each other in the presence of certain regularities in the series with functional transformations of these increments (random errors) and in the presence of heteroscedasticity in the residuals. For RWH-1 and RWH-2, the complete absence of correlations between the squares of the random errors (and also of their third, fourth, etc. powers) is assumed. In RWH-2, uncorrelated variance changes are assumed, and with RWH-3, the existence of correlated relationships is confirmed both between the second, third, and higher degrees of the random errors and with respect to the series obtained as the product of the random errors.
Price changes resulting from extraordinary events do not reflect the impact of a number of other more significant events. The information that is continuously released to the market influences, to a considerable extent, the quotation levels and can lead to drastic fluctuations within one business day. The conditional variance of the process can be defined as a random variable whose values at any point in time depend on a number of other variables reflecting the complex market situation. The process reflecting standard deviations in the price level of financial assets is characterised by a much wider range of patterns. Two main hypotheses regarding the variance volatility associated with RWH-3 are considered in the literature. According to the first hypothesis, the values of conditional variances can be viewed as a conditional standard deviation representing a function of previous values. According to the second hypothesis, the conditional variance is independent of the price level, but it is assumed that the variable can be represented as an autoregressive model with chained means, i.e. whereby the value of the indicator at time t is determined by the previous values and the random element.
Considering that as a result of the impact of the World crisis of 2008 and the Covid pandemic of 2019 there were turbulences in the financial markets and a huge decline in the stock market not only in Bulgaria but also globally, the purpose of this paper is to investigate the volatility of the returns of the oldest index of the Bulgarian Stock Exchange SOFIX since its launch using different variants of GARCH models. Adapting the step-by-step guide developed by Perlin et al. (2021), based on 5000 simulations, it is predicted when SOFIX will reach the historical peak again and accordingly the expected value of the time it will take the market to recover from the current crisis. The extent to which the impact of the 2008 World Crisis and the impact of the COVID-19 pandemic are manifested is also assessed. The main differences from the algorithm applied in Perlin et al. (2021) and here are observed in the following directions. First, more variants of the GARCH models are tested in this study. In addition to GARCH, EGARCH, and GJR-GARCH used in the original work, IGARCH and Component GARCH are also approbated in this study. Second, instead of only normal and Student t-distributions of the residuals, 6 types of distributions are applied here – normal, Student’s t, GED and their skewed forms. Third, in computing forecasts using simulations, larger horizons are used, both in terms of covering the period in the past and in terms of the forecast horizon. In order to capture the potential impact of the mentioned crises, all information from the creation of the index to the present moment, i.e. 25 years, is used in the forecasting exercise. The forecast horizon is also much wider and, in this case, covers a period of 75 years. Fourth, a stage is added where the time series constructed from the daily returns of the SOFIX is subjected to a stationarity test. This is missing in the original publication.
The modelling of stock indices traded on the Bulgarian Stock Exchange by GARCH models has been the subject of research in a number of publications by Bulgarian and foreign authors (Gerunov 2023), (Milinov and Kanaryan 2006), (Patev, Kanaryan and Lyroudi 2009). Petkov (2010) tests the validity of the GARCH(1,1) model with respect to the daily returns of the four stock indices of the Bulgarian Stock Exchange - SOFIX, BG40, BGTR30 and BGREIT. The results of the empirical analysis show that the validity of the standard GARCH(1,1) model is confirmed only with respect to the returns of the BGREIT index. Mainly under the influence of new information, a high degree of persistence of volatility is found, i.e. the impact of shocks on quotes is manifested for a significant period of time after their occurrence. For the BG40 and BGTR30 indices, it is found that GARCH models postulating asymmetry of the series would be more appropriate, while for the SOFIX index, the data confirm the presence of only ARCH effect.
Paskaleva and Stoykova (2021) investigate the impact of the world stock markets and the main indices traded on them (France - CAC 40, Germany - DAX, United Kingdom - FTSE 100, Belgium - BEL - 20, Romania - BET, Greece - ATHEX20, Portugal - PSI-20, Ireland - ISEQ-20, Spain - IBEX35 and USA - DJIA) on the Bulgarian stock market and the SOFIX index, respectively, as well as their performance for the period from 03.03.2003 to 30.06.2016. The research period is divided into three sub-periods - pre-crisis (from 03.03.2003 to 29.12.2006), crisis (from 02.01.2007 to 28.12.2012) and post-crisis (from 03.01.2013 to 30.06.2016) and DCC-GARCH and TGARCH models are tested. The results of the empirical analysis show that the stock markets in the USA and Germany have the most significant impact on the Bulgarian stock market, and this is particularly pronounced during the global financial crisis. It is also found that the stock markets of the United Kingdom, Greece, Ireland, Portugal, Romania and Bulgaria are inefficient, while the German stock exchange could be defined as efficient.
Petrova and Todorov (2023) estimate and forecast the volatility of the net asset value of 42 Bulgarian investment funds based on daily data for the period 13.07.2020 to 13.07.2023. For this purpose, the authors fit GARCH, EGARCH, TGARCH and GARCH-M models with specification (1,1). The results of the empirical study show that the investment fund with the highest concentration of risk is the Golden Lion Index 30, which is found from GARCH, EGARCH and GARCH-M models. In fitting the different models, it is also found that the GARCH and EGARCH models successfully optimise the regression parameters of the final equation for all investment funds analysed, resulting in adequate predictions. GARCH-M and TGARCH models were found to be inapplicable for some of the investment funds due to zero value of the parameters in the regression equations.
Tsenkov and Stoitsova-Stoykova (2017) estimate the market efficiency of eleven stock markets in Southeastern Europe (SEE) - Bulgaria, Croatia, Greece, Serbia, Slovenia, Turkey, Romania, Montenegro, Macedonia, Banja Luka and Sarajevo (Bosnia and Herzegovina) by applying GARCH, EGARCH, TGARCH and PGARCH models. The study covers the period from 01.01.2004 to 04.11.2015, focusing on the importance of the 2008 global financial crisis for the efficiency of the markets. The results of the empirical study show that eight of the eleven markets analysed are market inefficient according to the Efficient Market Hypothesis (EMH) throughout the study period. From the pre-crisis to the crisis period, five of the analysed indices decrease their market efficiency. The indices with relatively high market efficiency in the post-crisis period have the highest number compared to the previous periods. Therefore, according to the authors of the study, stock markets in SEE countries are not homogeneous in the context of the Efficient Market Hypothesis.
The results in (Tsenkov 2011) show the leading influence of the DJIA relative to the dynamics of other indices, especially pronounced in the period of the global financial crisis. It is also found that the EMH with respect to the Bulgarian capital market is rejected, as well as the presence and direction of influence on it by developed capital markets. As a result of econometric modelling of the returns and volatility of the studied indices by EGARCH models, it is found that the negative information manifests itself more recently and significantly on the values of the SOFIX index. Differences in the reflection of market information and the determinant influence of the DJIA by the DAX and SOFIX are also found, as well as that 47.28% of the volatility of the Bulgarian index is explained by the impact of the US index.
Petrică, Stancu, and Ghițulescu (2017) investigate the volatility of the stock indices of the London Stock Exchange (FTSE) and the Bulgarian Stock Exchange (SOFIX), i.e., a developed stock market and an emerging stock market, for the period from 04.01.2010 to 27.09.2016 using asymmetric GARCH models, EGARCH and PARCH. The results of the empirical study show that the FTSE index is characterised by leverage effect, and the most appropriate model to account for conditional variance is the PARCH model (1,1), while for the SOFIX index, EGARCH and PARCH models are found to be inappropriate. Given this, the authors believe that when studying emerging stock markets, which include the Bulgarian Stock Exchange, it is more appropriate to use symmetric GARCH models.
Ugurlu, Thalassinos and Muratoglu (2014) model the volatility of stock market returns of the following stock market indices: Bulgarian Stock Exchange (SOFIX), Prague Stock Exchange Index (PX), Warsaw Stock Exchange (WIG), Budapest Stock Index (BUX) and Istanbul Stock Exchange National 100 Index (XU100). The methodology of the econometric analysis includes GARCH, GJR-GARCH and EGARCH models, and the period of the study is from 08.01.2001 to 20.07.2012. The results of the analysis show that pronounced GARCH effects exist in all stock markets except the Bulgarian stock market and the SOFIX index. Therefore, the authors recommend testing GARCH models of different order for Bulgaria in subsequent studies. For the other four markets, the authors find that shocks are characterised by persistence, and the impact of old news on volatility is significant, with the Warsaw Stock Exchange having the longest memory of the variance. The empirical results also show that bad news increases volatility and leverage effects in market returns. The authors recommend that multivariate dynamic models should be tested in the future, especially when examining the daily returns of emerging stock markets.
Arneric and Scrabic-Peric (2018) investigate the presence of weekday effects on major stock indices for the following 10 emerging European stock markets - Romania (BETI), Hungary (BUX), Croatia (CROBEX), Latvia (OMXRGI), Estonia (OMXTGI), Czech Republic (PX), Slovenia (SBITOP), Bulgaria (SOFIX), Poland (WIG20) and Slovakia (SAX) for the period from 04.01.2007 to 13.05.2015. The results of the econometric analysis prove the significance of the common Monday effects in the mean and variance equations, while the Tuesday effect is significant only in the mean equation. Volatility persistence is also found in the observed emerging stock markets. Based on the results obtained, the authors believe that stock markets in Hungary, Romania, Poland, Slovakia and the Czech Republic are expected to be riskier in the future, while a low level of unconditional volatility characterises those in Estonia, Latvia, Slovenia, Croatia and Bulgaria. In the longer term, high positive cross-correlation is also expected between stock markets in Poland and the Czech Republic, Poland and Hungary, and Poland and Croatia, and negative, but close to zero, between Slovakia and the other countries.
In recent years, a significant number of authors have focused in their academic publications on the impact of the COVID-19 pandemic on the world economy and, in particular, on the development of financial markets. Iqbal, Manzoor and Bhatti (2021) examine the effect of COVID-19 on the volatility of Australian stock returns and the effect of negative and positive news for the period from 27.01.2020 to 29.12.2020. The authors apply GARCH and EGARCH models to account for asymmetry and implied leverage. News related to the negative effect of COVID-19 on the Australian economy and health system is reported as bad news, and government measures, in the form of monetary and fiscal policies implemented, are reported as good news. The S&P/ASX200 index is used as a proxy for the Australian stock market and a weighted stock return is applied. The empirical results show that the EGARCH model is more appropriate for identifying asymmetry and leverage in estimating the volatility of Australian stock returns. It is also found that when news is excluded from the equation, the EGARCH model is characterised by a larger/less leverage effect of negative/positive shocks on conditional volatility compared to a model that includes the news effect.
Gherghina, Armeanu and Joldes (2021) using GARCH (1,1) models examine the volatility of daily returns of the BET index and twelve companies traded on the Bucharest Stock Exchange for the period between 02.01.2020 and 30.04.2021. The results of the empirical study indicate the presence of periods of high resilience, as well as periods of high and low volatility on the Bucharest Stock Exchange. Capital market volatility in Romania in the first quarter of 2020 reaches a level very close to that recorded during the global financial crisis. Over the next two quarters, volatility has a downward trend, with no causal link established between the impact of COVID-19 and the dynamics of the BET index.
Khan et al. (2023) examine the volatility of financial markets during the COVID-19 pandemic. The econometric analysis is based on daily data for the period from 27.11.2018 to 15.06.2021, and the models fitted are GARCH (1,1), GJR-GARCH (1,1) and EGARCH (1,1). The empirical results show high volatility persistence in all financial markets during the COVID-19 pandemic. EGARCH is derived as the most appropriate model to identify the volatility of financial markets before the COVID-19 pandemic, while during the pandemic, as well as for the entire study period, all three models are appropriate to model the financial markets included in the study.
Ouchen (2023) investigates the possibility of forecasting the daily returns of the major global stock indices (SSE, S&P500, FTSE100, DAX, CAC40 and NIKKEI225) using GARCH and EGARCH models during two separate periods - before COVID-19 (from 01.06.2019 to 30.11.2019) and post-pandemic (from 31.12.2019 to 01.06.2020). The results of the study show that GARCH and EGARCH models are suitable for modelling conditional variance, whose values indicate an increase in stock market volatility during the post-COVID-19 pandemic period compared to the pre-pandemic period. This instability is most pronounced in early January 2020 for the Chinese stock market and in March 2020 for the other five stock markets. During both periods examined, the Frankfurt Stock Exchange is characterised by the highest volatility.
Ncube, Sibanda and Matenda (2024) investigate the impact of the COVID-19 pandemic on stock market volatility in sub-Saharan Africa, and more specifically on two large and two small stock exchanges in the region, the Johannesburg Stock Exchange (JSE) and Nigeria Stock Exchange (NGX) and the Zimbabwe Stock Exchange (ZSE) and Lusaka Stock Exchange (LUSE), respectively. The analysis is based on daily stock data, COVID-19 indicators and macroeconomic indicators for the period January 2019 to July 2022. GARCH volatility estimation models and Explainable Artificial Intelligence (XAI) in the form of SHapley Additive exPlanations (SHAP) are fitted to identify significant factors that influence stock volatility during the pandemic. The empirical results find significant increases in volatility at the onset of the pandemic, with government measures leading to more pronounced effects in larger markets, while population vaccination programs have an impact toward reducing volatility. Increased stock market volatility has also been found to result mainly from government measures to contain the spread of the pandemic rather than from its initial manifestation. The authors argue that to reduce the negative effects of the pandemic, governments need to implement policies to limit the spread of the pandemic on economic stability and, for investors, policies to diversify investments.
Setiawan et al. (2021) examine financial market volatility resulting from the COVID-19 pandemic and its impact on returns in two types of economies, emerging (Indonesia) and developed (Hungary), using a GARCH model with specification (1,1). The empirical study covers the period from 27.09.2006 to 31.08.2021. The results show that the COVID-19 pandemic has a negative impact on stock market returns in both developing and developed economies. Stock market volatility is also found to be more pronounced during the COVID-19 pandemic than during the global financial crisis. Higher negative stock market returns and volatility during the COVID-19 pandemic caused a contraction in economic activity, which has implications for supply and demand shocks. The authors find that advanced economies were able to more easily implement policies to limit the impact of the pandemic compared to countries with more limited financial resources. Fiscal and monetary policies are highlighted as a means of stabilising the economy and maintaining investor confidence in the two stock markets studied.
Tabash et al. (2024) compare stock returns and volatility in developed (Italy - FTSE Italia All Share, Canada - S&P/TSX, France - CAC 40, Germany - DAX, Japan - Nikkei 225, UK - FTSE 100 and the USA - Nasdaq 100) and emerging (Brazil - BOVESPA, China - SSE Composite Index, India - S&P BSE Sensex, Indonesia IDX Composite, Mexico - S&P/BMV IPC, Russia - MOEX 10 and Turkey - BIST 100) stock markets between the 2008 financial crisis and the COVID-19 pandemic. The methodology of the study includes GARCH, EGARCH and TGARCH models, and the empirical results show that emerging and developed markets react differently to these two crises - while emerging markets react similarly in both crisis periods, developed markets respond differently. They are significantly more volatile and sensitive to the effects of the global pandemic of 2019 than to the financial crisis of 2008.
2. Materials and Methods
Models describing correlations between the squares of the deviations and the average price level have been proposed by Engle (1982) and are known in the literature as ARCH models (Autoregressive Conditionally Heteroskedasticity Models). They are used to predict volatility (variation) in time series and are widely used to assess financial risk by modelling the volatility inherent in financial markets. Periods of high volatility are followed by periods of even higher volatility, and vice versa - periods of low volatility are followed by periods of even lower volatility. This means that volatility manifests itself in the form of clusters that are useful to investors when deciding to purchase relevant financial assets over a period of time. ARCH models are based on the idea that the standard deviation in the time series at the present time is affected by the forecast error in past periods. The higher the value of the error, the higher the value of the standard deviation and vice versa.
ARCH models in the literature have been summarised in different ways. A useful one from a practical point of view is the variant proposed by Bollerslev (1986), called the GARCH model (Generalized Autoregressive Conditionally Heteroskedasticity Model). It measures, models and predicts the volatility (expressed by standard deviation) in the series, which determines their application in risk management areas, in the selection of financial assets in the investment portfolio, or in secondary market pricing. The term 'autoregressive conditional heteroskedasticity' means that the model specifies, in addition to the mean, the prior-period dependent variance.
The general form of a GARCH model of order (p,q) characterises the dependence of current variance variability (i.e., in period t) on past changes in the indicators under study and past variance estimates ("old news"):
where p is the order of the GARCH effect of conditional variance ht, q is the order of the ARCH effect of random variance εt, and is a constant term.
The GARCH(1,1) model can be represented by the following system of equations:
where:
μ is the mean of the return rt;
εt - the random error (shock term), considered as an innovation process with mean equal to zero and conditional variance σt2 or ht, that is dependent on the available information on returns to period t-1. The shock term is calculated as follows:
where ht is conditional volatility and zt is a white noise error with mean equal to zero and unit variance, zt~N(0,1).
Equation (2) specifies the returns equation, known yet as a conditional mean equation, that specifies return dynamics. Here, it includes mean and autoregressive (AR) component (reflecting the impact of the previous day's returns) and the variance estimate, but in practice, it may also include a moving average (MA) component. In this case, we can say that the model is ARMA(1,0)-GARCH(1,1). Decomposition of daily returns into expected conditional mean returns and innovations, which are represented as a standardised "white noise" process with time-varying conditional variance is very convenient and feasible. On the one hand, all the necessary information is used, and the model is correctly specified. On the other hand, the volatility is known or predetermined at time t-1.
Equation (3) specifies the volatility (conditional variance), which includes the ARCH (squared residuals of the previous day's returns or the most recent information) and GARCH factors (autoregressive component characterising the new information). The coefficients α and β must satisfy the stationarity conditions, namely α≥0, β≥0 and α+β≤1. The sum of the parameters α and β reflects the degree of stationarity preservation and is known as persistence.
One of the main limitations of ARCH and GARCH models is their symmetry. They are influenced by the absolute values rather than the actual signs of the variances, i.e. negative and positive changes of the same magnitude have identical influence on the future values of the conditional variance. In asymmetric models, bad and good news have different impacts on future actions. A comprehensive review of the different types of asymmetric GARCH models is given in Andersen et al. (2006). In the present study, only those models that have been validated in the following parts of the publication are considered.
Nelson (1991) proposed an exponential GARCH or EGARCH model that represents the asymmetric effect as a function of standardised innovations. The conditional variance ht is an asymmetric function of the lags of the random variances εt-i:
where:
αi reflects the influence of the sign of the standard deviations;
γi reflects the effect of the absolute size of the standard deviations;
E|zt| is the expected value of the absolute standardised innovations zt, which is calculated as follows:
The estimate of the persistence of the conditional variance is calculated as follows:
The main characteristics of the EGARCH model can be stated as follows (Ghalanos 2022):
- The function g(zt) is linear in zt with coefficient θ+1 when zt is positive, and g(zt) is linear in zt with coefficient θ-1 when zt is negative.
- When θ = 0, large innovations lead to an increase in conditional variance when |zt|- E|zt |>0 and to a decrease in conditional variance when |zt|- E|zt |<0.
- For θ < 1, the innovation g(zt) in the variance is positive when the innovation zt is less than . Hence, negative innovations in returns εt lead to positive innovations in conditional variance when θ takes values much smaller than 1.
The condition in the standard GARCH model implies that the process is weakly stationary since the mean, variance, and autocovariance take finite and constant values over time. However, this condition is often not satisfied when there is autocorrelation in the residuals. As a result, for a large number of financial indicators, the estimate of the persistence of the conditional variance turns out to be close to unity. In such cases, the so-called integrated GARCH model, abbreviated IGARCH, proposed by Engle and Bollerslev (1986) is used. In particular, the IGARCH(1,1) process can be written as follows:
Glosten, Jagannathan, and Runkle (1993) propose a model (GJR-GARCH) in which positive and negative influences on conditional variance are represented using the indicator function I:
where γi represents the “leverage” effect. The indicator function I takes value 1 when ε ≤ 0 and value 0 when ε > 0. The persistence of the conditional variance depends on the type of asymmetry in the conditional distribution used. It is calculated as follows:
where k is the expected number of standardised residuals zt that are negative:
By f we denote the standardised conditional density with different parameters reflecting the skewness and shape of the distribution (...). For a symmetric distribution, k takes the value 0.5.
Lee and Engle (1999) propose a model (Component GARCH or CGARCH) in which the conditional variance is represented as a set of two components (permanent and transitory) that are used to capture short- and long-term effects of shock, respectively. If qt denotes the permanent component, i.e. time-varying process, which represents the long-term component of the conditional variance, and st denotes the transitory component of the conditional variance, the CGARCH(1,1) model can be written as follows (Liu and Shi 2022):
The sum α+β measures the autoregressive persistence of the transitory component, and ρ measures the autoregressive persistence of the permanent component. The immediate impacts of volatility shocks () on the short-run component is reflected by α and that of the long-run – by φ. It is constrained (α + β) < ρ to distinguish between the two components. The persistence of qt should be stronger than that of st. In order to guarantee that the immediate impact of volatility shocks of the long-run component is smaller than that of the short-run component, we let α ≥ φ. The stationarity of CGARCH(1,1) process is present if 0 < (α+β) < ρ < 1, 0 < φ< β, 0 < φ < α and ω > 0.
Testing the validity of GARCH models is reduced to verifying the existence of their characteristic roots. For this purpose, the LR-test (LR=TR2) is used, followed by a distribution with degrees of freedom (φ) equal to the sum of the lag variables used in the models for εt-i and ht-j. T is the number of observations in the time series, and R2 is the coefficient of determination corresponding to the applied conditional variance model (ht). If the empirical value of the LR test is greater than the critical value of , the model is assumed to be adequate. The parameter estimates are computed using the maximum likelihood method by maximising the function:
Taking the natural logarithm of LL, we obtain the log-likelihood function:
Parameter estimates using the maximum likelihood method are obtained by maximising the specified likelihood function, which raises the question of the proper selection of the conditional distribution of εt. In the present study, the most commonly used distributions in the specialised literature, i.e., normal, Student t-distribution, Generalized Error Distribution (GED) and their skewed variants, are applied (see Table 1).
The designations in the table are as follows:
3. Results
We adapt the algorithm in estimating GARCH models used by Perlin et al. (2021) and the programming code is available for download in GitHub (https://github.com/ip4-2023/garch-sofix/). The steps are as follows.
- Initial data preparation
- Calculation of descriptive statistics for SOFIX
- Testing for stationarity
- Check for ARCH effects
- Testing different variations of GARCH models
- Selection of the best ARMA-GARCH model for SOFIX analysis, including changes in the variance equation and distribution parameters
- Simulating and forecasting future SOFIX levels
3.1. The Data
This study tests the validity of different versions of GARCH models with respect to the daily return of the SOFIX index traded on the Bulgarian Stock Exchange, which is calculated as follows:
where:
It is the index quote for day t at market close;
It-1 is the index quote for the previous day at market close.
The calculation of SOFIX started on 20.10.2000 with a base value of 100. It includes the most liquid issues of 15 Bulgarian joint-stock companies with a capitalisation of at least BGN 40 million and at least 500 shareholders. This study covers the period from the launch of the index until 28.03.2024. Data for the period from 26.11.2001 has been obtained using the website https://stooq.com, while data for the first year has been sourced from a previous study (Petkov 2010) using https://www.infostock.bg.
3.2. Descriptive Statistics and Figures for SOFIX
Figure 1 shows the evolution of the SOFIX index, panel (a), along with its daily log returns, panel (b).
Figure 1 presents the value of the SOFIX index in Panel (a) and its corresponding log return in Panel (b). The red circles in Panel (b) indicate the largest 10 absolute (positive or negative) price changes found in the time series of log returns. Using Panel (b) in Figure 2, we can see that most of the values for the returns hover around zero. Large changes in prices, both in the downward and upward order, alternate in relatively short periods. That pattern of behaviour is noted in the literature as volatility clustering. Of the ten highest absolute values in price changes, seven occur at the start of the index launch, two (on 22.1.2008 and 19.11.2008) are recorded in the 2009 financial crisis, and one - at the start of the Covid pandemic (10.3.2020, two days after the date of the authorities declaring an emergency). Only two absolute changes at the beginning of the period have a positive sign, and all others are negative. These effects should be considered when modelling returns, which fully justifies the use of GARCH models.
Table 2 shows descriptive statistics of the SOFIX return. The most important values are skewness, kurtosis and Jarque Bera statistics. Positive skewness means that the distribution has a long right tail, and negative skewness implies that the distribution has a long left tail. If the kurtosis is more than 3, the distribution is peaked (leptokurtic), and if the kurtosis is less than 3, the distribution is flat (platykurtic) relative to the normal. Jarque Bera test is a goodness-of-fit test of whether sample data have a normal distribution. It is distributed with 2 degrees of freedom.
3.3. Testing for Unit Roots
The stationarity of the SOFIX index was investigated using the augmented Dickey and Fuller (Dickey and Fuller 1981) test (ADF), Phillips and Perron (Phillips and Perron 1988) test (PP), Elliott, Rothenberg and Stock (Elliot, Rothenberg and Stock 1996) test (ADF-GLS) and Kwiatkowski, Phillips, Schimdt and Shine (Kwiatkowski, et al. 1992) test (KPSS). These four tests differ with respect to the null and alternative hypotheses. In the ADF, PP and ADF-GLS tests the null hypothesis is that the series has a unit root, and the alternative is that it is stationary, compared to the KPSS test where the null and alternative hypotheses are reversed. The main difference between the Phillips-Perron (PP) test and the ADF test lies in the way in which serial correlation and heteroskedasticity in the errors are accounted for. While the ADF test uses parametric autoregression to approximate the ARMA structure of the errors in the test regression, the PP test ignores serial correlation in the test regression. The first advantage of the PP test is its robustness to offering general forms of heteroskedasticity in the error term. Its other main advantage is that the user does not have to specify a lag length for the test regression (Zivot and Wang 2006, 127). Arltová and Fedorová (2016) in their study analysing the main problems in the use of unit root tests based on the statements of Pesaran (2015) and Zivot and Wang (2006), confirm that the main problem of all unit root tests is related to their dependence on the length of the time series under analysis. They point out that the other advantage of the PP test due to asymptotic theory is that the test is designed to test unit roots in long time series. The main disadvantage of the ADF and PP tests is their power when the unit root value approaches unity. In these cases, the probability of not rejecting the null hypothesis even when it is not true is high (Enders 1994, 251). Although it is argued that the KPSS test due to the reversal of the null and alternative hypotheses avoids the disadvantage associated with power in the ADF and PP tests (Charteris and Strydom 2011, 58), according to Caner and Killian (2001), even the KPSS test suffers from a similar disadvantage. Moreover, the power of the three tests has been shown to be lower in the case where a linear deterministic trend is included in the test regression model. This is why Arltová and Fedorová (2016) recommend the ADF-GLS test and the NGP test proposed by Ng and Perron (1995), where the power problem is absent. Using simulation methods, the authors perform a comparative analysis for appropriate tests for different lengths of time series and values of the parameter in front of the unit root phi 1. They find that in the case of very long time series (for T = 500), the results of all the analysed tests were very similar. The best results for phi 1 < 0.9 were achieved by the NGP, ADF and PP tests, and for phi 1 > 0.9 by the ADF-GLS and NGP tests.
As can be seen from the results presented in Table 3, all the tests conclude that the SOFIX series are stationary with respect to the first differences. In terms of levels, ADF, PP and ADF_GLS confirm stationarity, while with KPSS, it is assumed that a unit root is present. Since the two criteria (ADF and PP) where the null hypothesis assumes that there is a unit root have problems in terms of their power, i.e. the null hypothesis is not true, but it is not rejected, and in this case, the situation is reversed, the log returns were used as the basis for estimating the conditional mean and variance equations. This conclusion is confirmed by the ADF-GLS test, in which the power problems are absent.
3.4. Testing for ARCH Effects
Testing for ARCH effects is performed using the Lagrange multiplier (LM) test (Engle 1982), which is based on a regression model describing the relationship between residual components and their lags. The null hypothesis states that all coefficients prior to lag variables are statistically insignificant, i.e. there are no ARCH effects in the analysed time series. Table 4 reports the results of the LM-ARCH test with lag order of up to 5, the number of working days in the week that is enough to capture the volatility memory in daily returns.
The p-value of the LM test in each of the lag orders tested is less than 0.01. This means that with a 1% risk of error we can conclude that the probability of existence of an ARCH effect in the time series composed of the SOFIX index values is too high.
Figure 2 exhibits the squared return series of SOFIX for the sample period stated above. The figure shows that there are periods of time when volatility is too high and periods when volatility is characterised by low values.
Taking also into account the values of the autocorrelation function of squared daily return that is presented in Table 5 and Figure 3, we can draw the general conclusion about the presence of volatility clustering. From a statistical point of view, the volatility clustering implies a strong correlation between the values of squared returns.
The results of volatility clustering and the presence of ARCH effect in the return series allow us to proceed to the next stage of the algorithm execution, namely analysing GARCH-type models, which involves estimating the conditional variance.
3.5. Estimating a GARCH Model
The estimation of GARCH models1 is performed by determining the number of lags in each part, specifying the mean and the variance equations, as well as the parameter distribution. In our case, five variants of the models are included, each of which is tested assuming the validity of six distributions - normal, Student's t, GED and their skewed forms. A total of 30 models are evaluated. All models are presented in Table B1 in Appendix B. Only a constant is included in the equation of the mean (that is no AR, neither MA components are included), and only one lag for each component is included in the equation of variance. The best 10 models according to the BIC information criterion are presented in the following table.
Analysing the values of the information criteria, we find that the top 10 models lie in the range of 0.008-0.009. Four of them are Component GARCH models estimated with the Student t-distribution and GED, as well as their skewed variants. The remaining 6 models are standard GARCH, EGARCH and IGARCH, estimated with the standard and skewed Student t-distributions. By focusing on the alpha1 and beta1 estimates, we can eliminate the validity of the two IGARCH models because beta1 is statistically insignificant. In the standard GARCH model, the parameters are significant, but their sum is 0.999, raising reasonable doubts about satisfying the stationarity requirement. In the two EGARCH models, the alpha1 parameters, in addition to being statistically insignificant, are also negative in sign, which does not satisfy the stationarity conditions, casting doubt on their validity. In all four versions of the CGARCH models, the alpha1 and beta1 parameters are statistically significant at 1% risk of error, and their sum is less than 1. The parameters pho and phi are also statistically significant, which strengthens the conclusion about the adequacy of the CGARCH model in forecasting the volatility of SOFIX.
3.6. Selection of the Best ARMA-GARCH Model
Selection of the best ARMA-GARCH model for SOFIX analysis, including changes in the mean and variance equations and distribution parameters, is performed using the BIC and AIC information criteria. In the specification, one lag order is chosen as the maximum value for the AR and MA components in the equation of means, while in the volatility equation for the ARCH component, the maximum lag order is equal to two, and for the GARCH component, the maximum lag is one. A total of 288 models were fitted, and they are presented in Figure A1 in Appendix A. The best 10 models according to the BIC information criterion are presented in Table 7.
All models were estimated assuming the validity of a standard (7 models) or skewed (3 models) Student's t distribution. The table shows that the top five best models are confirmed by both BIC and AIC information criteria. For the rest, there are minor differences in the ordering. According to AIC, the top ten models are located within 0.006, while according to BIC, the interval is 0.005. With the inclusion of ARMA components in the mean equation, seven of the ten models are CGARCH, and three are EGARCH. Among the top ten models is the best of the models estimated without the inclusion of AR and MA components, namely CGARCH, estimated under the assumption of a t-distribution of εt. Table 8 presents the parameter estimates of the models occupying the top 6 positions. In Table B2 and Table B3 in Appendix B are presented results of the estimation of two GARCH (EGARCH and CGARCH) models to the log returns of SOFIX. Each model has one lag at the AR and MA components in the conditional mean equation, the same variance equation (q=2, p=1 and q=1, p=1 respectively) and different distribution of residuals (Student t and Skewed t).
The best six models consist of four CGARCH and two EGARCH models. Analysing the estimates of the alpha and beta parameters, we can reject the adequacy of the EGARCH models since the alpha1 and alpha2 parameters are negative and statistically insignificant. In the four CGARCH models, the constants in the mean and conditional variance equations are statistically insignificant, while the estimates of all other parameters, except the alpha2 parameters, are statistically significant at the 1% risk of error. This implies that the models that include a second lag order with respect to the ARCH component are inadequate. In the end, the SOFIX data show that ARMA(1,1)-CGARCH(1,1), estimated under the assumption of a standard or skewed Student t-distribution, turns out to be the most appropriate to describe its dynamics. The parameters pho, phi, for shape and skewness, as well as those in front of the AR and MA components are statistically significant at the 1% significance level. There are almost no differences in the estimates of the models with standard and skewed t-distributions of the residual component, and starting from BIC, the ARMA(1,1)-CGARCH(1,1) model estimated with the assumption of the standard Student t-distribution is chosen as the most appropriate one for prediction. The autoregressive persistence of the transitory component amounts to 0.904, and that of the permanent component amounts to 0.998. The immediate impacts of volatility shocks () on the short-run component is 0.242, and that of the long-run is equal to 0.060. The stationarity of CGARCH(1,1) process is present because 0 < (α+β=0.904) < ρ=0.998 < 1, 0 < φ=0.060< β=0.662, 0 < φ =0.060 < α=0.242 and ω is not taking a negative value.
3.7. Forecasting SOFIX Index with ARMA(1,1)-CGARCH(1,1) Model
Using the GARCH model identified as the best, a number of simulations can be calculated to predict future levels of SOFIX returns. The simulations are run by sequentially imputing the first level of returns in the pre-specified best model and emitting random samples from the residual distributions. This approach allows us to generate time series with an arbitrary forecast horizon, with the simulated series having the same characteristics as the original model. Based on the computed simulations, the forecast probability of reaching the historical SOFIX peak is estimated. The forecast is calculated based on 5000 simulations.
Figure 4 presents the simulation results using the GARCH model selected as the best fit in Panel (a) and the probabilities of SOFIX reaching its peak (2024-2100) in Panel (b).
First, the future values of the return logarithms are simulated, and then these simulations are used to calculate the predicted index values. The black line reflects the evolution of the index, while the grey area reflects the different simulations. The historical peak of SOFIX was reached at 08.10.2007, with the closing value of 1976.73. The last day of the sample of prices is 28.03.2024, which defines the starting point of the simulation. The simulation shows that the trend in SOFIX values is rather upward. In the long run, financial index prices tend to increase in value, and the GARCH model used is able to capture this effect. Although the simulated value of the index may decline in the short term, the probability of reaching the historical peak increases with time. The chart shows that the first simulated price that crosses the peak is too soon after 28.03.2024. In calculating the simulations for each time point, the relative fraction of times in which a value of 1976.73 is reached is calculated. The calculations continue for all future dates, resulting in a vector of probabilities. Figure 3 Panel (b) presents the actual probabilities that future values of the SOFIX will reach the peak before the global financial crisis in 2008. As might be expected, the probability increases over time. The first date, 08.05.2024, shows the first probability, which is greater than 0.1%. According to the model, the probability of the index peaking in the first two months of the forecast period is almost zero. The chances of reaching the peak value are estimated at 50% after 11.02.2034. The probability increases over time, reaching a 90% probability of an event on 13.08.2087, more than sixty years after the last day in the price sample.
4. Discussion
Following the dynamics of the SOFIX index and its returns, we find that the most significant absolute changes in its levels occur in three periods - at the beginning, at the launch of the index, during the 2009 global crisis and at the start of the COVID-19 crisis in March 2020. The index reached its peak of 1976.73 on 08.10.2007. The first seven years are very intense, and the index increases about 20 times. Then, as a result of the impact of the World Crisis, there was a sharp decline, and its levels in February 2009 dropped to 256, as they were in mid-2003. After the crisis, the trend has been smooth and upward. The interesting thing about SOFIX is that the impact of the COVID-19 Pandemic is not that significant. The index loses a little over 100 units of its value, but the recovery occurs very quickly and at the end of the period amounts to 822 units, which practically reaches the levels of 20.08.2005. Here, the question of when the levels from before the global crisis will be reached arises. This question is answered in this study, which relies on the application of five GARCH models and six different distributions of the disturbances for predicting the volatility of the Bulgarian stock index SOFIX. The performance of these models is evaluated using BIC and AIC information criteria. The ranks of any forecasting model vary depending on the choice of distribution of disturbances. In contrast to previous studies of Ugurlu, Thalassinos and Muratoglu (2014) and Petkov (2010), in which the hypothesis of GARCH effect in SOFIX index returns is not proved, this study applies a different approach. On the one hand, a much longer period containing 5780 valid observations is covered here, and on the other hand, new variants of asymmetric GARCH models are also tested. Applying an algorithm in which 288 variations of GARCH models are evaluated, the ARMA(1,1)-CGARCH(1,1) model estimated with the assumption of the standard Student t-distribution of disturbances is found to be the most appropriate. On the basis of simulations, it is found that with a 90% probability, it takes more than 60 years to reach the peak value, which sounds very discouraging for the potential of the Bulgarian economy.
Predictions about the future SOFIX levels and, more in particular, about the probability of reaching its peak values of 2007 in the Bulgarian literature have been made only by financial analysts, while those with scientifically based argumentation are missing. Minchev, in a series of analyses (2024a), (2024b), traces the three stages in the dynamics of the index and makes a simple extrapolation forecast of its future quotes. Assuming that the third stage (the lost quinquennium for the Bulgarian Stock Exchange) is already over, expecting an annual increase of 50% compared to its average of the last twenty years - that is, up to 15% growth per year, he predicts that the SOFlX index would reach its peak of 2000 points in 6.9 years or in 2031. This forecast assumes that the index will move into the next phase of long-term growth rather than on an analysis of time-series with appropriate econometric methods and models.
In the present study, the forecast is based on the ARMA(1,1) - CGARCH(1,1) model with a Student's t-distribution identified as the best of the GARCH models applied here - standard GARCH, IGARCH, EGARCH, GJR-GARCH and CGARCH, estimated with the assumption of six distributions (Normal, Student's t, GED and their skewed forms). In estimating the forecast, it is found that the volatility of the SOFIX index can be described using two components reflecting the short-run and long-run effects of shocks, respectively, which, according to Christoffersen et al. (2008), allows for its more accurate modelling. Long-term volatility is represented by a permanent component, and a transitory component represents short-term volatility. According to the results, when predicting future values, it is necessary to include both an autoregressive component and a first order moving average in the mean equation.
The parameter α, reflecting the initial impact of shocks on the transitory component of volatility, is statistically significant at the 1% level and amounts to 0.242. Hence, we can say that the initial impact of shocks on the transitory component in SOFIX volatility is substantially positive. The parameter β reflecting the degree of memory in the transitory component is also statistically significant, and its value is 0.662. The sum of the two parameters is equal to 0.904, which means that the mean of the short-run volatility tends to zero at a geometric level of 0.904.
In the equation describing the long-run volatility, all parameters are significant except the constant ω. As required, the parameter ρ tends to 1 and, in this case, amounts to 0.998. This implies that the long-run volatility reaches its mean very slowly, with the effect of historical shocks remaining constant over a long period of time. Since the parameter ρ is larger in value than the sum of the parameters α and β, we can conclude that the persistence in volatility is greater in the long-run. The parameter φ is equal to 0.060 and reflects the influence of the time-varying constant component.
From the results obtained, we can confirm the conclusion drawn by Charteris and Strydom (2011, 60) that the CGARCH model specification supports a more appropriate description of SOFIX volatility than a simple GARCH model. They employ the Component GARCH model to examine the volatility of the South African and United States Treasury-Bonds and Treasury-Bills. In estimating the four Treasury securities, asymmetric component GARCH was applied by incorporating the adjustment inherent in Threshold GARCH into the transitory component of the volatility equation. The asymmetry in volatility is present when the parameter γ is positive and statistically significant. Of the four assets, asymmetry is found only with respect to the S.A. T-Bond. The authors find, as we do in this study, that long-term shocks have a more persistent impact on volatility than the effect of short-term shocks, and furthermore, for the same magnitude, negative shocks to South African Treasury-Bonds have a more significant impact on volatility than positive shocks.
Naik and Padhi (2014), in their study, apply GARCH, EGARCH, GJR-GARCH and asymmetric CGARCH models in estimating the volatility of the S&P CNX Nifty index, one of the benchmark indices of the Indian equity markets. All models are estimated assuming Gaussian normal distribution for GARCH (1, 1), GJR-GARCH (1, 1), asymmetric CGARCH (1, 1) and Generalised Error Distribution (GED) for EGARCH (1, 1) models. Based on the AIC and BIC information criteria, EGARCH (1, 1) is determined as the best of all asymmetric models. The results show that significant asymmetry in volatility is inherent in the index under study, confirming the leverage effect hypothesis.
In contrast to our study, Naik and Paddy (2014) do not focus on the components included in the conditional mean equation but only present results concerning the conditional volatility equation. Furthermore, they do not analyse the models assuming different random error distributions, relying only on the normal distribution and the Generalised Error Distribution (GED). Finally, only GARCH models of order (1,1) are tested without estimating possibilities for other orders, as in our case.
5. Conclusions
However, as with any simulation, there is no guarantee that our forecast is the best answer and whether the calculated probabilities are realistic, especially for such a long-time horizon of sixty years. It should be noted that the GARCH model is only a limited representation of the financial sustainability indicator, and no model can perfectly reproduce the real situation. Moreover, only some of the volatility modelling methods are covered in this study. Not all asymmetric GARCH models are considered, like Bayesian estimation methods or multivariate GARCH models for example. With other methods, it is possible to obtain different results.
Author Contributions
Conceptualization, P.P.; methodology, P.P.; software, P.P.; validation, P.P., E.O. and T.V.; formal analysis, P.P.; investigation, P.P.; resources, P.P.; data curation, P.P. and A.L.; writing—original draft preparation, P.P., E.O. and T.V.; writing—review and editing, P.P. and E.O.; visualisation, P.P.; supervision, P.P. and M.S.; project administration, P.P. and M.S.; funding acquisition, M.S. All authors have read and agreed to the published version of the manuscript.
Funding
The authors acknowledge the Special Account for the Institute for Scientific Research of the D. A. Tsenov Academy of Economics, Svishtov, Bulgaria, which funded the authors in the framework of the Infrastructure research project IP4-2023 "Comparative analysis of conventional statistical methods and artificial neural networks in time-series forecasting”.
Data Availability Statement
The data and the programming codes in R are publicly available for download in GitHub (https://github.com/ip4-2023/garch-sofix/) (accessed on 19 June 2024).
Conflicts of Interest
The authors declare no conflicts of interest. The funders had no role in the design of the study; in the collection, analyses, or interpretation of data; in the writing of the manuscript; or in the decision to publish the results.
Appendix A
Figure A1.
Selecting GARCH models using BIC and AIC.
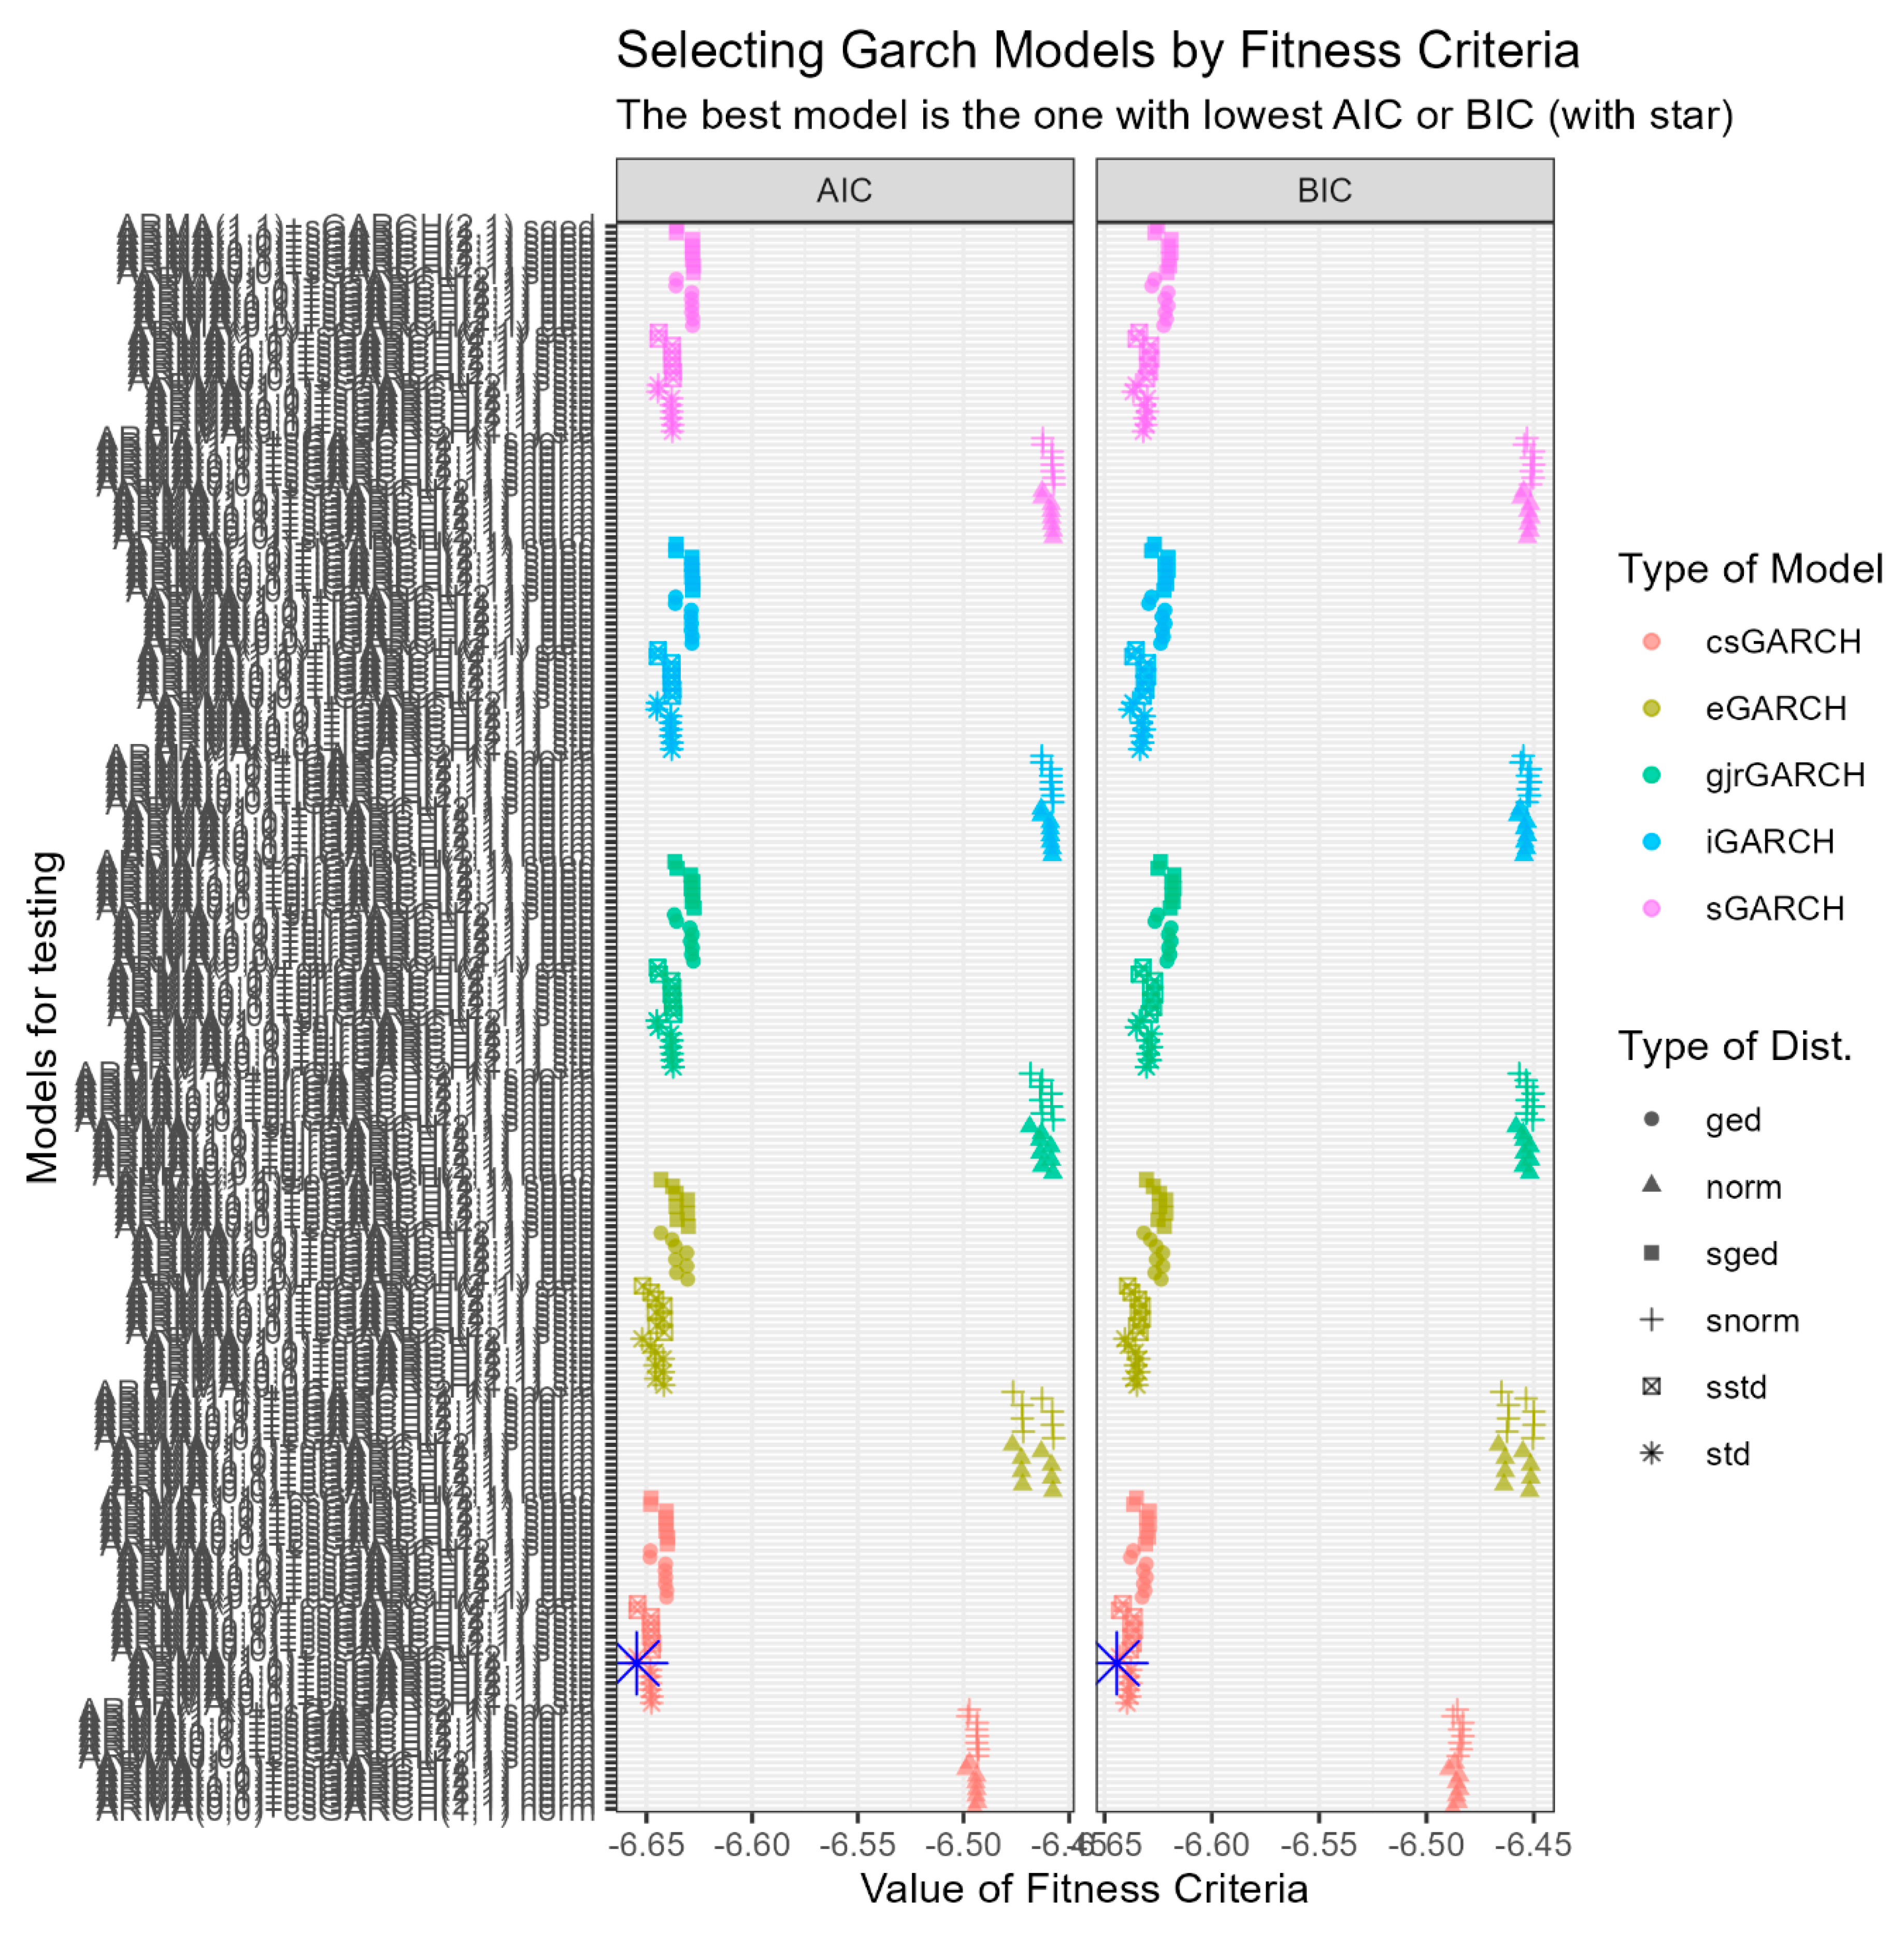
Figure A1 reports AIC (left panel) and BIC (right panel) values for different ARMA-GARCH models, changing lags, variance equation, and distribution parameters. The best model is the one with the lowest value of AIC and BIC, highlighted by the blue star. All results of the figure can be replicated using R script 05-Find_Best_Garch_SOFIX_5X6.R.
Appendix B

Table B1.
Estimation results of all 30 GARCH models.
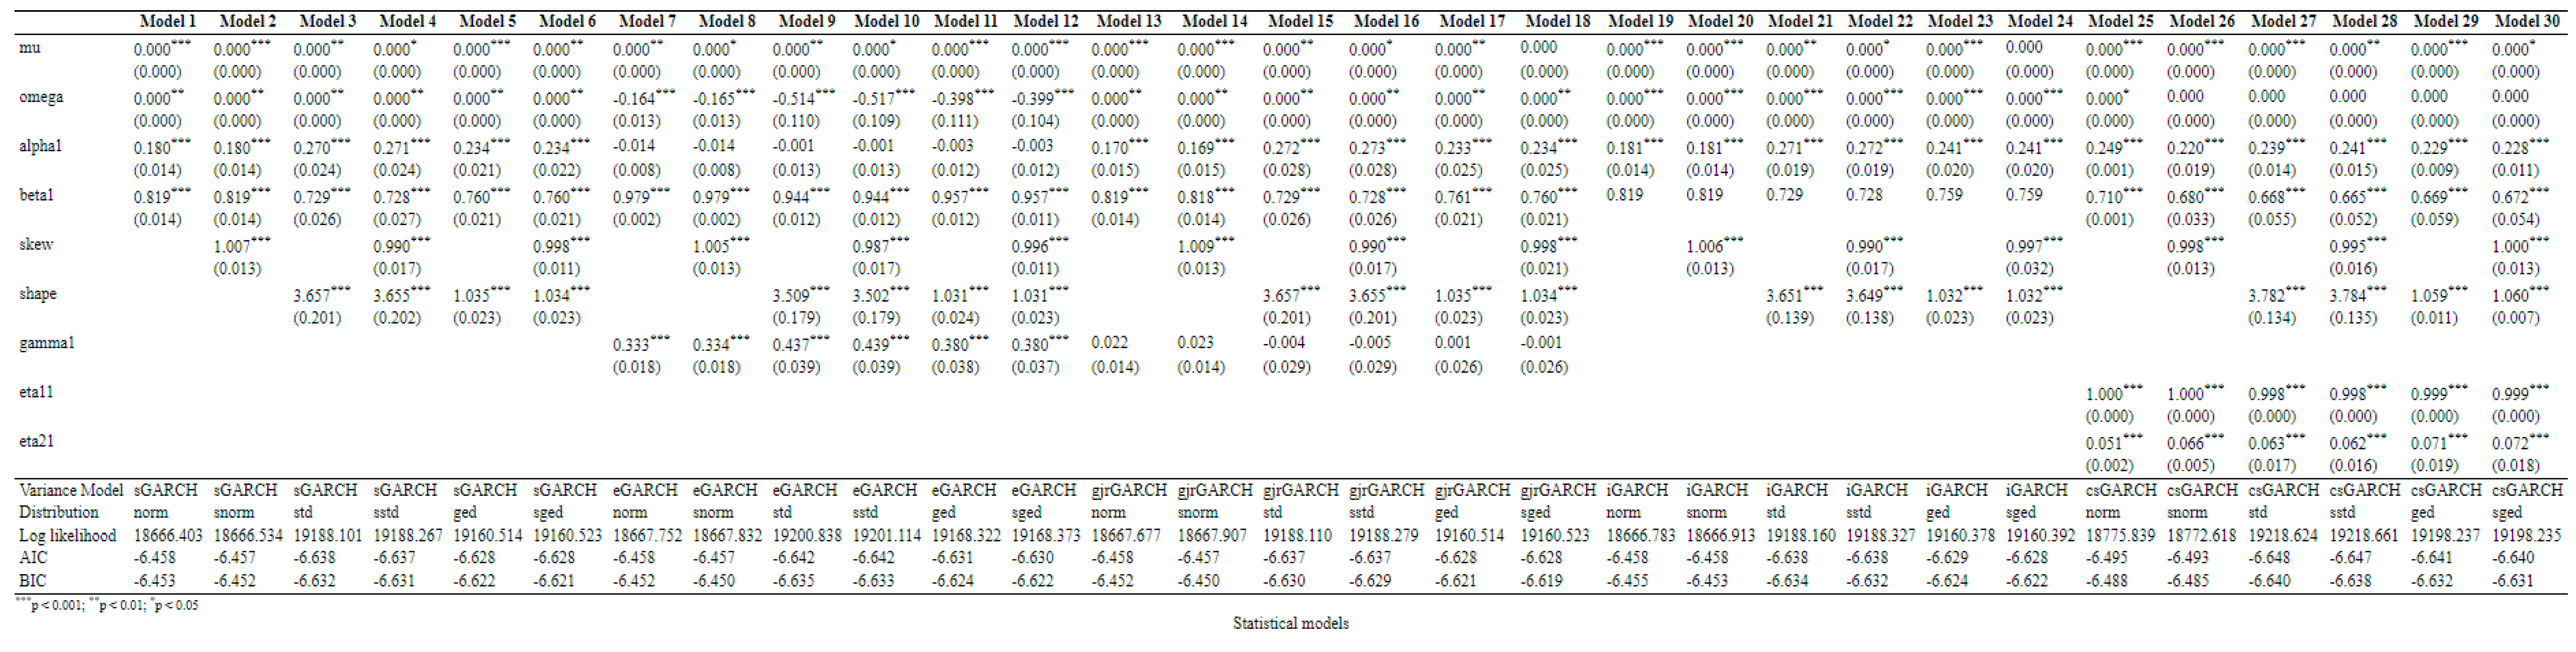 |
Table B1 presents the results of the estimation of five GARCH models to the log returns of SOFIX. Each model has a different variance equation and a different distribution of residuals. Likewise, all lags in the variance equation are the same. The results were found executing the script named 04-Estimate_SOFIX_5X6.R.
Table B2.
Estimation results of the best EGARCH and CGARCH models (part 1).
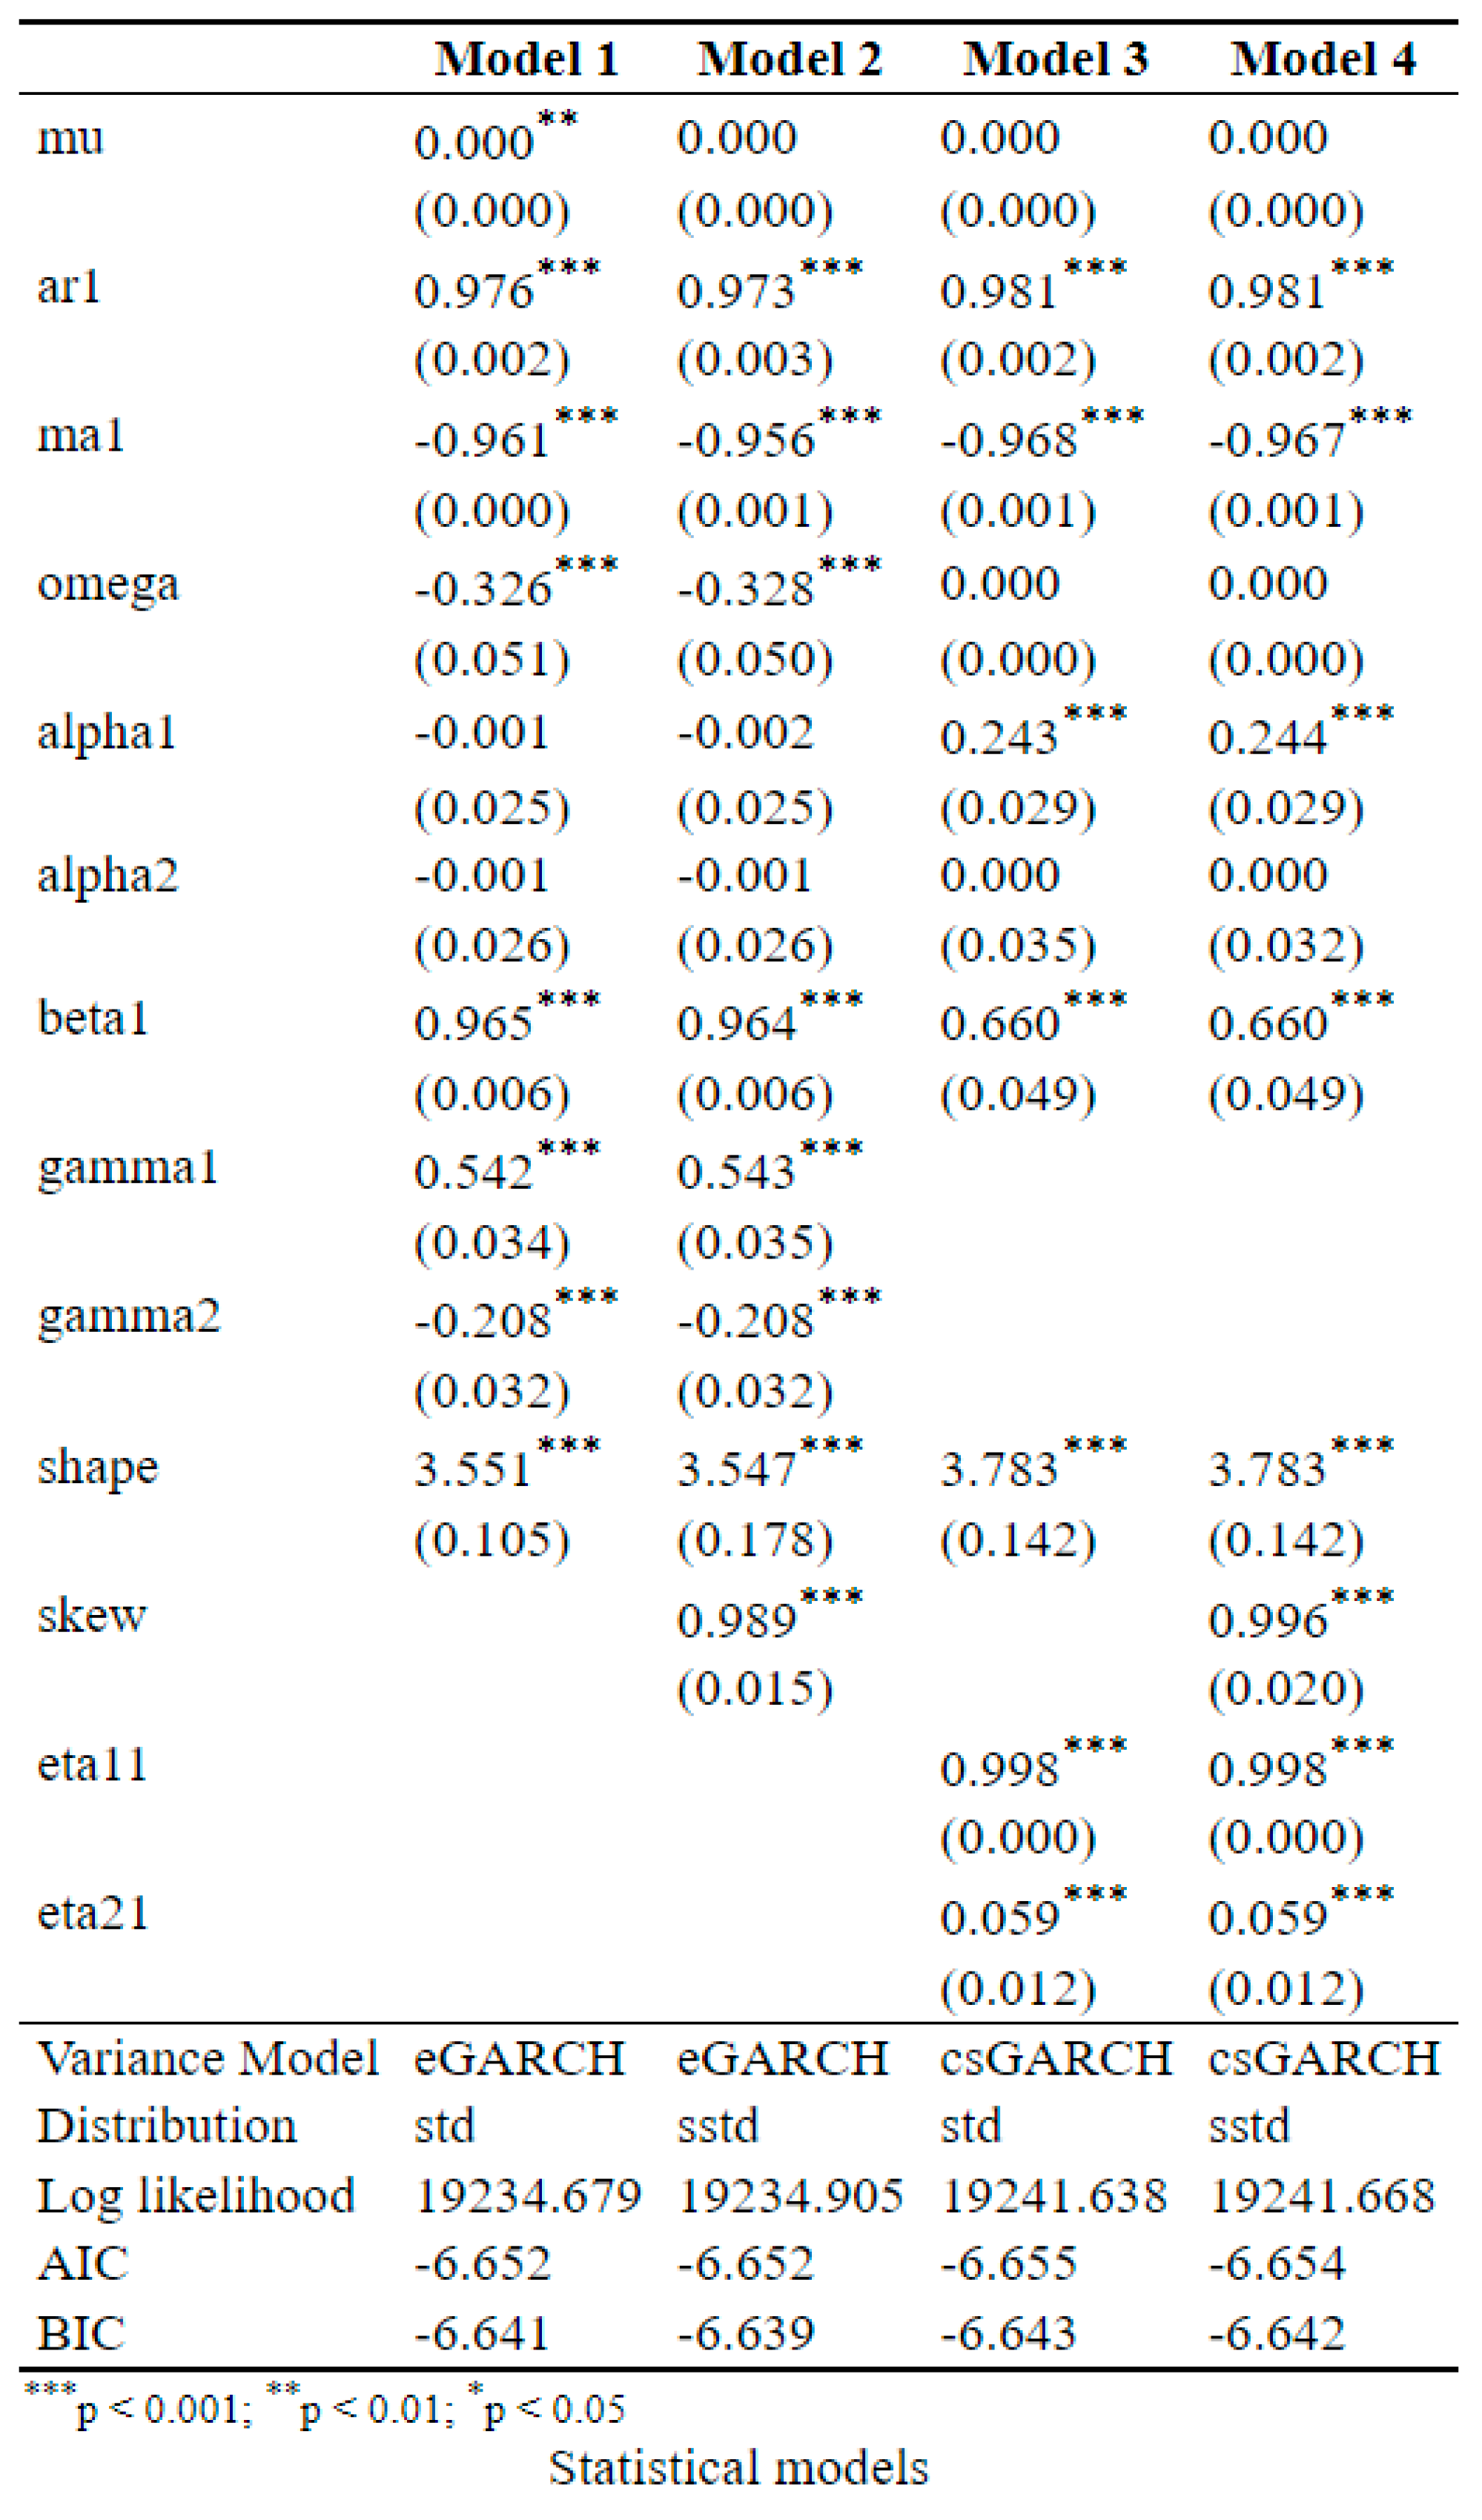 |
Table B2 presents the results of the estimation of two GARCH (EGARCH and CGARCH) models to the log returns of SOFIX. Each model has one lag at the AR and MA components in the conditional mean equation, the same variance equation (q=2 and p=1) and a different distribution of residuals (Student t and Skewed t). The results were found executing the script named 04-Estimate_BEST_GARCH_SOFIX_2X2.R.
Table B3.
Estimation results of the best EGARCH and CGARCH models (part 2).
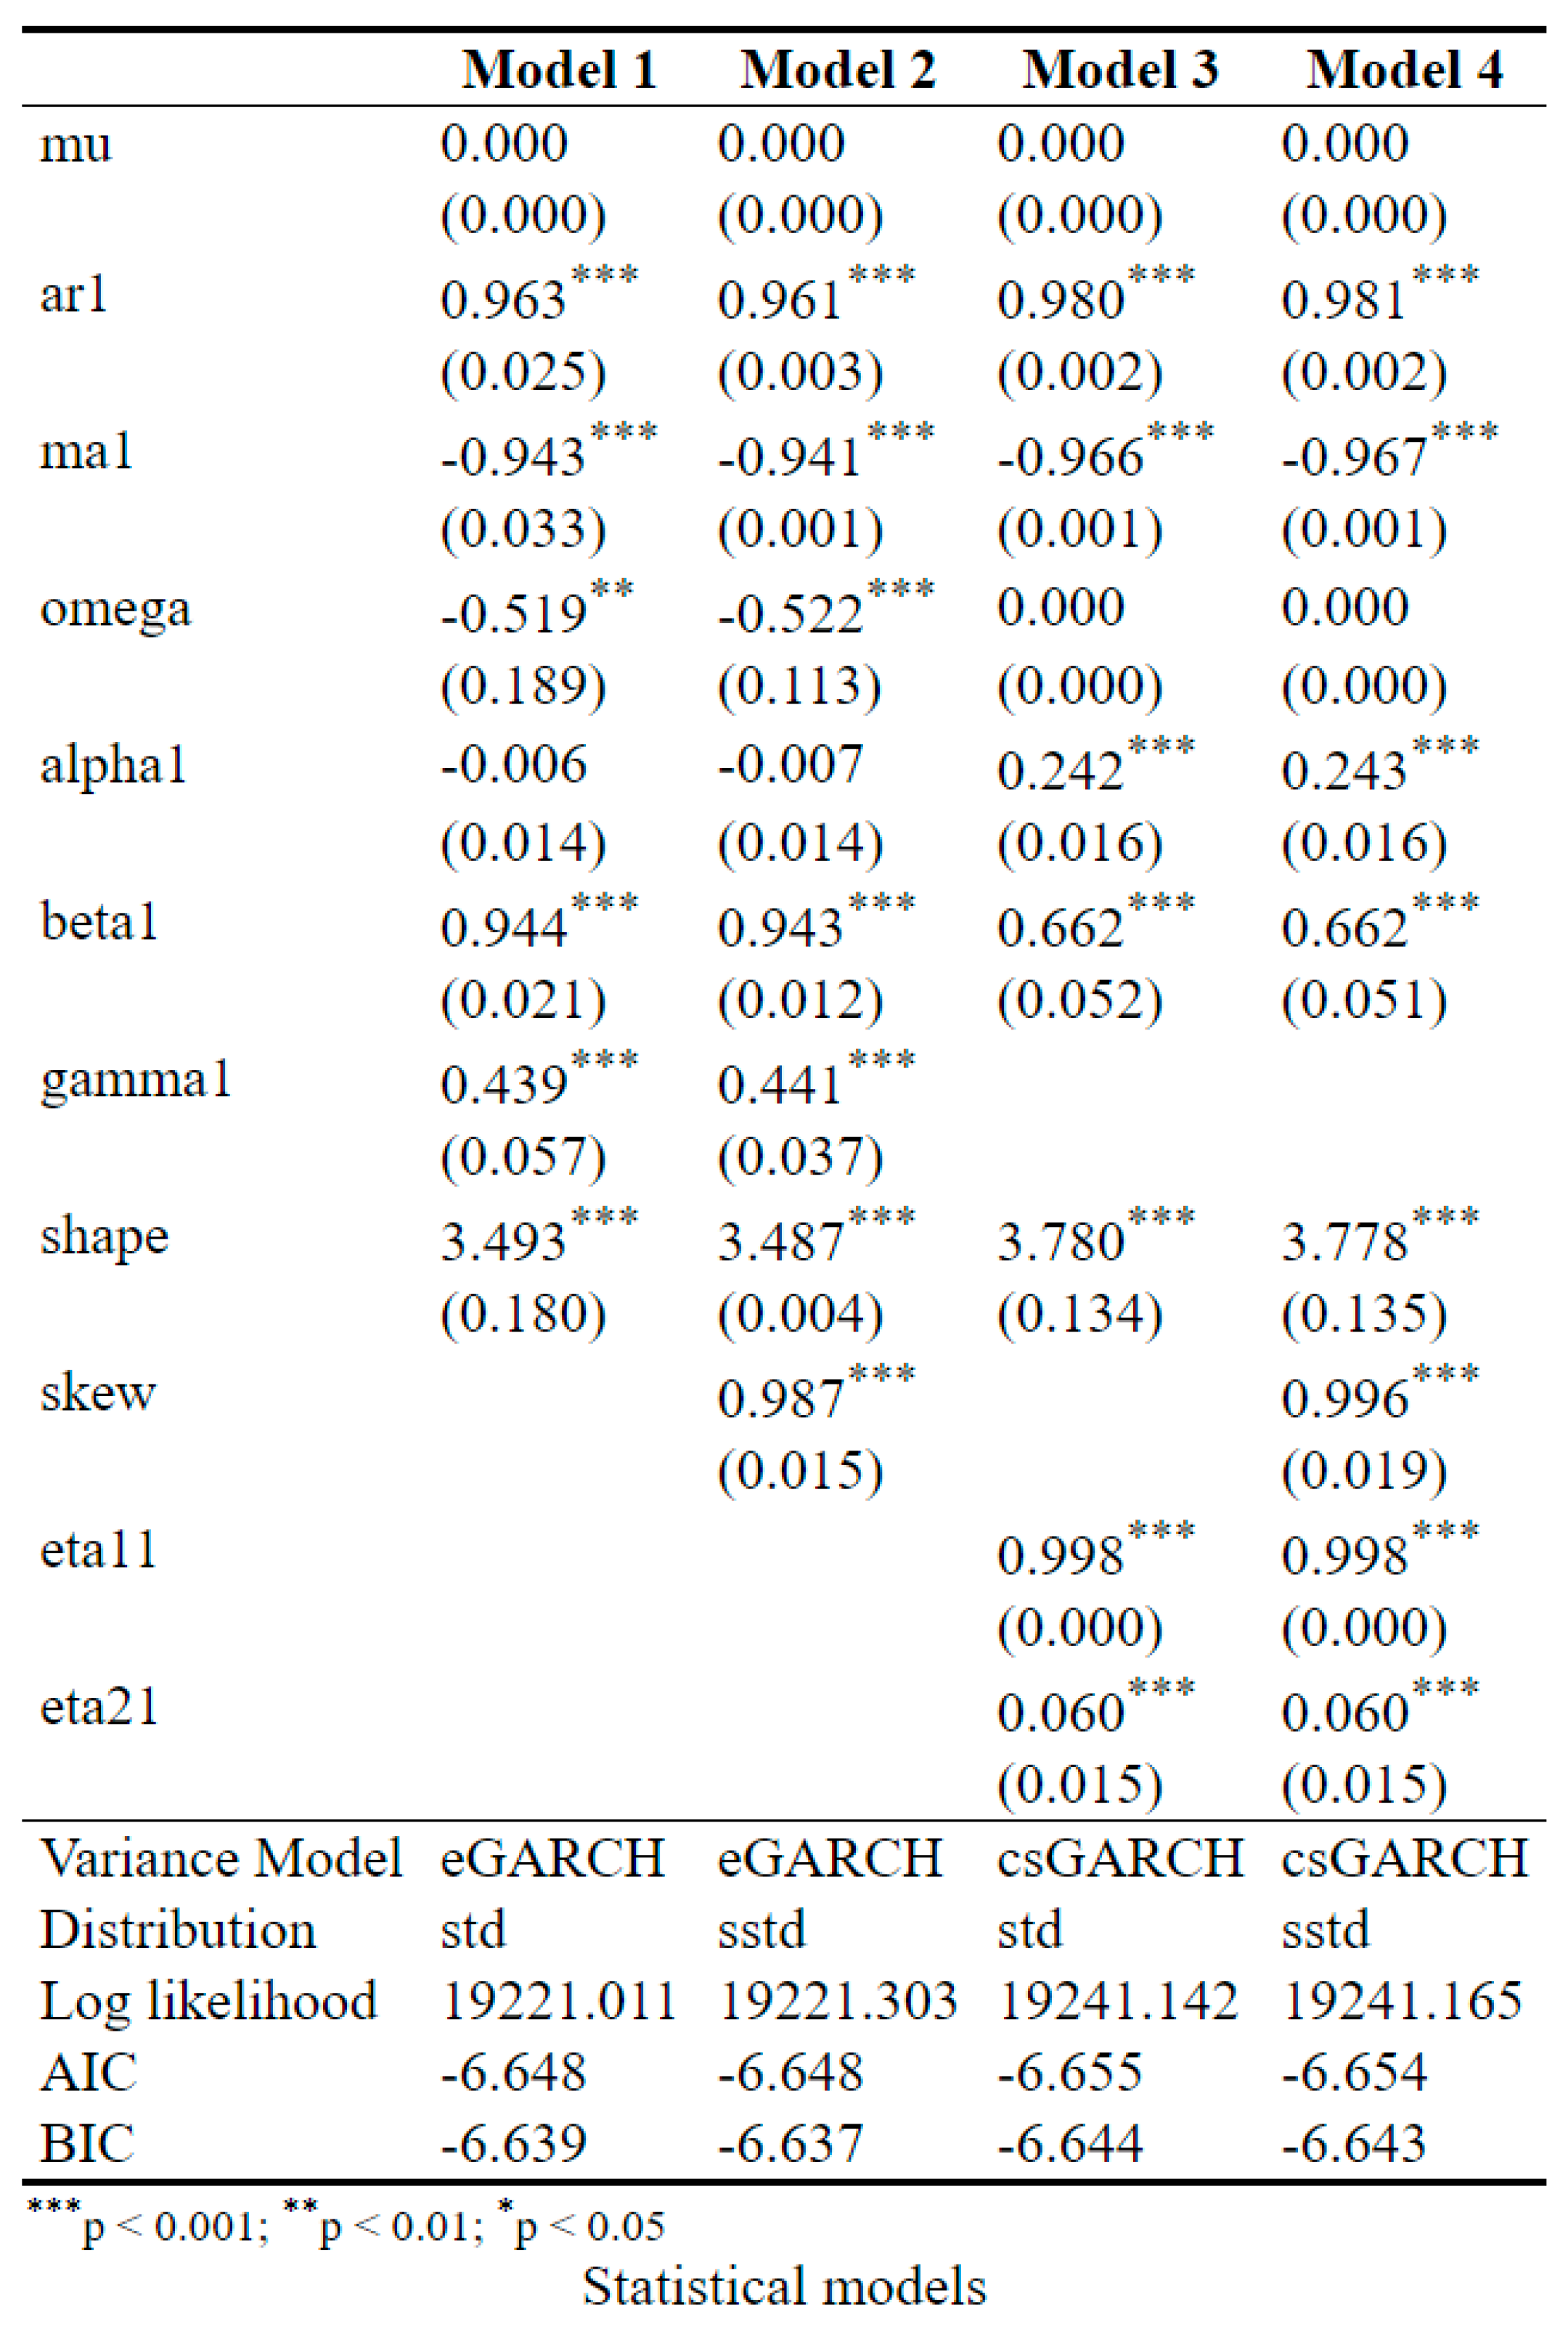 |
Table B3 presents the results of the estimation of two GARCH (EGARCH and CGARCH) models to the log returns of SOFIX. Each model has one lag at the AR and MA components in the conditional mean equation, the same variance equation (q=1 and p=1) and different distribution of residuals (Student t and Skewed t). The results were found executing the script named 04-Estimate_BEST_GARCH_SOFIX_2X2_2.R.
References
- Andersen, Torben, Tim Bollerslev, Peter Christoffersen, and Francis Diebold. Volatility and Correlation Forecasting. Handbook of Economic Forecasting 2006, 1, 778–878. [Google Scholar]
- Arltová, Markéta, and Darina Fedorová. Selection of Unit Root Test on the Basis of Length of the Time Series and Value of AR(1) Parameter. Statistika: Statistics & Economy Journal 2016, 96, 47–64. [Google Scholar]
- Arneric, Josip, and Blanka Scrabic-Peric. Panel GARCH model with cross-sectional dependence between CEE emerging markets in trading day effects analysis. Romanian Journal of Economic Forecasting 2018, 21, 71–84. [Google Scholar]
- Bollerslev, Tim. . Generalized autoregressive conditional heteroskedasticity. Journal of Econometrics 1986, 31, 307–327. [Google Scholar] [CrossRef]
- Caner, Mehmet, and Lutz Kilian. Size Distortions of Tests of the Null Hypothesis of Stationarity: Evidence and Implications for the PPP Debate. Journal of International Money and Finance 2001, 20, 639–57. [Google Scholar] [CrossRef]
- Charteris, A. , and B. Strydom. 2011. An Examination of the Volatility of South African Risk-Free Rate Proxies: A Component GARCH Analysis. Studies in Economics and Econometrics 35, 49–64. [CrossRef]
- Christoffersen, Peter, Kris Jacobs, Chayawat Ornthanalai, and Yintian Wang. Option Valuation with Long-Run and Short-Run Volatility Components. Journal of Financial Economics 2008, 90, 272–97. [Google Scholar] [CrossRef]
- Dickey, David A., and Wayne A. Fuller. Likelihood Ratio Statistics for Autoregressive Time Series with a Unit Root. Econometrica 1981, 49, 1057–1072. [CrossRef]
- Elliott, Graham, Thomas J. Rothenberg, and James H. Stock. Efficient Tests for an Autoregressive Unit Root. Econometrica 1992, 64, 813–36. [Google Scholar]
- Enders, Walter. Applied Econometric Time Series. John Wiley & Sons: New York, 2008. [Google Scholar]
- Engle, Robert F. . Autoregressive conditional heteroskedasticity with estimates of the variance of U.K. inflation. Econometrica 1982, 50, 987–1008. [Google Scholar] [CrossRef]
- Engle, Robert F., and Gary G. J. Lee. 1999. A permanent and transitory component model of stock return volatility. Cointegration, Causality and Forecasting: A Festschrift in Honour of Clive W.J, Oxford University Press, pp. 475–497.
- Engle, Robert F. , and Tim Bollerslev. Modelling the persistence of conditional variances. Econometric Reviews 1986, 1, 1–50. [Google Scholar]
- Gerunov, Anton. Stock Returns Under Different Market Regimes: An Application of Markov Switching Models to 24 European Indices. Ikonomicheski izsledvaniq 2023, 1, 18–35.
- Ghalanos, Alexios. 2022. Introduction to the rugarch package.
- Ghalanos, Alexios. 2023. rugarch: Univariate GARCH models.
- Gherghina, Ștefan Cristian, Daniel Ștefan Armeanu, and Camelia Cătălina Joldeș. COVID-19 pandemic and Romanian stock market volatility: A GARCH approach. Journal of Risk and Financial Management 2021, 14, 341. [Google Scholar] [CrossRef]
- Glosten, Lawrence R. , Ravi Jagannathan, and David E. Runkle. Relation between expected value and the nominal excess return on stocks. Journal of Finance 1993, 48, 127–38. [Google Scholar]
- 19. Iqbal, Najam, Muhammad Saqib Manzoor, and Muhammad Ishaq Bhatti. 2021. Asymmetry and leverage with news impact curve perspective in Australian stock returns’ volatility during COVID-19. Journal of Risk and Financial Management, 14(7): 314. [CrossRef]
- 20. Khan, Maaz, Umar Nawaz Kayani, Mrestyal Khan, Khurrum Shahzad Mughal, and Mohammad Haseeb. 2023. COVID-19 pandemic & financial market volatility; evidence from GARCH models. Journal of Risk and Financial Management, 16(1): 50. [CrossRef]
- Kwiatkowski, Denis, Peter CB Phillips, Peter Schmidt, and Yongcheol Shin. Testing the null hypothesis of stationarity against the alternative of a unit root. Journal of Econometrics 1992, 54, 159–78. [Google Scholar] [CrossRef]
- 22. Liu, Tong, and Yanlin Shi. 2022. Innovation of the Component GARCH Model: Simulation Evidence and Application on the Chinese Stock Market. Mathematics, 10(11): 1903. [CrossRef]
- Milinov, Valentin, and Nigokhos Kanaryan. The risk-volume relationship of the most liquid Bulgarian shares. Dialog 2006, 1, 44–54. [Google Scholar]
- Minchev, Teodor. 2024a. When SOFlX will break its 2007peak. Available online: https://money.bg/finance/koga-sofix-shte-probie-varha-si-ot-2007-a-godina.html (accessed on 1 June 2024).
- Minchev, Teodor. 2024b. SOFlX at its highest level since 2008. Available online: https://money.bg/finance/sofix-pri-nay-visokoto-si-nivo-ot-2008-godina-nasam.html (accessed on 1 June 2024).
- Naik, Pramod Kumar, and Puja Padhi. Equity Trading Volume and its Relationship with Market Volatility: Evidence from Indian Equity Market. Journal of Asian Business Strategy 2014, 4, 108–24. [Google Scholar]
- Ncube, Mbongiseni, Mabutho Sibanda, and Frank Ranganai Matenda. 2024. Investigating the Effects of the COVID-19 Pandemic on Stock Volatility in Sub-Saharan Africa: Analysis Using Explainable Artificial Intelligence. Economies, 12(5): 112. [CrossRef]
- Nelson, Daniel. Conditional heteroskedasticity in assets returns: a new approach. Econometrica: Journal of the econometric society 1991, 59, 347–70. [Google Scholar] [CrossRef]
- Ng, Serena, and Pierre Perron. Unit Root Tests in ARMA Models with Data-Dependent Methods for the Selection of the Truncation Lag. Journal of the American Statistical Association 1995, 90, 268–81. [Google Scholar] [CrossRef]
- Ouchen, Abdessamad. 2023. Econometric Modeling of the Impact of the COVID-19 Pandemic on the Volatility of the Financial Markets. Engineering Proceedings, 39(1): 14. [CrossRef]
- 31. Paskaleva, Mariya, and Ani Stoykova. 2021. Globalization effects on contagion risks in financial markets. Ekonomicko-manazerske spectrum, 15(1): 38-54. [CrossRef]
- Patev, Plamen, Nigokhos Kanaryan, and Katerina Lyroudi. Modelling and forecasting the volatility of thin emerging stock markets: the case of Bulgaria. Comparative Economic Research. Central and Eastern Europe 2009, 12, 47–60. [Google Scholar] [CrossRef]
- Perlin, Marcelo, Mauro Mastella, Daniel Vancin, and Henrique Ramos. A GARCH tutorial with R. Revista de Administração Contemporânea, 2021, 25(1). [CrossRef]
- Pesaran, M. Hashem. 2015. Time Series and Panel Data Econometrics, Oxford University Press.
- Petkov, Plamen. 2010. Econometric analysis of the main Bulgarian indices with GARCH(1,1) models. Paper presented at Jubilee Scientific Conference Market Development of the Bulgarian Economy - Two Decades after the Change. Svishtov. 4-5 November. pp. 332–36. PH "Tsenov".
- Petrică, Andreea-Cristina, Stelian Stancu, and Virgil Ghițulescu. 2017. EGARCH versus PARCH approach in modeling developed and underdeveloped stock markets. Paper presented at New Trends in Sustainable Business and Consumption. Graz, Austria. 31 May - 3 June. pp. 513–21. BASIQ.
- 37. Petrova, Mariana, and Teodor Todorov. 2023. Empirical Testing of Models of Autoregressive Conditional Heteroscedasticity Used for Prediction of the Volatility of Bulgarian Investment Funds. Risks, 11(11): 197. [CrossRef]
- Phillips, Peter CB, and Pierre Perron. . Testing for a unit root in time series regression. Biometrika 1988, 75, 335–46. [Google Scholar] [CrossRef]
- 39. Setiawan, Budi, Marwa Ben Abdallah, Maria Fekete-Farkas, Robert Jeyakumar Nathan, and Zoltan Zeman. 2021. GARCH (1, 1) models and analysis of stock market turmoil during COVID-19 outbreak in an emerging and developed economy. Journal of Risk and Financial Management, 14(12): 576. [CrossRef]
- 40. Tabash, Mosab, Neenu Chalissery, Mohamed Nishad, and Mujeeb Saif Mohsen Al-Absy. 2024. Market Shocks and Stock Volatility: Evidence from Emerging and Developed Markets. International Journal of Financial Studies, 12(1): 2. [CrossRef]
- Tikhomirov, Nikolay, and Elena Dorokhina. 2002. Ekonometrika, Moskva: Rossiĭskaya еkonomicheskaya akademiya.
- Tsenkov, Vladimir, and Ani Stoitsova-Stoykova. The Impact of the Global Financial Crisis on the market efficiency of capital markets of south east Europe. International Journal of Contemporary Economics and Administrative Sciences 2017, 7, 31–57. [Google Scholar]
- Tsenkov, Vladimir. The hypothesis of efficient markets and the global financial crisis – on the example of the SOFIX, DJIA and DAX indices. Economic research 2011, 3, 53–88. [Google Scholar]
- Ugurlu, Erginbay, Eleftherios Thalassinos, and Yusuf Muratoglu. . Modeling volatility in the stock markets using GARCH models: European emerging economies and Turkey. International Journal in Economics and Business Administration 2014, 2, 72–87. [Google Scholar]
- Zivot, Eric, and Jiahui Wang. 2006. Modeling Financial Time Series with S-PLUS®, Second Edition. NY: Springer New York. [CrossRef]
Figure 1.
Prices and returns of the SOFIX index (2000-2024). Source: Derived by the authors using adapted codes in R proposed in the publication of Perlin et al. (2021) and available for download in GitHub (https://github.com/ip4-2023/garch-sofix/). Figures can be replicated using the R script 02-Do_Descriptive_Figures_SOFIX.R.
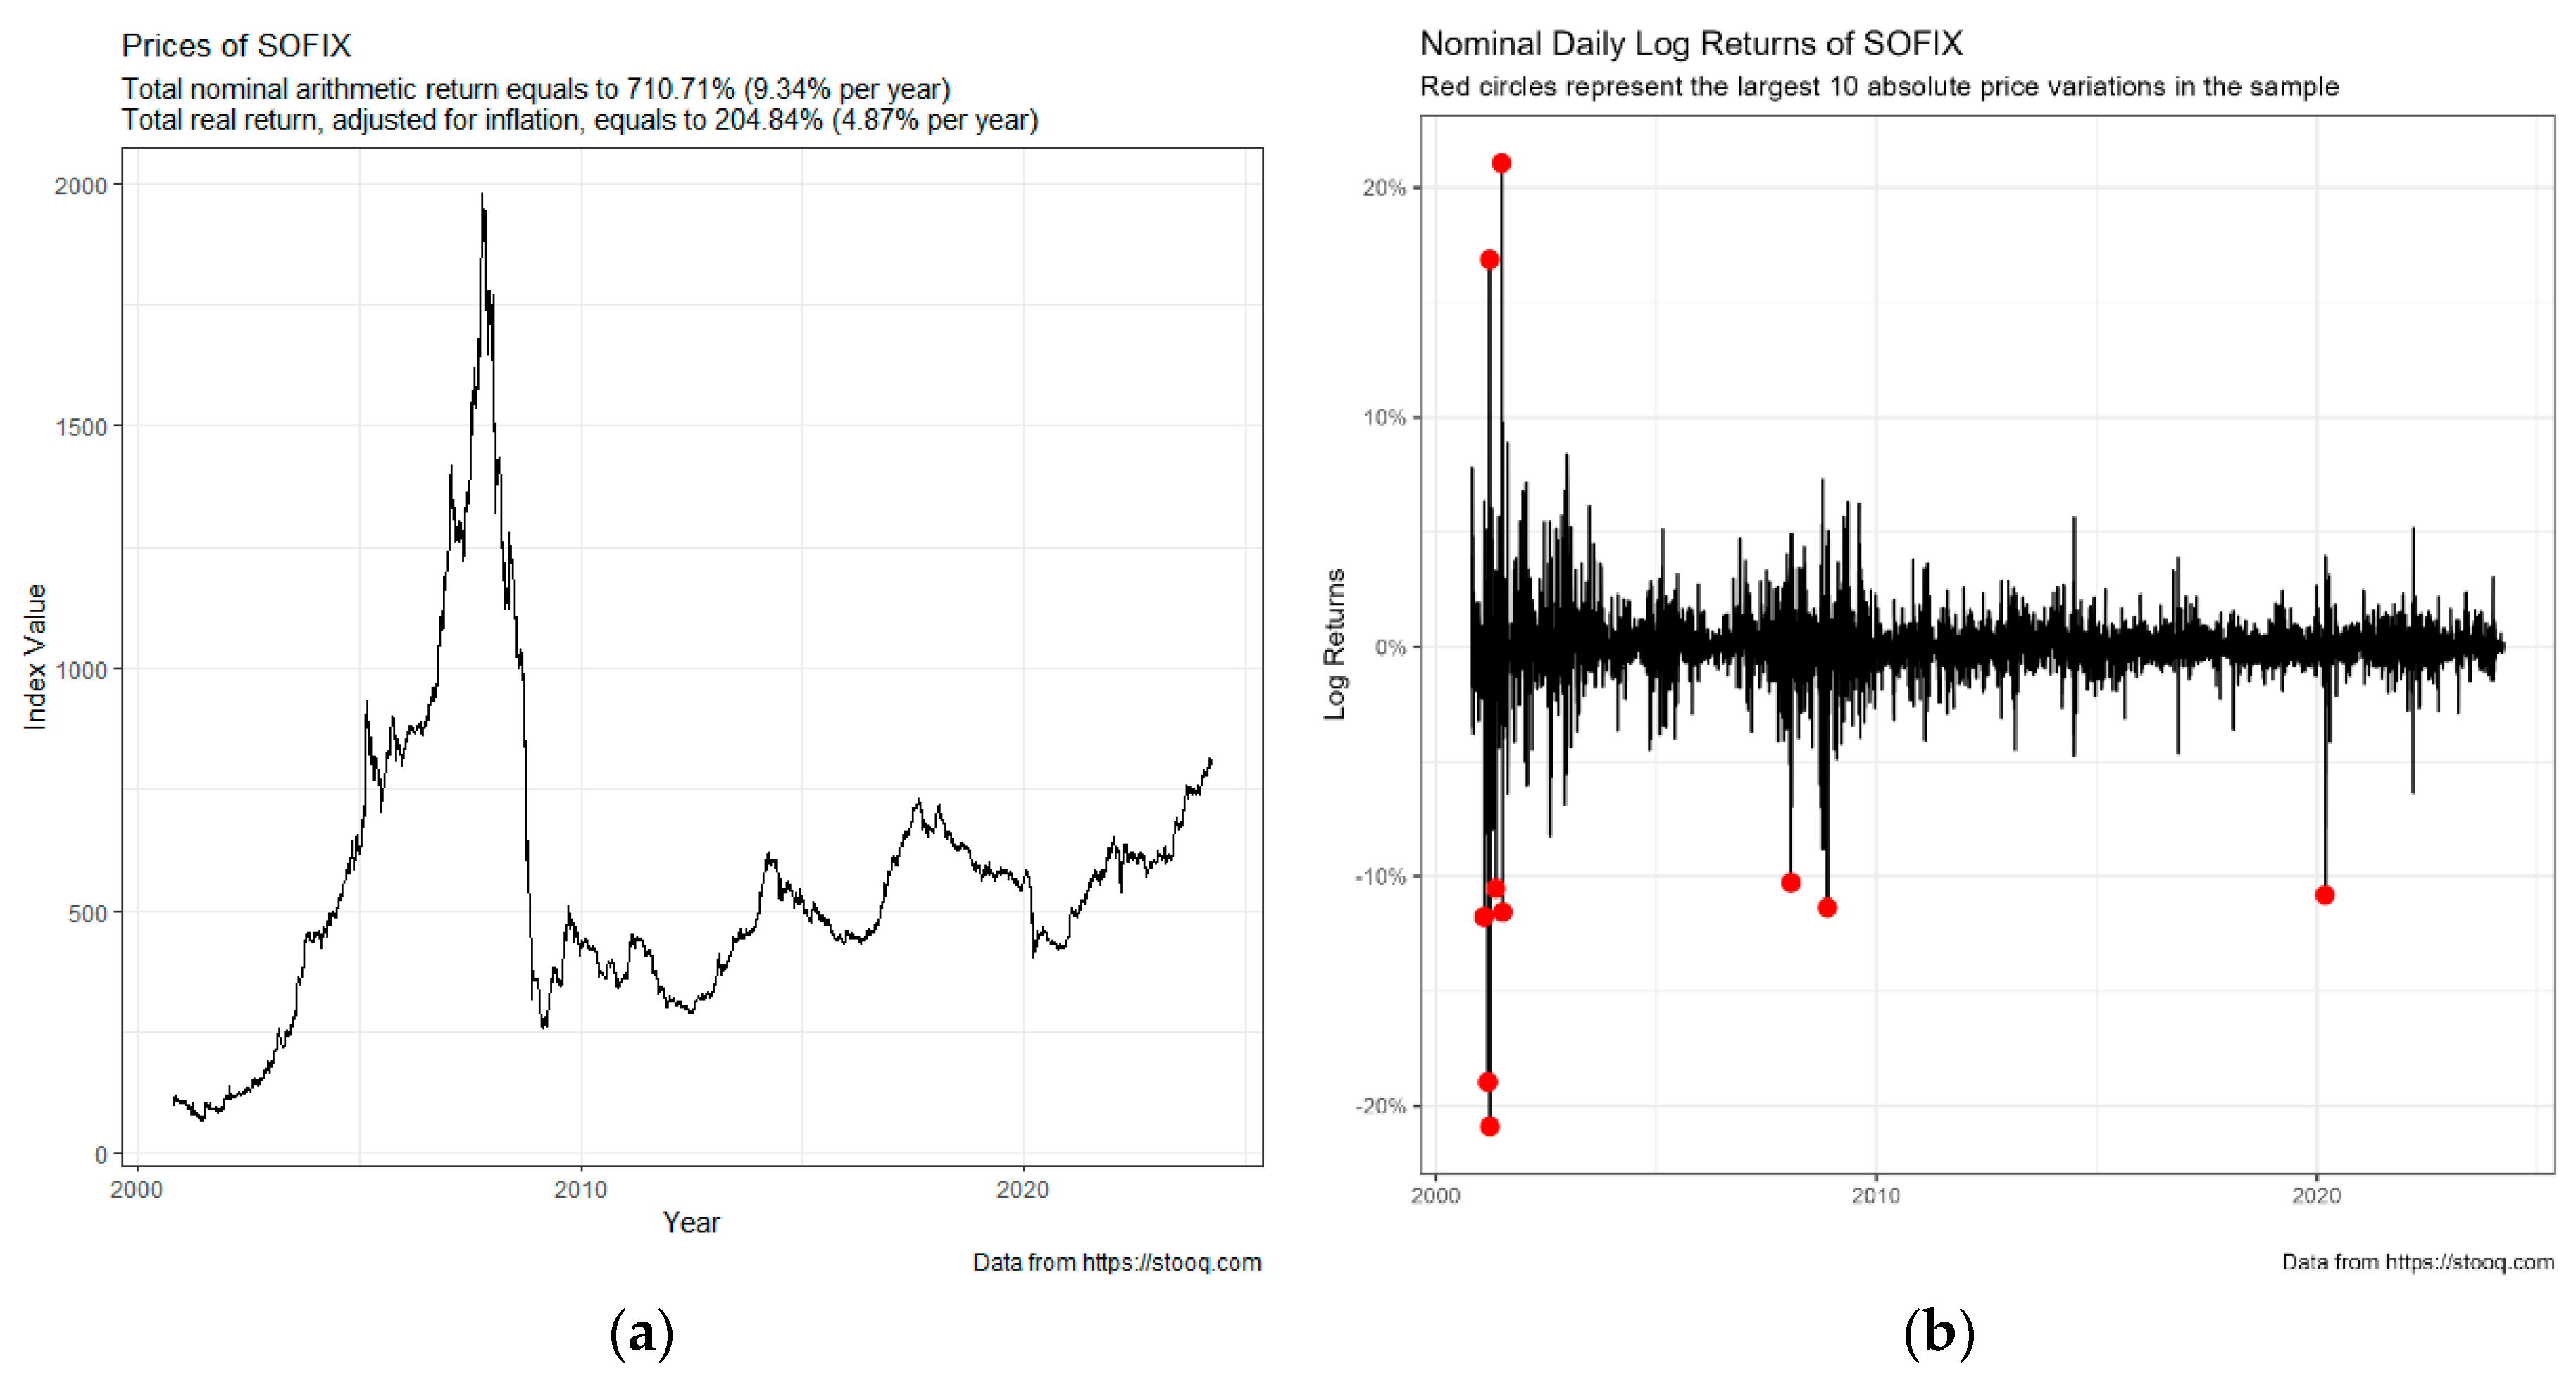
Figure 2.
Daily squared log returns of SOFIX index. Source: Derived by the authors using Gretl 2023 c for Windows.
Figure 2.
Daily squared log returns of SOFIX index. Source: Derived by the authors using Gretl 2023 c for Windows.
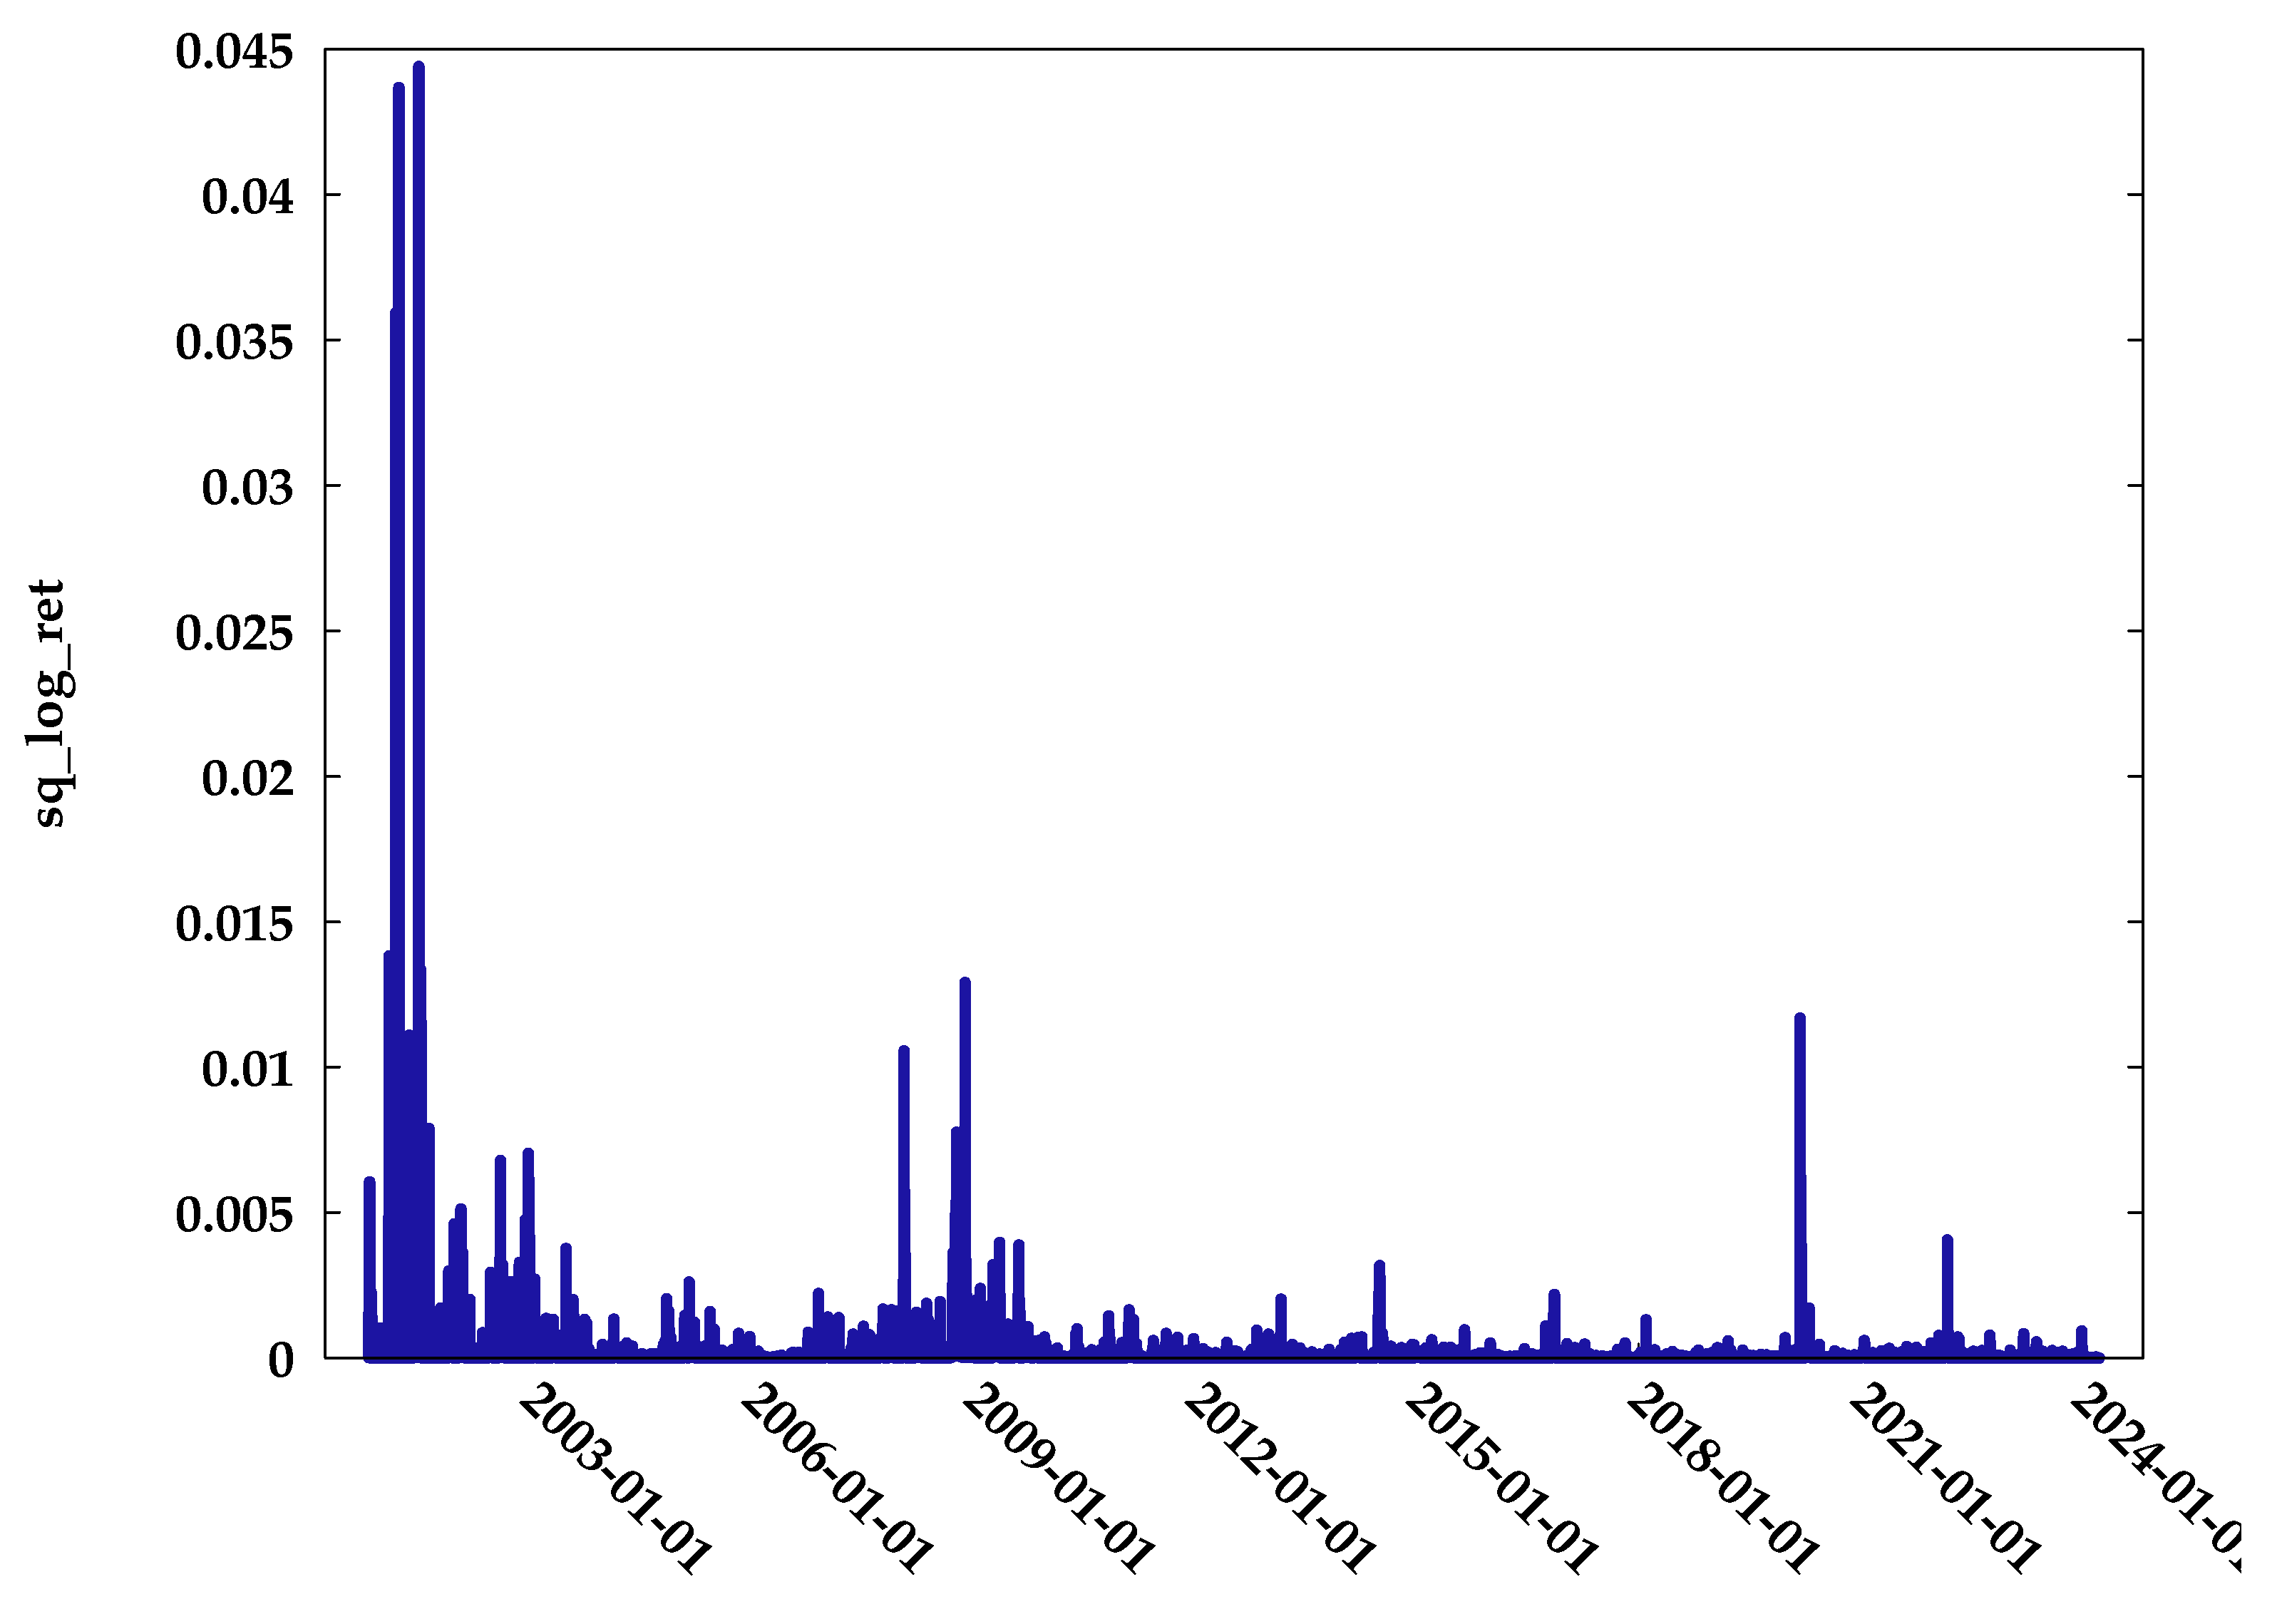
Figure 3.
Autocorrelation functions of daily squared log returns of SOFIX index. The autocorrelation at lag k (x-axis) shows the linear correlation between squared log returns at time t and t-k for the SOFIX index. The blue dashed lines represent numerical limits for the statistical significance of correlation. The autocorrelagram can be replicated using R script 02-Do_Descriptive_Figures_SOFIX.R.
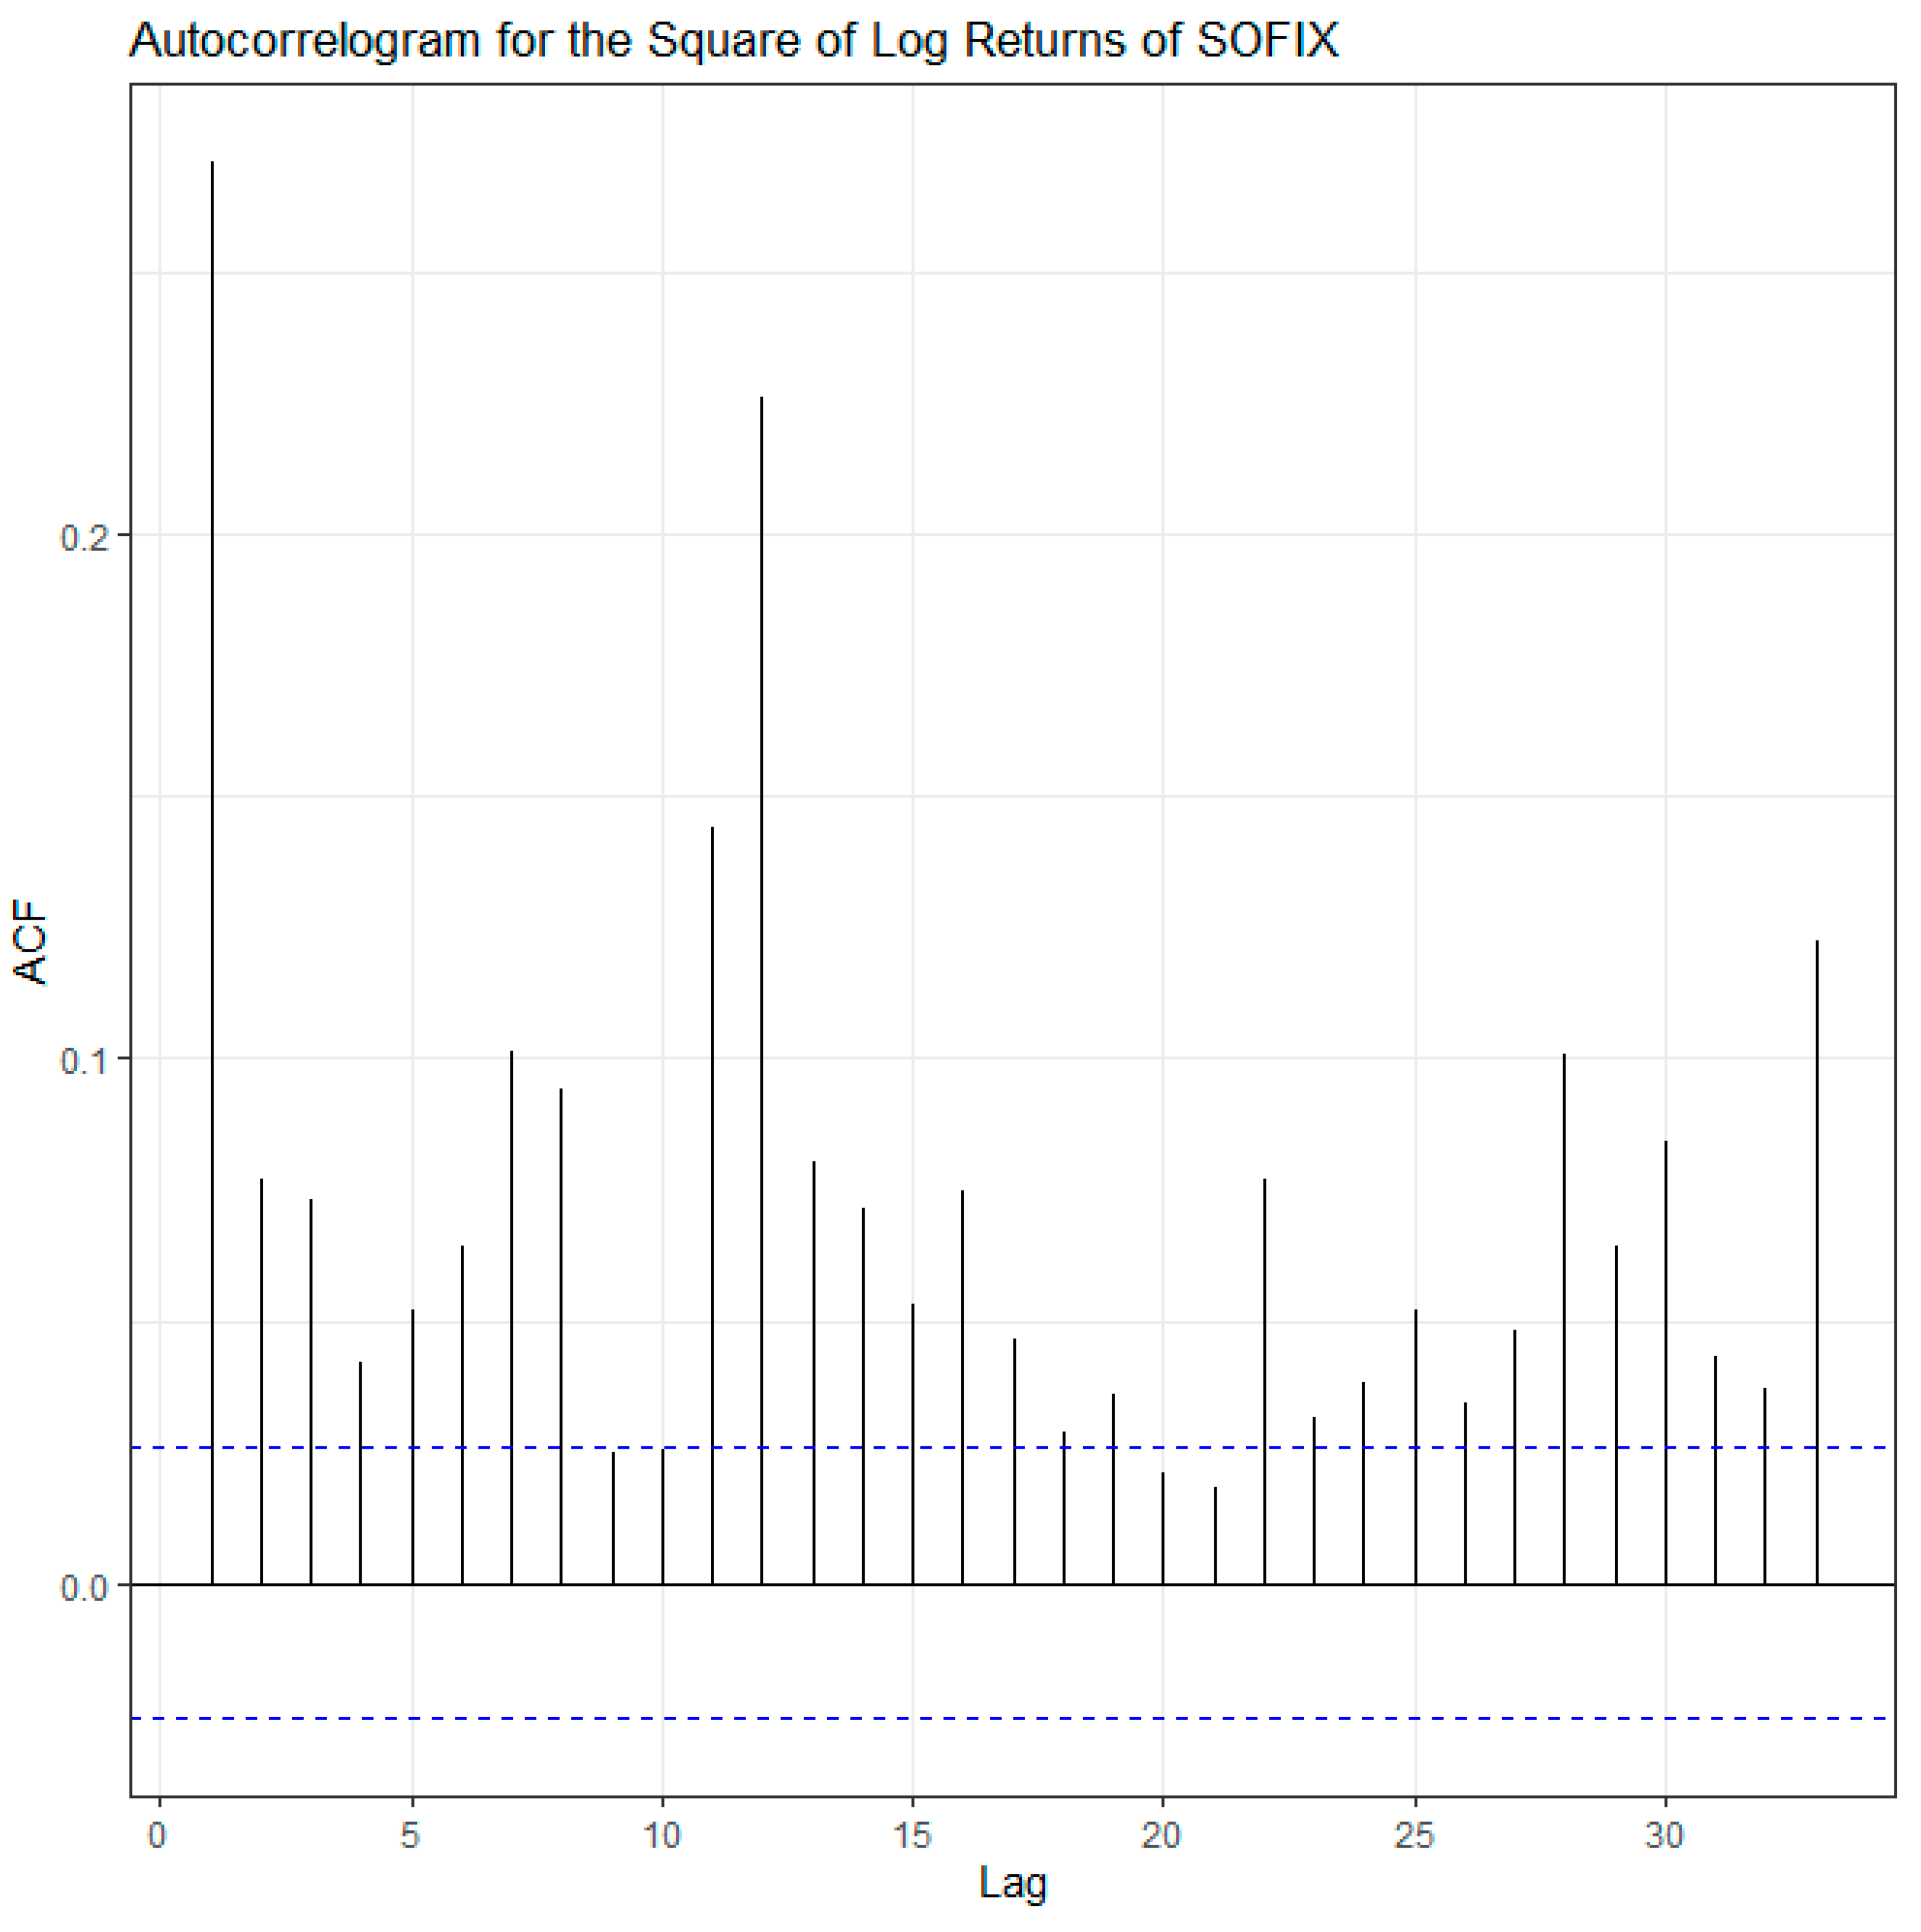
Figure 4.
Simulating the SOFIX index (2024-2029) and probabilities of SOFIX reaching its peak (2024-2100). Figure 4a shows the simulation results using a GARCH model. After estimating the model selected by BIC, we simulate its forward log returns and use them to construct projections of the future value of the index. The solid black line is the index itself, while the gray lines are the different paths of the simulation. Figure 4b shows the probabilities of SOFIX reaching its peak value once again, calculated using the simulated prices from the GARCH model. The x-axis represents the forward time period, while the y-axis is the probability itself. We calculate the probability as the proportion of times where the forward simulated index value is higher than the historical peak value of 1976.73. Figures can be replicated using the R script 06-Simulation_Forecasts_SOFIX.R.
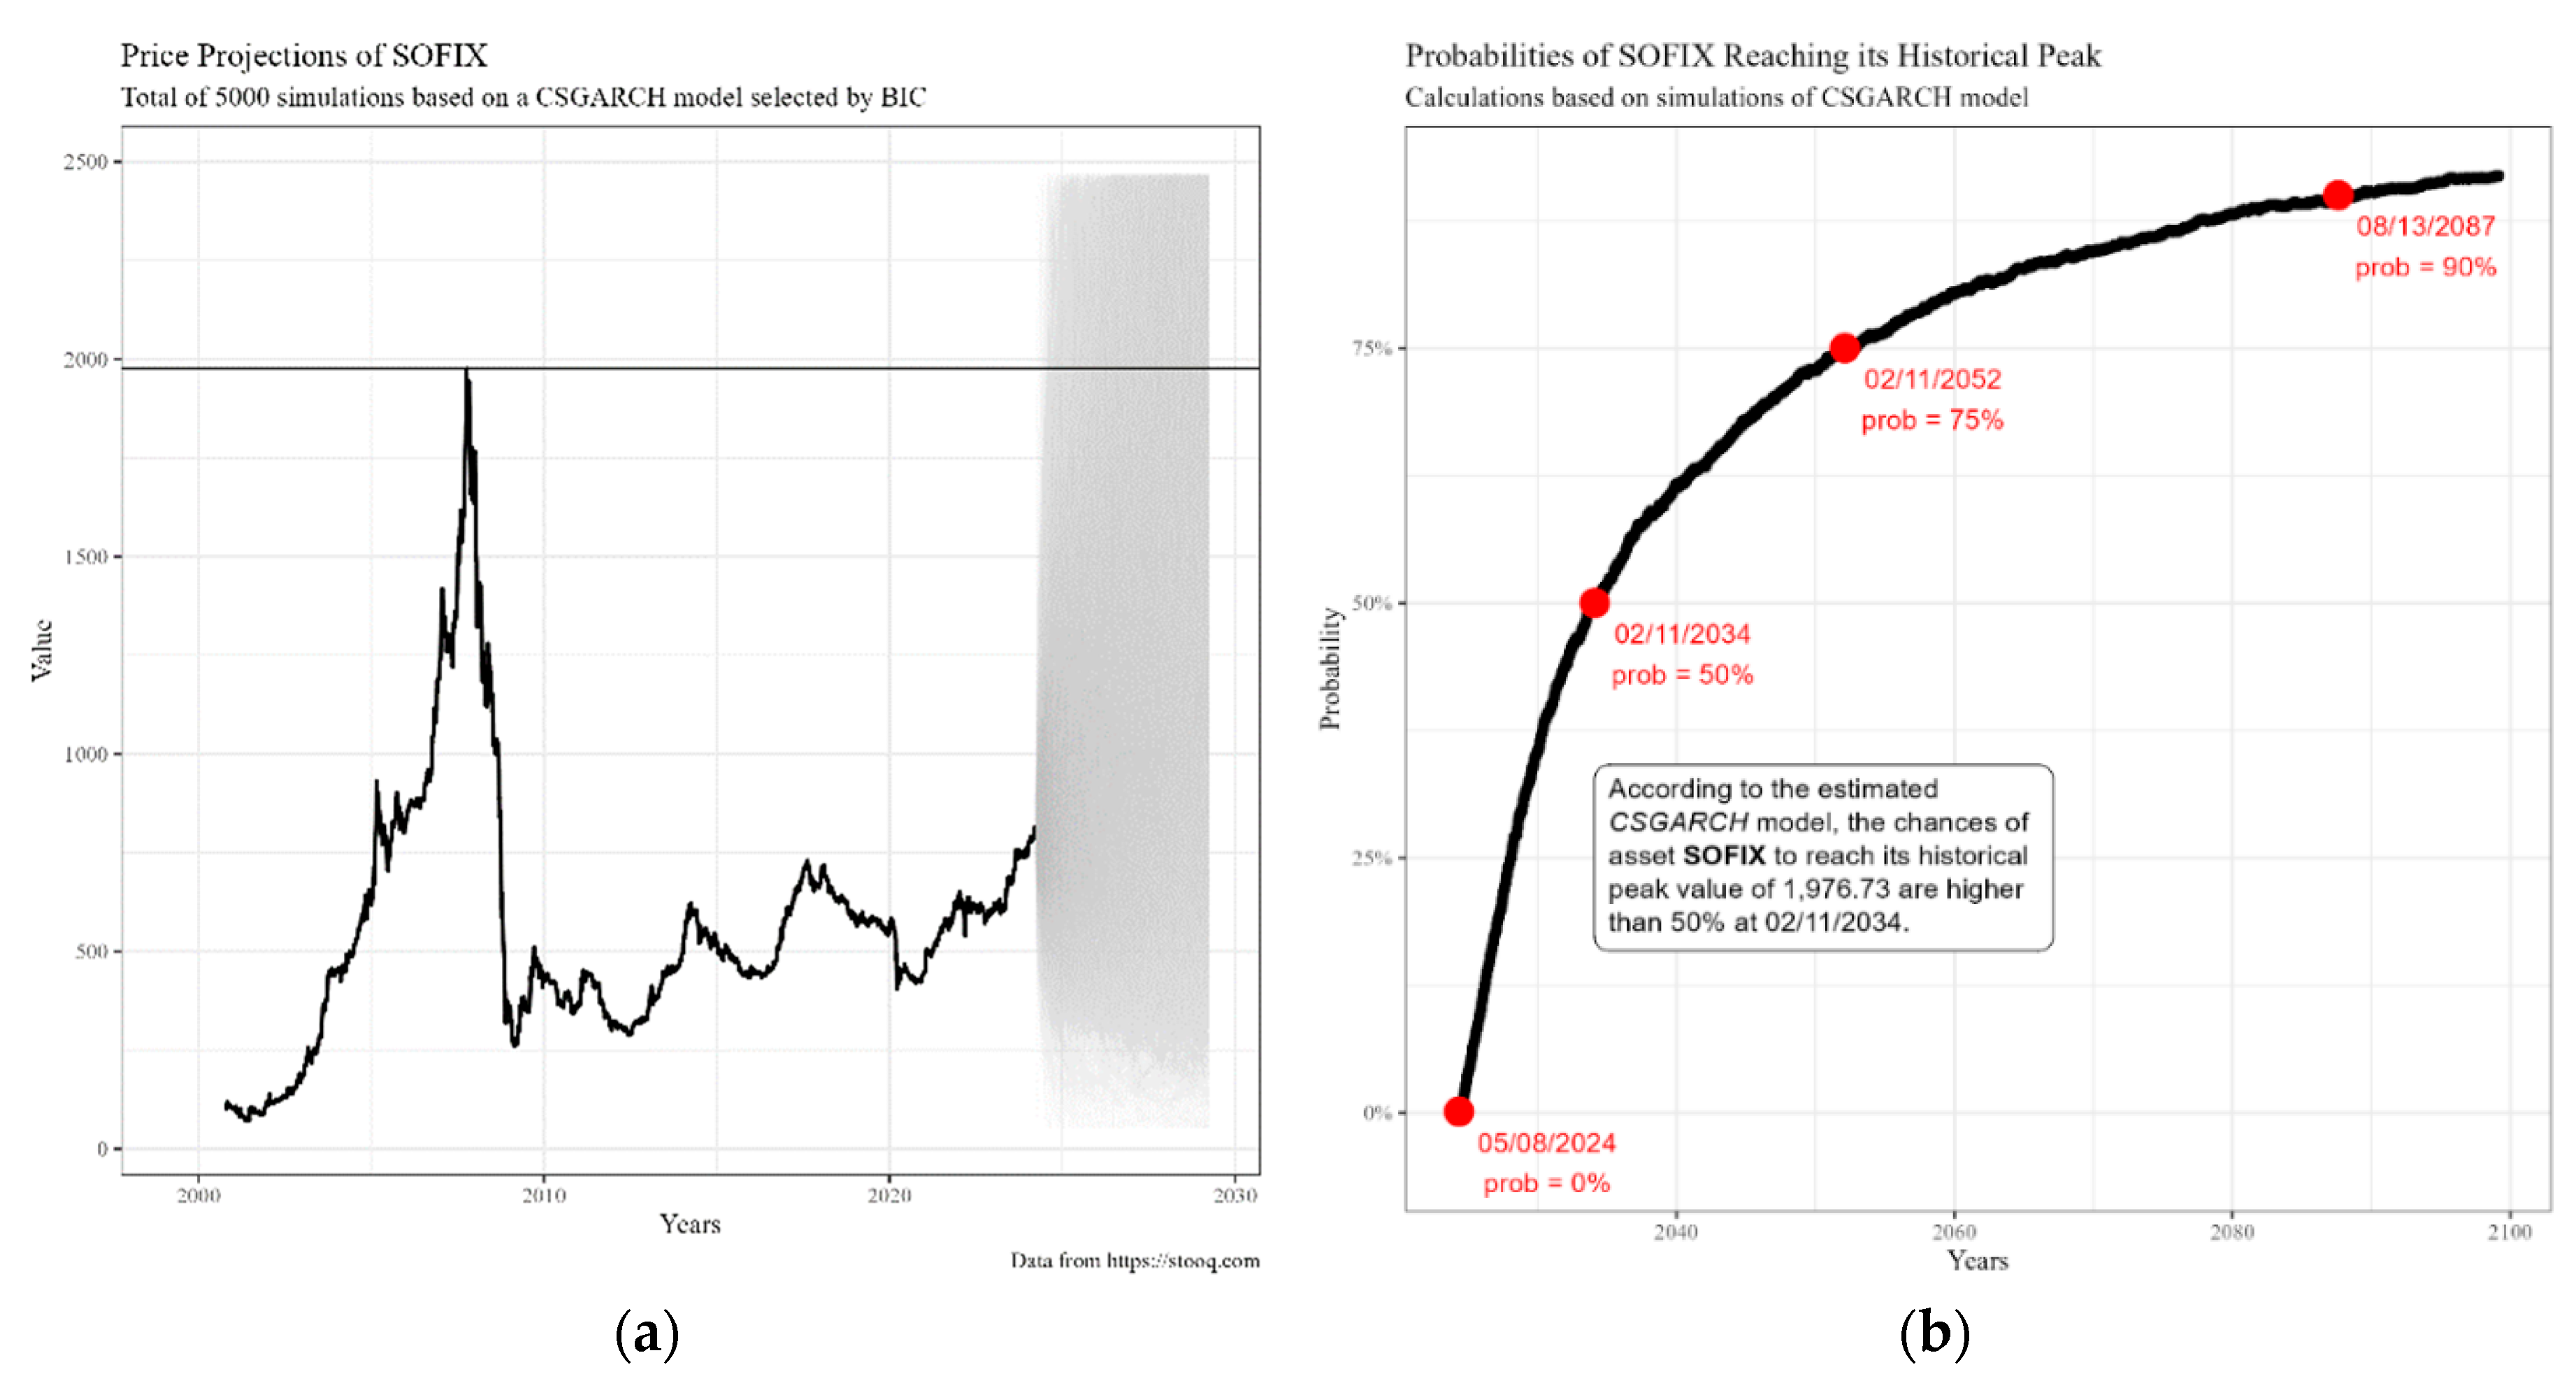
Table 1.
Conditional densities for εt.
| Name of distribution | Density | Parameters |
|---|---|---|
| Normal (norm) |
none | |
| Student’s t (std) |
||
| Generalised Error Distribution (ged) | ||
| Skewed normal (snorm) |
||
| Skewed t (sstd) |
||
| Skewed GED (sged) |
Table 2.
Descriptive statistics.
| Statistic | SOFIX return |
|---|---|
| Mean | 0.00035776 |
| Median | 0.00032240 |
| Minimum | -0.20899 |
| Maximum | 0.21073 |
| Std. Dev. | 0.013688 |
| Skewness | -0.75991 |
| Kurtosis | 39.625 |
| Jarque-Bera test | 378703.0 |
| p-value | 0.0000 |
| Observations | 5780 |
SOFIX return has negative skewness and high positive kurtosis. These values define that its distribution has a long left tail and it is leptokurtic. Jarque-Bera (JB) statistics reject the null hypothesis of normal distribution at the 1% level of significance.
Table 3.
Unit root tests1.
| Level | First difference | |||
|---|---|---|---|---|
| Test | Lags/BW | Test | Lags/BW | |
| ADF | ||||
| No Constant | -49.71*** | 33 | -91,82*** | 33 |
| Constant, No Trend | -49.75*** | 33 | -91,82*** | 33 |
| Constant, Trend | -49.78*** | 33 | -91,81*** | 33 |
| PP | ||||
| Constant, No Trend | -79,75*** | 33 | -477,56*** | 33 |
| Constant, Trend | -79,69*** | 33 | -477,52*** | 33 |
| KPSS | ||||
| Constant, No Trend | 0.371* | 33 | 0.0032 | 33 |
| Constant, Trend | 0.212** | 33 | 0.0032 | 33 |
| ADF-GLS | ||||
| Constant, No Trend | -25.46*** | 4 | -3.432*** | 4 |
| Constant, Trend | -29.12*** | 4 | -6.886*** | 4 |
1 Notes: 1. ***, ** and * indicate significance at the 1%, 5% and 10% levels respectively. 2. BW stands for bandwidth. 3. Table 3 reports the results of the Unit root tests applied to the log returns of SOFIX. The results can be replicated with R script 03-Do_ARCH_and_Unit_Roots_Tests-SOFIX.R.
Table 4.
Results of ARCH LM test for SOFIX1.
| Lag | LM test | p-value |
|---|---|---|
| 1 | 603,5227 | 2,9E-133 |
| 2 | 1225,037 | 9,7E-267 |
| 3 | 1273,103 | 1E-275 |
| 4 | 1286,057 | 3,5E-277 |
| 5 | 1316,519 | 1,7E-282 |
1 Note. Table 4 reports the results of the ARCH LM test applied to the log returns of SOFIX. Each lag has a corresponding LM statistic and associated p-value. The results can be replicated with R script 03-Do_ARCH_and_Unit_Roots_Tests-SOFIX.R.
Table 5.
Autocorrelation functions of daily squared log returns1.
| LAG | ACF | PACF | Q-stat. | [p-value] |
|---|---|---|---|---|
| 1 | 0.2711 *** | 0.2711 *** | 424.9105 | [0.000] |
| 2 | 0.0767 *** | 0.0035 | 458.9282 | [0.000] |
| 3 | 0.0729 *** | 0.0554 *** | 489.7069 | [0.000] |
| 4 | 0.0420 *** | 0.0088 | 499.9015 | [0.000] |
| 5 | 0.0517 *** | 0.0377 *** | 515.3868 | [0.000] |
| 6 | 0.0640 *** | 0.0398 *** | 539.1206 | [0.000] |
| 7 | 0.1012 *** | 0.0758 *** | 598.3805 | [0.000] |
| 8 | 0.0942 *** | 0.0457 *** | 649.7579 | [0.000] |
| 9 | 0.0247 * | -0.0231 * | 653.2860 | [0.000] |
| 10 | 0.0254 * | 0.0120 | 657.0365 | [0.000] |
| 11 | 0.1441 *** | 0.1348 *** | 777.2511 | [0.000] |
| 12 | 0.2263 *** | 0.1646 *** | 1073.9199 | [0.000] |
| 13 | 0.0804 *** | -0.0353 *** | 1111.4117 | [0.000] |
| 14 | 0.0715 *** | 0.0320 ** | 1141.0590 | [0.000] |
| 15 | 0.0528 *** | -0.0005 | 1157.2441 | [0.000] |
| 16 | 0.0745 *** | 0.0557 *** | 1189.4570 | [0.000] |
| 17 | 0.0464 *** | -0.0037 | 1201.9163 | [0.000] |
| 18 | 0.0286 ** | -0.0177 | 1206.6699 | [0.000] |
| 19 | 0.0361 *** | -0.0198 | 1214.2409 | [0.000] |
| 20 | 0.0211 | -0.0125 | 1216.8231 | [0.000] |
| 21 | 0.0181 | 0.0135 | 1218.7222 | [0.000] |
| 22 | 0.0770 *** | 0.0560 *** | 1253.1102 | [0.000] |
| 23 | 0.0313 ** | -0.0602 *** | 1258.8062 | [0.000] |
| 24 | 0.0383 *** | -0.0090 | 1267.3291 | [0.000] |
| 25 | 0.0519 *** | 0.0312 ** | 1282.9468 | [0.000] |
| 26 | 0.0344 *** | 0.0018 | 1289.8176 | [0.000] |
| 27 | 0.0480 *** | 0.0203 | 1303.1928 | [0.000] |
| 28 | 0.1007 *** | 0.0591 *** | 1362.1560 | [0.000] |
| 29 | 0.0641 *** | 0.0081 | 1386.0530 | [0.000] |
| 30 | 0.0841 *** | 0.0588 *** | 1427.2029 | [0.000] |
| 31 | 0.0433 *** | 0.0037 | 1438.1152 | [0.000] |
| 32 | 0.0367 *** | 0.0185 | 1445.9667 | [0.000] |
| 33 | 0.1222 *** | 0.0932 *** | 1532.8083 | [0.000] |
| 34 | 0.1453 *** | 0.0789 *** | 1655.5679 | [0.000] |
| 35 | 0.0791 *** | 0.0173 | 1691.9488 | [0.000] |
| 36 | 0.0560 *** | -0.0017 | 1710.1945 | [0.000] |
| 37 | 0.0503 *** | 0.0097 | 1724.8972 | [0.000] |
1 Notes: 1. ***, ** and * indicate significance at the 1%, 5% and 10% levels respectively using standard error 1/T^0.5. 2. Calculations were made with Gretl 2023C for Windows.
Table 6.
Estimation results of the best 10 GARCH models.
| Parameter | Model 27 | Model 28 | Model 9 | Model 21 | Model 10 | Model 3 | Model 22 | Model 29 | Model 4 | Model 30 |
|---|---|---|---|---|---|---|---|---|---|---|
| mu | 0.000*** | 0.000** | 0.000** | 0.000** | 0.000* | 0.000** | 0.000* | 0.000*** | 0.000* | 0.000* |
| (0.000) | (0.000) | (0.000) | (0.000) | (0.000) | (0.000) | (0.000) | (0.000) | (0.000) | (0.000) | |
| omega | 0.000 | 0.000 | -0.514*** | 0.000*** | -0.517*** | 0.000** | 0.000*** | 0.000 | 0.000** | 0.000 |
| (0.000) | (0.000) | (0.110) | (0.000) | (0.109) | (0.000) | (0.000) | (0.000) | (0.000) | (0.000) | |
| alpha1 | 0.239*** | 0.241*** | -0.001 | 0.271*** | -0.001 | 0.270*** | 0.272*** | 0.229*** | 0.271*** | 0.228*** |
| (0.014) | (0.015) | (0.013) | (0.019) | (0.013) | (0.024) | (0.019) | (0.009) | (0.024) | (0.011) | |
| beta1 | 0.668*** | 0.665*** | 0.944*** | 0.729 | 0.944*** | 0.729*** | 0.728 | 0.669*** | 0.728*** | 0.672*** |
| (0.055) | (0.052) | (0.012) | (0.012) | (0.026) | (0.059) | (0.027) | (0.054) | |||
| skew | 0.995*** | 0.987*** | 0.990*** | 0.990*** | 1.000*** | |||||
| (0.016) | (0.017) | (0.017) | (0.017) | (0.013) | ||||||
| shape | 3.782*** | 3.784*** | 3.509*** | 3.651*** | 3.502*** | 3.657*** | 3.649*** | 1.059*** | 3.655*** | 1.060*** |
| (0.134) | (0.135) | (0.179) | (0.139) | (0.179) | (0.201) | (0.138) | (0.011) | (0.202) | (0.007) | |
| gamma1 | 0.437*** | 0.439*** | ||||||||
| (0.039) | (0.039) | |||||||||
| pho | 0.998*** | 0.998*** | 0.999*** | 0.999*** | ||||||
| (0.000) | (0.000) | (0.000) | (0.000) | |||||||
| phi | 0.063*** | 0.062*** | 0.071*** | 0.072*** | ||||||
| (0.017) | (0.016) | (0.019) | (0.018) | |||||||
| Variance Model | CGARCH | CGARCH | EGARCH | IGARCH | EGARCH | GARCH | IGARCH | CGARCH | GARCH | CGARCH |
| Distribution | std | sstd | std | std | sstd | std | sstd | ged | sstd | sged |
| Log likelihood | 19218.624 | 19218.661 | 19200.838 | 19188.160 | 19201.114 | 19188.101 | 19188.327 | 19198.237 | 19188.27 | 19198.235 |
| AIC | -6.648 | -6.647 | -6.642 | -6.638 | -6.642 | -6.638 | -6.638 | -6.641 | -6.637 | -6.640 |
| BIC | -6.640 | -6.638 | -6.635 | -6.634 | -6.633 | -6.632 | -6.632 | -6.632 | -6.631 | -6.631 |
Table 7.
Selection of the best 10 ARCH-GARCH models with the BIC information criteria.
| No | Lag AR | Lag MA | Lag ARCH | Lag GARCH | AIC | BIC | Type of model | Type of distribution | Model name |
|---|---|---|---|---|---|---|---|---|---|
| 1 | 1 | 1 | 1 | 1 | -6.654720 | -6.644347 | CGARCH | std | ARMA(1,1)-CGARCH(1,1) std |
| 2 | 1 | 1 | 2 | 1 | -6.654546 | -6.643020 | CGARCH | std | ARMA(1,1)-CGARCH(2,1) std |
| 3 | 1 | 1 | 1 | 1 | -6.654382 | -6.642856 | CGARCH | sstd | ARMA(1,1)-CGARCH(1,1) sstd |
| 4 | 1 | 1 | 2 | 1 | -6.654210 | -6.641532 | CGARCH | sstd | ARMA(1,1)-CGARCH(2,1) sstd |
| 5 | 1 | 1 | 2 | 1 | -6.652138 | -6.640612 | EGARCH | std | ARMA(1,1)-EGARCH(2,1) std |
| 6 | 0 | 0 | 1 | 1 | -6.647621 | -6.639553 | CGARCH | std | ARMA(0,0)-CGARCH(1,1) std |
| 7 | 1 | 1 | 2 | 1 | -6.651870 | -6.639191 | EGARCH | sstd | ARMA(1,1)-EGARCH(2,1) sstd |
| 8 | 1 | 0 | 1 | 1 | -6.648376 | -6.639155 | CGARCH | std | ARMA(1,0)-CGARCH(1,1) std |
| 9 | 0 | 1 | 1 | 1 | -6.648280 | -6.639059 | CGARCH | std | ARMA(0,1)-CGARCH(1,1) std |
| 10 | 1 | 1 | 1 | 1 | -6.648101 | -6.638880 | EGARCH | std | ARMA(1,1)-EGARCH(1,1) std |
Table 8.
Estimation results of the best 6 ARMA-GARCH models1.
| Parameter | Model 1 | Model 2 | Model 3 | Model 4 | Model 5 | Model 7 |
|---|---|---|---|---|---|---|
| mu | 0.000 | 0.000 | 0.000 | 0.000 | 0.000** | 0.000 |
| (0.000) | (0.000) | (0.000) | (0.000) | (0.000) | (0.000) | |
| ar1 | 0.980*** | 0.981*** | 0.981*** | 0.981*** | 0.976*** | 0.973*** |
| (0.002) | (0.002) | (0.002) | (0.002) | (0.002) | (0.003) | |
| ma1 | -0.966*** | -0.968*** | -0.967*** | -0.967*** | -0.961*** | -0.956*** |
| (0.001) | (0.001) | (0.001) | (0.001) | (0.000) | (0.001) | |
| omega | 0.000 | 0.000 | 0.000 | 0.000 | -0.326*** | -0.328*** |
| (0.000) | (0.000) | (0.000) | (0.000) | (0.051) | (0.050) | |
| alpha1 | 0.242*** | 0.243*** | 0.243*** | 0.244*** | -0.001 | -0.002 |
| (0.016) | (0.029) | (0.016) | (0.029) | (0.025) | (0.025) | |
| alpha2 | 0.000 | 0.000 | -0.001 | -0.001 | ||
| (0.035) | (0.032) | (0.026) | (0.026) | |||
| beta1 | 0.662*** | 0.660*** | 0.662*** | 0.660*** | 0.965*** | 0.964*** |
| (0.052) | (0.049) | (0.051) | (0.049) | (0.006) | (0.006) | |
| gamma1 | 0.542*** | 0.543*** | ||||
| (0.034) | (0.035) | |||||
| gamma2 | -0.208*** | -0.208*** | ||||
| (0.032) | (0.032) | |||||
| shape | 3.780*** | 3.783*** | 3.778*** | 3.783*** | 3.551*** | 3.547*** |
| (0.134) | (0.142) | (0.135) | (0.142) | (0.105) | (0.178) | |
| skew | 0.996*** | 0.996*** | 0.989*** | |||
| (0.019) | (0.020) | (0.015) | ||||
| pho | 0.998*** | 0.998*** | 0.998*** | 0.998*** | ||
| (0.000) | (0.000) | (0.000) | (0.000) | |||
| phi | 0.060*** | 0.059*** | 0.060*** | 0.059*** | ||
| (0.015) | (0.012) | (0.015) | (0.012) | |||
| Variance Model | CGARCH | CGARCH | CGARCH | CGARCH | EGARCH | EGARCH |
| Distribution | std | std | sstd | sstd | std | sstd |
| Log likelihood | 19241.142 | 19241.638 | 19241.165 | 19241.668 | 19234.679 | 19234.905 |
| AIC | -6.655 | -6.655 | -6.654 | -6.654 | -6.652 | -6.652 |
| BIC | -6.644 | -6.643 | -6.643 | -6.642 | -6.641 | -6.639 |
1 Please note that instead of a model with only a constant included in the conditional mean equation, ordered sixth, an ARMA(1,1)-EGARCH(2,1) model with a skewed t-distribution of disturbances is presented here, occupying the seventh position, since the parameter estimates in the model without ARMA components are presented earlier.
| 1 | Analysis of the data was done using the rugarch package (Ghalanos 2023). |
Disclaimer/Publisher’s Note: The statements, opinions and data contained in all publications are solely those of the individual author(s) and contributor(s) and not of MDPI and/or the editor(s). MDPI and/or the editor(s) disclaim responsibility for any injury to people or property resulting from any ideas, methods, instructions or products referred to in the content. |
© 2024 by the authors. Licensee MDPI, Basel, Switzerland. This article is an open access article distributed under the terms and conditions of the Creative Commons Attribution (CC BY) license (http://creativecommons.org/licenses/by/4.0/).
Copyright: This open access article is published under a Creative Commons CC BY 4.0 license, which permit the free download, distribution, and reuse, provided that the author and preprint are cited in any reuse.


