Submitted:
19 June 2024
Posted:
20 June 2024
Read the latest preprint version here
Abstract
Background: Gait analysis systems offer invaluable insights for rehabilitation, yet their expense limits clinician access. We developed GAITWell®, a low-cost modular system for capturing spatiotemporal gait variables, and evaluated its measurement properties. Methods: The GAITWell® uses discreet binary sensors on interconnected boards to collect gait data, which is then analyzed using the DBSCAN algorithm on the Cartesian points from sensor outputs. Reliability was assessed using ICC2,1, standard error of the mean (SEM) and Bland-Altman plots. Validity was determined by comparing GAITWell® with the Qualisys Pro-Reflex system. Results: Participated 38 healthy adults, with an average age of 33.2 years (SD 13.0). Correlations between GAITWell® and the Qualisys system ranged from moderate to very high for most gait variables, with the exception of stride length, which demonstrated a low but significant correlation (r = .360, p < .05). The ICC2,1 indicated moderate to good agreement for most gait variables. Stance and double support times, cadence, and base of support exhibited poor reliability, characterized by larger SEM and limits of agreement. Conclusions: Our findings indicate that the GAITWell® system is a promising tool for gait analysis. Future research will enhance sensor accuracy and refine algorithms to improve reliability.
Keywords:
gait analysis
; spatiotemporal parameters
; reliability
; validity
; Clustering
; discrete sensors
1. Introduction
Gait analysis plays a fundamental role in both scientific research and clinical practice, serving as a compelling alternative for comprehensively understanding motor disorders and meticulously monitoring the progression of treatments. [1,2,3,4]. The identification of abnormal locomotion patterns [5,6], paves the way for personalized treatments [3] that meet the specific needs of each patient, thus improving prognoses and reducing associated costs, especially in the context of rehabilitation. Thus, as an important tool, it should be widely available and accessible to healthcare professionals across diverse healthcare settings, ensuring that all patients receive the highest standard of care tailored to their unique needs.
Amidst the array of available gait analysis systems, ranging from portable solutions like the GAITRite® system and wearable sensors [7] to sophisticated laboratory-based optoelectronic setups [8,9,10] cost remains a significant barrier to widespread adoption. Among these systems, pressure mat systems emerge as indispensable tools in both clinical and research settings, enriching our understanding of gait biomechanics and advancing evidence-based practice. Notably user-friendly, they streamline data collection by eliminating the need for markers or complex calibration procedures. With minimal training, pressure mats offer a wide array of gait parameters within minutes, rendering them highly efficient for comprehensive gait analysis. Acknowledging the significance of this technology and the imperative to minimize expenses, a team of interdisciplinary professionals at the Bioengineering Laboratory of the Federal University of Minas Gerais, Brazil, has pioneered the development of a modular system named GAITWell®. This innovative system provides comprehensive hardware and software solutions for the automated extraction, processing, and analysis of human gait data. Therefore, this study aims to evaluate the reliability and validity of the GAITWell® system in the spatial and temporal analysis of gait. This system offers an affordable alternative, seeking to overcome cost barriers and make gait analysis more accessible to a wider audience.
2. Materials and Methods
2.1. Study Design and Participants
This methodological study compared the spatiotemporal gait parameters measured with the GAITWell® system to those measured by the gold standard Qualisys® Pro-Reflex MCU 240 systems (QUALISYS MEDICAL AB, 411 12 Gothenburg, Sweden [11]), integrated with two force platforms. We also conducted test-retests of the GAITWell® system for gait parameters.
Healthy young adult participants without any orthopedic or neurological problems, lower limb deformities, or heart disease that would prevent walking several times on the electronic walkway were invited to take part in the study. This study was approved by the Research Ethics Committee of the Federal University of Minas Gerais (CAAE—95186518.0.0000.5149), and all participants provided written consent to participate.
2.2. Measurement Instrument
2.2.1. GAITWell® Gait Analysis System
The GAITWell® system software was developed using C sharp (C#) language that features an intuitive user interface. Data is captured by a computer that receives information from discrete sensors, processes it, and stores the processed data in a database for further analysis. The GAITWell® stands out for not relying on pressure/force sensors or retroreflective markers for gait data acquisition. Instead, it utilizes discrete sensors operating at a logical level (0 and 1; activated or deactivated) ensuring a simple yet precise alternative for the extraction and analysis of gait patterns.
The electromechanical component of the system consists of interconnected plates that form the electronic walkway, as illustrated in Figure 1a. Each plate measures 440 x 370 mm and contains a set of discrete sensors arranged in an 11 x 7 array, with a center-to-center spacing of 40 mm. The 1.76 m long walkway features a layout of 2 x 4 interconnected plates along its length and a 2 x 2 layout along its width. This dimension is essential for covering a complete gait cycle.
The plate that comprises the electronic structure is made up of five layers and two enclosures, as illustrated in Figure 1b. This structure includes the rubber surface (1) in contact with the ground and a plate housing the electronic circuit (2). A perforated protection plate (3) is employed to shield the sensors, supplemented by a transparent plate (4) designed to prevent the infiltration of particles or dust into the region where the sensors are located. Additionally, there is a carpet (5) and two enclosures (6) covering the electronic communication block and the connectors. The electronic circuit layer (2) incorporates microcontrollers, the sensor array, connectors for external power supply and interconnection of the plate, as well as a module for communication and data transmission via Bluetooth and USB.
In addition, the GAITWell® system software has three main modules: the user interface for interaction, the data acquisition module for collecting gait information, and the processing module for analyzing the data. These modules work together to obtain accurate data and create reports that are useful in analyzing human gait. The interface not only facilitates interaction but also coordinates the collection and processing of the data to generate reports.
The Graphical User Interface of the GAITWell® has been organized into distinct modules. An initial authentication screen provides access to key functionalities, including data management, connection, and results. The interface plays a fundamental role in configuring connections with the device and verifying its integrity. Subsequently, it performs a routine scan of the structures of the electronic walkway and sensors at a frequency of 1 kHz, completing this check-in in 1 ms for each structure. It provides feedback on operational status, checks and identifies module failures or connection issues, and confirms when the system is ready to initiate data collection. Additionally, the user interface constitutes the visible and interactive part of the system, offering the user tools to manage information about the participant whose gait data is being analyzed. After the hardware is connected to the software, the graphical interface collects information about the individual’s gait as they walk over the sensors. The data is recorded as vectors, accompanied by date/time stamps and corresponding states, and is transmitted to the computer through serial communication ports.
Subsequently, this data proceeds to the next stage, referred to as ‘Processing’. In this step, the sensor triggers (events) are identified and transmitted to the computer through serial communication. They then undergo preprocessing and temporal analysis. During this process, the data is transformed into a list of instances of the ‘EventSensor’ class, each associated with a specific timestamp for subsequent analysis. Additionally, the processing involves the application of the Density-Based Spatial Clustering of Applications with Noise (DBSCAN) clustering algorithm to the Cartesian points derived from the sensor readings. DBSCAN is crucial for identifying reference points such as foot contact and toe-off. This method identifies clusters of arbitrary [12,13] shapes and different sizes, separates noise from data, and detects ‘natural’ clusters and their arrangements within the data space, without any prior information about the groups [14,15,16,17].
For clustering purposes, DBSCAN distinguishes between three types of points: core points, border points, and noise points [12,13]. Core points are located within the densest area of a cluster and are characterized by having a minimum number of points within their Epsilon (Eps) neighborhood, equal to or greater than MinPts. MinPts represents the minimum quantity of points required within the EPS radius to establish a cluster [13,15]. Only core points form new clusters. Border points lie in the neighborhood of at least one core point [13,16,17]. Noise points are points that are neither core nor in the neighborhood of a core object. The DBSCAN estimates the density of points in a dataset by counting the number of points within a circle centered on the estimated points and with radius Epsilon (EPS) [13]. EPS is the maximum distance between two points for them to be considered neighbors in clustering algorithms [13,17,18]. A neighborhood is considered dense if the number of neighboring points is equal to or greater than the MinPts value [13,17].
Thus, the method requires only one input parameter but supports determining an appropriate value for it [16]. For the initial choice of parameters Eps and MinPts, several gait readings were taken from volunteer participants who walked on the GAITWell electronic walkway. The effect of altering these parameters [13] was observed to identify values that could correctly group the footprints.
The number of footprints is equals to the number of clusters identified by the DBSCAN clustering algorithm. Furthermore, using the resulting vectors as a basis, the data from each cluster is separated into left and right footprints. This division considers account the direction of walking and the average position of two consecutive footprints in the perpendicular direction to the walking progression. Figure 2a and b illustrates this process, where the first identified footprint is classified as right if it is positioned further to the right when walking in the direction of increasing coordinates of the sensor line, or further to the left when walking in the opposite direction. Subsequent footprints alternate between right and left.
Once clustering is completed, spatiotemporal variables are calculated from the clustered data (Figure 2c). This includes parameters such as step length, stride length, velocity, cadence, and gait cycle duration. These calculations offer a comprehensive understanding of the individual’s walking pattern.
After processing, a detailed analysis of the spatiotemporal variables in the gait and visual representations of the cycle through images are displayed on the ‘Results Screen’ (Figure 3). Additionally, the data, along with their respective date/time stamps, are stored in the database, serving as a customizable history of analyses. This includes specific features enabling the tracing of the exact sequence of gait events, accessible through the ‘Management Screen’. Professionals can access, review, and extract all information, from data acquisition to processing and presentation of results in a spreadsheet. This accessibility enables them to conduct additional analyses, including statistical studies, whenever necessary.
2.2.2. Qualisys Pro-Reflex System
For spatial-temporal and kinematic gait parameters, the motion analysis system Qualisys—ProReflex MCU (Qualisys MEDICAL AB, 411 12 Gothenburg, Sweden [11]) with seven cameras was used. Synchronized to the Qualisys system, two force plates (AMTI) embedded in the walkway were used, which provided the data for determining the events of the gait cycle (foot contact on the first force plate, toe off, next contact of the same foot on the second force plate). Data were collected by the data acquisition software Qualisys Track Manager 1.6.0.x-QTM and then transferred to the Visual 3D (HAS-Motion, Kingston, ON, Canada) software to process. The frequency of collection was 120 Hz. The motion analysis system has an accuracy of 0.6 mm as specified by the manufacturer and registered the position of selected markers at a frequency of 120 Hz. The force plate registered ground reaction force (GRF) data at a frequency of 1000 Hz, which was subsequently resampled to 120 Hz.
2.3. Simultaneous Integration of GAITWell and Qualisys Devices for Gait Data Collection
The data collection was conducted simultaneously using GAITWELL® and Qualisys devices. Initially, the GAITWell® electronic walkway was positioned on the wooden walkway equipped with two embedded force platforms. These platforms are integrated with the Qualisys System, enabling the joint collection of kinetic and kinematic data.
After assembly, the GAITWell® device was connected to a laptop with an Intel Core i5 processor via Bluetooth communication. The GAITWell® software was then run on the laptop, followed by pre-programmed calibration at a frequency of 1 kHz with a period of 1 ms. This automatic calibration not only ensured the proper functioning of the system but also provided the necessary operational status.
Subsequently, the force platforms were zeroed to ensure accuracy throughout the data collection process. This approach enabled simultaneous and integrated data collection, efficiently coordinating both technologies. Figure 4a illustrates the positioning of the GAITWell® electronic walkway over the force platforms. In the views of Figure 4b, it is possible to observe the specific arrangement of the platforms to capture the complete gait cycle, simultaneously with the acquisition of kinematic data by the GAITWell® system. Figure 4c highlights the final overlap of the equipment in the test.
2.4. Experimental Setup
Data was collected at the Laboratory of Movement Analysis of the School of Physical Education, Physical Therapy and Occupation Therapy at Federal University of Minas Gerais. For the first visit, kinematic and kinetic data of the Qualisys system were obtained simultaneously with the kinematic data from the GAITWell. Participants were instructed to wear a pair of shorts and walk barefoot over the gait walkway. After the first visit, participants were invited to attend a second visit one week apart, specifically for data collection using the GAITWell system. This aspect of the experiment was designated for evaluating reliability.
For the kinematic and kinetic data obtained from the Qualisys system, anatomical markers were used to determine the coordinates of lower limb segments. The markers were placed at specific locations, including the lateral and medial condyles, lateral and medial malleoli, heads of the first, second, and fifth metatarsals, and the distal end of the calcaneus. In addition, a cluster consisting of a rigid plate attached to a neoprene girdle with four tracking markers were positioned in the medial third of both shanks [19].
After attaching the passive markers and cluster, participants were asked to stand still using a comfortable stance for 5 seconds to record the static trial. Next, the participants were instructed to walk over the 9-meter walkway in their comfortable self-selected gait speed. A specific command was issued as follows: “Upon my command ‘go’, walk at a speed as close as possible to your normal gait speed.” Participants were given a practice period to familiarize themselves with the procedures. Participants performed 10 trials. Trials in which the force plate was contacted with the correct foot and all the dynamic markers were visible were used for analysis. On average 5 trials participant were used for analysis. After each collection, the data were checked for quality and stored for analysis. The average length of stay of each participant was approximately 90 minutes.
2.5. Data Reduction
The kinematic and kinetic data from the Qualisys system were processed using Visual 3D. A fourth-order Butterworth low-pass filter with cut-off frequencies set at 6 Hz and 18 Hz for kinematic and force data was applied, respectively. Automatic detection of heel strike and toe-off were obtained using the vertical ground reaction force with a 20N threshold. The gait cycle was normalized to 101 data points.
In the GAITWell system, the kinematic data is processed using a software developed by our group in C# language, which fully automates the data collection, processing, and visualization of the gait cycle. Data reduction in the GAITWell involves a post-clustering process, as described previously, aimed at deriving meaningful spatiotemporal variables characterizing an individual’s gait. The spatiotemporal parameters were calculated as detailed below.
1. Gait Cycle Time in seconds was calculated as the average of the right and left cycle times. This metric represents the time interval between the initial contact of the foot and the initial contact of the subsequent foot of the same limb.
2. Stance time in seconds was determined by subtracting the time of the first initial contact from toe-off.
3. Swing time in seconds was determined by subtracting the time of the second initial contact from toe-off.
4. The number of steps was determined based on the total number of footfalls ‘n’), with each footfall indicating the transition from one step to another. Subtracting one from the total footfalls accounts for the initial step, which does not have a preceding footfall, resulting in ‘n—1’ steps.
5. The number of Strides was determined as the number of steps minus one.
6. Total walking time in seconds was determined by determining the time interval between the first foot contact and the last foot.
7. Total Distance in meters was determined as the linear distance between the first foot contact and the last foot contact, marked by the time of initial sensor activation, and the last toe-off contact with the device surface, identified by the time the sensor is triggered for the last time.
8. Base of support in meters is determined within the plane perpendicular to the plane of progression. It represents the perpendicular distance between the first foot contact of one foot and the subsequent first contact of the opposite foot. The final value is obtained by averaging the base of support of each step.
9. Step Length in meters was determined as the linear distance in the plane of progression between the left and right heel contact.
10. Stride length in meters was determined by the linear distance in the plane of progression between the first heel contact of the foot to the subsequent heel contact of the same foot.
11. Step Time in seconds was determined as the time elapsed between the initial contacts of the right and left footfalls.
12. Cadence was determined by dividing the duration of a 60-second interval by the time it takes to complete a single step. This calculation yields the number of steps taken within one minute, representing the individual’s cadence or step frequency.
13. Gait speed was determined by multiplying cadence and step length, and it is expressed as distance per unit time; it was calculated by dividing stride length by cycle time.
14. Single Support Time was determined by calculating the arithmetic mean of the right and left single support times. It represents the average time interval between the lift-off of the opposite foot and its subsequent contact with the ground during the analyzed gait cycles.
15. Double support time was measured by identifying the two intervals that both feet were in the ground then calculating the mean of these values across the analyzed gait cycles.
2.6. Statistical Analysis
Sample characteristics and spatiotemporal gait parameters were described using measures of central tendency and dispersion. Data from visit 1 were used to determine the concurrent validity of the GAITWell® with the Qualisys system. Pearson’s correlation was conducted and the correlations coefficients were interpreted as follows: negligible (0.0 to 0.30), low (0.30 to 0.50), moderate (0.50 to 0.70), high (0.70 to 0.90), and very high (0.90 to 1.0) [20].
To assess the reliability of the GAITWell® system across two visits, the Intraclass Correlation Coefficient (ICC)2,1 was employed with a two-way random effects model. Interpretation of the ICC was as follows: poor (< 0.50), moderate (0.50 to 0.75), good (0.76 to 0.90), and excellent (> 0.90) [21]. The standard error of the mean (SEM) provides information about the repeatability of the measurement and was calculated using the pooled standard deviation between both visits and the ICC2,1:
We also applied the Bland-Altman plots to visualize the agreement between visits for the variables that did not reach reliability. Bland-Altman plots can be used to evaluate the amount of measurement bias, thus more reliable results will show an average bias closer to zero and narrower 95% limits of agreement. [22]. Thus, if the measurement falls inside the limits of agreement, then it would suggest no bias in the measurement. All analyses were conducted at a significance level of 0.05, using statistical software SPSS Statistics for Windows version 29.0 (IBM Corp, Armonk, NY, USA).
3. Results
Participated in the study 38 healthy adults, including 18 (47.4%) females, with a mean age of 33.2 years (SD 13.0) and BMI of 26.6 kg/m² (SD 5.4). Of those, only 29 returned for the second visit, including 15 (50%) females, with a mean age of 33.0 years (SD 13.4) and BMI of 27.3 kg/m² (SD 5.6).
Table 1 describes the mean and standard deviation of the gait variables obtained using the GAITWell® and the Qualisys system during the first visit. Most of the correlations varied from moderate to very high, except for stride length (r=.360, p<.05) that showed a low but significant correlation with the Qualisys system.
The mean and standard deviations and the test-retest reliability results of the GAITWell® system are described in Table 2. Reliability of the variables gait speed, stride length, cycle time, left step length, right step time, and swing time achieved a good level of agreement. However, moderate reliability was observed for right step length and left step time. Conversely, stance and double support times, cadence of right and left steps, and base of support exhibited insufficient reliability, failed to attain statistical significance.
Figure 5 displays the Bland-Altman analysis of the variables that did not achieve reliability. Increased bias, wider 95% limits of agreement, and a larger SEM are evident for the variables of left and right cadence and base of support.
4. Discussion
This study aimed to assess the methodological properties of the GAITWell® system, a low-cost technology designed to measure gait spatial-temporal parameters, within a cohort of healthy young adults. The results indicated that the GAITWell® system is comparable to the gold standard Qualisys ProReflex in computing spatiotemporal parameters in healthy young participants. However, limitations were observed in the reliability of stance time, double support time, cadence, and base of support. These discrepancies are attributed to the low resolution of the sensors used in the GAITWell® electronic walkway. Unlike pressure/force sensor technologies that provide continuous measurements, the GAITWell® system employs discrete sensors operating at logical levels 0 and 1, using a binary approach to gather footprint information. The spatial resolution of the 4.0 x 4.0 cm sensor array may not be sufficient to accurately capture subtle variations or movements in peripheral areas of the foot, where these parameters are often dependent. Additionally, the stages of data acquisition, classification, and processing are inherently linked to the sensor array’s spatial resolution, influencing triggers and consequently impacting the results obtained for quantifying the spatiotemporal characteristics of an individual’s gait.
The weak correlation observed in stride length between the GAITWell® and Qualysis systems could be attributed to differences in the methodologies employed for foot contact and toe-off detection. The GAITWell® relies on the DBSCAN clustering algorithm for spatial and temporal clustering of sensor data to identify foot contact events and subsequent stride lengths. However, variability in sensor positioning and noise in the data may introduce inaccuracies in event detection, potentially resulting in variability in calculated stride lengths. Conversely, the Qualisys system collects ground reaction forces (GRF) simultaneously, which are used by Visual 3D to precisely detect foot contact and toe-off events, enabling accurate calculation of stride lengths.
Notably, our study found a strong correlation between the right and left step lengths measured by the GAITWell® and Qualisys systems, indicating consistency in measuring each step separately. However, discrepancies in stride length calculation may arise due to differences in the identification and timing of foot contact and toe-off events, leading to an overall weaker correlation. Thus, while discrete-sensors-based systems offer an alternative approach, systems that use GRF generally provide more reliable and consistent measurements of stride length and base of support in gait analysis. Increasing the spatial resolution of sensors could help mitigate these issues by providing finer-grained data and more precise measurements of foot contact events, aiding in distinguishing between noise and actual foot contact events, thereby reducing the likelihood of false detections and improving the reliability of the measurements.
Our study demonstrated excellent reliability for key gait parameters including gait speed, stride length, cycle time, and step length, indicating consistent and reproducible measurements across repeated trials. This reliability underscores the robustness of our data collection methodology and the stability of these variables when assessed using our system. However, it’s important to acknowledge that reliability was not achieved for the variables stance time, double support time, cadence, and base of support. This limitation may stem from several factors, including the complexity of accurately measuring these variables using our discrete-sensors-based system. Stance time and double support time, for instance, require precise identification of foot contact and toe-off events, which may be influenced by sensor placement, noise in the data, and algorithmic sensitivity. Similarly, cadence and base of support measurements rely on accurate temporal and spatial analysis of gait cycles. Individual variability in gait patterns might also contribute to the challenge in reliably measuring cadence. We assessed the agreement using Blant-Altman plots (Figure 5), which showed minimal bias for stance time, double support time, and base of support. This suggests that, on average, the measurements closely match the true or reference value. We acquired data from visit 2 using the Qualisys system (not reported in this study) and decided to plot the same variables for visual comparison. Surprisingly, we observed inconsistencies in some variables even with the gold standard. Specifically, the double support time exhibited larger limits of agreement compared to those observed with the GAITWell® system. Furthermore, the limits of agreement for stance time were found to be very close to those obtained with the GAITWell® system. These findings suggest that variability may also contribute to discrepancies in measurements, even with widely accepted gold standard systems. Our goal in plotting these graphs was to highlight the potential sources of variation in measurements and emphasize the importance of thorough validation studies to ensure the accuracy and reliability of motion capture systems. To address these inaccuracies, we plan to upgrade the sensors to higher resolution, optimize sensor placement, and refine algorithms for data processing. For gait analysis systems like the GAITWell® electronic walkway we recommend a resolution of around 1-2 millimeters to appropriate capture fine-grained details of foot movements. Closer sensor proximity reduces empty space between them, resulting in better foot image definition on the ‘virtual mat’ and more accurate processed data. This resolution allows for the detection of subtle variations in gait dynamics, which are essential for accurate assessment of spatiotemporal parameters.
It is important to consider the trade-offs between spatial resolution and other factors such as cost, system complexity, and data processing requirements. Higher spatial resolution sensors may come with increased costs and computational demands, but our preliminary review suggests that increasing the resolution of the carpet would not significantly affect the overall expenses. Therefore, considering the potential benefits in measurement accuracy, we are inclined to pursue this enhancement in our system.
Our study aligns with prior research investigating the reliability of mat-based gait analysis systems, particularly exemplified in the early evaluations of the GAITRite [23] system by Menz et al. [24]. Despite exhibiting commendable Intraclass Correlation Coefficients (ICCs), [24] identified notable challenges in the reliability of base of support and toe in/out angles. Their findings showed discrepancies associated with higher coefficients of variation, ranging from 8.3% to 17.7% in younger cohorts and 14.3% to 33.0% in older adults. At that time, the authors suggested caution in interpreting base of support and toe in/out angles, particularly within the context of older populations, where stability during gait is paramount. This serves as a poignant reminder of the imperative for stringent testing and continual refinement during the nascent stages of system development. It’s noteworthy that while these challenges are evident, they are not insurmountable. As researchers, we are actively engaged in addressing these issues, steadfast in our commitment to enhancing the reliability and precision of our GAITWell® system for the benefit of scientific inquiry and clinical practice within the realm of human locomotion.
Two limitations in our study merit discussion. Firstly, while we assessed the validity of the GAITWell® system against the Qualisys ProReflex, an established motion track system, it would have been ideal to also evaluate its validity against other widely recognized carpet-based systems such as GAITRite [25] or the Zeno Walkway [26] Comparative assessments with these systems could provide a more comprehensive understanding of the GAITWell’s performance across different measurement platforms. Secondly, our study focused exclusively on a cohort of healthy young adults. Therefore, generalizability to broader populations, including individuals with disabilities or different age groups, remains uncertain. Future research efforts should prioritize expanding the participant pool to encompass diverse demographic and clinical profiles, thus ensuring the applicability and relevance of the GAITWell® system across a wider spectrum of users.
Our findings indicate that the GAITWell® system shows promise as an accessible tool for gait analysis. Moving forward, our research will focus on refining the system’s sensor accuracy and algorithms to enhance reliability, as well as exploring its utility in diverse patient populations and clinical settings. Notably, the GAITWell® system’s affordability underscores its potential to widen access to essential gait analysis tools.
5. Patents
The GAITWell® technology has been patented under the number BR 202017028502-8, filed on 12/28/2017, and granted on 12/26/2023. The patent covers a device for quantifying the spatiotemporal parameters of human gait, as well as the processes of operating this device and quantifying these parameters using the device.
Author Contributions
Conceptualization, W.D.D., I.C.B., I.O.C., and M.S.; Formal analysis, W.D.D., R.K., I.C.B., and I.O.C.; Investigation, W.D.D.; Methodology, W.D.D.; Project administration, W.D.D. and R.H.; Resources, R.H.; Software, I.C.B. and I.O.C.; Validation, W.D.D., R.K., I.C.B., and I.O.C.; Writing—original draft, W.D.D. and R.K.; Writing—review and editing, W.D.D., R.K., M.S., C.B.S.V., and R.H.
Funding
W.D.D was funded by the Conselho Nacional de Desenvolvimento Científico e Tecnológico (CNPQ)—Process number 142163/2018-0. All other authors have no financial disclosures to declare.
Institutional Review Board Statement
The study was conducted in accordance with the Ethics Committee of Brazil (COEP) under the number CAAE: 95186518.0.0000.5149. Approval number: 2.836.553, with the approval date being August 22, 2018, for studies involving humans.
Informed Consent Statement
Informed consent was obtained from all subjects involved in the study.
Data Availability Statement
The data presented in this study are available on request from the corresponding author.
Acknowledgments
The authors would like to thank the Conselho Nacional de Desenvolvimento Científico e Tecnológico (CNPq)—Process number 142163/2018-0, for their support in this project. This study was financed in part by the Coordenação de Aperfeiçoamento de Pessoal de Nível Superior—Brasil (CAPES)—Finance Code 001.
Conflicts of Interest
The authors declare no conflicts of interest.
References
- Doi, T., Nakakubo, S., Tsutsumimoto, K., Kim, M. J., Kurita, S., Ishii, H., & Shimada, H. (2020). Spatio-temporal gait variables predicted incident disability. Journal of NeuroEngineering and Rehabilitation, 17(1). [CrossRef]
- Herssens, N., Verbecque, E., Hallemans, A., Vereeck, L., van Rompaey, V., & Saeys, W. (2018). Do spatiotemporal parameters and gait variability differ across the lifespan of healthy adults? A systematic review. In Gait and Posture (Vol. 64). [CrossRef]
- Chen, S., Lach, J., Lo, B., & Yang, G. Z. (2016). Toward Pervasive Gait Analysis with Wearable Sensors: A Systematic Review. In IEEE Journal of Biomedical and Health Informatics (Vol. 20, Issue 6). [CrossRef]
- Chui, K. K., & Lusardi, M. M. (2010). Spatial and temporal parameters of self-selected and fast walking speeds in healthy community-living adults aged 72-98 years. Journal of Geriatric Physical Therapy, 33(4). [CrossRef]
- Fried, L. P., Ferrucci, L., Darer, J., Williamson, J. D., & Anderson, G. (2004). Untangling the Concepts of Disability, Frailty, and Comorbidity: Implications for Improved Targeting and Care. In Journals of Gerontology - Series A Biological Sciences and Medical Sciences (Vol. 59, Issue 3). [CrossRef]
- Simon, S. R. (2004). Quantification of human motion: Gait analysis - Benefits and limitations to its application to clinical problems. Journal of Biomechanics, 37(12). [CrossRef]
- Mason, R., Pearson, L. T., Barry, G., Young, F., Lennon, O., Godfrey, A., & Stuart, S. (2023). Wearables for Running Gait Analysis: A Systematic Review. In Sports Medicine (Vol. 53, Issue 1). [CrossRef]
- Sacco, G., Ben-Sadoun, G., Gautier, J., Simon, R., Goupil, M., Laureau, P., Terrien, J., & Annweiler, C. (2023). Comparison of spatio-temporal gait parameters between the GAITRite<sup>®</sup> platinum plus classic and the GAITRite<sup>®</sup> CIRFACE among older adults: a retrospective observational study. BMC Geriatrics, 23(1). [CrossRef]
- Dommershuijsen, L. J., Isik, B. M., Darweesh, S. K. L., van der Geest, J. N., Kamran Ikram, M., & Arfan Ikram, M. (2021). Unraveling the association between gait and mortality-one step at a time. Journals of Gerontology - Series A Biological Sciences and Medical Sciences, 75(6). [CrossRef]
- Muro-de-la-Herran, A., García-Zapirain, B., & Méndez-Zorrilla, A. (2014). Gait analysis methods: An overview of wearable and non-wearable systems, highlighting clinical applications. Sensors (Switzerland), 14(2), 3362–3394. [CrossRef]
- Qualisys. Motion Capture Systems [Corporate Website] Gotemburgo, Suécia. Available online: http://www.qualisys.com.
- Ester, M., Kriegel, H. P., Sander, J., & Xu, X. (1996). A Density-Based Algorithm for Discovering Clusters A Density-Based Algorithm for Discovering Clusters in Large Spatial Databases with Noise. Proceedings - 2nd International Conference on Knowledge Discovery and Data Mining, KDD 1996.
- Starczewski, A., Goetzen, P., & Er, M. J. (2020). A New Method for Automatic Determining of the DBSCAN Parameters. Journal of Artificial Intelligence and Soft Computing Research, 10(3). [CrossRef]
- Ansari, M. Y., Ahmad, A., Khan, S. S., Bhushan, G., & Mainuddin. (2020). Spatiotemporal clustering: a review. Artificial Intelligence Review, 53(4). [CrossRef]
- Wang, C., Ji, M., Wang, J., Wen, W., Li, T., & Sun, Y. (2019). An improved DBSCAN method for LiDAR data segmentation with automatic Eps estimation. Sensors (Switzerland), 19(1). [CrossRef]
- Schubert, E., Sander, J., Ester, M., Kriegel, H. P., & Xu, X. (2017). DBSCAN revisited, revisited: Why and how you should (still) use DBSCAN. ACM Transactions on Database Systems, 42(3). [CrossRef]
- Tran, T. N., Drab, K., & Daszykowski, M. (2013). Revised DBSCAN algorithm to cluster data with dense adjacent clusters. Chemometrics and Intelligent Laboratory Systems, 120. [CrossRef]
- Mahesh Kumar, K., & Rama Mohan Reddy, A. (2016). A fast DBSCAN clustering algorithm by accelerating neighbor searching using Groups method. Pattern Recognition, 58. [CrossRef]
- Mukaka, M. M. (2012). Statistics corner: A guide to appropriate use of correlation coefficient in medical research. Malawi Medical Journal, 24(3).
- Koo, T. K., & Li, M. Y. (2016). A Guideline of Selecting and Reporting Intraclass Correlation Coefficients for Reliability Research. Journal of Chiropractic Medicine, 15(2), 155–163. [CrossRef]
- Giavarina, D. (2015). Understanding Bland Altman analysis. Biochemia Medica, 25(2). [CrossRef]
- Manal, K., McClay, I., Stanhope, S., Richards, J., & Galinat, B. (2000). Comparison of surface mounted markers and attachment methods in estimating tibial rotations during walking: An in vivo study. Gait and Posture, 11(1). [CrossRef]
- GAITRite ®, 2023. The GAITRite Gold Standard. Available online: https://www.gaitrite.com.
- Menz, H. B., Latt, M. D., Tiedemann, A., Kwan, M. M. S., & Lord, S. R. (2004). Reliability of the GAITRite<sup>®</sup> walkway system for the quantification of temporo-spatial parameters of gait in young and older people. Gait and Posture, 20(1), 20–25. [CrossRef]
- McDonough, A. L., Batavia, M., Chen, F. C., Kwon, S., & Ziai, J. (2001). The validity and reliability of the GAITRite system’s measurements: A preliminary evaluation. Archives of Physical Medicine and Rehabilitation, 82(3), 419–425. [CrossRef]
- Vallabhajosula, S., Humphrey, S. K., Cook, A. J., & Freund, J. E. (2019). Concurrent Validity of the Zeno Walkway for Measuring Spatiotemporal Gait Parameters in Older Adults. Journal of Geriatric Physical Therapy, 42(3). [CrossRef]
Figure 1.
In (a), an image of the electronic device. In (b), the five layers forming the modular hardware structure (refer to the text for explanation).
Figure 1.
In (a), an image of the electronic device. In (b), the five layers forming the modular hardware structure (refer to the text for explanation).
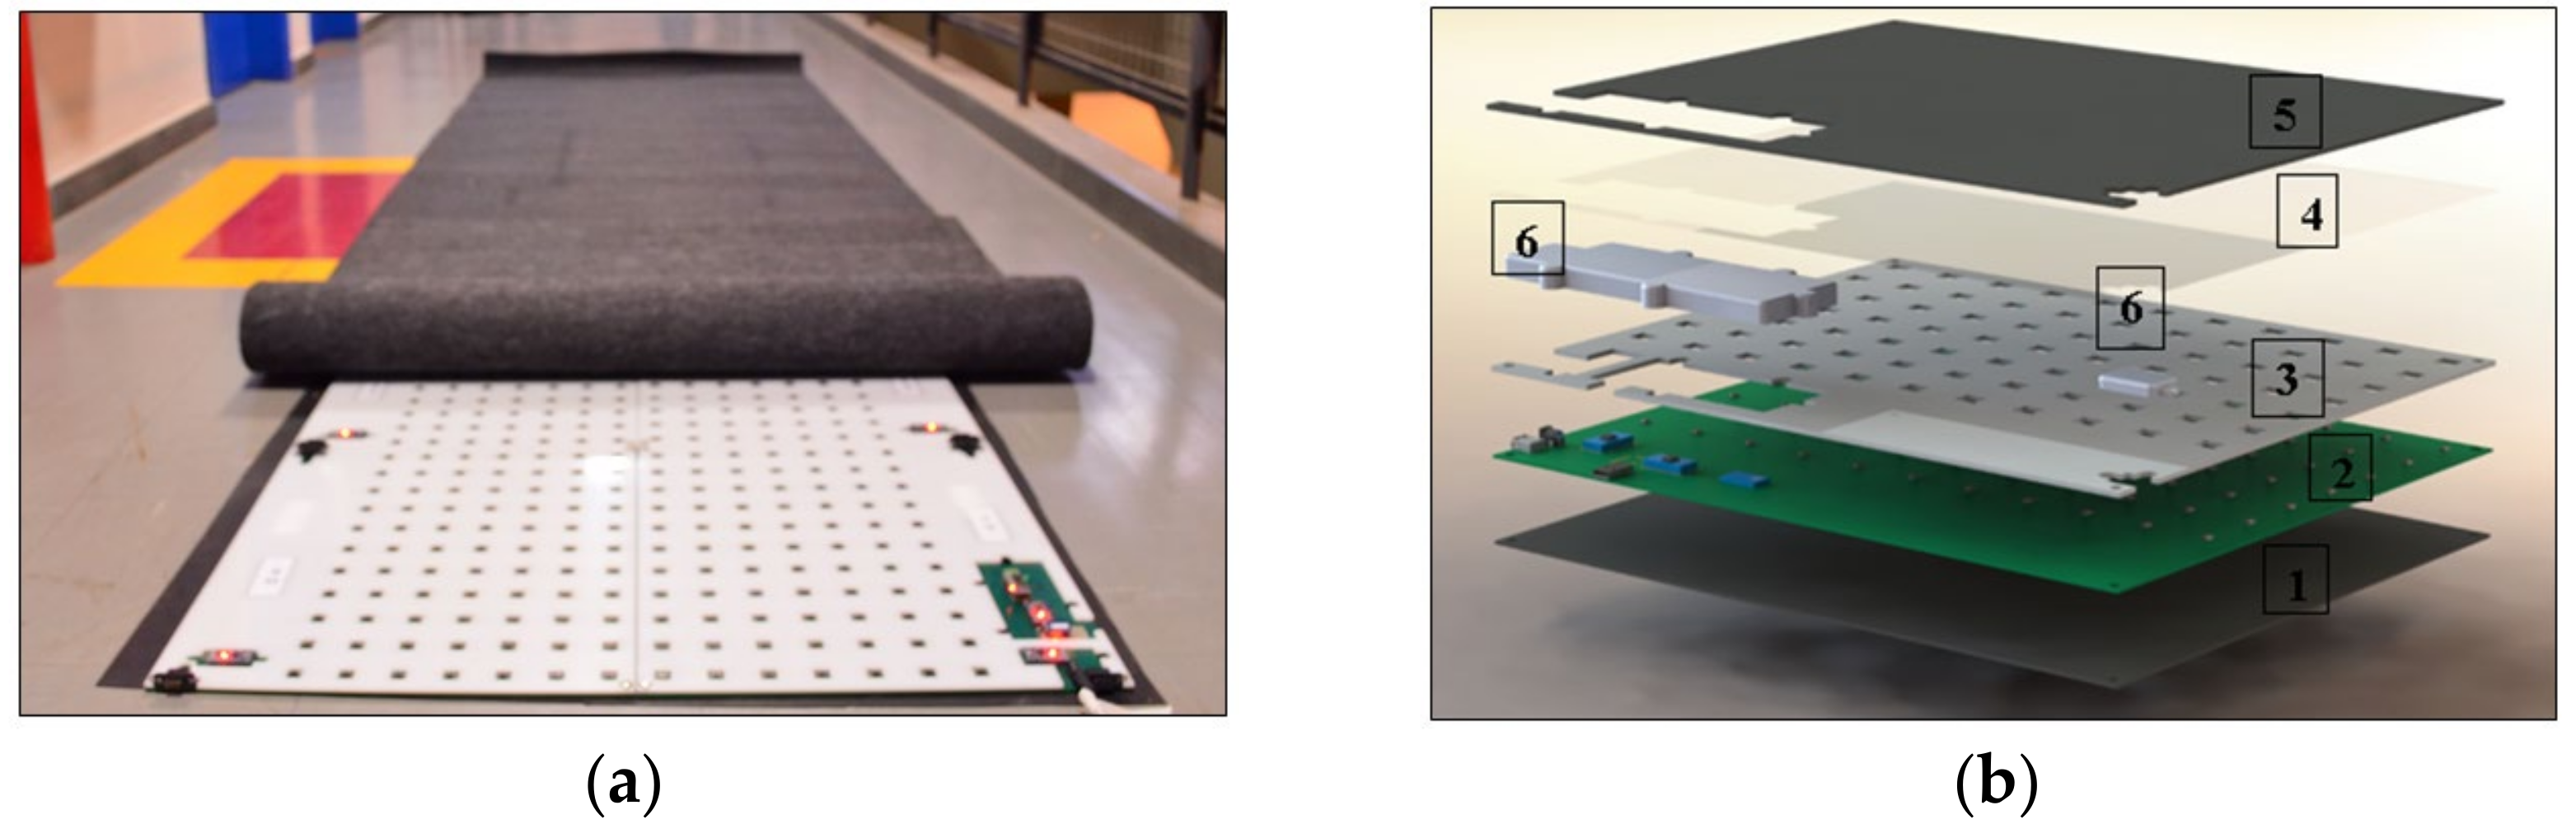
Figure 2.
In (a) Map of all footprints during the gait cycle test; (b) Resulting clustering analysis after excluding the initial partial footprint; (c) Schematic representation illustrating how GAITWell® determines step length relative to the (x, y) coordinate and the initial sensor activation on the device by heel strike, stride length and base of support.
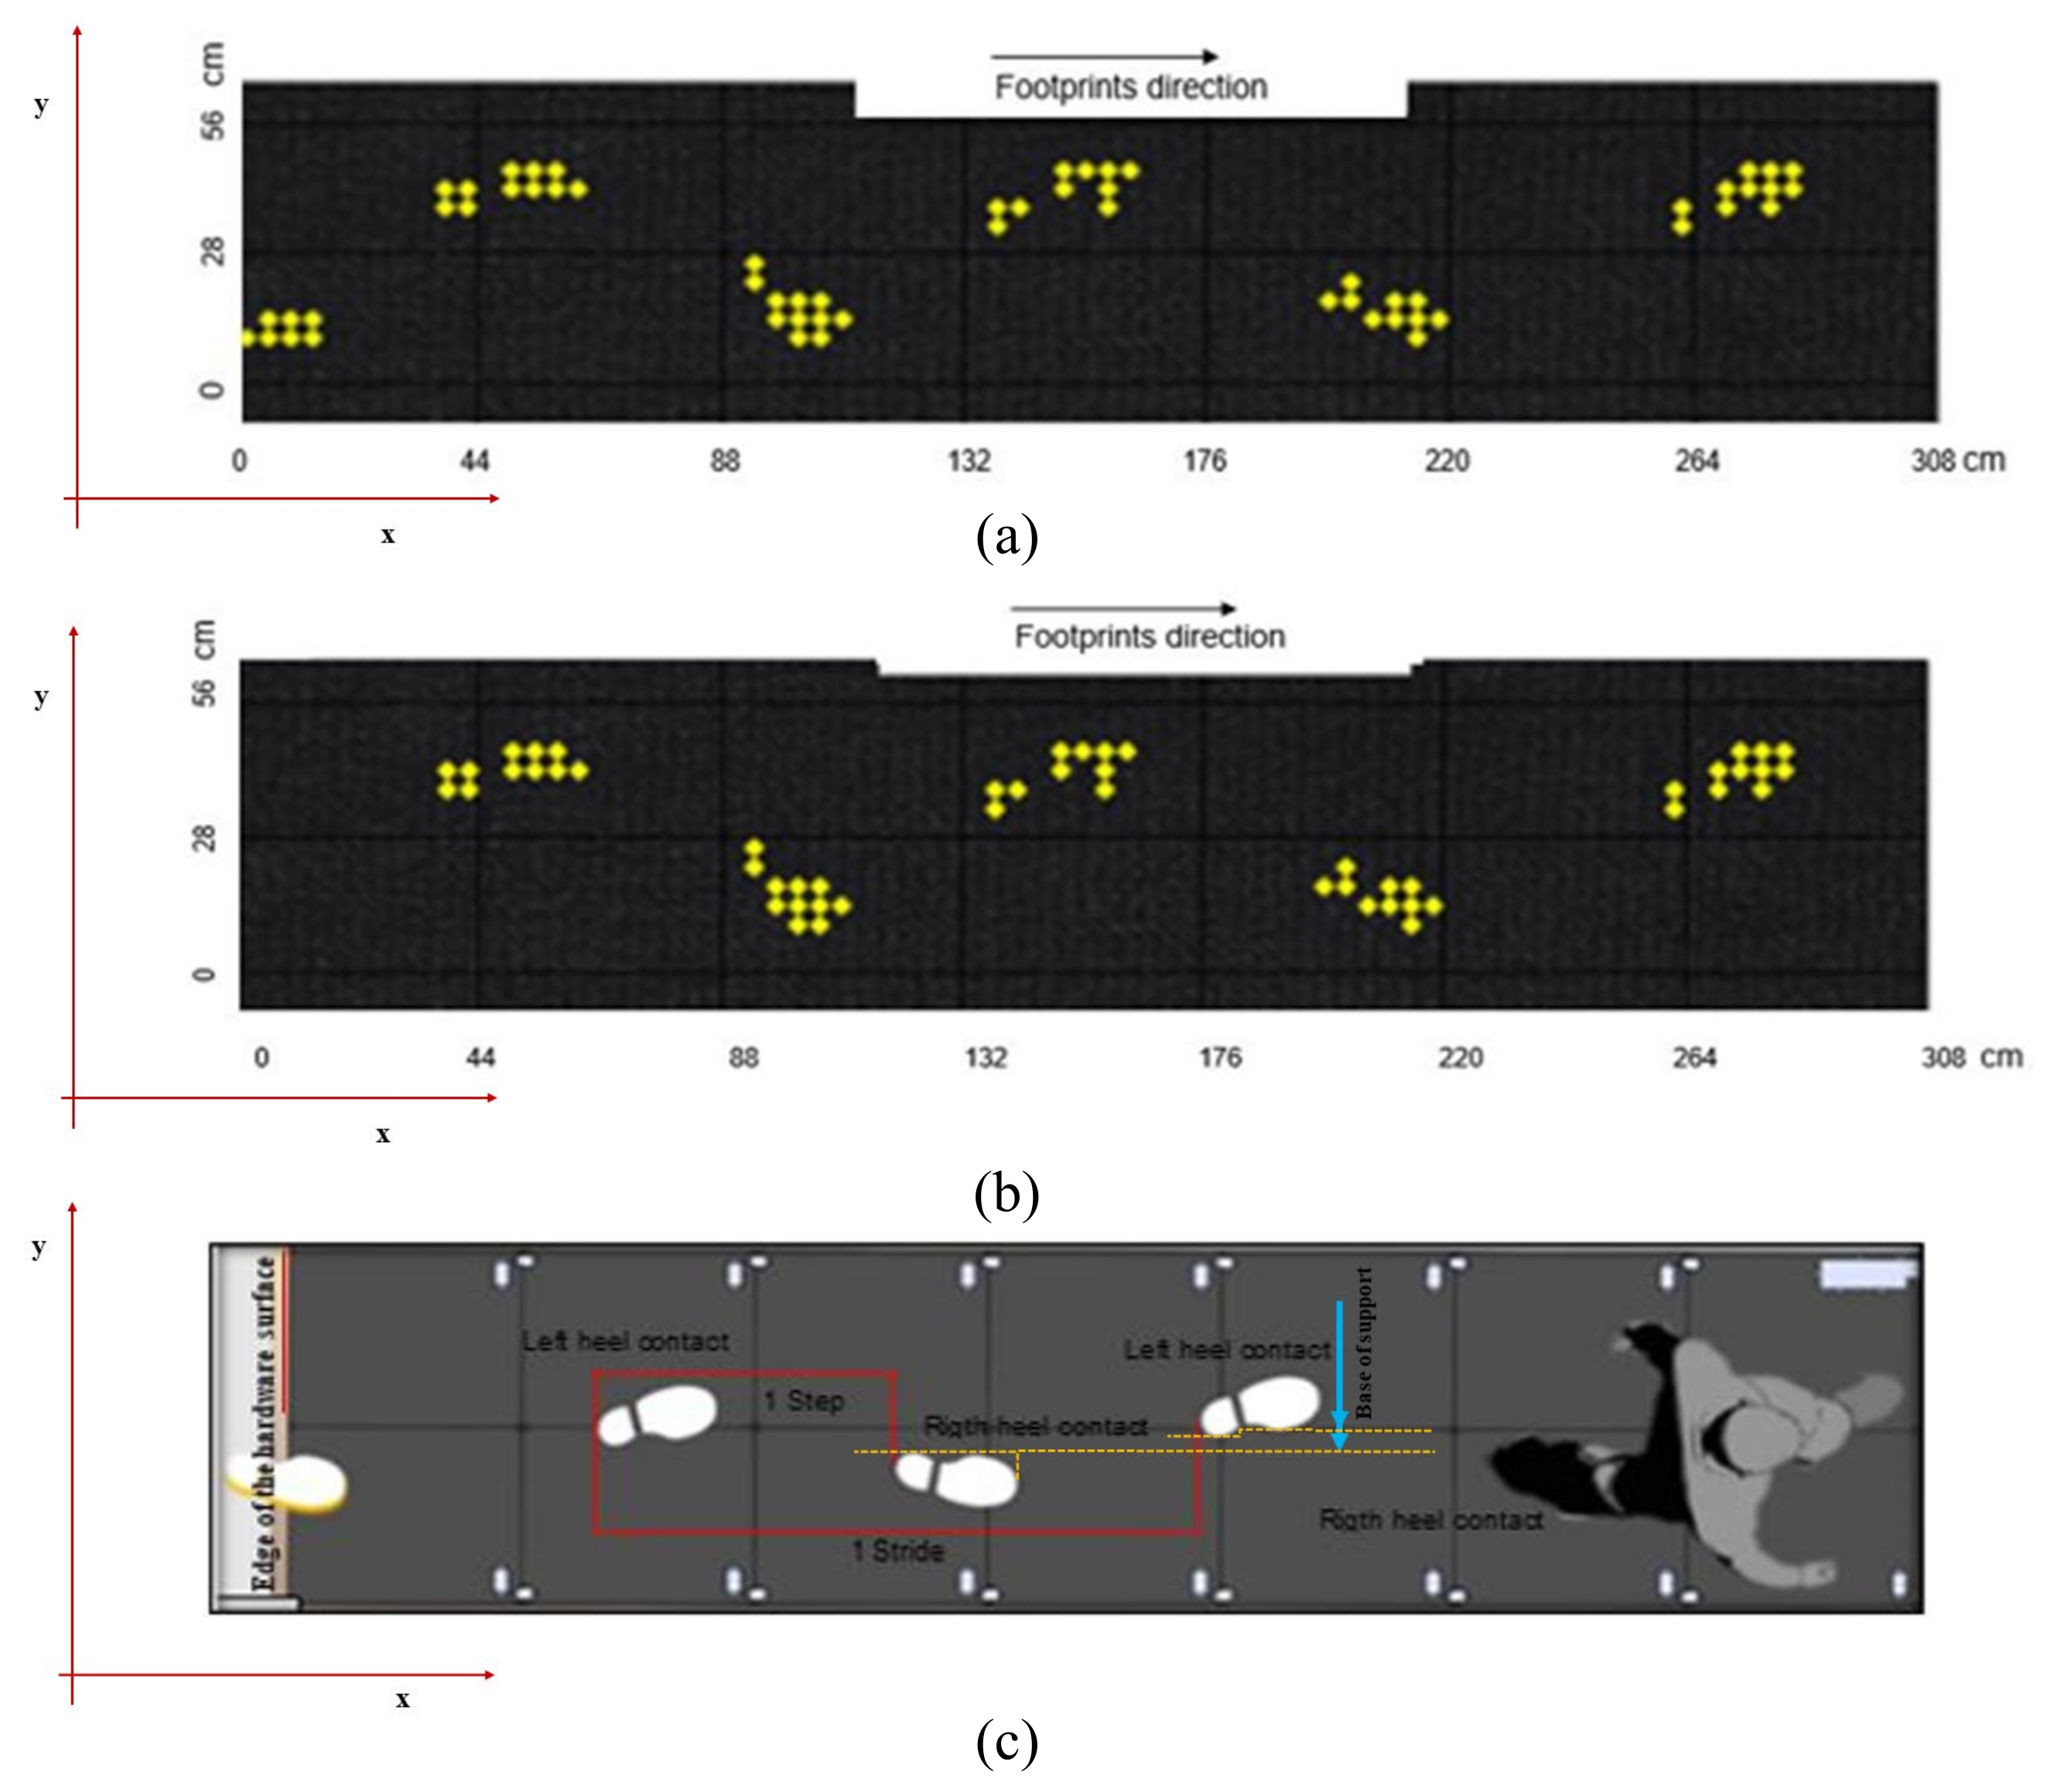
Figure 3.
GAITWell interface showing the selected footprints and calculated spatiotemporal variables.
Figure 3.
GAITWell interface showing the selected footprints and calculated spatiotemporal variables.
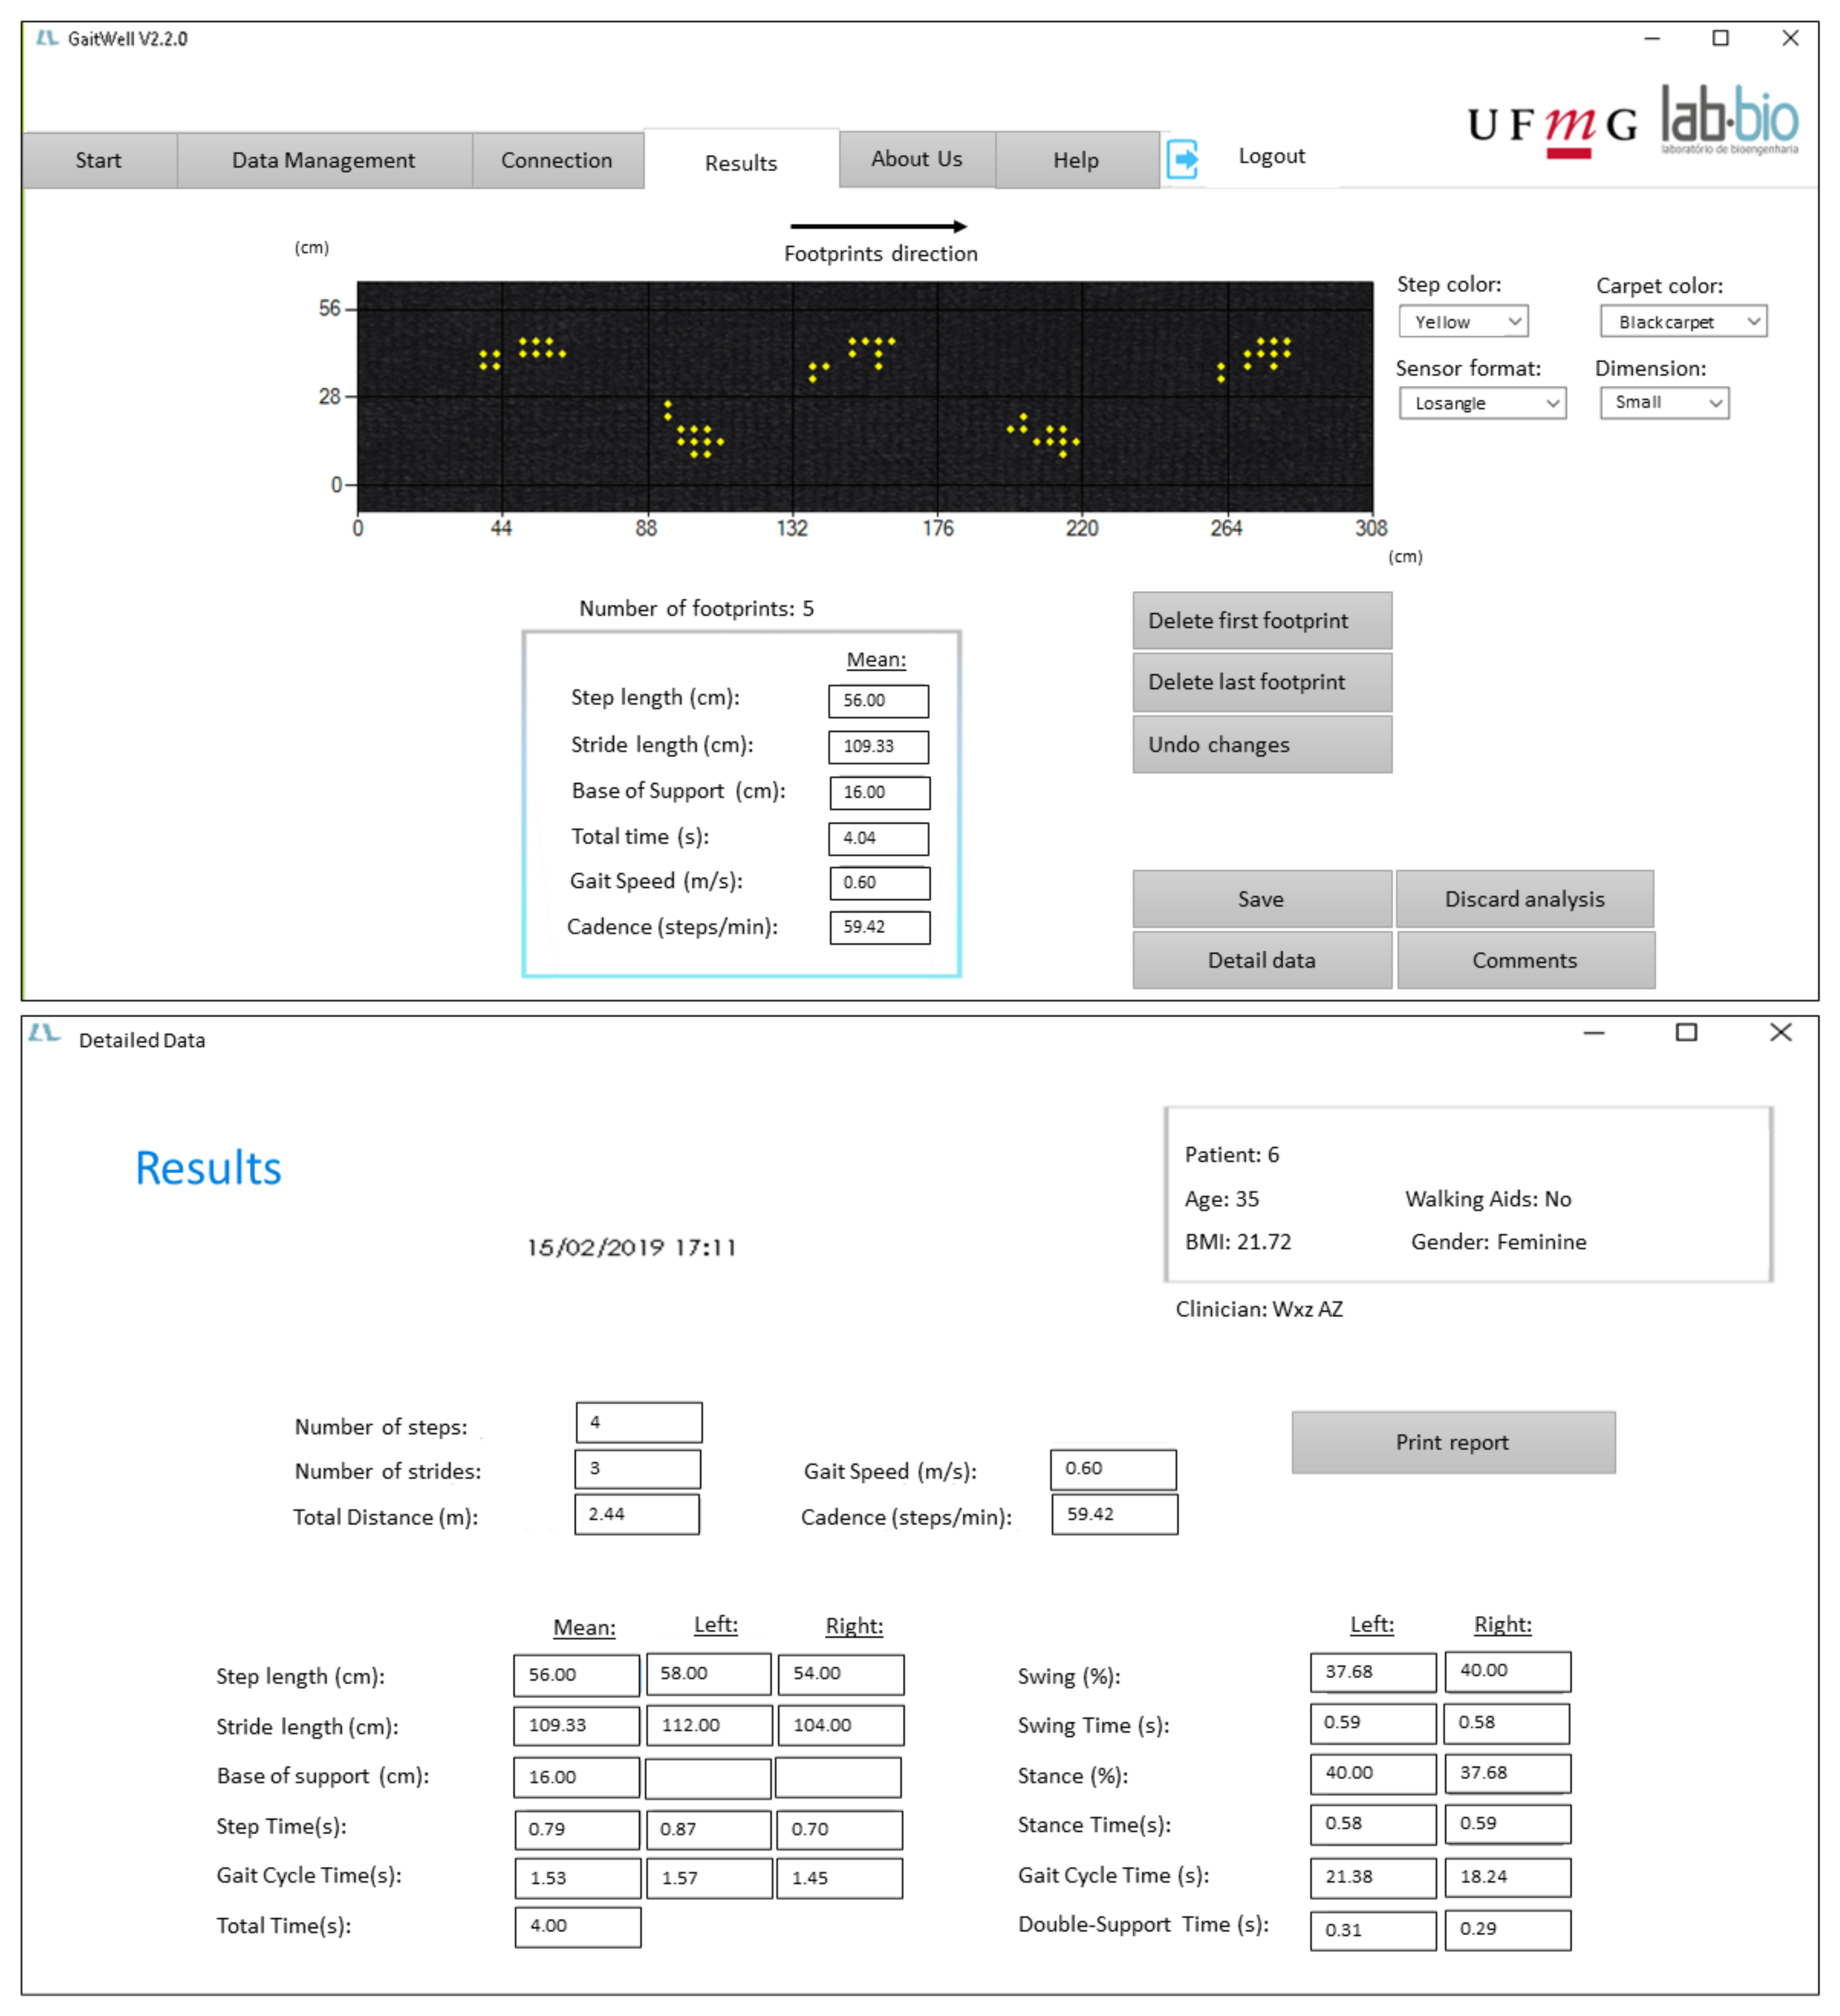
Figure 4.
Experimental Environment Setup—Panoramic view of the testing area with the GAITWell electronic walkway positioned on top of the two force plates.
Figure 4.
Experimental Environment Setup—Panoramic view of the testing area with the GAITWell electronic walkway positioned on top of the two force plates.
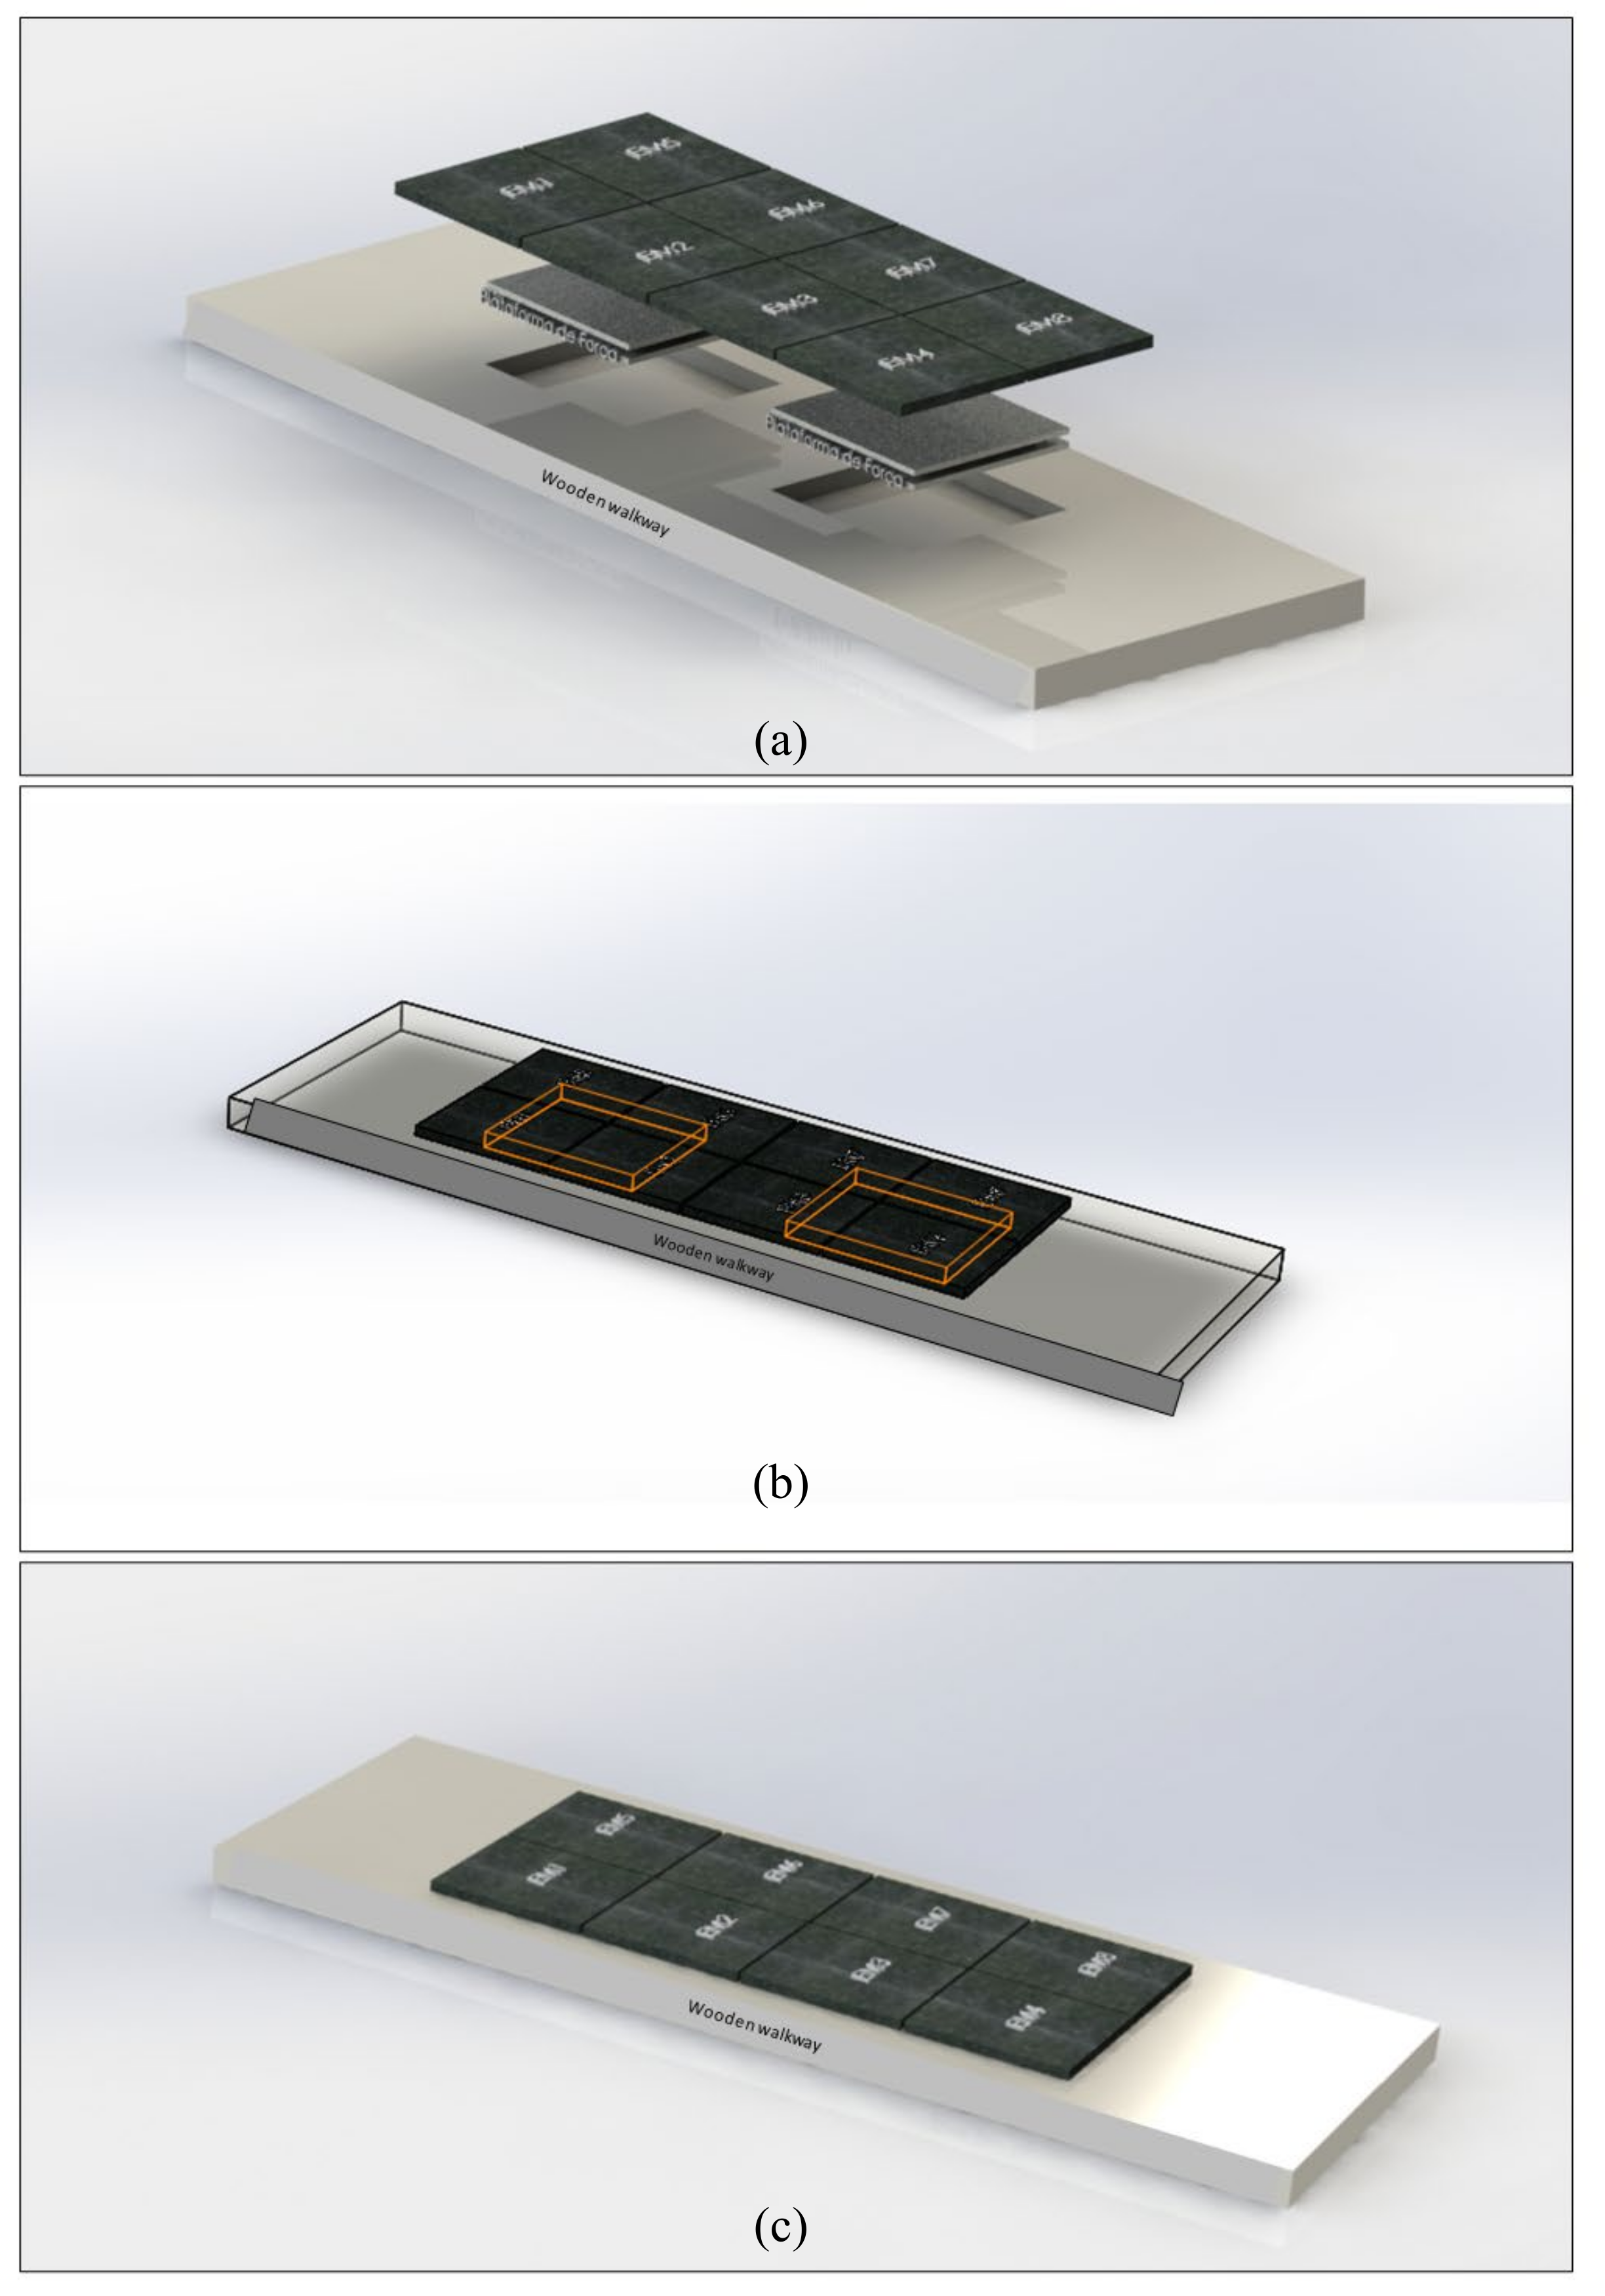
Figure 5.
Blant-Altman plots of selected spatiotemporal variables during walking. Dashed lines = 95% limits of agreement (1.96 SDs of the mean difference); darker dashed = mean difference or bias.
Figure 5.
Blant-Altman plots of selected spatiotemporal variables during walking. Dashed lines = 95% limits of agreement (1.96 SDs of the mean difference); darker dashed = mean difference or bias.
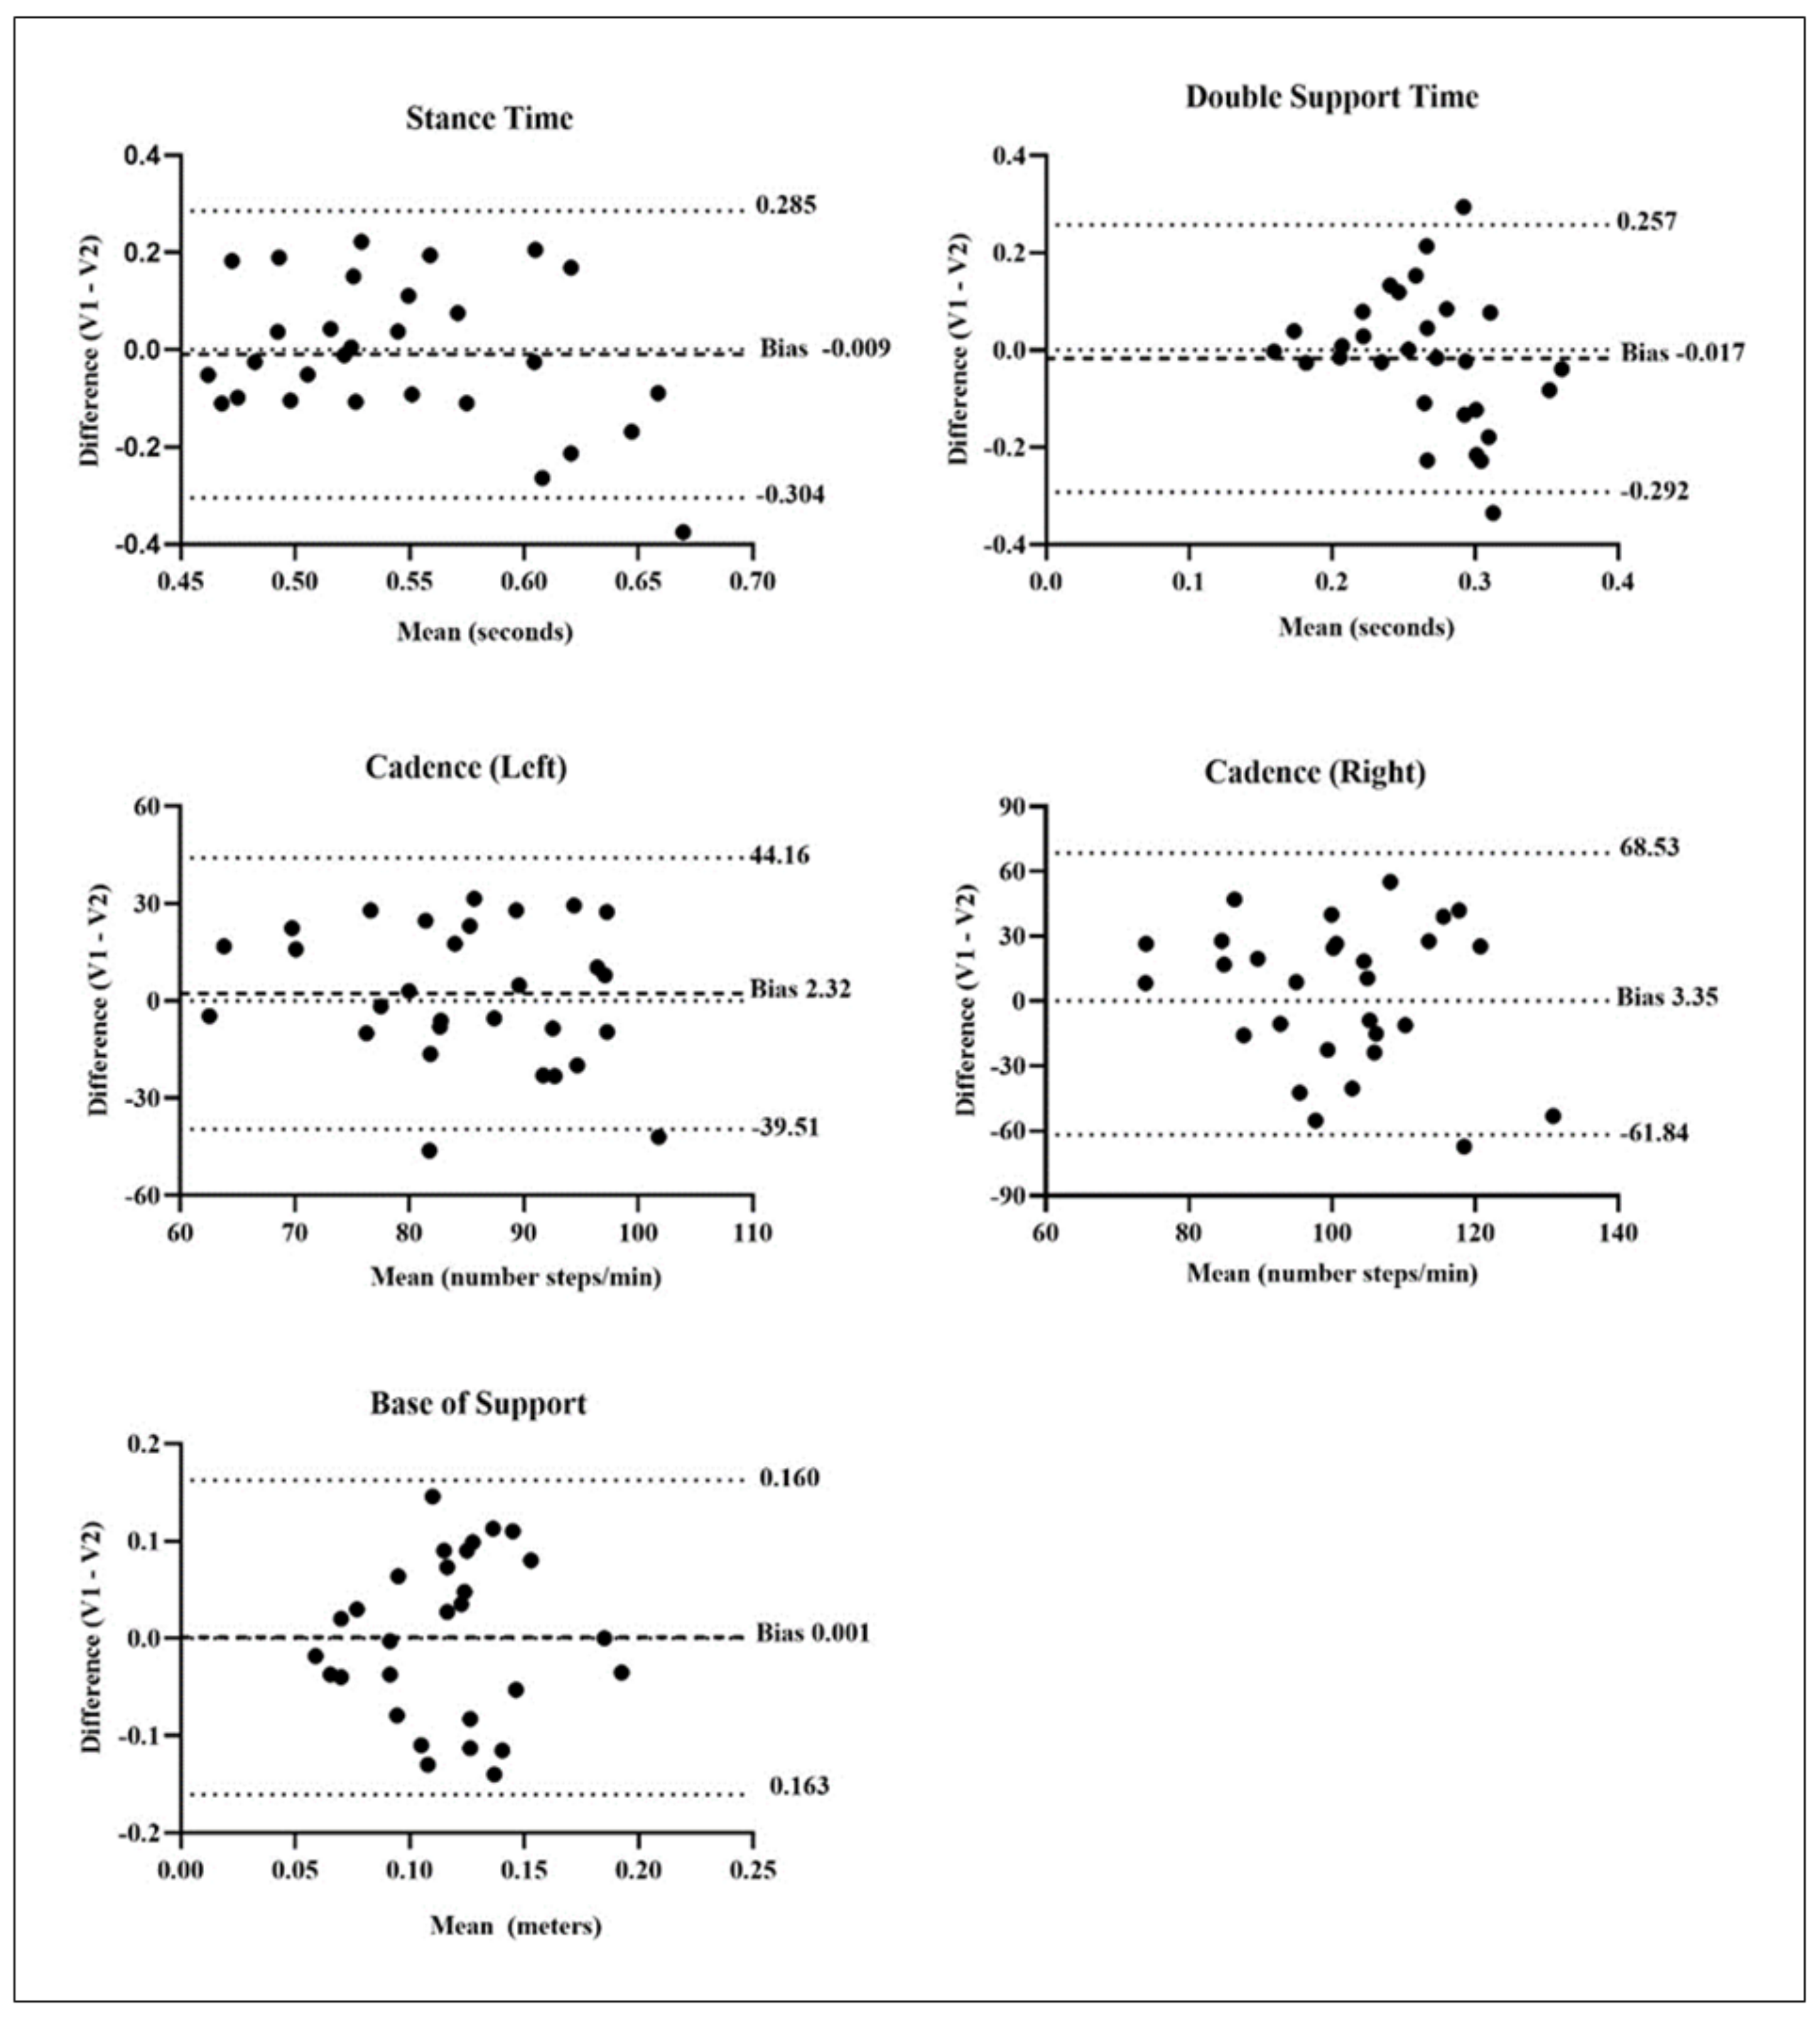

Table 1.
Mean, standard deviation, and correlation of gait variables between the GAITWell® and Qualisys systems during the first visit (n=38).
Table 1.
Mean, standard deviation, and correlation of gait variables between the GAITWell® and Qualisys systems during the first visit (n=38).
| Gait Variables | GAITWellN=38mean (SD) | QualisysN=38mean (SD) | r |
|---|---|---|---|
| Gait Speed (m/s) | 0.89 (0.16) | 0.89 (0.15) | .9711 |
| Stride length (cm) | 112.9 (7.5) | 109.1 (16.0) | .3602 |
| Gait cycle time (s) | 1.30 (0.19) | 1.25 (0.21) | .7621 |
| Right step length (cm) | 56.1 (4.4) | 56.6 (3.9) | .6721 |
| Left step length (cm) | 56.8 (3.9) | 56.7 (3.9) | .8031 |
| Right step time (s) | 0.71 (0.11) | 0.63 (0.10) | .7961 |
| Left step time (s) | 0.59 (0.11) | 0.65 (0.10) | .8291 |
| Stance time (s) | 0.53 (0.07) | 0.81 (0.13) | .8671 |
| Swing time (s) | 0.53 (0.08) | 0.48 (0.06) | .8761 |
| Right cadence (steps/min) | 104.9 (18.1) | 96.1 (13.7) | .8261 |
| Left cadence (steps/min) | 87.2 (12.8) | 94.6 (13.9) | .8081 |
| Base of support (cm) | 11.4 (5.0) | 11.8 (4.0) | .9141 |
m: meters, s: seconds; steps/min: steps per minute; r correlation coefficient; 1 <.001, 2 <.05.
Table 2.
Test retest reliability of the GAITWell® system (N=29).
| Gait Variables | Visit 1Mean (SD) | Visit 2Mean (SD) | Visit 1 vs. Visit 2 | SEM | |
|---|---|---|---|---|---|
| ICC2,1(95% CI) | P-value | ||||
| Gait Speed (m/s) | 0.88 (0.15) | 0.83 (0.16) | .864 (.675-.940) | .001 | .022 |
| Stride length (cm) | 113.3 (6.9) | 111.6 (7.3) | .818 (.616-.914) | .001 | .013 |
| Gait cycle time (s) | 1.31 (0.20) | 1.39 (0.27) | .847 (.645-.931) | .001 | .037 |
| Right step length (cm) | 56.6 (4.2) | 56.2 (3.9) | .650 (.250-.836) | .004 | .014 |
| Left step length (cm) | 56.7 (3.5) | 55.4 (4.0) | .764 (.494-.889) | .001 | .009 |
| Right step time (s) | 0.71 (0.12) | 0.75 (0.15) | .821 (.614-.916) | .001 | .024 |
| Left step time (s) | 0.60 (0.11) | 0.64 (0.15) | .691 (.357-.853) | .001 | .041 |
| Stance time (s) | 0.54 (0.08) | 0.55 (0.11) | -.583 (-2.58-.277) | .875 | .151 |
| Swing time (s) | 0.54 (0.08) | 0.58 (0.10) | .767 (.490-.892) | .001 | .022 |
| Double-support time (s) | 0.26 (0.07) | 0.27 (0.10) | -.344 (-.644-.032) | .965 | .115 |
| Right cadence (steps/min) | 102.6 (19.2) | 99.3 (23.4) | -.528 (-2.41-.298) | .859 | 32.58 |
| Left cadence (steps/min) | 86.1 (13.1) | 83.8 (16.3) | -.091 (-1.39-.495) | .588 | 16.03 |
| Base of support (cm) | 11.7 (5.4) | 11.6 (5.1) | -.639 (-2.74-.253) | .891 | 8.53 |
Disclaimer/Publisher’s Note: The statements, opinions and data contained in all publications are solely those of the individual author(s) and contributor(s) and not of MDPI and/or the editor(s). MDPI and/or the editor(s) disclaim responsibility for any injury to people or property resulting from any ideas, methods, instructions or products referred to in the content. |
© 2024 by the authors. Licensee MDPI, Basel, Switzerland. This article is an open access article distributed under the terms and conditions of the Creative Commons Attribution (CC BY) license (http://creativecommons.org/licenses/by/4.0/).
Copyright: This open access article is published under a Creative Commons CC BY 4.0 license, which permit the free download, distribution, and reuse, provided that the author and preprint are cited in any reuse.


