
Submitted:
18 June 2024
Posted:
19 June 2024
You are already at the latest version
Abstract
The impact of interaction SS with MJO on rainfall along Java Island to East Nusa Tenggara has been studied using daily rainfall observation data from 2140 weather observation stations, which are also equipped with GSMaP, OLR, and ERA5 data. There were 61 SS events found, 17 during active MJO and 44 in inactive MJO. Rainfall increases more in the western study area when the active MJO and more in the eastern study area when the inactive MJO is due to SS. SS reduces rainfall in the Jakarta region, regardless of the activity or inactivity of the MJO. SS causes extreme rainfall to only occur in a small part of certain areas, so it tends to significantly reduce the possibility of extreme rainfall. In the southern part of the IMC, SS predominates over MJO in supporting increased water vapor transport. Large-scale synoptic circulations like the monsoon, SS, and MJO can interact with local land-sea wind circulation to produce spatiotemporal variability in rainfall on Java Island. Rainfall mostly increases in the afternoon and decreases in the morning when SS occurs, whether there is MJO or not. Convective instability analysis indicates that SS increases precipitation, most likely by lowering CIN and raising VIMFC.
Keywords:
Southerly Surge
; MJO
; Rainfall
; Java Island
; East Nusa Tenggara
1. Introduction
The Indonesia Maritime Continent (IMC) is a unique geographical area situated between two oceans (the Pacific and Indian Oceans) and two continents (Asia and Australia). In addition, IMC features a sophisticated mountainous system made up of more than 13,000 small islands and five major islands: Papua, Kalimantan, Sumatra, Sulawesi, and Java (Yamanaka 2016). Due to its unique geographic location, IMC is traversed by variations in global winds that affect climatic conditions in the country, commonly referred to as monsoon winds in the form of the East and South Asian monsoon and the Australian monsoon. Monsoon activity significantly influences weather formation in the areas it passes through and is often associated with synoptic disturbances in these regions. IMC is a transitional zone between the Australian Monsoon (AUM) and Asian Monsoon (AM) systems, according to Chang et al. (2004). As a result, IMC experiences seasonal variations in wind and rainfall patterns. In general, the rainy season in IMC usually coincides with the strengthening of the AM, which is characterized by the strengthening of westerly wind activity in the southern equatorial region of IMC and occurs around the beginning of November and ends at the end of March (NDJFM), which is also known as the Asian Winter Monsoon (AWM) Circulation (Aldrian and Susanto (2003); Kajikawa et al., 2009). AWM activity is often associated with the rainy season in most parts of IMC.
Cold air masses typically propagate eastward and southward over IMC waters, which are encircled by numerous relatively warm seas, from the center of high pressure on mainland Asia during the AWM. The propagation of this cold air mass is referred to as a cold surge (CS), and it is one of the synoptic-scale weather phenomena that significantly impacted the AWM (Chen et al., 2002). Along with the CS phenomenon, there are other meteorological phenomena called the southerly surge (SS) that are like CS and originate from the southern portion of the Indian Ocean, close to Australia. This air mass moved toward Java Island and East Nusa Tenggara from the Indian Ocean on Australia's west coast. Monsoon activity in the summer is influenced by a surge that originates from Australia's west coast. The weak east-west pressure gradient surrounding Australia's west coast is what is causing this surge, which is a geostrophic wind flow. At the height of the AUM, convective activity in the region is affected by the convergence of surges from Australia's west coast (Davidson et al., 1983). According to research (Fukutomi and Yasunari, 2005), there is a meridional wind wave from the extratropic to the tropics during the SS in eastern India. The southeast-south wind blows around the eastern Indian Ocean, south of the Bay of Bengal, and out of the subtropical Southern Hemisphere at the time of surge onset. This surge's flow meets the West Asian monsoon flow, which runs from the Philippines to the Arabian Sea. They employ the SS index, which is based on meridional wind parameters, to observe the spread of SS activity. Davidson et al. (1983), McBride (1987), and Suppiah and Wu (1998) have all documented the impact of Australian west coast surges on summertime monsoonal activity. They hypothesized that geostrophic winds resulting from an east-west pressure gradient off Australia's west coast were responsible for these surges. On the other hand, not much is known about the characteristics of the surges and how they affect the rainfall in IMC.
There is currently a severe lack of research on SS, particularly as it relates to Indonesia's rainfall. As for previous research that has been carried out, there are only a few local Indonesian studies. According to research Amelia (2010) did for her final assignment, one of the reasons there was less rainfall in several IMC areas in January was because of SS spreading toward the equator. Nonetheless, the study's findings do not provide a detailed explanation of how SS composites affect rainfall in the southern IMC's NDJFM rainy season. In his last work, Hermawanto (2011) also demonstrated that a period of monsoon lull during the AWM was caused by a strengthening of southerly winds from Australia's west coast. In his master's thesis, Taryono (2012) documented how the interplay of CS and SS significantly affects the patterns of precipitation in the IMC. The effect of SS on rainfall patterns in IMC, particularly in the southern part of IMC along Java Island to East Nusa Tenggara, is still unknown based on several earlier research findings that were previously discussed. It would also be interesting to investigate how it interacts with the poorly studied Madden-Julian Oscillation (MJO), which affects rainfall in the southern portion of the IMC. The MJO is the eastward movement of large-scale circulating cells oriented to the equatorial (zonal) plane in the troposphere. On the synoptic scale, the MJO is linked to increased low-level convergence and ascent, while upper troposphere winds diverge from the updraft. An increase in deep convection coincides with this circulation. The cycle is divided into eight phases, each of which corresponds to 1/8 of the full cycle. Individual MJO events can last between 30 and 60 days. Depending on the phase, the MJO brings organized convection and related circulation that favor a region for either dry or rainy conditions. According to earlier research (Muhammad et al, 2021; Ren and Ren, 2017; Seto et al., 2004; Wheeler et al., 2009; Zhou et al., 2012), the MJO can influence the frequency and intensity of global temperature and precipitation phenomena. Based on this, it is critical to understand how SS activity affects the pattern of rainfall, particularly the extreme rainfall that occurs using observational data in the southern portion of IMC (from Java Island to East Nusa Tenggara). There have not been any large-scale SS studies using observation data, so one advantage of research is the availability of observation data from 2140 weather observation stations. More comprehension of SS operations and their effects advances our understanding of rainfall patterns and the forecasting of extreme rainfall, particularly during the occurrence of this phenomenon.
2. Data and Method
2.1. Data Used in This Study
The meridional wind parameter data used to identify southerly surges comes from ERA5 reanalysis data, which is global atmospheric reanalysis data from the European Center for Medium-Range Weather Forecast (ECMWF). ERA5 is the fifth generation of atmospheric reanalysis of the global climate by ECMWF, and it covers the years 1950–1961 inclusive. ERA5 offers hourly estimates of 137 levels and 30x30 km of horizontal and vertical spatial resolution for a wide range of atmospheric, land, and oceanic climate variables that span the entire earth's surface up to a height of 80 km. The data covers the Earth on a 30 km grid and resolves the atmosphere using 137 levels from the surface up to a height of 80 km (Hersbach et al. 2020). ERA5 includes information about uncertainties for all variables at reduced spatial and temporal resolutions (https://www.ecmwf.int/en/forecasts/dataset/ecmwf-reanalysis-v5). We utilize several additional ERA5 parameters in addition to meridional wind data to measure integrated water vapor transport (IVT), including zonal wind, mean sea level pressure (MSLP), sea surface temperature (SST), and specific humidity. To analyze convective instability, several additional parameters are needed, including surface temperature, dew point temperature, convective inhibition (CINH), and convective available potential energy (CAPE).
As seen in Figure 1a, we use daily rainfall observation data from 2140 weather observation stations operated by the Meteorology, Climatology, and Geophysics Agency (BMKG) that are dispersed throughout Java Island to East Nusa Tenggara. Observational data was employed from January 2001 to March 2019 for the NDJFM. Averaging the rainfall values across all stations in each study area was done as part of the observational rainfall analysis. The study area is divided based on the number of provinces from Java to East Nusa Tenggara. The study area is divided into nine provinces: Banten, designated as region 1 (R1), Jakarta, designated as region 2 (R2), West Java, designated as region 3 (R3), Central Java, designated as region 4 (R4), Yogyakarta, designated as region 5 (R5), East Java, designated as region 6 (R6), Bali, designated as region 7 (R7), West Nusa Tenggara, designated as region 8 (R8), and East Nusa Tenggara, designated as region 9 (R9) (Figure 1b). Out of the total number of 2140 weather observation stations, there are 77 in R1, 27 in R2, 294 in R3, 535 in R4, and 70, 927, and 98 in R5, R6, and R7, respectively. There are 61 and 51 weather observation stations in R8 and R9, respectively.
Satellite data is utilized for diurnal analysis and rainfall analysis along the SS route, as the available observational data only includes daily data on land. The Global Satellite Mapping of Precipitation (GSMaP) gauge version 7, which has a spatial resolution of 0.1º x 0.1º, was used to calibrate the satellite data that the MVK clock meter acquired. GSMaP is a product of the Global Precipitation Measurement (GPM) mission, which provides global precipitation observations at three-hour intervals. Values are estimated using multi-band passive microwave and infrared radiometers from the GPM Core Observatory satellite and with the assistance of a constellation of other satellites. GSMaP data from the Japan Aerospace Exploration Agency (JAXA) has been validated and calibrated with both sharp and radar data in Japan with good validation results (Bui et al. 2019). https://sharaku.eorc.jaxa.jp/GSMaP is the URL to access GSMaP data.
We used the MJO index in conjunction with Outgoing Longwave Radiation (OLR) data to identify MJO events. OLR is long-wave radiation that enters space from the Earth and clouds. The OLR increases with temperature and is attenuated by clouds and other atmospheric gases, which have the potential to re-emit radiation into space based on their respective temperatures. A low anomaly value suggests a tall, cold cloud or cold surface when viewed in terms of OLR anomalies, whereas a high anomaly value indicates the opposite phenomenon (Liebmann and Smith 1996). OLR data, with its daily average temporal resolution and 2.5° x 2.5° spatial resolution, is the world's global data. The data can be accessed at https://psl.noaa.gov/data/gridded/data.olrcdr.interp.html and spans the years 1974 to the present. The MJO index information was sourced from https://www.cpc.ncep.noaa.gov/products/precip/CWlink/MJO/. Real-time multivariate MJO indexes 1 (RMM1) and 2 (RMM2) are used to define MJO events. Wheller and Hendon (2004) have shown that RMM1 and RMM2 together provide information on the state of the MJO throughout the tropics and are accurate year-round. These indices are then used to calculate the amplitude of the MJO events as follows; √ (RMM12+ RMM22). As per the findings of Hidayat and Kizu (2010), Matthews et al. (2013), and Peatman et al. (2014), an MJO is classified as strong or weak based on whether its amplitude is greater or less than 1. In addition, there are eight phases to the MJO event, and the location of the MJO convective center is indicated by each phase. The convective center of the MJO propagates eastward from west Africa (phase 1) to the east, passing over the Indian Ocean (phases 2 and 3), the Maritime Continent (phases 4 and 5), migrating to the western Pacific (phases 6 and 7), and decaying at phase 8. However, in this study, we divided the active MJO and inactive MJO by defining the active and inactive MJO based on Lim et al. (2017) and Xavier et al. (2014) with a slight modification in the active MJO definition by adding phase 5 during strong conditions. The active MJO is defined during phases 2, 3, 4, and 5 which have an amplitude value greater than or equal to 1, while inactive the MJO is all days with the MJO phases 2, 3, 4, and 5 with an amplitude value less than 1 added all the days when the MJO in phases 1 and 5–8.
2.2. Southerly Surge Identification
The identification of SS events in this study was predicated on earlier research by Fukutomi and Yasunari (2005), who computed the SS index from the meridional wind value, which at the time was greater than the average daily meridional wind variance value. This approach is used for SS events in western Australia or southern Indonesia since they are comparable and take place in the same area, the Southern Hemisphere. Meanwhile, the selection of SS occurrence areas in the western region of Australia (25–30°S and 105–110°E) was based on research conducted by Suppiah and Wu (1998) which stated that wind variations in this region have an important role in monsoon circulation. As indicated by the red dotted line in Figure 2a, this study indicates that the daily mean meridional wind variance value at 850 hPa for the western region of Australia (25–30°S and 105–110°E) from January 2001 to March 2019 is approximately 9.5 m/s. During NDJFM, from January 2001 to March 2019, there were 61 SS events with meridional wind values that were higher than the variance value. This SS event may be unusual; Fukutomi and Yasunari (2005) only discovered 62 SS events in the Eastern Indian Ocean over 23 years. Of these 61 SS events, 17 happened during the active MJO with an average meridional wind speed of 10.85 m/s, and 44 happened during the inactive MJO with an average meridional wind speed of 10.79 m/s (Figure 2b). According to Figure 2c, the highest number of SS events overall happened in December (15 events), followed by January (14 events) and November and February (12 events each). With 10 events, SS happened the least in March. Except for January, when it mostly happens during the active MJO, most SS happens when the MJO is dormant. Tropical cyclone events that occurred in northern and western Australia as well as the Indian Ocean along the SS event path have not been included in the filtered SS events examined in this research. Information regarding tropical cyclone events is obtained from this link: https://tropic.ssec.wisc.edu/storm_archive/aussie.html.
2.3. Extreme Rainfall, Integrated Water Vapor Transport, and Convective Instability
We investigate the different conditions of the SS phenomena under active and inactive MJO conditions and their contribution to precipitation along Java Island to East Nusa Tenggara. We compute the cumulative probability of daily precipitation events that surpass the 95th percentile of precipitation for all conditions during active and inactive MJO to investigate the changes in the probability of extreme precipitation or rainfall. We calculate the probability changes using a modified equation from Ren and Ren 2017 (equation 1).
where ΔP is the probability of changes in extreme events (hereinafter abbreviated as PCE) for each condition of MJO (active or inactive). Trismidianto et al., 2023 investigated how the Borneo Vortex, Cross-Equatorial Northerly Surge, and CS interact to influence extreme rainfall during Madden-Julian oscillation over the IMC using a similar formulation.
Moreover, analysis of moisture transport was applied by calculating the IVT using the following equation (equation 2). We analyzed the composite of IVT to identify the moisture condition in relation to precipitation during certain phenomena and their combinations.
Other important variables such as Lifting Condensation Level (LCL), Level of Free Convection (LFC), Level of Neutral Buoyancy (LNB), CAPE, and CINH were also derived. The LCL refers to the height at which an air parcel, when lifted adiabatically, becomes saturated. This concept carries importance across multiple domains, including the prediction of cloud cover, the integration of convection and precipitation into weather and climate models, and the comprehension of atmospheric dynamics on extraterrestrial celestial bodies (Romps, 2017).
The LCL formula proposed by Lawrence (2005) is:
where 𝓏 is the parcel’s height, T is its absolute temperature, K denotes units of kelvins, m denotes units of meters, and ranges from 0 to 1. The intention of Lawrence (2005) is for this expression to be applied to parcels with 0:5 1 and 273 < T < 303 K. The LFC is the level where the parcel is warmer than its environment and accelerates upward without additional mechanical lifting. The LNB or the Equilibrium Level (EL) is the level where the parcel’s temperature is colder than the environment.
The CAPE quantifies the energy accessible to elevate an air parcel to the neutral buoyancy level from a level characterized as the level of free convection (Moncrief and Miller 1976). This metric serves as an indicator of the atmosphere's stability or instability and aids in evaluating the potential for convection initiation. Positive values of CAPE (>0 J/kg) indicate an unstable atmosphere, suggesting an increased likelihood of hail and thunderstorm occurrences. CAPE is widely employed as one of the primary indicators for meteorological conditions conducive to energetic precipitation events, including lightning, wind shear, and hailstorms (Zawadzki et al. 1981; Singh et al. 2017). Moisture augmentation in convective regions, as demonstrated in Chou and Neelin's (2004), is responsible for sustaining positive CAPE values. Conversely, the Computed CINH measures the energy necessary to impede an air parcel's ascent from the surface to the level of free convection (DeAngelis et al. 2015). Eliminating and surpassing CINH becomes imperative for convective processes to utilize the available CAPE.
The CAPE is the energy available for the free convective process and is given by the following formula:
Where g is the acceleration due to gravity, B is the buoyancy force, θ is the virtual potential temperature of the air parcel (denotes that of the environment), and z is the altitude. S denotes Surface, LFC denotes the Level of Free Convection, and LNB denotes the Level of Non-Buoyancy (Air Weather Service, 1979).
In contrast, the CINH is the energy that must be overcome for the convection process to occur and is given by the following formula (Air Weather Service, 1979):
3. Result and Discussion
3.1. Climatology of SS and Large-Scale Atmospheric Condition
3.1.1. Climatology of the Rainfall and SS
The NDJFM seasonal average rainfall and 850 hPa wind speed in the study area, averaged from January 2001 to March 2019, are displayed in Figure 3a and 3d. Certain areas have greater rainfall than other areas, such as the Java Sea along the north coast of Java Island and the Indian Ocean along the west coast of Sumatra Island (Figure 3a). These results support previous research that found consistency and reliability in the observed patterns (Hidayat and Kizu 2010; Love et al. 2011; Xavier et al. 2020; Da Silva and Matthew 2021; and Trismidianto et al. 2023). According to Chang et al. (2005a, b) and Lim et al. (2017), MJO contributed to the high rainfall experienced on the north coast of Java and the west coast of Sumatra. This emphasizes how important large-scale atmospheric phenomena are to regional rainfall patterns. Higher rainfall also occurs on several islands of Java, apart from the ocean. This observation is further supported by the presence of strong low-level winds associated with the MJO, indicating the interdependence of atmospheric circulation and precipitation variability that produces precipitation in the AWM (Chang et al., 2005b). According to several studies (Chang et al. 2006; Hattori et al. 2011; Koseki et al. 2014; Trismidianto et al. 2023; and Satiadi et al. 2023), the high rainfall that Java Island often experiences is also correlated with the presence of CENS, CS, or both. Strong southeasterly low-level winds originate from the west coast of Australia and move towards the Indian Ocean (Figure 3d). According to Trismidianto et al. (2023), the existence of the MJO is related to low-level, strong winds observed from the Indian Ocean towards the islands of Sumatra and Java. Higher rainfall in southern Indonesia, especially Java Island, is the result of interactions between large-scale circulation and complex local terrain. This phenomenon, referred to as wind field interaction, emphasizes how important it is to take geographical features into account when analyzing rainfall patterns.
On the day of the SS event, the amount of rainfall and wind speed (850 hPa) are displayed in Figure 3b and 3e. On SS days, there is an increase in rainfall, particularly in the northern Java Island region, in the western Indian Ocean off the island of Sumatra, and in the southern Java region (Figure 3b). On land, there was also a lot of rain in a few locations throughout Java Island, up to R9. The pattern of high rainfall distribution on SS days is nearly identical to that of the NDJFM average rainfall; however, the high rainfall on SS days is more widely distributed. Strong low-level jets are seen moving from the identification areas SS (25–30°S and 105–110°E) toward the Indian Ocean west of Sumatra Island, then following Java Island to R9 (Figure 3e). The distribution of rainfall anomalies during the combined SS event days is the same as what is shown in Figure 3c. This demonstrates how SS modifies the intensity of rainfall, thereby influencing rainfall patterns in southern Indonesia. Rainfall intensity is increasing, as evidenced by positive rainfall anomalies on Java Island's north coast and in the Indian Ocean to the west and south of Sumatra Island. There has also been a notable increase in rainfall on land in several locations up to R9 along Java Island. On the other hand, there was also a decrease in rainfall in a few locations on the island of Java, R7, R8, and R9, which was indicated by negative rainfall anomalies (Figure 3c). The low-level wind anomaly distribution pattern and the low-level wind distribution pattern on the day of the combined SS event are identical, as shown in Figure 3f. This indicates that wind speed increases along the SS path due to the SS. Ascending to Java Island, Sumatra Island, and the western Indian Ocean, up to R9, indicates an increase in wind speed (Figure 3f). The wind deflection from Java to R9 is also visible if there is SS. The NDJFM wind average, on the other hand, only indicates southeast winds that are moving toward the Indian Ocean. Strengthened low-level wind surges cause changes in wind direction from the western coast of Australia parallel along Java Island to R9. Wind direction changes are caused by stronger low-level wind surges, which originate from Australia's western coast and run parallel to the island of Java until they reach R9. Fukutomi and Yasunari (2005) also discovered that cross-equatorial wind direction changes can result from amplified low-level wind surges, extending from subtropical regions to the east Indian Ocean to the southern Bay of Bengal. Davidson et al. (1983) assert that the surge from Australia's west coast influences the summertime monsoon activity. This was further supported by Suppiah and Wu (1998), who reported that although there seems to be a strong correlation between surge and monsoon activity before and during the start of the Australian monsoon, this relationship weakens as the rainy season approaches in the Australian region. However, this study also revealed that the AWM activity at NDJFM was impacted by the surge that originated from Australia's west coast. This finding aligns with the research findings of Taryono (2012), who revealed that SS can happen concurrently with CS activity or during the Asian monsoon in addition to the Australian monsoon.
Figure 4a and 4b show that the distribution pattern of daily average rainfall on NDJFM and SS event days is nearly identical based on observational data. But when SS happens, the distribution of low daily average rainfall increases (Figure 4b). R6 is the region with the lowest distribution of rainfall. Certain locations from Java Island to R9 experienced higher rainfall, with the highest intensity levels on both combined SS and NDJFM days being observed in R4 and R5 (Figure 4a). Rainfall intensity at R4, R5, and R7 was higher on the day of the SS event than it was during NDJFM. This demonstrates how the presence of SS causes rainfall to vary at different points in the R1–R9 area. Rainfall significantly increased in R4, R5, and R7 but significantly decreased at several locations in R6, as Figure 4c illustrates. This demonstrates that SS contributes to both an increase in rainfall and a decrease in rainfall intensity in the R1–R9 study area.
3.1.2. Large-Scale, MJO and Monsoon Conditions Associated with SS
Figure 5a and 5b illustrate the pattern of MSLP intrusion in the surface layer during NDJFM and the composite SS event, where MSLP intrusion is observed towards the Indian Ocean in the western part of Sumatra Island and along Java Island to East Nusa Tenggara. Low-level jets are made possible along the SS route as a result, as evidenced by the MSLP values decreasing in the direction of Java Island, R7, R8, and R9 (Figure 5c). These results are in line with earlier research (Davidson, 1984; McBride, 1987), which contends that a surge, or geostrophic wind flow, is brought on by a weak east-west pressure gradient near Australia's west coast. Figure 5a and Figure 5b further demonstrate that, although the distribution of high SST in the Indian Ocean is wider during NDJFM, the pattern of SST value distribution is essentially the same during composite SS events and NDJFM. High SST values were observed to be distributed from Java Island to R9 during the composite SS event. Because a warmer SST will increase the amount of water vapor available to support the formation of rain clouds, the surrounding area will experience more rainfall the higher or warmer the SST value (Woolnough et al., 2000). The wind movement that carries masses of water vapor towards Java Island and its surroundings is made possible by the very significant difference in SST anomalies in the SS route area between the northern part of Java Island and its surroundings. Figure 5d and Figure 5e depict similar OLR distribution patterns during NDJFM and composite SS events, respectively. However, OLR values during composite SS events are lower along Java Island than R9. This demonstrates that low-level jets from the SS as well as convective clouds connected to the MJO are growing (Figure 5d). Significantly more rain clouds are present along Java Island to R9, as indicated by the negative anomaly from the OLR (Figure 5f).
3.2. Rainfall Response to Southerly Surges
3.2.1. Rainfall Patterns during MJO Condition
In the NDJFM period, the average daily rainfall in the active and inactive MJO periods is displayed in Figure 6a and 6b. The pattern of rainfall distribution is nearly the same whether the MJO is active or not; that is, the amount of rainfall is more evenly distributed throughout the island of Java and is more intense in R4 and R5. On the other hand, the intensity of the rainfall is higher during an active MJO than during an inactive one. The MJO had an impact on rainfall in the IMC, including on the island of Java and its environs, as evidenced by the extensive distribution of high rainfall that previous researchers (Peatman et al. 2014; Vincent and Lane 2016) reported on the island of Java. In the meantime, even when there is no MJO, high rainfall frequently occurs on the island of Java and is linked to the occurrence of other phenomena like CENS, CS, or both (Chang et al. 2006; Hattori et al. 2011; Koseki et al. 2014; Trismidianto et al. 2023; and Satiadi et al. 2023). The rainfall intensity around West Java (R1 and R3) and Central Java (R4 and R5) is higher when SS occurs in an active MJO than when an active MJO occurs in NDJFM, as Figure 6c illustrates. An increase in rainfall intensity is evident in most of the distribution of high positive anomalies for rainfall in R1, R3, R4, and R5 (Figure 6e). On the other hand, the intensity of rainfall at R2, R6, and R7 was less than during the MJO's active period at NDJFM. Nearly all the regions have the same distribution of negative rainfall anomalies (Figure 6e). In an inactive MJO, the SS experiences less intense rainfall, but the pattern of distribution is nearly the same as in an active MJO (Figure 6d). Positive anomalies are smaller in areas R1, R3, R4, and R5 when the SS occurs in an inactive MJO than when an active MJO is present (Figure 6f). In contrast, areas R7, R8, and R9 saw a rise in rainfall during the MJO's inactive phase as opposed to a fall during its active phase. This indicates that when MJO occurs, SS affects the amount of rainfall that increases in the western part of the study area. On the other hand, when SS coincides with inactive MJO conditions, a greater increase in rainfall is observed in the eastern portion of the study area.
Out of the 17 SS that occurred during active MJO conditions, 6 SS events happened each in phases 3 and 5, and 5 events happened in phase 4. However, there is no SS in phase 2 of the active MJO. Rainfall anomalies during periods 3, 4, and 5 of the active MJO's SS are shown in Figure 7 based on observational data. This demonstrates how the influence of SS on rainfall varies depending on the active phases of the MJO. Figure 7a illustrates the larger positive rainfall anomalies in the western part of Java Island (R1 and R3) during SS and MJO phase 3 when the MJO convective center is in the Indian Ocean. Conversely, there are more negative rainfall anomalies in Java Island's central and eastern regions (R2, R4, R5, and R6), including Bali Island (R7). When the location of the MJO convective center is near the South China Sea, positive rainfall anomalies are generally greater in SS and MJO phase 4 (Figure 7b) as opposed to MJO phase 3, especially in the central (R4 and R5) and eastern (R6) regions of Java Island. Furthermore, positive rainfall anomalies further increase in SS and MJO phase 5 (Figure 7c), especially in R2, R4, and R5, including on the island of Bali (R7), except for the southern mountainous region of East Java (R6) when the MJO convective center is around Maluku. The findings indicate that the distribution of rainfall over Java Island is influenced differently by different MJO phases. This phenomenon may be related to the location of the MJO convective center and the associated wind dynamics between the monsoon, SS, MJO, and local circulation. Phases 2 and 3 of the MJO are over the Indian Ocean, while phases 4 and 5 are concentrated on the Maritime Continent, according to Hidayat and Kizu (2010). Hidayat and Kizu (2010) also noted that more rain fell over Sumatra Island and the Indian Ocean during phase 3 of the MJO. Most of Indonesia, including Java Island, experiences increased rainfall during Phase 4 of the MJO, whereas eastern Indonesia experiences increased rainfall during Phase 5 of the MJO. In contrast to the findings of this study, the SS that transpired during the MJO should have been more pronounced during Phase 4 of the MJO; however, Phase 5 significantly impacted rainfall along Java Island up to R9. This indicates that the pattern of MJO impacts on rainfall is altered when SS is present.
As shown in Figure 8, the SS period usually experiences higher rainfall with positive rainfall anomalies during active MJO periods, except for the regions in Jakarta (R2), East Java (R6), and Bali (R7). When the MJO is active, R5 experiences the largest increase in rainfall; this region may be where the SS and MJO's westerly winds converge. Furthermore, the western portion of the study area experiences a significantly greater increase in rainfall than the eastern portion does during an MJO. This is because the SS and westerly winds from the MJO interact strongly in the western portion of the study area. Rainfall in the R6 and R7 regions has decreased, and the interaction between the MJO and SS winds may have weakened. However, positive anomalies are detected in the R8 and R9 regions, which could be the result of SS interacting with regional elements and northerly winds, which typically happen in the NDJFM month. High rainfall in the eastern portion of the study area is also observed to be influenced by the presence of regional factors and winds from the north when the MJO is not active. Additionally, during the MJO's inactive periods, there is a slight increase in rainfall in the R1, R4, and R5 areas, but not as much as during its active periods. Whether the MJO is active or not, SS has a major effect on reducing rainfall in the R2 region. This is made possible and influenced by the geographic location of R2, which is behind the R3 region's orography, as shown in Figure 1b. When the MJO is active, SS has the effect of greatly increasing rainfall in the R3 region; conversely, when the MJO is inactive, rainfall decreases. There are also notable variations in the R7 region, where there is a decrease in rainfall during an active MJO but an increase in rainfall during an inactive MJO. Rainfall in the R6 region decreases when the MJO is active due to the SS impact and increases slightly when the MJO is not active. These results show that the impact of MJO on Java Island when SS is present is higher in the western region than the impact of SS alone, which is higher in the eastern region of the island.
The average daily rainfall anomalies based on observation data in each study area between two days prior to and three days following the SS event in MJO, active or not, are displayed in Figure 9. Consistent with Figure 8 results, SS in an active MJO is accompanied by a notable increase in rainfall in the R1, R3, R4, R5, and R8 regions starting one day prior to the SS event (Figure 9a). As shown in Figure 9a, rainfall in R5 during the active MJO is significantly higher than it was prior to the SS days. This shows that the SS and MJO interaction is very significant in the R5 region, which may be the location of the SS and MJO wind convergence. Additionally, the analysis in Figure 8 is strengthened by this statement. Rainfall in this area increased only during the SS, and it started to decrease one day after the SS. Rainfall in the R9 region is also increased by the combination of SS and MJO, as Figure 8 and Figure 9a demonstrate, although the increase is much less than in the other regions. In the R7 region, where the interaction of SS with the MJO reduces rainfall, the consistency of Figure 8 and Figure 9a is also demonstrated. In fact, the R7 region experienced a decrease in precipitation for a few days after the SS. However, the decrease in rainfall in the R6 region caused by the interaction of SS and MJO is not visible in Figure 9a, where rainfall appears to increase slightly from one day before the SS occurred. The R2 region, which should also experience a decrease in rainfall, is not visible in Figure 9a; however, this is possible because there was a significant increase in rainfall in the R2 region until one day after the SS occurred. The increase in rainfall that reached one day after the SS occurred was possible due to the interaction of the SS with local factors and orography, so that the formation of rain clouds was delayed and continuous after the SS event.
Increased rainfall is also observed in several study areas when SS occurs without MJO (Figure 9b), but the intensity of the increase is smaller than when there is MJO. Consistent with Figure 8, the R8 region experienced the largest increase in rainfall. Figure 9b also illustrates the increase in rainfall in R1, R4, R5, and R7. This adds credence to the analysis of Figure 8, which shows that SS influences the region's increased rainfall in the absence of the MJO. In contrast to the MJO, where rainfall significantly decreased following the SS, there was no significant drop in rainfall in the area one day after the SS without the MJO. In the R2 region, where rainfall decreases when SS occurs on its own without the presence of MJO, Figure 8 and Figure 9b also show consistency. The decrease in rainfall was even more drastic in the area one day after the SS, although it increased again after that. In the R9 region, it appears that there is no correlation between maximum rainfall anomalies and SS events without the presence of MJO when compared with Figure 8. However, overall, the analysis of Figure 9 strengthens the analysis of Figure 8.
Based on observational data, Figure 10a–e displays the distribution of rainfall anomalies on SS event days at NDJFM each month. In November (Figure 10a) and December (Figure 10b), SS increased the amount of rainfall across most of the study area, with Java Island particularly affected. The Central Java region saw the largest increase in rainfall, with 5 mm falling each day in R4 and R5. However, in January (Figure 10c), February (Figure 10d), and March (Figure 10e), SS reduced the amount of rainfall over most of the study area. This confirms the findings of earlier studies that claimed SS was responsible for Java Island's January rainfall decline (Amelia, 2010). On Java Island, however, this research indicates that February sees the most noticeable decrease in rainfall. In the R7 and R8 areas, there is significantly more rainfall from January to March than there is in November and December. R7 and R8 saw the biggest increase in rainfall in February. These findings indicate that in the western portion of the study area, particularly on Java Island in November and December, SS is more likely to be responsible for an increase in rainfall. But in January, February, and March, the amount of rainfall in the study's eastern region rose.
3.2.2. Extreme Rainfall Response
During an active MJO, high PCE intensities of up to 20% are more commonly seen along the southern portion of Java and Bali (Figure 11a), particularly in R4 and R5. Compared to periods without MJO, the northern coastal regions around Java Island and R7–R9 frequently exhibit high PCE intensity distributions, with values as high as 20% (Figure 11b). PCE values with a negative sign are predominant in the southern regions of Java and Bali. Several studies (Chang et al., 2006; Hattori et al., 2011; Koseki et al., 2014; Trismidianto et al., 2023; Satiadi et al., 2023) have found that when the MJO is not active, the presence of CENS, CS, or both is linked to high PCE in the northern part of Java Island. Based on the explanation above, it can be inferred that MJO influences the likelihood of extremely high rainfall in the southern part of Java Island up to R9. The R4 and R5 areas are more likely to experience intense rainfall. Other than that, it does not seem like MJO has much of an effect on the intense rainfall in the northern coastal regions of Java Island and R7.
Figure 11c and 11d illustrate how the SS and MJO interact to influence extreme rainfall. In Figure 11c and 11d, the PCE distribution pattern is nearly the same whether SS occurs with the MJO active or not. The interaction between SS and MJO is more frequently seen in providing the impact of extreme rainfall in the high PCE intensity R4, R5, and R7 regions. In contrast, the distribution of minus PCE is larger than that of positive PCE. Meanwhile, low PCE is predominant in the Java and R7 regions when the SS occurs on its own without the MJO present; high PCE intensity is still observed in several R4, R5, and R8 regions. This demonstrates that, even in the absence of MJO, SS has no discernible effect on excessive rainfall. The predominance of low PCE values on the Java and Bali islands, both for active and inactive MJO, suggests that SS has little effect on the islands' increased extreme rainfall. Extreme rainfall is only affected by SS in a small number of areas and may only happen in a small number of SS events.
Figure 12 displays the average rainfall for each weather observation station in the nine study areas during the active and inactive MJO periods. The interaction of SS and MJO is found to have a greater average impact on extreme rainfall in region R5 for each location in each study area (Figure 12a). Compared to other areas, R5 experienced more extreme rainfall with six SS events, followed by the R4 region, which experienced four extreme events. Nevertheless, on the 16th and 17th SS events, R7 and R8 had extremely high average rainfall exceeding 50 mm/day. This is consistent with the analysis described in Figure 11c. It is also noted that, with small average rainfall values, the influence of SS and MJO on extreme rainfall in R2 is not very significant. Figure 11c also shows that the interaction of the SS with the MJO allows extreme rainfall to occur in the R4, R5, and R7 regions due to the large number of high PCE intensities found in these regions; this is also confirmed by Figure 12a. In the case of SS without MJO, regions R4 and R5 also predominate in terms of extreme rainfall (Figure 12b), although there are also periods of extreme rainfall with few SS events in several other areas. This validates the analysis of Figure 11d, which indicates that there is minimal likelihood of extreme rainfall due to SS during the MJO's inactivity, except for the R4 and R5 regions.
3.2.3. Cross-Section Analysis for Rainfall Diurnal Variations
Utilizing cross-section analysis, Figure 13a–f illustrates the diurnal analysis of the effects of SS and MJO on rainfall. Only Java Island, the largest island in the study area, was subjected to cross-section analysis. This is because the R7–R9 region can be represented by the SS and MJO interaction schemes on rainfall on Java Island. Two cross-section analyses were performed: the time-longitude cross-section and the latitude-time cross-section. The latitude-time cross-section was carried out by averaging the longitude region around 106–115°E, which represents the entire Java Island. Concurrently, the time-longitude cross-section is computed by averaging the latitude region between 6 – 9°S, which corresponds to Java Island's northern and southern borders. Figure 13a-c illustrates that rainfall predominantly occurs over land in the afternoon until midnight. However, an additional enhancement over the ocean in the morning reflects a diurnal rainfall pattern influenced by the contrast between land and sea. This shows that the influence of SS on rainfall on land occurs in the afternoon until midnight and in the sea in the morning. In addition, it is worth noting that during the day, SS tends to increase rainfall along the north coast of Java. Meanwhile, at night and early in the morning, SS tends to increase rainfall along the south coast. These findings could be elucidated by examining the interplay between local land-sea breeze circulation and broader-scale SS circulation. In daylight hours, the sea breeze along the northern coast opposes the SS, leading to increased convergence and rainfall. Conversely, the sea breeze along the southern coast aligns with the SS, resulting in minimal convergence effects. Furthermore, during nighttime, the land breeze along Java's southern coast opposes the SS, fostering convergence and rainfall, while along the northern coast, the land breeze aligns with the SS, reducing convergence. Moreover, rainfall along the northern coast also increased in the early morning, likely due to the heightened convergence between the monsoon and land breezes, which peak during this time. When the SS coincides with an active MJO, as shown in Figure 13b, a similar rainfall pattern emerges but with intensified precipitation both over land and sea. This amplification could be attributed to the alignment of the SS circulation with the MJO's low-level convergence circulation, thereby reinforcing each other. Conversely, during SS occurrences with an inactive MJO, a comparable rainfall pattern emerges but with diminished intensity, as depicted in Figure 13c.
Using a time-longitude cross-section, the diurnal analysis of SS's effect on rainfall is displayed in Figure 13d–f. The eastern region of Java, which is dominated by R4 and R5 in the morning, afternoon, and evening, generally experiences the highest average rainfall for all SS days (Figure 13d). The eastern R8 and R9 regions also experienced heavy morning and afternoon rainfall. During active SS events in the MJO, high rainfall intensity was observed throughout the day from Java to East Nusa Tenggara (Figure 13e). Conversely, when the MJO is not active during SS, rainfall intensity is low, except for R8 (Figure 13f).
Figure 14 illustrates potential interactions between large-scale synoptic circulations, such as SS, MJO, and the monsoon, with local land-sea breeze circulations, resulting in the observed spatio-temporal variability of rainfall over Java Island. Increased convergence over land during the day and over the sea at night may explain the typical diurnal rainfall pattern due to land-sea contrast. Additionally, the increased convergence between the monsoon and the land breeze may account for the increased rainfall along the northern coast in the early morning. Enhanced convergence over the northern coast during the day and the southern coast at night may explain increased coastal rainfall due to the SS. Finally, the MJO tends to amplify the effects of the SS even further. This makes it possible to connect SS to diurnal rainfall activity and validates earlier findings that one of the main phenomena in tropical areas is the diurnal cycle of rainfall and convective activity (Hendon and Woodberry 1993). Most studies have indicated that diurnal rainfall variations in the Tropics have their peaks in the late evening over land regions and in the early morning over adjacent sea regions (e.g., Gray and Jacobson 1977; Murakami 1983; Houze et al. 1981). Over the ocean, the diurnal cycle of precipitation is generally weak and peaks in the early morning (Nesbitt and Zipser, 2003).
3.2.4. Time Series Analysis for Rainfall Diurnal Variations
Due to the lack of hourly observation rainfall data, Figure 15 displays the average rainfall for each location R1–R9 based on GSMaP data. These numbers suggest that variations in the influence of SS on precipitation, during both active and inactive phases of the MJO, exhibit patterns that align with Java Island's diurnal rainfall patterns. In the morning, there is less rain, and in the afternoon or evening, there is more. The afternoon increase in rainfall during the active MJO period is significantly stronger than it is during the inactive phase. However, the degree to which rainfall decreases in the morning when the MJO is active (Figure 15a) varies depending on the region. On the other hand, the morning rainfall decrease in each region is nearly equal to when the MJO is dormant (Figure 15b). In the R2 and R6 areas, the amount of rainfall has decreased more than it has increased. For this reason, as Figure 8 illustrates, SS results in less rainfall in the R2 and R6 areas. In addition, there was a significant drop in rainfall in the R7 area and a postponed increase in precipitation until the next day. This corroborates Figure 8, which indicates that during an active MJO, SS reduces rainfall in the R7 region. As shown by Figure 15a, the R3 and R5 regions experience a significant increase in high rainfall and a decrease in low rainfall during MJO activity, indicating a significant SS impact in these regions (see Figure 8). In addition, peak rainfall in many areas tends to shift towards midnight during the inactive MJO period (Figure 15b). While the morning's precipitation decrease is nearly constant, the afternoon's precipitation increase varies significantly. Even the R2 region experienced a significant decrease in rainfall twice, in the morning and evening. This corroborates Figure 8 and demonstrates how SS affects the R2 area's rainfall. However, the impact of SS, which reduces rainfall in R3 when the MJO is inactive, is not very significant in Figure 14b. The impact of SS on increasing rainfall in the eastern regions of Indonesia (R7, R8, and R9) can be seen quite clearly, with a significant increase in rainfall in the afternoon in these areas (Figure 15b). In general, it can be concluded that increased rainfall occurs in the afternoon and decreases in the morning when SS occurs whether in the presence or absence of MJO. This shows that SS is closely related to the diurnal rainfall variation system in the tropics. In Rainfall diurnal variation is characterized by evening (morning) rain over land (sea) due to the different heat capacities of the two surfaces and related local land-sea circulations (Tao et al. 1996; Sui et al. 1998; Zhou and Wang 2006).
3.3. Atmospheric Processes of SSs Governing Rainfall Systems
3.3.1. Integrated Water Vapor Transport (IVT)
Figure 16 depicts the moisture transport during NDJFM for the mean conditions of active MJO, inactive MJO, SS, and a combination of active/inactive MJO and SS. Contour represents the magnitude, and streamline represents the direction of moisture transport. Streamlines indicate that SS strengthens the southerly wind and moisture transport over the Indian Ocean toward the Maritime Continent, thus resulting in a high moisture concentration over Java and its surrounding area, reaching more than 300 kg/m/s (Figure 16b). The high sea surface temperature over the Indian Ocean (Figure 5b) supports the evaporation process in this area, thus resulting in the high moisture content in this area. The high amount of moisture over the Indian Ocean is transported toward Java and its surroundings and deflected eastward around 10°S (see streamlines in Figure 16b), resulting in decreasing and increasing rainfall in several areas around Java (Figure 4c).
Moreover, the active MJO amplified the moisture transport over the Maritime Continent, as shown by the greater transport of moisture from the Indian Ocean toward Sumatera Island. The eastward propagation of MJO significantly added moisture to the Maritime Continent during the SS event, with eastward moisture transport reaching more than 400 kg/m/s from the Indian Ocean (Figure 16d). The high moisture over the Maritime Continents supports the development of convective clouds, thus resulting in positive rainfall anomalies over this area during SS occurrence with the active MJO (Figure 8). However, a single MJO phenomenon (without SS) increases the eastward moisture transport but is not as significant as if it were coupled with SS (Figure 16c). Furthermore, the inactive MJO is likely not significant in reducing moisture transport over the domain studied during SS, as shown in Figure 16f, which has quite similar moisture transport distribution to SS alone (Figure 16b).
Previous studies show a consistent result on the moistening over the Maritime Continent due to the SS and MJO separately. However, a study combining these two phenomena needs more exploration. A previous study indicates the Tropical Eastern Indian Ocean experienced moistening indicated by high OLR during two to four days before SS phenomena (Fukutomi and Yasunari, 2005). This moistening is enhanced by evaporation over the sea surface area, which is associated with the surge (Fukutomi and Yasunari, 2005). The surge can be identified by the streamline over the midlatitude of the Indian Ocean (around 25°–30° S), which supports the high moisture (200–300 kg/m/s) over this area to be transported toward the Maritime Continent (Figure 16b, d, f). The development of baroclinic synoptic disturbances in this midlatitude area induced the development of the surge (Fukutomi, 2019). Furthermore, the moistening over the Maritime Continent due to MJO is explained by a previous study (Hu H. et al., 2023). This study emphasized that moistening is a consequence of the eastward propagation of MJO. The outward turbulent heat flux, due to advective heat transport in the upper ocean dominating the sea surface warming under the MJO atmospheric convection center (around the Timor Sea), triggers the moistening and instability in the lower atmosphere (Hu H. et al., 2023). Therefore, by considering the impact of each phenomenon on the moistening process, we can generally conclude that higher moisture can be detected when SS and MJO are in occurrence, as in the results presented in this paper (Figure 16d). However, the underlying mechanism behind this moistening remains unclear. Therefore, the atmospheric conditions during these phenomena are examined in the next section.
3.3.2. Convective Instability
During the SS period, surface temperatures generally decreased across all regions, as depicted in Figure 17a, likely due to the inflow of cold air masses from the south. Notably, in the western regions (R1 to R3), surface temperatures experience a more pronounced decline during active MJO phases compared to inactive ones, possibly attributable to heightened convective activity and cloud development. Conversely, the eastern region (R4 to R9) exhibits the opposite trend, suggesting a stronger MJO influence in the western areas. Moreover, Figure 17b indicates a reduction in dew point temperatures across all regions during the SS, concurrent with the decline in surface temperatures. However, during active MJO phases, the decrease in dew point temperature is less pronounced than during inactive phases, likely due to increased moisture content.
The meridional wind anomaly generally decreases during the SS, except for the Jakarta area (R2), as shown in Figure 17c. During active MJO phases, the reduction in meridional wind is more pronounced than during inactive phases, potentially indicating an increase in convergence. Figure 17d illustrates that the SS typically enhances convective available potential energy (CAPE), except in central regions. Additionally, Figure 17e indicates a reduction in convective inhibition (CIN) across all regions during the SS, with a greater decrease observed in western regions (R1 to R3) during active MJO phases compared to their eastern counterparts (R4 to R9). The anomaly in Vertical Integrated Moisture Flux Convergence (VIMFC) depicted in Figure 17f shows an increase across all regions during the SS, except over Jakarta (R2) during inactive MJO phases. During active MJO phases, the increase in VIMFC is more pronounced in western regions (R1 to R3) than in eastern regions (R4 to R9).
Consequently, the SS tends to reduce surface and dew point temperatures as well as meridional wind speeds across all regions. It also tends to decrease CIN and increase VIMFC, though the effect on CAPE shows regional variability. Overall, the SS enhances rainfall, likely through increased VIMFC and reduced CIN. Furthermore, the MJO generally amplifies the SS's impact on rainfall, with active MJO exerting a more significant effect than inactive MJO, particularly in the western regions. However, it's important to note that the analysis above utilizes regional averages of all variables, and actual variable values may exhibit substantial spatial variations, such as between coastal and mountainous regions.
4. Conclusion
The effects of the SS and its interaction with the MJO on rainfall patterns in Java, Bali, West Nusa Tenggara, and East Nusa Tenggara have been studied during the NDJFM months of January 2001 to March 2019. We used rainfall data from 2140 weather station observations in Indonesia that were combined with GsMAP data for this study. The ERA5 data set is used for a more thorough analysis. It contains several parameters for convective instability analysis, such as zonal wind, MSLP, SST, and specific humidity, which are used to measure IVT. By using the average daily meridional wind over the western region of Australia (15°E–30°S, 105°E–115°E) that exceeds the variance value of 9.5 m/s, active SS events were identified, following the methodology of Fukutomi and Yasunari (2005) and Suppiah and Wu (1998). To distinguish between active and inactive MJO conditions, utilize the MJO index provided by CPC. This investigation began by identifying SS and MJO active events. Next, a plot of the combined distribution of rainfall in the studied region is created, considering anomalies related to normal conditions as well as SS days, active MJO, and SS + active MJO. In the same conditions, a similar plot is made for the 95-percentile extreme precipitation, including its PCE. Next, an analysis is conducted to determine how SS, MJO, and their combined influence affect the distribution of rainfall in different study areas. Additionally examined is the impact of SS and MJO on variations in daily and monthly rainfall. In addition, further analyses using IVT, and other selected variables were carried out to study possible explanations behind the observed changes in rainfall distribution.
Throughout the study, 61 SS events were found, with 17 of those taking place during the active MJO and 44 during the inactive MJO. Six SS events each in phases 3 and 5, and five events in phase 4, comprised the total of the 17 SS that transpired during active MJO conditions. But in phase 2 of the active MJO, there were no SS events. The impact of SS and MJO interactions on rainfall in the study area varies depending on the active MJO phase, according to observational data. The MJO convective center's location and the wind dynamics that are connected to the monsoon, SS, MJO, and local circulation may be the cause of this. Rainfall increased significantly in several areas along R1 to R9 during the SS that occurred during active MJO phase 5, as compared to phases 3 and 4. Whether or not MJO is present, all SS events have a greater impact on rainfall on Java Island in November and December than in other months. The Central Java region, particularly in R4 and R5, saw the largest increase in rainfall during these two months. On the other hand, the R7 and R8 regions experience significantly more rainfall from January to March due to SS. February saw the biggest increase in rainfall in R7 and R8. These findings indicate a shift in the distribution of rainfall in the area studied, along with the arrival of SS and AWM.
A decrease in SST anomalies, a strengthening and modification of wind patterns, and an overall increase in rainfall in the southern part of the IMC as the SS moves northward are all signs of the impact of the SS event. Notable features include the strengthening of the low-level jet stream over the southern Indian Ocean to the west of Australia and the wind field's eastward deflection as it gets closer to Java Island. This demonstrates how the SS's presence causes the wind speed to increase along its path. Wind speed increases as one rises toward Java Island, Sumatra Island, and the western Indian Ocean up to R9. During NDJFM, the wind only blows toward the Indian Ocean; when there is SS, it deflects from Java to R9 and is observable. In comparison with the average daily rainfall of NDJFM, the presence of SS causes variations in the rainfall response in the study area with changes in rainfall patterns. Overall, SS affects increasing rainfall in several areas on the island of Java, with the highest intensity levels in areas R4, R5, and R7, whether or not there is MJO. R6 has the lowest rainfall distribution among the study areas, but SS also affects decreasing rainfall in several other study areas. This demonstrates how variations in rainfall and altered rainfall patterns occur at different locations throughout the R1–R9 region when SS is present. In research areas R1–R9, SS was responsible for both an increase in rainfall and a decrease in rainfall intensity.
The results of this study showed that whether an SS event occurs during an active MJO or not, there is a different response to rainfall in the study area through spatial analysis of observational data. Rainfall has decreased throughout Java Island's mountains, particularly in the northern portion of East Java, and increased in some areas of the island, particularly Central Java. The intricate interplay between the topography of the Java Islands and the SS wind field may be the source of rainfall variability. Furthermore, this research result observes that when the SS coincides with an active MJO, precipitation either increases or decreases even more over the islands, suggesting that the MJO tends to amplify the effects of the SS. The results suggest possible supporting dynamics that may intensify rainfall differences between low-level SS and southern MJO convergence flows across the topography of Java Island. Another sign of the influence of the monsoon circulation is the eastward-moving rainfall anomalies on the island of Java. When SS coincides with an active MJO, there is a predominant increase in rainfall in the areas surrounding western Java (R1 and R3) and central Java (R4 and R5), according to the average observed rainfall for each station in each study area. The increase in rainfall is predominantly in the R3, R4, and R5 regions compared to other regions. Here in these three regions, there might be a convergence of westerly winds from the SS and MJO. However, when SS coincides with MJO, there is also a noticeable increase in rainfall in the R8 and R9 regions. This is likely because SS interacts with local factors and northern winds, which typically happen in the month of NDJFM. However, the R2, R6, and R7 regions see a decrease in rainfall on the day of the SS but an increase in rainfall the day after the SS due to the interaction of the SS and the MJO. The effects of these three regions' topography may be the reason for the delay in rising rainfall in these areas. While rainfall is primarily increased in Regions R1, R3, R4, and R5 when SS happens on its own without MJO, the increase in intensity is less than when SS occurs concurrently with MJO. In contrast, when SS occurs alone as opposed to when MJO is active, the eastern portion of the study area, specifically R7, R8, and R9, primarily experiences a higher increase in rainfall. This indicates that the western research area's increasing rainfall is primarily caused by the interaction between SS and MJO. However, the eastern portion of the study area experiences a higher increase in rainfall due to SS, which happens when MJO is absent. Apart from that, SS has a significant impact on lowering rainfall in the R2 region, regardless of whether MJO is active. The geographic position of R2, which is behind the orography of the R3 region, makes this both feasible and influential. In addition, the study's findings indicate that in the R4, R5, and R7 regions with high PCE intensity, there is a tendency for the interaction between SS and MJO to affect the likelihood of extreme rainfall. While extreme rainfall is still more common in some areas of the region, SS that happens on its own without MJO tends to drastically lower the likelihood of it occurring in Java and R7. Interestingly, when combined with MJO, the likelihood of extreme rainfall is marginally higher than when combined with SS alone. The results show that MJO and SS have opposite effects on extreme precipitation. MJO tends to increase the probability of extreme rainfall, while SS reduces it significantly.
The results of this research also show that there is a potential interaction between large-scale synoptic circulations, such as SS, MJO, and monsoons, and local land-sea wind circulation, resulting in spatio-temporal variability in rainfall on the island of Java. The increased convergence of land during the day and the ocean at night may account for the typical diurnal rainfall pattern caused by the land-sea contrast. Furthermore, there is a chance that the monsoon and onshore winds will converge more, which could result in more rain falling along the northern coast early in the morning. A possible explanation for the increase in coastal rainfall caused by SS is increased convergence over the north coast during the day and the south coast at night. Finally, the MJO tends to amplify the SS effect even further. According to the integrated water vapor transport analysis, SS considerably raised the water vapor content in the IMC's southern region and marginally shifted it north of Java Island. This increase is more pronounced when SS and MJO happen at the same time. However, the region's water vapor content was only marginally elevated by the MJO specifically. The study's findings indicate that, while SS plays a more prominent role, both MJO and SS have an impact that encourages increased water vapor transport in the southern IMC region. The southern IMC may see an increase in water content because of the SS actively pushing water vapor from the Indian Ocean toward the area. Convective instability analysis indicates that, overall, SS increases rainfall, most likely by lowering CIN and raising VIMFC. Furthermore, the influence of SS on rainfall is generally amplified by MJO, with active MJO having a greater effect than inactive MJO, particularly in the western region. It is crucial to remember that the analysis makes use of regional averages for every variable and that actual variable values may exhibit significant regional differences, such as those between coastal and mountainous regions. In conclusion, this study has brought attention to the previously unnoticed impact of SS on patterns of rainfall in the southern IMC region, specifically on the islands of Java, Bali, and East Nusa Tenggara. Furthermore, the intricate relationships between the SS, the well-researched MJO, and the distinct topography of the islands are revealed by this study, offering important new information about how these factors together affect rainfall variability and extreme events. As a result, this study significantly advances our knowledge of the dynamics of the regional climate and emphasizes the significance of considering the complex interactions that shape weather patterns between atmospheric phenomena and geographic features.
Author Contributions
All the authors are the main contributors. Conceptualization, T., D.S., D.E.N., F.N., D.F.A., A.P., A.W., I.J., and W.H.; methodology, T., T.H., I.F., A.S.P., D.S., R., R.M., and D.E.N.; validation, R., E.S., R.M., F.N., W.H., I.F., B.S., and D.F.A.; formal analysis, T., A.P., T.H., I.F., E.S., D.F.A., B.S., and A.S.P.; writing—original draft preparation, T., D.S., A.S.P., A.W., I.J., E.S., D.E.N., and B.S.; writing—review and editing, T., R., R.M., I.F., I.J., D.S., A.W., W.H., F.N., T.H., A.S.P., B.S., and A.P; visualization, E.S., F.N., R., A.P., I.J., B.S., R.M., D.E.N., D.F.A., A.P., T.H., A.W., and I.F.; data curation, E.S., D.E.N., A.P., R., W.H., F.N., D.F.A., D.S., T.H., I.J., A.S.P., A.W., and R.M.; funding acquisition. All authors have read and agreed to the published version of the manuscript.
Funding
This project is part of the Program House's research at the Research Organization of Aeronautics and Space in BRIN, which is funded by the BRIN DIPA in the 2022 financial year [NOMOR 39/III.1/HK/2022].
Institutional Review Board Statement
Not applicable.
Informed Consent Statement
Not applicable.
Data Availability Statement
http://www.bom.gov.au/climate/mjo/ for MJO index data, and ftp://ftp.ifremer.fr/ifremer/cersat/products/gridded/ for ECMWF Era5 data. GSMaP data is available at http://sharaku.eorc.jaxa.jp/GSMaP/, while OLR data is obtained from NOAA/NESDIS.
Acknowledgments
We are grateful that the Meteorology, Climatology, and Geophysics Agency (BMKG) maintains 2140 weather observation stations that provide daily rainfall observation data.
Declaration of Competing Interest: The authors declare no conflict of interest.
References
- Air Weather Service: The Use of Skew-T Log-P Diagram in Analysis and Forecasting, Technical Report No. AWS/TR-79/006 Rev., 1979.
- Aldrian, E., and Susanto, R. D.: Identification of three dominant rainfall regions within Indonesia and their relationship to sea surface temperature, Int. J. Climatol., 23, 1435–1452, 2003. [CrossRef]
- Amelia, Y.: Study of Variations in January Rainfall Patterns in the Asian Monsoon Region of Australia and Their Relation to the Southerly Surge Phenomenon, Final Assignment of the Meteorology Study Program in Bandung Institute of Technology, 2010.
- Bui, H. T., Ishidara, H., and Shaowei, N.: Evaluation of the use of global satellite–gauge and satellite-only precipitation products in stream flow simulations, Appl. Water Sci., 9, 52, 2019. [CrossRef]
- Chang, C. P., Harr, P. A., McBride, J., and Hsu, H. H.: Maritime Continent monsoon: Annual cycle and boreal winter variability, East Asian Monsoon, World Scientific, 107–150, 2004. [CrossRef]
- Chang, C. P., Harr, P. A., and Chen, H. J.: Synoptic disturbances over the equatorial South China Sea and western Maritime Continent during boreal winter, Mon. Wea. Rev., 2005a. [CrossRef]
- Chang, C. P., McBride, J., and Liu, C. H.: Annual cycle of Southeast Asia—Maritime Continent rainfall and the asymmetric monsoon transition, J. Climate, 18, 287-301, 2005b.
- Chang, C. P., Wang, Z., and Hendon, H.: The Asian winter monsoon, in: The Asian Monsoon, Springer, Berlin, 89-127, 2006.
- Chen, T. C., Yen, M. C., Huang, W. R., and Gallus Jr, W. A.: An East Asian cold surge: case study, Mon. Wea. Rev., 130, 2271-2290, 2002. [CrossRef]
- Chou, C., and Neelin, J. D.: Mechanisms of global warming impacts on regional tropical precipitation, J. Clim., 17, 2688–2701, 2004. [CrossRef]
- Da Silva, N. A., and Matthews, A. J.: Impact of the Madden–Julian Oscillation on extreme precipitation over the western Maritime Continent and Southeast Asia, Quart. J. R. Meteorol. Soc., 147, 3434–3453, 2021. [CrossRef]
- Davidson, NE.: Short-term fluctuations in the Australian monsoon during winter Monex. Mon. Weath. Ret, 112, 1697–708, 1984.
- Davidson, N. E., McBride, J. L., and McAvaney, B. J.: The onset of the Australian monsoon during winter MONEX: Synoptic aspects, Mon. Wea. Rev., 111, 496–516, 1983. [CrossRef]
- DeAngelis, A. M., Qu, X., Zelinka, M. D., and Hall, A.: An observational radiative constraint on hydrologic cycle intensification, Nature, 528, 249–253, 2015. [CrossRef]
- Fukutomi, Y., and Yasunari, T.: Southerly Surges on Submonthly Time Scales over the Eastern Indian Ocean during the Southern Hemisphere Winter, Mon. Wea. Rev., 133, 1637-1629, 2005.
- Fukutomi, Y.: Tropical synoptic-scale waves propagating across the Maritime Continent and northern Australia, J. Geophys. Res.: Atmos., 124, 7665–7682, 2019. [CrossRef]
- Gray, W.M. dan Jacobson, R. W.: Diurnal Variation of Deep Convective System in The Tropics. Mon, Weather Rev., 105, 1171 – 1188, 1977.
- Hattori, M., Mori, S., and Matsumoto, J.: The cross-equatorial northerly surge over the maritime continent and its relationship to precipitation patterns, J. Meteorol. Soc. Japan Ser. II, 89, 27-47, 2011. [CrossRef]
- Hermawanto, A.: Study of the Break Period During the Winter Asian Monsoon in Indonesia, Thesis, Bandung Institute of Technology, 2011.
- Hersbach, H., Bell, B., Berrisford, P., et al.: The ERA5 global reanalysis, Q. J. R. Meteorol. Soc., 146, 1999–2049, 2020. [CrossRef]
- Hidayat, R., and Kizu, S.: Influence of the Madden–Julian Oscillation on Indonesian rainfall variability in austral summer, Int. J. Climatol., 30, 1816-1825, 2010. [CrossRef]
- Houze, R. A., Jr., S. G. Geotis, F. D. Marks, Jr., and A. K. West.: Winter monsoon convection in the vicinity of north Borneo. Part I: Structure and time variation of the clouds and precipitation. Mon. Wea. Rev., 109, 1595-1614, 1981.
- Hu, H., Li, Y., Yang, X.-Q., Wang, R., Mao, K., and Yu, P.: Influences of oceanic processes between the Indian and Pacific basins on the eastward propagation of MJO events crossing the Maritime Continent, J. Geophys. Res.: Atmospheres, 128, e2022JD038239, 2023. [CrossRef]
- Kajikawa, Y., Wang, B., and Yang, J.: A Multi time Scale Australian Monsoon Index, Int. J. Climatol., 30, 1114-1120, 2009. [CrossRef]
- Koseki, S., Koh, T. Y., and Teo, C. K.: Borneo vortex and mesoscale convective rainfall, Atmos. Chem. Phys., 14, 4539-4562, 2014. [CrossRef]
- Lawrence, M. G.: The Relationship between Relative Humidity and the Dewpoint Temperature in Moist Air: A Simple Conversion and Applications, Bull. Am. Meteorol. Soc., 86, 225–234, 2005.
- Lim, S. Y., Marzin, C., Xavier, P., Chang, C.-P., and Timbal, B.: Impacts of boreal winter monsoon cold surges and the interaction with MJO on Southeast Asia rainfall, J. Climate, 30, 4267–4281, https://doi.org/10.1175/JCLI-D-16-0546.1, 2017. [CrossRef]
- Liebmann, B., and Smith, C. A.: Description of a complete (interpolated) outgoing longwave radiation dataset, Bull. Am. Meteorol. Soc., 77, 1275-1277, 1996.
- Love, B. S., Matthews, A. J., and Lister, G. M. S.: The diurnal cycle of precipitation over the maritime continent in a high-resolution atmospheric model, Q. J. R. Meteorol. Soc., 137, 934–947, 2011. [CrossRef]
- Matthews, A. J., Pickup, G., Peatman, S. C., Clews, P., and Martin, J.: The effect of the Madden-Julian Oscillation on station rainfall and river level in the Fly River system, Papua New Guinea, J. Geophys. Res.: Atmospheres, 118, 10–926, 2013. [CrossRef]
- McBride, J. L.: The Australian summer monsoon, in: Monsoon Meteorology, edited by: Chang, C.-P. and Krishnamurti, T. N., Oxford University Press, 203–231, 1987.
- Moncrieff, M. W., and Miller, M. J.: The dynamics and simulation of tropical cumulonimbus and squall lines, Q. J. R. Meteorol. Soc., 102, 373–394, 1976.
- Muhammad, F. R., Lubis, S. W., and Setiawan, S.: Impacts of the Madden–Julian oscillation on precipitation extremes in Indonesia, Int. J. Climatol., 41, 1970-1984, 2021. [CrossRef]
- Murakami, M.: Analysis of the deep convective activity over the western Pacific and Southeast Asia. Part I: Diurnal variation. J. Meteor. Soc. Japan, 61, 60–75, 1983.
- Nesbitt SW, Zipser EJ.: The diurnal cycle of rainfall and convective intensity according to three years of TRMM measurements. Journal of Climate 16: 1456–1475. 2003.
- Peatman, S. C., Matthews, A. J., and Stevens, D. P.: Propagation of the Madden–Julian oscillation through the Maritime Continent and scale interaction with the diurnal cycle of precipitation, Quart. J. Roy. Meteorol. Soc., 140, 814–825, 2014. [CrossRef]
- Ren, H.-L., and Ren, P.: Impact of Madden-Julian Oscillation upon winter extreme rainfall in Southern China: Observations and predictability in CFSv2, Atmosphere, 8, 192, 2017. [CrossRef]
- Romps, D. M.: Exact Expression for the Lifting Condensation Level, J. Atmos. Sci., 74, 3891–3900, 2017.
- Satiadi, D., Purwaningsih, A., Harjupa, W., Trismidianto, Andarini, D. F., Nauval, F., Saufina, E., Harjana, T., Risyanto, Rahmatia, F., Pratama, R., Devianto, D., and Yollanda, M.: Impacts of CENS and MJO phenomena on diurnal cycle of local convection, moisture convergence, and rainfall over land, coast, and sea areas in the western part of Java Island, Meteorol. Atmos. Phys., 2023. [CrossRef]
- Seto, T. H., Yamamoto, M. K., Hashiguchi, H., and Fukao, S.: Convective activities associated with intraseasonal variation over Sumatera, Indonesia, observed with the equatorial atmosphere radar, Ann. Geophys., 3899–3916, 2004.
- Singh, C., Ganguly, D., and Dash, S. K.: Dust load and rainfall characteristics and their relationship over the South Asian monsoon region under various warming scenarios, J. Geophys. Res.: Atmos., 122, 7896–7921, 2017. [CrossRef]
- Sui, C. H., X. Li, and K.-M. Lau.: Radiativeconvective processes in simulated diurnal variations of tropical oceanic convection. J. Atmos. Sci., 55, 2345–2357, 1998.
- Suppiah, R., and Wu, X.: Surges, cross-equatorial flows and their links with the Australian Summer Monsoon Circulation and Rainfall, Aust. Meteorol. Mag., 47, 2, 1998.
- Tao, W, K., S, Lang, J. Simpson, C, H. Sui, B. Ferrier, and M, -D. Chou.: Mechanisms of cloud-radiation interaction in the tropics and midlatitude. J. Atmos. Sci., 53. 2624-2651, 1996.
- Taryono: Study of Cold Surge and Southerly Surge Activities During the Winter Asian Monsoon in the Java Region, Thesis, Bandung Institute of Technology, 2012.
- Trismidianto, Andarini, D. F., Muharsyah, R., Purwaningsih, A., Risyanto, Nauval, F., Fathrio, I., Harjupa, W., Nuryanto, D. E., Harjana, T., Satiadi, D., Saufina, E., and Praja, A. S.: Interactions among Cold Surge, Cross-Equatorial Northerly Surge, and Borneo Vortex in influencing extreme rainfall during Madden–Julian oscillation over the Indonesia Maritime Continent, Meteorol. Atmos. Phys., 2023. [CrossRef]
- Vincent, C. L., and T. P. Lane.: Evolution of the diurnal precipitation cycle with the passage of a Madden–Julian oscillation event through the Maritime Continent. Mon. Wea. Rev., 144, 1983–2005, 2016. [CrossRef]
- Wheeler, M. C., and Hendon, H. H.: An all-season real-time multivariate MJO index: Development of an index for monitoring and prediction, Mon. Wea. Rev., 132, 1917–1932, 2004. [CrossRef]
- Wheeler, M. C., Hendon, H. H., Cleland, S., Meinke, H., and Donald, A.: Impacts of the Madden-Julian oscillation on Australian rainfall and circulation, J. Climate, 22, 1482–1498, 2009. [CrossRef]
- Woolnough S. J., Slingo J. M., and Hoskins B. J.: The Relationship between Convection and Sea Surface Temperature on Intraseasonal Timescales, J. Climate, 2086–2104, 2000. [CrossRef]
- Xavier, P., Rahmat, R., Cheong, W. K., and Wallace, E.: Influence of Madden-Julian Oscillation on Southeast Asia rainfall extremes: Observations and predictability, Geophys. Res. Lett., 41, 4406–4412, 2014. [CrossRef]
- Xavier, P., Lim, S. Y., Ammar Bin Abdullah, M. F., Bala, M., et al.: Seasonal Dependence of Cold Surges and their Interaction with the Madden–Julian Oscillation over Southeast Asia, J. Climate, 33, 2467-2482, 2020. [CrossRef]
- Yamanaka, M. D.: Physical climatology of Indonesian maritime continent: An outline to comprehend observational studies, Atmos. Res., 178, 231-259, 2016.
- Zawadzki, I., Torlaschi, E., and Sauvageau, R.: The relationship between mesoscale thermodynamic variables and convective precipitation, J. Atmos. Sci., 38, 1535–1540, 1981. [CrossRef]
- Zhou, L., and Y. Wang.: Tropical Rainfall Measuring Mission observation and regional model study of precipitation diurnal cycle in the New Guinean region. J. Geophys. Res., 111, D17104, 2006. [CrossRef]
- Zhou, S., L’Heureux, M., Weaver, S., and Kumar, A.: A composite study of the MJO influence on the surface air temperature and precipitation over the continental United States, Clim. Dyn., 38, 1459–1471, 2012. [CrossRef]
Figure 1.
(a) Distribution of 2140 weather observation station locations from BMKG along Java Island to East Nusa Tenggara. (b) A topographic map with the study regions divided into the following regions: Banten as region 1 (R1), Jakarta as region 2 (R2), West Java, designated as region 3 (R3), Central Java, designated as region 4 (R4), Yogyakarta as region 5 (R5), East Java as region 6 (R6), Bali as region 7 (R7), West Nusa Tenggara as region 8 (R8), and East Nusa Tenggara as region (R9).
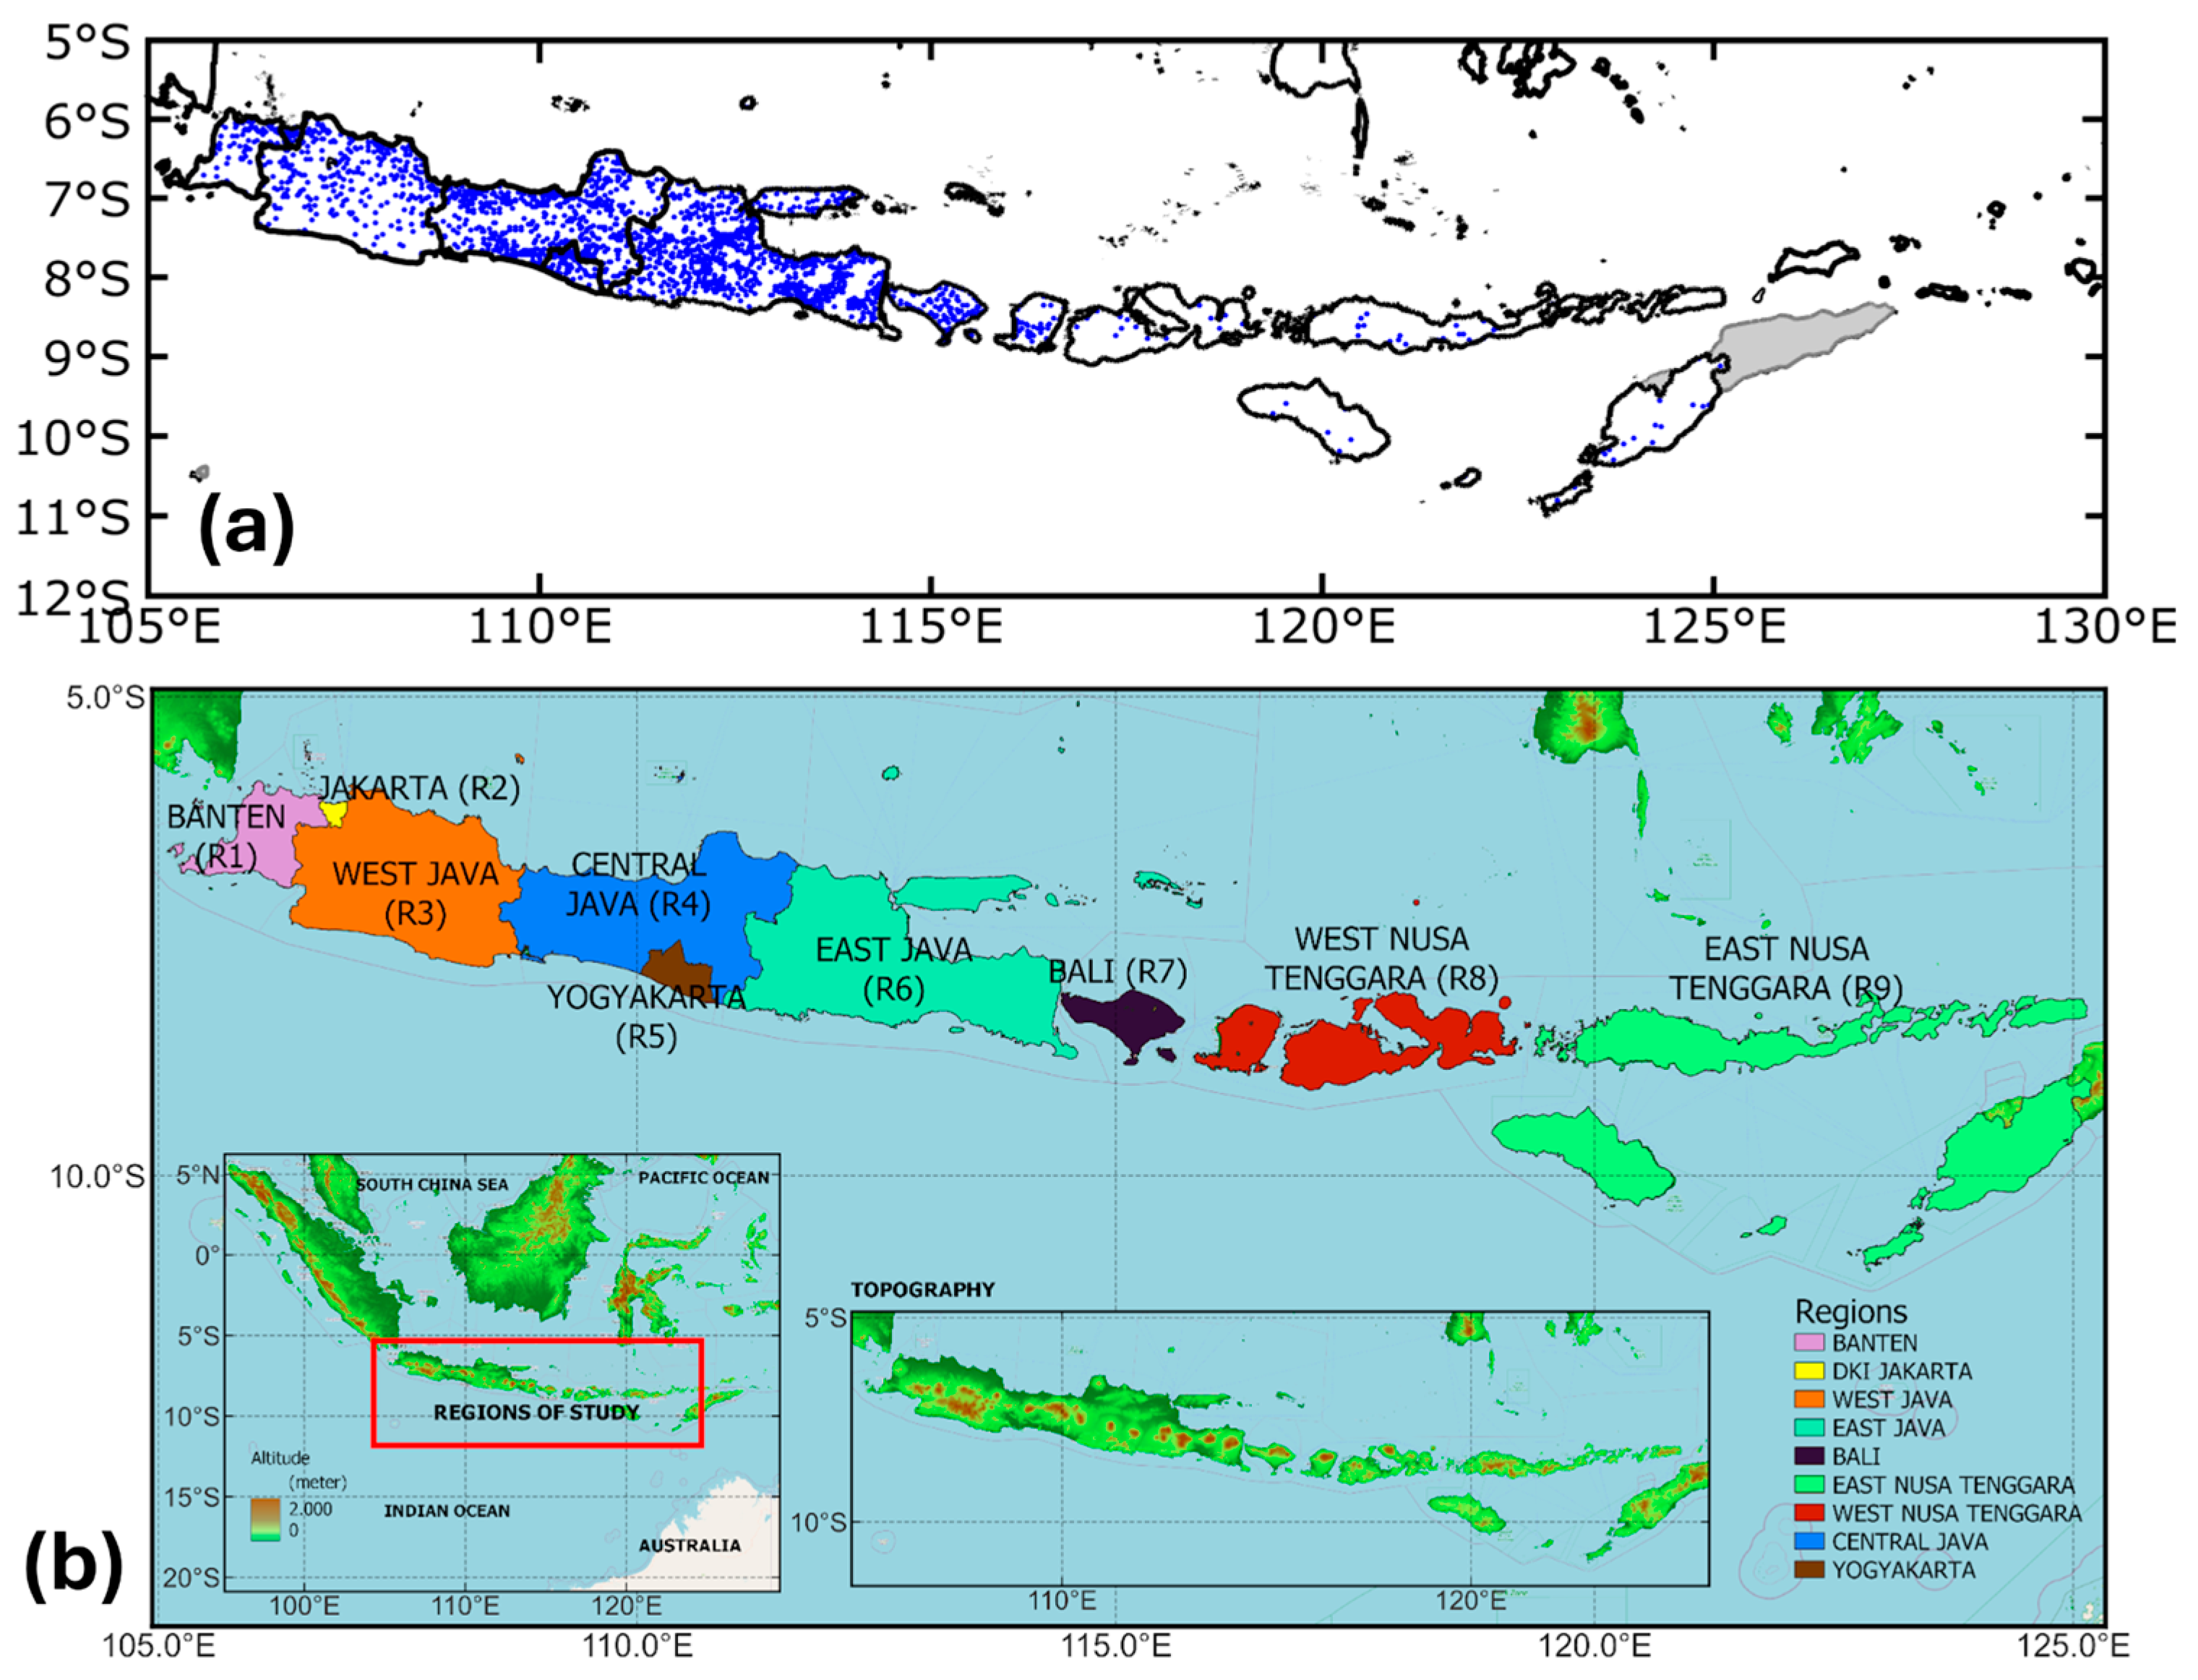
Figure 2.
The daily mean meridional wind at 850 hPa for Australia's western region (25–30°S and 105–110°E) derived from ERA5 data between January 2001 and March 2019 for (a) all meridional wind data (the variance value of the daily mean meridional wind is displayed in red; the daily mean meridional wind above the red line represents the southerly index), and (b) all SS events (61 events). (c) Total SS events for each month between January 2001 and March 2019.
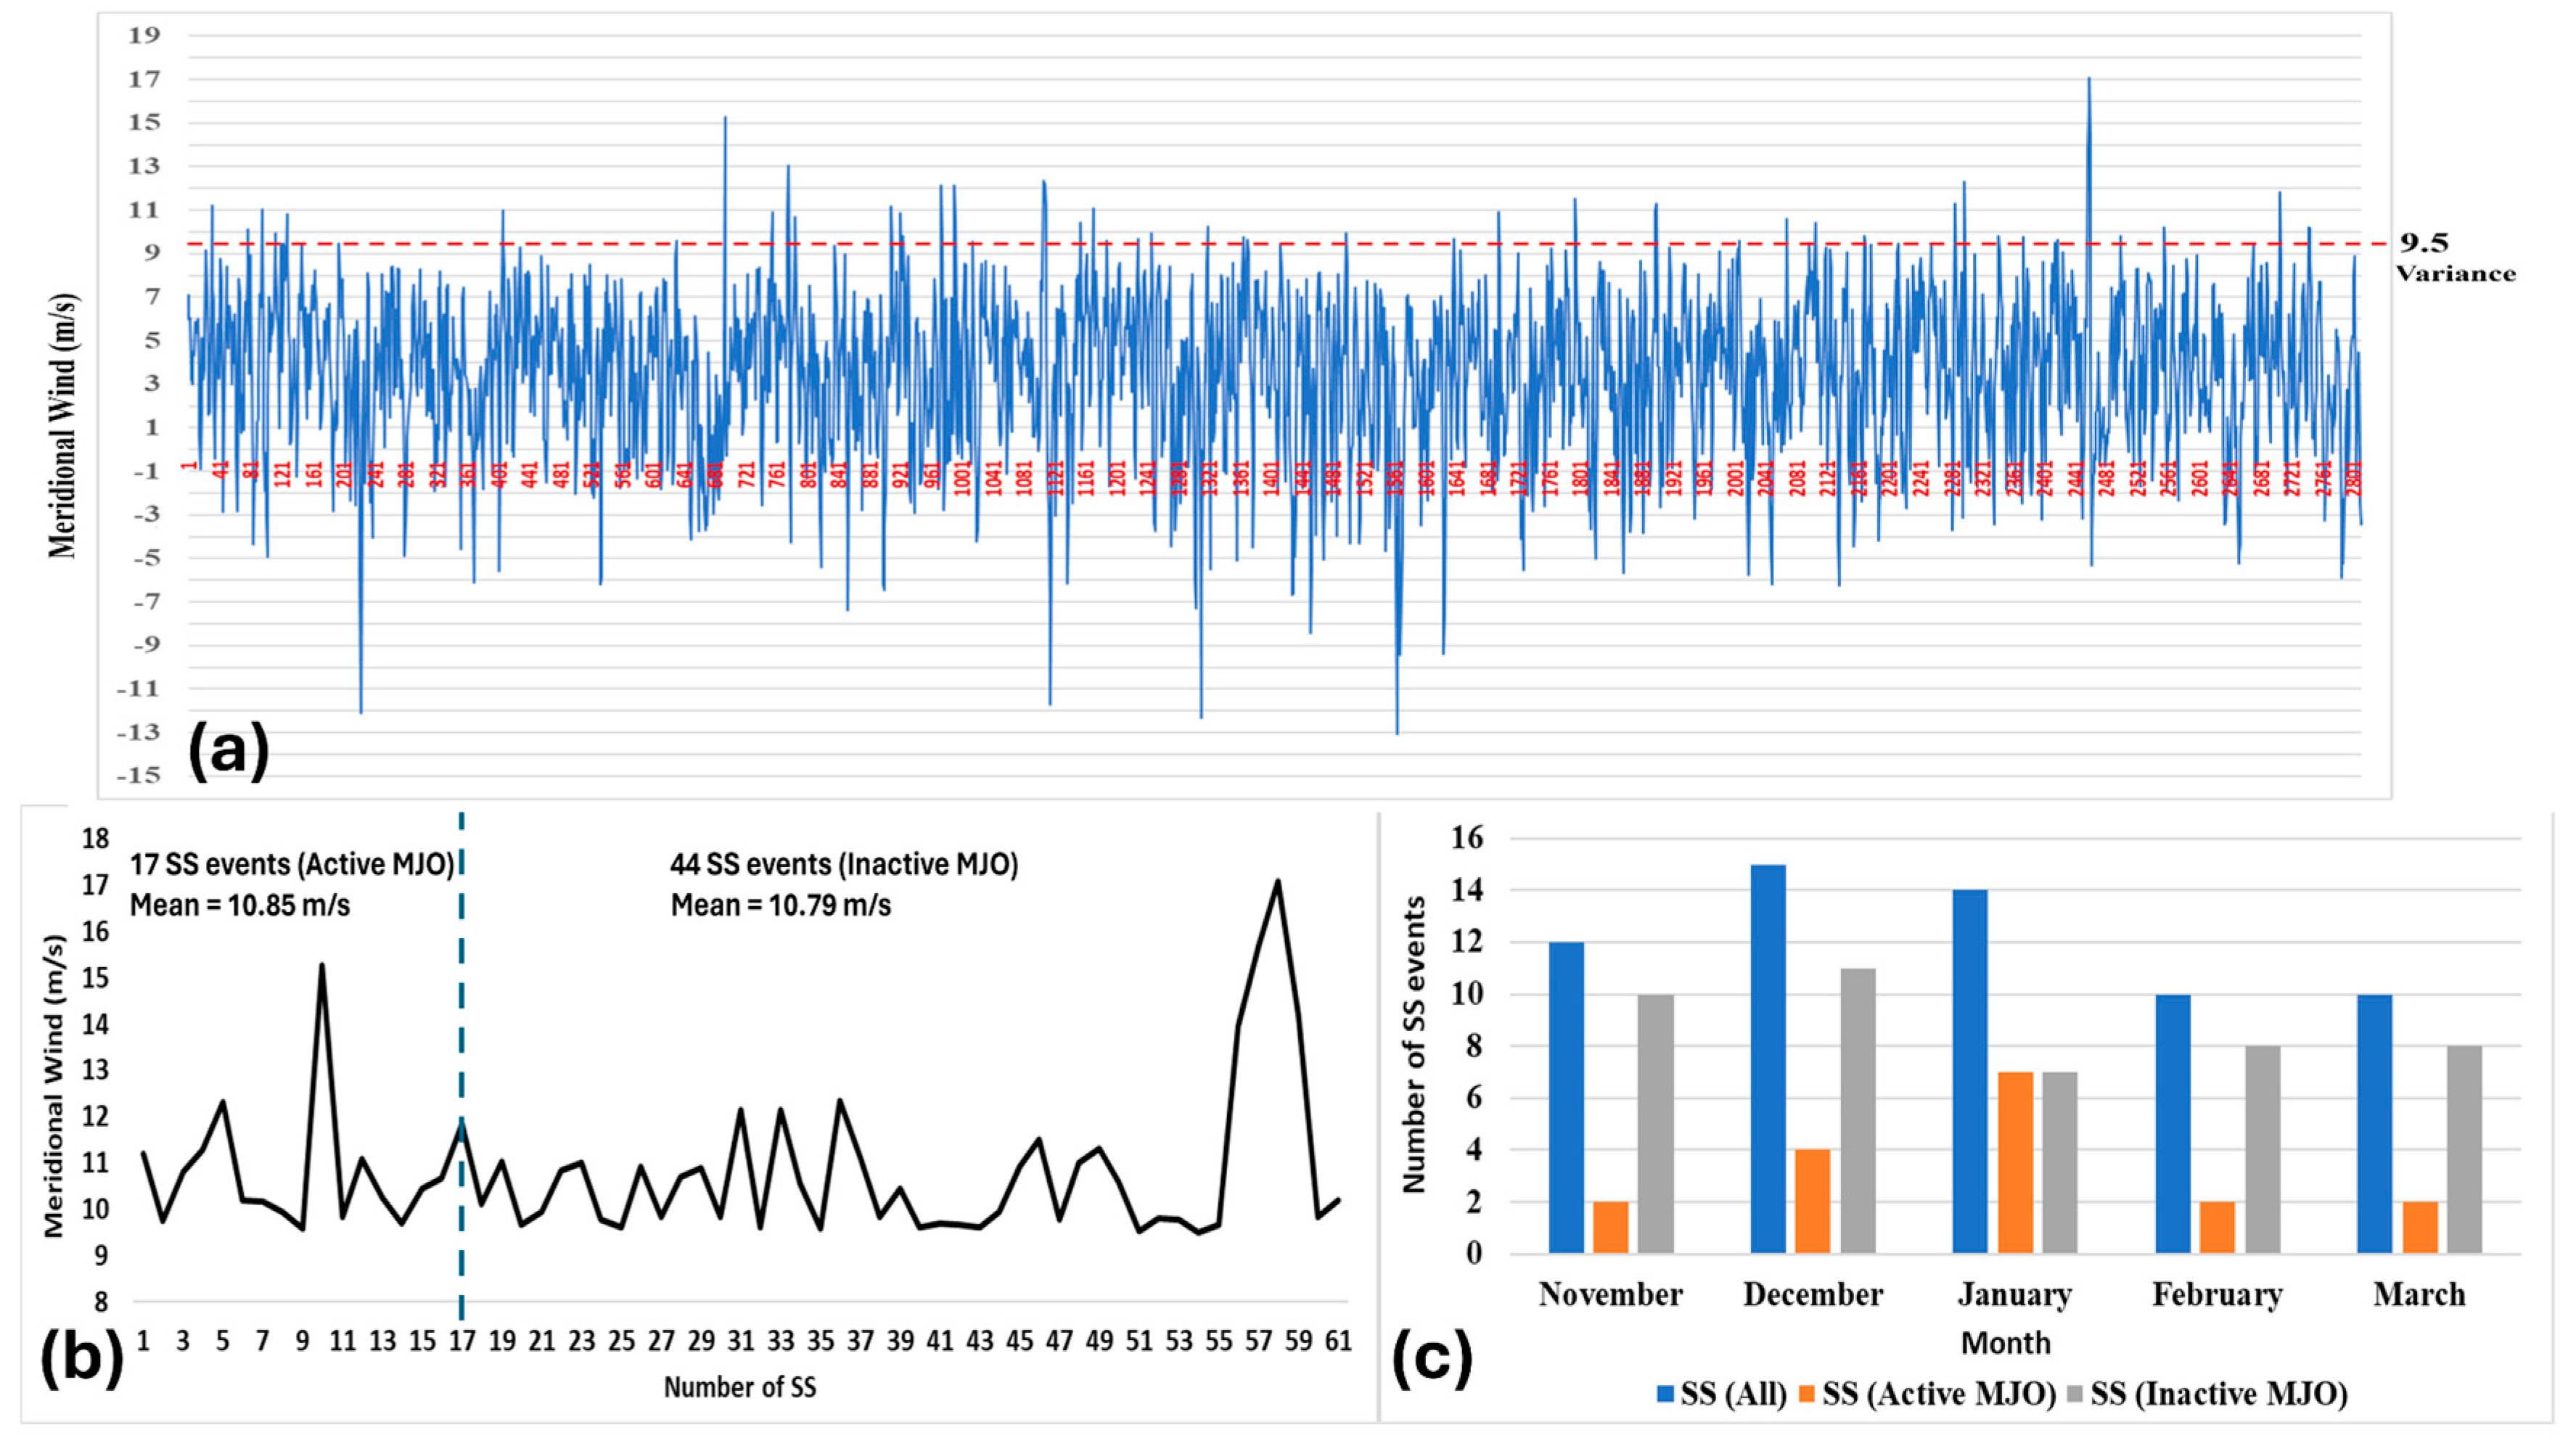
Figure 3.
The 19-yr (Jan 2001 – March 2019) NDJFM mean daily for (a) Rainfall (mm/day), and (d) 850-hPa wind speed (shaded and vectors; m/s); the composites of Southerly surge days for (b) rainfall (mm/day), (e) 850-hPa wind speed (shaded and vectors; m/s); (c) the anomalies between (b)–(a), and (f) the anomalies between (e)–(d).
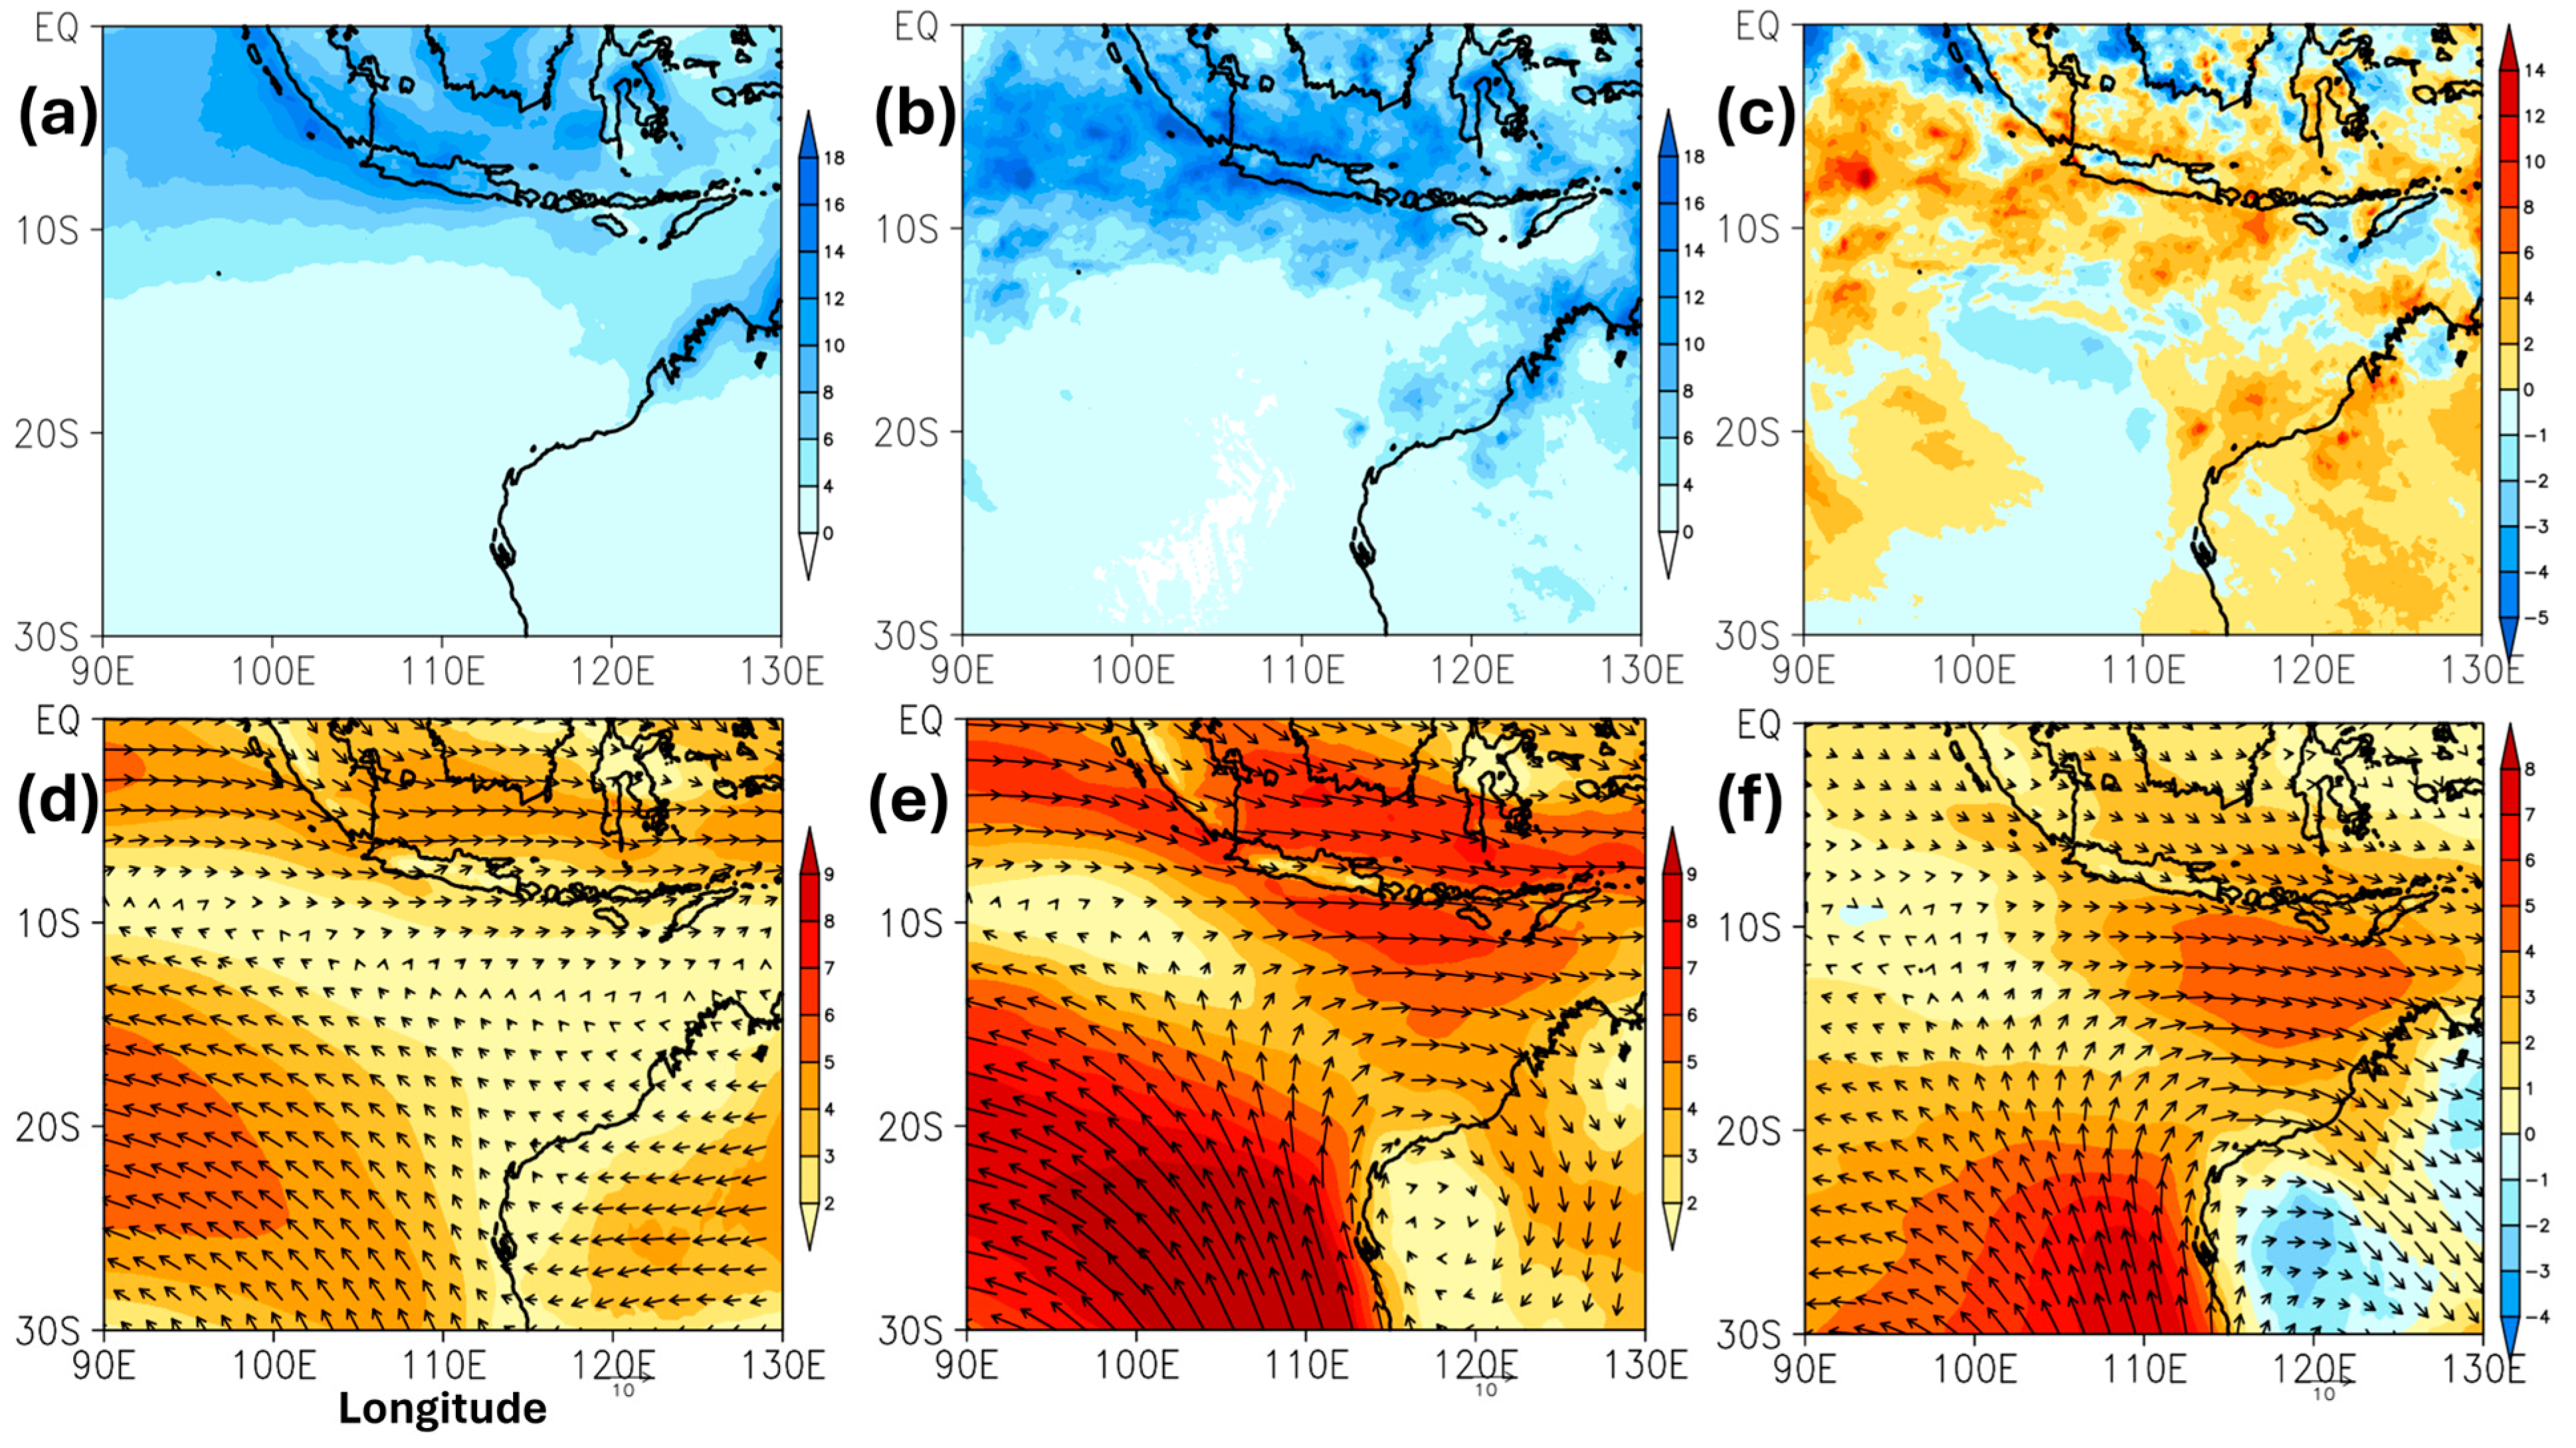
Figure 4.
The 19-year (January 2001–March 2019) average daily rainfall from observation data for (a) rainfall in NDJFM (mm/day), (b) rainfall composites from days of Southerly surge (mm/day), and (c) anomalies between (b) and (a).
Figure 4.
The 19-year (January 2001–March 2019) average daily rainfall from observation data for (a) rainfall in NDJFM (mm/day), (b) rainfall composites from days of Southerly surge (mm/day), and (c) anomalies between (b) and (a).
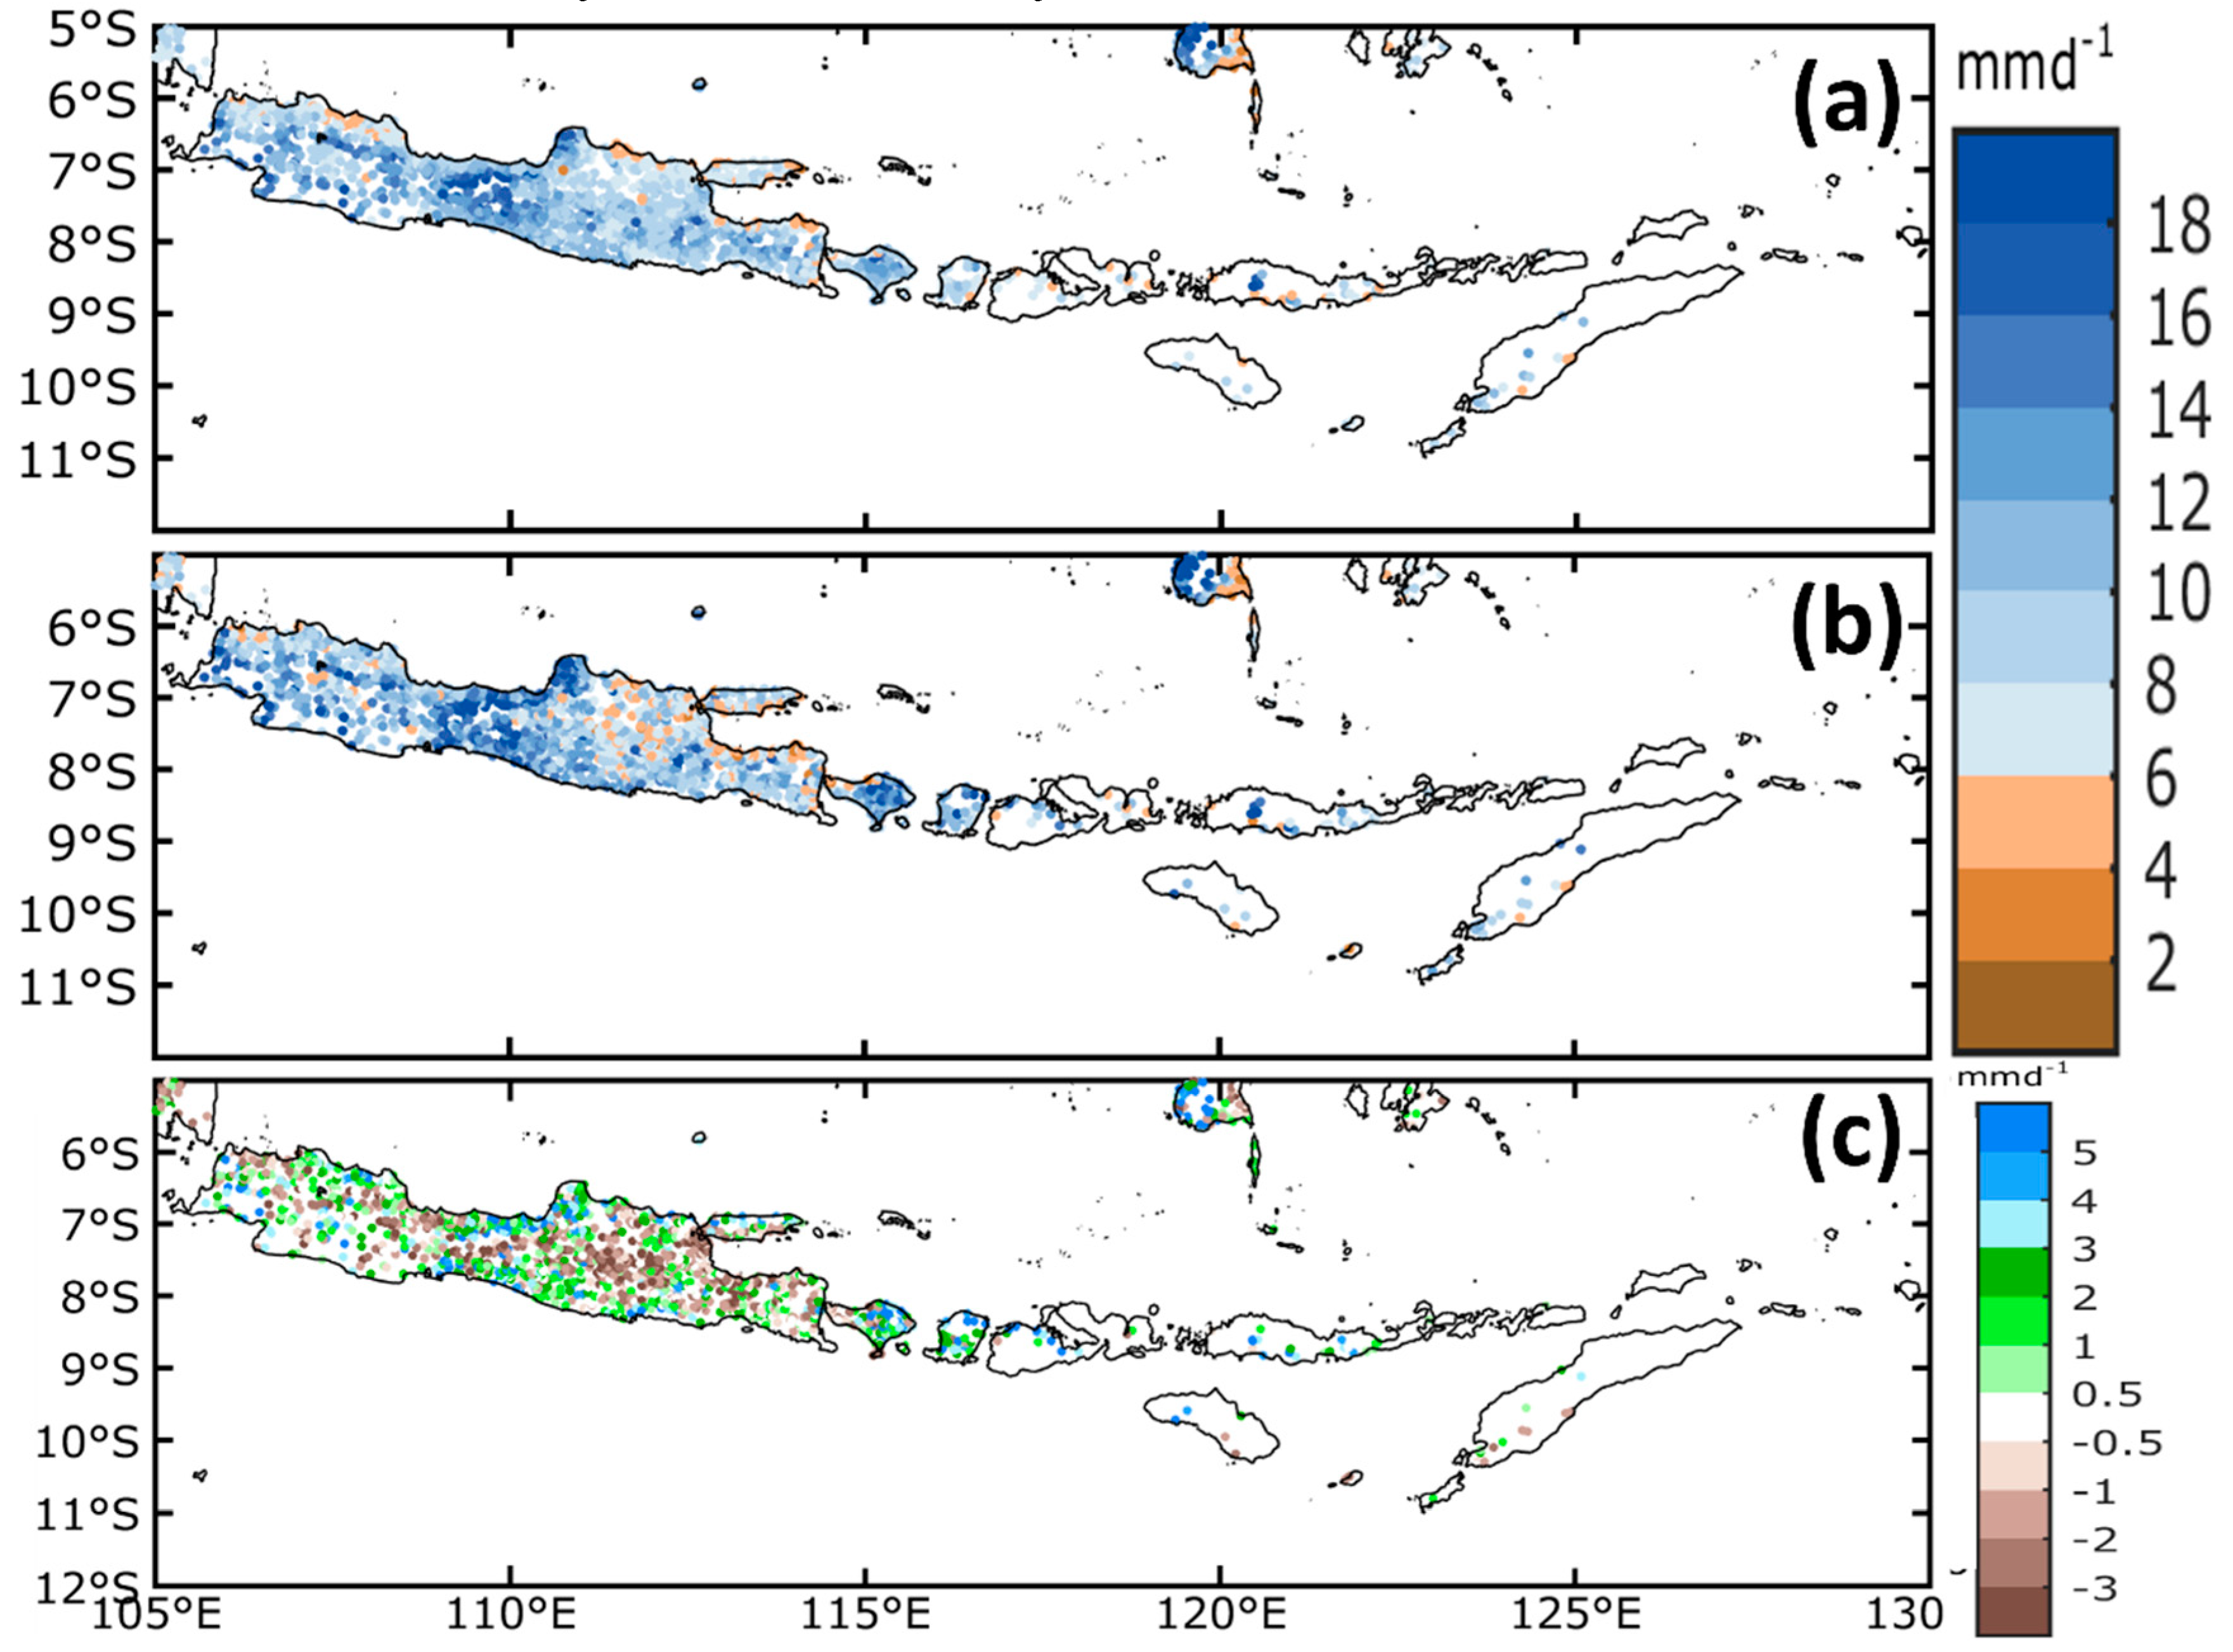
Figure 5.
The 19-year (January 2001 – March 2019) NDJFM mean daily for (a) MSLP (contours; hPa) with SST (shaded; °C) and (d) 850-hPa wind speed (vectors; m/s) with OLR (shaded; W/m2); the composites of Southerly surge days for (b) MSLP (contours; hPa) with SST (shaded; °C) and (e) 850-hPa wind speed (vectors; m/s) with OLR (shaded; W/m2); (c) the anomalies between (b) and (a); and (f) the anomalies between (e) and (d).
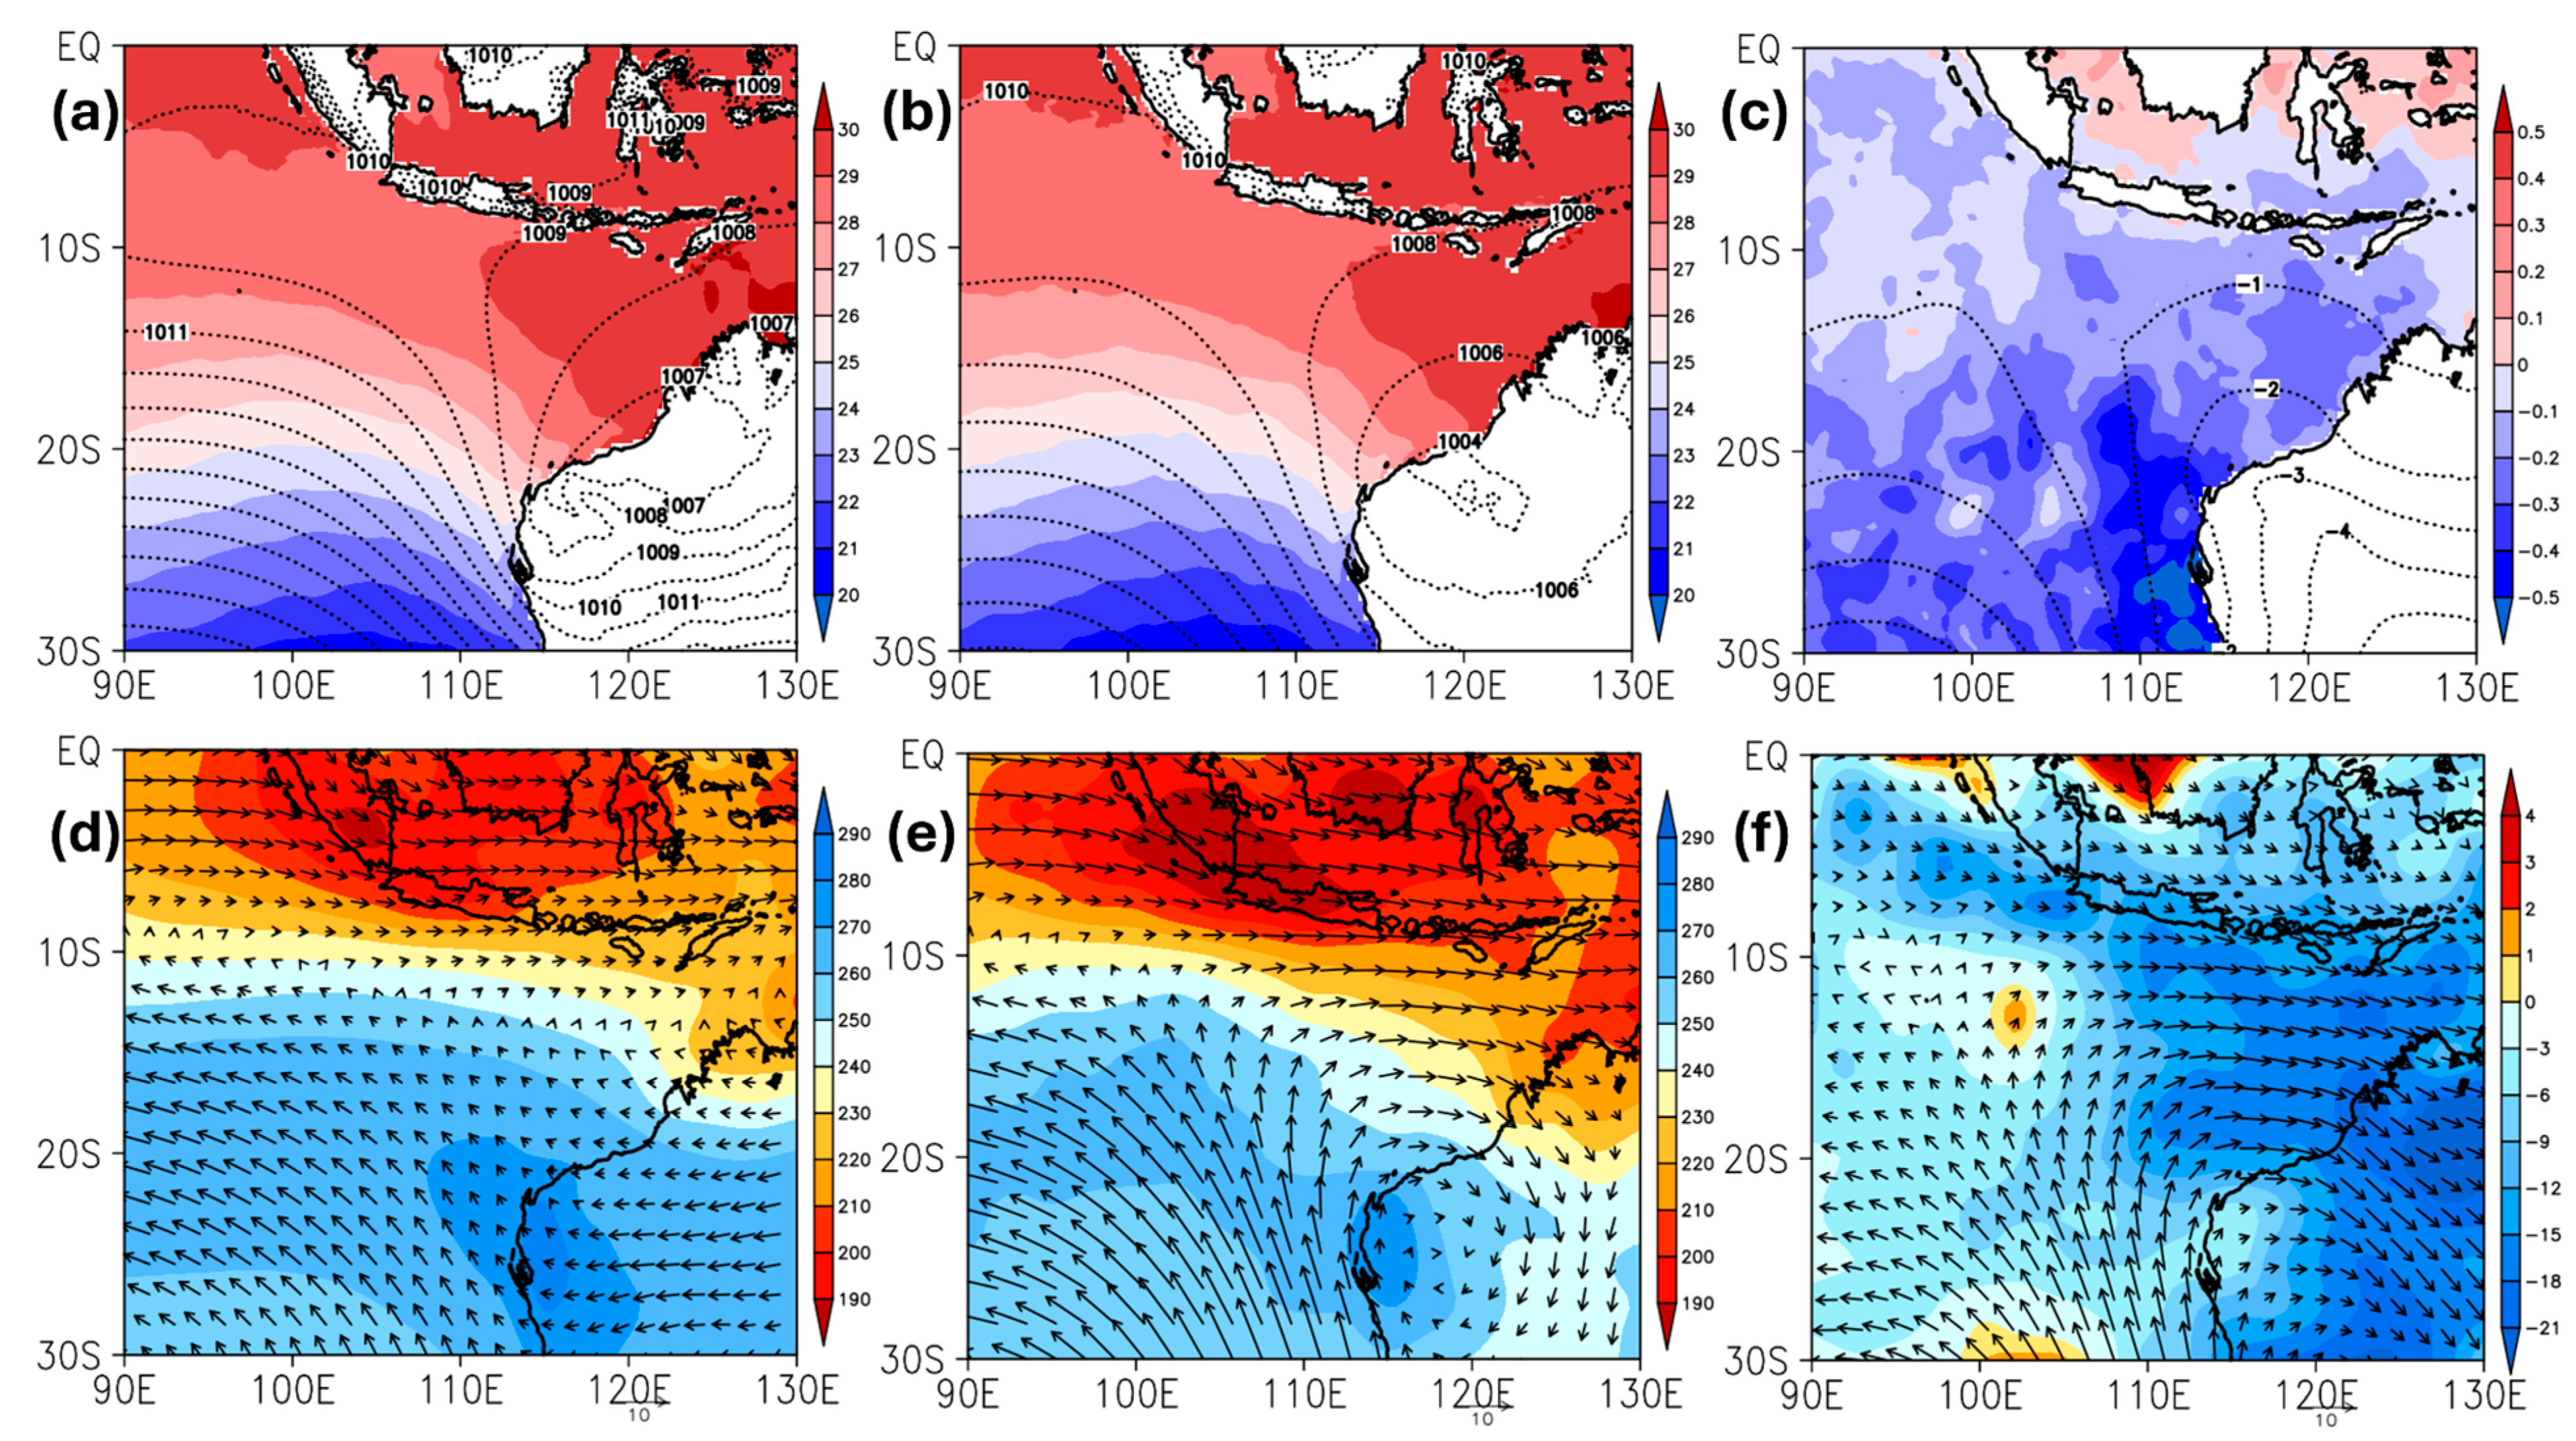
Figure 6.
The 19-year (Jan 2001–March 2019) NDJFM mean daily from observation data for (a) rainfall during the active MJO (mm/day), (c) rainfall in the composites of SS days during the active MJO (mm/day), and (e) rainfall anomalies from all SSs that occurred during the active MJO relative to NDJFM rainfall. (b), (d), and (f) are the same as (a), (c), and (e), respectively, but during an inactive MJO.
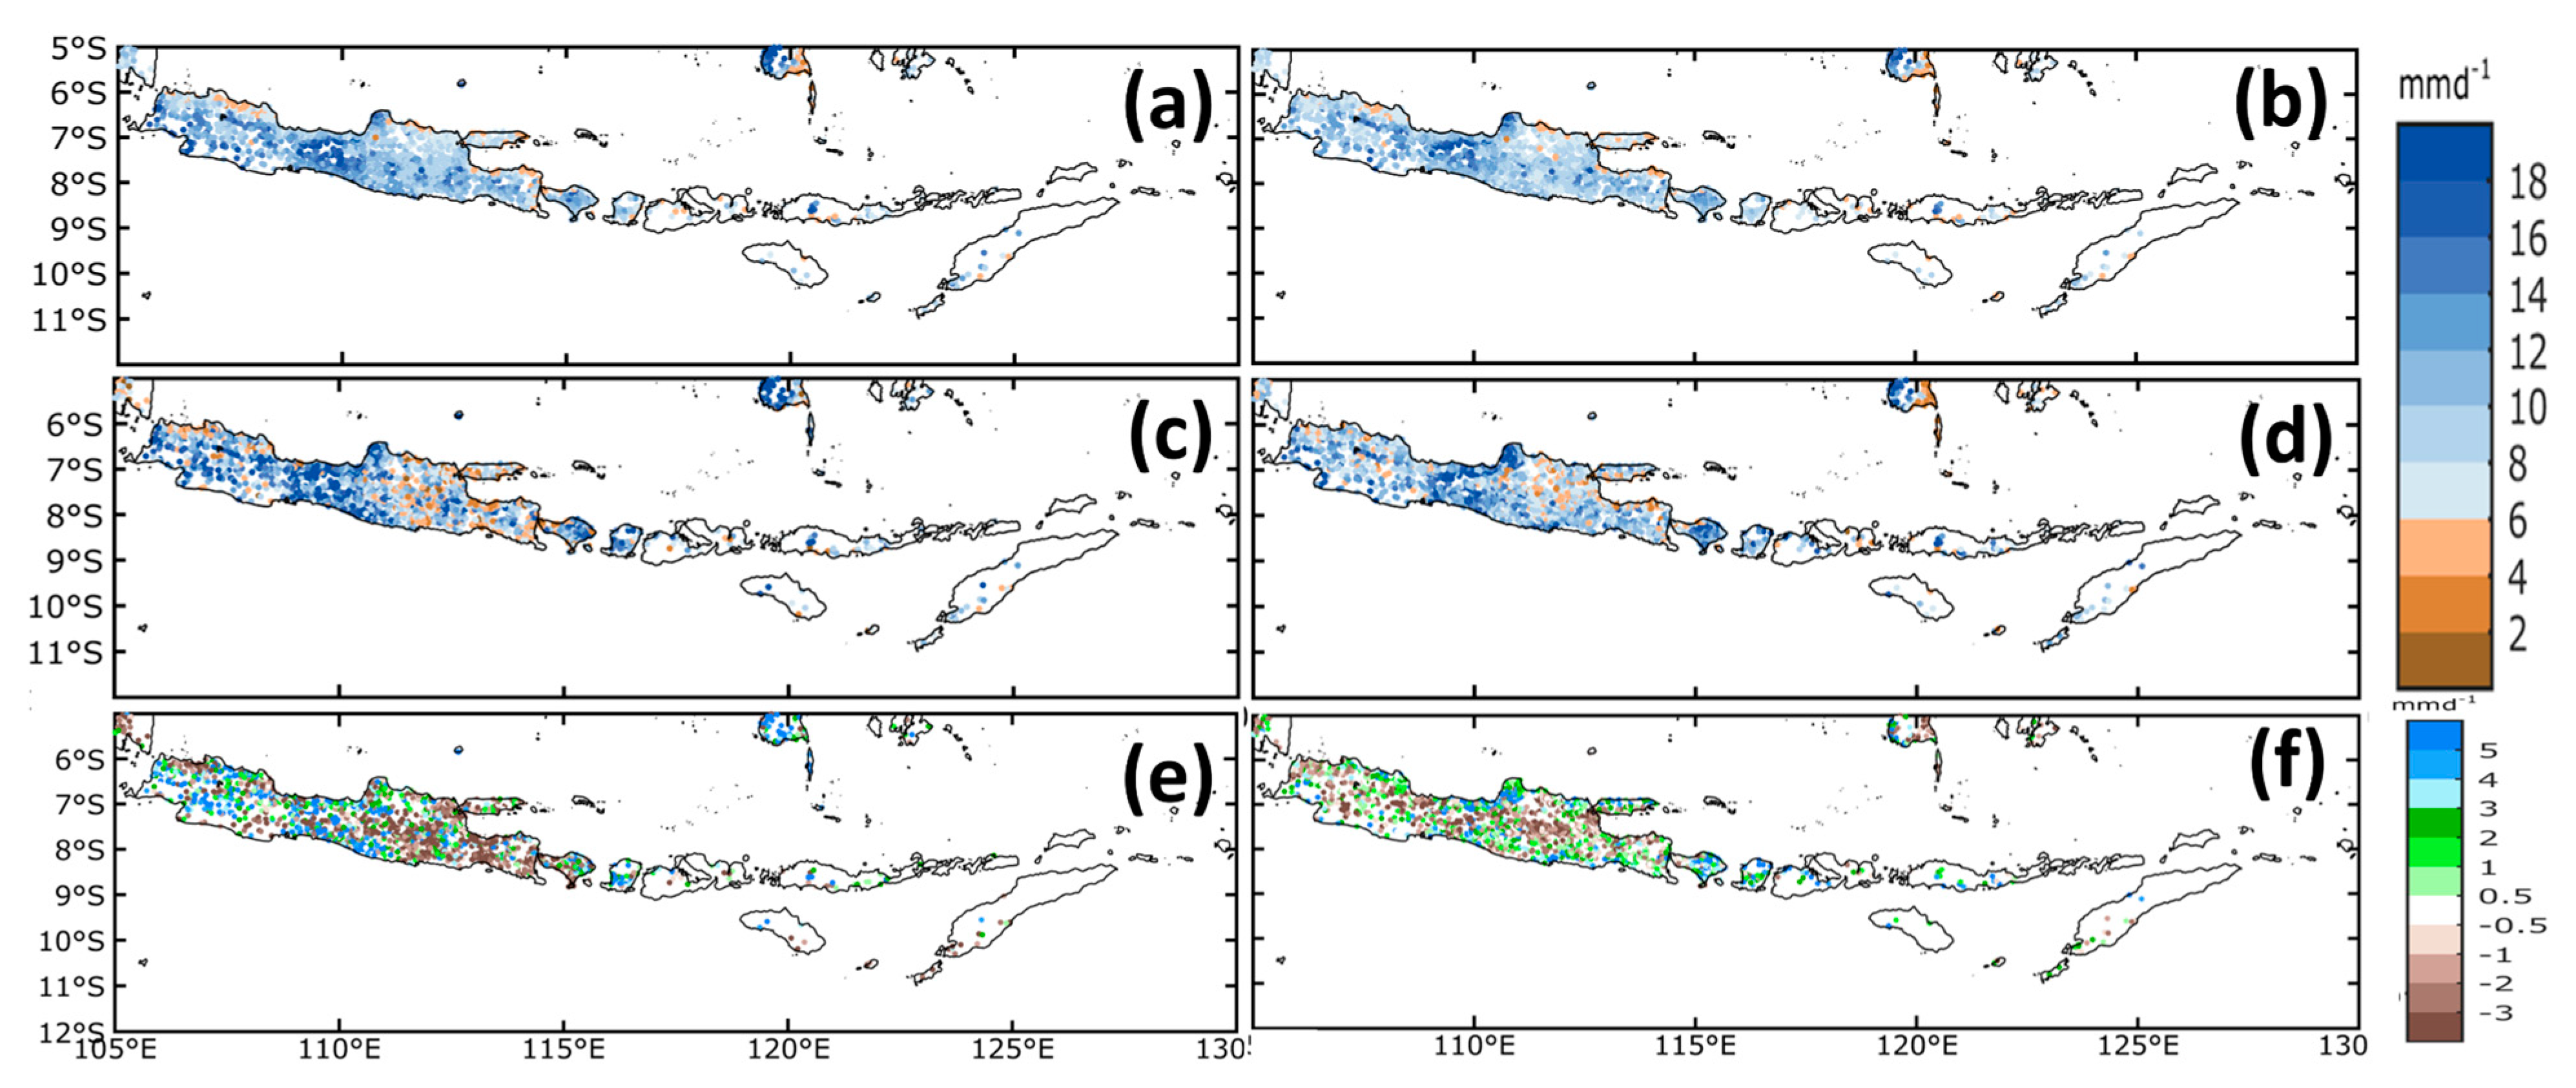
Figure 7.
Rainfall anomalies from SSs occurred during the active MJO on a) phase 3, b) phase 4, and c) phase 5. No SS occurred during phase 2 of the active MJO.
Figure 7.
Rainfall anomalies from SSs occurred during the active MJO on a) phase 3, b) phase 4, and c) phase 5. No SS occurred during phase 2 of the active MJO.
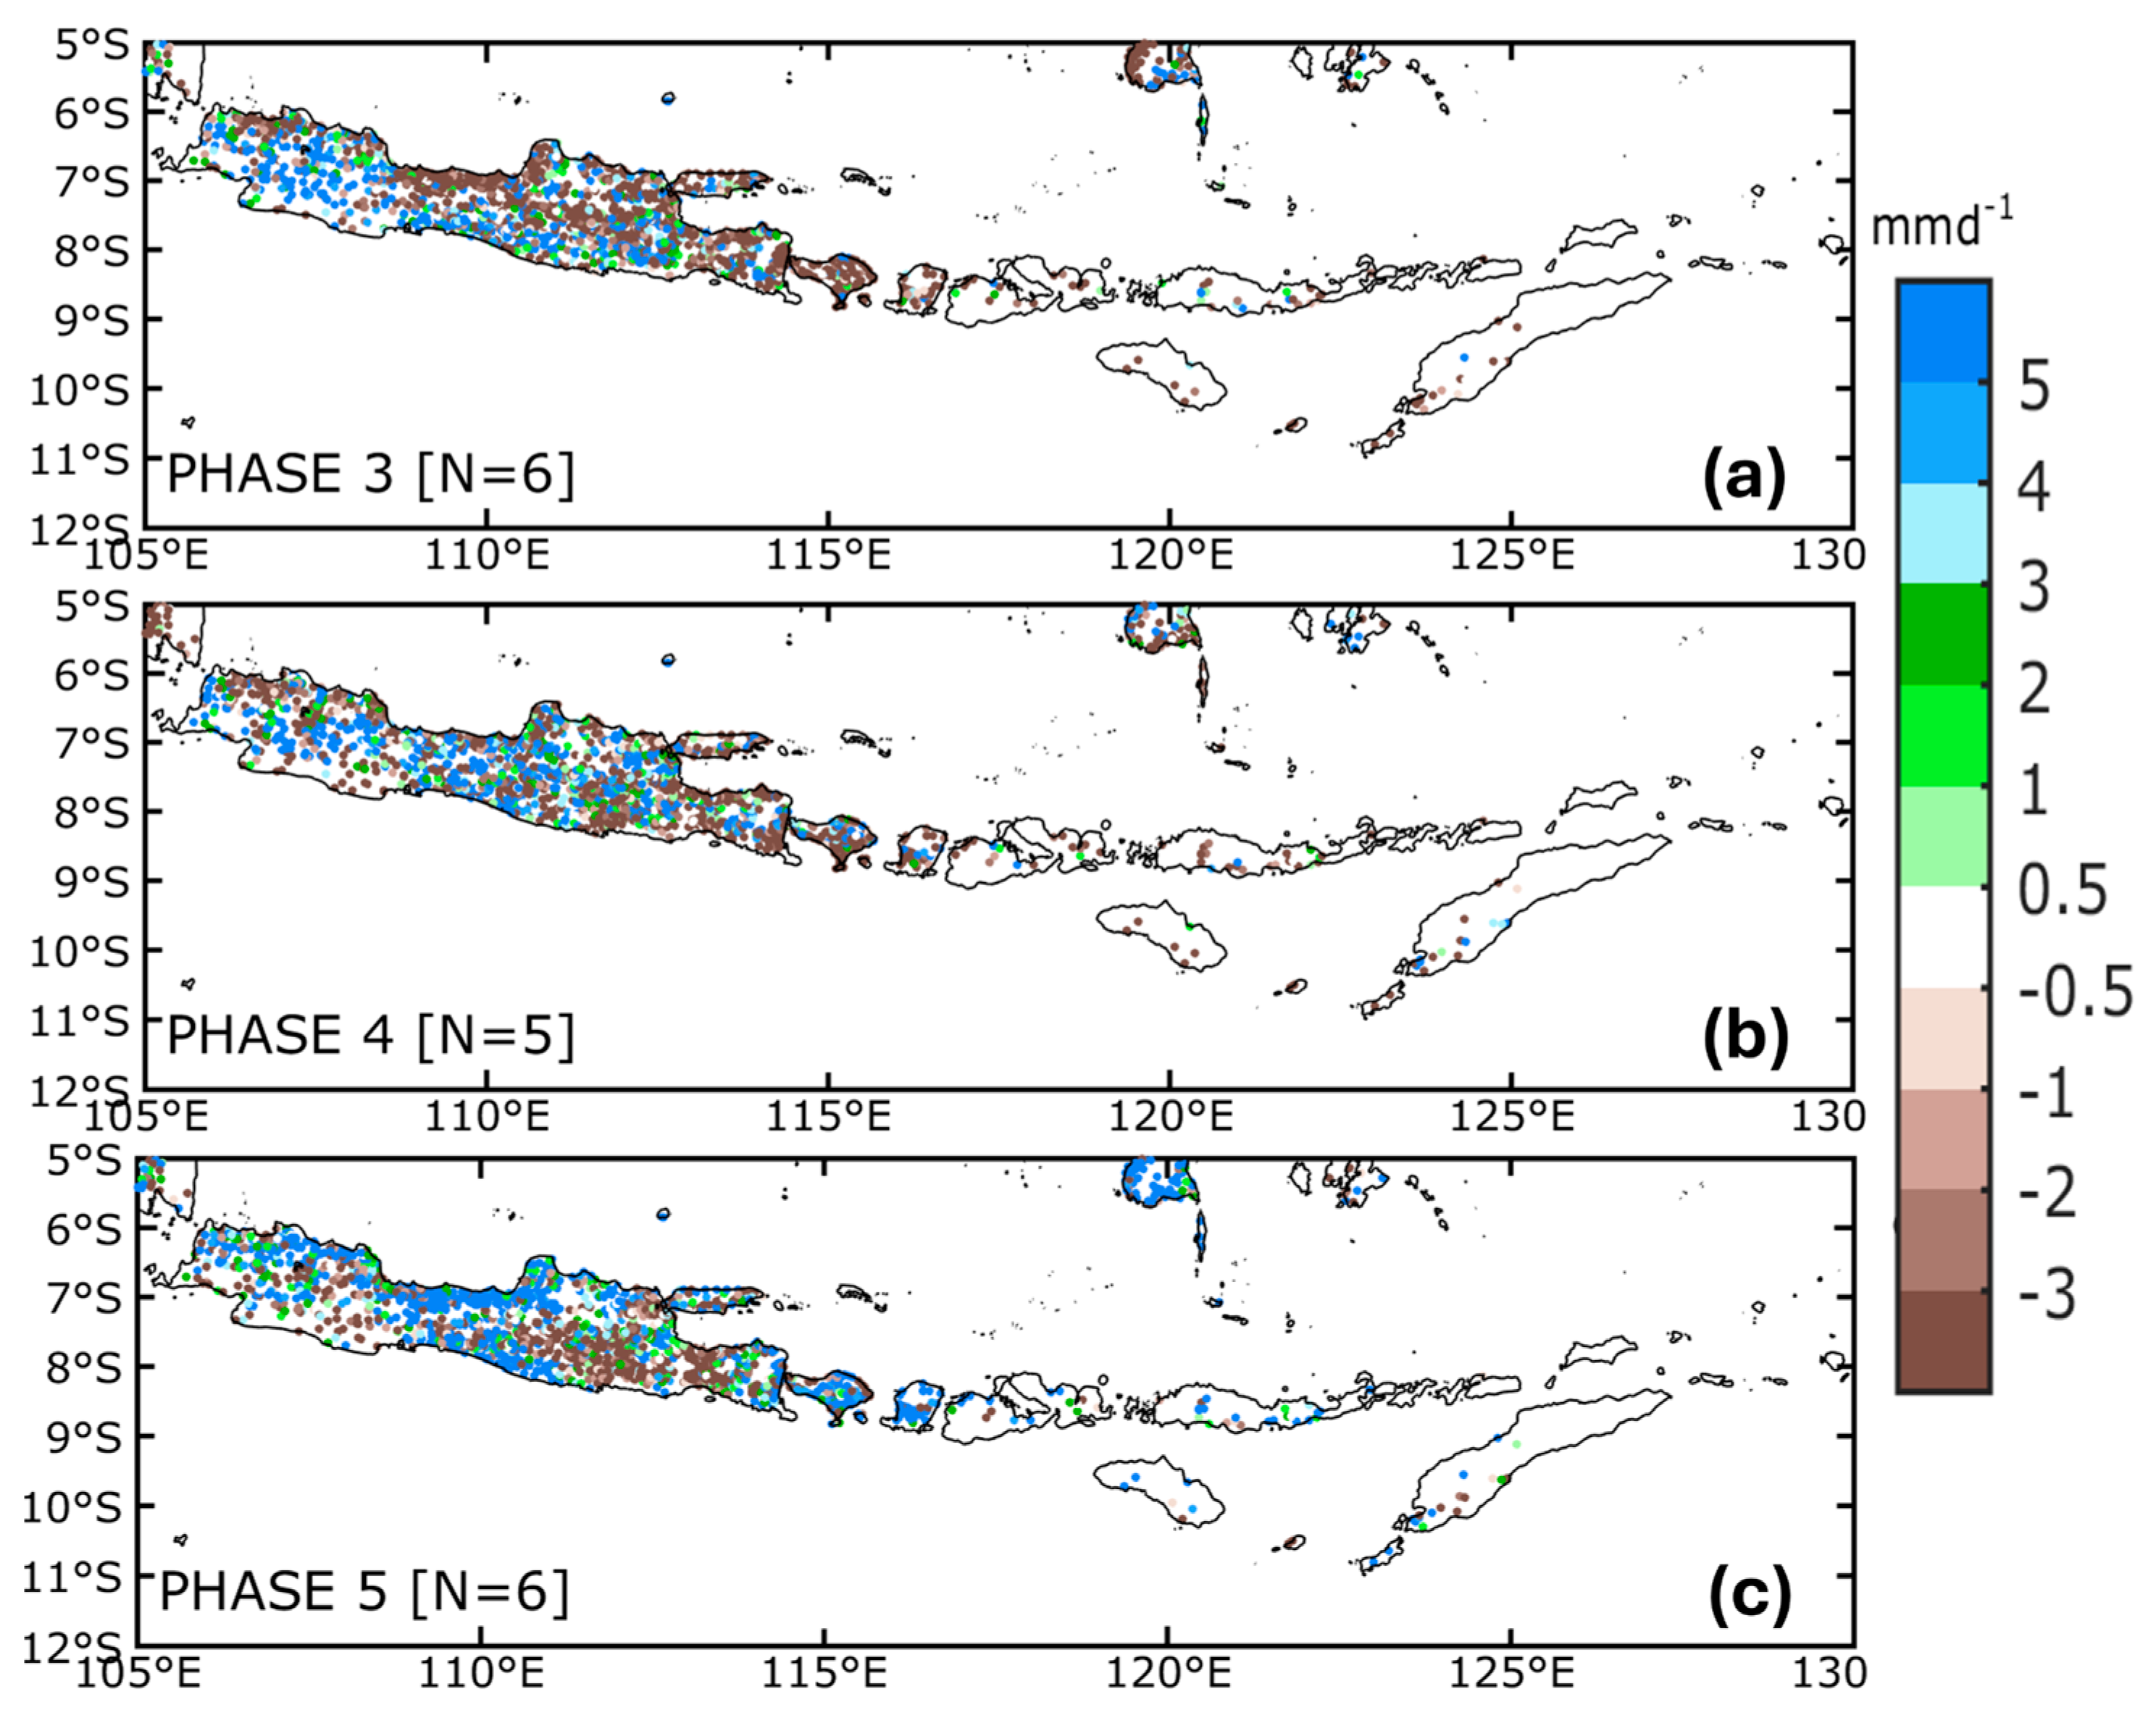
Figure 8.
Average rainfall anomalies at all observation stations data in the R1-R9 region when SSs occur during active MJO and inactive MJO.
Figure 8.
Average rainfall anomalies at all observation stations data in the R1-R9 region when SSs occur during active MJO and inactive MJO.
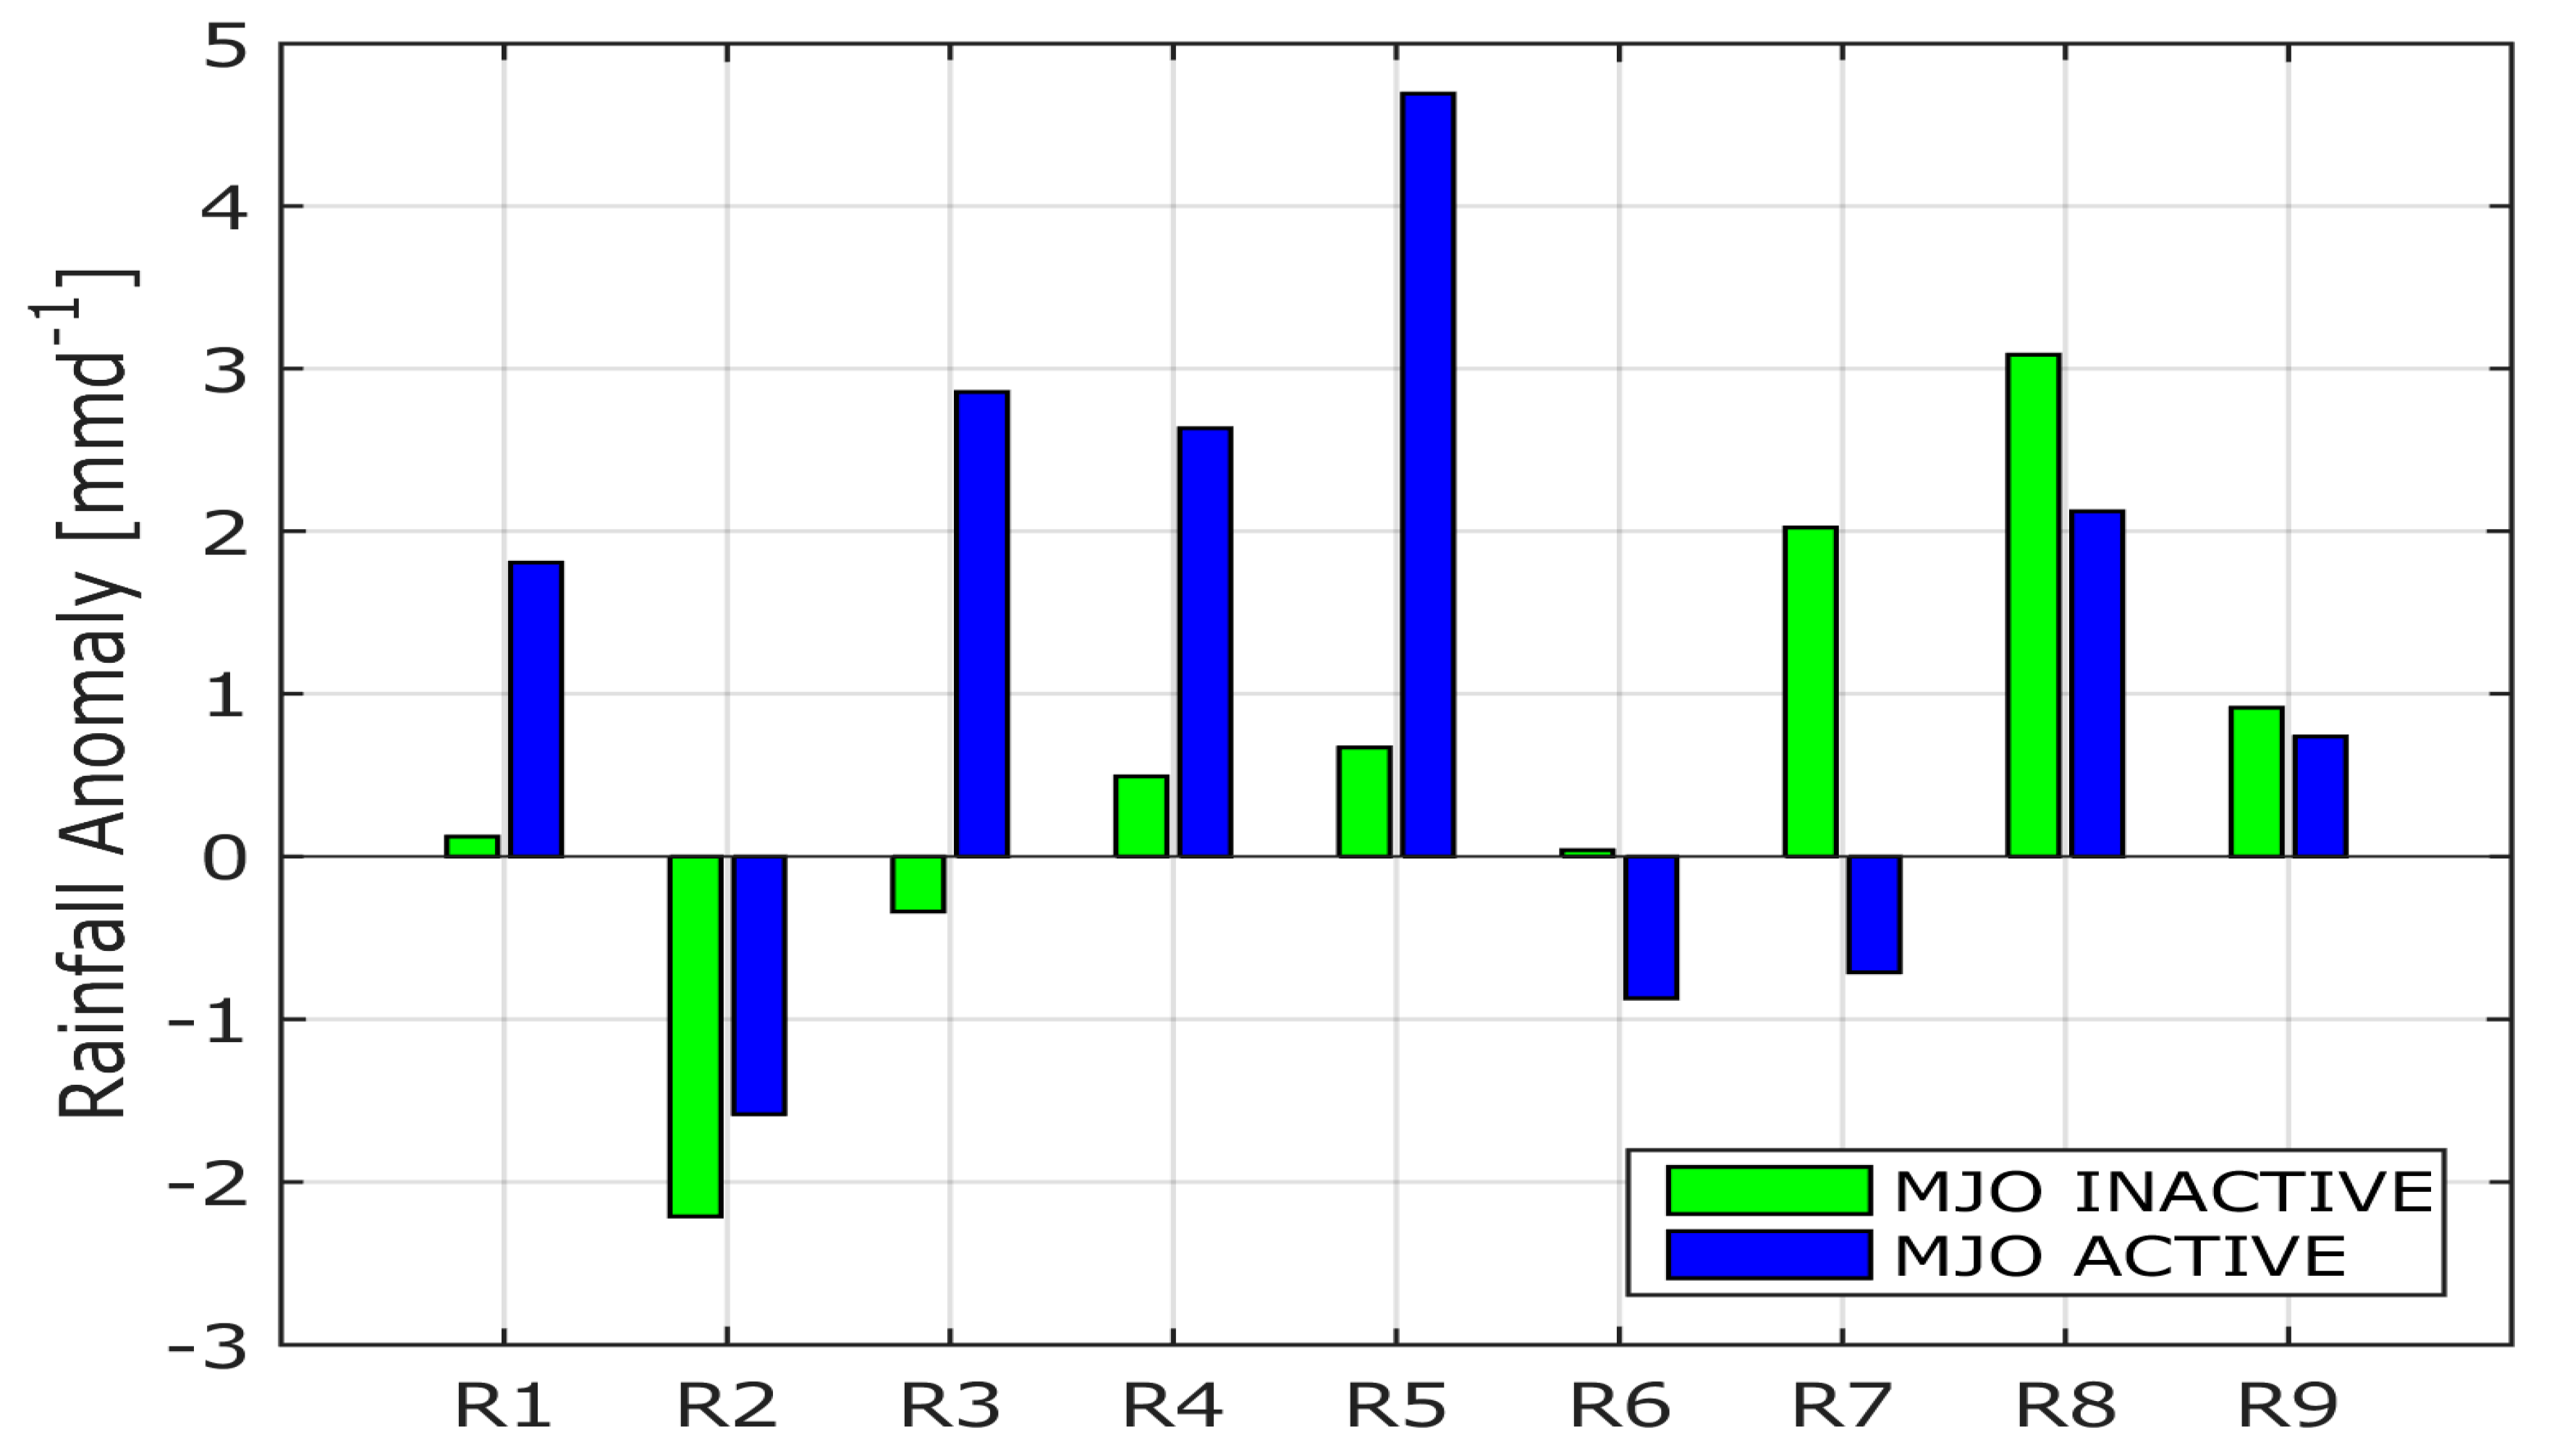
Figure 9.
Average rainfall anomaly during SS Day, two days prior to and three days following SS during (a) active MJO and (b) inactive MJO, based on observation data from all-weather observation stations in the R1 through R9 region.
Figure 9.
Average rainfall anomaly during SS Day, two days prior to and three days following SS during (a) active MJO and (b) inactive MJO, based on observation data from all-weather observation stations in the R1 through R9 region.
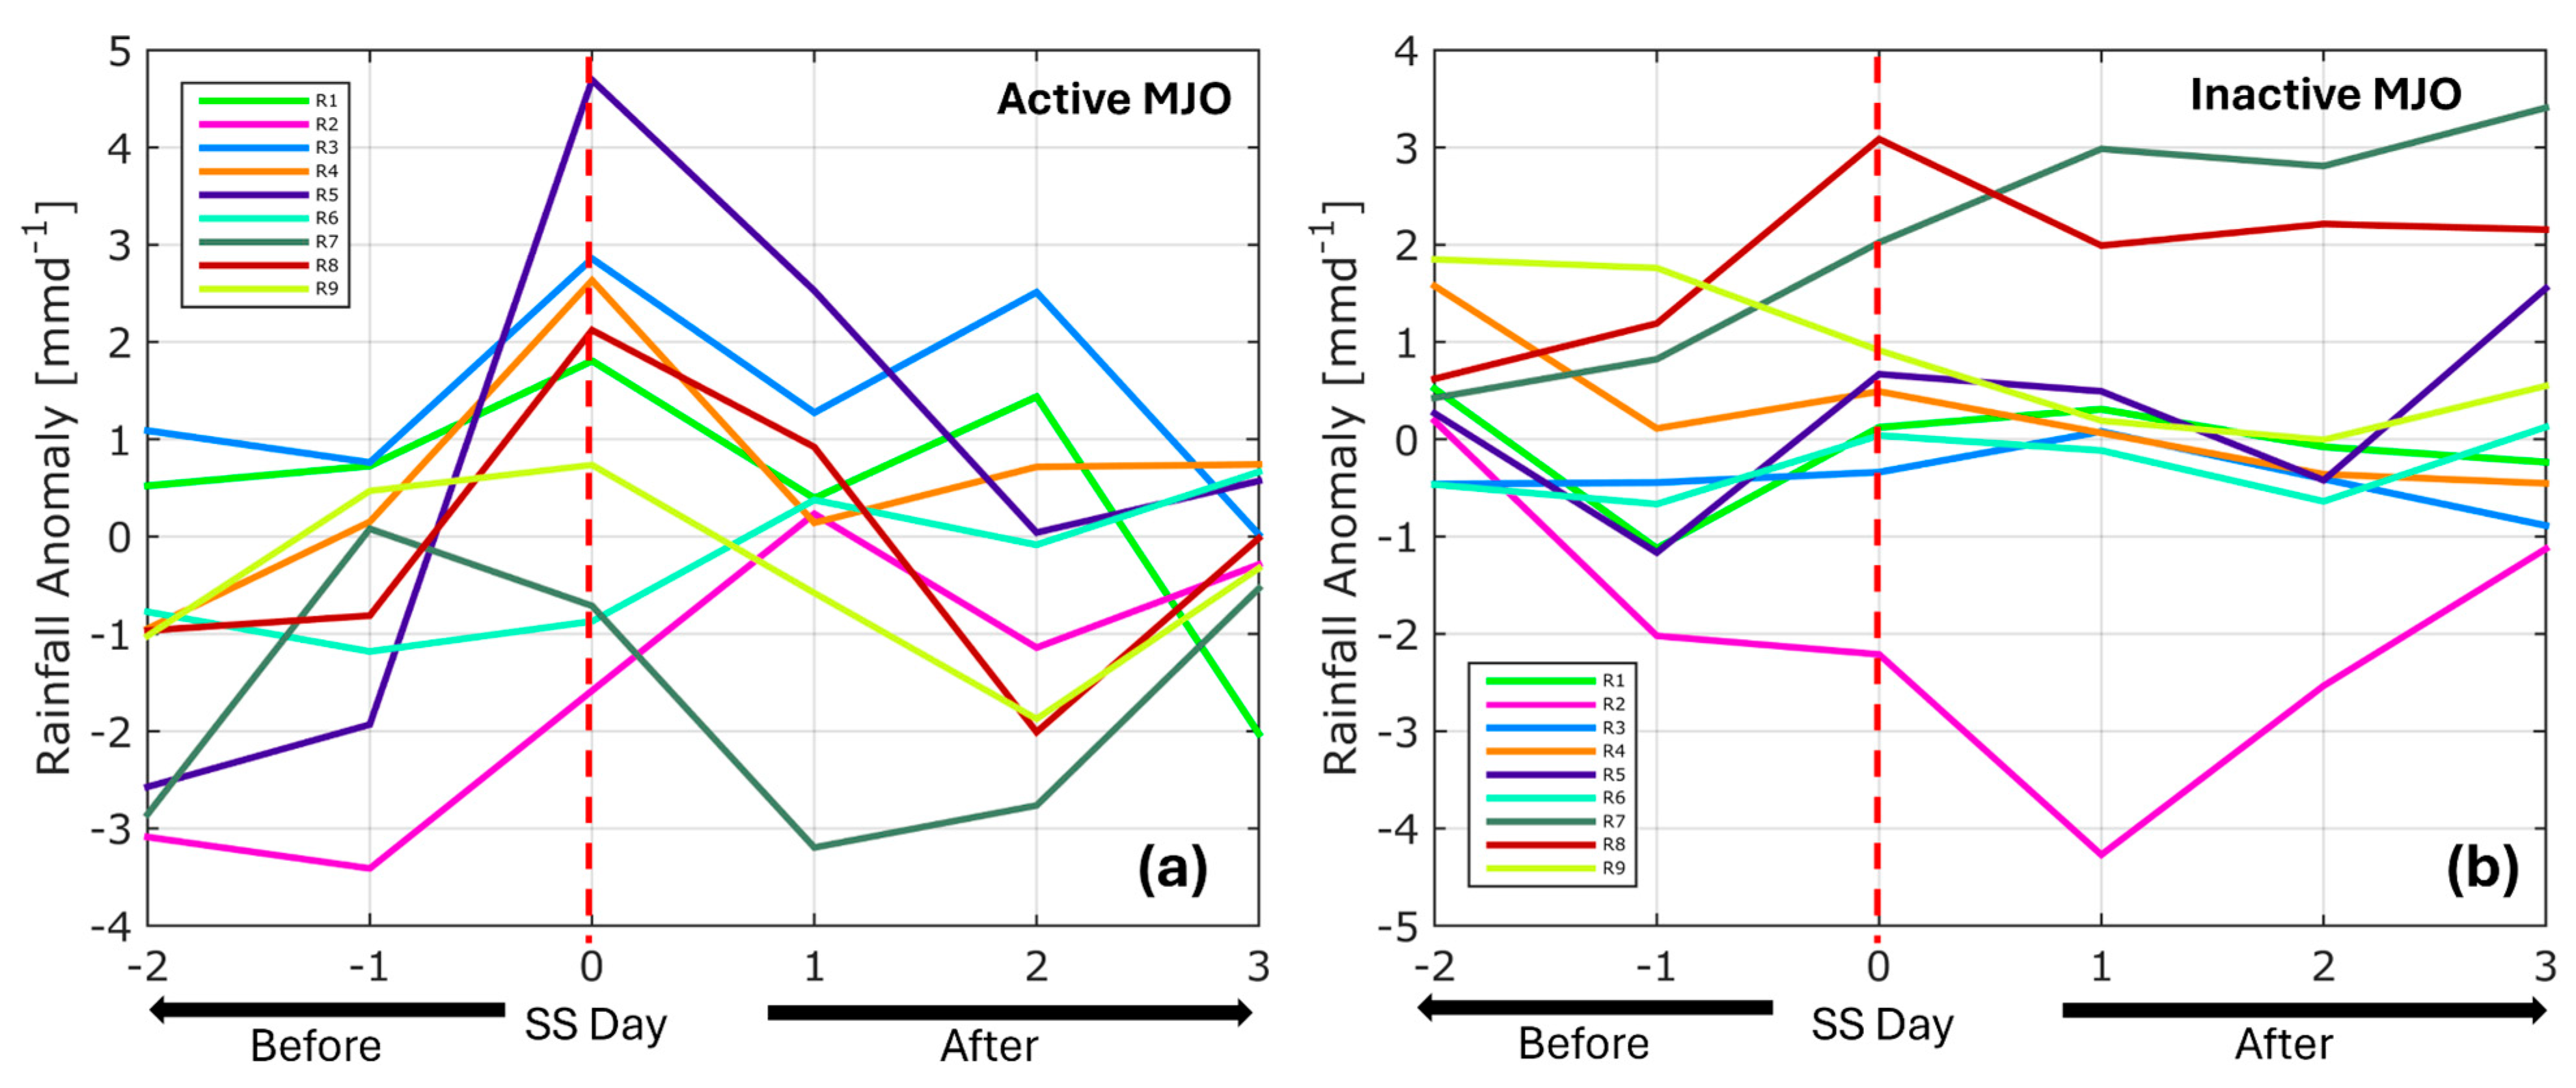
Figure 10.
The rainfall anomaly for the composites of SS days (mm/day) during the following months: (a) November, (b) December, (c) January, (d) February, and (e) March, as determined by observation data.
Figure 10.
The rainfall anomaly for the composites of SS days (mm/day) during the following months: (a) November, (b) December, (c) January, (d) February, and (e) March, as determined by observation data.
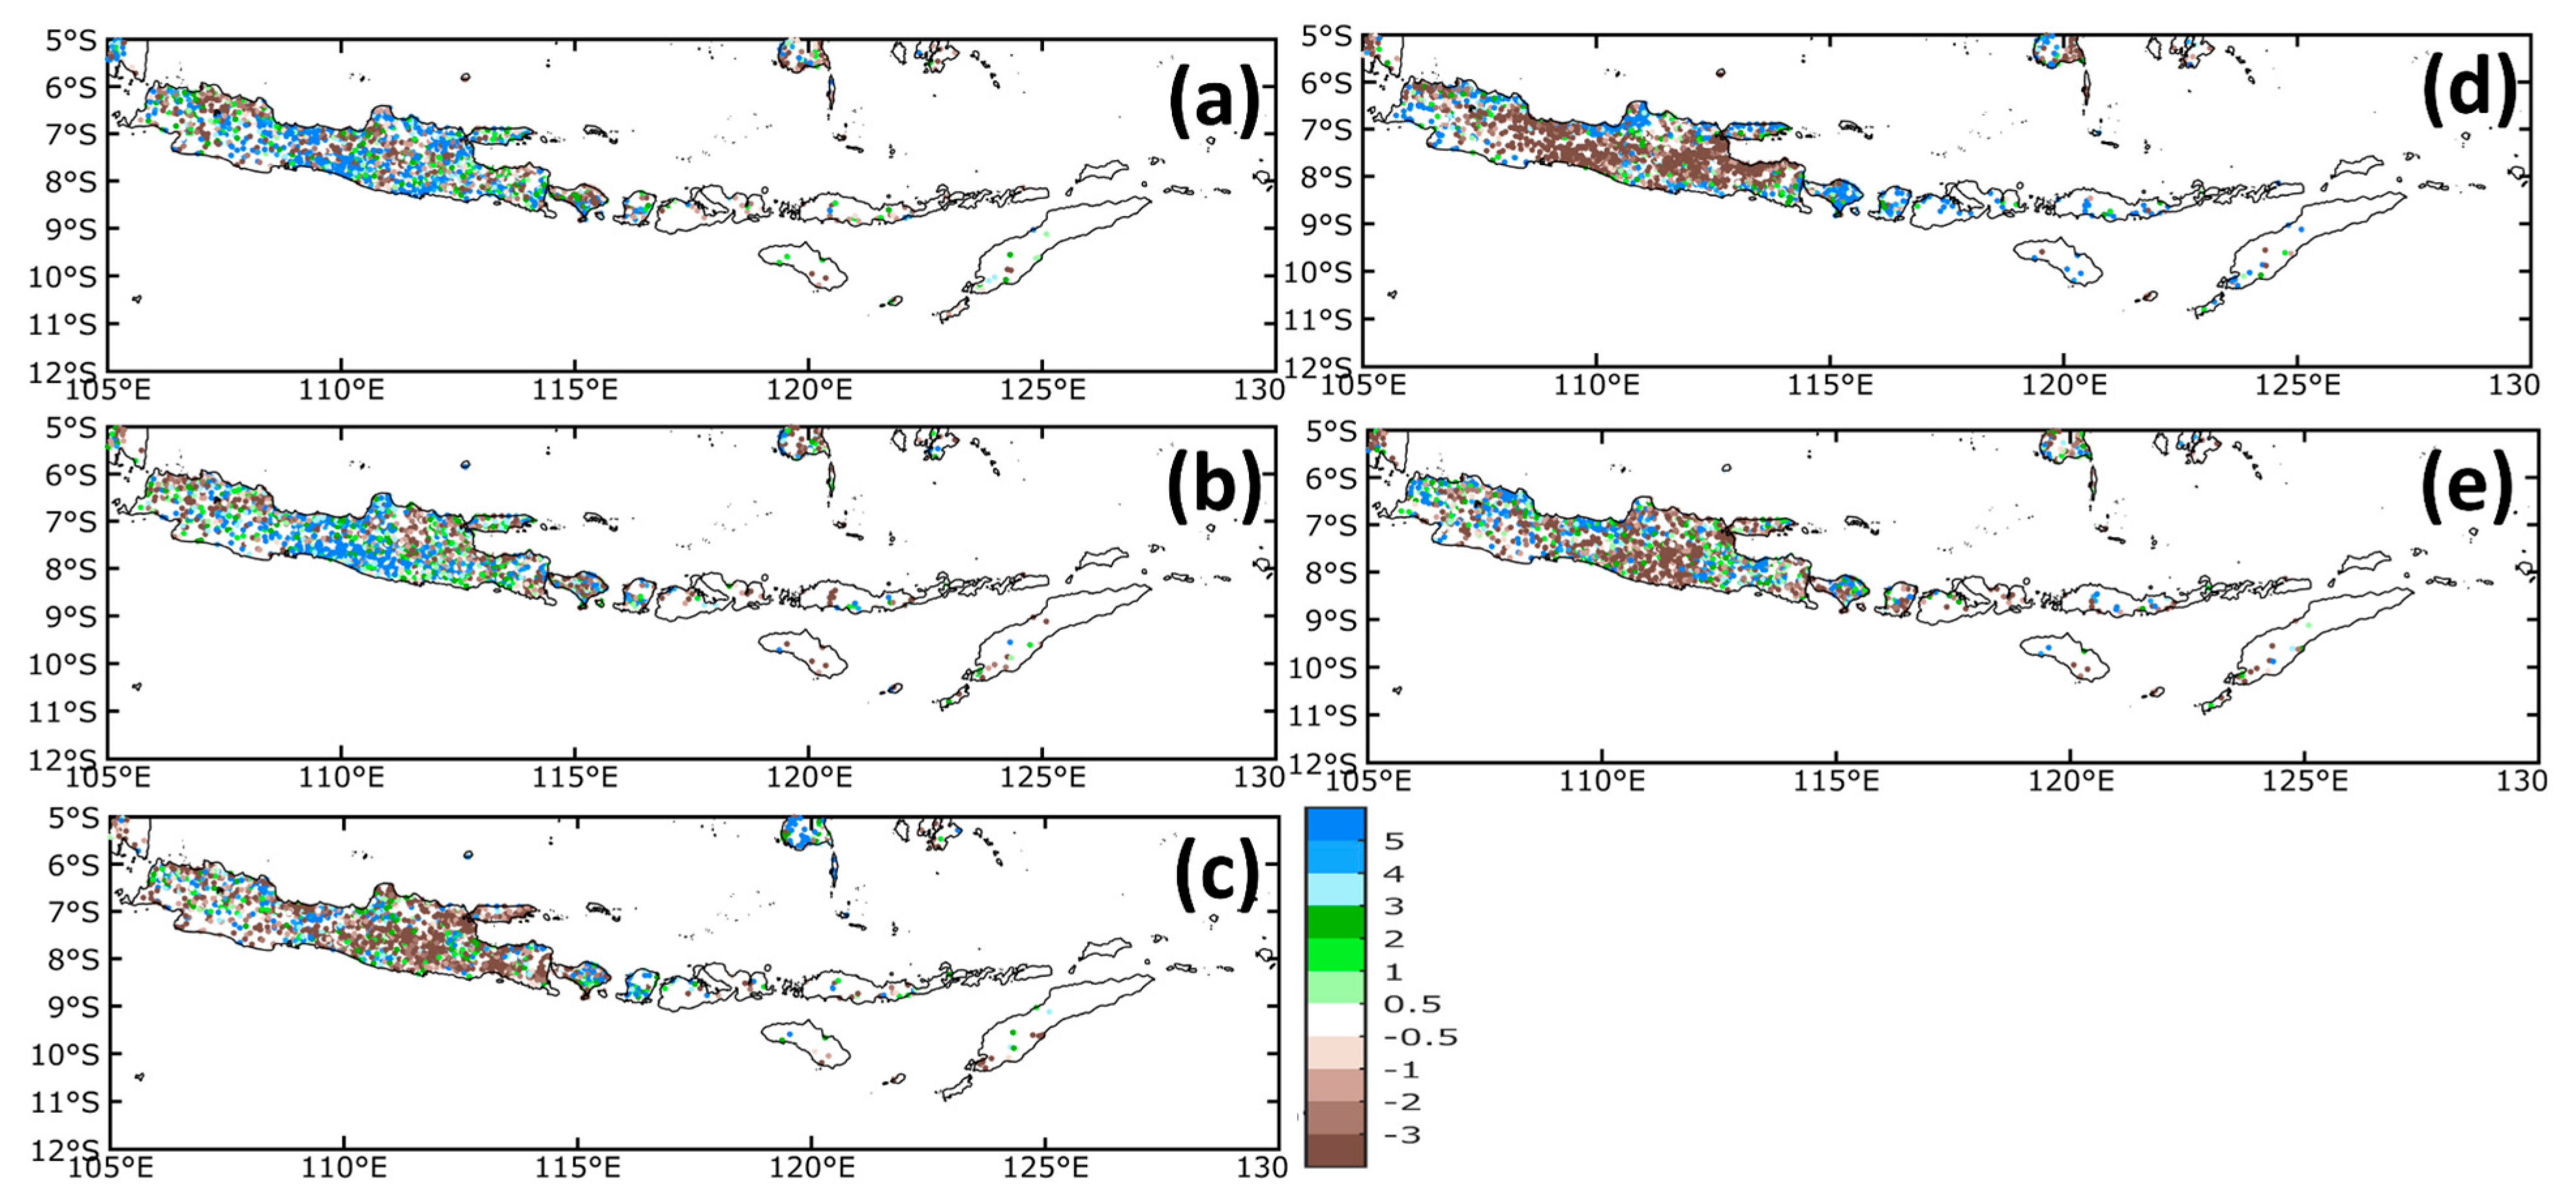
Figure 11.
Based on observational data, the PCE during (a) the active MJO in NDJFM, (b) the inactive MJO in NDJFM, (c) SS during MJO active, and (d) SS during MJO inactive.
Figure 11.
Based on observational data, the PCE during (a) the active MJO in NDJFM, (b) the inactive MJO in NDJFM, (c) SS during MJO active, and (d) SS during MJO inactive.
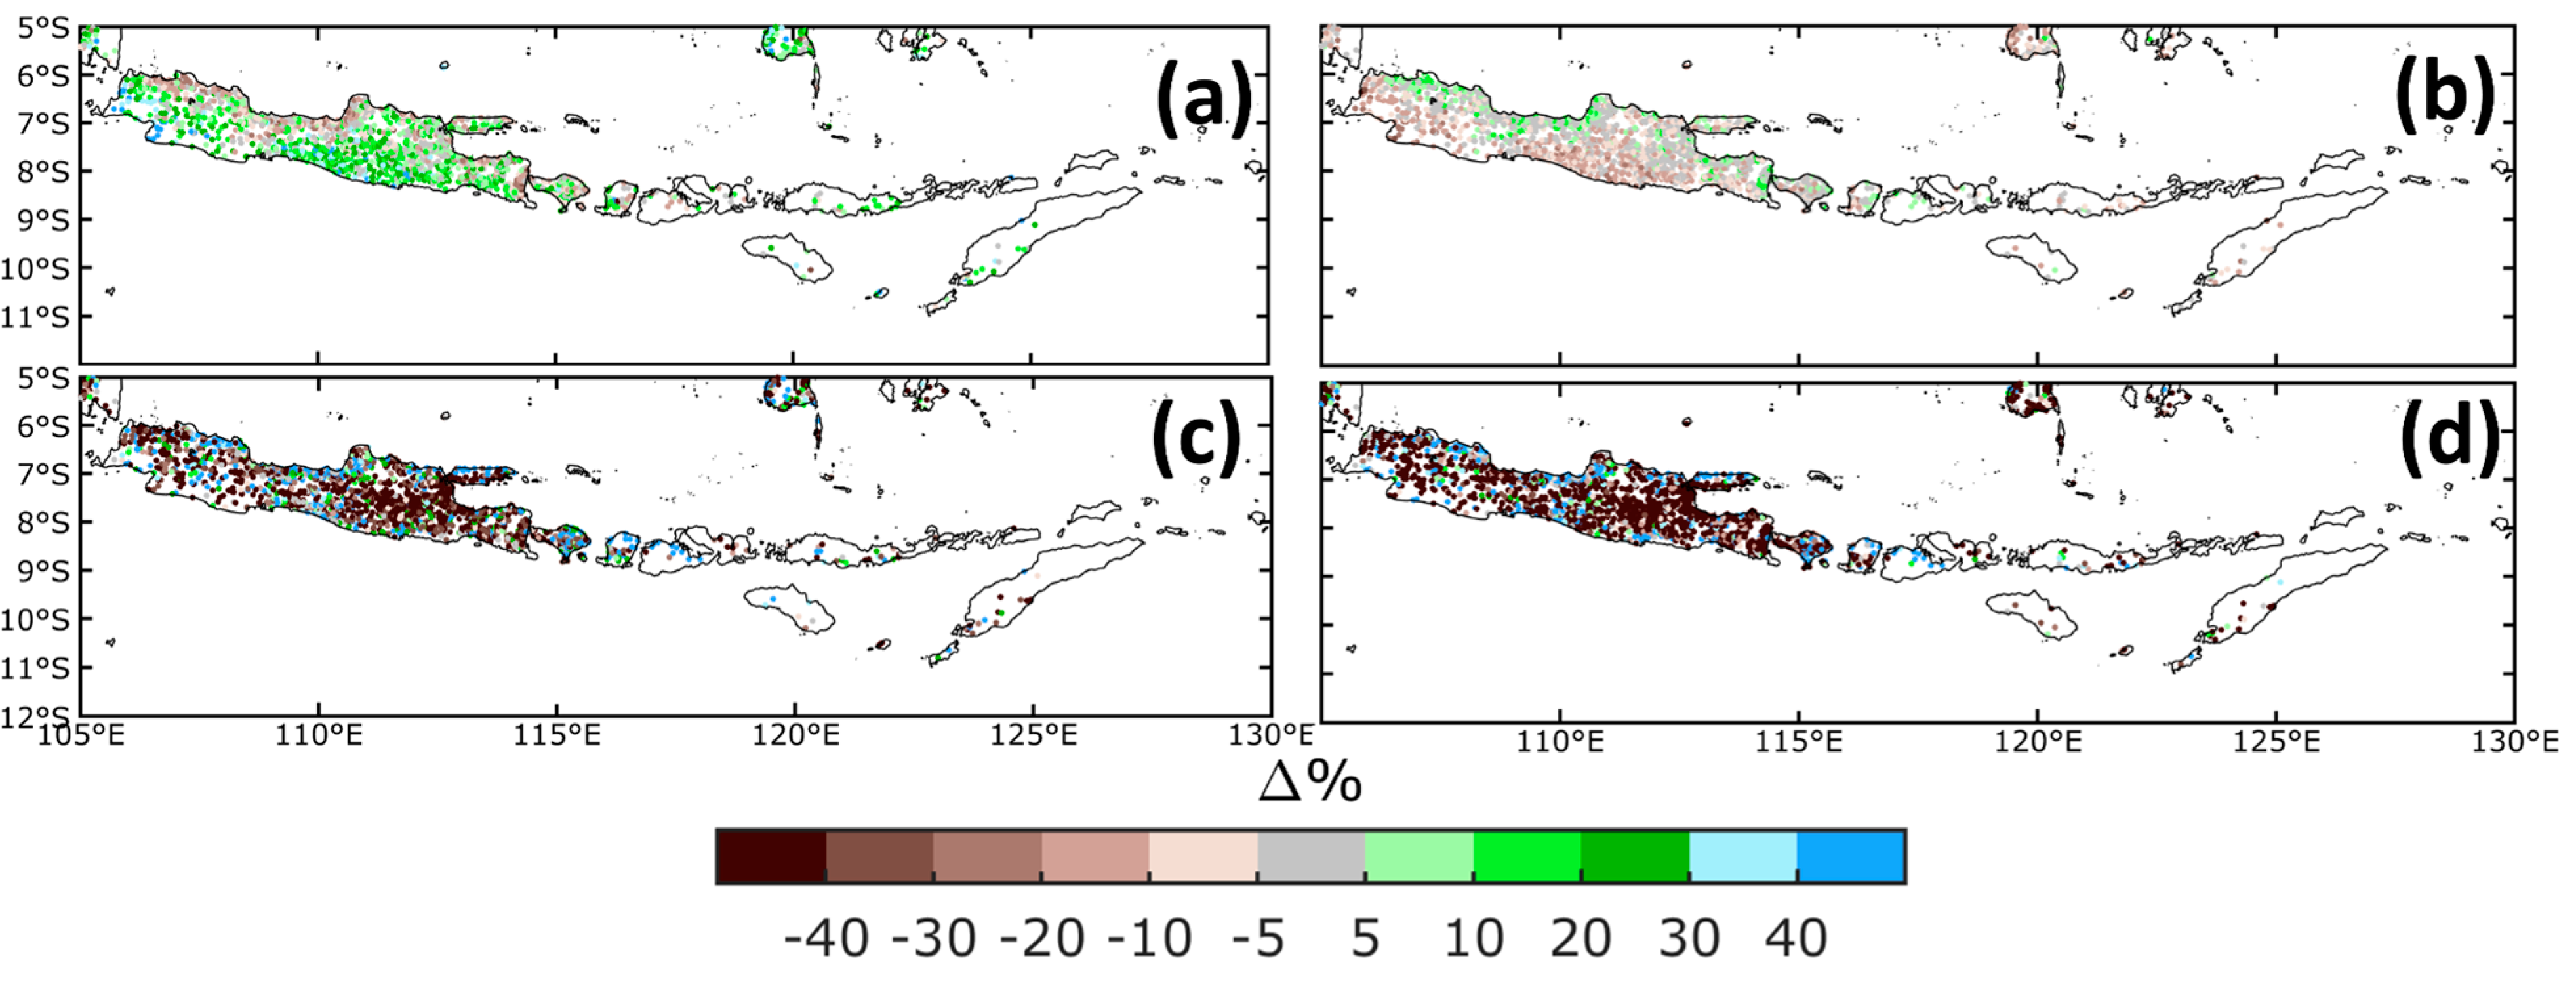
Figure 12.
Box plot and whisker for mean rainfall from all-weather observation stations in the R1 until R9 region during SS events at (a) active MJO, and (b) inactive MJO. SS Event in the x-axis represents the index of the event consecutively.
Figure 12.
Box plot and whisker for mean rainfall from all-weather observation stations in the R1 until R9 region during SS events at (a) active MJO, and (b) inactive MJO. SS Event in the x-axis represents the index of the event consecutively.
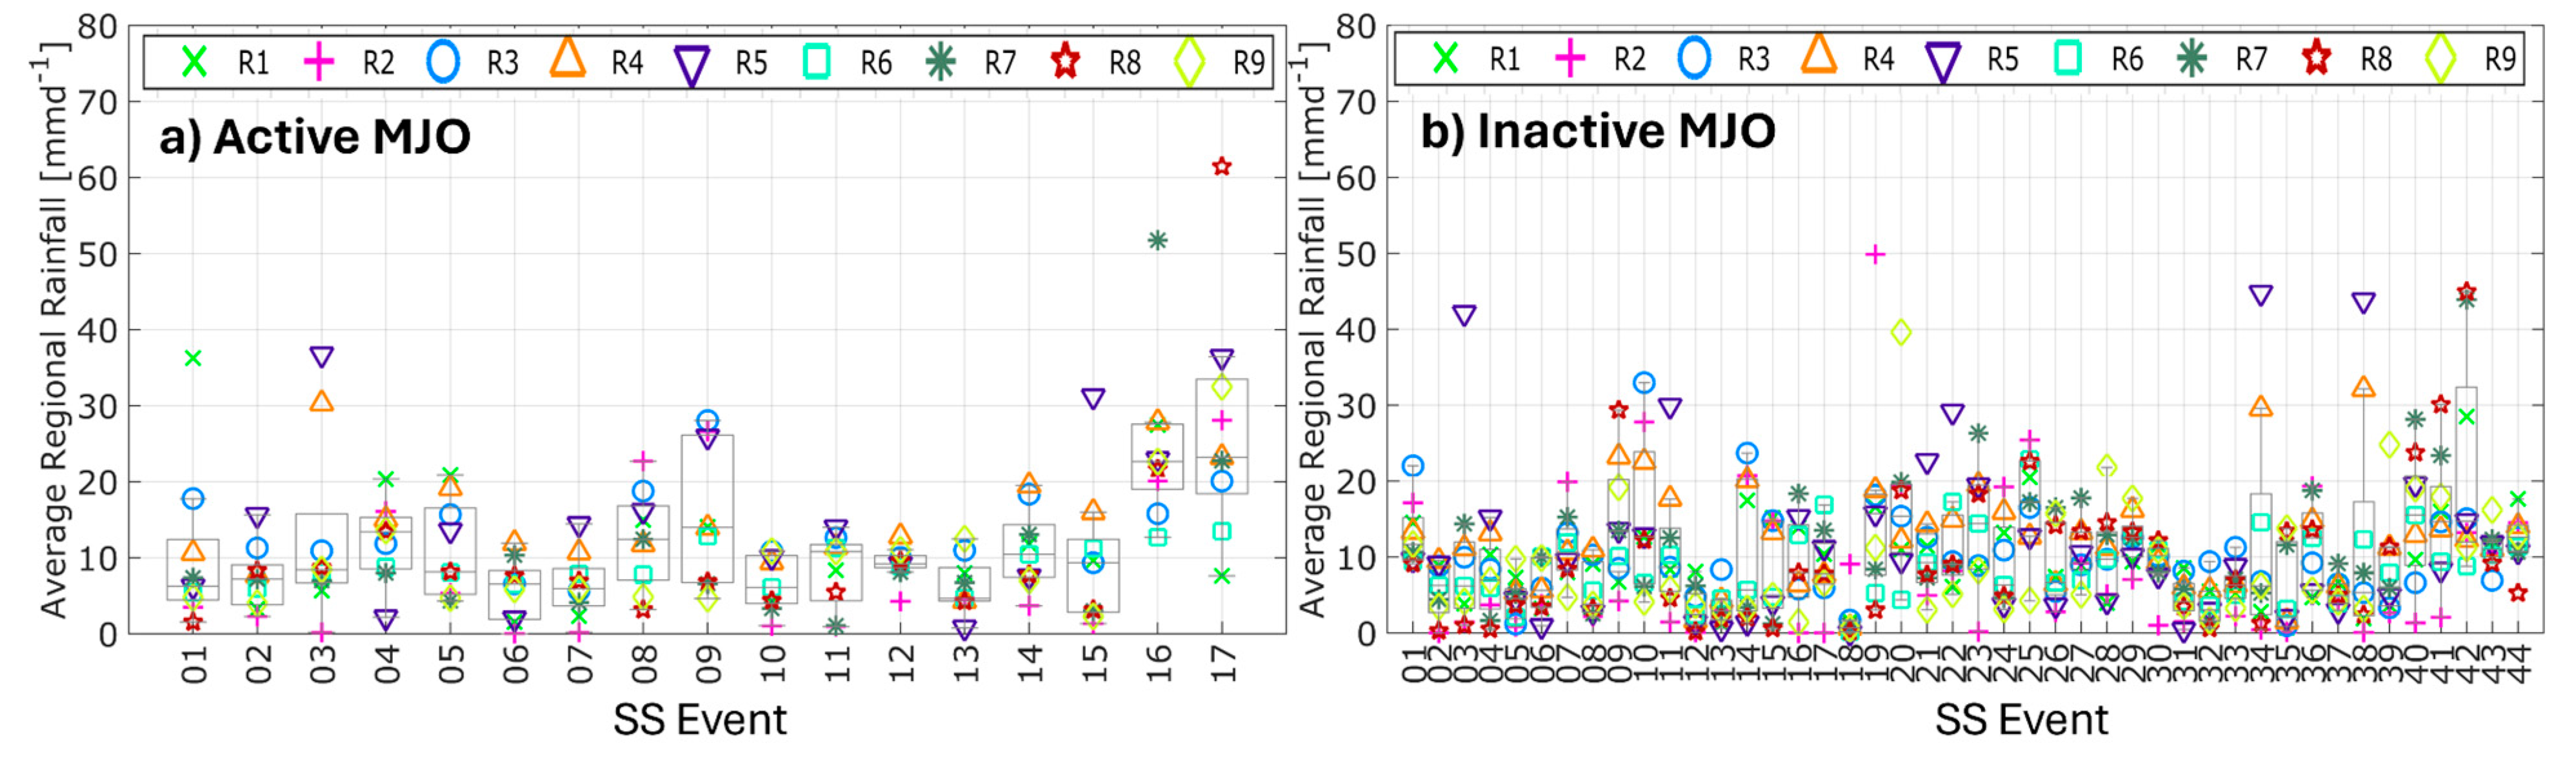
Figure 13.
The latitude-time cross section (average longitude 106–115°E) of mean hourly rainfall (mm/hour) over Java Island on (a) all SS days, (b) SS during active MJO, and (c) SS during inactive MJO. The time-longitude cross section (average latitude at 6–9°S) of mean hourly rainfall (mm/hour) over Java Island on (d) all SS days, (e) SS during active MJO, and (f) SS during inactive MJO. The horizontal box dashed black lines along (a) until (c) indicate the approximate latitudes of Java Island's northern (above) and southern coasts (below). The dashed black lines in (d), (e), and (f) show the approximate boundaries of the R1-R9 region.
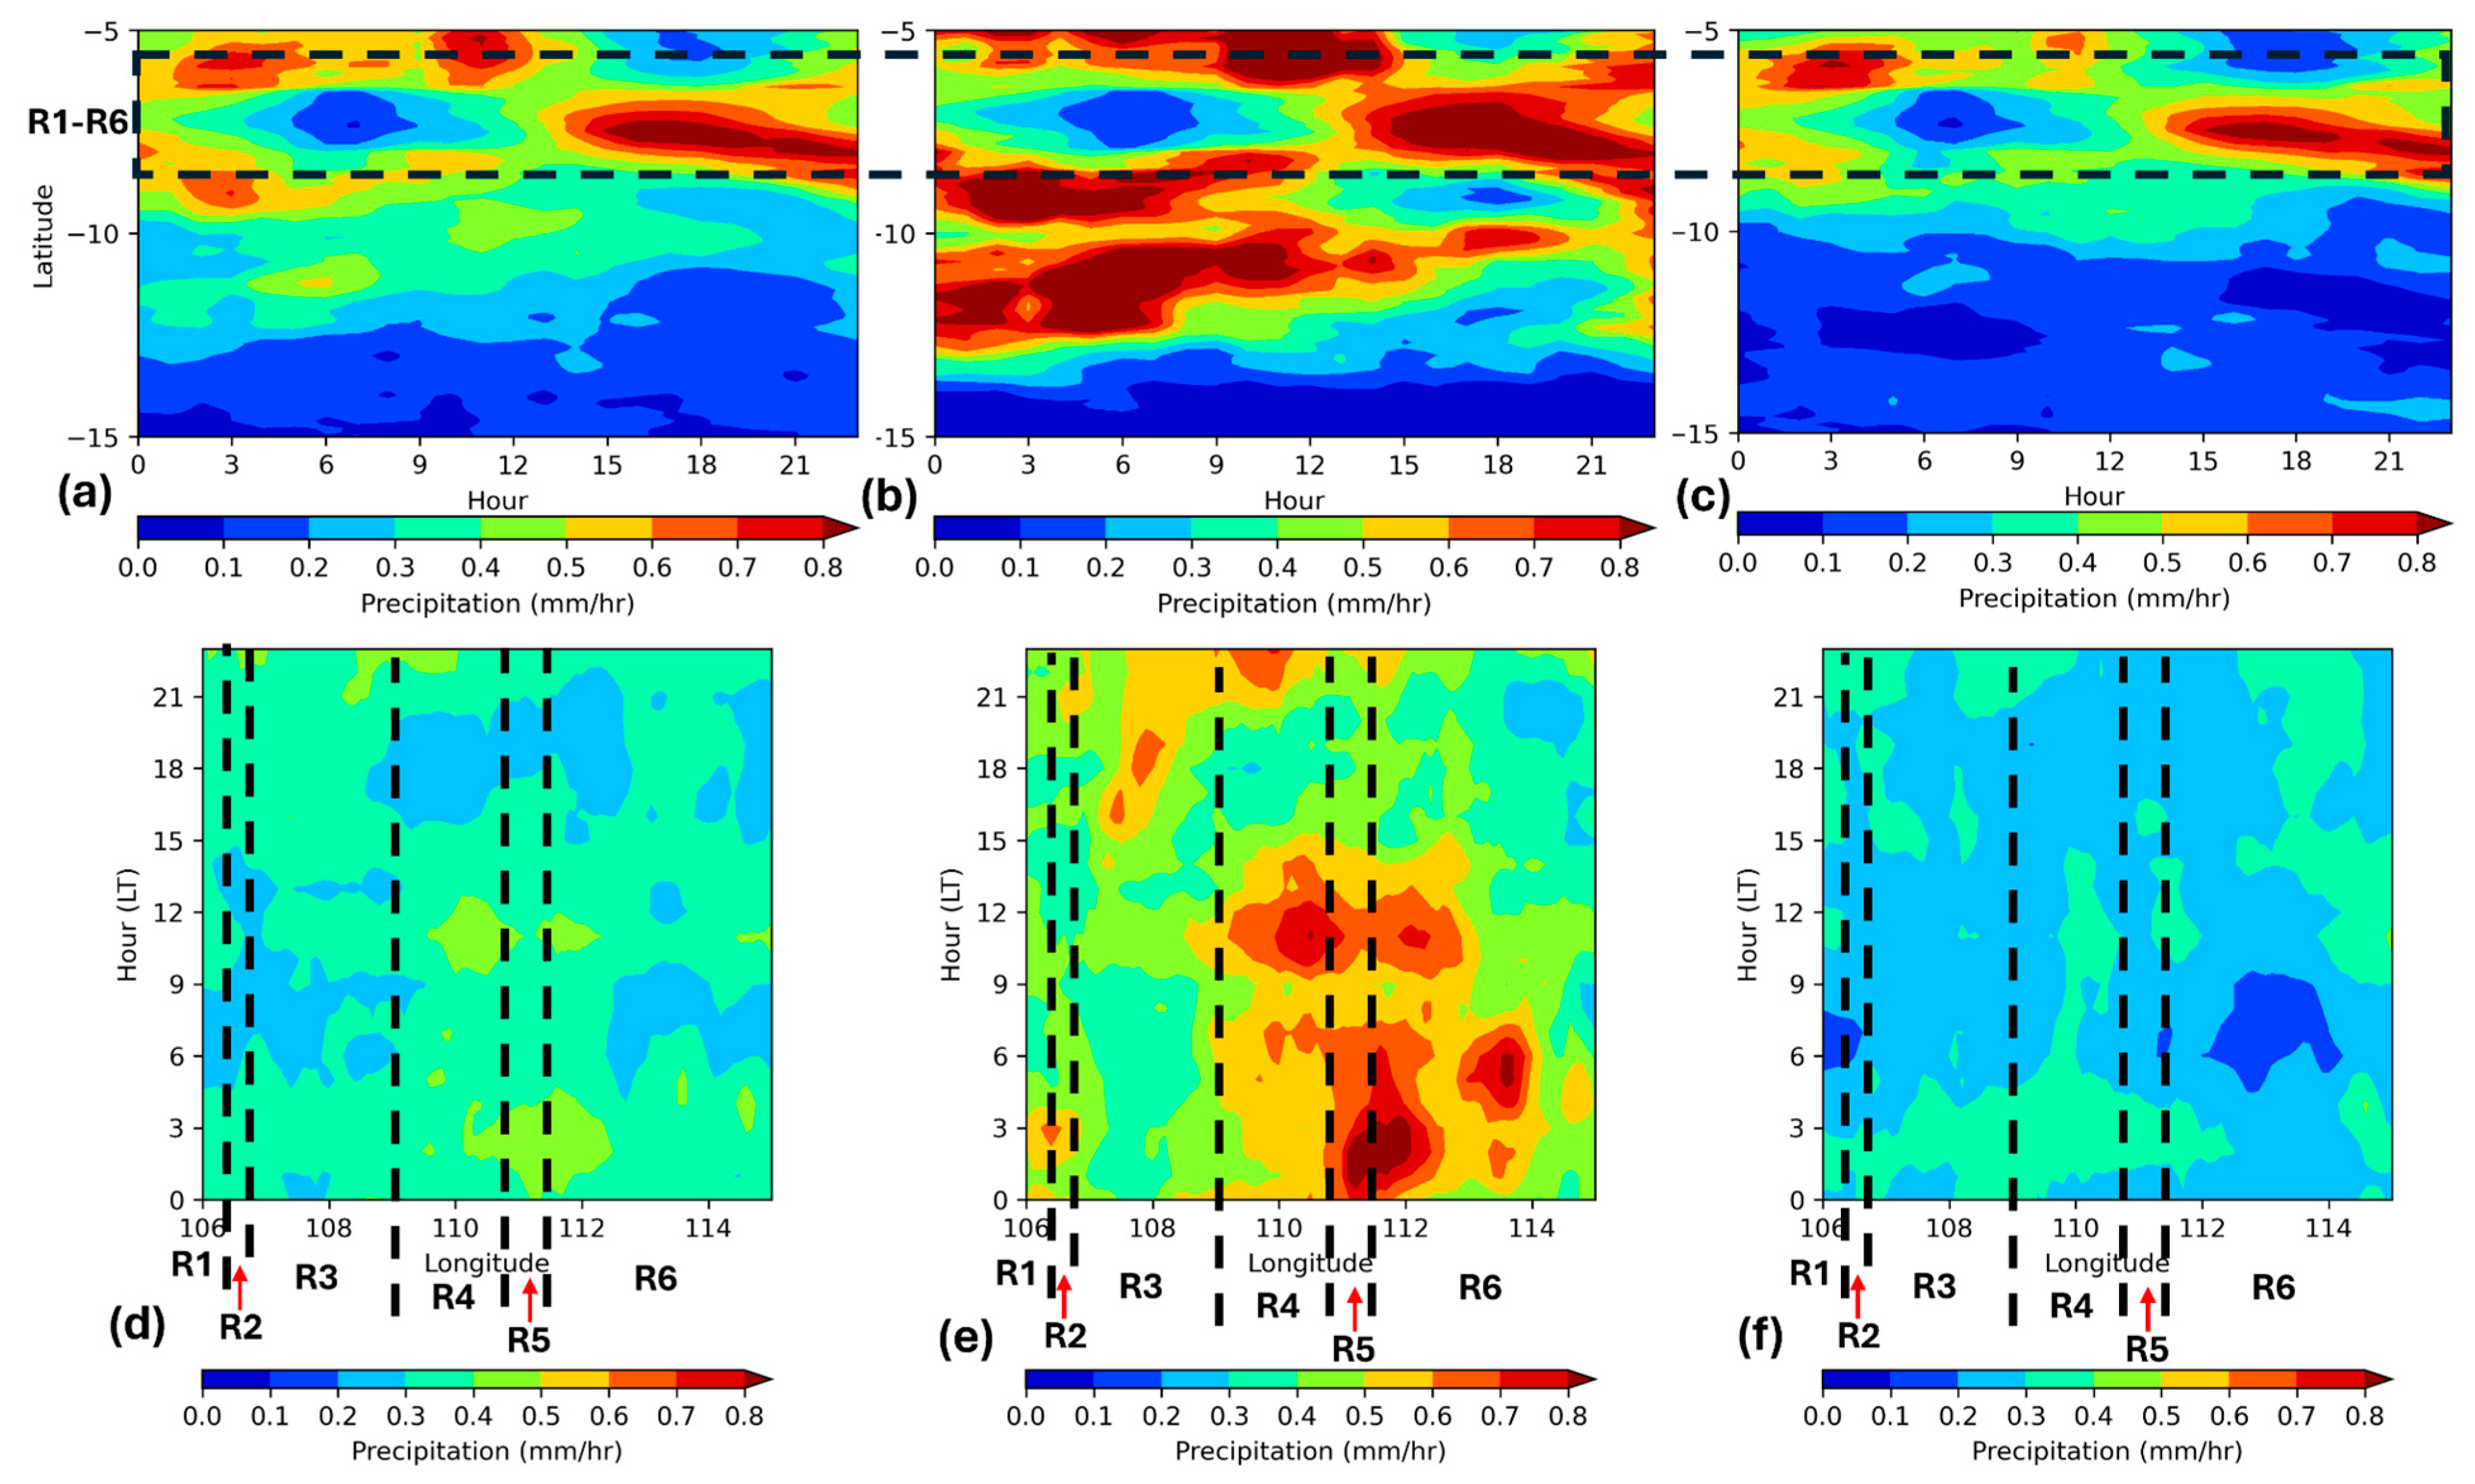
Figure 14.
Illustration of potential interactions between large-scale SS, MJO, and monsoon circulations with local land-sea breeze circulations.
Figure 14.
Illustration of potential interactions between large-scale SS, MJO, and monsoon circulations with local land-sea breeze circulations.
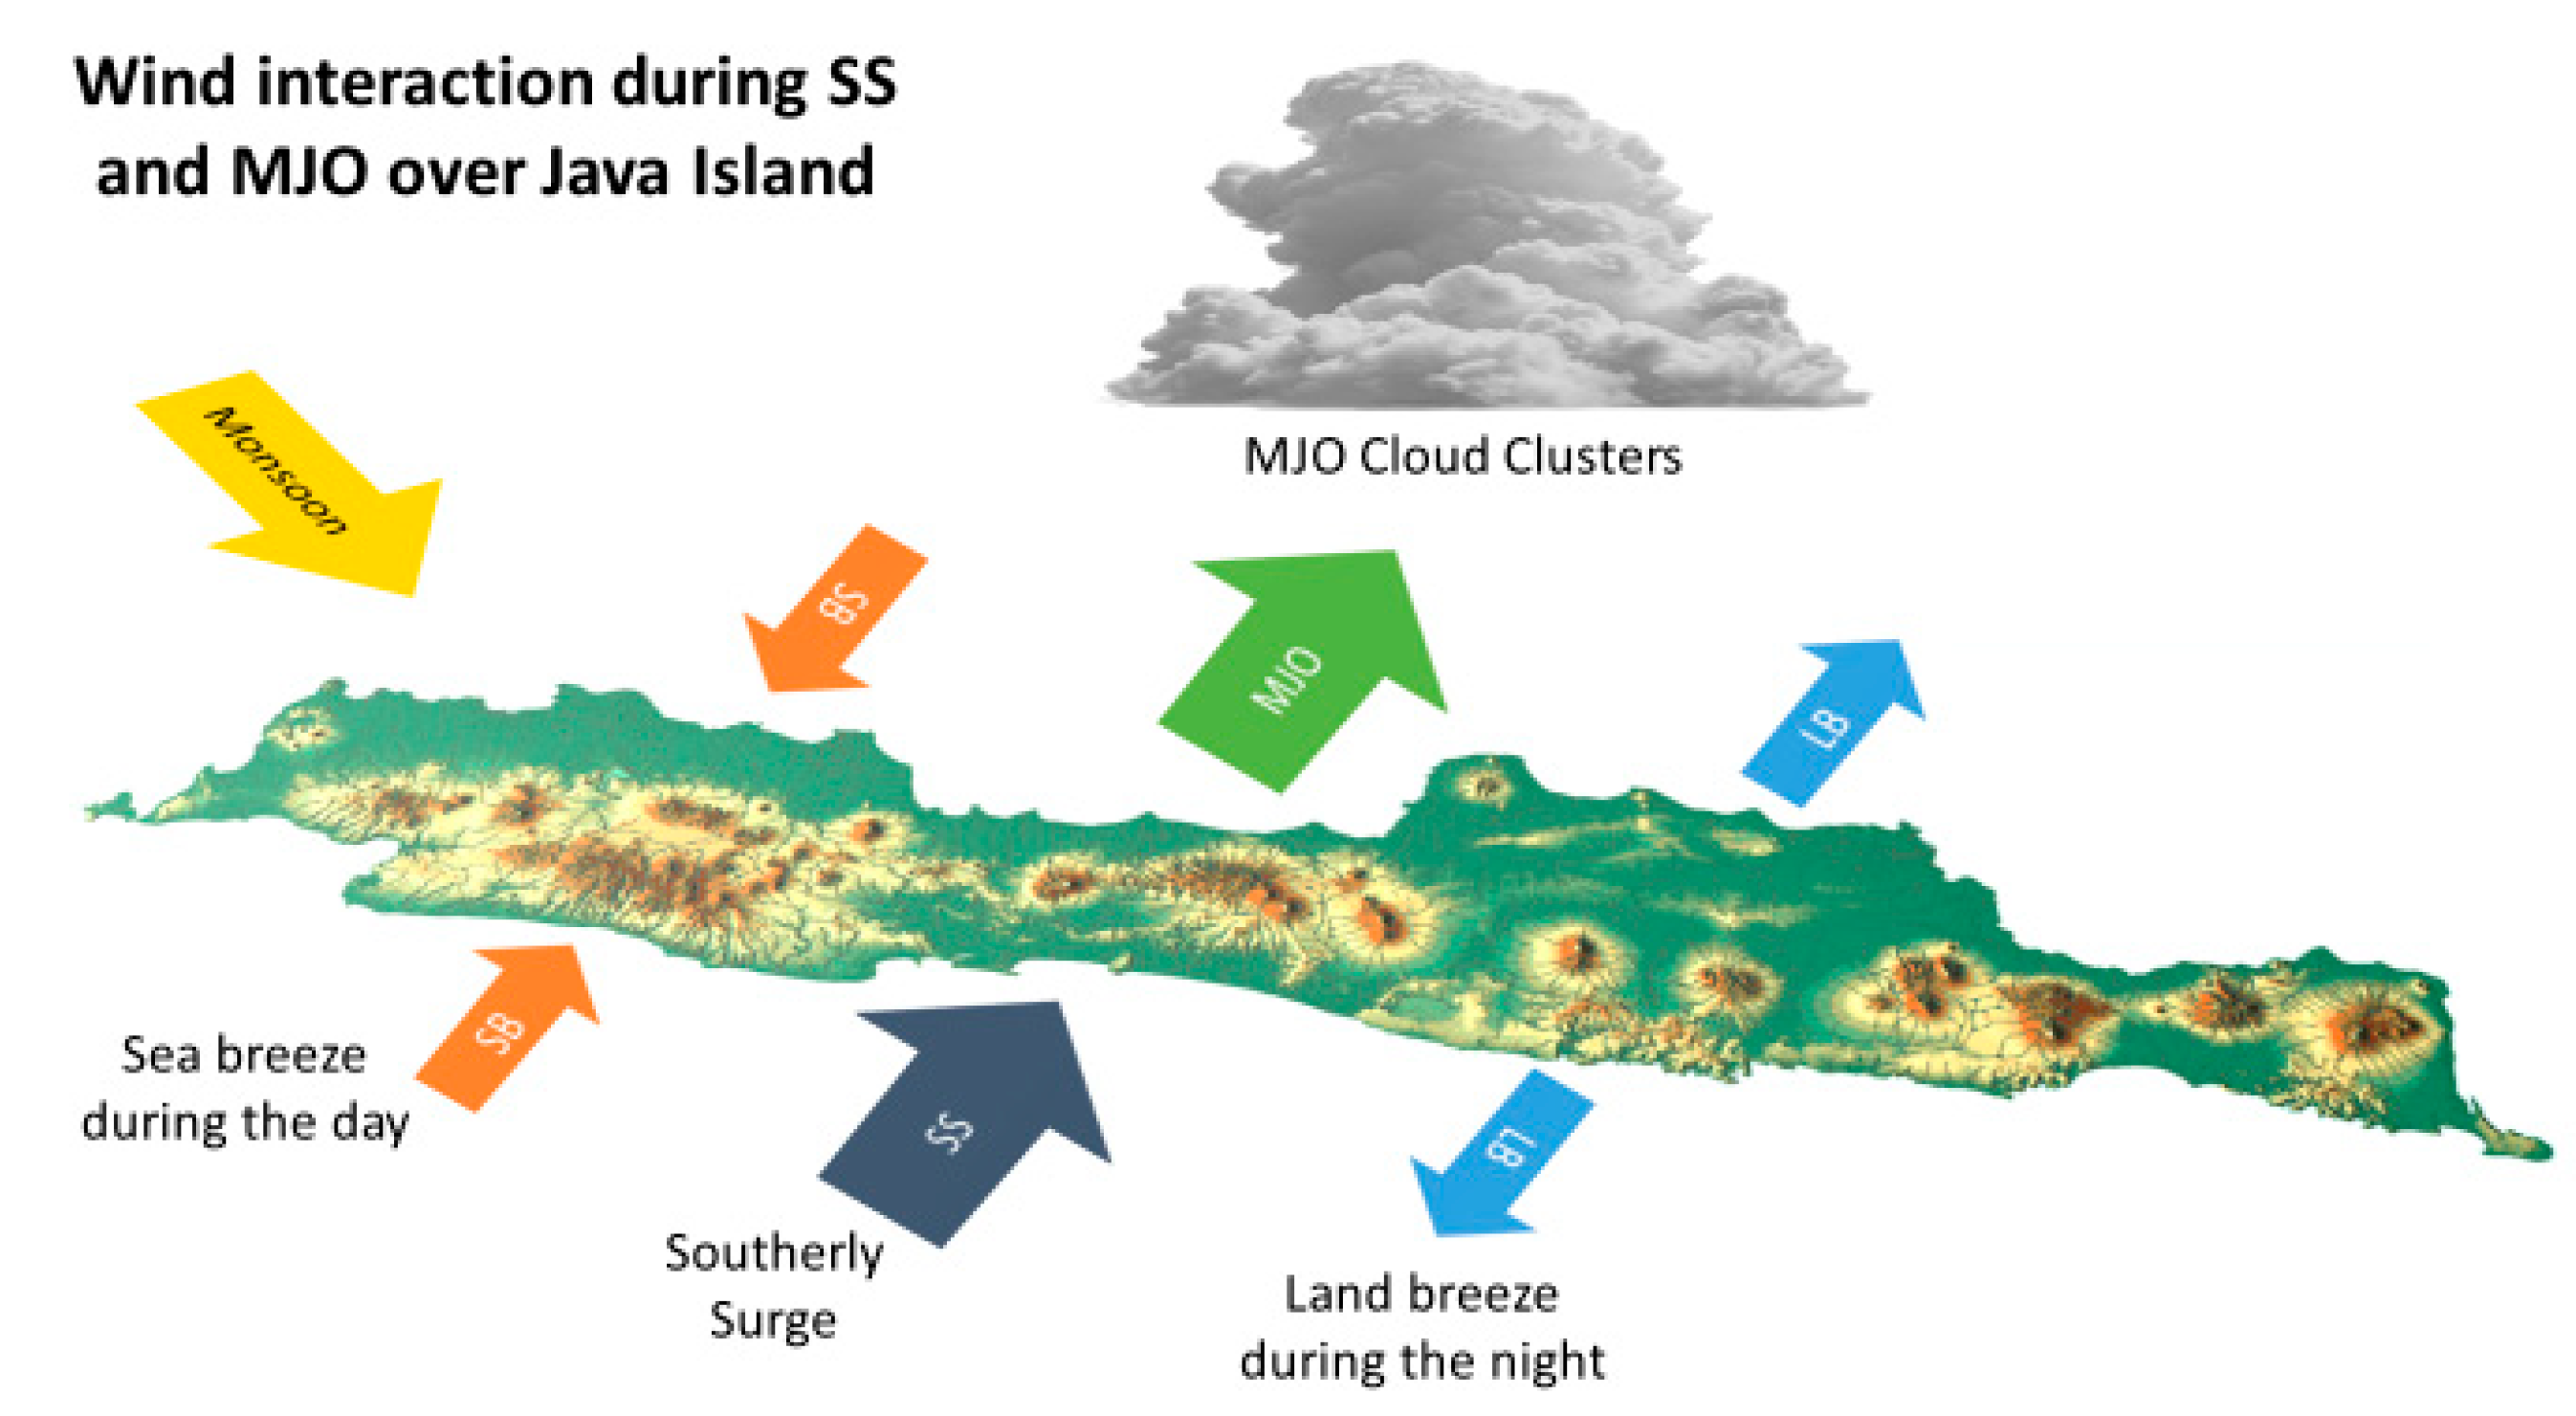
Figure 15.
Diurnal area averaged of GSMaP precipitation (mm/hr) for R1 - R9 during (a) SS in active MJO events; and (b) SS in inactive MJO events.
Figure 15.
Diurnal area averaged of GSMaP precipitation (mm/hr) for R1 - R9 during (a) SS in active MJO events; and (b) SS in inactive MJO events.
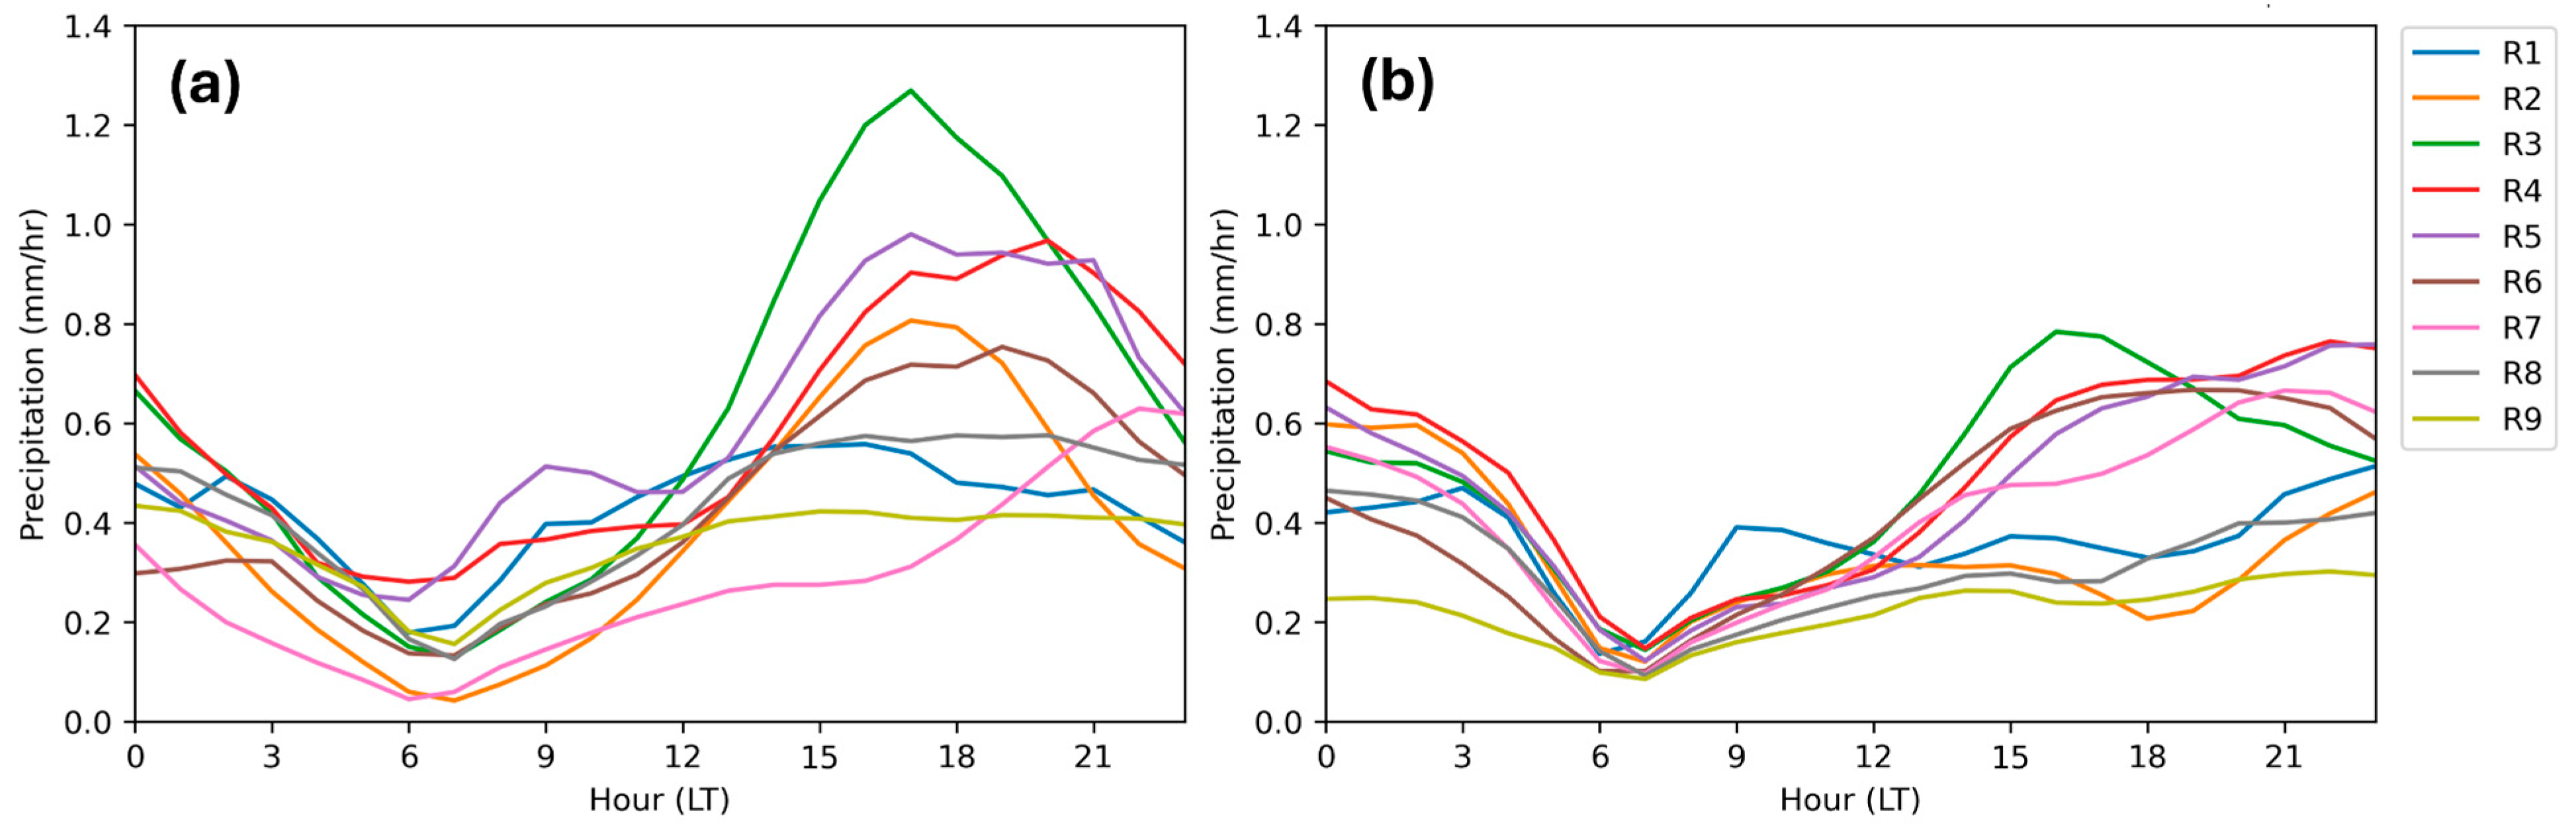
Figure 16.
Composite of integrated water vapor transport (IVT) during a) NDJFM/Seasonal Mean, b) SS event, c) active MJO (NDJFM), d) SS and active MJO, e) inactive MJO (NDJFM) and f) SS and inactive MJO.
Figure 16.
Composite of integrated water vapor transport (IVT) during a) NDJFM/Seasonal Mean, b) SS event, c) active MJO (NDJFM), d) SS and active MJO, e) inactive MJO (NDJFM) and f) SS and inactive MJO.
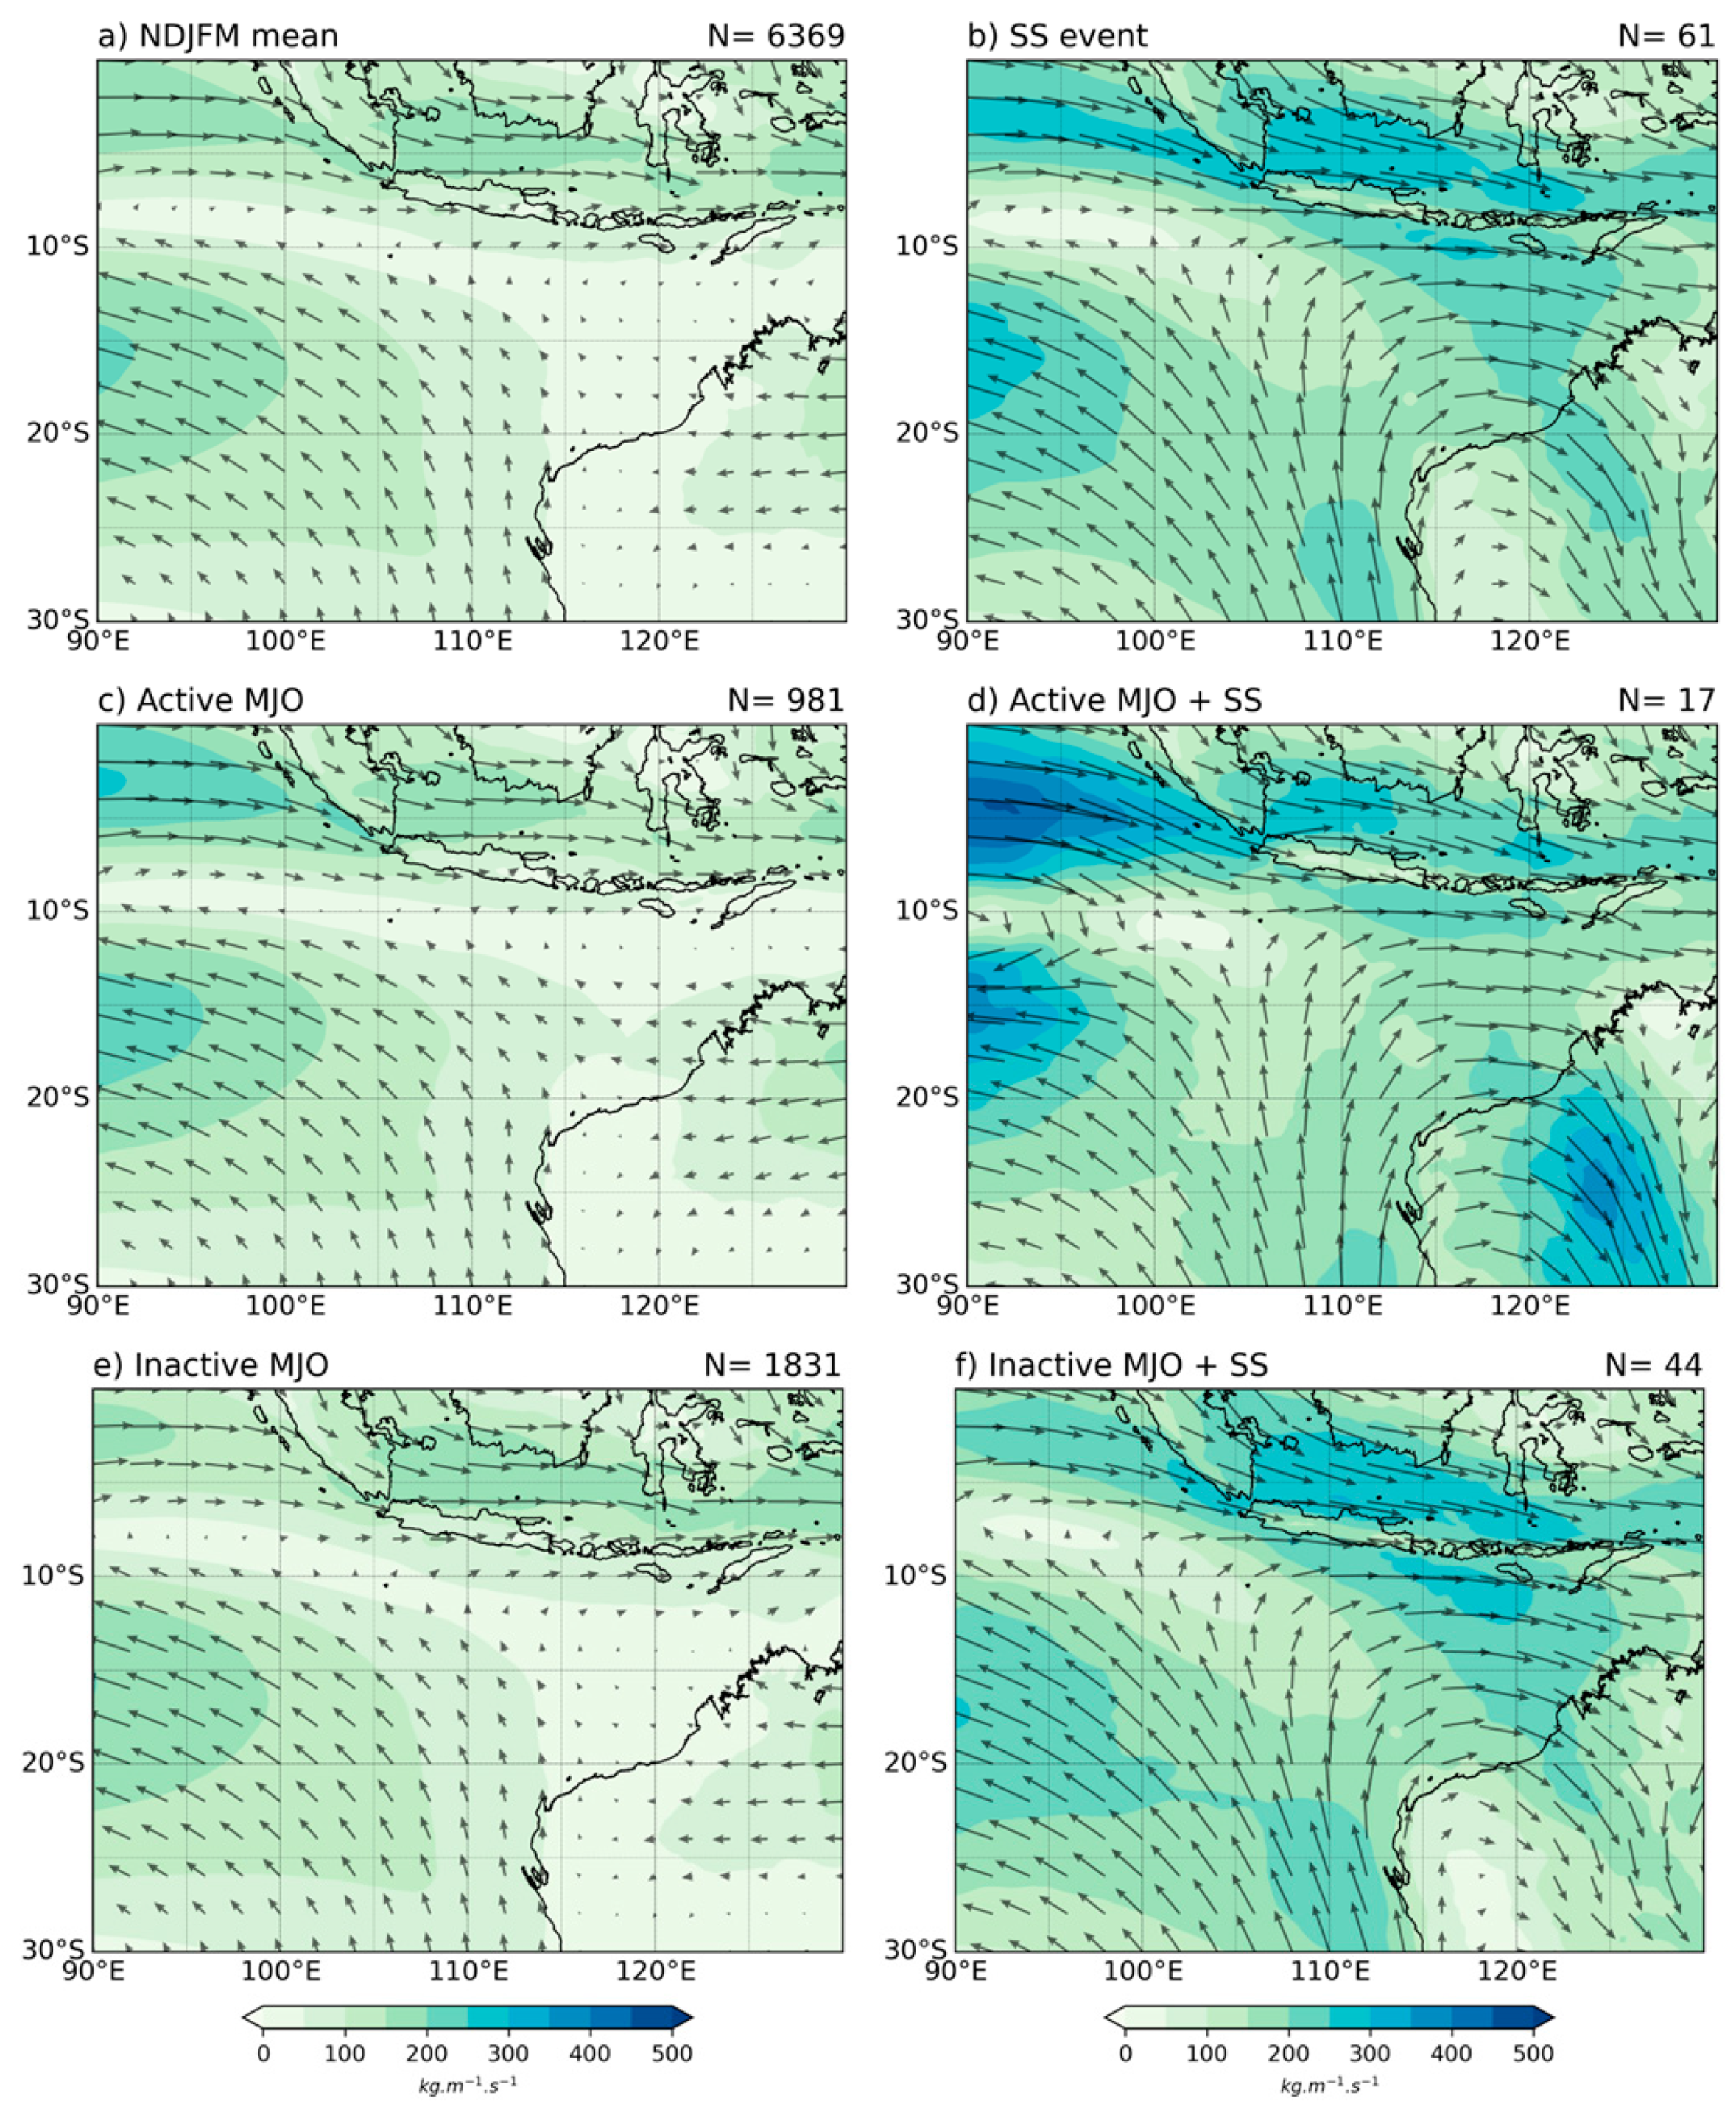
Figure 17.
Anomaly of a) Surface Temperature, b) Dew-point Temperature, c) Meridional Wind, d) CAPE, e) CIN, f) VIMFC over Region 1-9 when SS occur during Active MJO and Inactive MJO.
Figure 17.
Anomaly of a) Surface Temperature, b) Dew-point Temperature, c) Meridional Wind, d) CAPE, e) CIN, f) VIMFC over Region 1-9 when SS occur during Active MJO and Inactive MJO.
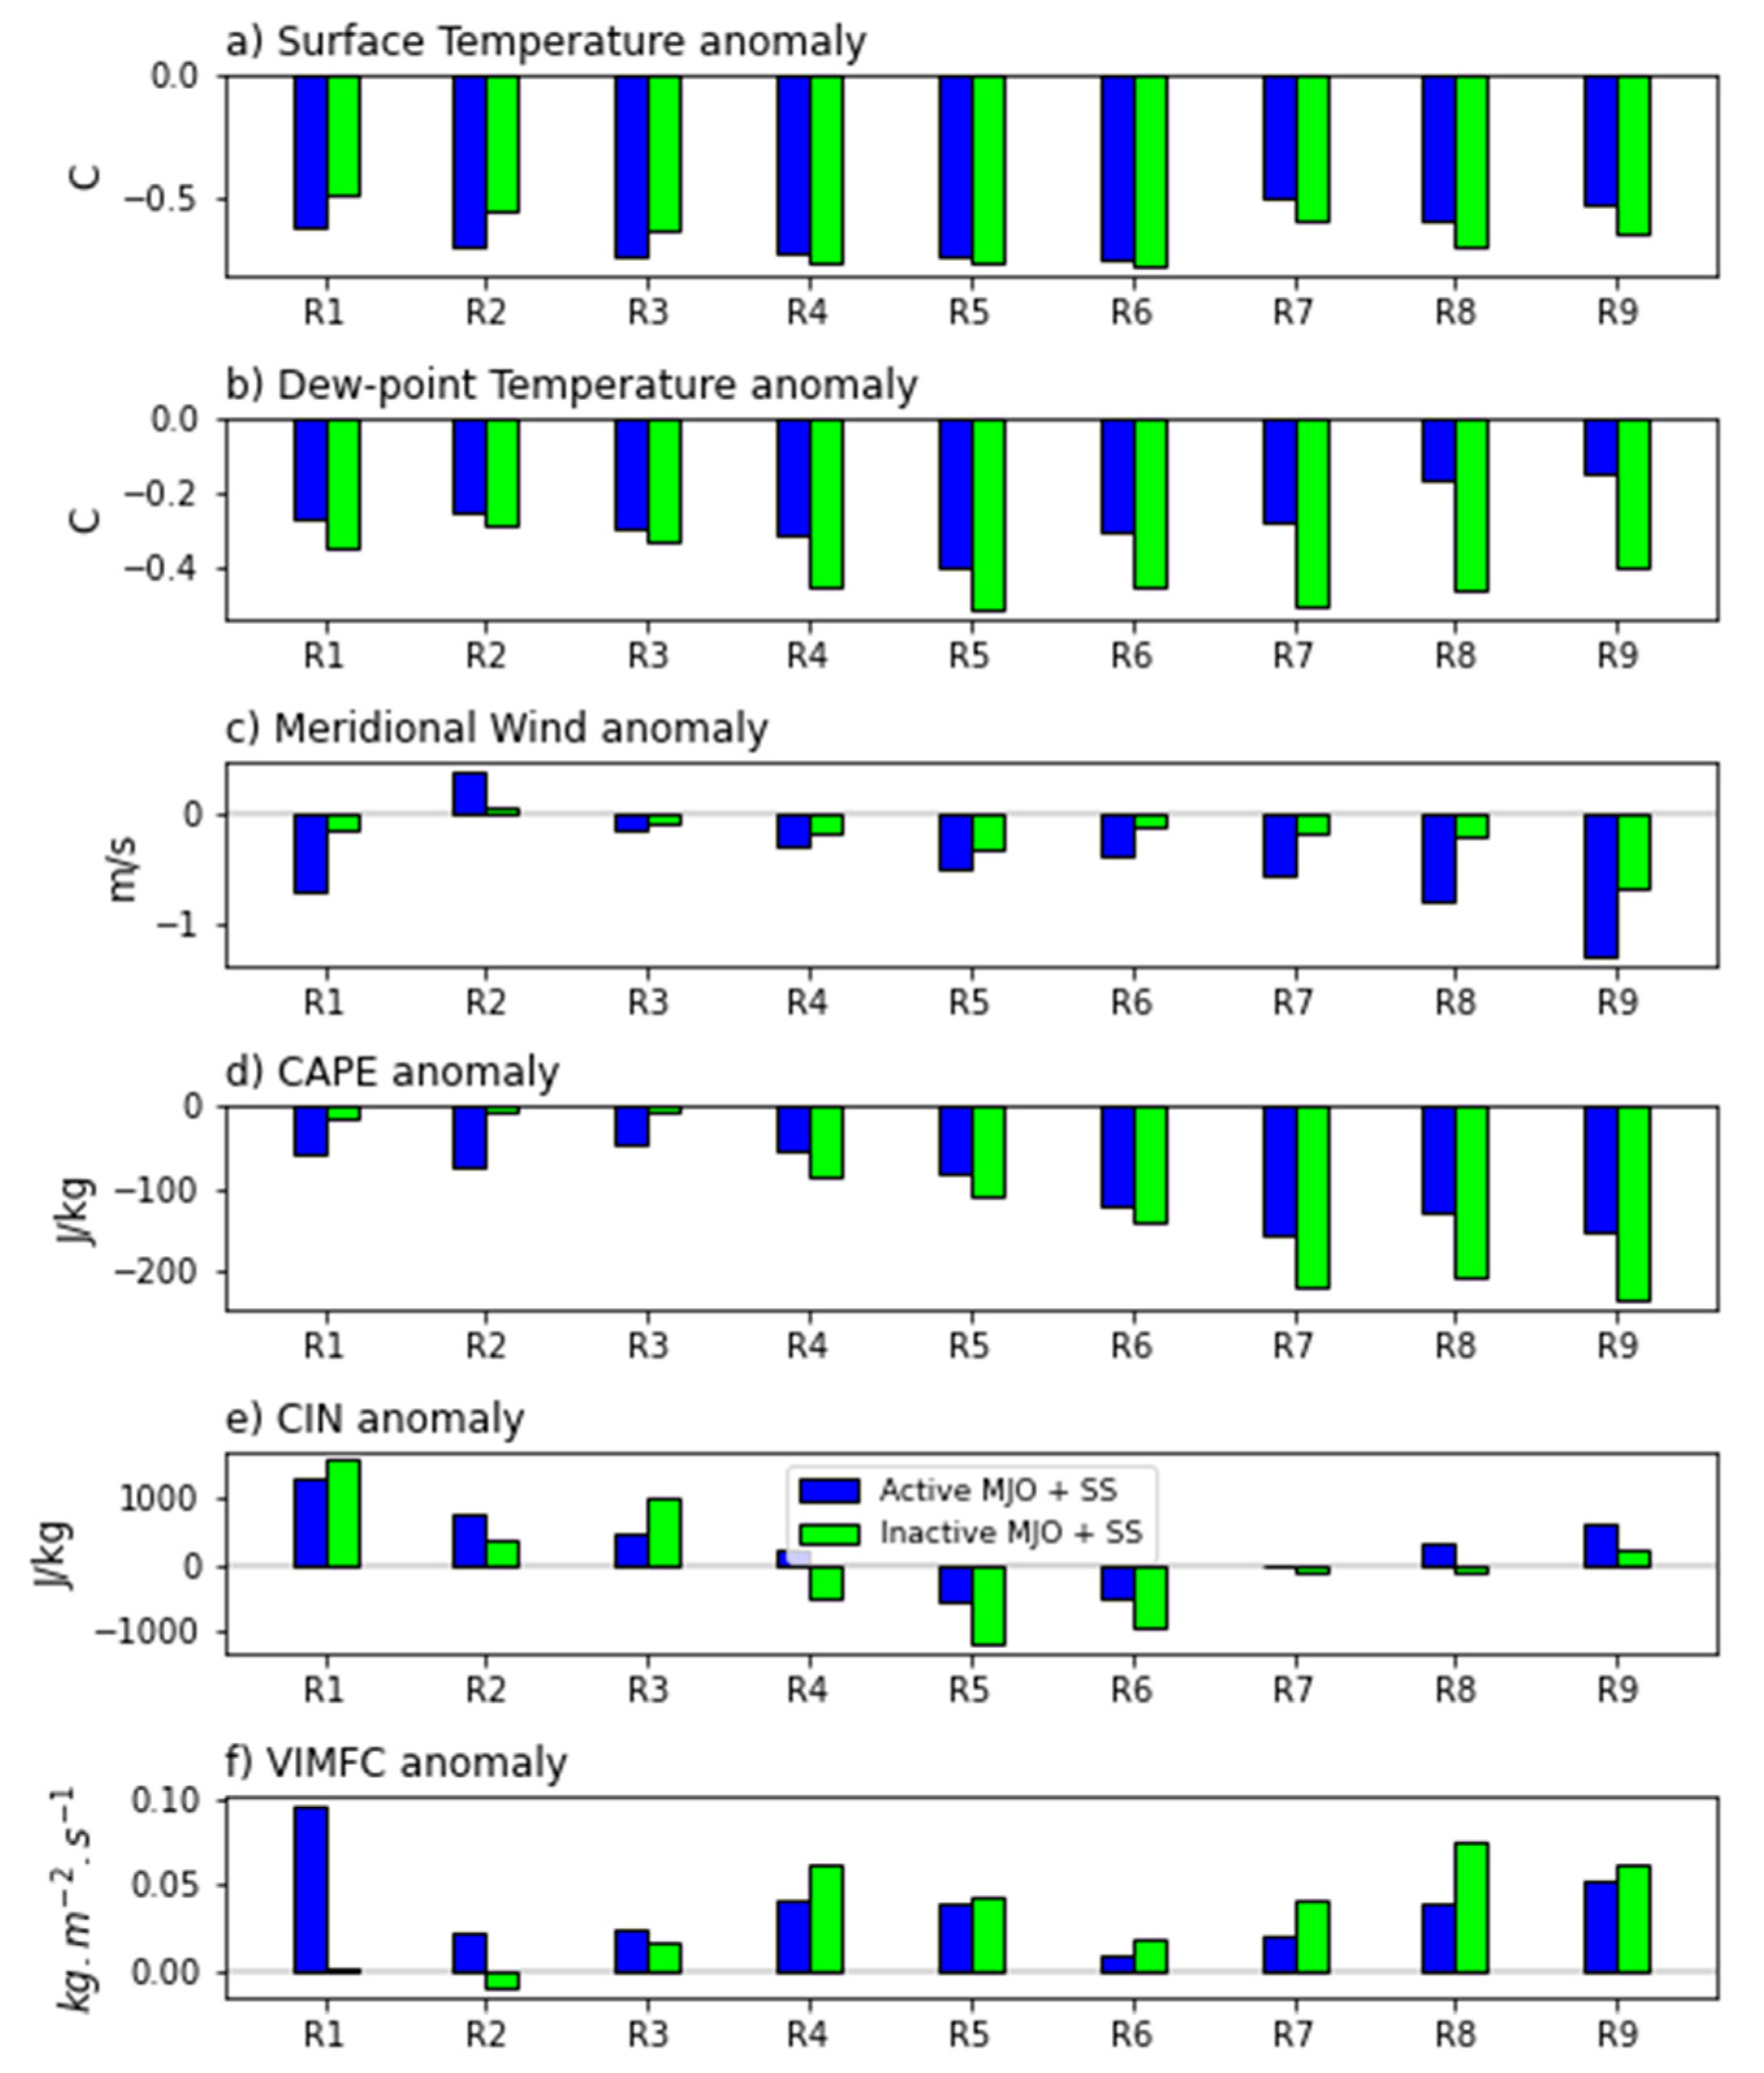
Disclaimer/Publisher’s Note: The statements, opinions and data contained in all publications are solely those of the individual author(s) and contributor(s) and not of MDPI and/or the editor(s). MDPI and/or the editor(s) disclaim responsibility for any injury to people or property resulting from any ideas, methods, instructions or products referred to in the content. |
© 2024 by the authors. Licensee MDPI, Basel, Switzerland. This article is an open access article distributed under the terms and conditions of the Creative Commons Attribution (CC BY) license (http://creativecommons.org/licenses/by/4.0/).
Copyright: This open access article is published under a Creative Commons CC BY 4.0 license, which permit the free download, distribution, and reuse, provided that the author and preprint are cited in any reuse.


