Submitted:
18 June 2024
Posted:
20 June 2024
You are already at the latest version
Abstract
Objective: This research was aimed to estimate the anti-fatigue effects of arecoline and elucidate its underlying mechanisms using a murine model of central fatigue precipitated by sleep deprivation (SD).
Methods: Seventy-two male C57BL/6 mice were randomly allocated into six groups: a control group, a SD-induced fatigue model group, a group receiving Rhodiola Rosea capsules (2.5 mg/kg), and arecoline groups administered low, medium, and high doses (10, 20, and 40 mg/kg, respectively). Following 28 days of continuous administrations, the effects of arecoline on the mouse fatigue-related behaviors was assessed by the behavioral tests, including grip strength, rotarod performance, and weight-bearing swimming endurance. Enzyme-linked immunosorbent assays (ELISAs) were utilized to measure the levels of the relevant biochemical markers. Western blotting was employed to quantify the expression of nuclear factor erythroid 2-related factor (Nrf2), Kelch-like ECH-associated protein 1 (Keap1), heme oxygenase 1 (HO-1), sequestosome-1 (p62), and NADPH quinone oxidoreductase 1 (NQO1) in the gastrocnemius muscle.
Results: Arecoline administration notably enhanced grip strength, delayed the onset of fatigue as evidenced by extended latencies in rotarod tests, and increased the duration of weight-bearing swimming in mice. In the elevated plus maze, arecoline significantly reduced both the number of entries and the total distance traveled in the open arms. Arecoline markedly decreased serum levels of creatine kinase, blood urea nitrogen, lactate dehydrogenase, triglycerides, and cholesterol, while elevated total testosterone, lactate dehydrogenase, and immunoglobulin G levels. Furthermore, it significantly increased superoxide dismutase(SOD), catalase(CAT), and glutathione peroxidase activity in the gastrocnemius muscle, reduced malondialdehyde levels, augmented hippocampal SOD and CAT activity, and elevated glycogen stores in both liver and muscle tissues. Neurotransmitter levels were significantly increased, cytokine levels were markedly reduced, and the expression of Nrf2, Keap1, NQO1, p62, and HO-1 in brain tissue was significantly upregulated.
Conclusion: The current study for the first time demonstrated that arecoline has significant anti-fatigue activity, and its mechanism of action is related to elevate the levels of glucose and lipid metabolism, relieve oxidative stress damage, inhibit neuroinflammatory response, regulate neurotransmitter levels and Keap1/Nrf2/HO-1 signaling pathway. The current study provides a new insight into the potential of arecoline in prevention and improvement of fatigue.
Keywords:
Arecoline
; Anti-fatigue
; Glycolipid metabolism
; Oxidative stress
; Neurotransmitter
1. Introduction
Fatigue is defined as the inability of an organic physiological process to maintain its function at a specific level and/or to maintain a predetermined intensity of exercise [1]. Fatigue emerges as a predominant symptom of sub-health, representing a pre-disease condition and a harbinger of potential pathologies. It triggers a cascade of physiological responses including sleep deprivation, endocrine imbalances, metabolic dysfunctions, and immune impairments. The modern lifestyle, characterized by fast-paced living, stress, unhealthy dietary habits, irregular routines, sleep deprivation, sedentary behavior, and persistent negative emotions, is exacerbating the prevalence of sub-health conditions. Chronic fatigue can eventually lead to serious health problems such as accelerated aging, anxiety, depression, and neurodegenerative diseases such as cancer and Parkinson’s, significantly reducing an individual’s quality of life and productivity at work [2].Research shows that 12% of middle school students in China suffer from chronic fatigue [3]. The current pharmacological solutions, such as cerebral cortex stimulants, can offer temporary relief of fatigue, while their potential for adverse effects like convulsions, mental disturbances, and dependency restricts their utility. Therefore, it is urgent to seek the more safe and effective anti-fatigue compounds and elucidate their mechanisms of action for developing the anti-fatigue nutritional health products to meet the nutritional needs of modern people.
Food and drug homologous substances have the characteristics of both medicine and food, which is a special resource in China and has great potential for exploitation. With the increase of health awareness and the pursuit of health, food with dual medicinal and nutritional value caters to the preferences of modern people. Areca catechu L., is an evergreen tree of Areca genus of the palm family (Palmaceae) and one of the cash crops in the south tropical and subtropical areas of China. The dried, mature seeds of it are called areca nut. The fresh fruits and the dried processed products are its main food routes. In addition, Areca catechu L. own a wide array of bioactive actions, such as anti-inflammatory, antiviral, antioxidant [4,5], anti-aging, antidepressant, antihypoxic [6], antithrombotic [7], as well as aiding in blood sugar reduction [8,9], vascular protection [10] and gastrointestinal enhancement [11,12], which promotes it esteemed as the foremost among the "four southern medicines" of China. As one of the important active substances in areca nut, alkaloids exhibit the potent biological actions, particularly on the nervous and digestive systems [13,14,15].The primary alkaloids, including arecoline and its derivatives, constitute approximately 0.3% to 0.7% of the total content[16,17].It is reported that the extract of Areca catechu L can enhance the cognitive function, elevate the antioxidant capacity of brain tissue and reduce the signs of tissue aging in mice, showing anti-aging effects [18]. Furthermore, our previous findings showed that arecoline has the neuroprotective activities both in lipopolysaccharide (LPS) induced BV2 inflammatory response in mouse microglia [19] and H2O2-induced oxidative stress damaged model in SH-SY5Y cells, and elucidated its mechanisms related to the antioxidation and anti-apoptosis [20]. However, the anti-fatigue effect of arecoline has not yet been reported. In order to further explore the biological activity of arecoline and elucidate its mechanisms, the present study was conducted to determine whether arecoline could improve the fatigue induced by sleep deprivation through modulating the antioxidant system and attenuating the inflammatory response.
2. Materials and Methods
2.1. Materials
Arecoline (63-75-2, No.:A14660) was supplied by Shanghai Jizhi Biochemical Technology Co., Ltd (Shanghai, China). Rhodiola Rosea capsules is provided by Shanxi Jiahe Phytochemistry Co., Ltd (Xian, Shanxi, China). Commercial sandwich enzyme-linked immunosorbent assay (ELISA) kits for 5-hydroxytryptamine (5-HT), dopamine (DA), norepinephrine (NE), acetylcholine (Ach), gamma-aminobutyric acid (GABA), tumor necrosis factor (TNF-α), interleukin-1β (IL-1β), interleukin-6 (IL-6) were obtained from Jiancheng Biological Technology Co., Ltd (Nanjing, Jiangsu, China). The commercial kits for serum testosterone (TTS), corticosterone (CTC), lactic acid (LD), triglyceride (TG), blood urea nitrogen (BUN), lactate dehydrogenase (LDH), creatine kinase (CK), immunoglobulin G (IgG), liver glycogen (LG), muscle glycogen (MG), superoxide dismutase (SOD), and glutathione peroxidase (GSH-Px), malondialdehyde (MDA), catalase (CAT) were purchased from Jianglai Biological Technology Co., Ltd. (Shanghai, China). Antibodies targeting nuclear factor erythroid 2-related factor (Nrf2), Kelch-like ECH-associated protein 1 (Keap1), heme oxygenase 1 (HO-1), sequestosome-1 (p62), and NADPH quinone oxidoreductase 1 (NQO1) were supplied by Cell Signaling Technology(Boston,USA).
2.2. Ethical Statement
The study was performed in compliance with the National Institutes of Health and institutional guidelines for the Care and Use of Laboratory Animals and under the approval and supervision of the Animal Ethics Committee at Institute of Food Science and Technology, Chinese Academy of Agricultural Sciences (Approval Number: SYXK-2023100312).
2.3. Animals and Experimental Design
Seventy-two male C57BL/6 mice, weighing between 18.0 and 22.0g, were acquired from Beijing Weitonglihua Laboratory Animal Technology Co., Ltd., holding an experimental animal production license (SCXK (Guangdong) 2019-0063) and an experimental animal qualification certificate (No.44829700011576). Before tests, the mice were acclimated for 7 days in the animal room (12 h light/dark cycle; 23 ± 2 ℃ ambient temperature; 55 ± 10% relative humidity) and allowed free access to chow and water. Based on body weight, the mice were randomly segregated into six groups(n=12/group): (1) Control (control group not subjected to any stress, distilled water); (2) Model (Sleep deprivation (SD) model group subjected to the SD procedure, distilled water); (3) Rhodiola (the positive group subjected to the SD procedure, Rhodiola Rosea capsules at 2.5 mg/kg); (4) Arecoline-L (the group subjected to the SD procedure, 10 mg/kg Arecoline); (5) Arecoline-M (the group subjected to the SD procedure, 20 mg/kg Arecoline); (6) Arecoline-H (the group subjected to the SD procedure, 40 mg/kg Arecoline). The mice were administrated with the corresponding solutions 1 h before the beginning of the daily SD procedure and behavioral tests. All drugs were dissolved in distilled water and given by gastric gavage at a volume of 20 mL/kg of body weight. Following 28 days of SD procedure and the continuous treatment, the forelimb grip strength test, rotary latency test, and exhaustive swimming tests were conducted to assess the anti-fatigue effects of arecoline. After the behavioral tests, the mice were sacrificed by decapitation.
2.4. SD Procedure
The SD procedure was performed as previously described [21]. In Brief, the mice except the control group were acclimated to the automated sleep interruption apparatus (SIA) for 3 hr (from 8:00 a.m. to 11:00 a.m. daily) that lasted for 3 days before the SD procedure, meanwhile the mice in the control group were housed in a static SIA copy apparatus. Then, SD period for 28 days began during which the SD mice stayed inside the SIA for 24 hr/day, while the control mice were still housed in the static SIA copy apparatus. At the same time, the mice were daily administrated with different doses of arecoline or Rhodiola by oral gavage, whereas the control and SD model groups received the corresponding volume of the vehicle solution.
2.5. Behavioral Tests
2.5.1. Forelimb Grip Strength Test
On the 29th day, the forelimb grip strength of the mice was measured using a low-force testing system (Model-RX-5). In brief, the procedure involved having the mice grip the available grids in the instrument with their front paws. Subsequently, their tails were elevated and gently pulled backward, enabling the maximum force exerted by the mice to be automatically recorded by the system. The forelimb grip strength for each mouse was determined by calculating the average of three consecutive measurements, ensuring accuracy and reliability of the data collected. This method provided a quantitative assessment of the muscular strength and fatigue resistance in the mice following the experimental interventions.
2.5.2. Rotary Latency Test
The Rotarod test was conducted to evaluate the exercise endurance and motor coordination in mice. In this test, mice were positioned on a cylindrical rod that rotates at a gradually increasing speed. The procedure involved closely observing the mice’s performance as the rotation speed escalates, meticulously noting endurance time and the specific speeds at which the mice can no longer maintain their balance and subsequently fall off the rod. The commencement of the test sees the rod begin to rotate, with the experimenter tasked with monitoring the mice’s behavior on this apparatus. The precise moment a mouse falls or fails to maintain balance, indicating a loss of motor coordination or endurance, is recorded as the drop time.To ensure comprehensive and reliable assessment, the test is repeated multiple times, with each trial lasting for several minutes. This repetitive testing approach allows for the determination of key parameters such as endurance and overall exercise capacity of the mice, providing valuable insights into their physical performance and motor skills post-experimental interventions.
2.5.3. Exhaustive Swimming Test
The swimming endurance of the mice was evaluated using an adjustable current swimming pool, with some modifications to the standard protocol. Briefly, 30 minutes following the final administration via gavage, each mouse was equipped with a lead sheath, equivalent to 5% of its body weight, affixed at the root of its tail. Subsequently, the mice were placed individually into an acrylic plastic pool, which was maintained at a water temperature of 25°C and a depth of 35 cm. The exhaustive swimming time, serving as the primary measure of endurance, was meticulously recorded from the moment the mouse began swimming until it could no longer resurface within a 10-second interval. This assessment method effectively quantifies the physical stamina and fatigue resistance of the mice, offering insights into their endurance capabilities under induced stress conditions.
2.6. Sample Collection
Immediately following the conclusion of the final exhaustive swim test, each mouse was euthanized, and blood samples were extracted from the eyeball. These samples were then centrifuged at 4℃ and 3500 rpm for 10 min to separate the serum. Key organs, including the liver, hippocampus, and gastrocnemius muscle, were excised. The liver and muscle tissues were immersed in 10% (v/v) formalin for preservation or stored at −80°C for further analysis.
2.7. Biochemical Parameter Assays
The activities of serum testosterone (TTS), corticosterone (CTC), lactic acid (LD), triglyceride (TG), blood urea nitrogen (BUN), lactate dehydrogenase (LDH), creatine kinase (CK), immunoglobulin G (IgG), liver glycogen (LG), muscle glycogen (MG) and the levels of superoxide dismutase (SOD), and glutathione peroxidase (GSH-Px), malondialdehyde (MDA), catalase (CAT) both in the muscle and hippocampus were determined using commercially assay kits (Jianglai Biological Technology Co., Ltd. Shanghai, China), according to the manufacturer’s protocol.
The hippocampus sample was collected to measure the levels of 5-hydroxytryptamine (5-HT), dopamine (DA), norepinephrine (NE), acetylcholine (Ach), gamma-aminobutyric acid (GABA), tumor necrosis factor (TNF-α), interleukin-1β (IL-1β), interleukin-6 (IL-6) using commercial ELISA kits (Jiancheng Biological Technology Co., Ltd, Nanjing, Jiangsu, China) based on the manufacturer’s instructions.
2.8. Western Blot Analysis
Protein extraction from the gastrocnemius muscle was performed using lysis buffer, supplemented with a phosphatase inhibitor, to ensure comprehensive protein recovery while preventing dephosphorylation. Following lysis, the mixture was centrifuged at 4°C for 4 minutes at 13,000 rpm, enabling the collection of the supernatant, which contains the protein content.For protein analysis, equal quantities of the protein samples (30 μg) were subjected to electrophoresis on a 12% SDS-PAGE to achieve separation based on molecular weight. Subsequently, the separated proteins were transferred onto PVDF membranes, a step crucial for subsequent immunoblotting. To prevent non-specific binding, the membranes were incubated with 5% (w/v) skimmed milk at room temperature, serving as a blocking agent.The membranes were then incubated with specific primary antibodies designed to bind to the proteins of interest overnight at 4°C, ensuring optimal binding affinity and specificity. Following this incubation, the membranes were washed three times with T-TBS to remove unbound antibodies and then incubated with secondary antibodies for 1 hour at 25°C. These secondary antibodies are conjugated to an enzyme that produces a detectable signal upon substrate addition, allowing for visualization of the protein bands. Development of the blots was conducted using a Gel Image Analysis System, which facilitates the visualization and quantification of the protein bands. For quantitative analysis, the relative protein expression levels were normalized to GAPDH, a housekeeping protein, using ImageJ software. This normalization is critical for accounting for variations in sample loading and transfer efficiency, providing a reliable measure of the protein levels of interest in the context of the study’s experimental conditions.
2.9. Statistical Analysis
The experimental data were analyzed using SPSS software version 25.0 (SPSS Inc., Chicago, IL, USA) and expressed as mean ± SEM. One-way analysis of variance followed by multiple post hoc comparisons using the least significant difference test was carried out to analyze the data. P < 0.05 was considered as statistically significant for all tests.
3. Results
3.1. Effect of Arecoline on Fatigue-Related Behaviors in SD-Induced Mice
The experimental results, summarized in Figure 1, elucidate the effects of arecoline on the physical performance of mice subjected to a regimen of grip strength, rotarod endurance, and weight-bearing swimming tests. Prior to the administration of treatments, the grip strength of mice in the model group, as well as those treated with Rhodiola and aprodine, was significantly lower compared to the control group (P < 0.01, Figure 1A), indicating an induced state of fatigue. However, no significant differences were observed among the various treatment groups themselves at this initial stage. Post-treatment observations revealed a marked decrease in grip strength within the model group compared to the control group (P < 0.01,Figure 1B), highlighting the persistence of fatigue. Conversely, treatment with arecoline at varying dosages resulted in a significant increase in grip strength across all arecoline-dosed groups when compared to the model group (P < 0.05, P < 0.01, Figure 1B), demonstrating arecoline’s potential in mitigating fatigue and enhancing muscular strength. In the rod turning test, latency times for the model group were significantly lower than those of the control group (P < 0.01,Figure 1C), suggesting impaired motor coordination or endurance due to induced fatigue. However, treatments with arecoline showed a trend towards increased latency times in all arecoline-dosed groups compared to the model group, indicating an improvement in motor coordination and endurance. The weight-bearing swimming test results further supported arecoline’s anti-fatigue effects. Compared to the control group, the model group exhibited a significant reduction in swimming time (P < 0.05,Figure 1D), indicative of decreased endurance. Notably, LA group demonstrated a significant increase in weight-bearing swimming time compared to the model group (P < 0.05, Figure 1D), affirming arecoline’s efficacy in enhancing endurance and resistance to fatigue.
3.2. Effect of Arecoline on Serum Biochemical Indexes in Mice
LA and BUN are products of glycolysis and amino acid metabolism, while LDH and CK are key indicators to reflect fatigue and assess muscle cell damage. The serum fatigue indexes of mice were shown in Figure 2. Compared with control, the levels of CTC, BUN, LD, TG and CK in serum of mice in model group were significantly increased (P < 0.05,P < 0.01,P < 0.001,Figure 2A and C-F), while the activities of TTS, LDH and IgG were significantly decreased (P < 0.001,Figure 2B and G-H).Compared with model control group, serum TTS levels in medium and high dose arecoline groups were significantly increased (P < 0.01, P < 0.0001,Figure 2A).Compared with the model control group, serum levels of CTC, BUN, LD, TG and CK in Rhodiola and arecoline group were significantly decreased (P < 0.001, P < 0.0001,Figure 2A and C-F), LDH and IgG activities were significantly increased (P < 0.0001,Figure 2G-H).The results showed that arecoline intervention could significantly increase the serum antioxidant level of model mice.
3.3. Effect of Arecoline on Oxidative Stress Indexes of Gastrocnemius Muscle in Mice
Free radical and oxidative damage play an important role in excessive fatigue. The fatigue indexes of gastrocnemius in mice are shown in Figure 3.Compared with control, MDA in model group was significantly increased (P < 0.0001,Figure 2A), SOD, CAT and GSH-Px were significantly decreased (P < 0.01, P < 0.0001, Figure 3B-D).Compared with model group, MDA in arecoline dose groups was significantly decreased (P < 0.01, P < 0.0001,Figure 3A), SOD, CAT and GSH-Px in arecoline dose groups were significantly increased (P < 0.05, P < 0.01, P < 0.001, P < 0.0001, Figure 3B-D).The results showed that arecoline intervention could significantly improve the antioxidant level in gastrocnemius of Model mice.
3.4. Effects of Arecoline on Glycolipid Metabolism Indexes in Mice
The glucose and lipid metabolism indexes of mice are shown in Figure 4.Compared with the control, the content of liver and muscle glycogen in the model group was significantly decreased (P < 0.0001,Figure 4A-B).Compared with model group, the contents of liver glycogen and muscle glycogen were significantly increased at low, medium and high doses of arecoline (P < 0.01, P < 0.0001,Figure 4A-B).The results showed that arecoline intervention could significantly increase liver glycogen content and muscle glycogen content in model mice, and achieve anti-fatigue effect.
3.5. Effects of Arecoline on Biochemical Indices of Mouse Hippocampus
3.5.1. Effects of Arecoline on Oxidative Stress Indexes in Hippocampus of Mice
Compared with control group, SOD and CAT activities in model group were significantly reduced (P < 0.001,Figure 5A-B).Compared with model group, SOD activity of mice in low, medium and high dose arecoline groups was significantly increased (P < 0.05, P < 0.01, P < 0.001,Figure 5A), CAT activity of mice in medium and high dose arecoline groups was significantly increased (P < 0.05,Figure 5B).
3.5.2. Effects of Arecoline on Cytokines TNF-α, IL-6 and IL-1β in Mouse Hippocampus
Compared with the control group, the concentrations of TNF-α, IL-6 and IL-1β in the hippocampus of mice in the model group were significantly increased (P<0.001, P<0.0001,Figure 6A-C).Compared with model group, IL-1β content in medium and high doses of arecoline mice was significantly decreased (P < 0.05,Figure 6C), and TNF-α and IL-6 contents in low, medium and high doses of arecoline mice were significantly decreased (P < 0.001, P < 0.0001,Figure 6A-B).The results showed that arecoline intervention could significantly enhance the activity of antioxidant enzymes in the brain of model mice and inhibit the level of oxidative stress.
3.5.3. Effects of Arecoline on the Content of 5-HT, DA, NE, GABA and Ach in the Hippocampus of Mice
Compared with control group, 5-HT, DA, NE, GABA and Ach in model group were significantly decreased (P < 0.05, P < 0.01, P < 0.001, P < 0.0001,Figure 7A-E).The contents of 5-HT, DA, NE and GABA in low, medium and high doses of arecoline were significantly increased (P < 0.01, P < 0.001, P < 0.0001,Figure 4C-F).The results showed that arecoline intervention significantly increased the level of neurotransmitter release in the brain of mice. The results showed that arecoline intervention could reduce the level of cytokines in the hippocampus of model mice to achieve anti-fatigue effect.
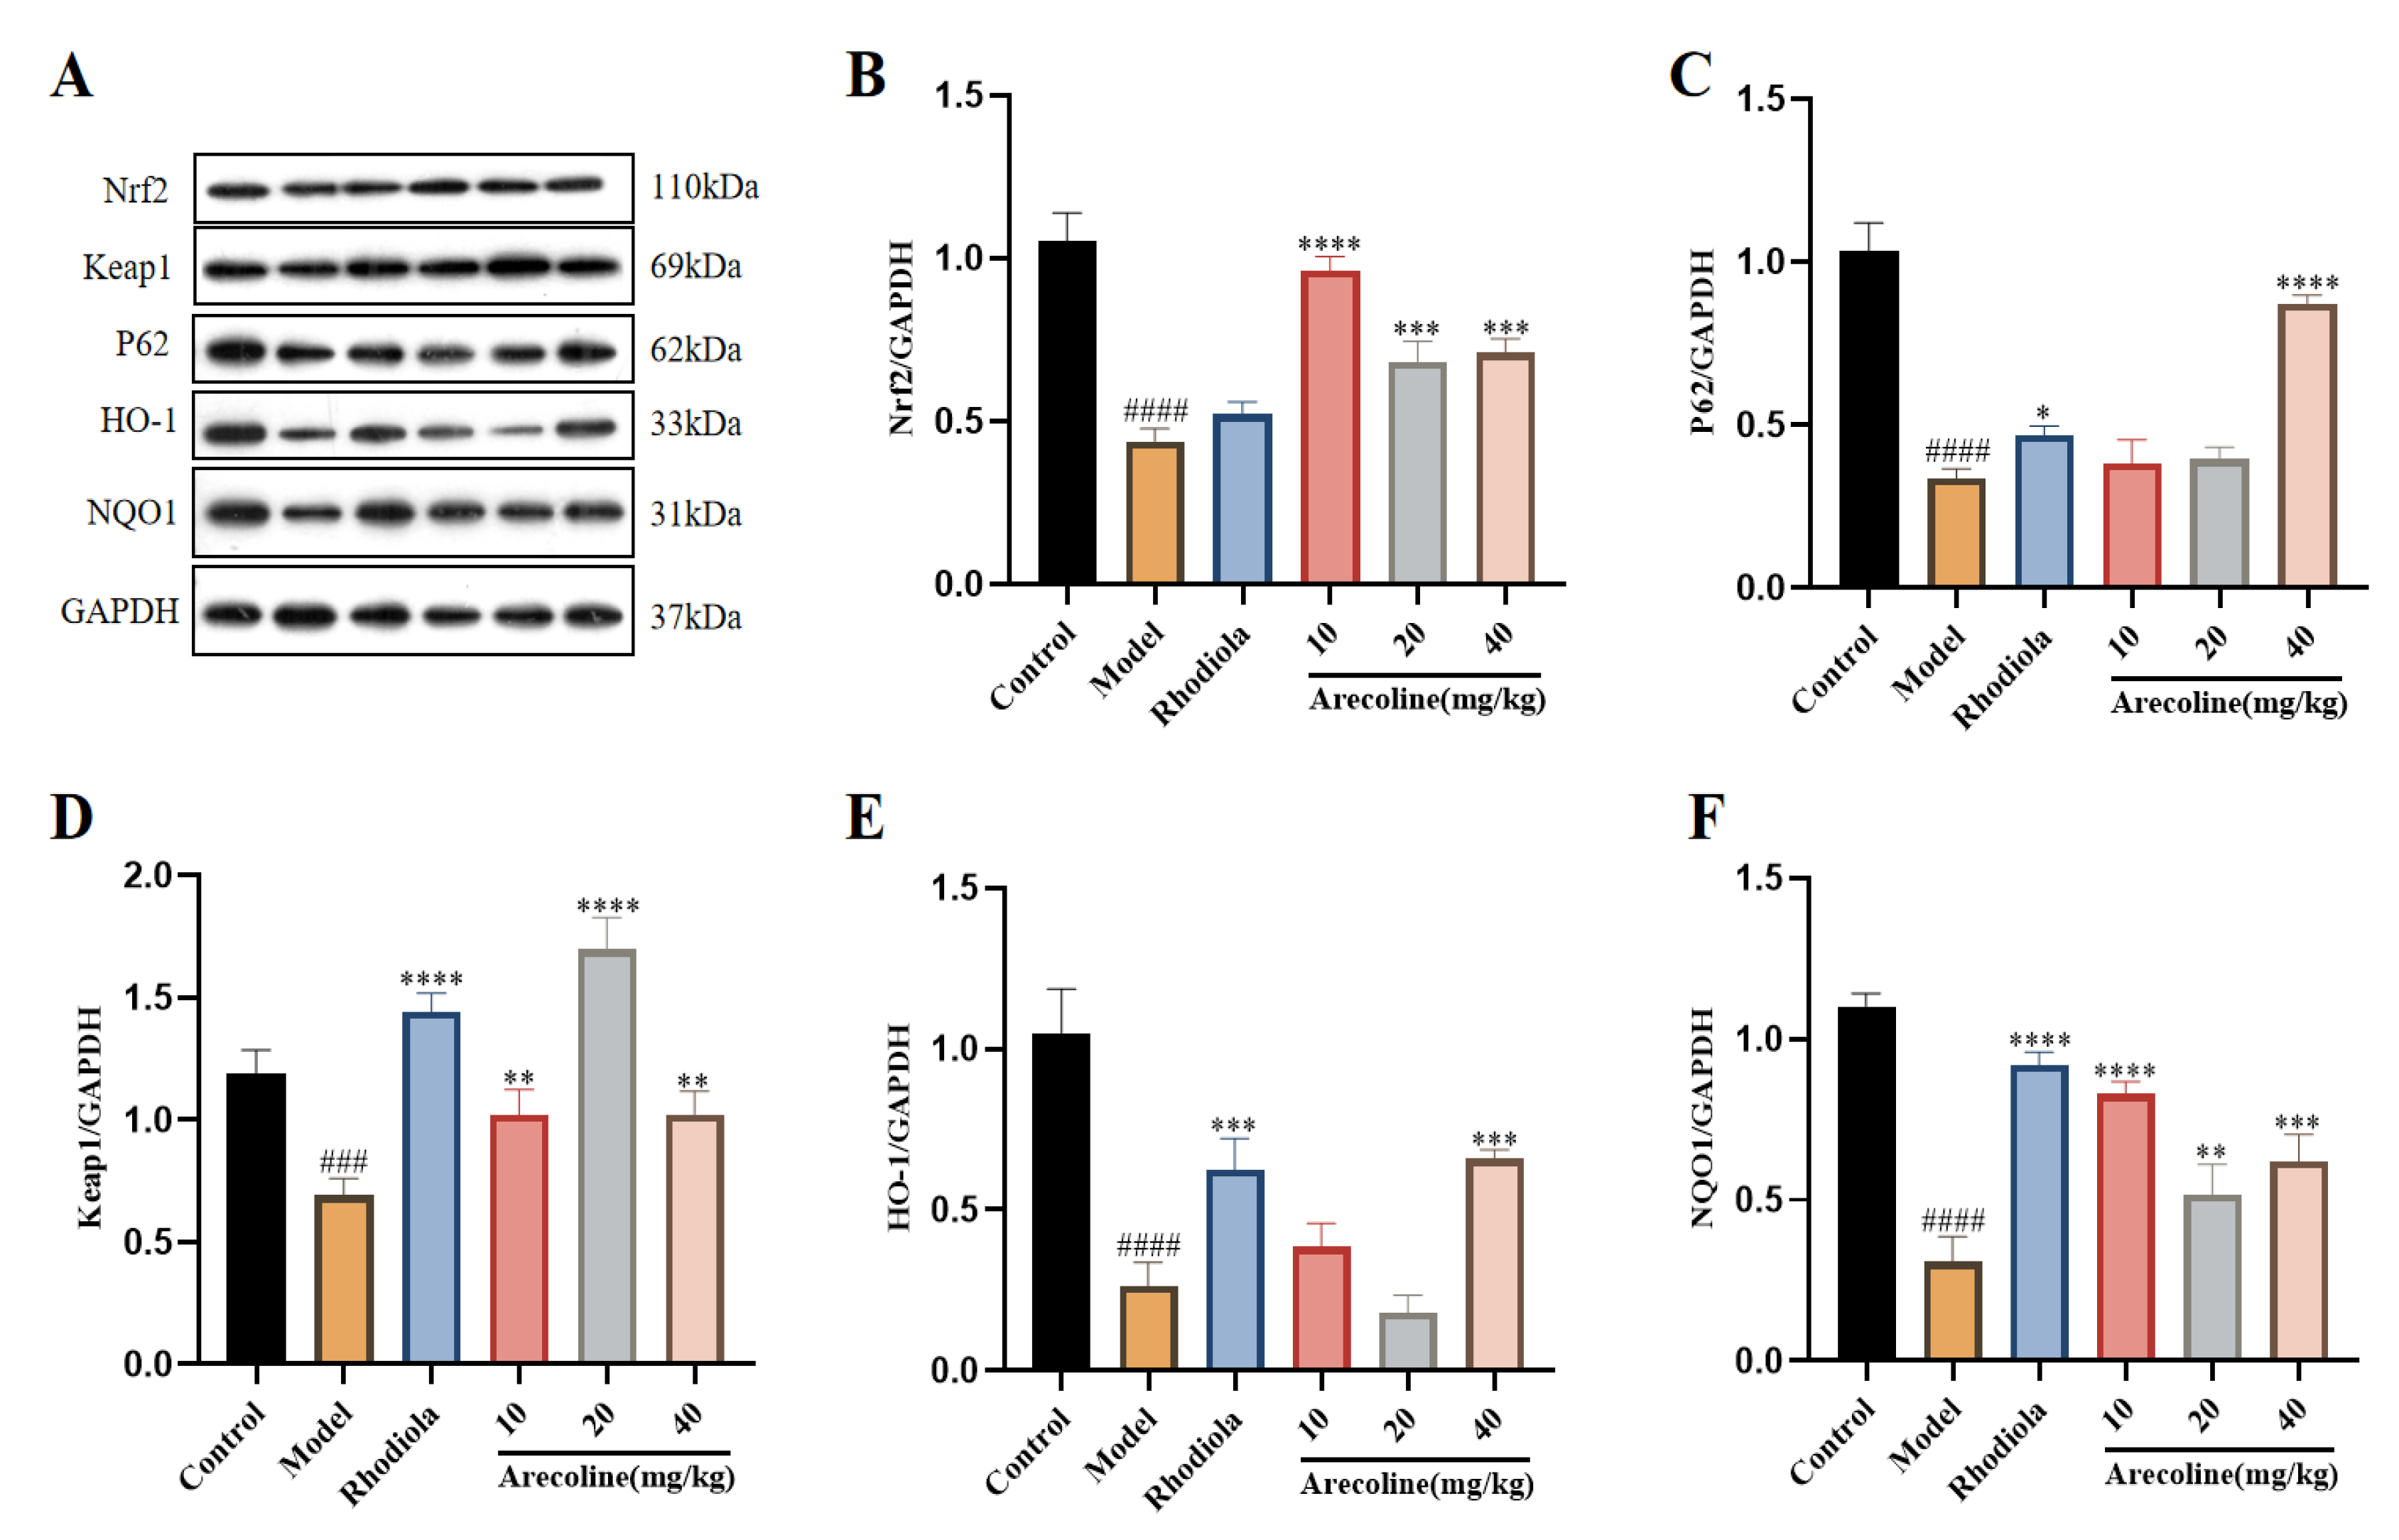
3.6. Effect of Arecoline on Keap1/Nrf2/HO-1 Signaling Pathway in Gastrocnemius of Mice
The Keap1/Nrf2/HO-1 signaling pathway is thought to be critical under oxidative stress conditions.As shown in Figure 5A-C, compared with control, the expression of Nrf2, P62, Keap1, HO-1 and NQO1 proteins in the model group was significantly down-regulated. Compared with the model, the expression of Nrf2, P62, Keap1, HO-1 and NQO1 were significantly up-regulated in Rhodiola and arecoline groups (Figure 8B-F).
4. Discussion
Sleep is a vital physiological process for humans and a protective mechanism for maintaining autonomic nervous system and immune system homeostasis [22]. Shorter sleep times can lead to fatigue, increased mood swings, and affect learning and memory. Studies have shown that lack of sleep has significant effects on cardiovascular, endocrine, immune and nervous systems [23,24].Fatigue is a long-term or temporary state of physical or mental weakness and exhaustion, often accompanied by a lack of energy, motivation, and focus.The SD-induced fatigue model can mimic a state of fatigue induced by sleep deprivation and is used to screen the the candidate anti-fatigue active substances. Grip test, rod spinning test and weight exhaustion swimming tests were conducted in the current study, which are the classic behavioral paradigms for evaluating the fatigue-like behaviors and body strength of experimental animals [25,26]. The results of this study showed that after 14 days of chronic sleep deprivation, the grasping power, rod turning time and weight-bearing swimming time of mice were significantly reduced, indicating that the fatigue mouse model was successfully established. Meanwhile, administrations with arecoline (10, 20 and 40 mg/kg) significantly improved these behavioral changes in SD-induced mouse fatigue, exerting the remarkable anti-fatigue action.
Oxidative stress is a state in which the level of reactive oxygen species (ROS) in the body increases dramatically. Under normal circumstances, the ROS production and antioxidant systems in the body are in a state of dynamic balance.However, excessive ROS produced by strenuous exercise can lead to an imbalance in the oxidative stress response, resulting in lipid peroxidation of membrane structures and the formation of lipid peroxidation product MDA, which changes the fluidity and permeability of cell membranes, damages skeletal muscle and liver mitochondria, and ultimately leads to fatigue.GSH-Px is an endogenous antioxidant enzyme that plays an important role in maintaining the balance of antioxidant stress in the body [27]. Studies have found that after continuous administration of areca nut for 14 days, the activities of SOD and CAT in mice increased significantly and the expression of MDA decreased significantly, indicating that areca nut had good antioxidant activity [28].The results of this study showed that arecaline groups could significantly reduce the MDA content of mice, and significantly increase the expression levels of SOD, CAT and GSH-Px in mice, which was consistent with the results.
Previous studies have shown that CTC, TTC, BUN, LD, TG, LDH and CK levels are closely related to exercise [29].High intensity exercise accelerates the accumulation of LD.Lactate dehydrogenase (LDH) is an accurate indicator of muscle activity.Without adequate energy supply, anaerobic metabolism of sugars and catabolism of proteins increase urea levels and cause fatigue.This study showed that arecoline can reduce the content of serum CTC, BUN, LD, TG and CK, and finally play an anti-fatigue role, and provide sufficient evidence to prove that arecoline can regulate fatigue related biochemical indicators and reduce muscle damage.The body’s main source of energy for movement is glycogen, which is stored in the liver and muscles.Glycogen provides energy through peroxidation during high intensity exercise [30,31].Therefore, glycogen reserve can directly improve exercise ability and slow down the occurrence of exercise fatigue [32].The contents of liver glycogen and muscle glycogen in arecoline group were significantly higher than those in model group.The results showed that arecoline was beneficial to delay energy consumption and had the significant anti-fatigue effect.
It has been reported that the gut microbiota affects the brain through a variety of pathways, including changes in the gamma-aminobutyrate (GABA) system, and contributes to a variety of mental disorders [33].It is reported that areca was an effective inhibitor of central inhibition of the uptake of the transmitter gamma-aminobutyric acid (GABA) in rat brain sections [34]. In addition, the alkaloids in betel nut are a potent depressant for GABA uptake, and chewing betel nut may affect sympathetic nerve function and increase the plasma concentration of norepinephrine [35].The results of this study showed that arecoline interventions reversed the decline in 5-HT, DA, NE, GABA and Ach levels, suggesting that the improvement of cholinergic system function is one of the potential mechanisms of arecoline’s anti-fatigue activity.IL-6 and IL-1β have strong pro-inflammatory activity [36] and can induce a variety of pro-inflammatory mediators, such as cytokines and chemokines.Similar to IL-1β, TNF-α is a pleiotropic pro-inflammatory cytokine that plays different roles in regulating multiple developmental and immune processes, including inflammation, differentiation, lipid metabolism, and apoptosis [37].The dysregulation of TNF-α is associated with a variety of pathological conditions, such as infection, autoimmune diseases, cancer, atherosclerosis, Alzheimer’s disease, inflammatory bowel disease, and intervertebral disc degeneration [38,39,40]. Based on data from animal and clinical studies, studies have shown that a subpopulation of MDD patients in animal models and clinical trials have the effect of increasing plasma TNF-α levels, and blocking TNF-α improves depressive symptoms [41]. In this study, arecoline interventions significantly reduced the contents of TNF-α, IL-6 and IL-1β in mice, which was consistent with the above study.
Studies have shown that cells will be damaged by reactive oxygen species and respond to the damage of harmful substances through a variety of mechanisms, the most important defense mechanism of oxidative stress is regulated through the Nrf2-Keap1 signaling pathway [42]. Keap1 is a negative regulator of Nrf2 activity, which can directly bind Nrf2 and regulate the NRF2-KEap1 signaling pathway.When cells are stressed, p62 protein is phosphorylated at Ser403 and Ser351, and the phosphorylated p62 binds Keap1 through the KIR domain, resulting in Nrf2 dissociation from Keap1 and activation [43].In addition, Keap1 restricts actin cytoskeleton and Nrf2 to cytoplasm by binding to them, respectively, and also plays an active role in Nrf2 ubiquitination and proteasome degradation [44].It is shown that p62 can depolymerize Nrf2-Keap1 complex by binding to Keap1, which plays a positive regulatory role in NRF2-KEap1 pathway [45].In addition, the aggregation of p62 and Keap1 has been detected in many human tumor cells, and certain neurodegenerative diseases,such as Alzheimer’s disease (AD), Parkinson’s disease (PD), and amyotrophic lateral sclerosis (ALS).They are also characterized by a large accumulation of protein aggregates in the central nervous system [46] and are all related to p62.Nrf2 is one of the important transcription factors that protect cells from oxidative stress. It can regulate the transcription of target genes in the nucleus, including NAD(P)H, NQO-1 and HO-1 [47], thereby avoiding apoptosis induced by oxidative stress.The results of this experiment showed that arecoline administration could significantly up-regulate the expression of Nrf2, Keap1, NQO1, P62 and HO-1 proteins, indicating that arecoline could improve the fatigue mice by regulating Keap1/Nrf2/HO-1 pathway.
5. Conclusions
In summary, this study for the first time demonstrated that arecoline has significant anti-fatigue activity, and its mechanism of action is related to elevate the levels of glucose and lipid metabolism, relieve oxidative stress damage, inhibit neuroinflammatory response, regulate neurotransmitter levels and Keap1/Nrf2/HO-1 signaling pathway. The current study provides a new insight into the potential of arecoline in prevention and improvement of fatigue.
Author Contributions
CL and FZW designed the study. DYW conducted the experiments and collected the data. DYW, YS, JML, JS, BF helped with data analysis. DYW wrote this paper. CL and FZW revised the manuscript. All authors approved the final manuscript.
Funding
This work was supported by the National Key Research and Development Program of China (No.2023YFD2201304), Nanfan special project of Chinese Academy of Agricultural Sciences (YYLH05) and Nanfan special project of CAAS(YBXM2417).
Data Availability
Data will be made available on request.
Declaration of Competing Interest
The authors declare that they have no known competing financial interests or personal relationships that could have appeared to influence the work reported in this paper.
References
- Matura L A,Malone S,Jaime-Lara R, et al. A systematic review of biological mechanisms of fatigue in chronic illness [J] Biol Res Nurs,2018,20(4) : 410-421. [CrossRef]
- Hsiao C Y, Hsu Y J, Tung Y T, et al. Effects of Antrodia camphorata and Panax ginseng supplementation on antifatigue properties in mice [J] J Vet Med Sci,2018,80 (2) : 284 - 291. [CrossRef]
- Shi, J.; Shen, J.; Xie, J.; Zhi, J.; Xu, Y. Chronic fatigue syndrome in Chinese middle-school students. Medicine 2018, 97, e9716. [Google Scholar] [CrossRef] [PubMed]
- LUAN J, TAO X Y. Study on the Biological Activity of Areca catechu[J]. Anhui Agri.Sci.Bull.2018,24 (13).
- ZHANG W, LAN Y, DENG B.Addiction to chewing betel nut: research status and possible mechanism[J].China Academic Journal Electronic Publishing House,2016,25(6):505-507.
- HUANG L W, HSIEH B S, CHENG H L, et al. Arecoline decreases interleukin-6 production and induces apoptosis and cell cycle arrest in human basal cell carcinoma cells[J]. 2011, 258(2):199-207. [CrossRef]
- YAO Q X.Arecoline improved glucose metabolism in type 2 diabetes rats by CAR and PXR. Hengyang: University of South China, 2010.
- WANG Y Q, ZHOU S H. A recoline Prevents the Injury of Endothelium Dependent Relaxation Induced by High G lucose. Chinese Journal of Arteriosclerosis, 2010, 18(6):461-464.
- LI C B, YANG X, TANG W B, et al. Arecoline excites the contraction of distal colonic smooth muscle strips in rats viathe M3 receptor-extracellular Ca2+ influx-Ca2+ store release pathway[J]. Canadian Journal of Physiology & Pharmacology,2010, 88(4):439-447. [CrossRef]
- QI Z Q. Protection effect of Arecoline on pancreas cells in type 2 diabetic rats and its mechanism.Hengyang: University of South China, 2010.
- QI J. Extraction,Antioxidant and Anti-fatigue Effects of Phenolic Compounds of Betel Nut[D].Hainan University,2011.
- MA J H, DU X, ZHAO A P, WANG Z H, GUO Q W, QIN N N, WANG R.Anti-hypoxic pharmacological effects of betelnut polyphenols[J].J Cent South Univ (Med Sci),2022,47(04):512-520.
- YI P,TANG Y R,ZHOU F,Research progress on chemical constituents and pharmacological activities of Areca catechu.China Journal of Chinese Materia Medica,2019,50(10):2498-2504.
- ZHANG C J, LV F J, TAO H T.Research progress on the active components of areca nut and their functions[J]. Food and Nutrition in China, 2008(6):50-53.
- Montoro P,Maldini M,Piacente S,et al. Metabolite fingerprinting of Camptotheca acuminata and the HPLC-ESI-MS/MS analysis of camptothecin and related alkaloids [J]. Journal of Pharmaceutical and Biomedical Analysis,2010,51(2):405-415. [CrossRef]
- XIAO Peigen. Modern Chinese materia medica[M]. Beijing: Chemical Industry Press, 2002.
- YI M S, PAN F B,GUO J H,JI X L, LIU Y Q. Research into Chemical Constituents and Pharmacological Activities in Areca catechu L. Food Research and Development, 2021,42(15):219-224.
- LIU Y L,XV W W,ZHOU D.Anti-ageing effects of betel nut extract grown in Hainan.China Tropical Medicine.2017,17(02):123-125. [CrossRef]
- SUN Y, WANG D.Y., SUN J., FAN B., SONG H.B., LIU X.M., LU C., WANG F.Z. Arecoline improves neuroinflammation of BV2 cells induced by lipopolysaccharide and its mechanism [J]. Drugs & Clinic, 2024, 39 (03): 541-54.
- SUN Y., WANG D.Y., SUN J., BAI Y.J, FAN B., SONG H.B., JI J.B., LU C., WANG F.Z. Neuroprotective effect and mechanism of arecoline on H2O2-induced damage in SH-SY5Y cell [J/OL]. Chinese Journal of Tropical Crops:1-12[2024-06-06].http://kns.cnki.net/kcms/detail/46.1019.S.20231204.1607.004.html.
- Lu C., Wei Z, Jiang N., Chen Y., Wang Y.Q., Li S.Y., Wang Q.,Fan B., Liu XM* and Wang FZ*. Soy isoflavones protects against cognitive deficits induced by chronic sleep deprivation via alleviating oxidative stress and suppressing neuroinflammation. Phytotherapy Research. 2022, 36(5):2072-2080.
- J.S. Durmer, D.F. Dinges, Neurocognitive consequences of sleep deprivation, Semin.Neurol. 25 (1) (2005) 117-129. [CrossRef]
- Research Institute of Medicine Committee on Sleep Medicine. The National Academies Collection: Reports funded by National Institutes of Health. In: Colten HR, Altevogt BM, (eds.), Sleep Disorders and Sleep Deprivation: An Unmet Public Health Problem. Washington (DC): National Academies Press(US), National Academy of Sciences, 2006.
- Nedeltcheva AV, Scheer FA: Metabolic effects of sleep disruption, links to obesity and diabetes. Curr Opin Endocrinol Diabetes Obes, 2014; 21(4):293–98. [CrossRef]
- Liu Y, Liu C. Antifatigue and increasing exercise performance of Actinidia arguta crude alkaloids in mice. J Food Drug Anal. 2016;24(4):738–745. [CrossRef]
- Liu C, Shao C, Du Q, et al. Mechanism and effects of fructose diphosphate on anti-hypoxia fatigue and learning memory ability. Can J Physiol Pharmacol. 2020;98(10):733–740. [CrossRef]
- Ma L-L, Lin J-Z, Liu H-Y, et al. Accurate positioning and analysis on health function of high frequency anti-fatigue herbal medicines. China J Chin Materia Med. 2020;45(15):3608–16. [CrossRef]
- PEI H Y, JIANG N, WANG M D, WANG F Z, AO D M, WANG Q. Study on the antidepressant effect and mechanism of betel nut on mice [J] Chinese Journal of Comparative Medicine. 2022, 32(1): 24-32.
- Xiaoming Chai, Mengyue Pan, Jingjie Wang, Mingmei Feng, Yupeng Wang, Qi Zhang, Yang Sun,Cordycepin exhibits anti-fatigue effect via activating TIGAR/SIRT1/PGC-1α signaling pathway,Biochemical and Biophysical Research Communications,Volume 637,2022,Pages 127-135,ISSN 0006-291X. [CrossRef]
- Prats C, Graham TE, Shearer J. The dynamic life of the glycogen granule. J Biol Chem. 2018;293(19):7089–7098. [CrossRef]
- Vigh-Larsen JF, Ørtenblad N, Spriet LL, Overgaard K, Mohr M. Muscle Glycogen Metabolism and High-Intensity Exercise Performance: A Narrative Review. Sports Med. 2021;51(9):1855– 1874. [CrossRef]
- Park SH, Jang S, Lee SW, Park SD, Sung YY, Kim HK. Akebia quinata Decaisne aqueous extract acts as a novel anti-fatigue agent in mice exposed to chronic restraint stress. J Ethnopharmacol. 2018;222:270–279. [CrossRef]
- Hui Yao, Dalin Zhang, Hao Yu, Hui Shen, Hao Liu, Fanyue Meng, Xu Wu, Guohua Zhang, Xiaolong Wang, Chronic ethanol exposure induced anxiety-like behaviour by altering gut microbiota and GABA system, Physiology & Behavior. [CrossRef]
- JOHNSTON, G., KROGSGAARD-LARSEN, P. & STEPHANSON, A. Betel nut constituents as inhibitors of γ-aminobutyric acid uptake. Nature 258, 627–628 (1975).
- Chu, Nai-Shin.Effects of betel chewing on the central and autonomic nervous systems.Journal of Biomedical Science.2001,8 (3):229-236.
- Tanaka T, Narazaki M, Kishimoto T. IL-6 in inflammation, immunity, and disease. Cold Spring Harb Perspect Biol. 2014;6(10):a016295. Published 2014 Sep 4. [CrossRef]
- Idriss HT, Naismith JH. TNF alpha and the TNF receptor superfamily: structure-function relationship(s). Microsc Res Tech. 2000;50(3):184-195. [CrossRef]
- Tzanavari T, Giannogonas P, Karalis KP. TNF-alpha and obesity. Curr Dir Autoimmun. 2010;11:145-156. [CrossRef]
- Akash MSH, Rehman K, Liaqat A. Tumor Necrosis Factor-Alpha: Role in Development of Insulin Resistance and Pathogenesis of Type 2 Diabetes Mellitus. J Cell Biochem. 2018;119(1):105-110. [CrossRef]
- Moelants EA, Mortier A, Van Damme J, Proost P. Regulation of TNF-α with a focus on rheumatoid arthritis. Immunol Cell Biol. 2013;91(6):393-401. [CrossRef]
- Ma K, Zhang H, Baloch Z. Pathogenetic and Therapeutic Applications of Tumor Necrosis Factor-α (TNF-α) in Major Depressive Disorder: A Systematic Review. Int J Mol Sci. 2016;17(5):733. Published 2016 May 14. [CrossRef]
- Bae SH, Sung SH, Oh SY, et al. Sestrins activate Nrf2 by promoting p62-dependent autophagic degradation of keap1 and prevent oxidative liver damage. Cell Metab, 2013, 17: 73-84.
- Zheng JL, Lin Z, Shen B, et al. Antioxidant defenses at transcriptional and enzymatic levels and gene expression of Nrf2-Keap1 signaling molecules in response to acute zinc exposure in the spleen of the large yellow croaker Pseudosciaena crocea. Fish Shellfish Immunol, 2016, 52: 1-8.
- Fourtounis J, Wang IM, Mathieu MC, et al. Gene expression profiling following NRF2, and KEAP1, siRNA knockdown in human lung fibroblasts identifies CCL11/Eotaxin-1 as a novel NRF2 regulated gene. Respir Res, 2012, 13: 92.
- Jiang T, Harder B, Rojo de la Vega M, et al. p62 links autophagy and Nrf2 signaling. Free Radic Biol Med, 2015, 88: 199-204.
- Kerr F, Sofolaadesakin O, Ivanov DK, et al. Direct keap1 Nrf2 disruption as a potential therapeutic target for Alzheimer’s disease. PLoS Genet, 2017, 13: e1006593.
- Schieber M, Chandel N. ROS function in redox signaling and oxidative stress. Curr Biol, 2014, 24: 453-62.
Figure 1.
Effects of arecoline on gripping power, rod turning latency and weight-bearing swimming time of mice. (A) Before dosing Gripping power, (B) After dosing Gripping power, (C) Rod turning latency and (D) Weight-bearing swimming time. Data were expressed as means ± SEM (n = 12). # P < 0.05, ## P < 0.01 indicate significant difference compared with the Control group. * P < 0.05, ** P < 0.01 indicate significant difference compared with the Model group.
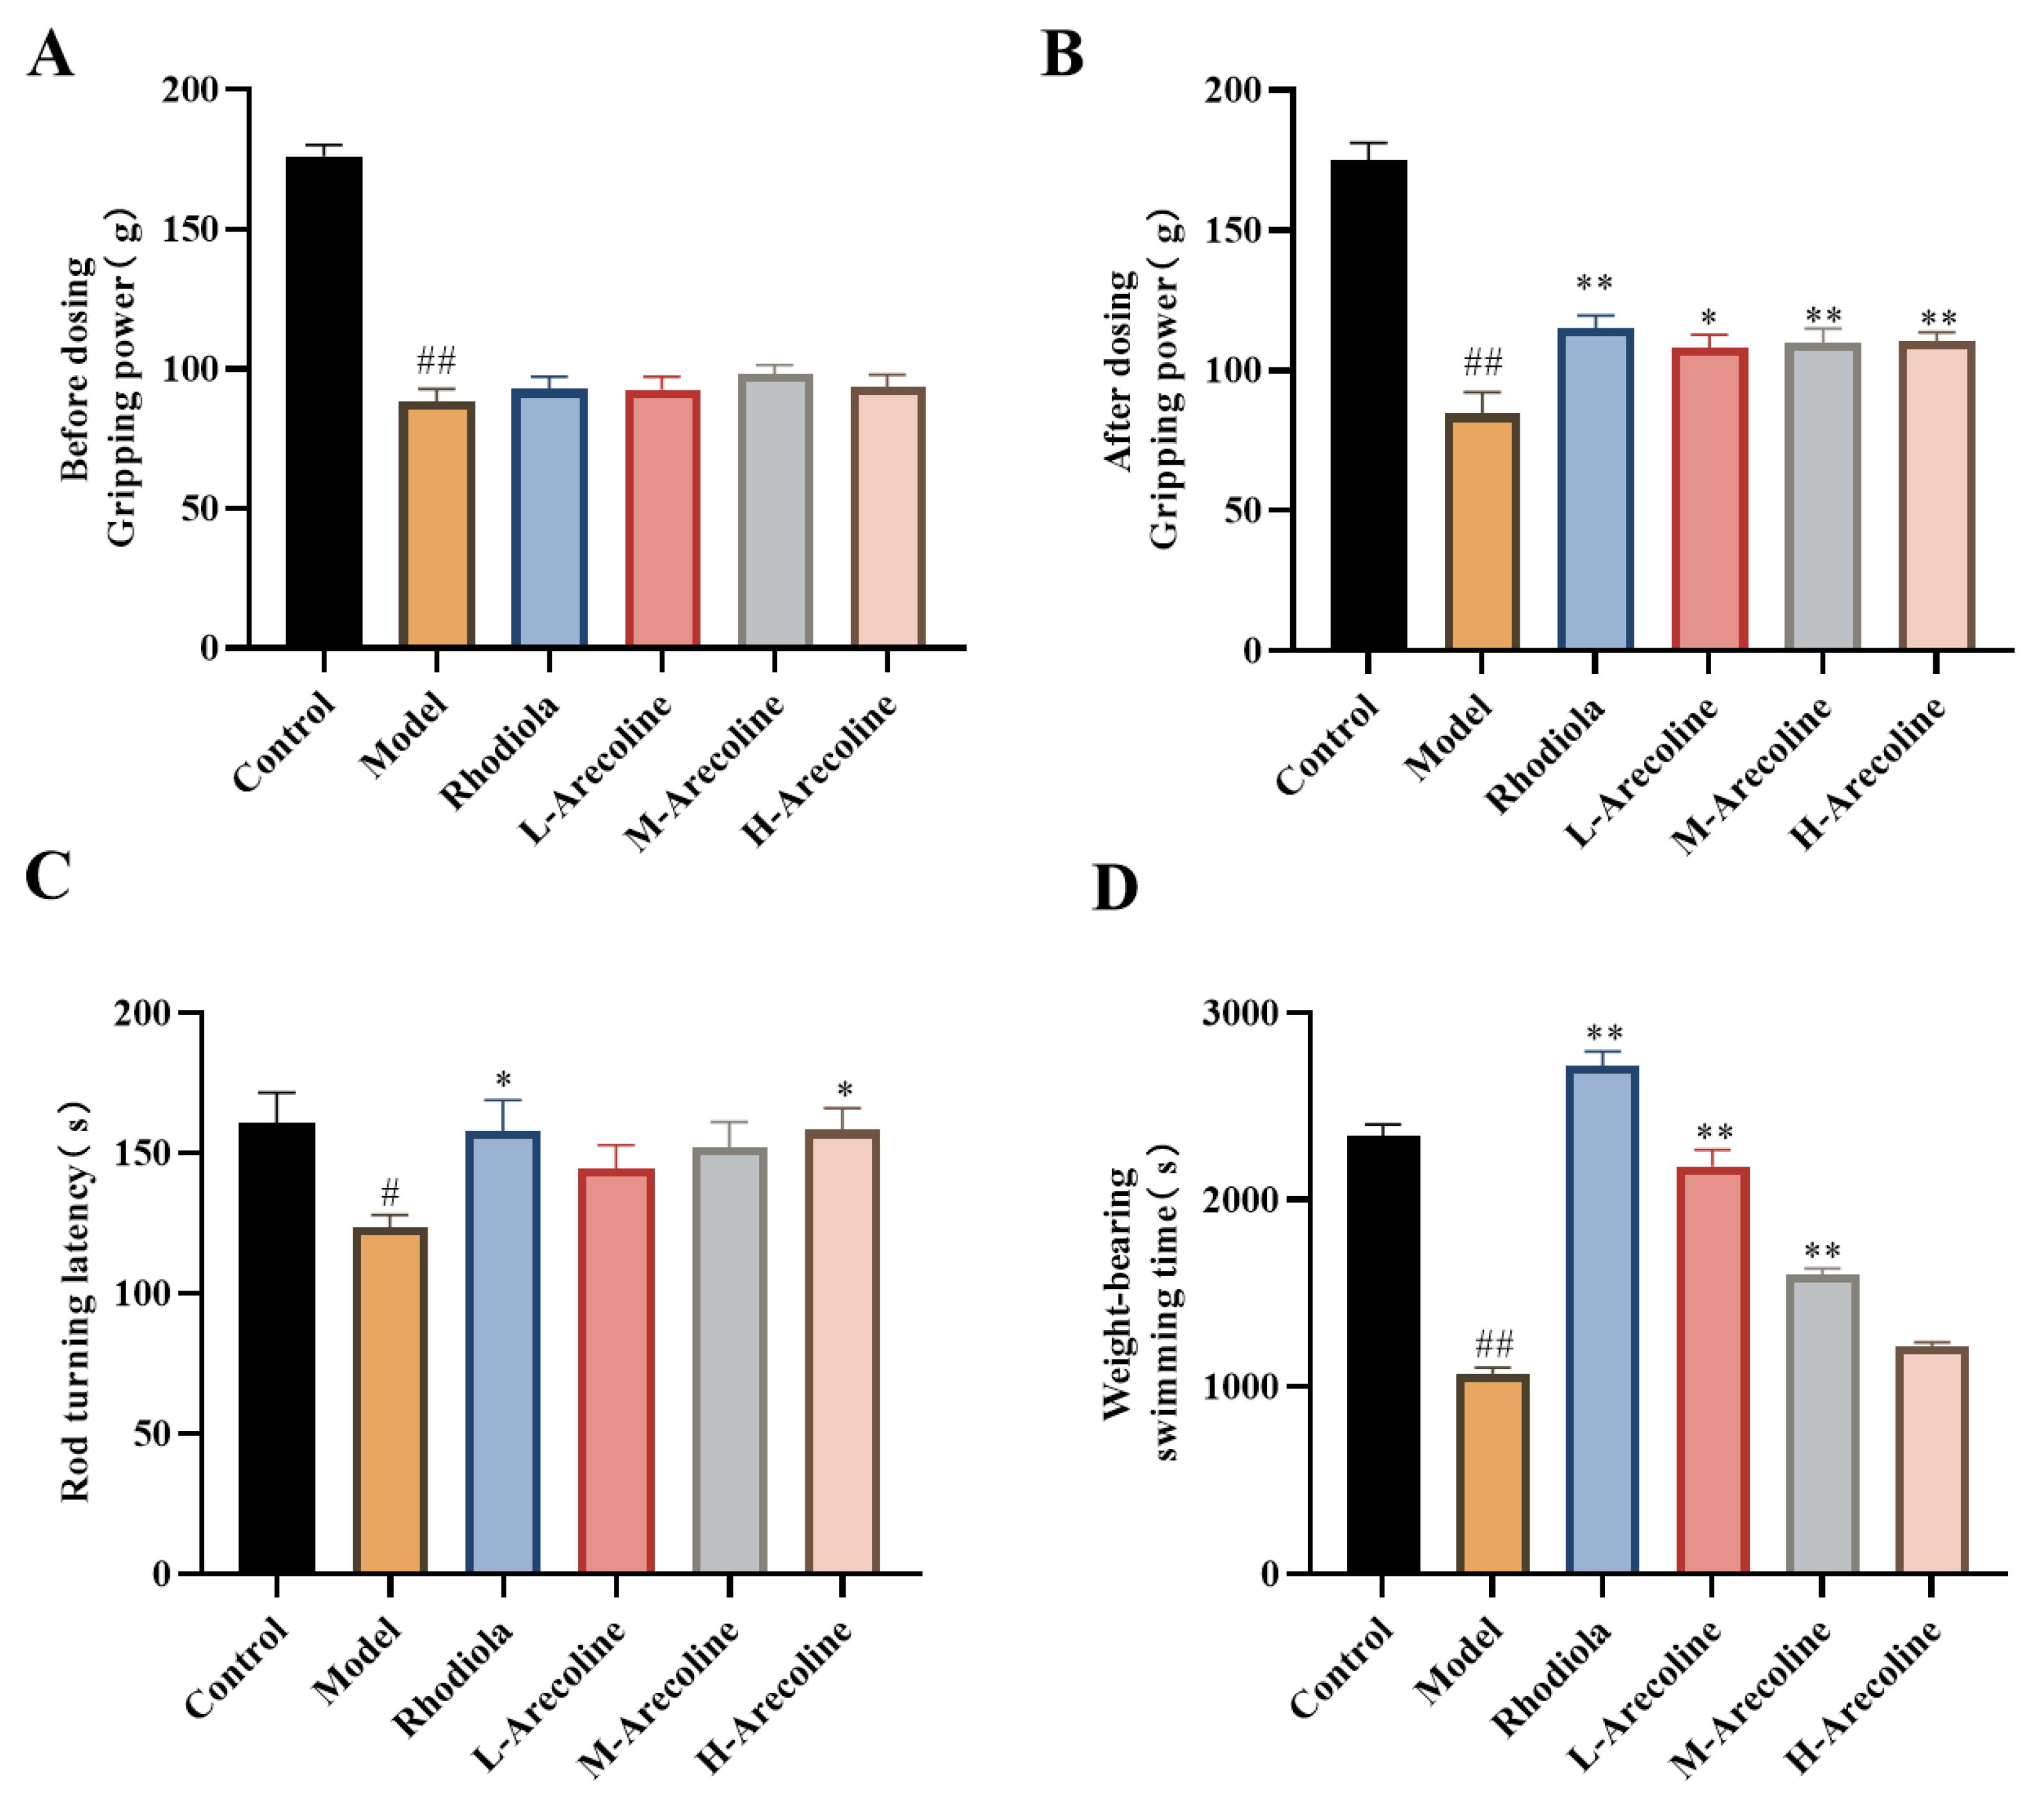
Figure 2.
Effect of arecoline on serum biochemical indexes in mice.(A) TCT, (B) TTS, (C) TG, (D) BUN, (E) LD, (F) CK, (G) LDH and (H) IgG. Data were expressed as means ± SEM (n = 12). # P < 0.05, ## P < 0.01 #### P < 0.0001 indicate significant difference compared with the Control group. ** P < 0.01, *** P < 0.001, **** P < 0.0001 indicate significant difference compared with the Model group.
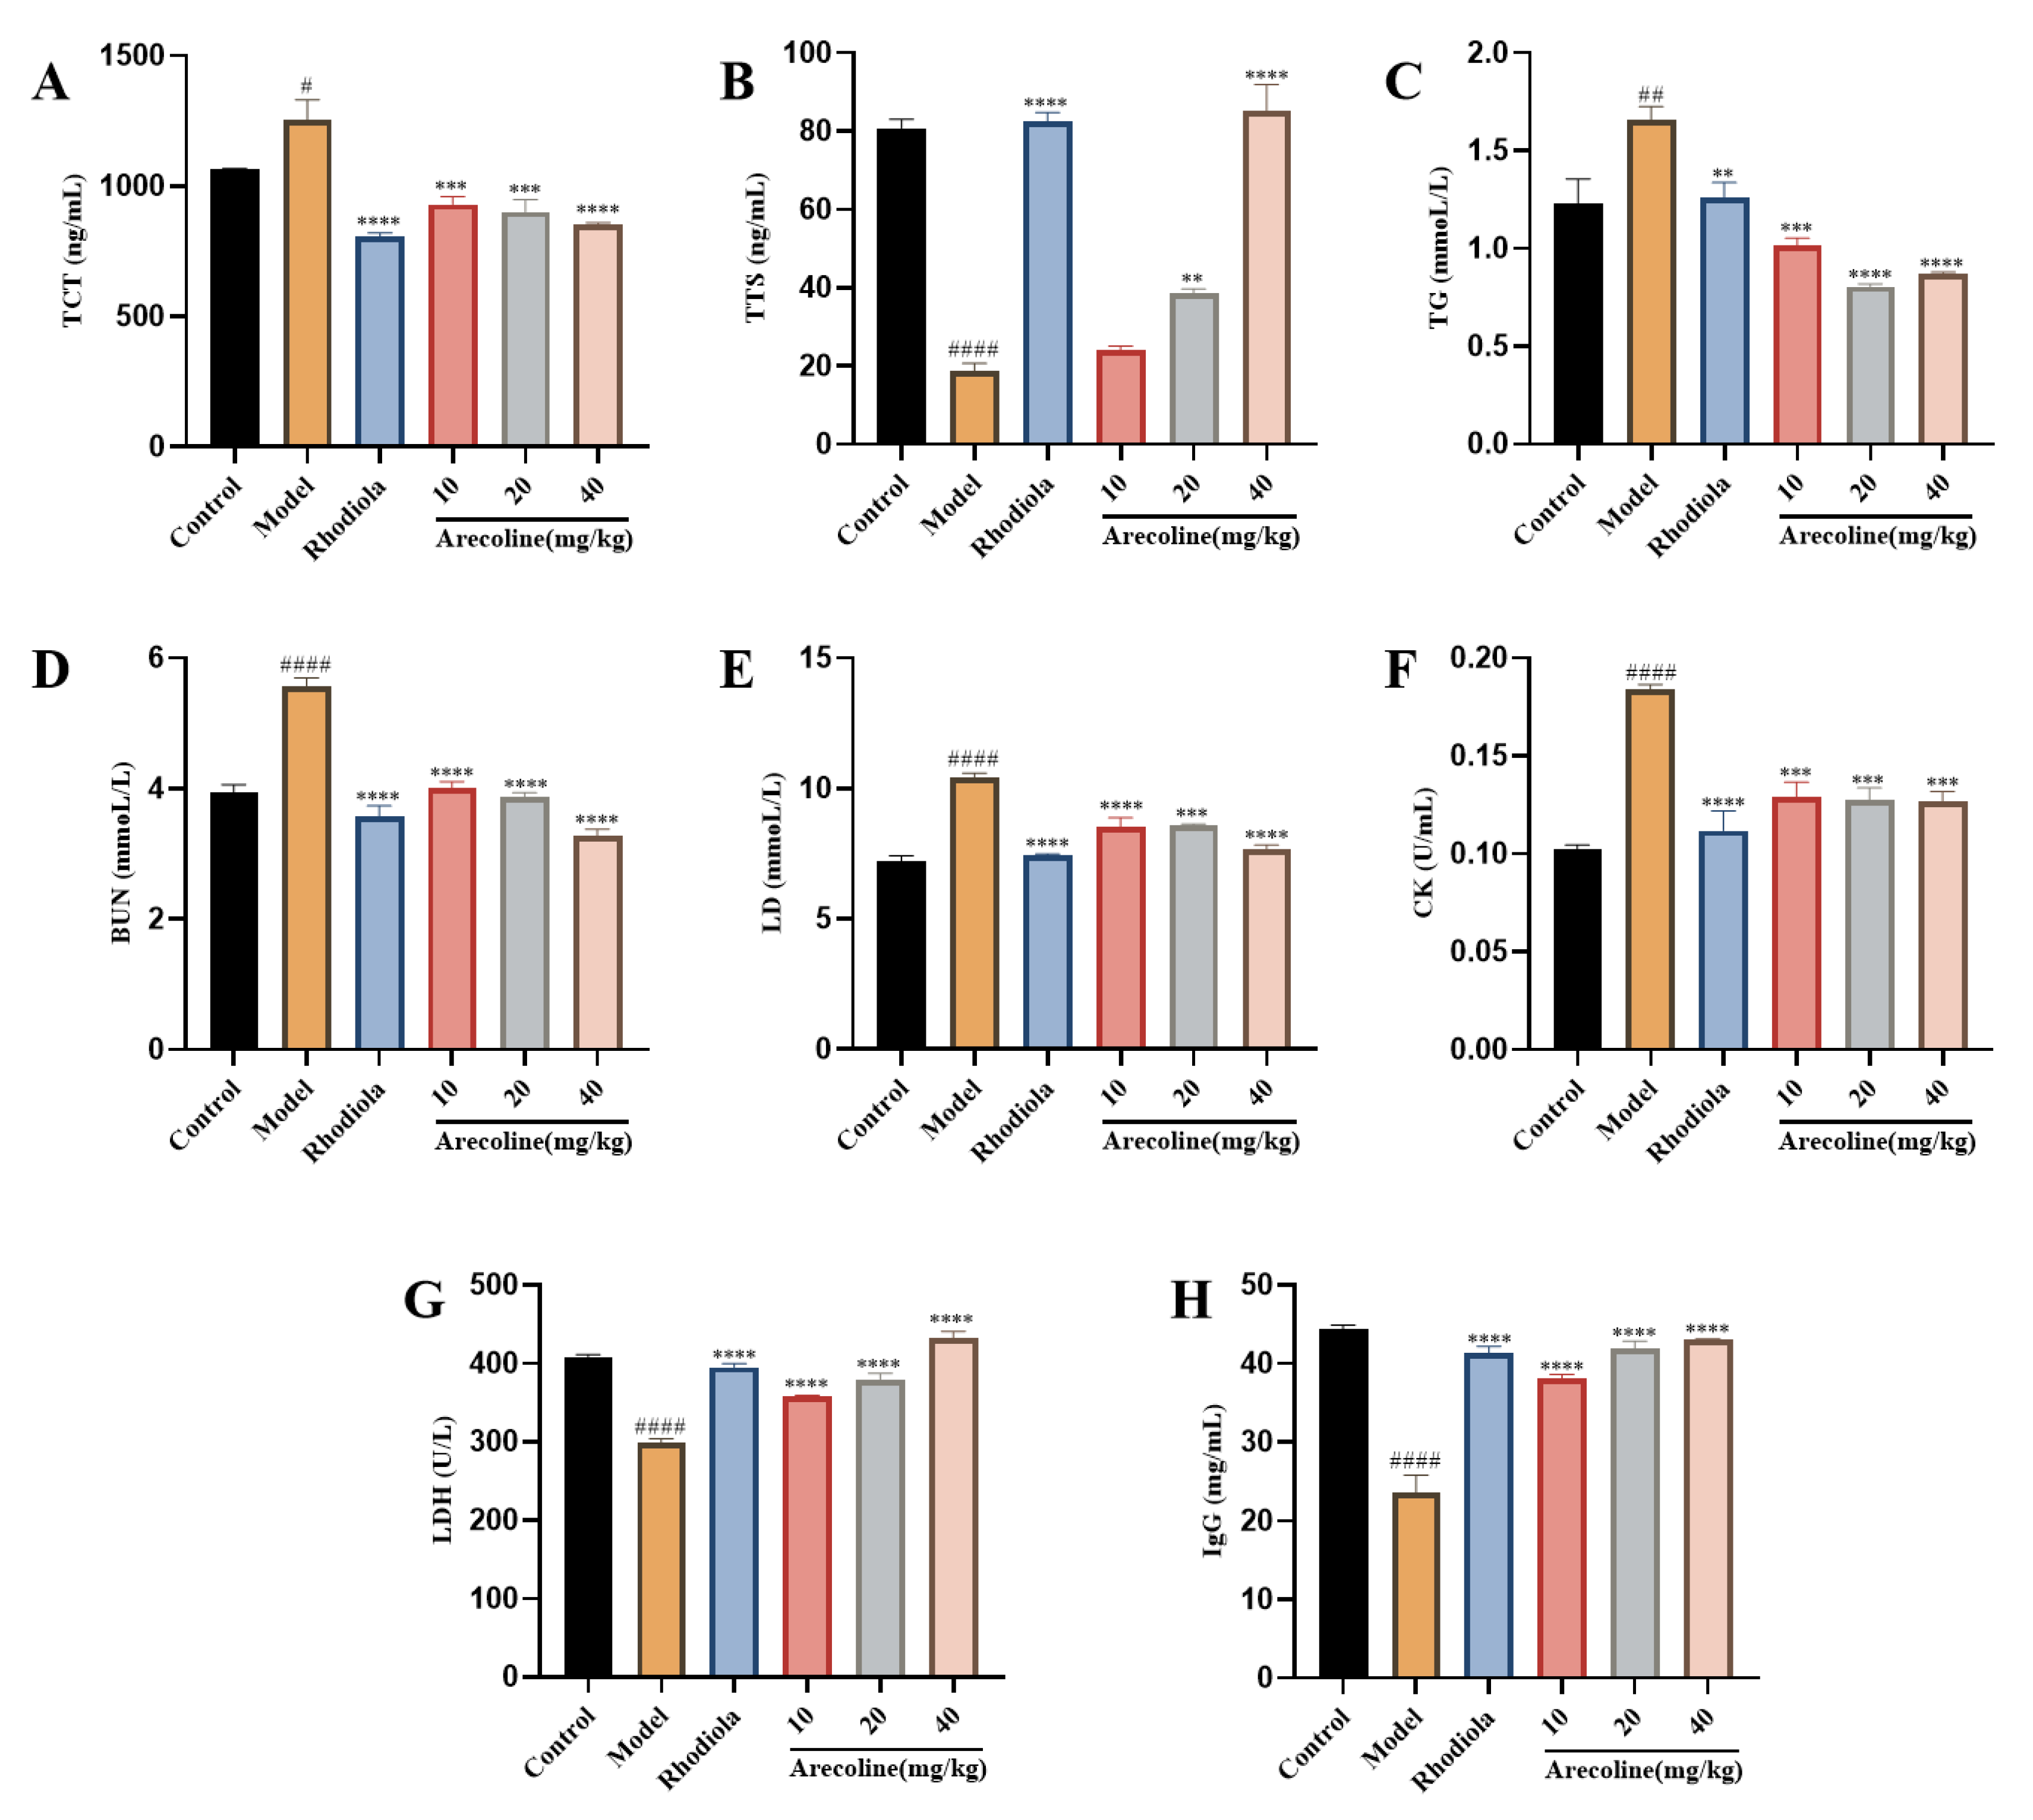
Figure 3.
Effect of arecoline on oxidative stress indexes of gastrocnemius muscle in mice. (A) MDA, (B) SOD, (C) CAT and (D) GSH-Px. Data were expressed as means ± SEM (n = 12). ## P < 0.01, #### P < 0.0001 indicate significant difference compared with the Control group. * P < 0.05, ** P < 0.01, *** P < 0.001, **** P < 0.0001 indicate significant difference compared with the Model group.
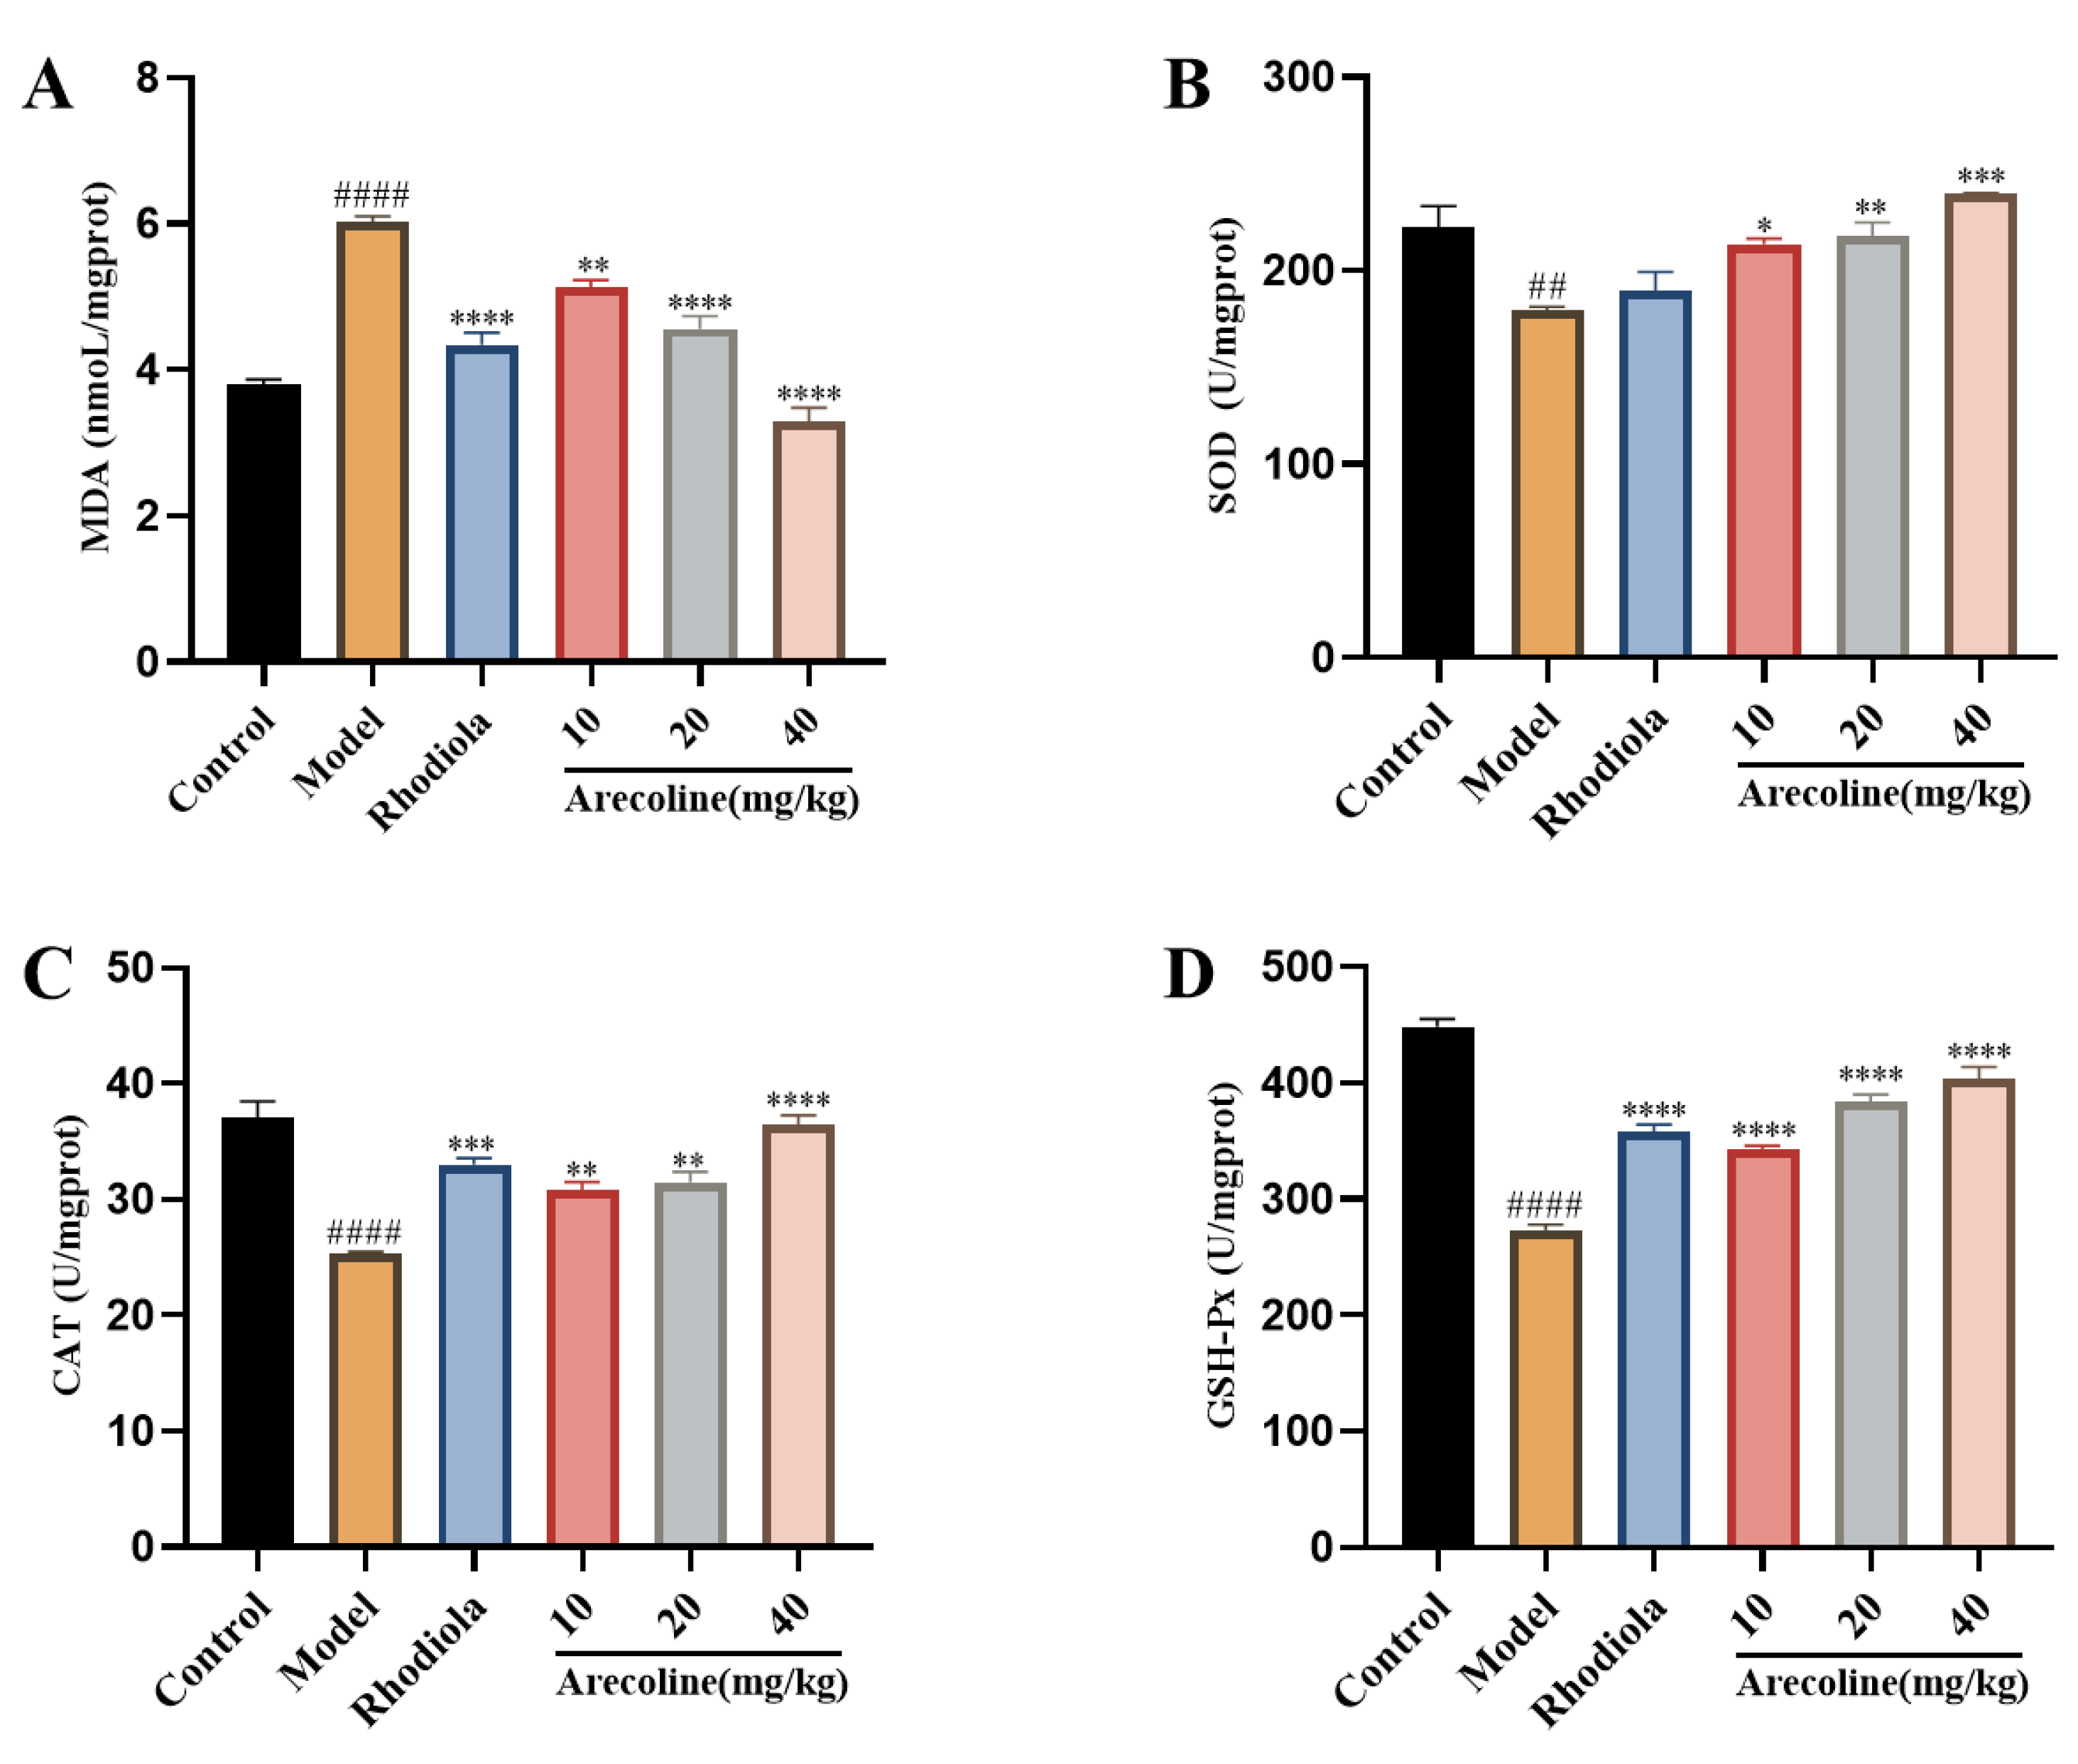
Figure 4.
Effect of arecoline on glycolipid metabolism indexes in mice.(A) liver glycogen and (B) Muscle glycogen. Data were expressed as means ± SEM (n = 12). #### P < 0.0001 indicate significant difference compared with the Control group. ** P < 0.01, **** P < 0.0001 indicate significant difference compared with the Model group.
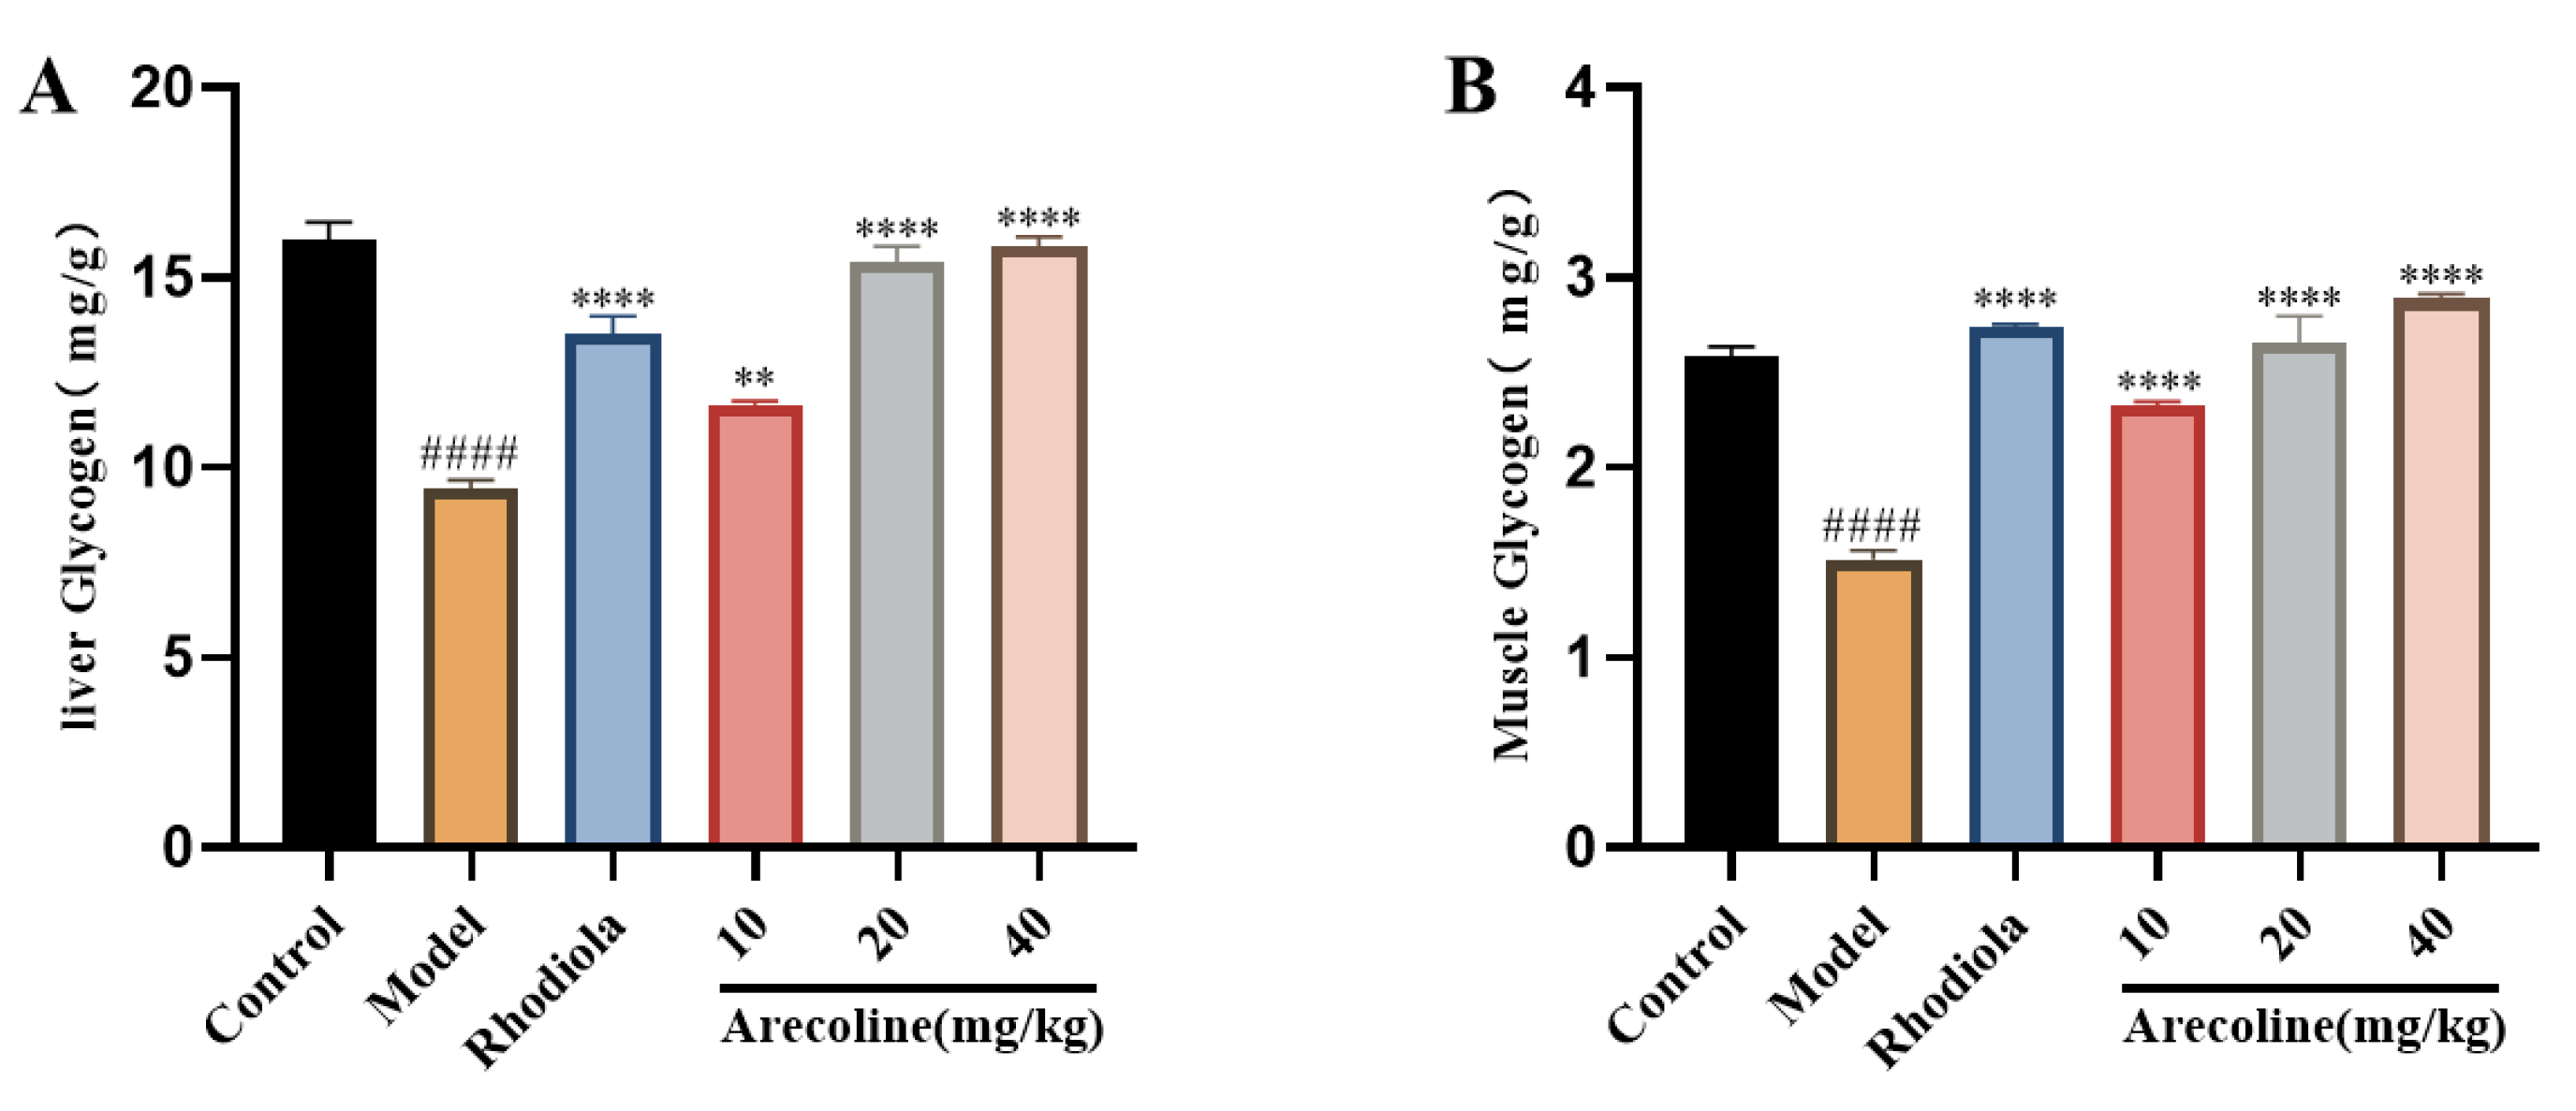
Figure 5.
Effect of arecoline on biochemical indices of mouse hippocampus. (A) SOD and (B) CAT. Data were expressed as means ± SEM (n = 12). ### P < 0.001 indicate significant difference compared with the Control group. * P < 0.05, *** P < 0.001 indicate significant difference compared with the Model group.
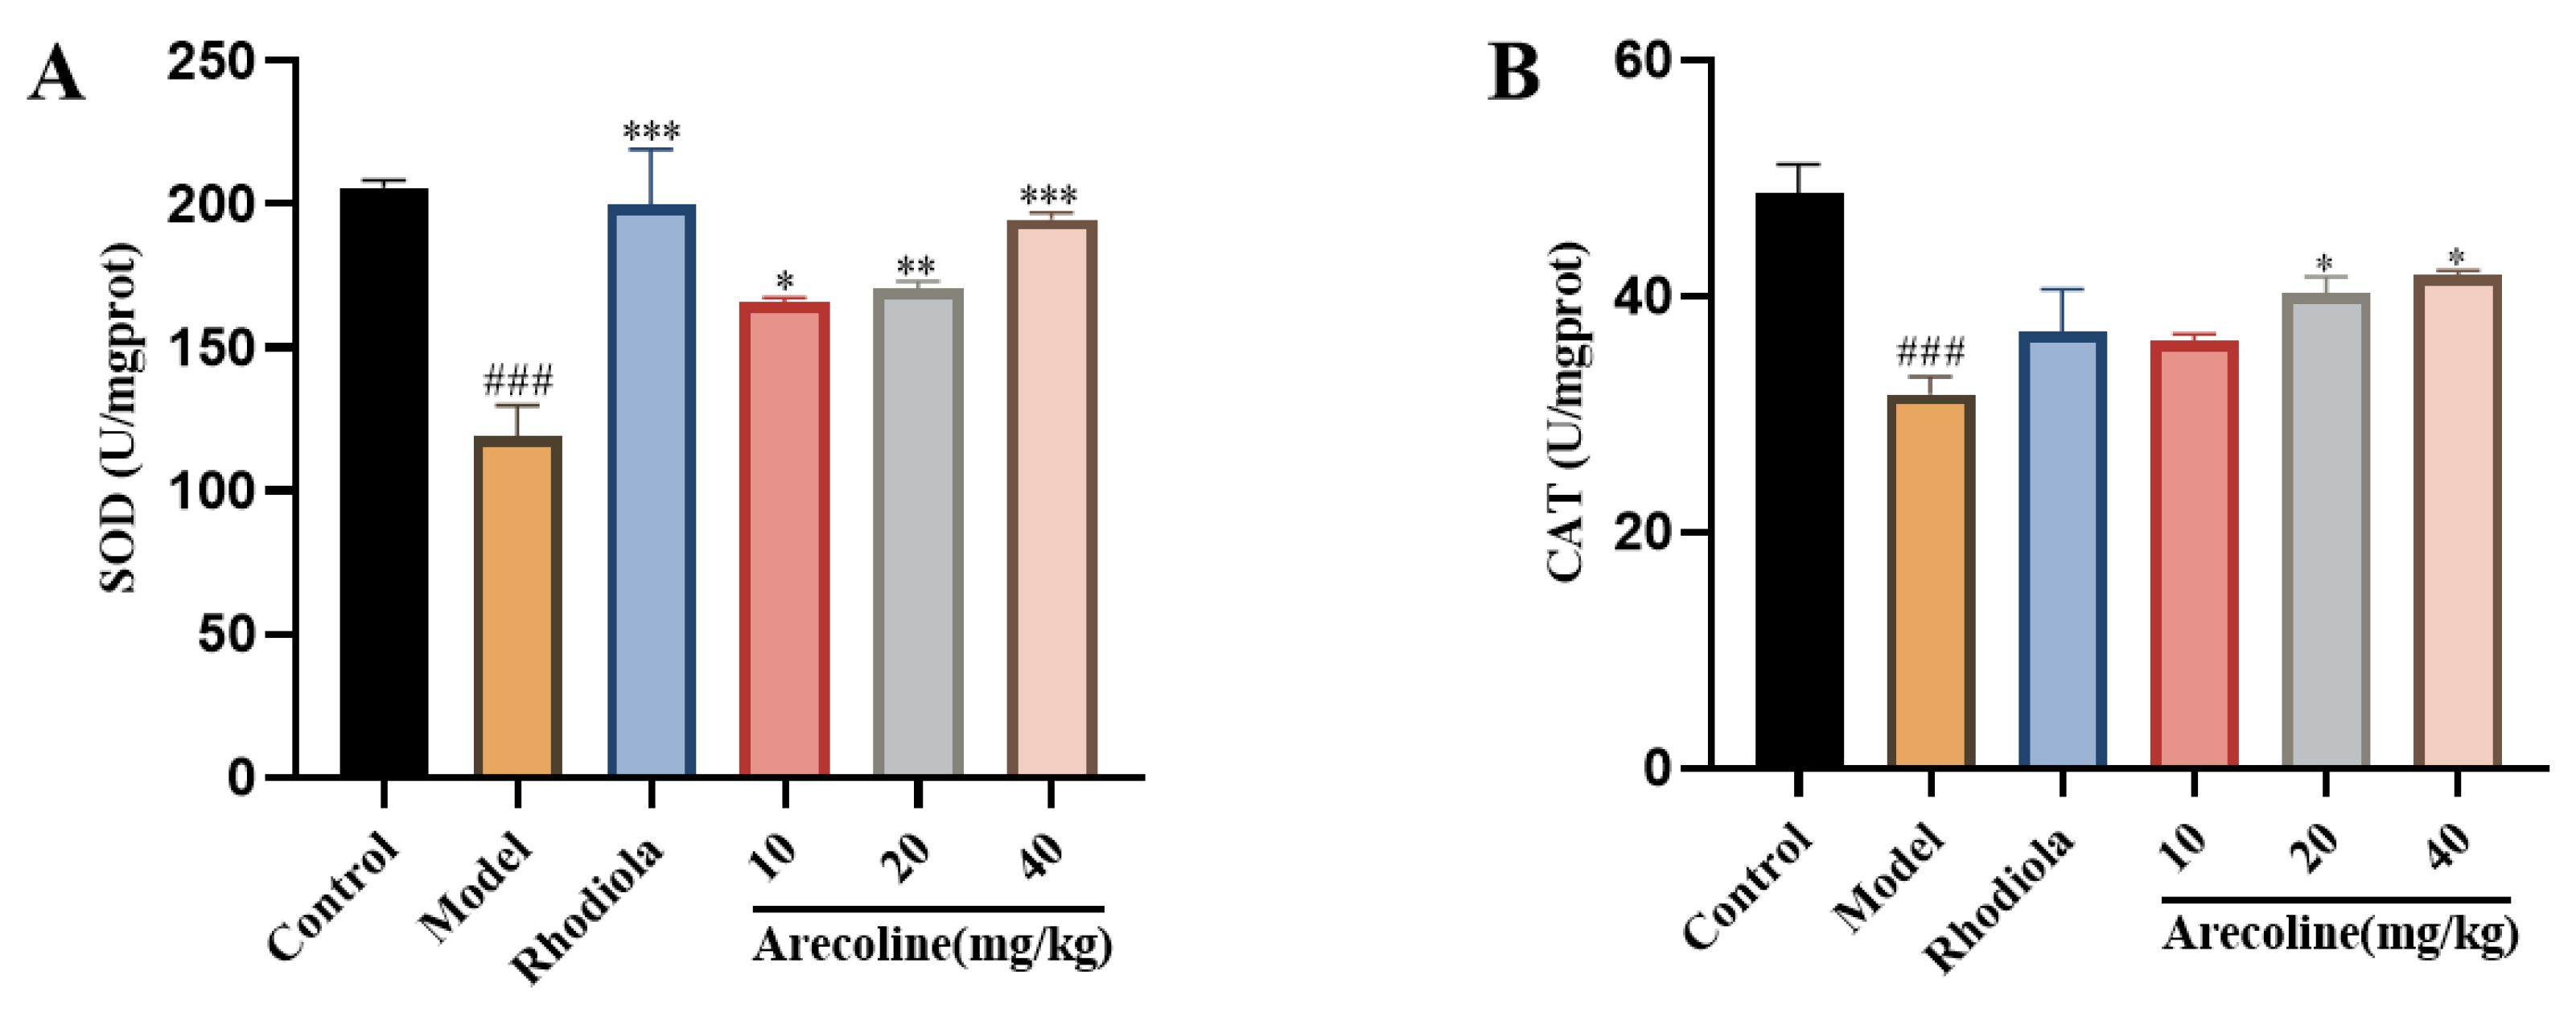
Figure 6.
Effect of arecoline on biochemical indices of mouse hippocampus. (A) TNF-α, (B) IL-6 and (C) IL-1β. Data were expressed as means ± SEM (n = 12). ### P < 0.001, #### P < 0.0001 indicate significant difference compared with the Control group. * P < 0.05, *** P < 0.001, **** P < 0.0001 indicate significant difference compared with the Model group.
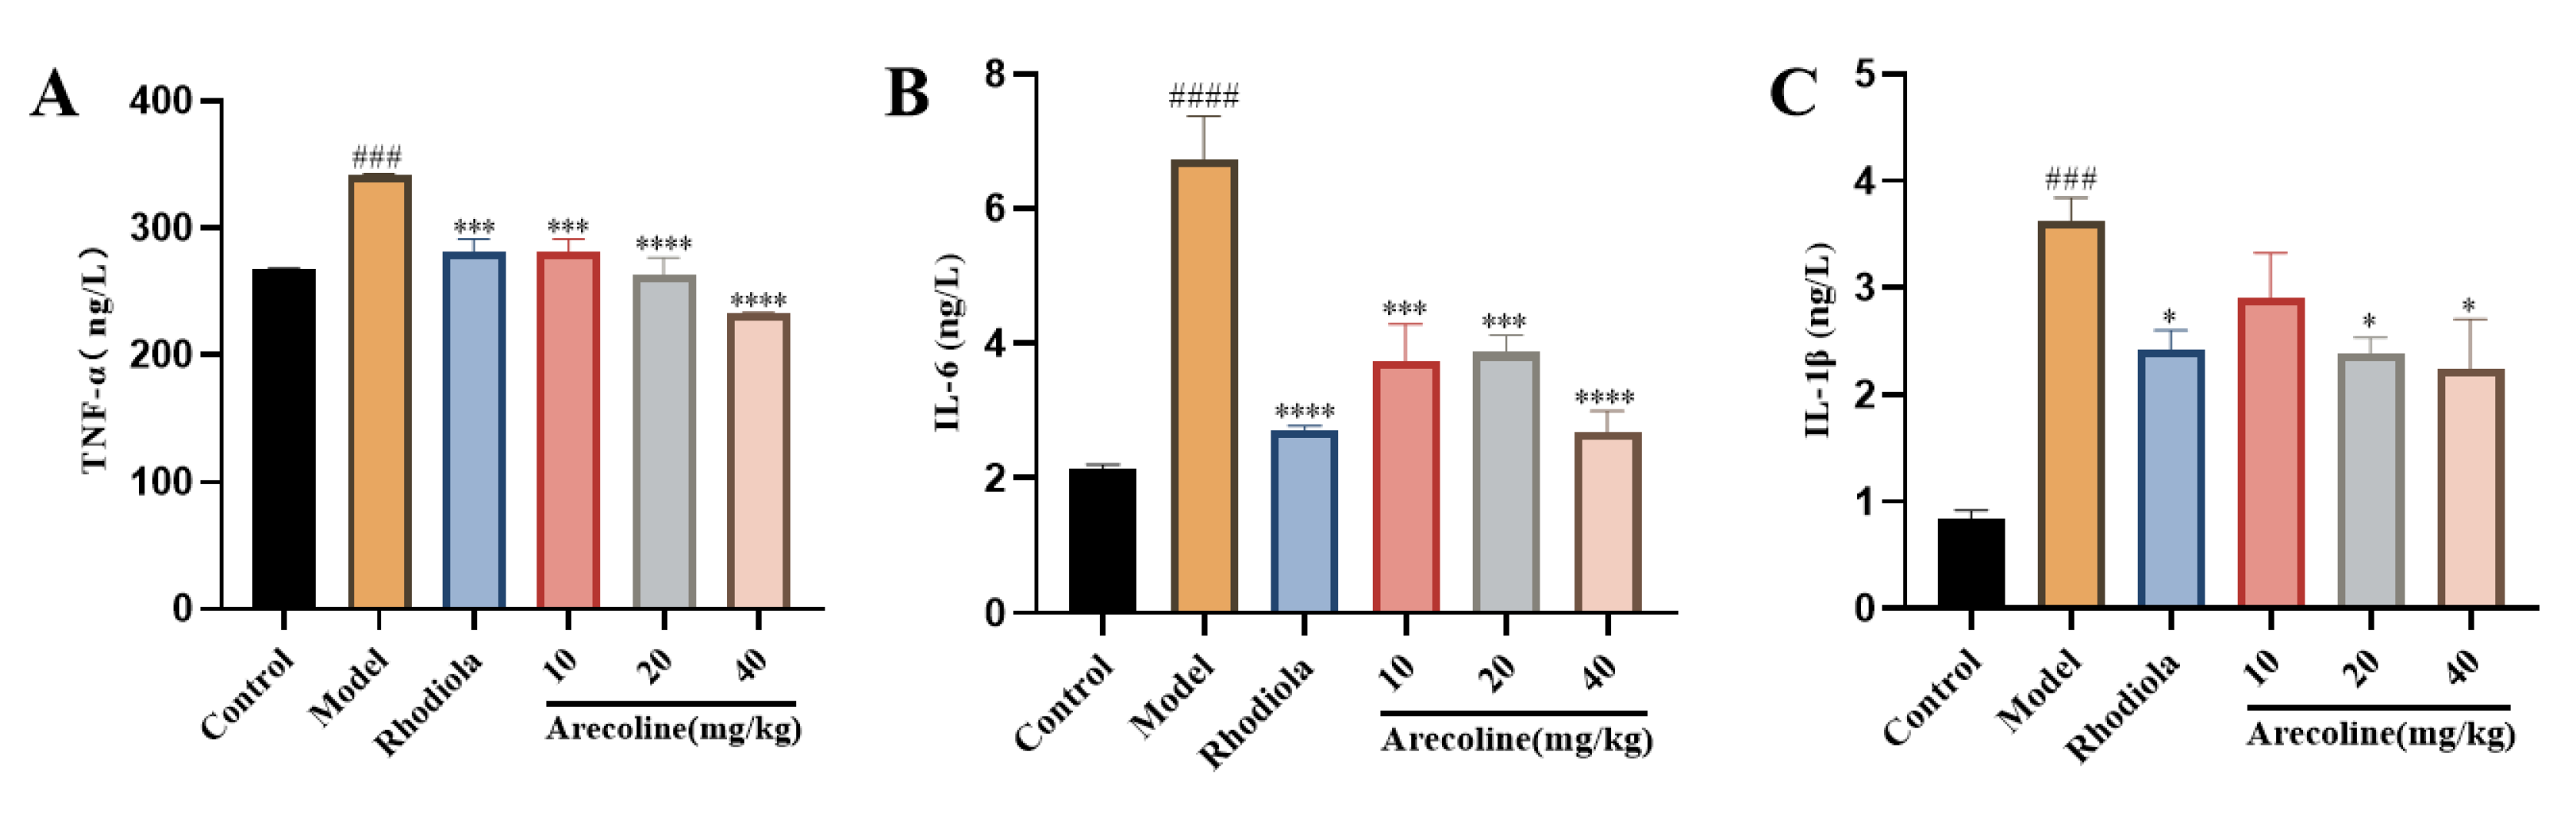
Figure 7.
Effect of arecoline on biochemical indices of mouse hippocampus. (A) DA, (B) NE, (C) 5-HT, (D) GABA and (E) Ach。 Data were expressed as means ± SEM (n = 12). # P < 0.05,## P < 0.01, ### P < 0.001, #### P < 0.0001 indicate significant difference compared with the Control group. * P < 0.05, ** P < 0.01, *** P < 0.001, **** P < 0.0001 indicate significant difference compared with the Model group.
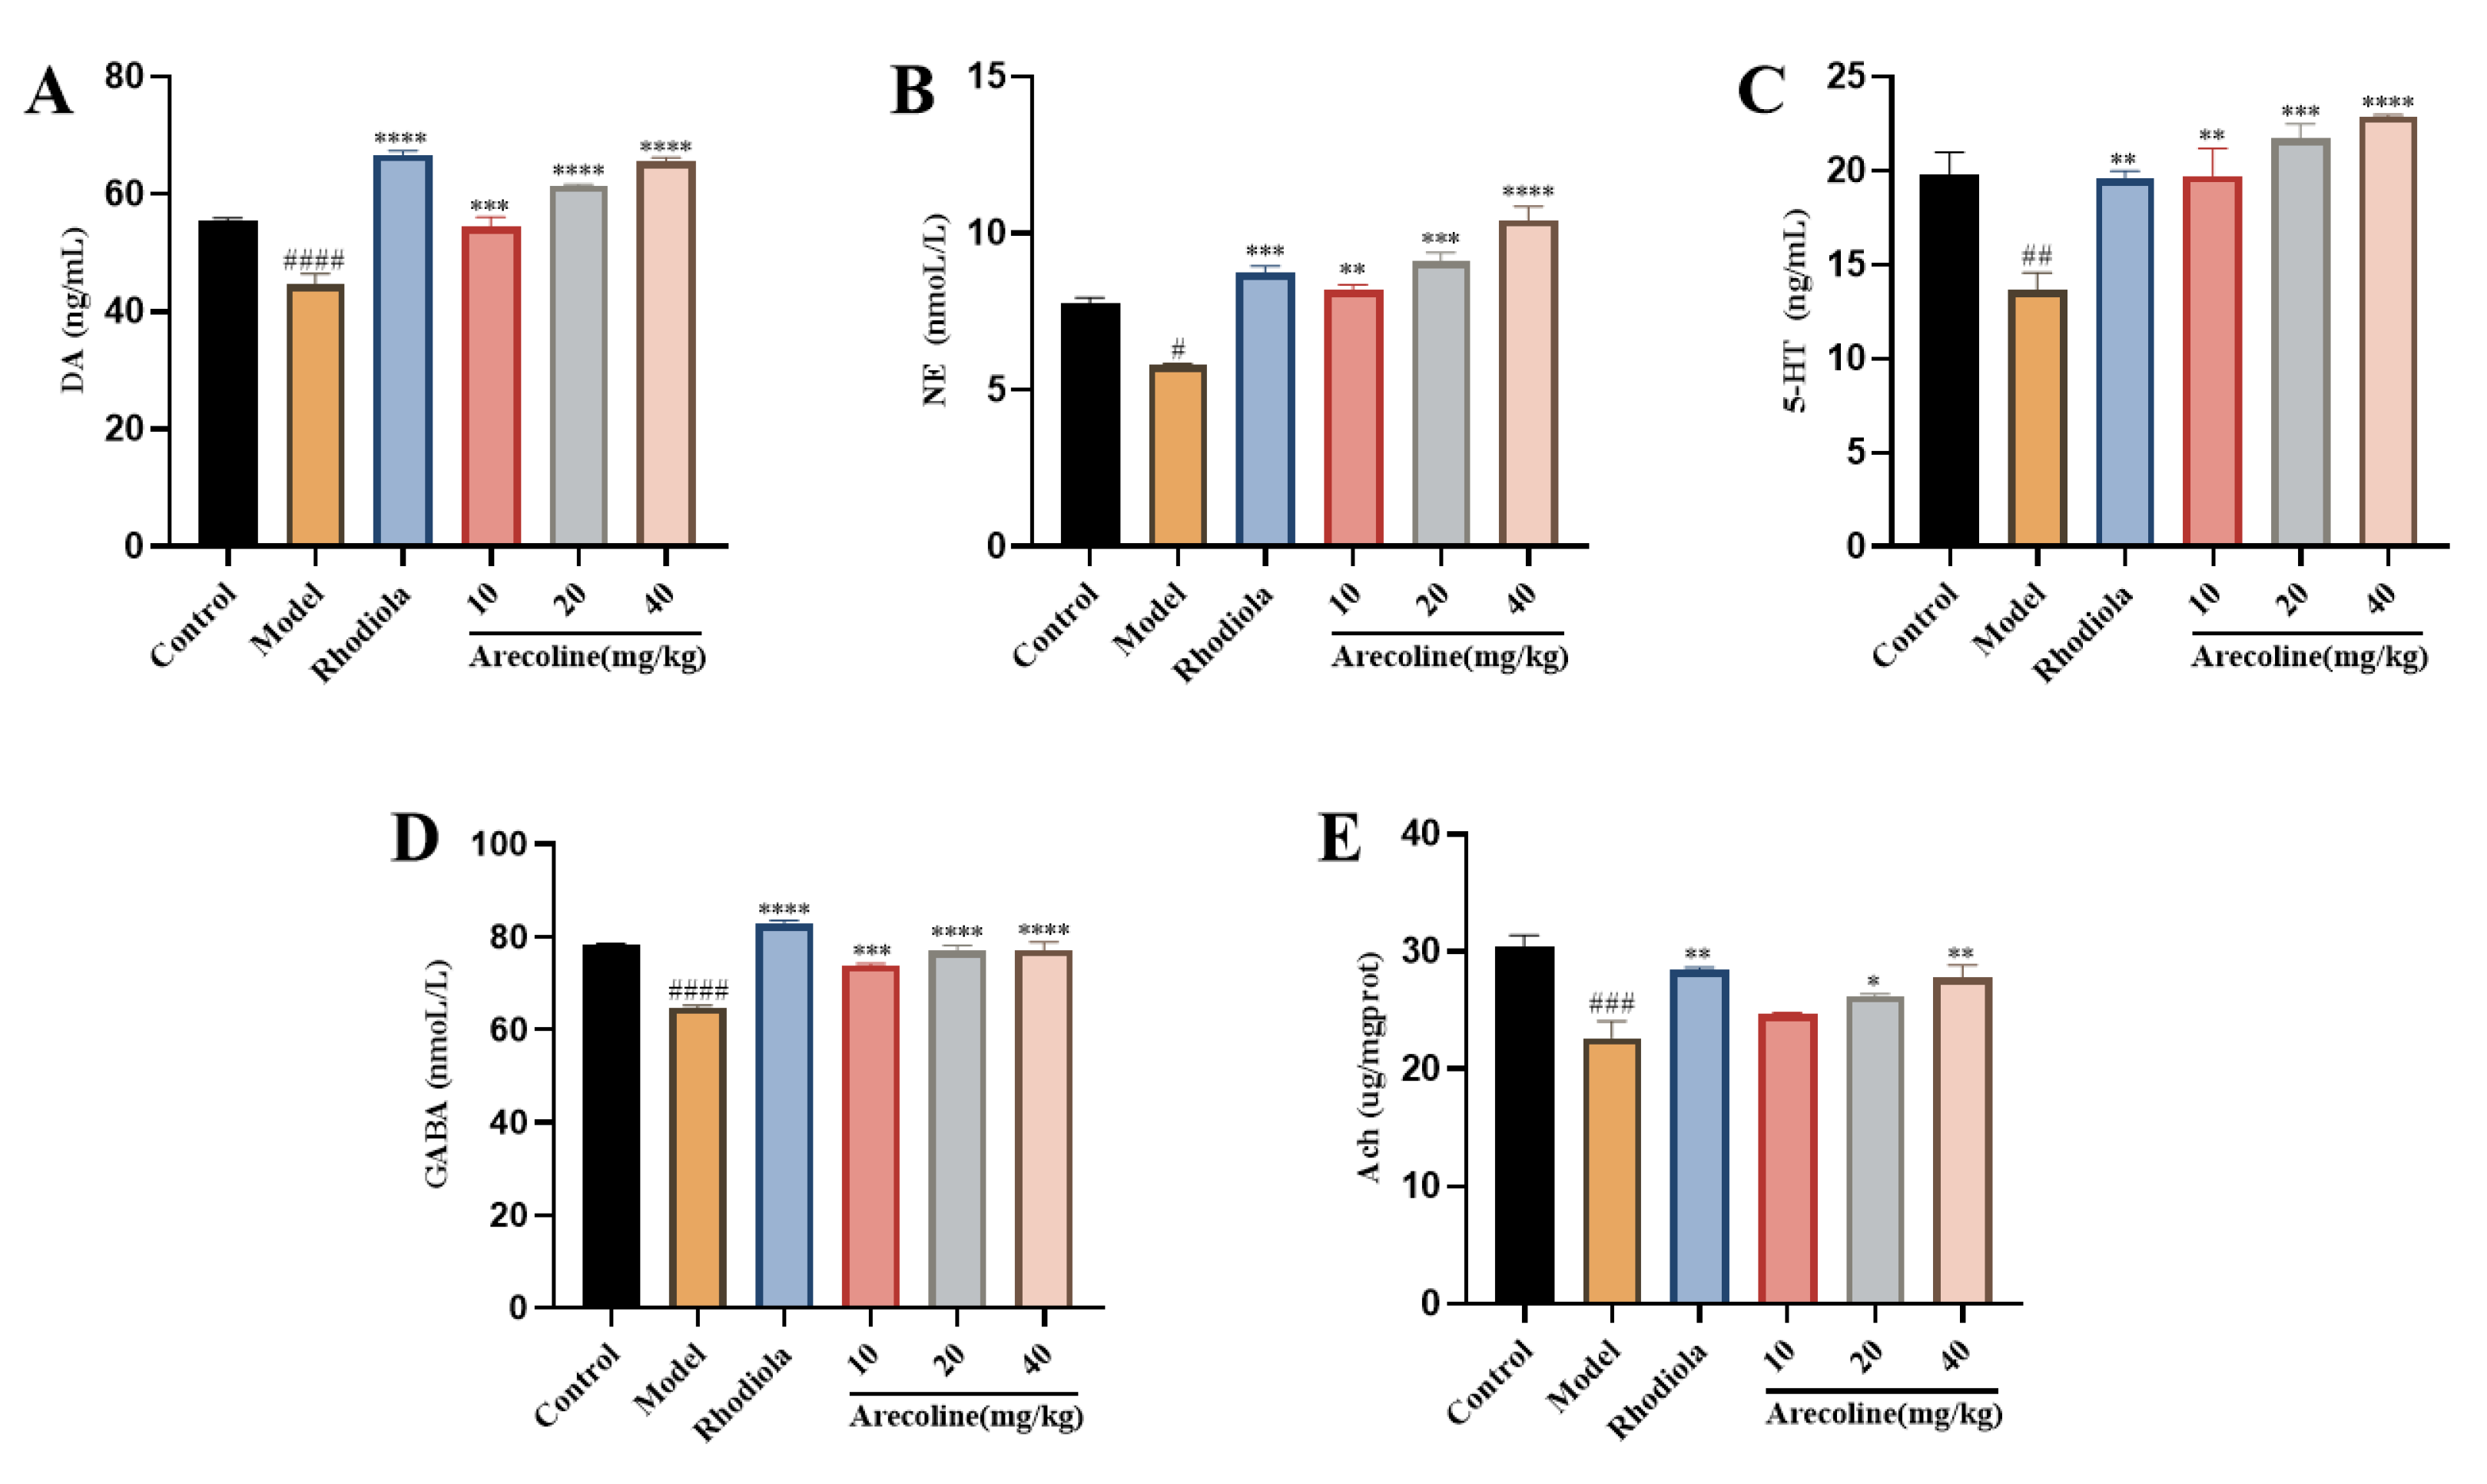
Figure 8.
Effects of arecoline on protein expression in gastrocnemius muscle were evaluated using western blotting.(A-F) The protein levels of Nrf2, Keap1, P62, HO-1 and NQO1 were normalized to GAPDH and their relative band intensities were quantified. Data were expressed as means ± SD (n = 3). ### P < 0.001, #### P < 0.0001 indicate significant difference compared with the Control group. * P < 0.05, ** P < 0.01, *** P < 0.001, **** P < 0.0001 indicate significant difference compared with the Model group.
Disclaimer/Publisher’s Note: The statements, opinions and data contained in all publications are solely those of the individual author(s) and contributor(s) and not of MDPI and/or the editor(s). MDPI and/or the editor(s) disclaim responsibility for any injury to people or property resulting from any ideas, methods, instructions or products referred to in the content. |
© 2024 by the authors. Licensee MDPI, Basel, Switzerland. This article is an open access article distributed under the terms and conditions of the Creative Commons Attribution (CC BY) license (http://creativecommons.org/licenses/by/4.0/).
Copyright: This open access article is published under a Creative Commons CC BY 4.0 license, which permit the free download, distribution, and reuse, provided that the author and preprint are cited in any reuse.


