Submitted:
17 June 2024
Posted:
20 June 2024
You are already at the latest version
Abstract
Simple Summary: Breast cancer is the most common invasive cancer among women. Triple-negative breast cancer (TNBC) accounts for 15–20% of newly diagnosed breast cancers and has the worst prognosis. However, TNBC patients are not a homogeneous group, and there are differences in the course of the disease as well as in response to treatment. For this reason, differentiation of subtypes of this tumor is important for optimal therapeutic decision and risk prediction. The presented study focuses on the expression of the androgen receptor (AR) and the infiltration of T-lymphocytes in the tumor stroma (TILs) of TNBC patients. Correlation of these tested biomarkers with standard prognostic factors. Defining new prognostic factors for 3-year overall survival (OS).
Abstract:
Background: Analysis of the practical benefit of testing the expression of AR and the TILs in patients with TNBC and their correlation with standard prognostic factors.
Methods: The study group consisted of 86 female patients treated for TNBC. T-lymphocyte infiltration was examined in H+E staining. AR expression, CD8 and CD4 T-lymphocytes were evaluated in immunohistochemistry.
Results: Significantly negative correlation was found between AR expression and the CD8 T-lymphocyte infiltration levels. A significant negative correlation was found between the AR expression and G and Ki 67, and a positive correlation between the TILs levels and G and Ki 67. Patients with AR expression and low TILs levels had the highest percentage of diagnosed distant metastases and 3-years OS. Patients with high TILs no distant metastases or deaths were diagnosed. The level of TILs turned out to be a significant independent prognostic factor.
Conclusions: Based on the assessment of AR expression and TILs infiltration, the group of highest and lowest risk was determined. The prognostic factor of known parameters such as TNM and a new factor - TILs was confirmed. On the other hand, parameters such as G and Ki 67 and the tested factor - AR had no effect on the prognosis.
Keywords:
TNBC- triple negative breast cancer
; AR- androgen receptor
; TILs- T-lymphocytes infiltration in the tumor stroma.
1. Introduction
Breast cancer (BC) is the most common malignant tumor and the second leading cause of cancer-related mortality in women [1].
The diagnosis of BC is based on histopathological reports, which is conducted on the basis of which the oncologist determines the most effective method of treatment and the risk of recurrence of the disease.
The most common form of this cancer (70–80%) is the non-special type (NST), the second (10%) is lobular carcinoma. However, within the same histological type of BC, there are differences in biological characteristics. For this reason, based on the evaluation of gene expression, five biological subtypes were distinguished: luminal A, luminal B, HER2, basal and the “normal breast type” (Table 1). In clinical practice, their surrogates are used, and these are determined on the basis of routine immunohistochemical reports. There are four subtypes: luminal A and B, HER2-positive and TNBC (triple-negative breast cancer) (Table 2) [2].
This subtype showed no expression of estrogen and progesterone receptors, and no overexpression of the epidermal growth factor receptor type 2 (HER-2) in the pathomorphological examination.
Compared to hormone receptor positive breast cancer, it is more aggressive and has worse treatment results [6-8]. Also, the risk of recurrence is more frequent and highest in the first 2 years from diagnosis, while relapses after 5 years are rare [9,10].
The clinical and pathological features of TNBC:
- Younger, premenopausal patients;
- Higher grade of malignancy (G);
- T-lymphocyte infiltration in the tumor is more common;
- Higher percentage of patients with a germline mutation of BRCA genes (15%);
- Shorter progression-free survival (PFS);
- More frequently diagnosed metastases in the internal organs and brain.
TNBC includes different histological types. The most common histological types of TNBC after NST include metaplastic carcinoma, medullary carcinoma, lobular carcinoma, apocrine carcinoma and adenoid cystic carcinoma [11]. Compared to NST, metaplastic and lobular carcinomas have a worse prognosis, while medullary, apocrine and adenoid cystic carcinomas have a better prognosis [11-13].
TNBC molecular classification. Based on transcriptome profiling data, Lehmann et al. were the first to propose a division in the TNBC molecular subtypes [12] (Figure 1). They classified TNBC tumors into six clusters: basal-like 1 (BL1), basal-like 2 (BL2), immunomodulatory (IM), mesenchymal (M), stem cell mesenchymal (MSL) and androgen receptor-expressing luminal (LAR). In a subsequent study, the same research team changed their classification from the previous six subtypes to four subtypes (BL1, BL2, M and LAR). In their study, they discovered that the transcripts of the IM and MSL subtypes originate from tumor-infiltrating T-lymphocytes (TILs) and tumor-associated stromal cells [13]. The team led by Jiang et al. also analyzed the clinical, genomic and transcriptomic data of 465 TNBC patients [14] (Figure 1). They classified TNBC into four mRNA-based subtypes—LAR (luminal AR), which is characterized by androgen receptor signaling; IM (immunomodulatory), which shows a high immune-cell signaling and expression of cytokine signaling genes; BLIS (basal-like and immunosuppressive); and MES (similar to mesenchymal). Through using the division of TNBC into the four subtypes that are detailed within The Cancer Genome Atlas (TCGA) in a retrospective analysis of clinical trials, it was assessed [13] that there are differences between subtypes in terms of disease progression and metastasis location. Namely, BL1 tumors are of a higher grade but a lower stage than LAR. Regional lymph nodes and bone metastases were most commonly involved in LAR, while in the case of subtype M, lung metastases were diagnosed more often. The apocrine type was characteristic of LAR, and the metaplastic type was characteristic of MSL [13].
Infiltration of T-lymphocytes in the tumor stroma (TILs) in TNBC.
Malignant transformation changes the ordered structure of tissues and induces an immune response that can destroy a neoplastic tumor in its early stages. However, some cancer cells are able to escape immune control in the process of immunoediting [15]. The theory of immunoediting defines the malignant progression that results from the interaction of tumor cells and immune cells into three phases: elimination, equilibrium and escape. Despite the inability of the immune system to reject a clinically detectable tumor, the organized immune response in the tumor may suggest the formation of an immune memory and the potential to effectively combat residual disease [16]. Cancer progression is characterized by interaction with cells in the tumor microenvironment.
In 2012, the International Breast Cancer Biomarker Immuno-Oncology Working Group (TILs-WG) was established to create a globally standardized approach for assessing lymphocyte infiltration in breast cancer tumors.
At the end of 2017, an update on the recommendations for the assessment of TILs in breast cancer by the International Immuno-Oncology Working Group was published [17].
Androgen receptor expression in TNBC.
Although estrogens dominate the development of female breasts, AR expression is significant as androgens are also essential in this process [18]. Testosterone maintains the hormonal balance of the mammary glands as it is preferentially converted to DHT and, in the absence of estrogens, is metabolized to E2.
The function of AR in the pathogenesis of breast cancer may partly depend on the molecular phenotype of the tumor, the environment and the expression of other hormone receptors [19].
In triple-negative breast cancer, AR expression may be positive in up to 50% of cases, and expression levels vary significantly between TNBC molecular subtypes [20]. In a retrospective study by Thike et al. with 699 patients, positive AR expression was associated with longer disease-free survival [21]. In the LAR type of TNBC, patients had a longer overall survival but a lower pathological complete response rate to neoadjuvant chemotherapy [22,23]. The value of AR as a biomarker is still undetermined. This is due to the lack of a specific cut-off value for positive AR expression, as well as the dual role of AR as a suppressor or inducer of tumor progression.
Despite the continuous introduction of new therapies in TNBC, chemotherapy (CTH) is still the standard of care, both in the early (neoadjuvant and adjuvant CTH) and metastatic stages. However, TNBC patients are not a homogeneous group. For this reason, research has been carried out for years to better define and divide this heterogeneous group. This is important for making the right therapeutic decisions and for applying appropriate treatment methods. In independent papers, Lehmann and Jiang defined different TNBC subtypes that were based on their molecular studies. These subtypes included the immunomodulatory group and the luminal group that express the androgen receptor (AR), which gave different prognostic information. However, due to the complexity of these molecular studies, this division does not apply to the routine work of a pathologist. The main aim of this study was to evaluate the expression of AR and T-lymphocyte infiltration in the tumor stroma (TILs) within the population of patients with TNBC before systemic treatment. Identification of the subgroups was performed according to the assessed new biomarkers in this group of breast cancer patients. Proof of the clinical relevance of these biomarkers were based on an analysis of deaths within 3-year OSs.
2. Materials and Methods
The data of the 6000 patients treated for breast cancer at the Oncology Clinic of the Medical University of Poznań, Poland in the Department of Chemotherapy in the years 2012–2019 were retrospectively analyzed.
A total of 720 patients (12%) diagnosed with TNBC were selected, of whom 116 met the inclusion criteria:
- Stage I–IV and ECOG 0–2;
- An age from 18;
- No previous systemic treatment for breast cancer;
- Available histopathological material from the primary breast tumor.
Due to the lack of histopathological material for immunohistochemistry, the final study group consisted of 86 female patients in whom histopathological material was obtained from the primary tumor, before systemic treatment, as a result of core-needle biopsy or through the surgical treatment of breast cancer.
The clinical data included in the medical history were analyzed:
- The clinical TNM, age and menopausal status at diagnosis;
- The history of hereditary breast cancer, including the presence of BRCA1 or of 2 mutations and the BMI;
- ECOG;
- Pathology report and immunohistochemical test results.
All procedures were approved by the Bioethics Committee at the Medical University of Karol Marcinkowskiego in Poznań, Poland (resolution number 49/17). All patients gave written consent to use their clinical data and histopathological material for scientific purposes.
2.1. T-Lymphocytes in the Tumor Stroma in H + E Staining
The tissue material was fixed in a 10% buffered formalin solution and placed in a vacuum processor. Then, the tissue was embedded in paraffin at 58 °C according to classical histological methods. Sections with a thickness of 4 μm were cut from paraffin blocks and then applied to adhesive slides. The sections were incubated in an incubator for 2 h at 58 °C. Staining with Mayer’s hematoxylin from Aqua-med was performed for 12 min (blue staining of the cell nuclei). Staining in a 1% eosin solution by Aqua-med for was conducted for 2 min (cytoplasm being staining red).
The T-lymphocyte infiltration in the tumor stroma was assessed according to the recommendations of the International Working Group on Immuno-Oncology of Breast Cancer Biomarkers (Figure 2, Figure 3, Figure 4, Figure 5, Figure 6 and Figure 7). The results are reported as the percentage of lymphocytes in the tumor stroma.
2.2. T-Lymphocytes in the Tumor Stroma in Immunohistochemistry
The following reagents and immunoreagents were used in the tests:
- (a)
- Reagents:
- -
- Envision FLEX, Mini Kit, High pH (Link);
- -
- EnVision FLEX Hematoxylin (Link).
- (b)
- Immunoreagents:
- -
- Antibodies:
- ∙
- FLEX Monoclonal Mo a Hu CD4, Clone 4B12, RTU;
- ∙
- FLEX Monoclonal Mo a Hu CD8, Clone C8/144B, RTU.
2.3. Androgen Receptor Expression in Immunohistochemistry
The following reagents and immunoreagents were used in the tests:
- (a)
- Reagents:
- -
- EnVision™ FLEX Target Retrieval Solution, High pH (50×).
- (b)
- Immunoreagents:
- -
- Antibodies: DAKO Monoclonal Mouse Anti-Human Androgen Receptor Clone AR441.
A color reaction in at least 1% of the cells was considered positive.
Correlation analysis between TILs, AR and the clinicopathological data was performed using Spearman’s test. Differences between the groups were calculated using a Kruskal–Wallis rank ANOVA. In the analysis of comparisons between the groups of ordinal variables, Fisher’s exact test for RxC tables was used. The Kaplan–Meier method was used to estimate survival curves, and the log-rank test was used to examine the differences between the groups. The influence of selected factors on survival was assessed by Cox proportional hazards regression.
3. Results
3.1. Characteristics of the Study Group According to Standard Markers
Most patients were postmenopausal at the time of diagnosis (n = 55; 63.95%), and the median age was 57 years. More than half of the patients were in good condition with an ECOG of 0 (n = 52; 60.42%). When taking into account the BMI value, there were almost equal numbers of overweight or obese patients (n = 44; 48.84%) vs. those with normal weight (n = 40; 45.51%). The majority of patients (n = 67; 77.91%) were diagnosed with breast cancer not related to its hereditary occurrence with or without BRCA1/2 mutation (Table 3 and Figure 15).
The older the patient, the higher the BMI level. A statistically significant (p < 0.001) positive correlation (Spearman’s rho 0.49) was found between the BMI degree and the age of diagnosis (Figure 16).
The most frequently diagnosed histopathological type in the study group was NST cancer (n = 69; 80.23%). The assessed tumors were characterized by a high degree of malignancy, where G3 accounted for more than half of the cases (n = 49; 56.98%) and the median Ki 67 was 60%. In addition, in the metaplastic type, which was the second most numerous group after NST, only the third grade of histological malignancy (G3) was diagnosed, which was statistically significant (−2.037; p = 0.041) (Table 4 and Table 5).
T2 was clinically diagnosed more frequently (n = 35; 40.70%) where the size of the primary tumor was 2–5 cm. More than half of the patients had no N0 regional lymph node involvement (n = 50; 58.14%). The vast majority did not have M0 distant metastases (n = 76; 88.37%) (Table 6).
3.2. Characteristics of the Study Group According to AR Expression and TILs
In the study group, AR = 0%, i.e., those without the expression of the AR prevailed (n = 63; 73.3%). All patients had T-lymphocyte infiltration in their tumor stroma ((TILs > 0%) (n = 86; 100%) and the median TILs was 20% (Table 7, and Figure 17 and Figure 18)).
Evaluation of the correlation between AR expression and TILs.
A negative correlation (Spearman’s rho −0.192) was found between the level of AR expression and the TILs. Although it was not statistically significant (p = 0.077), there was a trend: the higher the AR expression, the lower the level of TILs (Table 8 and Figure 19).
In the study group with a high level of AR expression (≥ 80%), the level of TILs was lower. There was a statistically significant (p = 0.0159) difference between the groups with a high AR expression (≥ 80%) and low AR expression (< 80%) depending on the TILs; however, there was no difference between the groups without AR expression (= 0%) and those with AR expression (> 0%) (Figure 20 and Table 9).
In the study group with a high level of AR expression, the level of CD4 TILs was lower. There was a significant difference (p = 0.035) between the groups with high AR expression (≥ 80%) and low AR expression (< 80%) depending on the CD4 TILs (Figure 21 and Table 9).
The higher the expression of the AR, the lower the level of the CD8 TILs. A significant (p = 0.041) negative correlation (Spearman’s rho −0.221) was found between the level of AR expression and CD8 TILs (Figure 22). In the study group with a high level of AR expression, the level of CD8 TILs was lower. There was a significant difference (p = 0.011) between the groups with high AR expression (≥ 80%) and low AR expression (< 80%) depending on the CD8 TILs (Figure 23 and Table 9).
3.3. Presentation of the Clinical Significance of the Tested Biomarkers Based on the Analysis of Deaths in TNBC Patients
An overall survival time of 3 years was found in the study group of TNBC patients. The longest follow-up period was 122 months, and the shortest was 37 months. For the analysis of deaths, a 3-year observation period was used, and this was censored for each patient; therefore, the maximum in statistical studies was 36 months. Within 3 years of diagnosis, 16 patients died. The three-year survival rate in the study group was 81.4% (Figure 24).
Data were compared for the group of patients who died before 3 years of follow-up (OS < 36) and those who lived for at least 3 years from the time of diagnosis (OS ≥ 36). The comparison of the groups showed that, among the standard parameters assessed in breast cancer, the TNM stage (according to AJCC) differed depending on the 3-year OS. However, there was no significant difference between the groups in tumor grade G or proliferation index Ki 67 (Figure 25, Figure 26 and Figure 27 and Table 10). At the same time—when comparing the groups—it was shown that, among the newly assessed parameters in breast cancer, the level of TILs, CD4 and CD8 differed depending on the 3-year OS. However, there was no significant difference in the level of AR expression between the groups (Figure 28, Figure 29, Figure 30 and Figure 31 and Table 11).
In the study group, in which the patients lived for 3 years or more (OS ≥ 36), the size of the primary tumor (T) was smaller. The difference between the group with an OS ≥ 36 and patients who died within 3 years of diagnosis (OS < 36) was significant (p = 0.047) (Figure 25 and Table 10).
In the study group, in which the patients lived for 3 years or more (OS ≥ 36), the degree of involvement of the regional axillary lymph nodes (N) was lower. The difference between the group with OS ≥ 36, and patients who died within 3 years of diagnosis (OS < 36) was significant (p < 0.001) (Figure 26 and Table 10). In the study group in which the patients had an OS ≥ 36, the presence of distant metastases (M) was less frequent. The difference between the group with an OS ≥ 36 and patients with an OS < 36 was significant (p < 0.001) (Figure 27 and Table 10). In the study group, in which the patients had an OS ≥ 36, the level of T lymphocyte infiltration in the tumor stroma was higher. The difference between the group with OS ≥ 36 and patients with OS < 36 was significant (p = 0.009) (Figure 28 and Table 11).
In the study group, in which the patients lived for 3 years or more (OS ≥ 36), the level of CD4 T lymphocyte infiltration in the tumor stroma was higher. The difference between the group with an OS ≥ 36 and patients with an OS < 36 was significant (p = 0.008) (Figure 29 and Table 11).
In the study group in which the patients lived for 3 years or more (OS ≥ 36), the level of CD8 T lymphocyte infiltration in the tumor stroma was higher. The difference between the group with an OS ≥ 36 and patients with an OS < 36 was significant p = 0.024 (Figure 30 and Table 11).
There was no difference in the level of AR expression between the study groups (OS ≥ 36 vs. OS < 36) (Figure 31 and Table 11).
In addition to the analysis of the deaths in the study group, four groups were classified depending on the level of the TILs and AR expression in the tumor. The highest percentage of deaths during the 3-year follow-up was found in Group IV with a low level of TILs (TILs ≤ 10%) and a positive expression of AR (AR > 0%), whereas no deaths were recorded in Group III, who had a high level of TILs (TILs > 10%) and positive AR expression (Table 12). Differences between the four groups were noted on the survival function plot (Figure 32). Due to the risk of error (Bonferroni correction), not every group was compared with every other group. There was no statistically significant difference between the four groups in the 3-year OS analysis. However, there was a significant difference (p = 0.046) between the two groups for the TILs (TILs ≤ 10% and TILs > 10%), thus confirming that this new biomarker was a significant prognostic factor in the TNBC study group analysis (Figure 33 and Table 13).
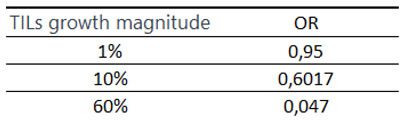
The adopted Cox model showed that only TILs as an independent prognostic factor had a significant impact on the 3-year OS. AR expression did not affect overall survival 3 years from diagnosis in the study group (Table 14 and Table 15). It has also been shown that patients with lower levels of TILs have a higher risk of death than patients with greater infiltration. The OR for a 10% increase in TILs was 0.6017. This means that an increase in TILs from 1% to 60% was associated with a 95% reduction in the incidence of death (Table 16).
4. Discussion
TNBC is a subgroup of breast cancer that lacks expression of the ER, PR and HER-2 receptors, and it has undefined therapeutic targets. TNBC accounts for 15–20% of newly diagnosed breast cancer cases [6,24]. Compared to breast cancers thar express hormone receptors, it is more aggressive and has worse treatment results [6,7,8]. The risk of recurrence is also more frequent and highest in the first 2 years from diagnosis, while relapses after 5 years are rare [9,10].
Although the molecular mechanisms responsible for the progression in this heterogeneous type of breast cancer are constantly being sought, there are still no potential prognostic and predictive factors. Technical development in the last decade has allowed for a thorough genetic analysis of neoplastic tumors, including TNBC. However, the assessment of polymorphisms, mutations within DNA, as well as gene transcriptions that use the RNA micromatrix require a prospective collection of biological material and experienced personnel with access to extensive technical facilities. Since the time of diagnosis is important in everyday oncology practice, it is hard to imagine that every case of TNBC could now be so thoroughly investigated. For this reason and due to its retrospective nature, the present study uses standard pathomorphological and immunohistochemical techniques that are currently available in every laboratory that deals with histopathological assessments of breast cancer.
Data from approximately 6000 patients who were treated for breast cancer were retrospectively analyzed. Despite the huge archival potential, due to the inclusion criteria, the study group consisted of 86 female patients who were treated for triple-negative breast cancer in stages I–IV. The most important inclusion criterion turned out to be the availability of histopathological material, which, in accordance with the guidelines of the international working group (TIL-WG), was carried out on the tissues from the primary tumor, before systemic treatment, as a result of core-needle biopsy or through the surgical treatment of breast cancer. The histological evaluation of the TILs during the course of this study was treated only as a promising biomarker. Currently, the St Gallen Breast Cancer Expert Committee has approved the routine assessment of TILs for TNBC patients, with evidence level IB as a prognostic marker in triple-negative breast cancer [21]. In the presented study, the focus was on the assessment of T-lymphocyte infiltration in the tumor stroma; this is because they are the dominant lymphocytes in breast cancer and so are the recommendations.
Knowledge about the relationship between TILs and AR is still limited. Various reports have described a significant relationship between AR expression and the level of TILs [25,26]. Since there are so few published studies that have evaluated the relationship between AR and TILs in TNBC, it is difficult to choose the best method to study this relationship, especially in the context of future meta-analyses. For this reason, all of the statistical analyses and correlations that were assessed in the groups in this paper are presented for the purposes of the potential of future research. The pathology studied in this paper was investigated in relation to AR expression and TILs (including CD4 and CD8 populations), and these were assessed by a single pathologist according to International Working Group guidelines. The pathologist was unaware of the other clinical features. An unobvious conclusion during the histopathological evaluation was that the immunohistochemical examination of CD4 and CD8 T-lymphocytes was helpful due to a more visible color reaction; however, it was not necessary in the assessment of TILs. This conclusion is reflected in the statistical analysis of this study due to the proven strong correlation between the total TILs in the H&E study, as well as in the CD4 (p < 0.001) and CD8 (p < 0.001) T-lymphocyte population in the IHC study. At the same time, the fact that the anti-CD4 antibody used for the assessment of CD4 T-lymphocytes also reacts with macrophage cells confirms that the pathologist’s experience seems to be the most important factor in the assessment of TILs. On the other hand, noticing the diverse environment of immune cells in a neoplastic tumor carries with it the temptation to evaluate other subpopulations, not only CD4 and CD8 T-lymphocytes, but also Tregs, natural killer cells and even B-lymphocytes. Perhaps the assessment of the entire immune microenvironment in a tumor would provide important information on immune activation or repression.
There is pressure to assess the immune response in TNBC tumors due to the already available immunotherapies (July 2021), the FDA-approved combination neoadjuvant treatment of pembrolizumab and chemotherapy for the early stage of this type of cancer. Although the expression of PD-L1 is considered a predictor of this therapy, the assessment of TILs among patients with TNBC may be a good start. It should be noted that the quantitative assessment of histopathology has human limitations, and the exact process is usually not standardized. However, though this is a challenge, it does not depreciate the value of TIL research, as advantages such as the low cost of testing and an easy and quick learning process prevail. The main goal of this work was to promote the assessment of TILs to everyday practice, such that the procedure does not significantly affect the working time of the pathologist. The availability of archived H&E stained material is also important. Thanks to this, there is no need for additional cutting of the histopathological material for further examinations. This study showed a probable relationship between AR expression and TIL levels before systemic treatment in TNBC patients. Subgroups of TNBC patients were also noted depending on the expression of AR and the level of TILs. Although there was no statistically significant difference between the four study groups, the “it’s better to have something than nothing, preferably everything” principle seems to hold true for TNBC. This is supported by the lack of deaths within 3 years from the diagnosis in the group of patients with positive AR expression and high TIL infiltration, and by the fact that the highest percentage of deaths observed in the group with low TILs were regardless of the level of AR expression. The team of researchers Ana Tečić Vuger et al. came to similar conclusions, whereby they distinguished a group of patients with a high level of TILs and high expression of AR (who had a statistically significantly better OS compared to patients with a high level of TILs but with a low expression of AR [27]).
5. Conclusions
The presented data suggest that the assessment of the level of TILs is a biomarker that can help clinicians identify patients who are candidates for more intensive treatment. It also seems justified to evaluate AR expression, especially in the group with low levels of TILs, due to the already available targeted therapies for those patients with its positive expression. A group of particular interest due to the intermediate 3-year OS rate appears to be the population of patients with no AR expression and high TIL levels; this is because they were characterized by a high grade of G and Ki 67, which are positive predictive factors for chemotherapy treatment. Unifying the assessment of TILs is now a critical issue in cross-study analyses. Especially in the last 5 years, new promising studies evaluating TILs have been developed: in residual diseases after neoadjuvant chemotherapy in patients with TNBC, as well as in HER-2 positive cancer or even in carcinoma in situ (DCIS) [28,29]. Although the process of developing biomarkers is long and requires efforts from the scientific community to go through the stages of analytical validation, the prognostic value and predictive potential of AR and TILs in TNBC deserve further evaluation in larger-scale studies, as it has potential for clinical utility.
Author Contributions
Conceptualization, O.M.; methodology, O.M.; software, J.M.; validation, O.M., P.K. and J.M.; formal analysis, O.M.; investigation, O.M. and P.K.; resources, M.K.; data curation, O.M. and M.K.; writing—original draft preparation, O.M.; writing—review and editing, O.M., P.K. and R.R.; visualization, P.K.; supervision, P.K. and R.R.; project administration, M.K.; funding acquisition, O.M. and R.R.
Funding
This research was funded by Grant for Young Scientists of the Medical University of Karol Marcinkowski in Poznan, Poland, No. 502-14-01113152-11080.
Institutional Review Board Statement
This study was conducted in accordance with the Declaration of Helsinki, and was approved by the Bioethical Committee of the Medical University of Karol Marcinkowski in Poznan, Poland (resolution number 49/17, 2 February 2017).
Informed Consent Statement
Informed consent was obtained from all of the subjects involved in the study.
Data Availability Statement
Data are contained within the article or in the Supplementary Material.
Acknowledgments
We would like to express our appreciation to the patients participating in the study, whose fight for health was the greatest inspiration for us.
Conflicts of Interest
The authors declare no conflict of interest.
References
- Tao, Z.; Shi, A.; Lu, C.; Song, T.; Zhang, Z.; Zhao, J. Breast cancer: Epidemiology and etiology. Cell Biochem. Biophys. 2015, 72, 333–338. [Google Scholar] [CrossRef]
- Bauer, K.R.; Brown, M.; Cress, R.D.; Parise, C.A.; Caggiano, V. Descriptive analysis of estrogen receptor (ER)-negative, progesterone receptor (PR)-negative, and HER2-negative invasive breast cancer, the so-called triple-negative phenotype: a population-based study from the California cancer Registry. Cancer 2007, 109, 1721–1728. [Google Scholar] [CrossRef] [PubMed]
- Carey, L.A.; Perou, C.M.; Livasy, C.A.; Dressler, L.G.; Cowan, D.; Conway, K.; Karaca, G.; Troester, M.A.; Tse, C.K.; Edmiston, S.; Deming, S.L.; Geradts, J.; Cheang, M.C.; Nielsen, T.O.; Moorman, P.G.; Earp, H.S.; & Millikan, R.C. C. Race, breast cancer subtypes, and survival in the Carolina Breast Cancer Study. JAMA 2006, 295, 2492–2502. [Google Scholar] [CrossRef] [PubMed]
- Liedtke, C.; Mazouni, C.; Hess, K.R.; André, F.; Tordai, A.; Mejia, J.A.; Symmans, W.F.; Gonzalez-Angulo, A.M.; Hennessy, B.; Green, M.; Cristofanilli, M.; Hortobagyi, G.N.; & Pusztai, L. Response to neoadjuvant therapy and long-term survival in patients with triple-negative breast cancer. Journal of clinical oncology : official journal of the American Society of Clinical Oncology 2008, 26, 1275–1281. [Google Scholar] [CrossRef]
- Amin, M.B.; Greene, F.L.; Edge, S.B.; Compton, C.C.; Gershenwald, J.E.; Brookland, R.K.; Meyer, L.; Gress, D.M.; Byrd, D.R.; & Winchester, D.P. The Eighth Edition AJCC Cancer Staging Manual: Continuing to build a bridge from a population-based to a more "personalized" approach to cancer staging. CA: a cancer journal for clinicians. [CrossRef]
- Criscitiello, C.; Azim, H.A., Jr.; Schouten, P.C.; Linn, S.C.; Sotiriou, C. Understanding the biology of triple-negative breast cancer. Ann. Oncol. 2012, 23 (Suppl. 6), 13–18. [Google Scholar] [CrossRef] [PubMed]
- Linn, S.C.; Van ‘t Veer, L.J. Clinical relevance of the triple-negative breast cancer concept: genetic basis and clinical utility of the concept. Eur. J. Cancer 2009, 45 (Suppl. 1), 11–26. [Google Scholar] [CrossRef] [PubMed]
- Gluz, O.; Liedtke, C.; Gottschalk, N.; Pusztai, L.; Nitz, U.; Harbeck, N. Triple-negative breast cancer-current status and future directions. Ann. Oncol. 2009, 20, 1913–1927. [Google Scholar] [CrossRef] [PubMed]
- Zhao, S.; Ma, D.; Xiao, Y.; Jiang, Y.-Z.; Shao, Z.-M. Clinicopathological features and prognosis of different histological types of triple-negative breast cancer: A large population analysis. Eur. J. Surgoncol. 2018, 44, 420–428. [Google Scholar] [CrossRef] [PubMed]
- Montagna, E.; Maisonneuve, P.; Rotmensz, N.; Cancello, G.; Iorfida, M.; Balduzzi, A.; Galimberti, V.; Veronesi, P.; Luini, A.; Pruneri, G.; et al. Heterogeneity of the triple-negative breast cancer: Histological subtypes to inform the outcome. Clin. Breast Cancer 2013, 13, 31–39. [Google Scholar] [CrossRef]
- Nowacka-Zawisza, M.; Krajewska, W.M. Triple-controlled breast cancer: Molecular characterization and potential urinary strategy. Adv. Hig. Med. Dosw. 2013, 67, 1090–1097. [Google Scholar] [CrossRef]
- Lehmann, B.D.; Bauer, J.A.; Chen, X.; Sanders, M.E.; Chakravarthy, A.B.; Shyr, Y.; Pietenpol, J.A. Identifying the Human Triple Negative Breast cancer subtypes and preclinical models for selecting targeted therapies. J. Clin. Investig. 2011, 121, 2750–2767. [Google Scholar] [CrossRef] [PubMed]
- Lehmann, B.D.; Jovanovic, B.; Chen, X.; Estrada, M.V.; Johnson, K.N.; Shyr, Y.; Moses, H.L.; Sanders, M.E.; Pietenpol, J.A. Refining Triple Negative Breast Cancer Molecular subtypes: Implications for the choice of neoadjuvant chemotherapy. PLoS ONE 2016, 11, e0157368. [Google Scholar] [CrossRef] [PubMed]
- Jiang, Y.Z.; Ma, D.; Suo, C.; Shi, J.; Xue, M.; Hu, X.; Xiao, Y.; Yu, K.D.; Liu, Y.R.; Yu, Y.; Zheng, Y.; Li, X.; Zhang, C.; Hu, P.; Zhang, J.; Hua, Q.; Zhang, J.; Hou, W.; Ren, L.; Bao, D.; … Shao, Z.M. Genomic and Transcriptomic Landscape of Triple-Negative Breast Cancers: Subtypes and Treatment Strategies. Cancer cell. [CrossRef]
- Garcia-Martinez, E.; Gil, G.L.; Benito, A.C.; Gonzalez-Billalabeitia, E.; Conesa, M.A.; Garcia, T.; García-Garre, E.; Vicente, V.; de la Peña, F.A. Tumor-infiltrating immune cell profiles and their change after neoadjuvant chemotherapy predict response and prognosis of breast cancer. Breast Cancer Res. 2014, 16, 488. [Google Scholar] [CrossRef] [PubMed]
- Miyashita, M.H.; Sasano, K.; Tamaki, H.; Hirakawa, Y.; Takahashi, S.; Nakagawa, S.; Watanabe, G.; Tada, H.; Suzuki, A.; Ohuchi, N.; et al. Prognostic signifier of tumor-inflating CD8+ and FOXP3+ lymphocytes in residual tumors and alterations in these parameters after neoadjuvant chemotherapy in triple-negative breast cancer: A retrospective multicenter study. Breast Cancer Res. 2015, 17, 124. [Google Scholar] [CrossRef] [PubMed]
- Bendall, S.C.; Simonds, E.F.; Qiu, P.; Amir, E.-A.D.; Krutzik, P.O.; Finck, R.; Bruggner, R.V.; Melamed, R.; Trejo, A.; Ornatsky, O.I.; et al. Single-cell mass cytometry of differential immune and drug responses across a human hematopoietic continuum. Science 2011, 332, 687–696. [Google Scholar] [CrossRef] [PubMed]
- Birrell, S.N.; Hall, R.E.; Tilley, W.D. Role of the androgen receptor in human breast cancer. J. Mammary Gland. Biol. Neoplasia 1998, 3, 95–103. [Google Scholar] [CrossRef] [PubMed]
- Lee, H.J.; Chang, C. Recent advances in androgen receptor action. Cell Mol. Life Sci. 2003, 60, 1613–1622. [Google Scholar] [CrossRef]
- Masuda, H.; Baggerly, K.A.; Wang, Y.; Zhang, Y.; Gonzalez-Angulo, A.M.; Meric-Bernstam, F.; Valero, V.; Lehmann, B.D.; Pietenpol, J.A.; Hortobagyi, G.N.; et al. Differential response to neoadjuvant chemotherapy among 7 triple-negative breast cancer molecular subtypes. Clin. Cancer Res. 2013, 19, 5533–5540. [Google Scholar] [CrossRef] [PubMed]
- Burstein, H.J.; Curigliano, G.; Loibl, S.; Dubsky, P.; Gnant, M.; Poortmans, P.; Colleoni, M.; Denkert, C.; Piccart-Gebhart, M.; Regan, M.; et al. Estimating the benefits of therapy for early-stage breast cancer: The St. Gallen International Consensus Guidelines for the primary therapy of early breast cancer. Ann. Oncol. 2019, 30, 1541–1557. [Google Scholar] [CrossRef]
- Hu, R.; Dawood, S.; Holmes, M.D.; Collins, L.C.; Schnitt, S.J.; Cole, K.; Marotti, J.D.; Hankinson, S.E.; Colditz, G.A.; Tamimi, R.M. Androgen receptor expression and breast cancer survival in postmenopausal women. Clin. Cancer Res. 2011, 17, 1867–1874. [Google Scholar] [CrossRef]
- Honma, N.; Horii, R.; Iwase, T.; Saji, S.; Younes, M.; Ito, Y.; Akiyama, F. Clinical importance of androgen receptor in breast cancer patients treated with adjuvant tamoxifen monotherapy. Breast Cancer 2012, 20, 323–330. [Google Scholar] [CrossRef] [PubMed]
- Cleator, S.; Heller, W.; Coombes, R.C. Triple-negative breast cancer: Therapeutic options. Lancet Oncol. 2007, 8, 235–244. [Google Scholar] [CrossRef] [PubMed]
- Leon-Ferre, R.; Polley, M.; Liu, H.; Cafourek, V.; Boughey, J.C.; Kalari, K.R.; Negron, V.; Liu, M.C.; Ingle, J.N.; Couch, F.; et al. Tumor-infiltrating lymphocytes in androgen receptor-positive, triple-negative breast cancer. J. Clin. Oncol. 2018, 36 (Suppl. 5), 5. [Google Scholar] [CrossRef]
- Dieci, M.; Tsvetkova, V.; Griguolo, G.; Miglietta, F.; Mantiero, M.; Tasca, G.; Cumerlato, E.; Giorgi, C.A.; Giarratano, T.; Faggioni, G.; et al. Androgen receptor expression and association with distant disease-free survival in triple negative breast cancer: Analysis of 263 patients treated with standard therapy for stage I–III disease. Front. Oncol. 2019, 9, 452. [Google Scholar] [CrossRef] [PubMed]
- Tečić Vuger, A.; Šeparović, R.; Šitić, S.; Vazdar, L.; Pavlović, M.; Vrbanec, D. Prognostic Significance of Tumor–infiltrating Lymphocytes and Androgen Receptors in Patients with Early Triple-negative Breast Cancer: Research Square. Preprint 2021. [Google Scholar] [CrossRef]
- Dieci, M.V.; Criscitiello, C.; Goubar, A.; Viale, G.; Conte, P.; Guarneri, V.; Ficarra, G.; Mathieu, M.C.; Delaloge, S.; Curigliano, G.; et al. Prognostic value of tumor-inflating lymphocytes on residual disease after primary chemotherapy for triple-negative breast cancer: A retrospective multicenter study. Ann. Oncol. 2014, 25, 611–618. [Google Scholar] [CrossRef]
- Loi, S.; Dushyanthen, S.; Beavis, P.A.; Salgado, R.; Denkert, C.; Savas, P.; Combs, S.; Rimm, D.L.; Giltnane, J.M.; Estrada, M.V.; et al. RAS/MAPK activation is associated with reduced tumor-Infiltrating lymphocytes in triple-negative breast cancer: Therapeutic cooperation between MEK and PD-1/PD-L1 immune checkpoint in inhibitors. Clin. Cancer Res. 2016, 22, 1499–1509. [Google Scholar] [CrossRef]
Figure 1.
Modified TNBC classification by Lehmann and Jiang.
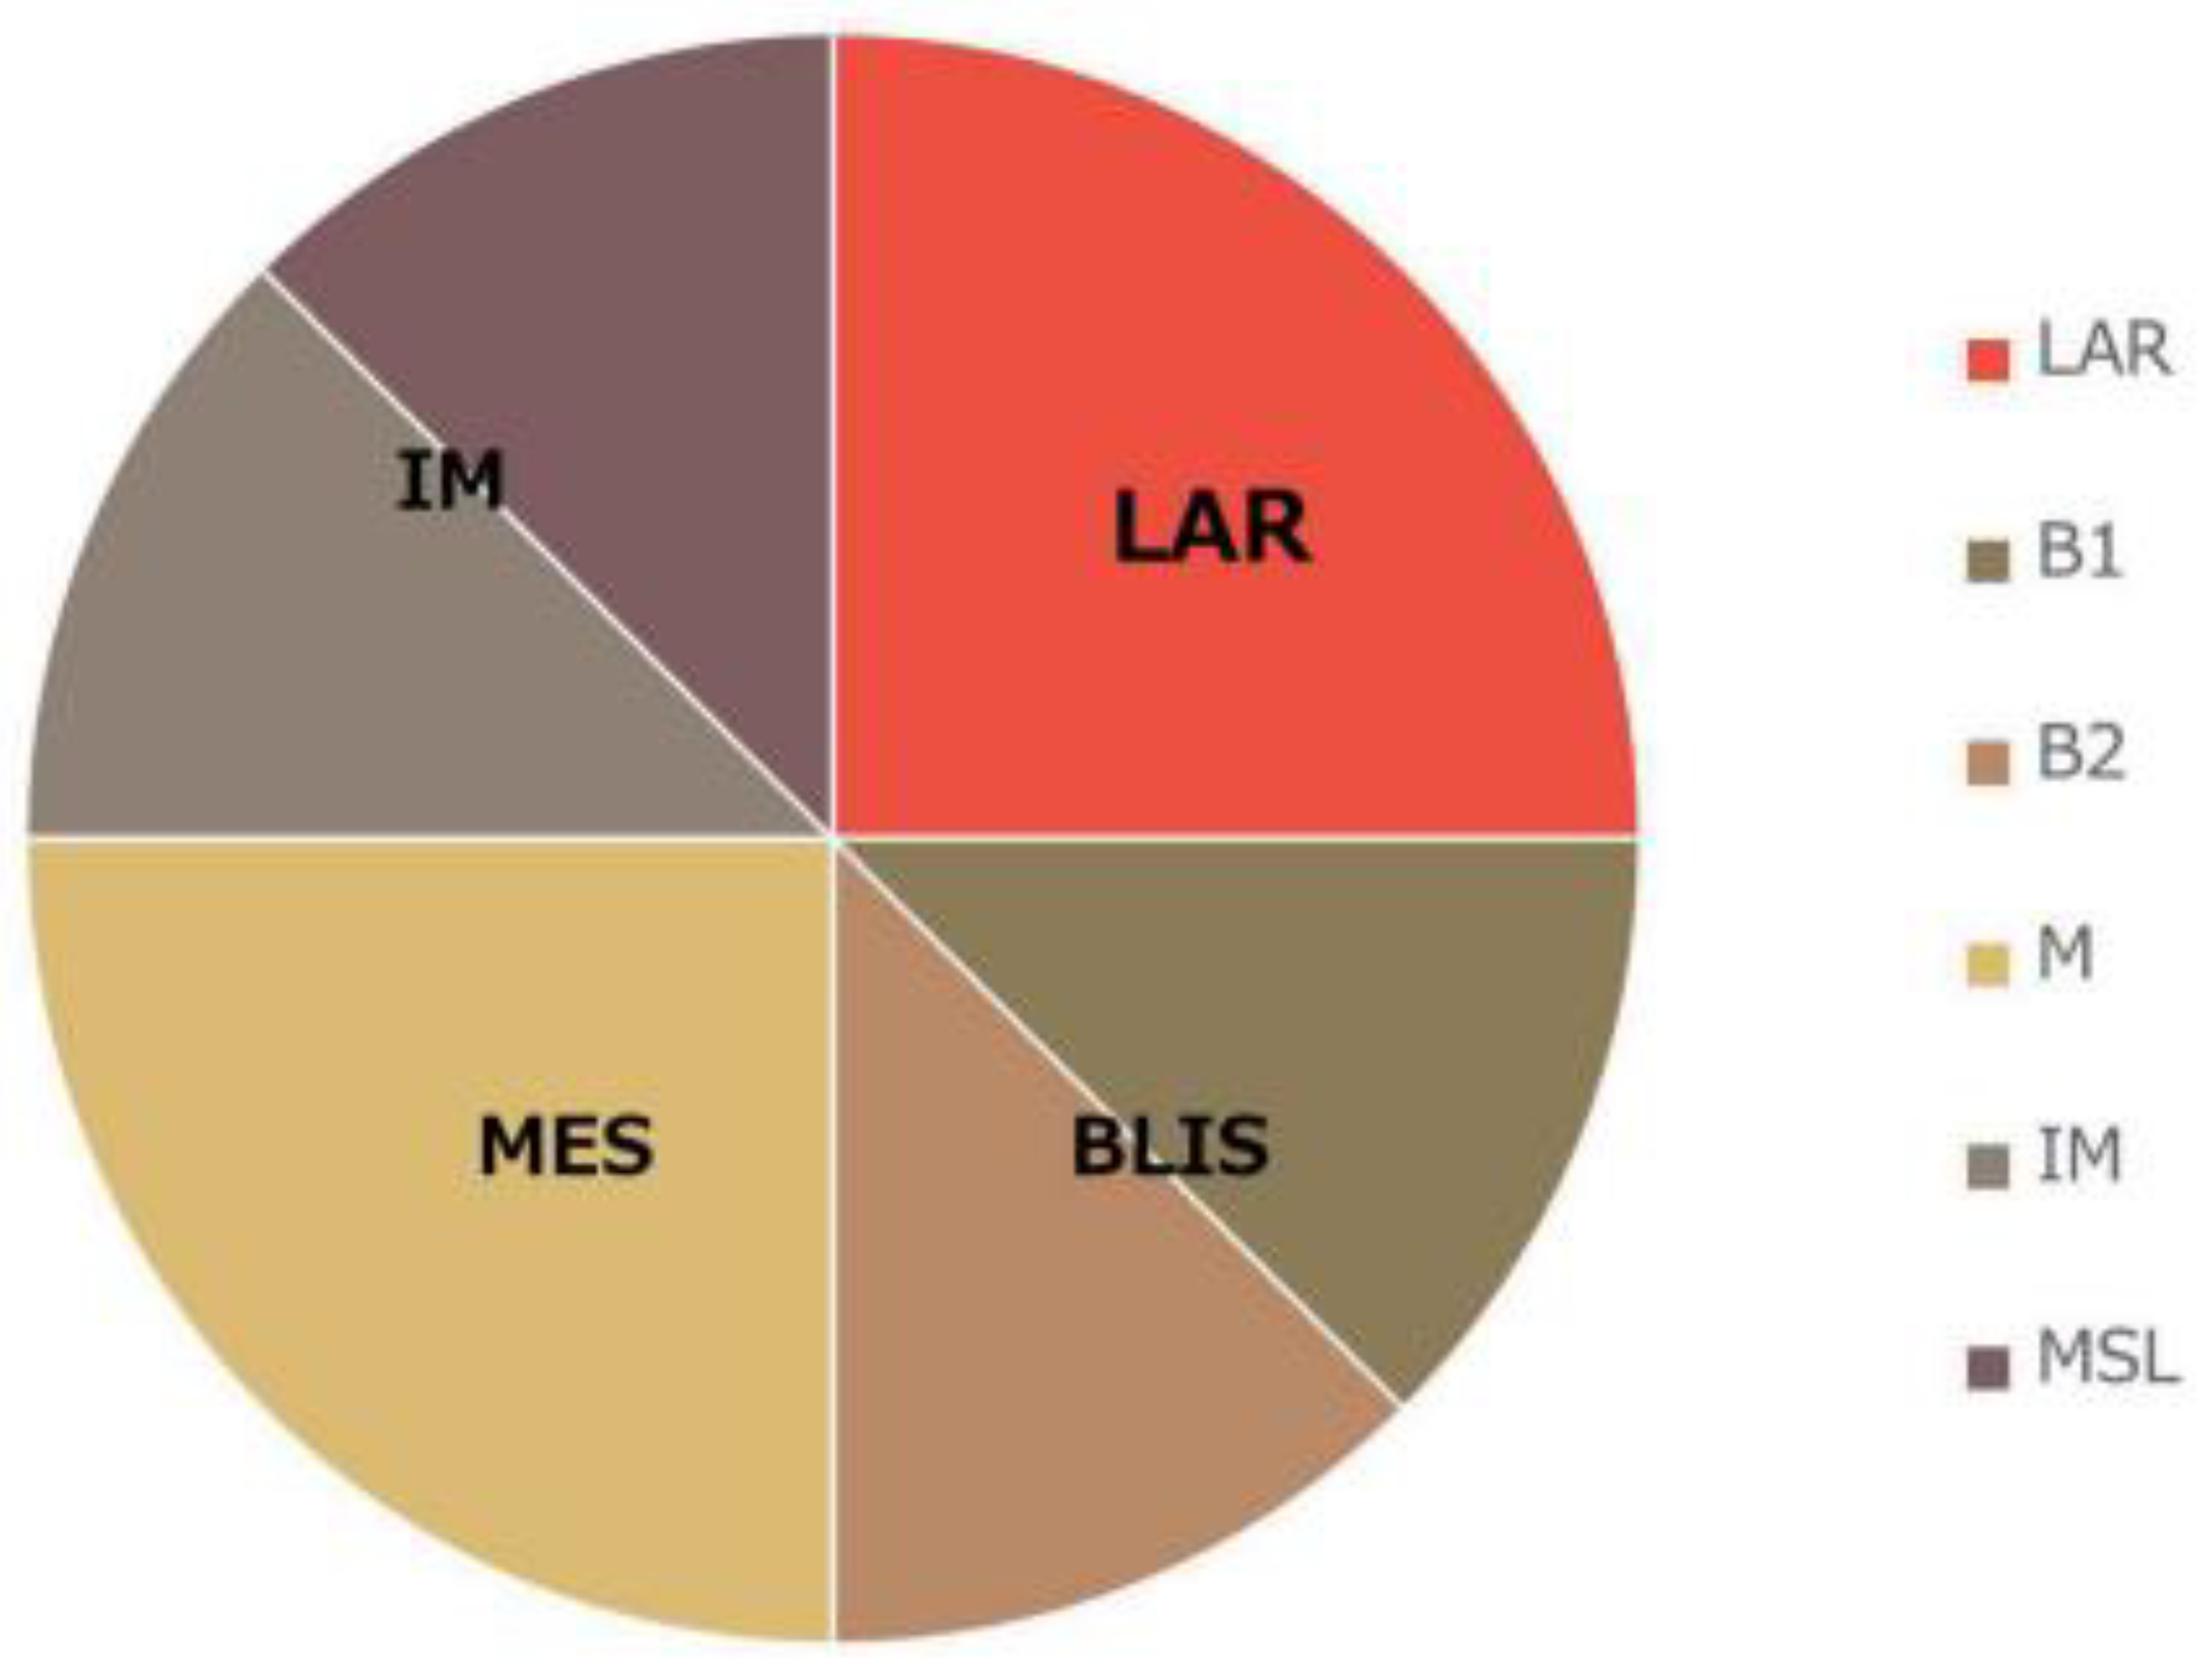
Figure 2.
Invasive breast cancer with 70% T-lymphocyte infiltration in the tumor stroma, H&E staining, 630×.
Figure 2.
Invasive breast cancer with 70% T-lymphocyte infiltration in the tumor stroma, H&E staining, 630×.
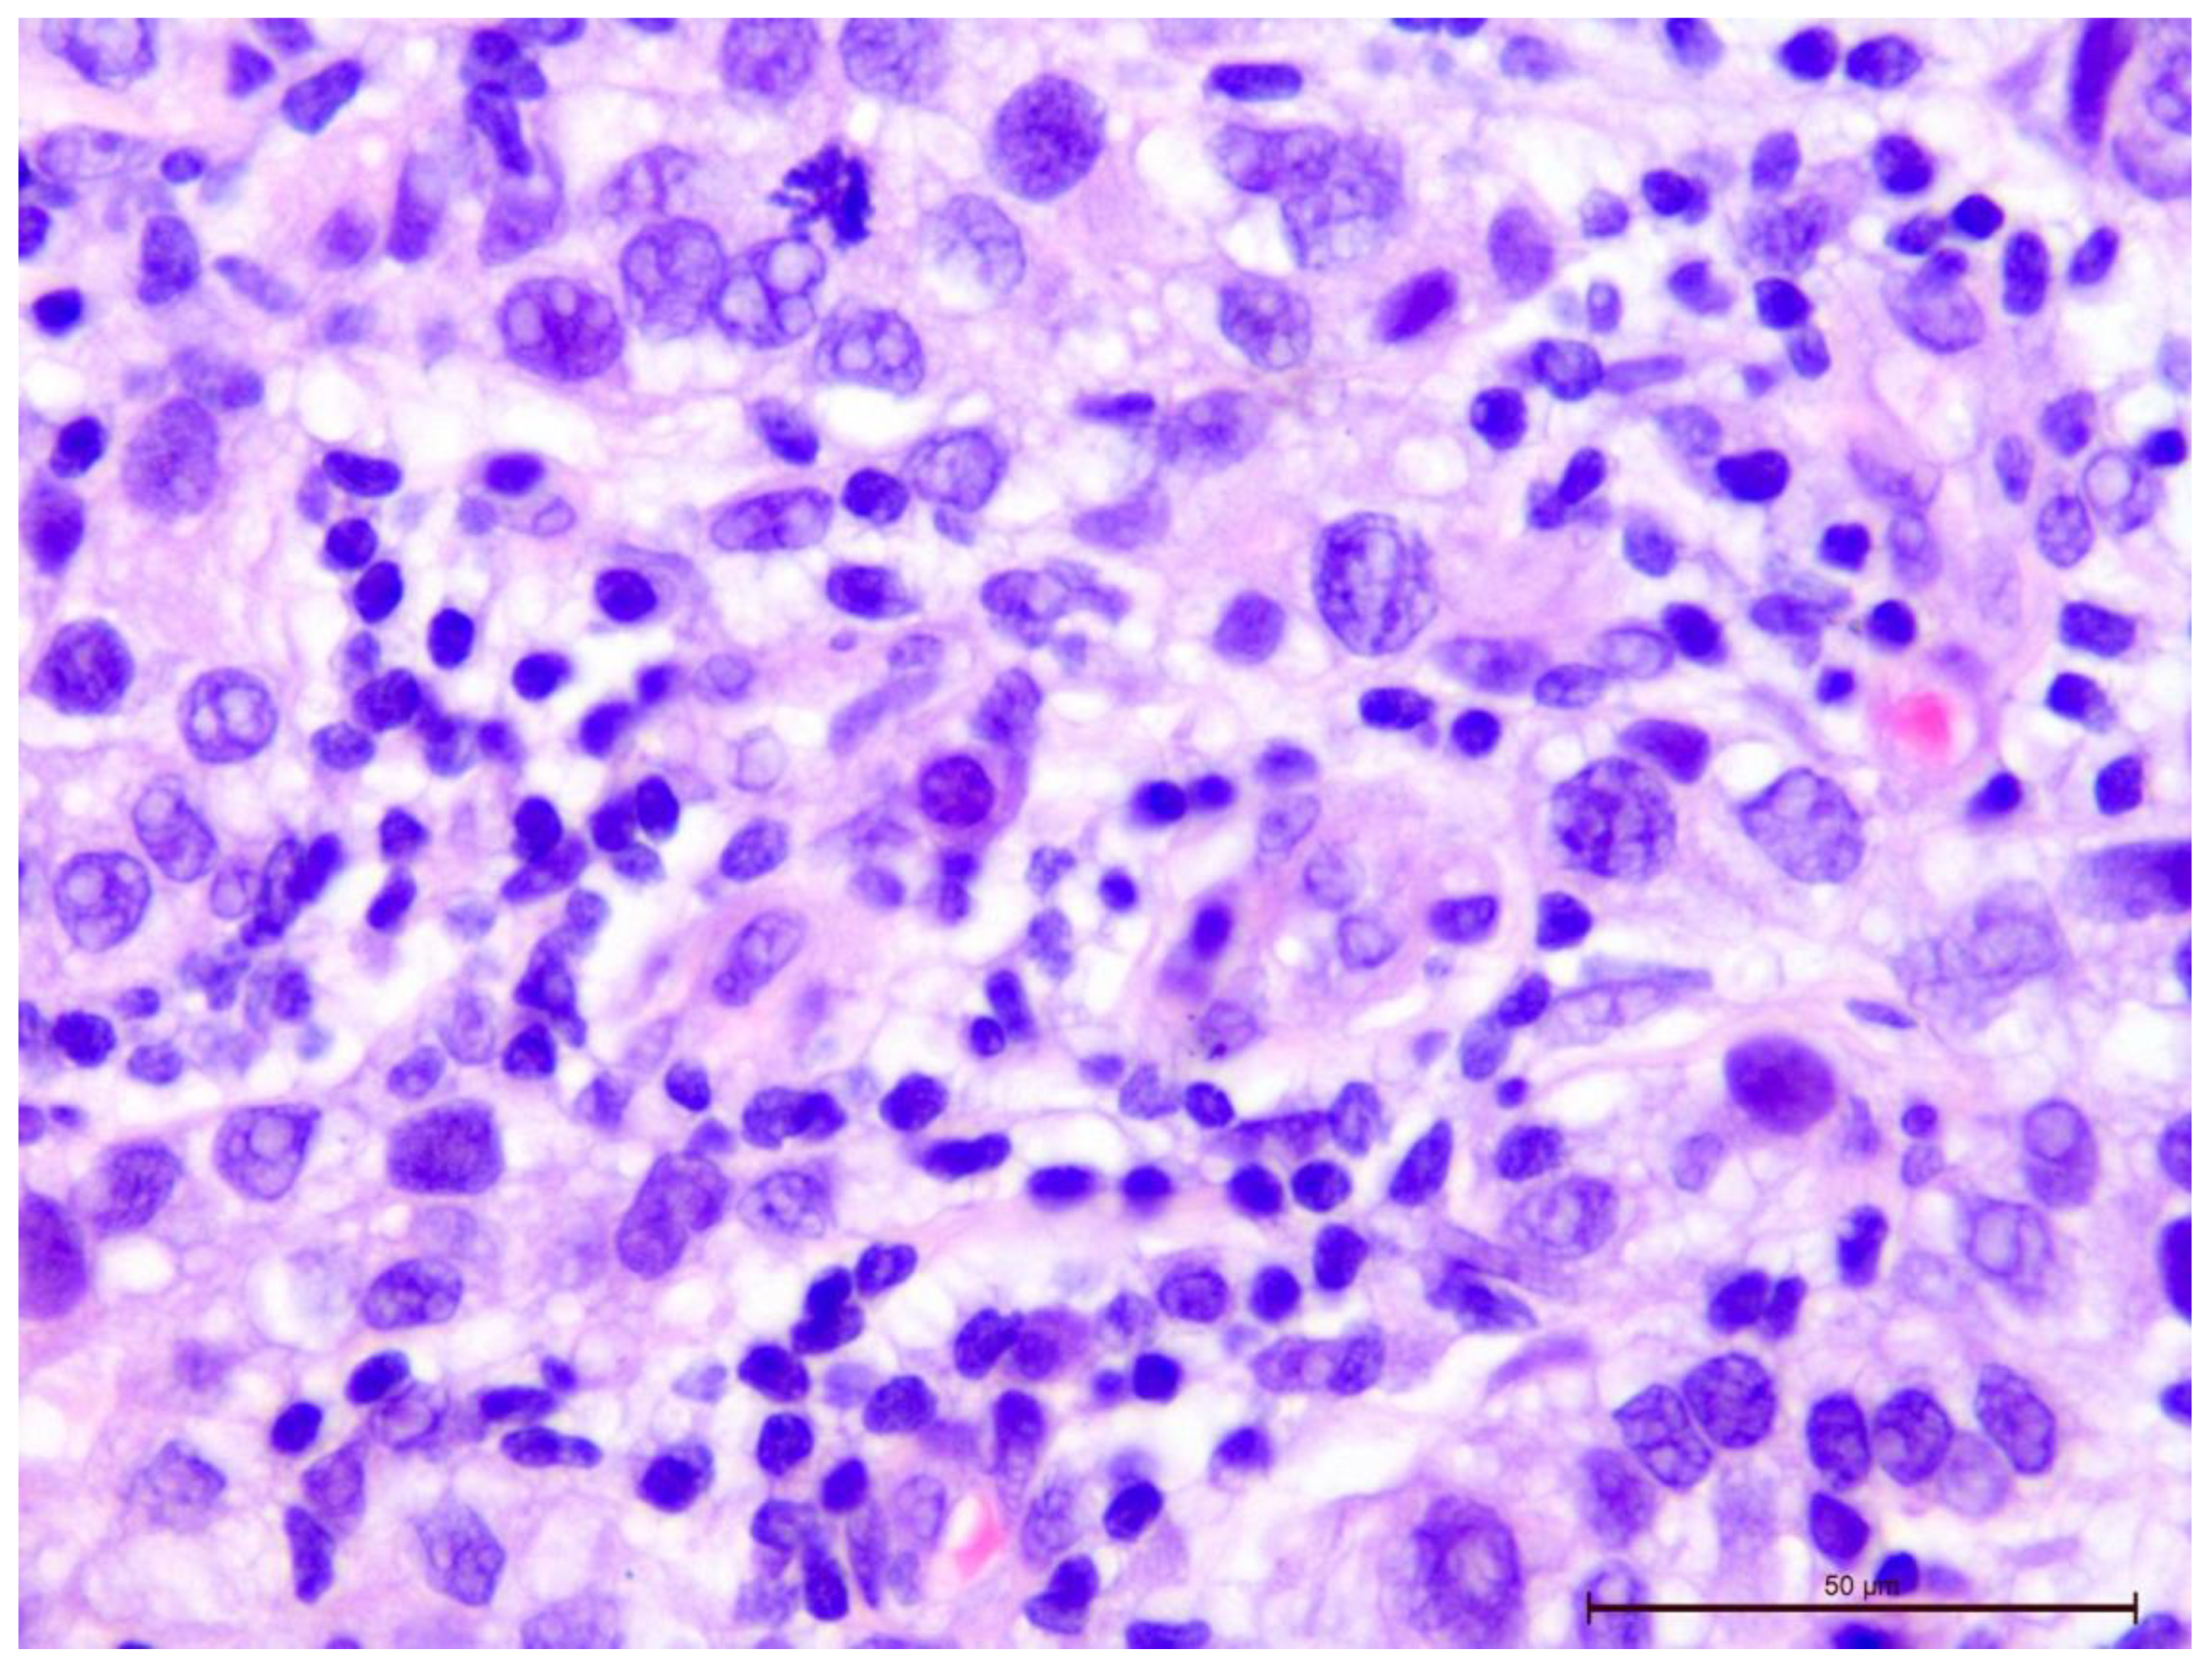
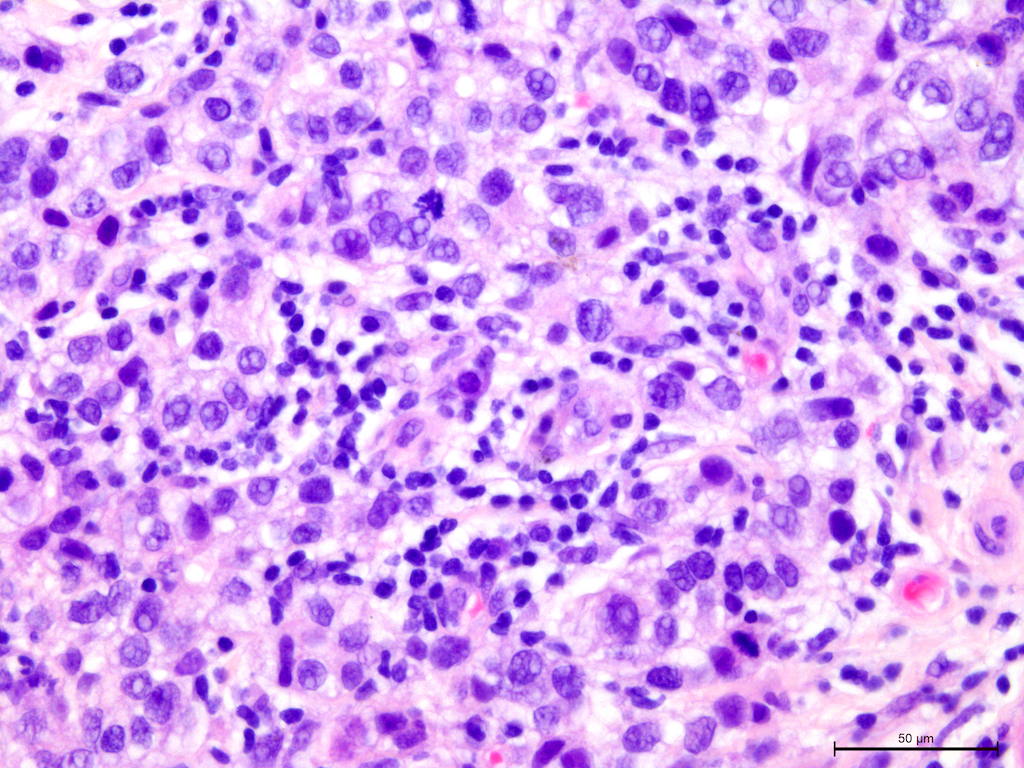
Figure 3.
Invasive breast cancer with 70% T-lymphocyte infiltration in the tumor stroma, H&E staining, 400×.
Figure 3.
Invasive breast cancer with 70% T-lymphocyte infiltration in the tumor stroma, H&E staining, 400×.
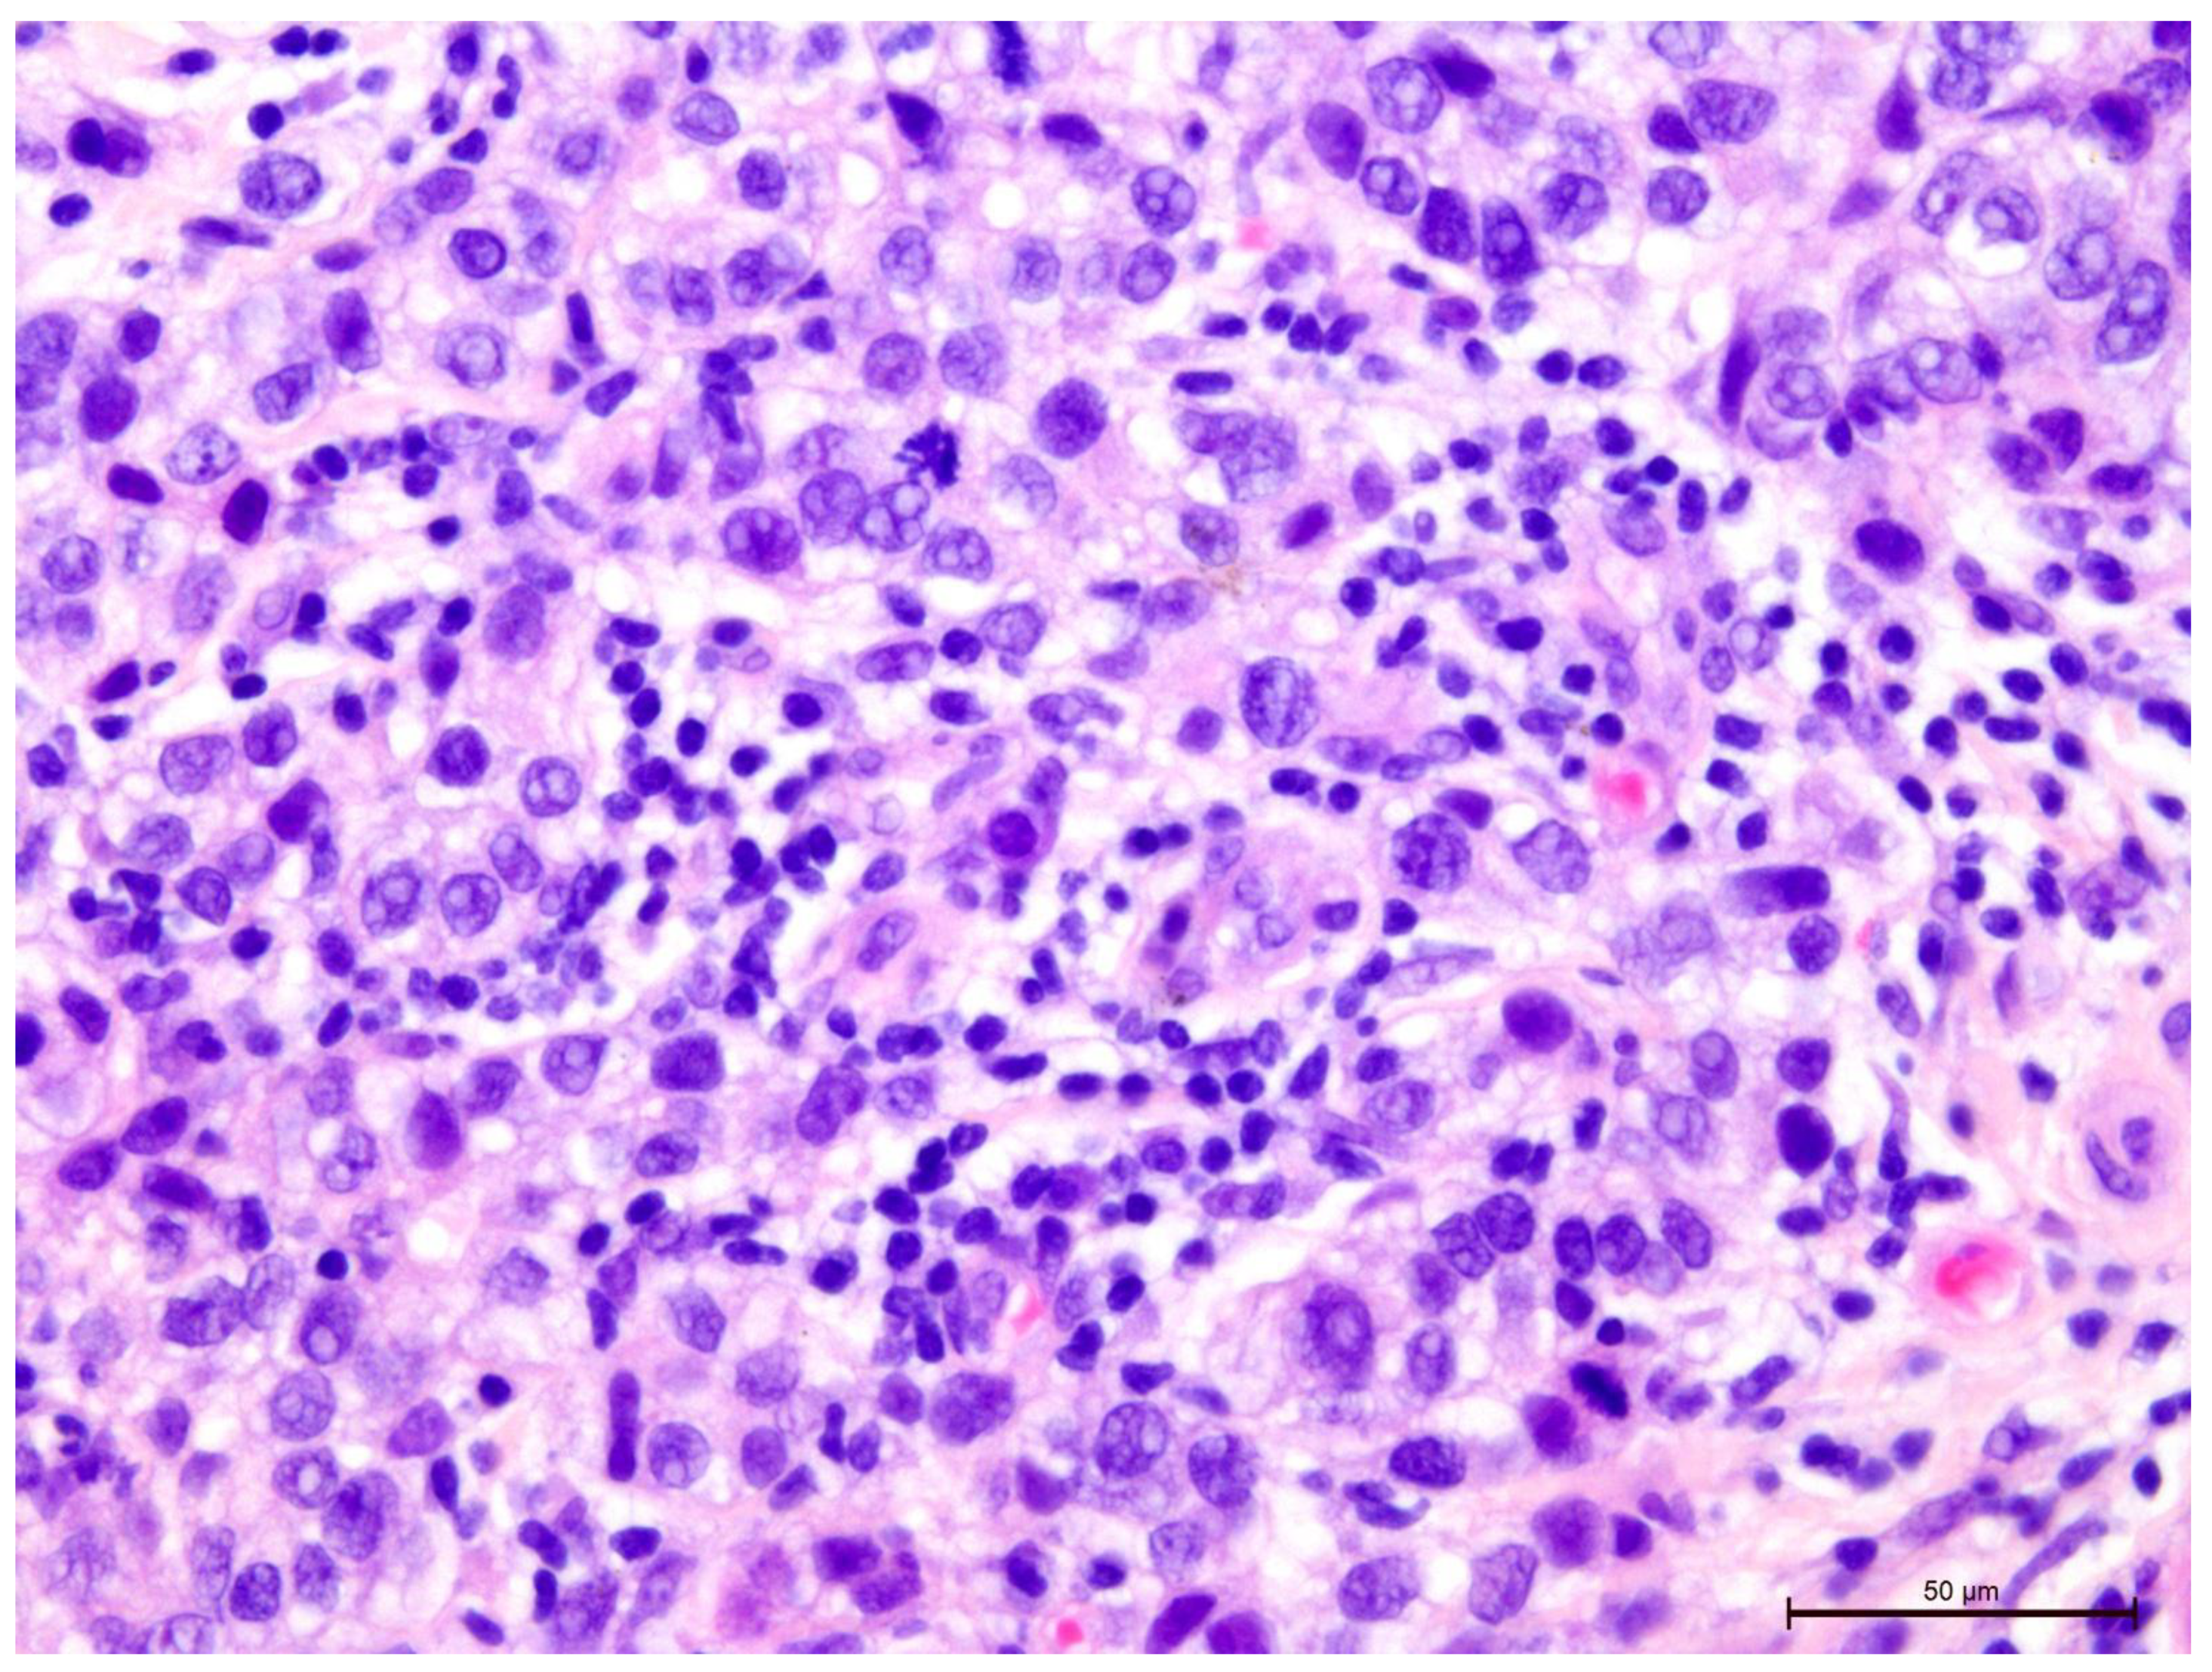
Figure 4.
Invasive breast cancer with 70% T-lymphocyte infiltration in the tumor stroma, H&E staining, 200×.
Figure 4.
Invasive breast cancer with 70% T-lymphocyte infiltration in the tumor stroma, H&E staining, 200×.
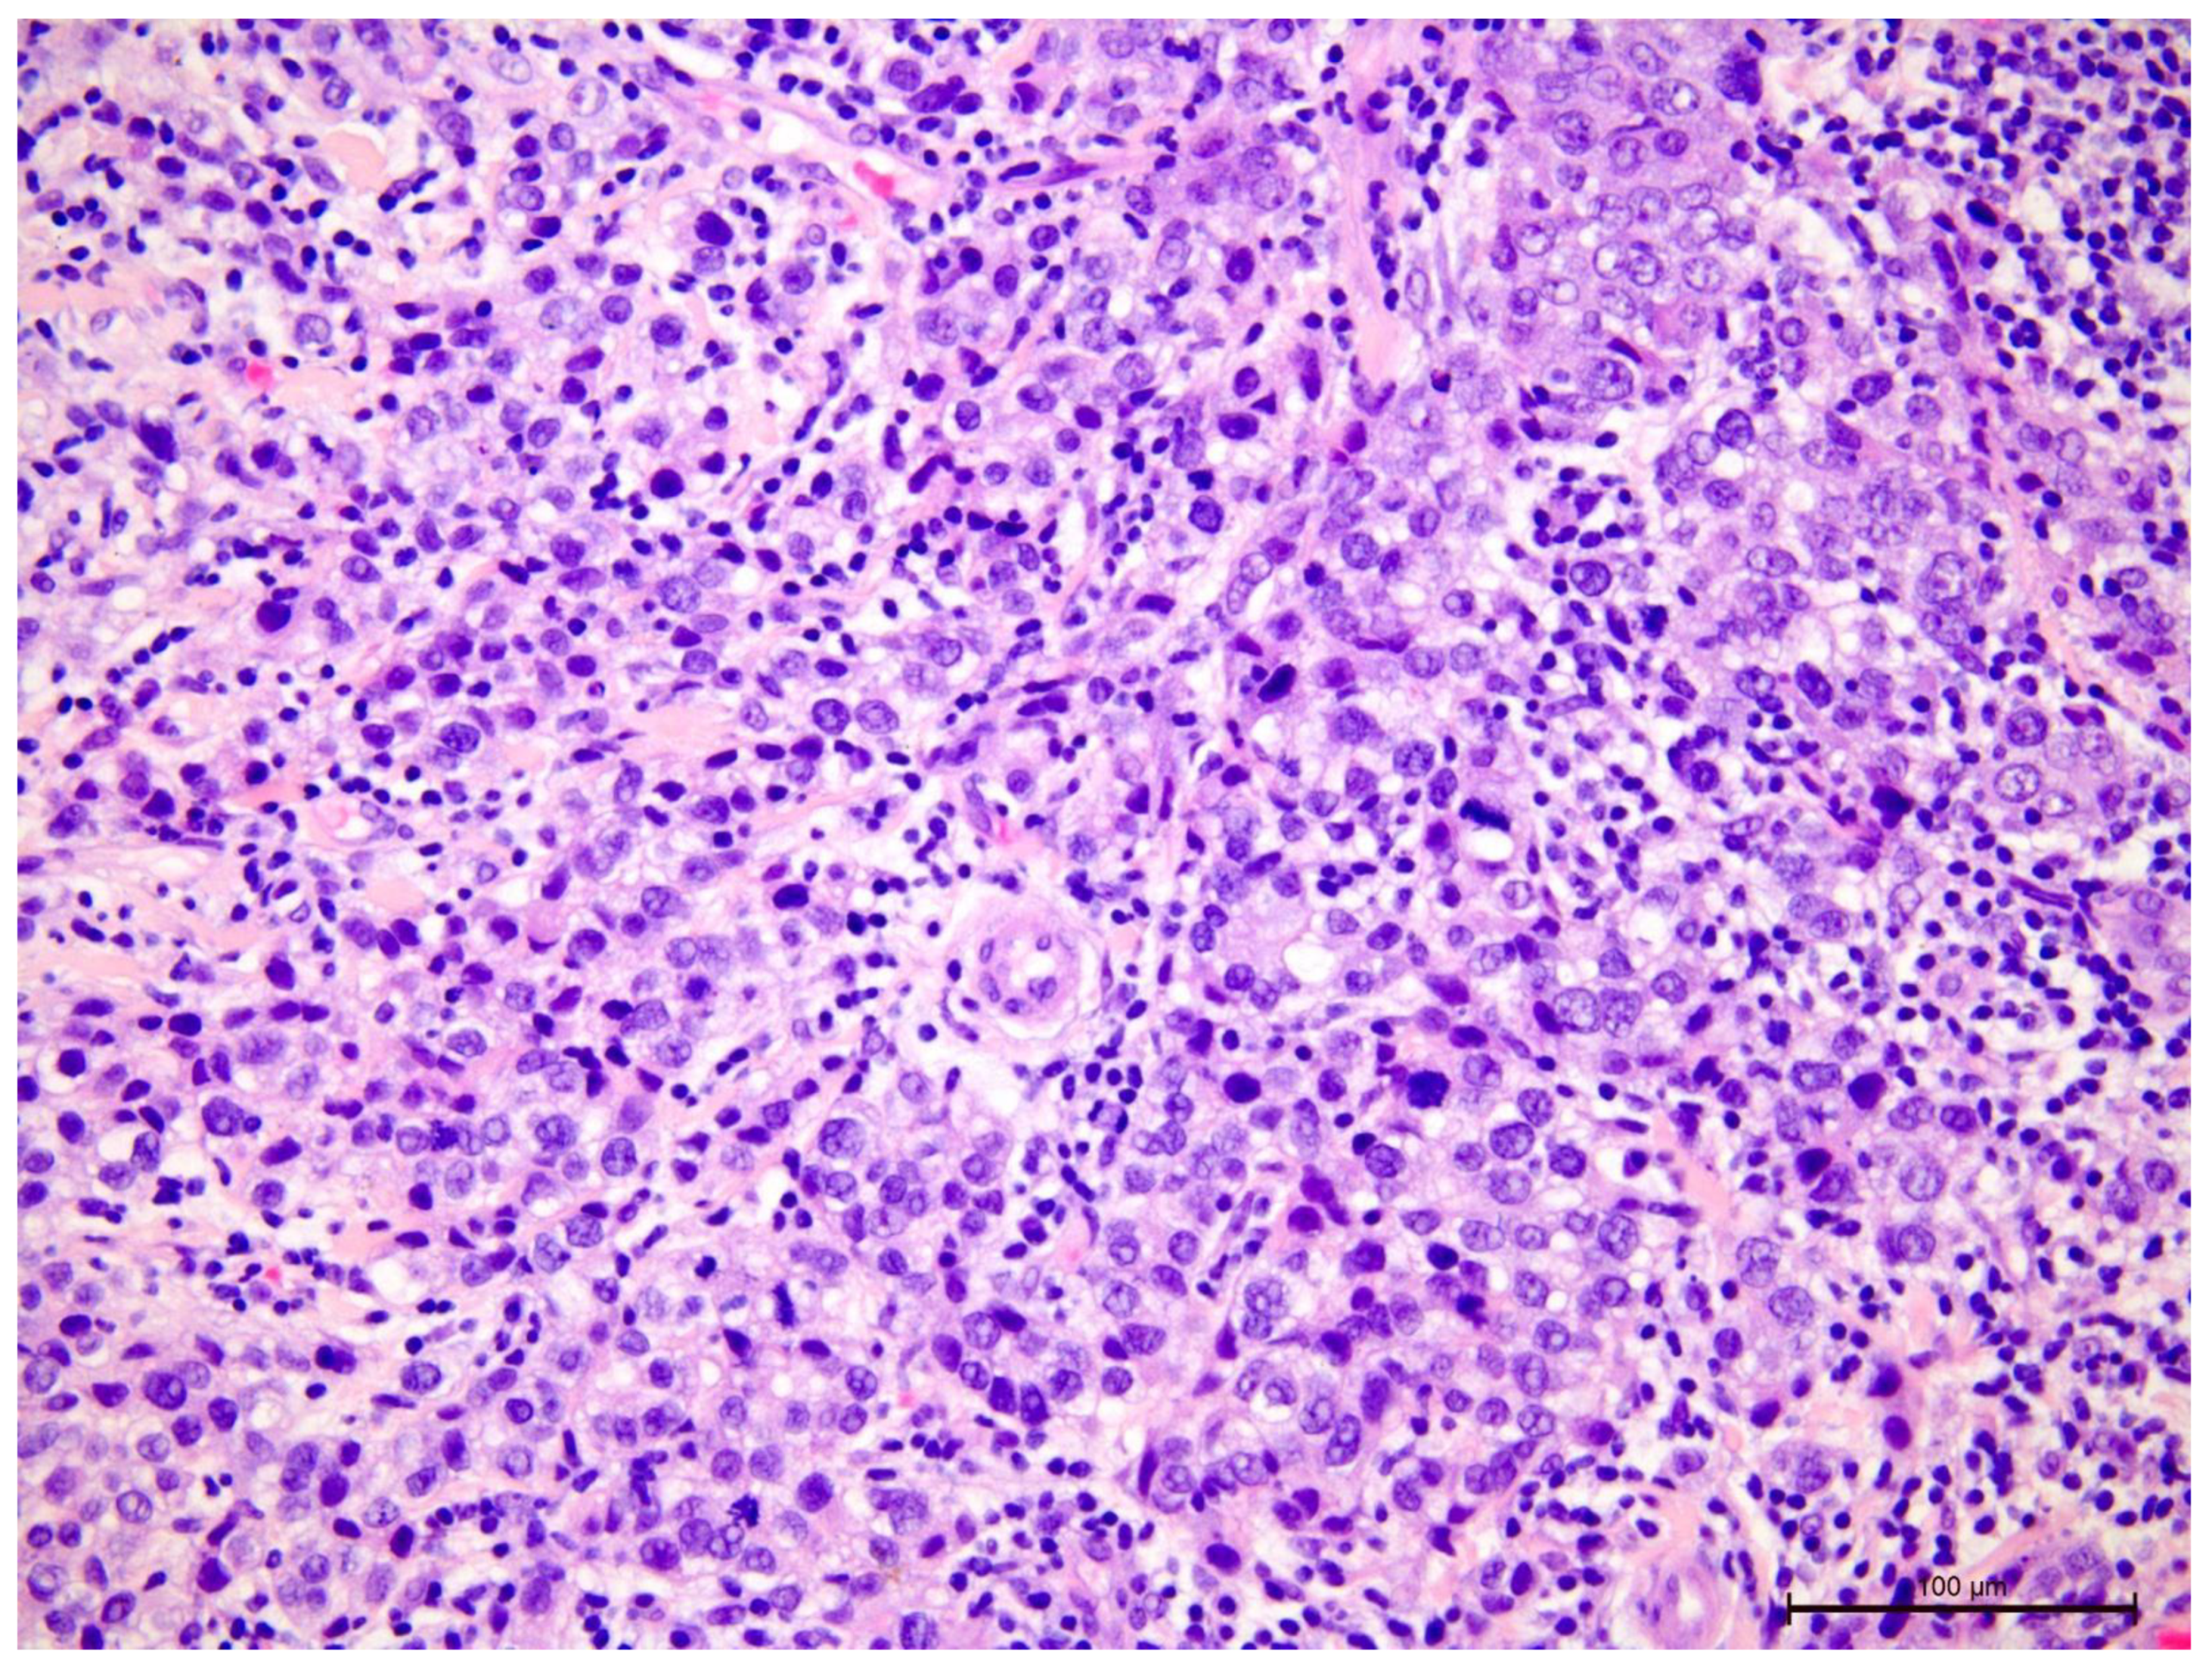
Figure 5.
Invasive breast cancer with 5% T-lymphocyte infiltration in the tumor stroma, H&E staining, area 400×.
Figure 5.
Invasive breast cancer with 5% T-lymphocyte infiltration in the tumor stroma, H&E staining, area 400×.
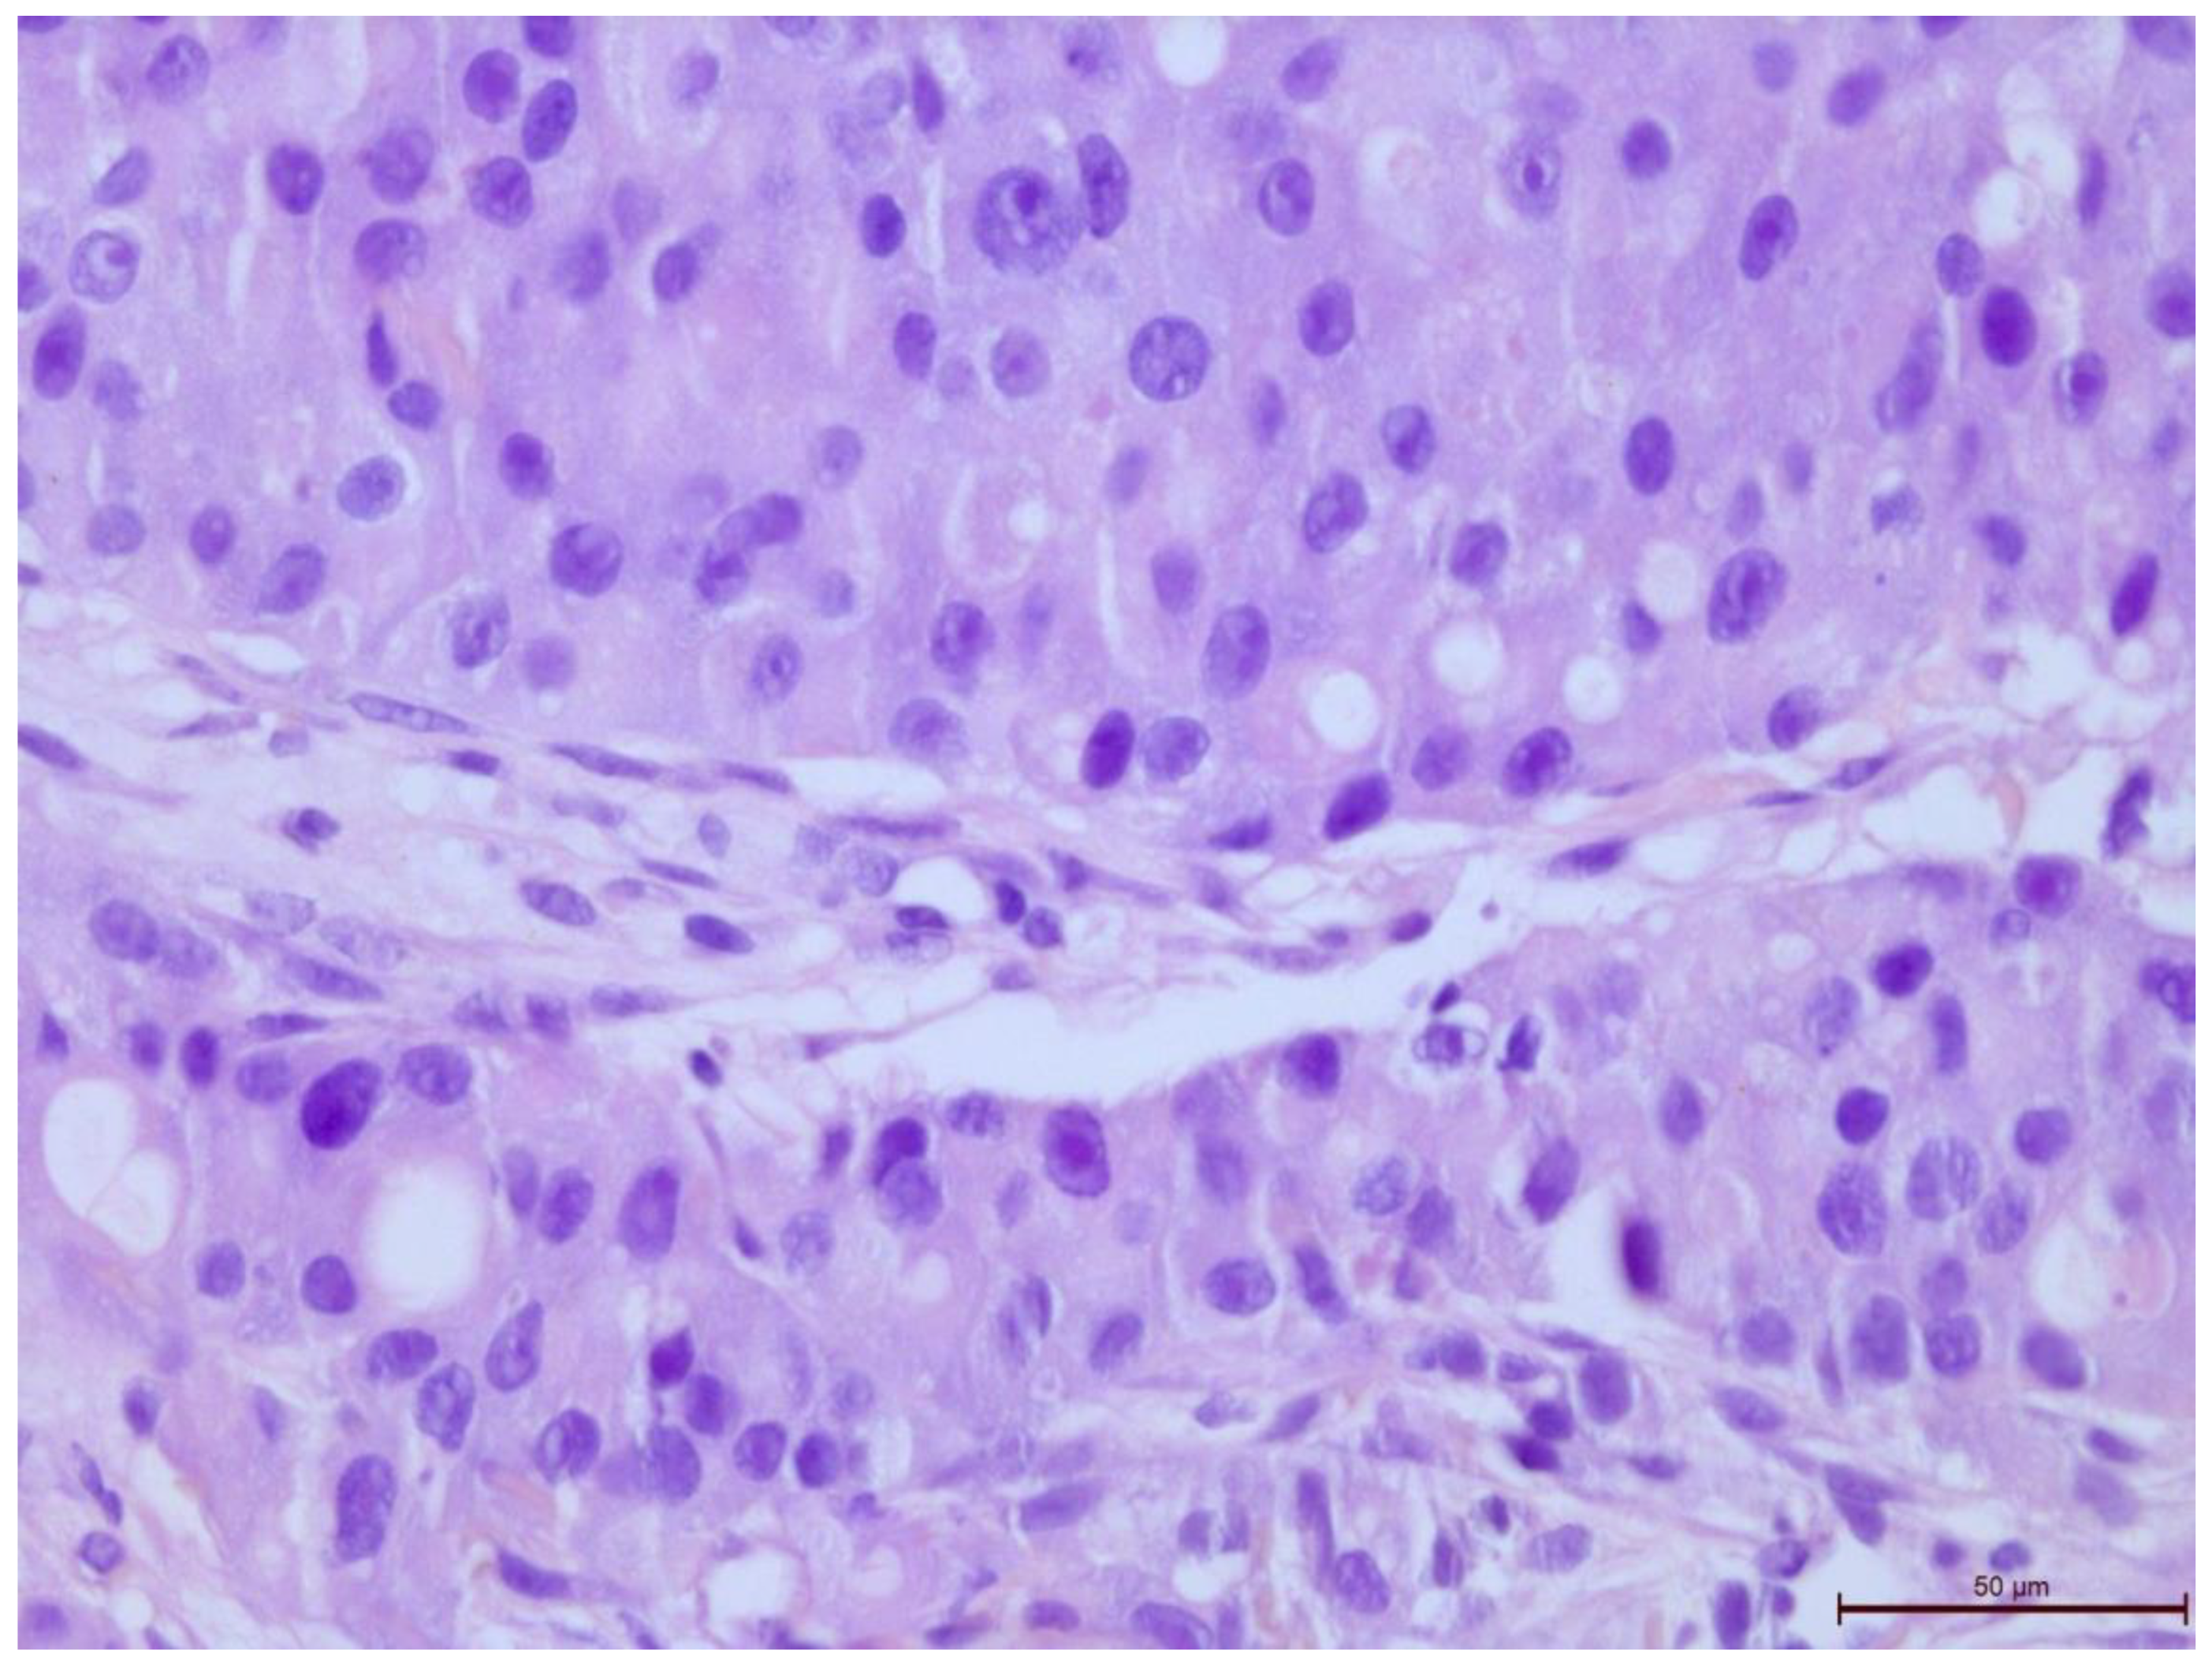
Figure 6.
Invasive breast cancer with 20% T-lymphocyte infiltration in the tumor stroma, H&E staining, area 400×.
Figure 6.
Invasive breast cancer with 20% T-lymphocyte infiltration in the tumor stroma, H&E staining, area 400×.
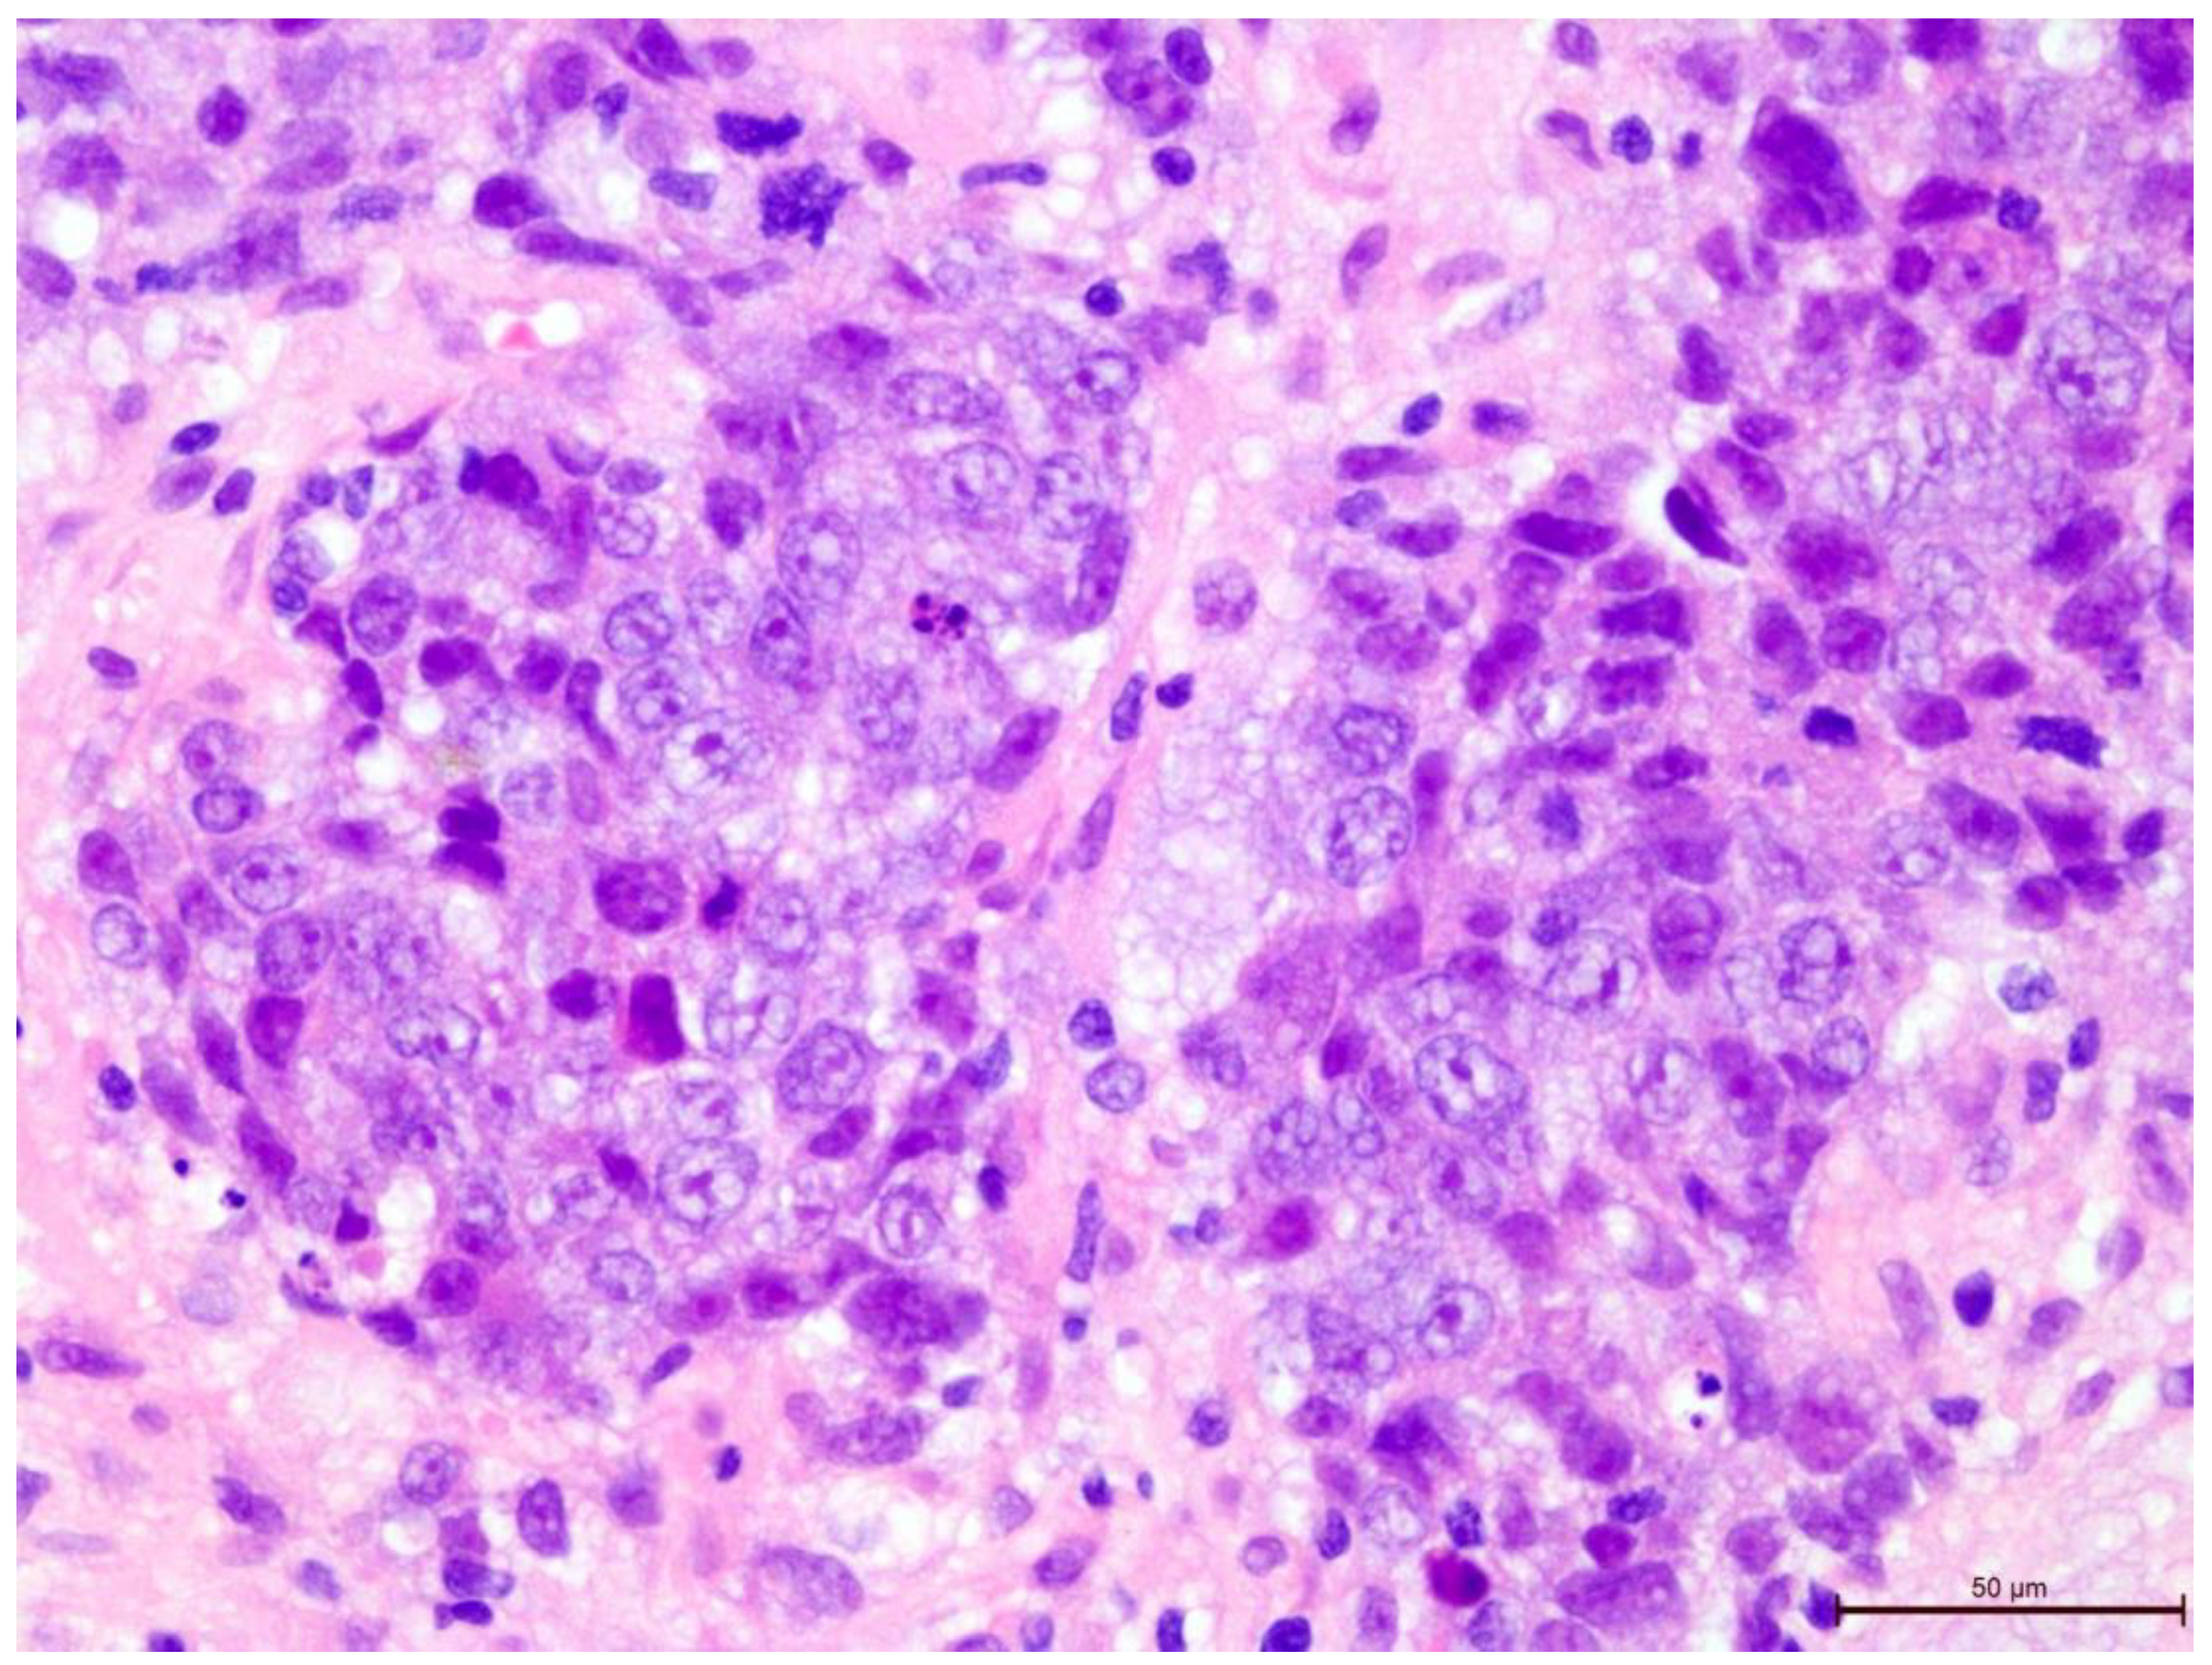
Figure 7.
Invasive breast cancer with 90% T-lymphocyte infiltration in the tumor stroma, H&E staining, area 400×.
Figure 7.
Invasive breast cancer with 90% T-lymphocyte infiltration in the tumor stroma, H&E staining, area 400×.
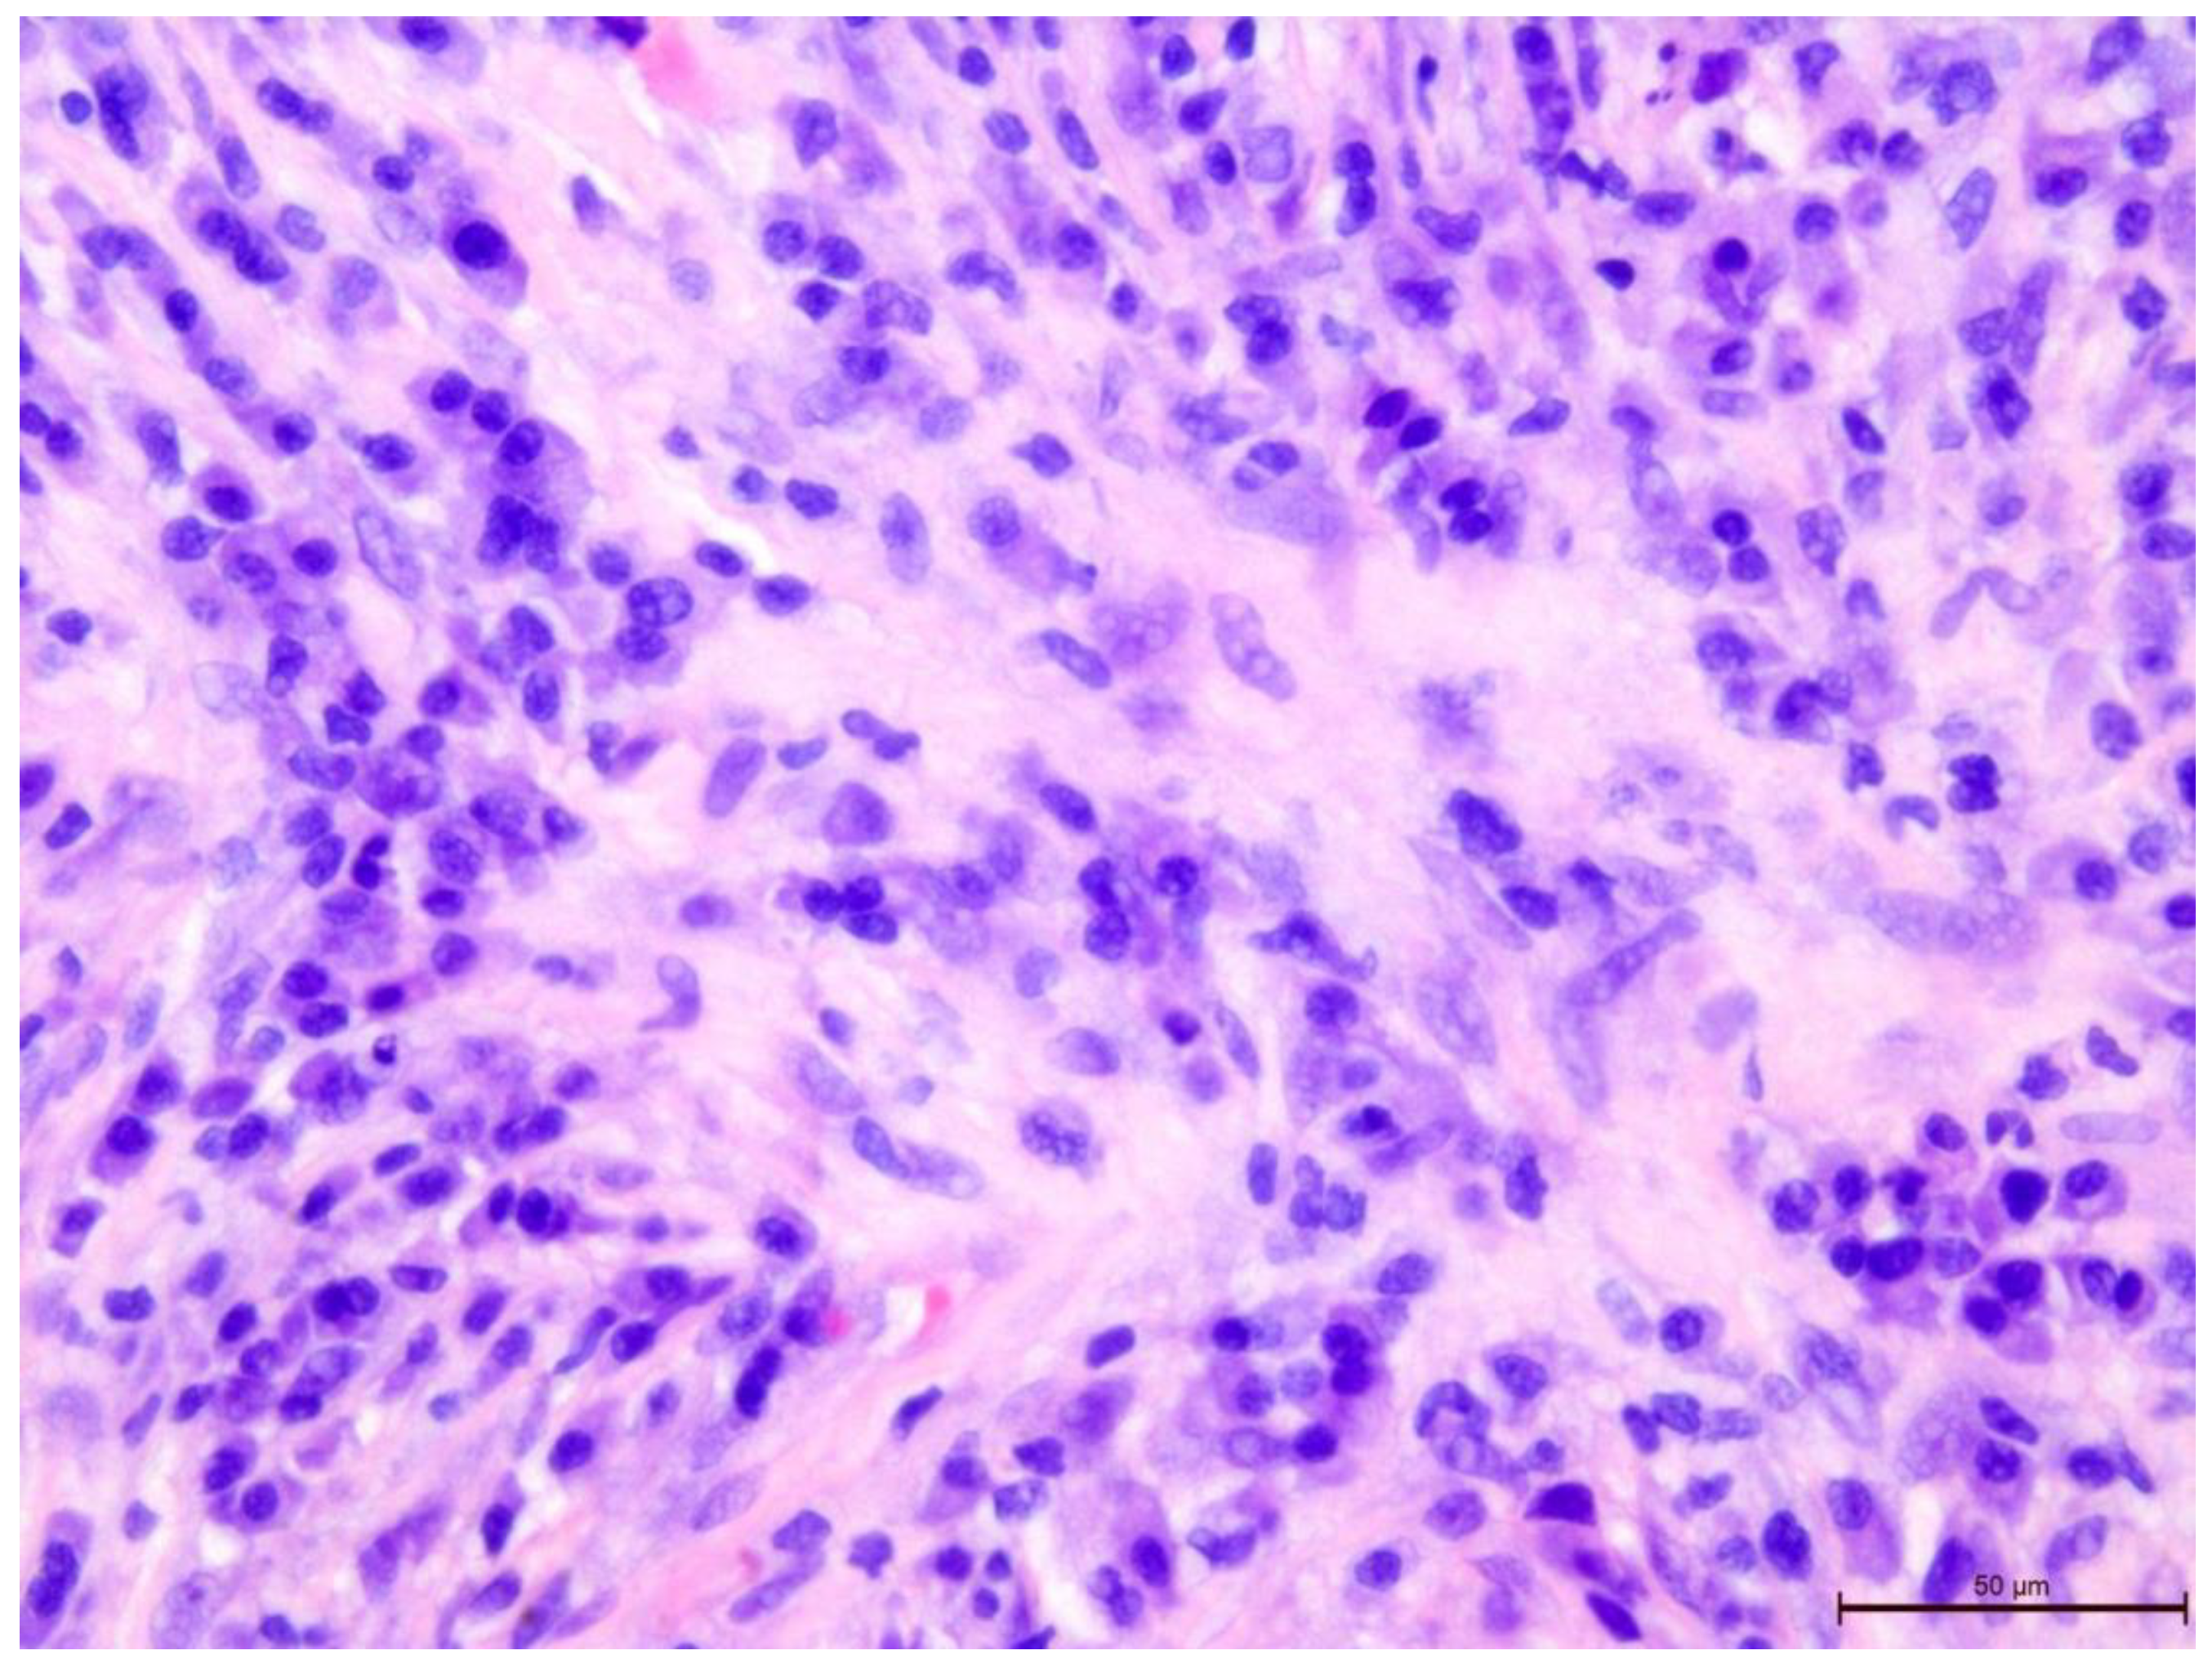
Figure 8.
Invasive breast cancer with 70% T-lymphocyte infiltration in the tumor stroma using anti-CD4 in the area of 400×.
Figure 8.
Invasive breast cancer with 70% T-lymphocyte infiltration in the tumor stroma using anti-CD4 in the area of 400×.
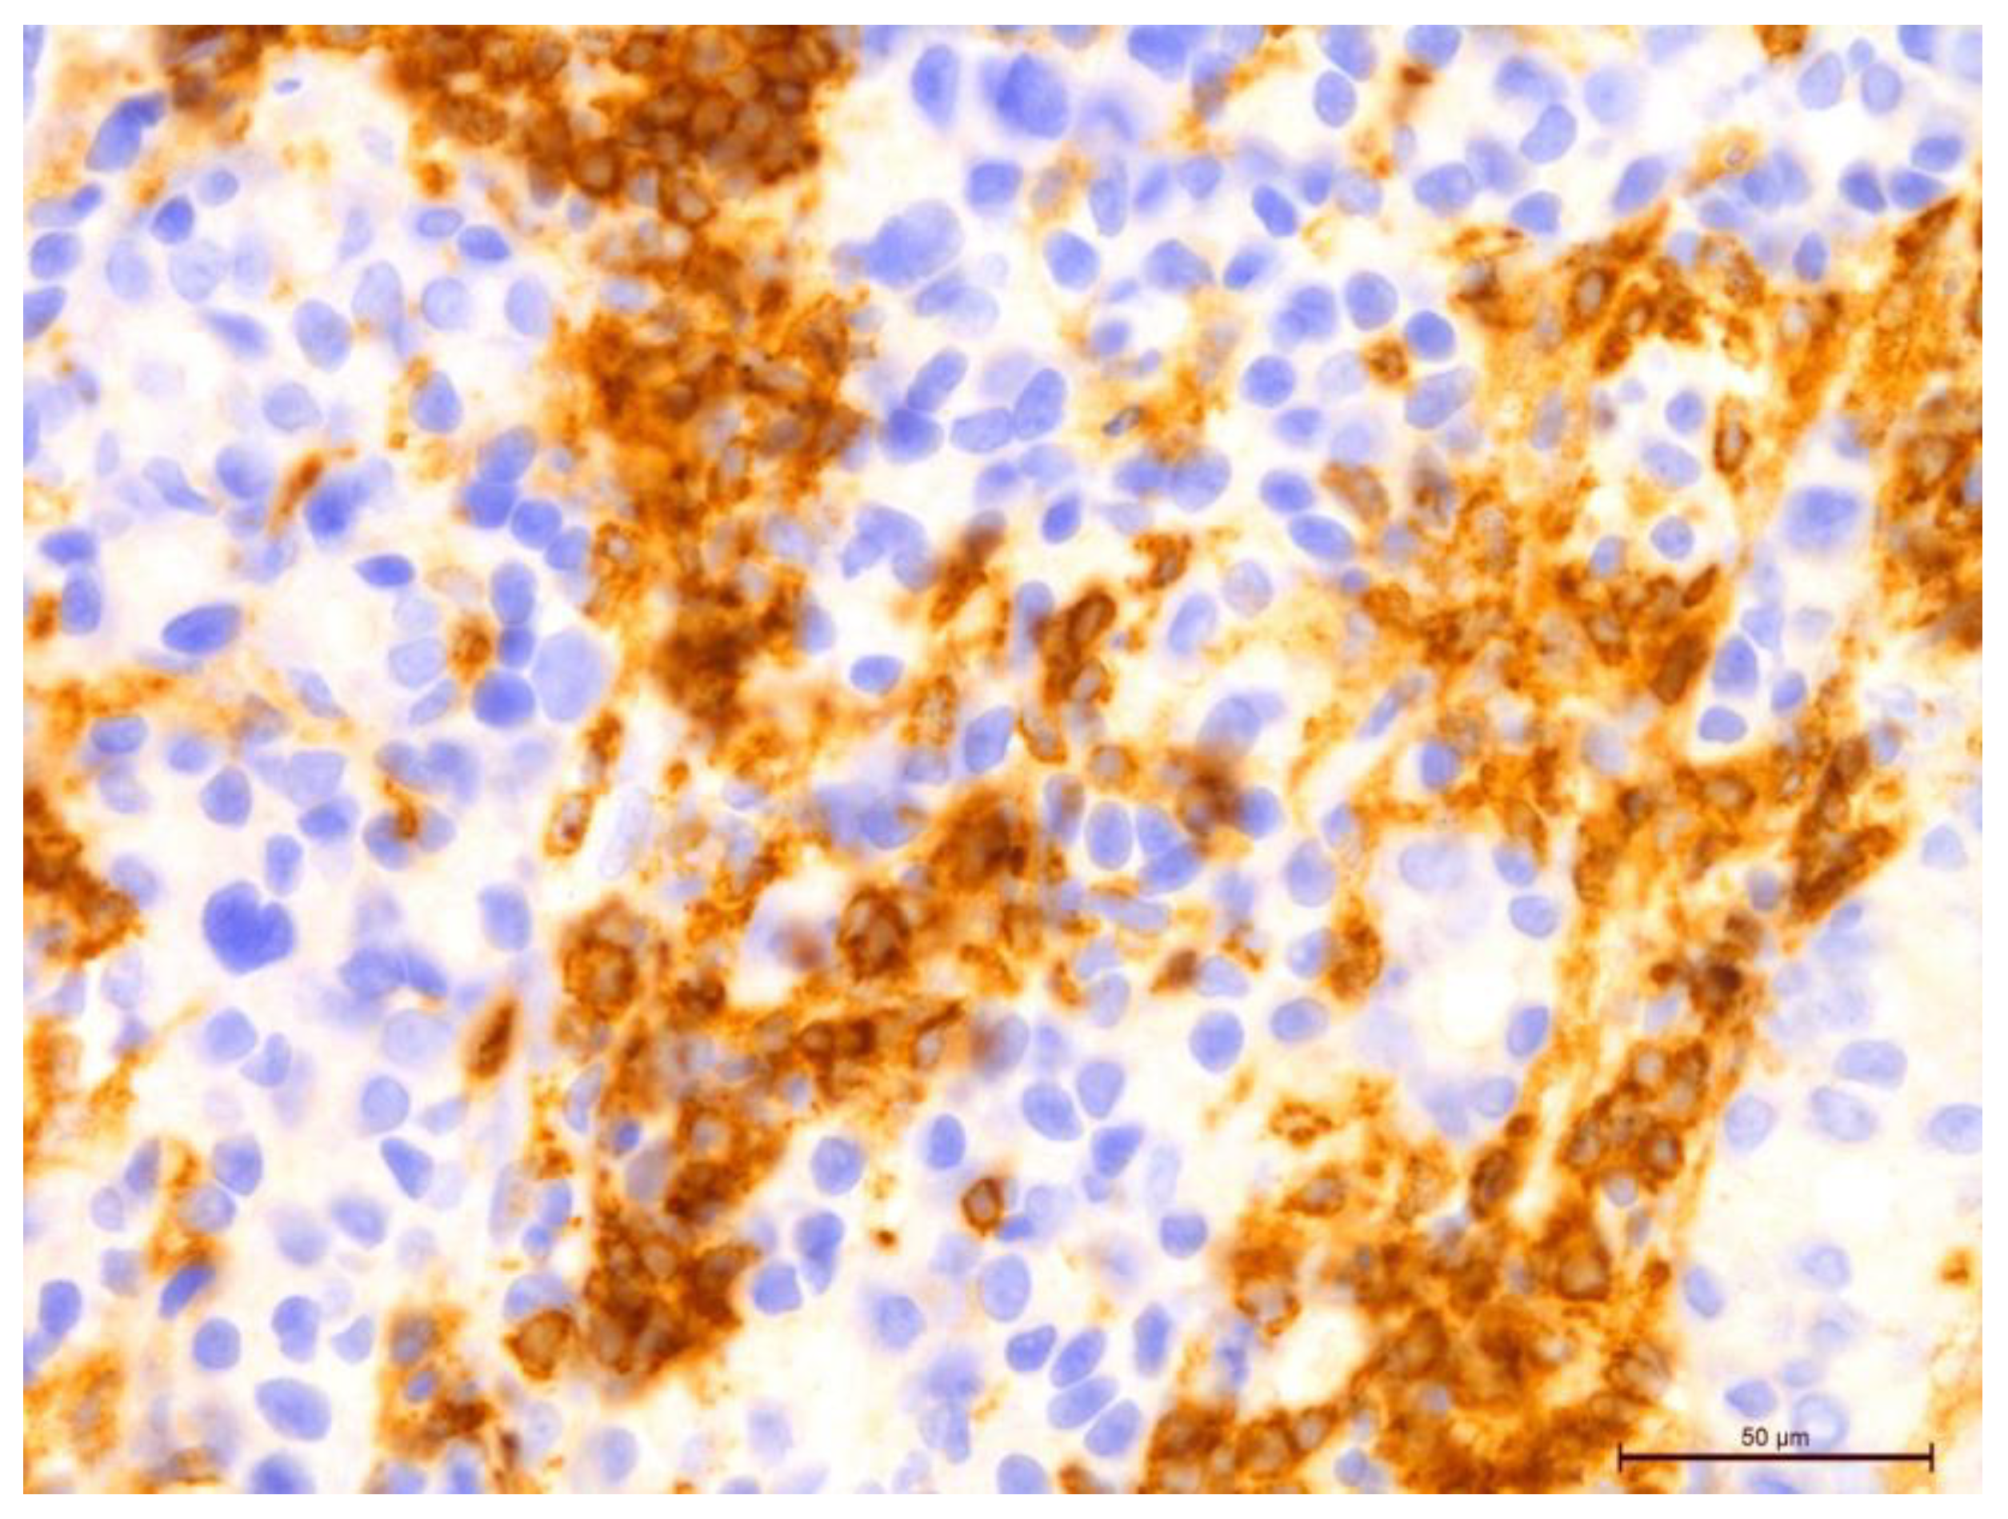
Figure 9.
Invasive breast cancer with 70% T-lymphocyte infiltration in the tumor stroma using anti-CD8 in the area of 400×.
Figure 9.
Invasive breast cancer with 70% T-lymphocyte infiltration in the tumor stroma using anti-CD8 in the area of 400×.
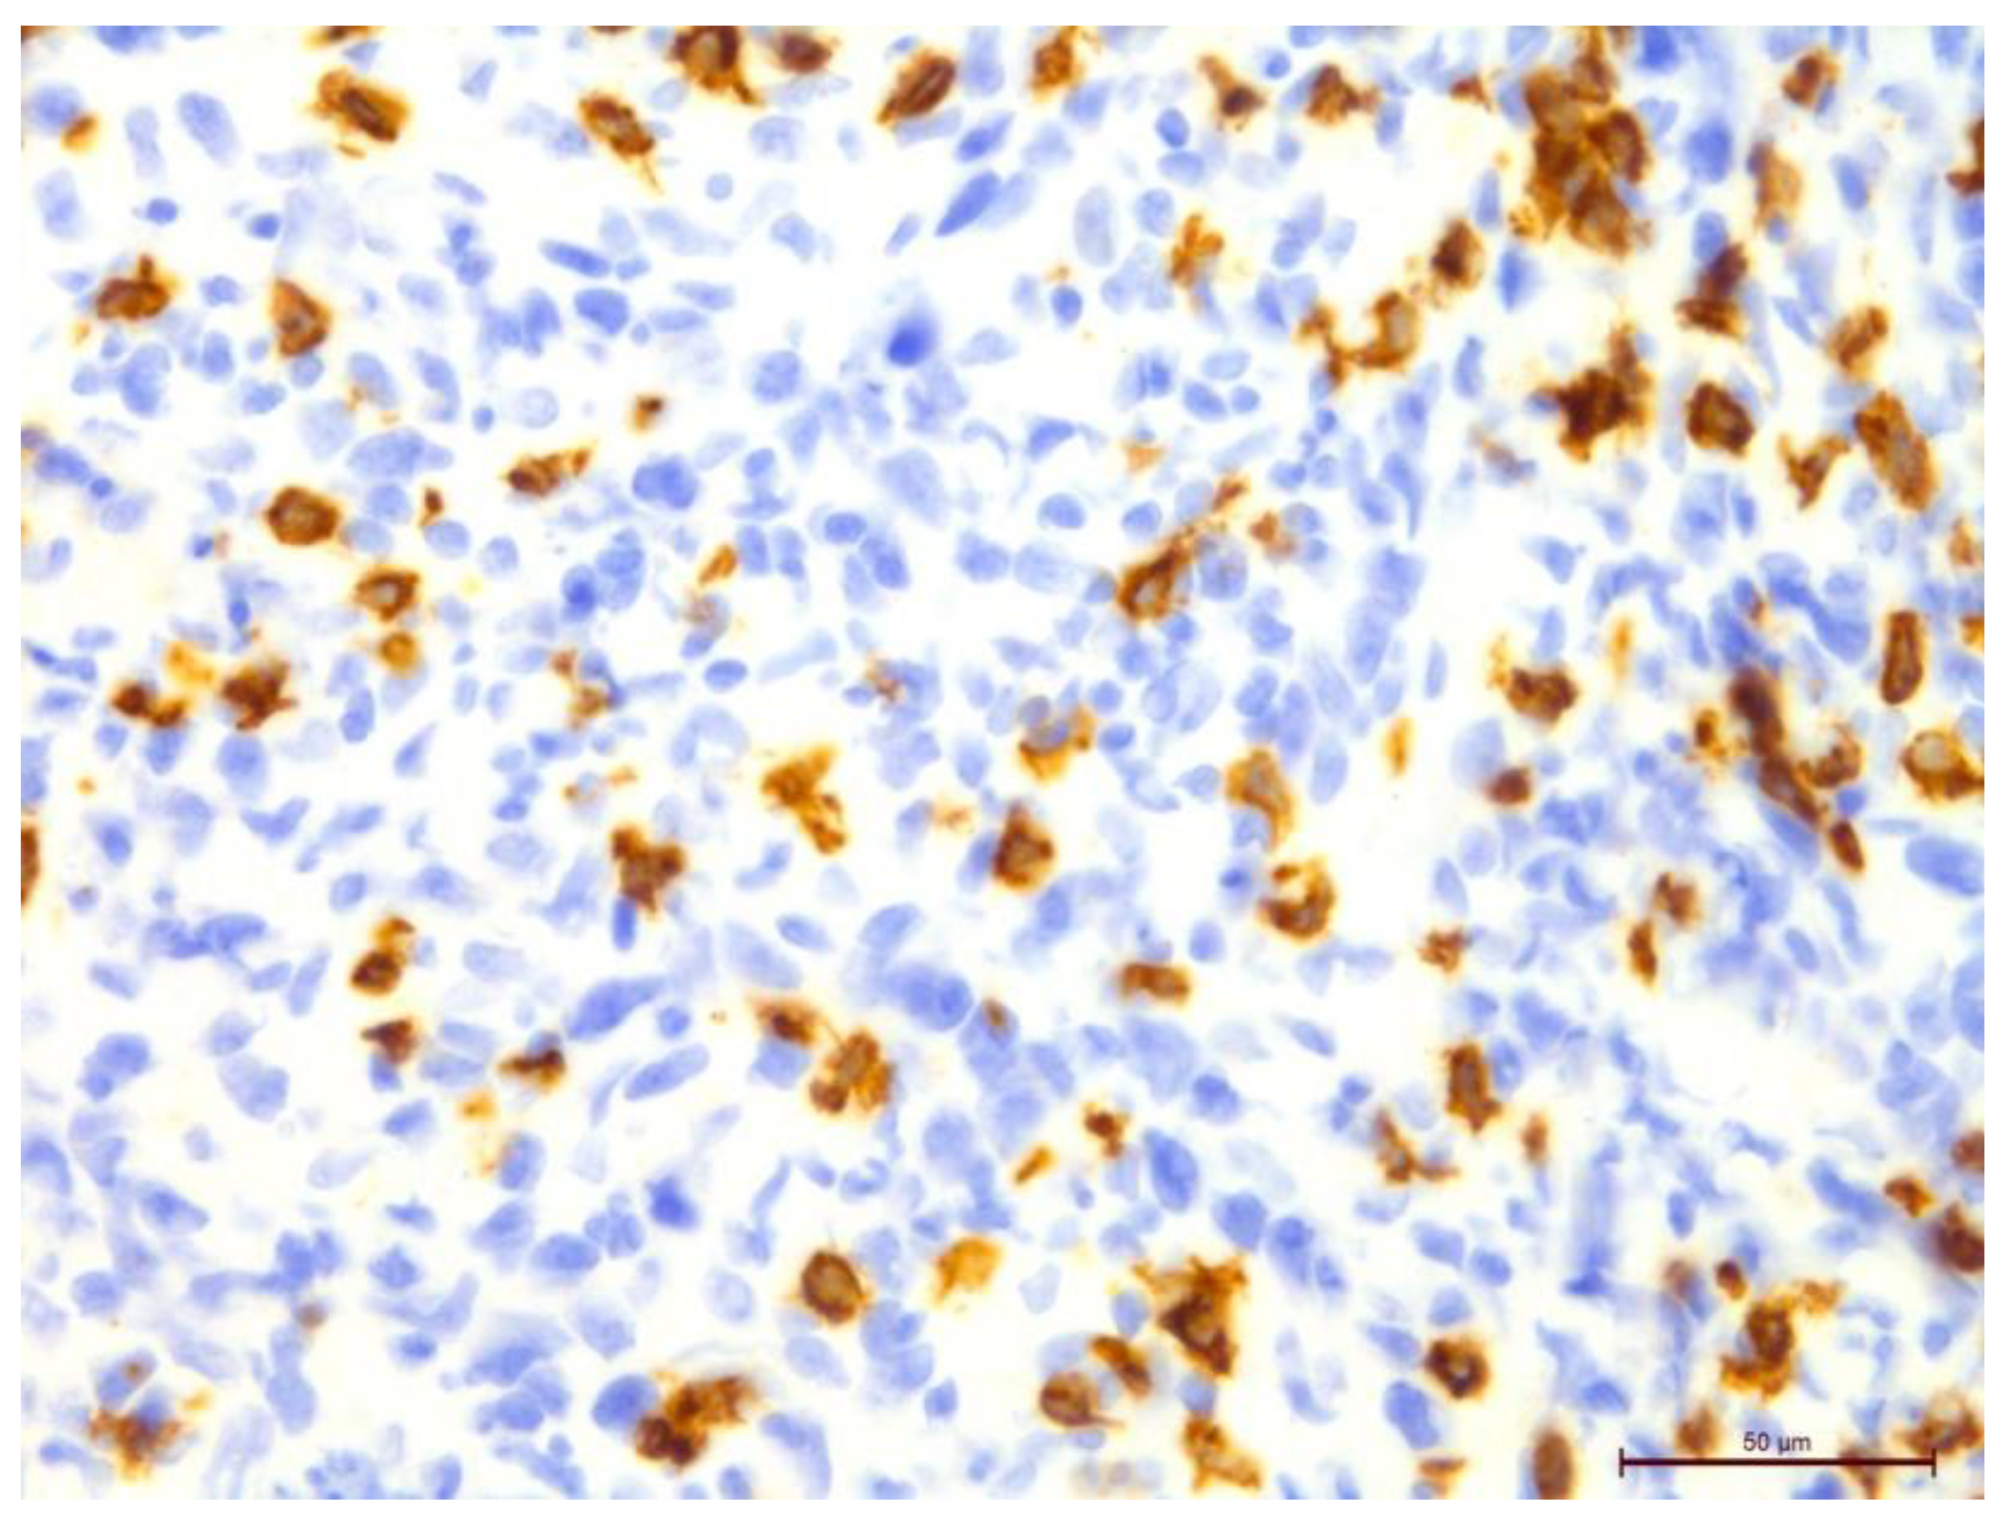
Figure 10.
Comparison of 70% T-lymphocyte infiltration in the tumor stroma by H&E, anti-CD4 and anti-CD8, 400×.
Figure 10.
Comparison of 70% T-lymphocyte infiltration in the tumor stroma by H&E, anti-CD4 and anti-CD8, 400×.
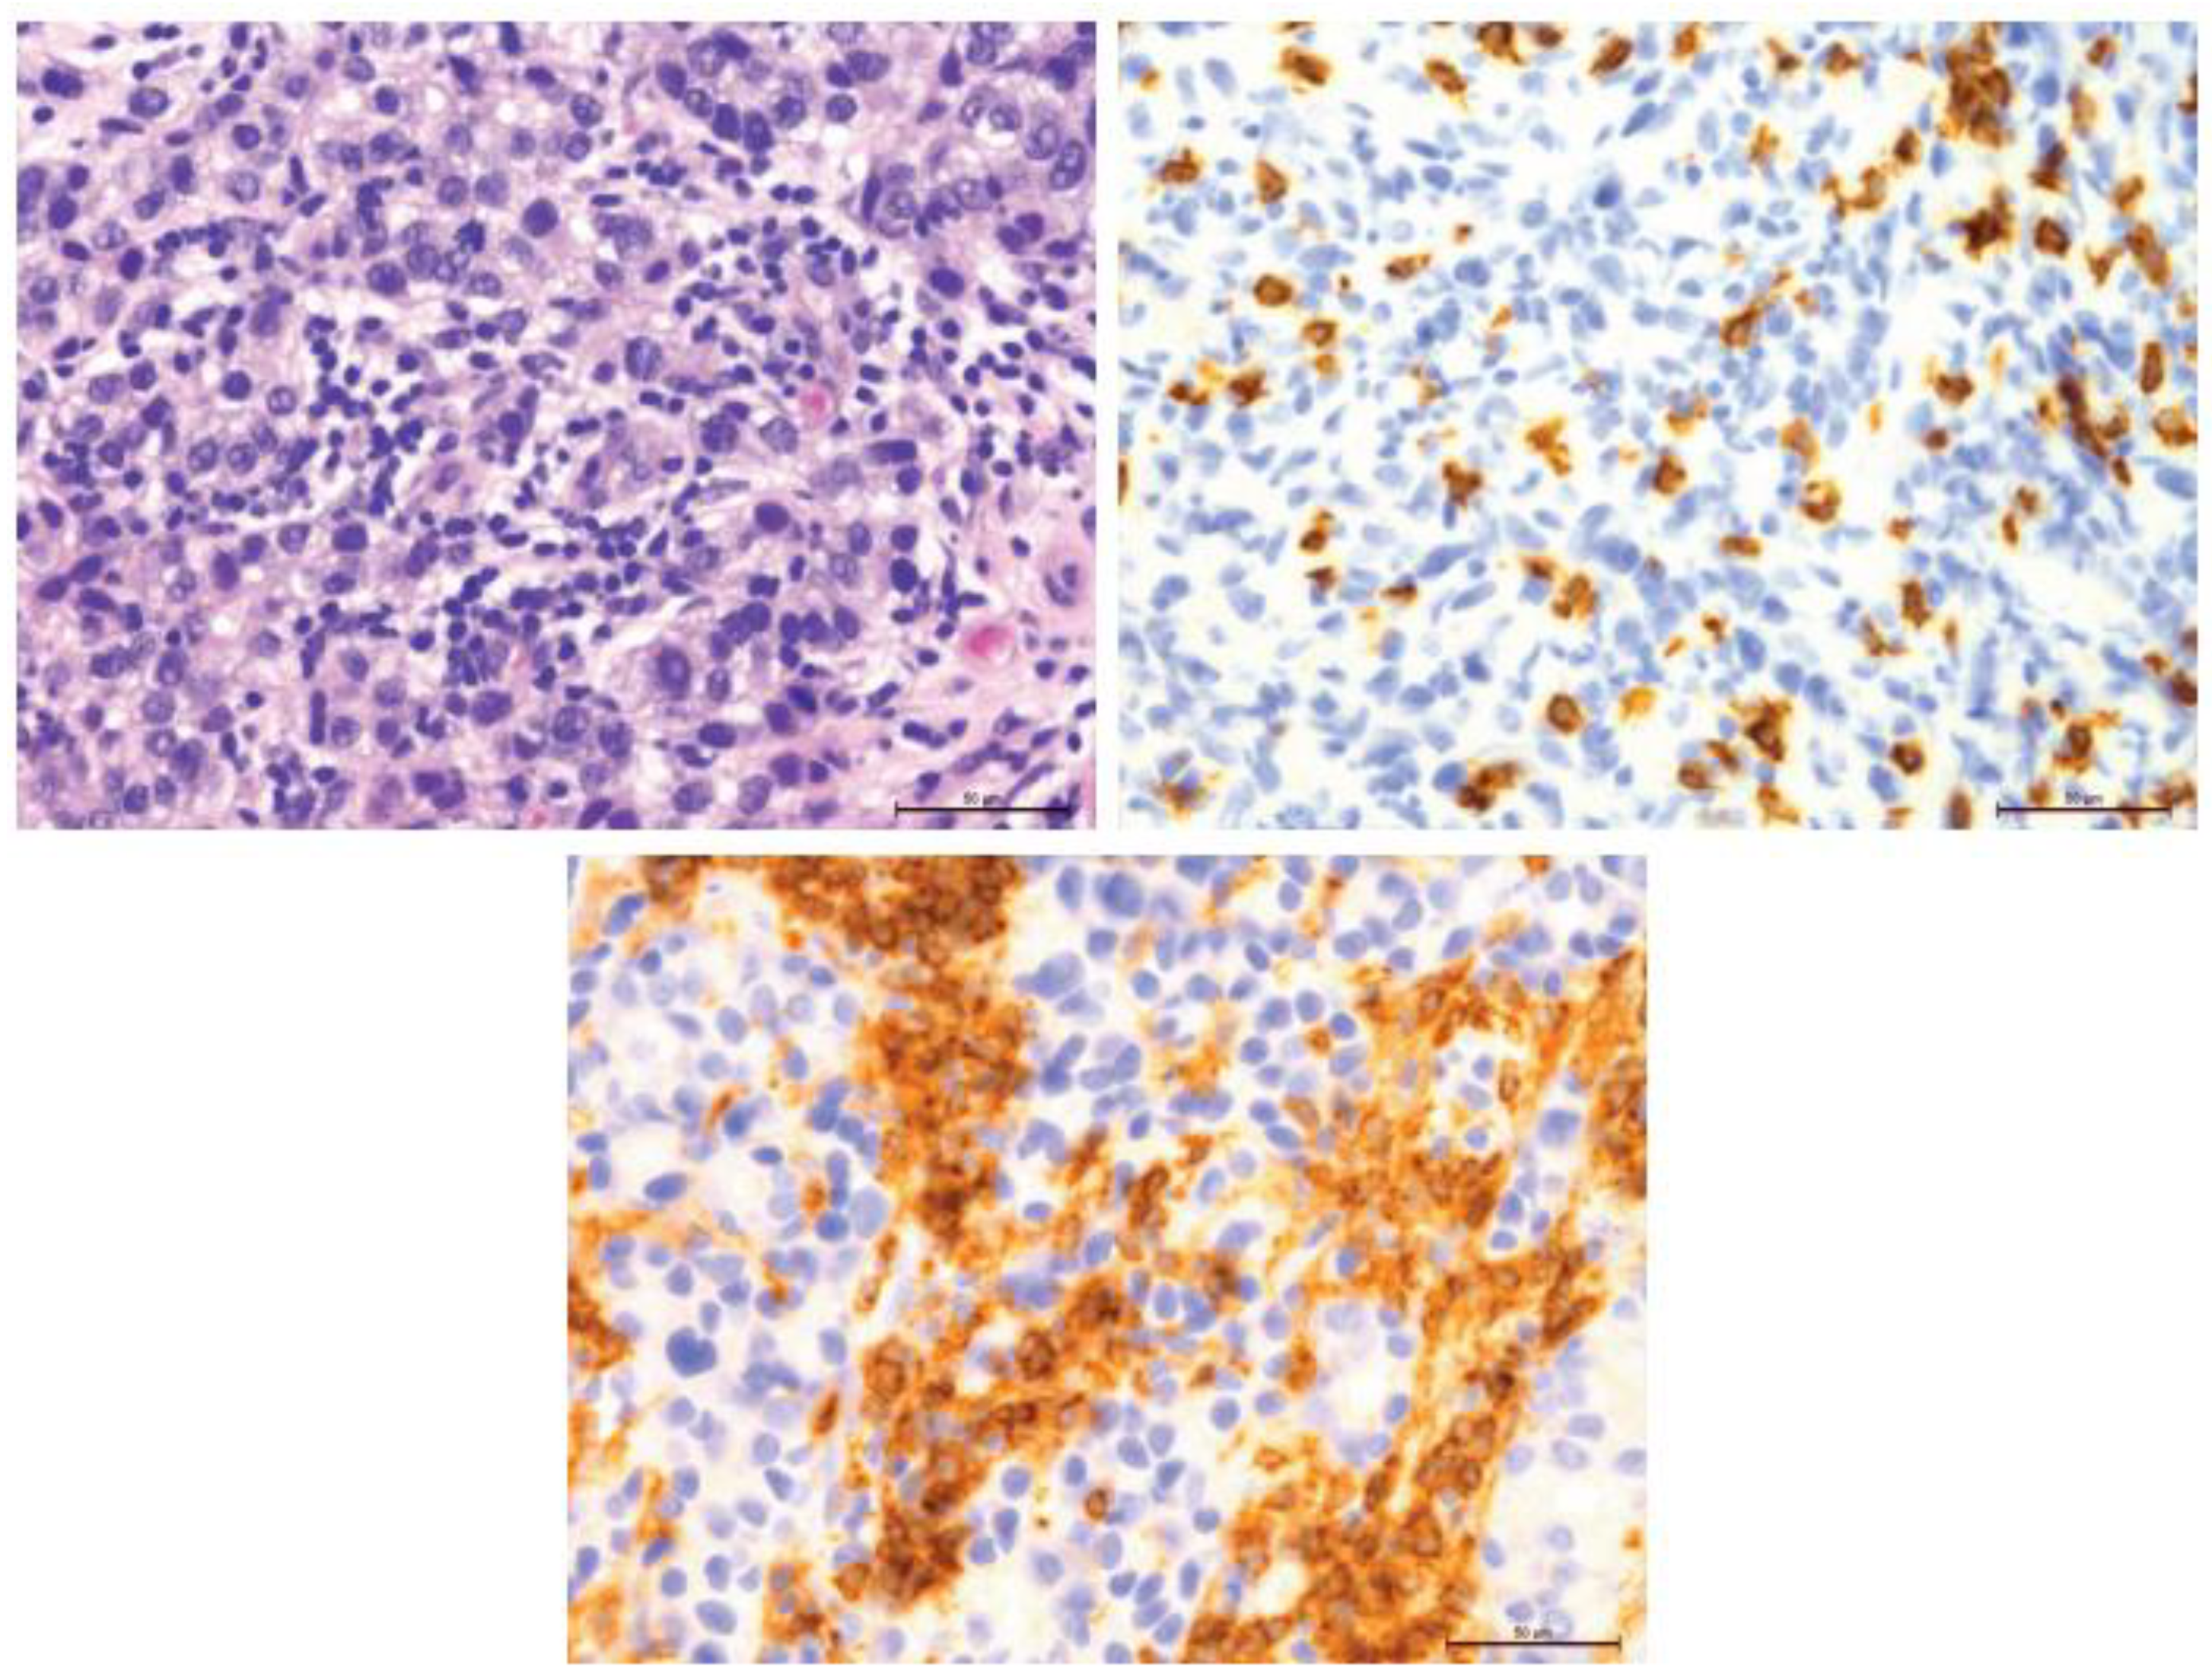
Figure 11.
Comparison of 20% T-lymphocyte infiltration in the tumor stroma by H&E, anti-CD4 and anti-CD8, 400×.
Figure 11.
Comparison of 20% T-lymphocyte infiltration in the tumor stroma by H&E, anti-CD4 and anti-CD8, 400×.
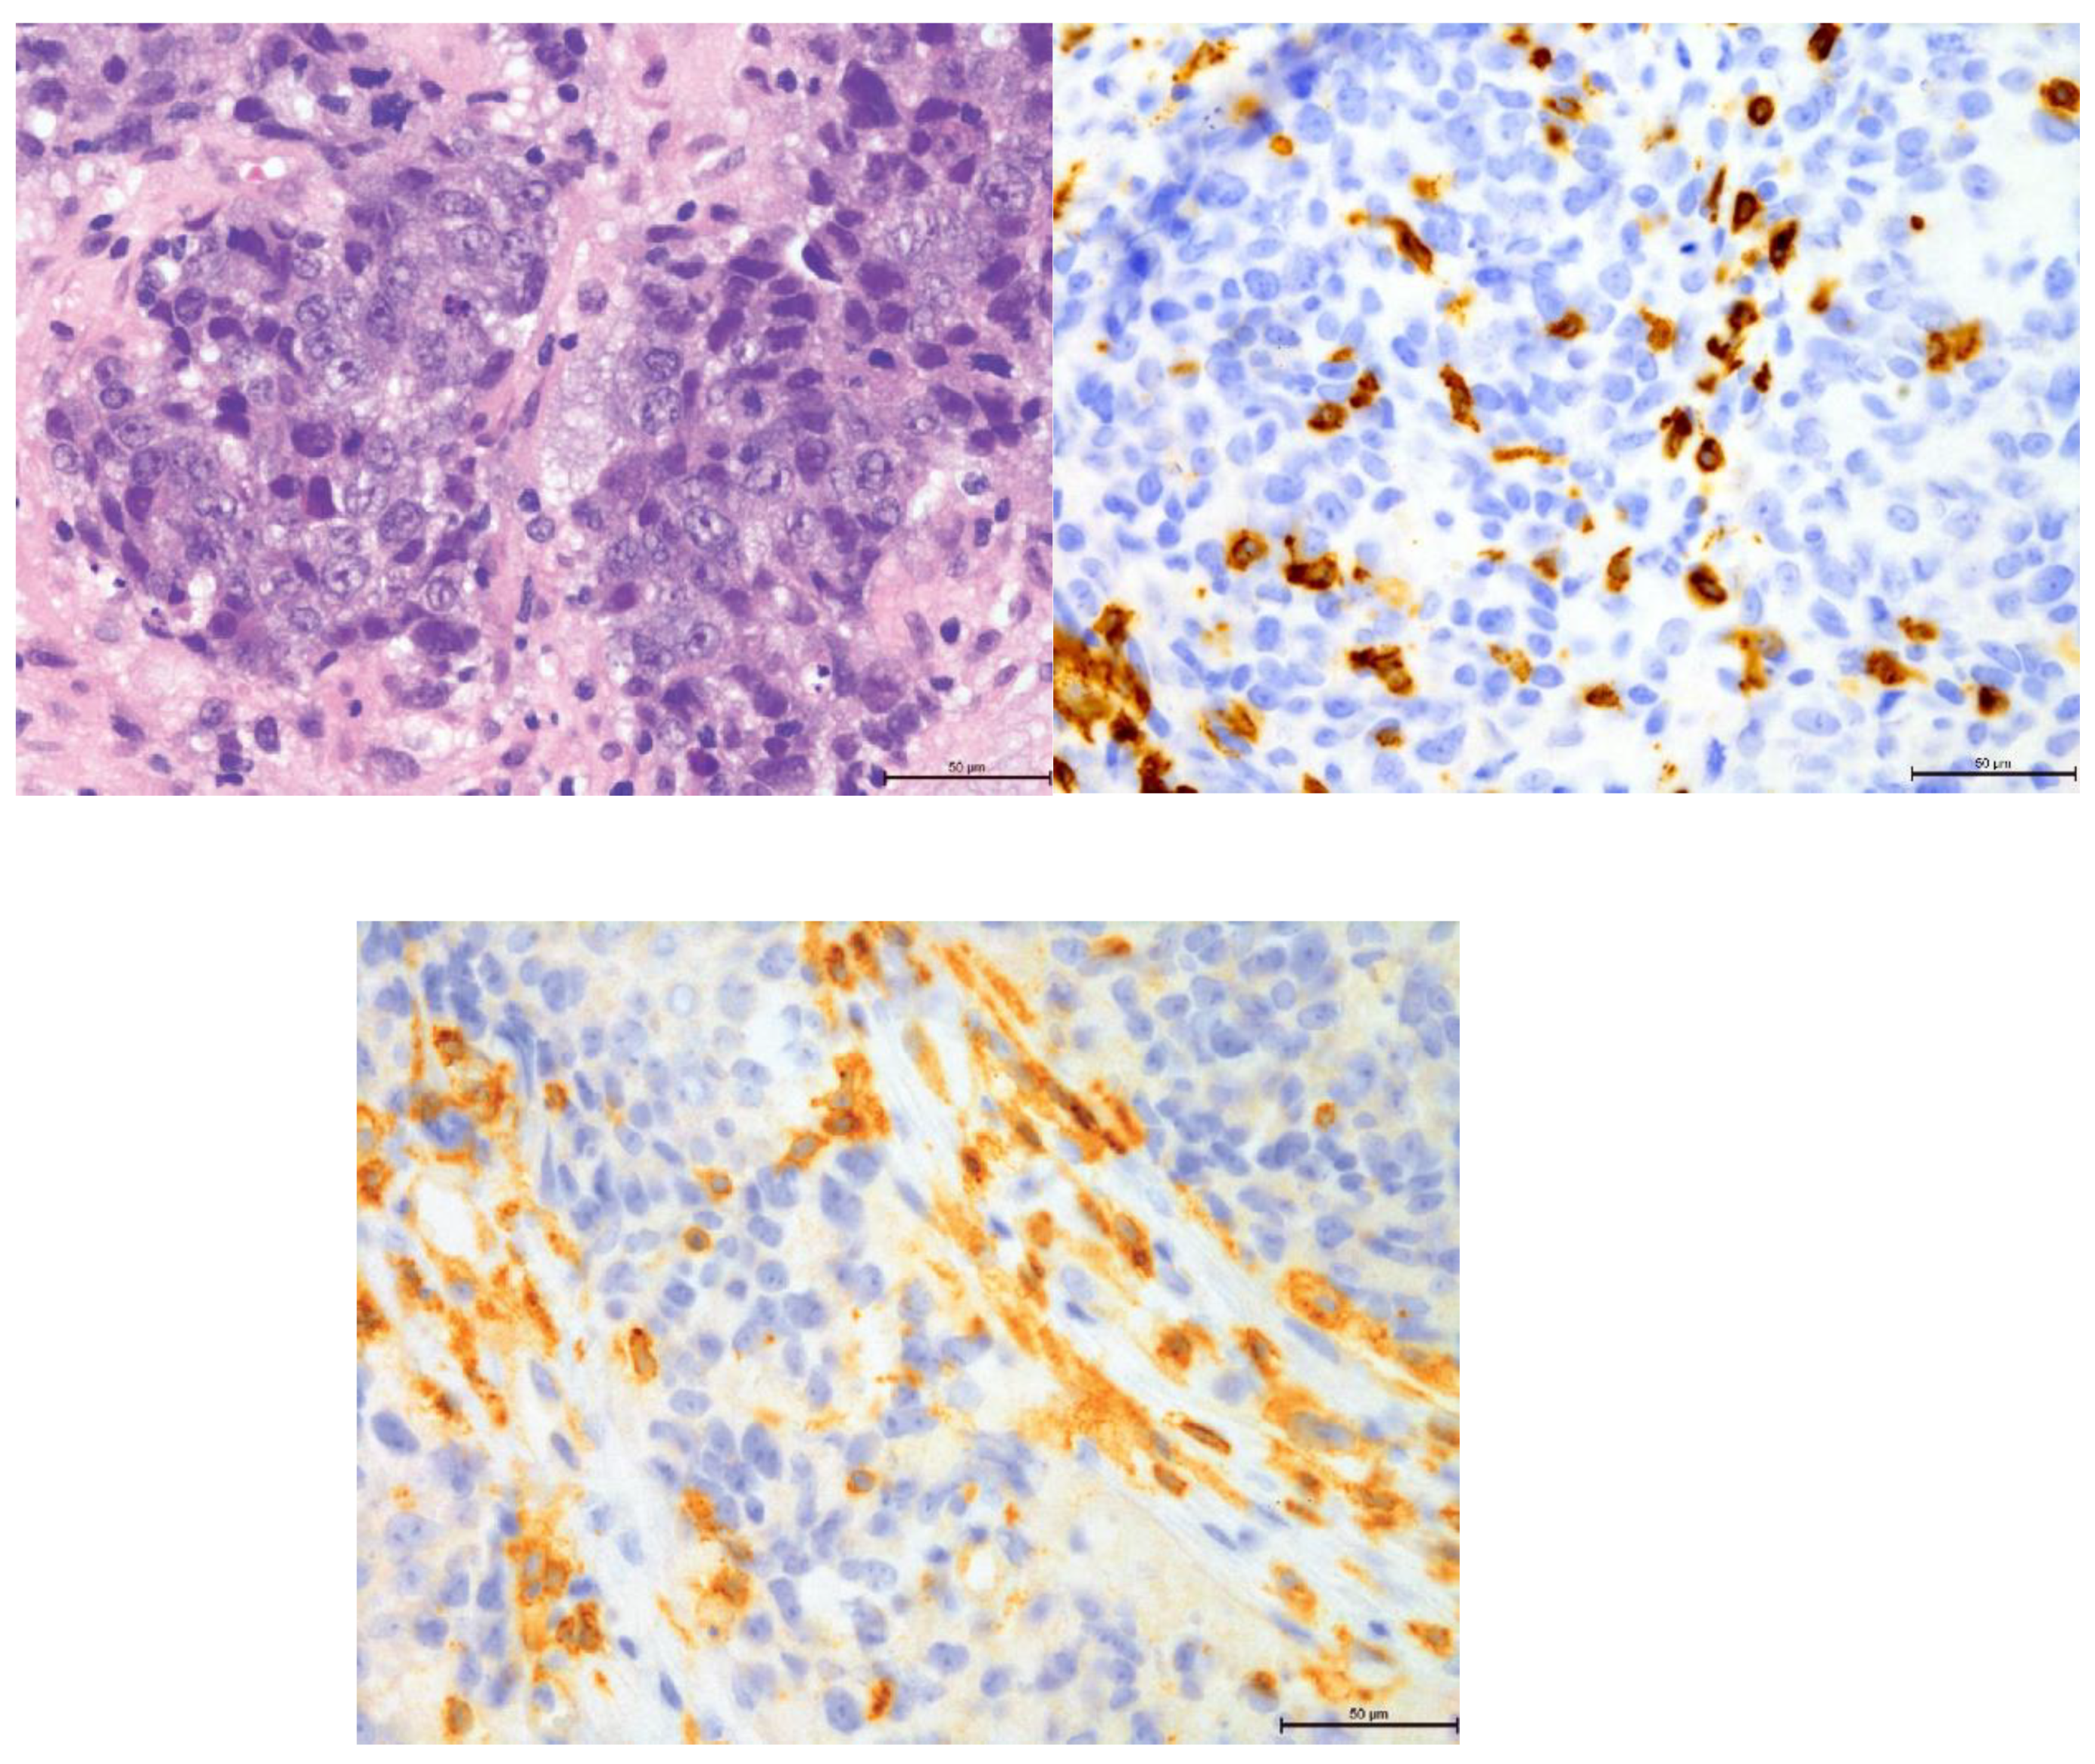
Figure 12.
Comparison of 5% T-lymphocyte infiltration in the tumor stroma by H&E, anti-CD4 and anti-CD8, 400×.
Figure 12.
Comparison of 5% T-lymphocyte infiltration in the tumor stroma by H&E, anti-CD4 and anti-CD8, 400×.
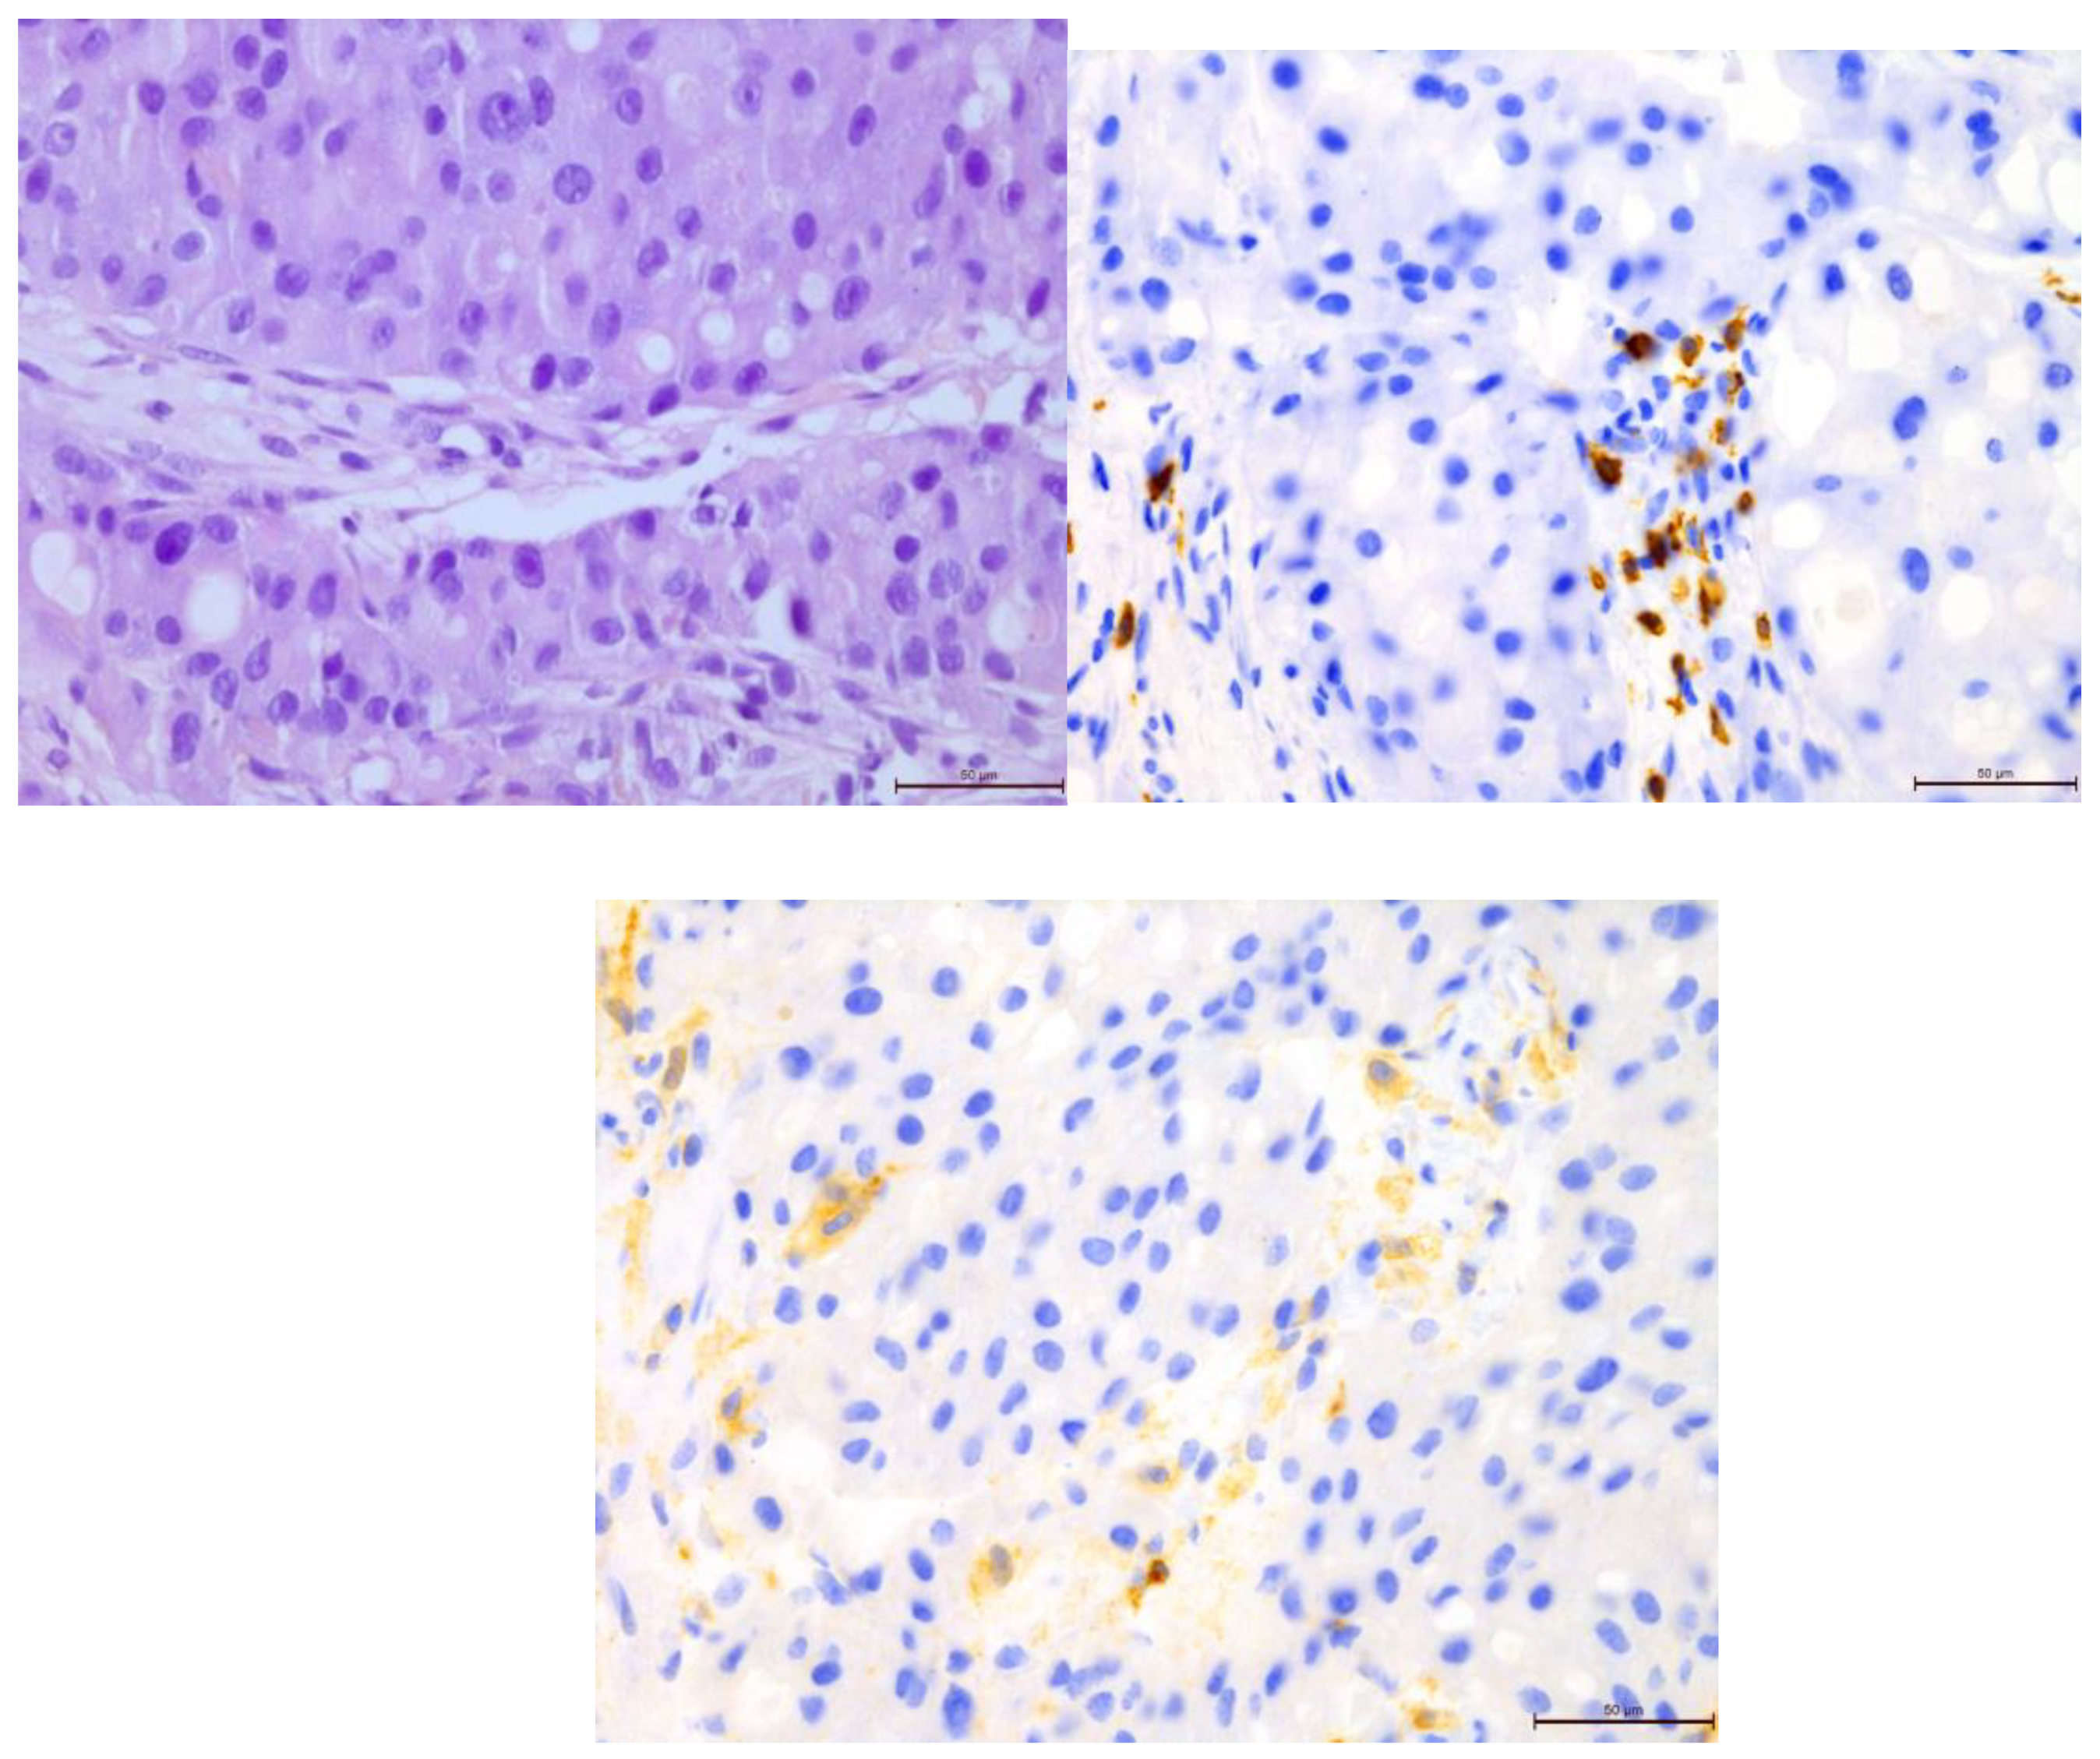
Figure 13.
Invasive breast cancer showing the lack of AR nuclear expression using anti-AR in the area of 200×.
Figure 13.
Invasive breast cancer showing the lack of AR nuclear expression using anti-AR in the area of 200×.
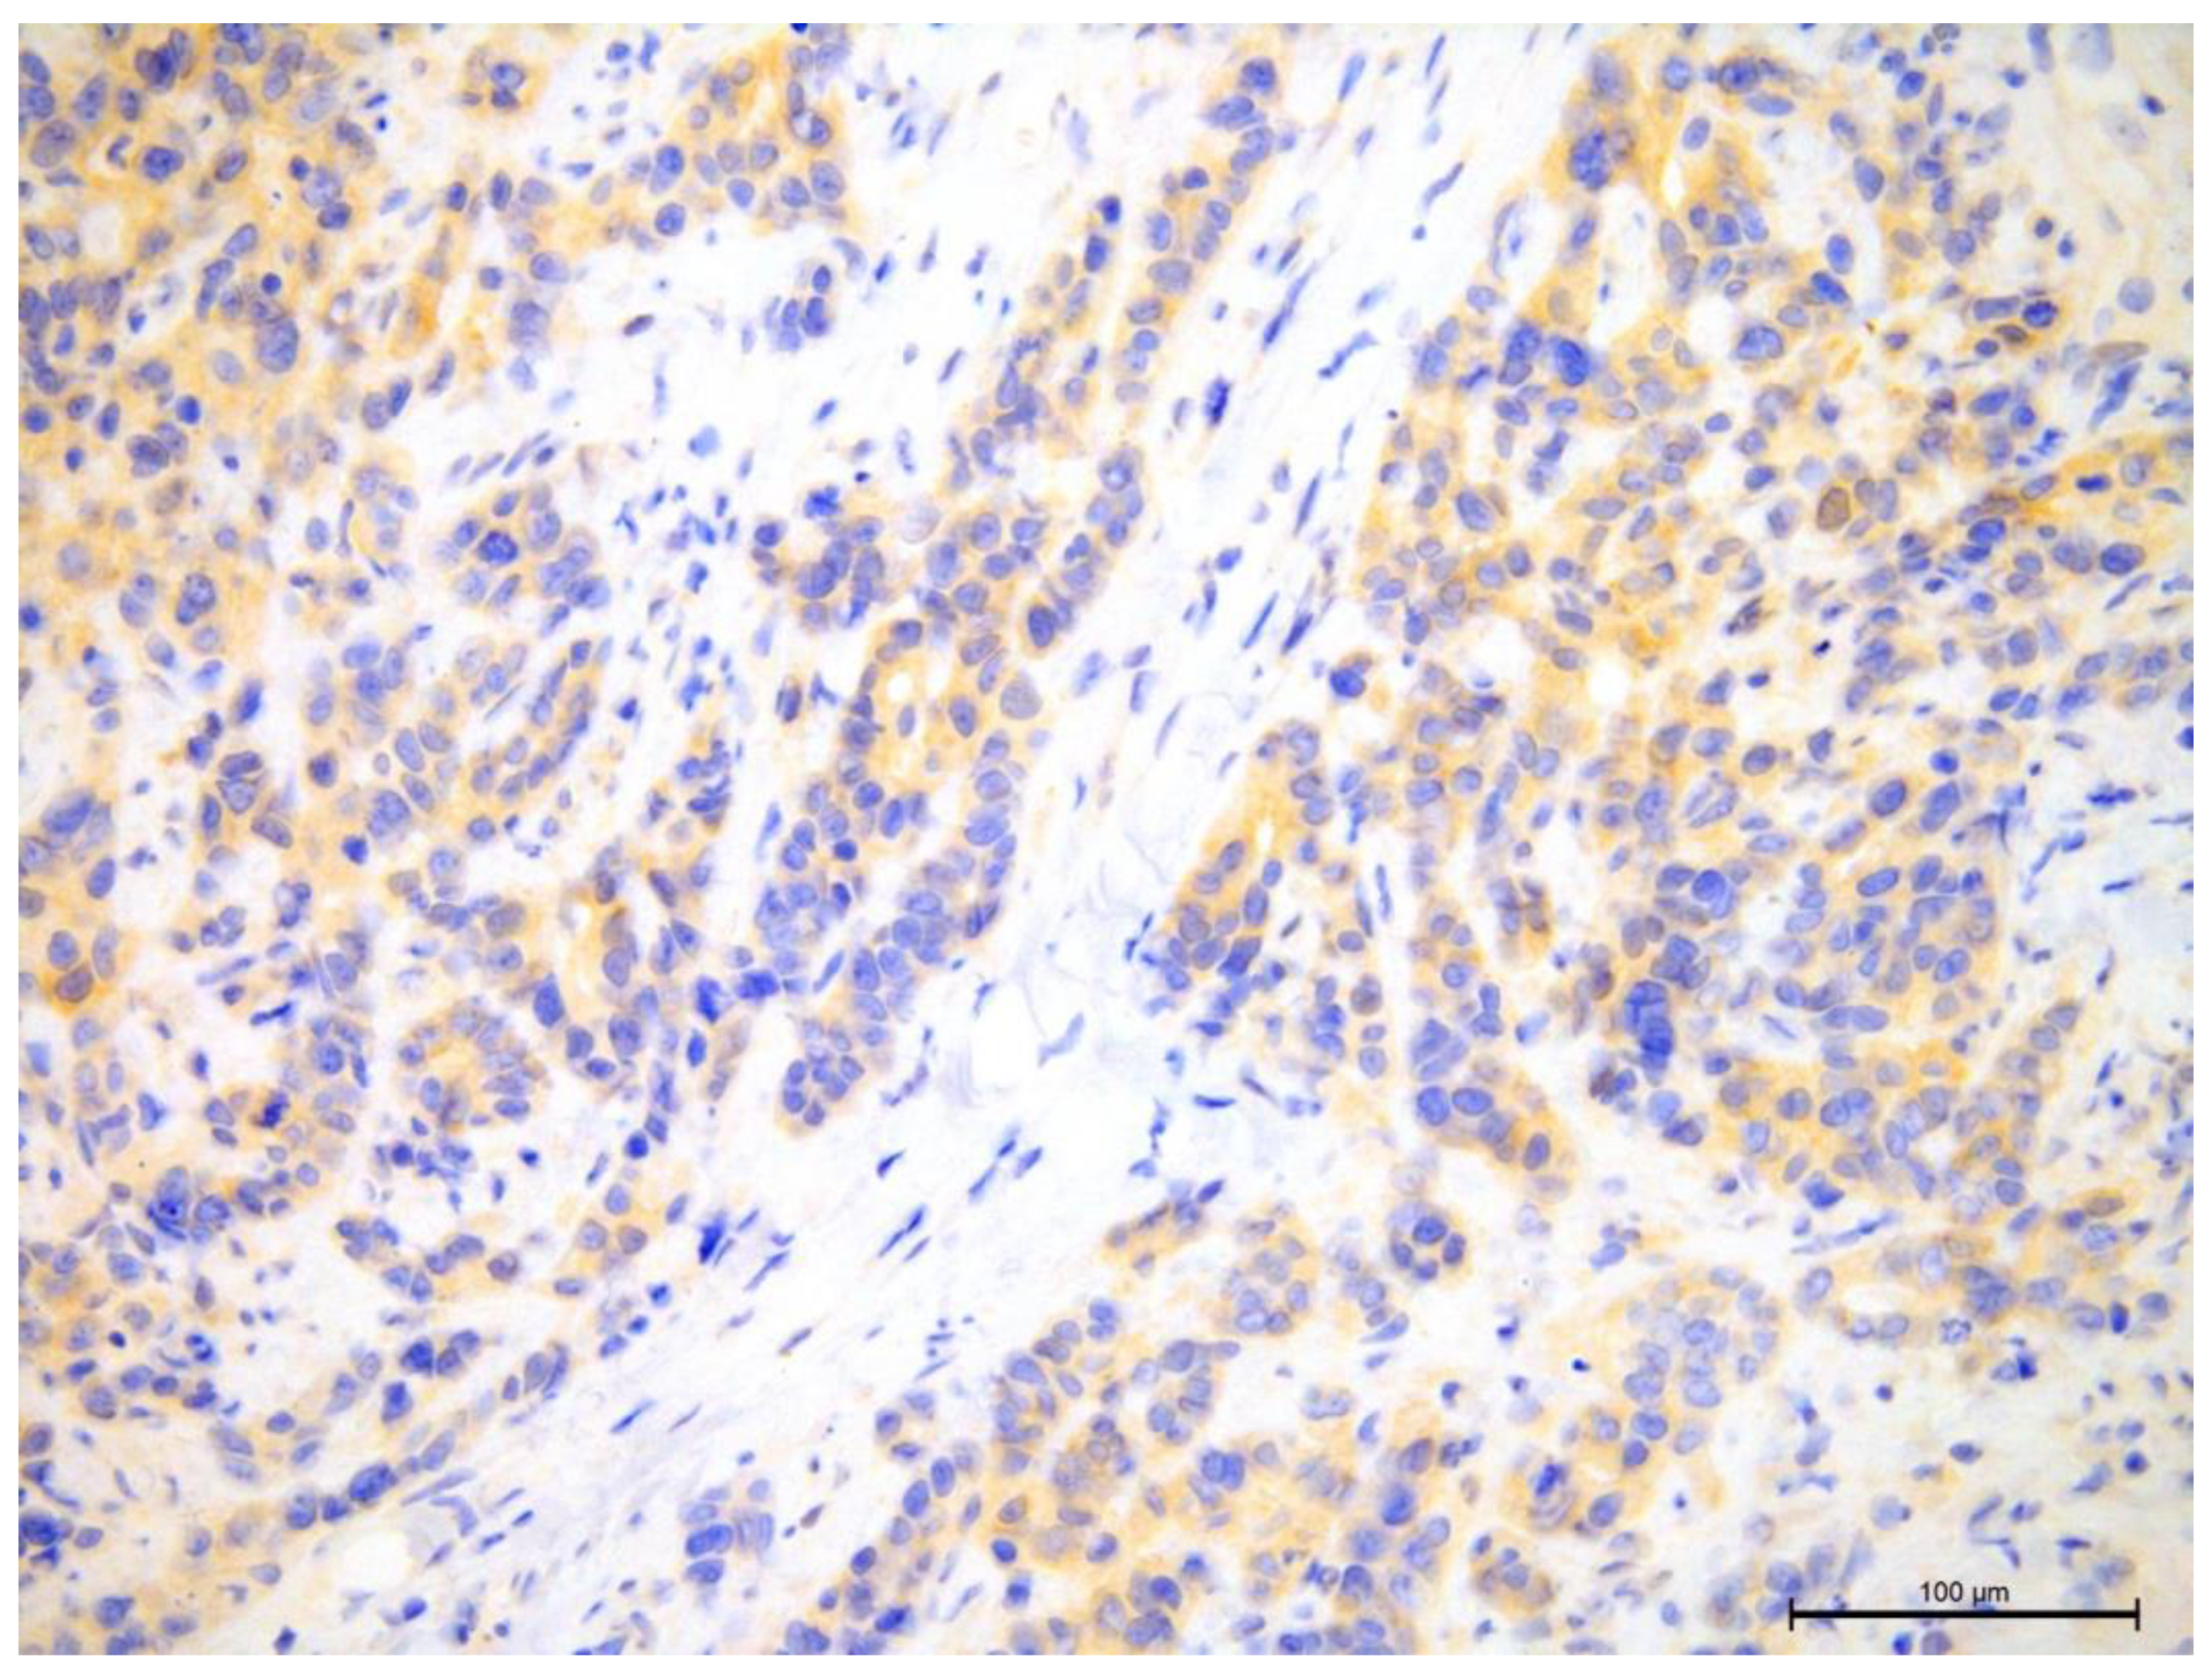
Figure 14.
Invasive breast cancer showing 90% nuclear expression of the AR receptor using anti-AR in the area of 200×.
Figure 14.
Invasive breast cancer showing 90% nuclear expression of the AR receptor using anti-AR in the area of 200×.
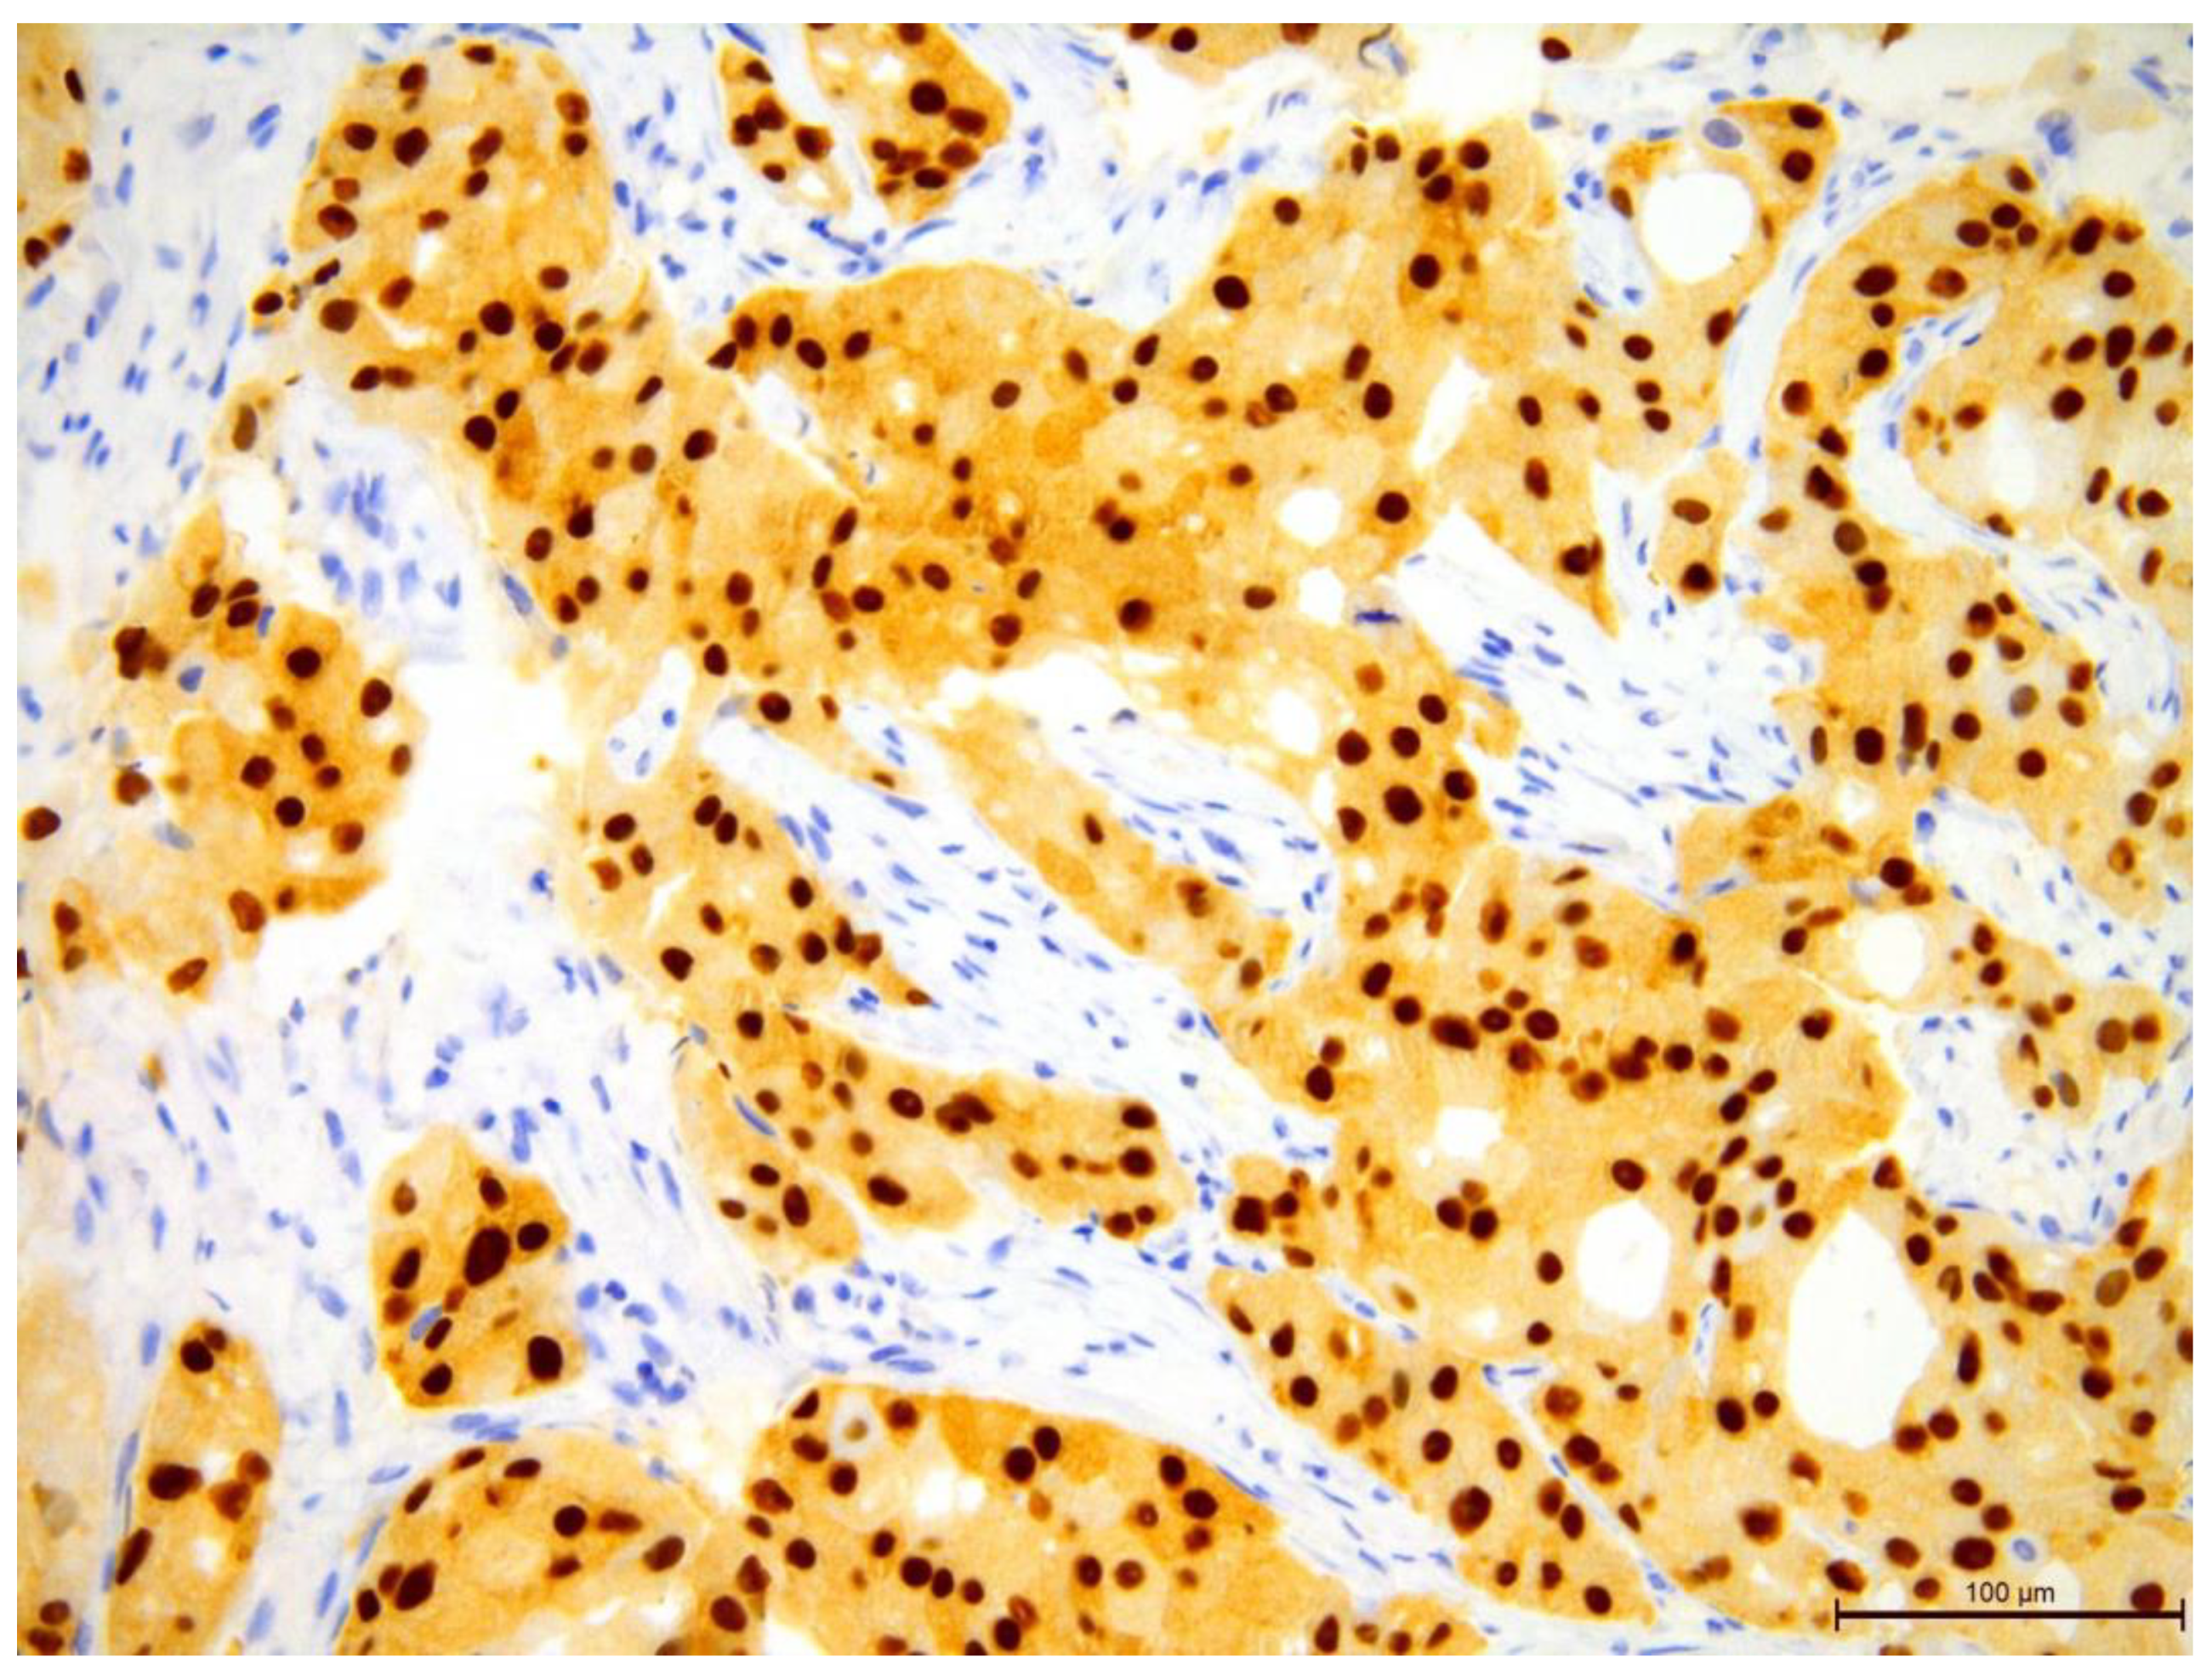
Figure 15.
Histogram of the age of the study group.
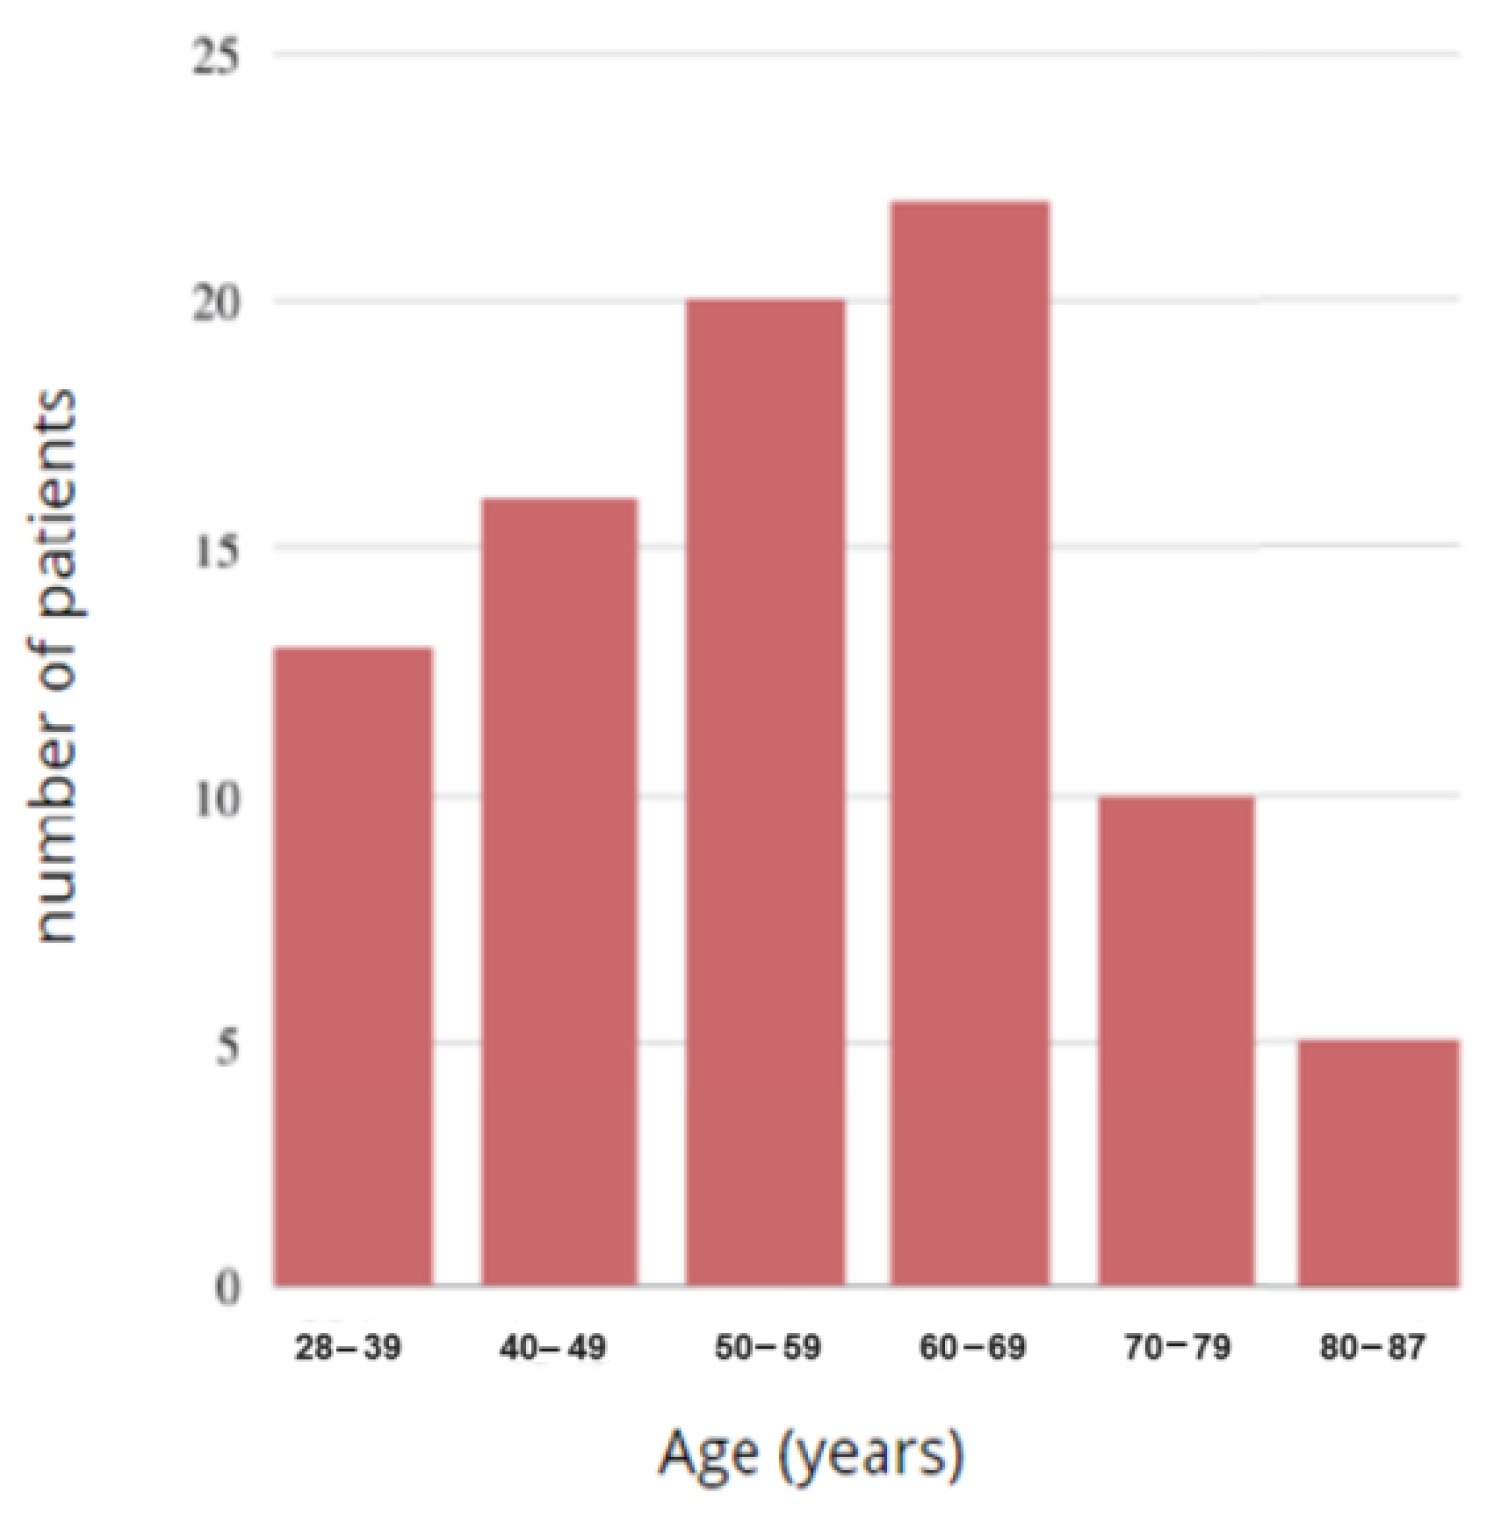
Figure 16.
Correlation between the age of the study group and the BMI degree.
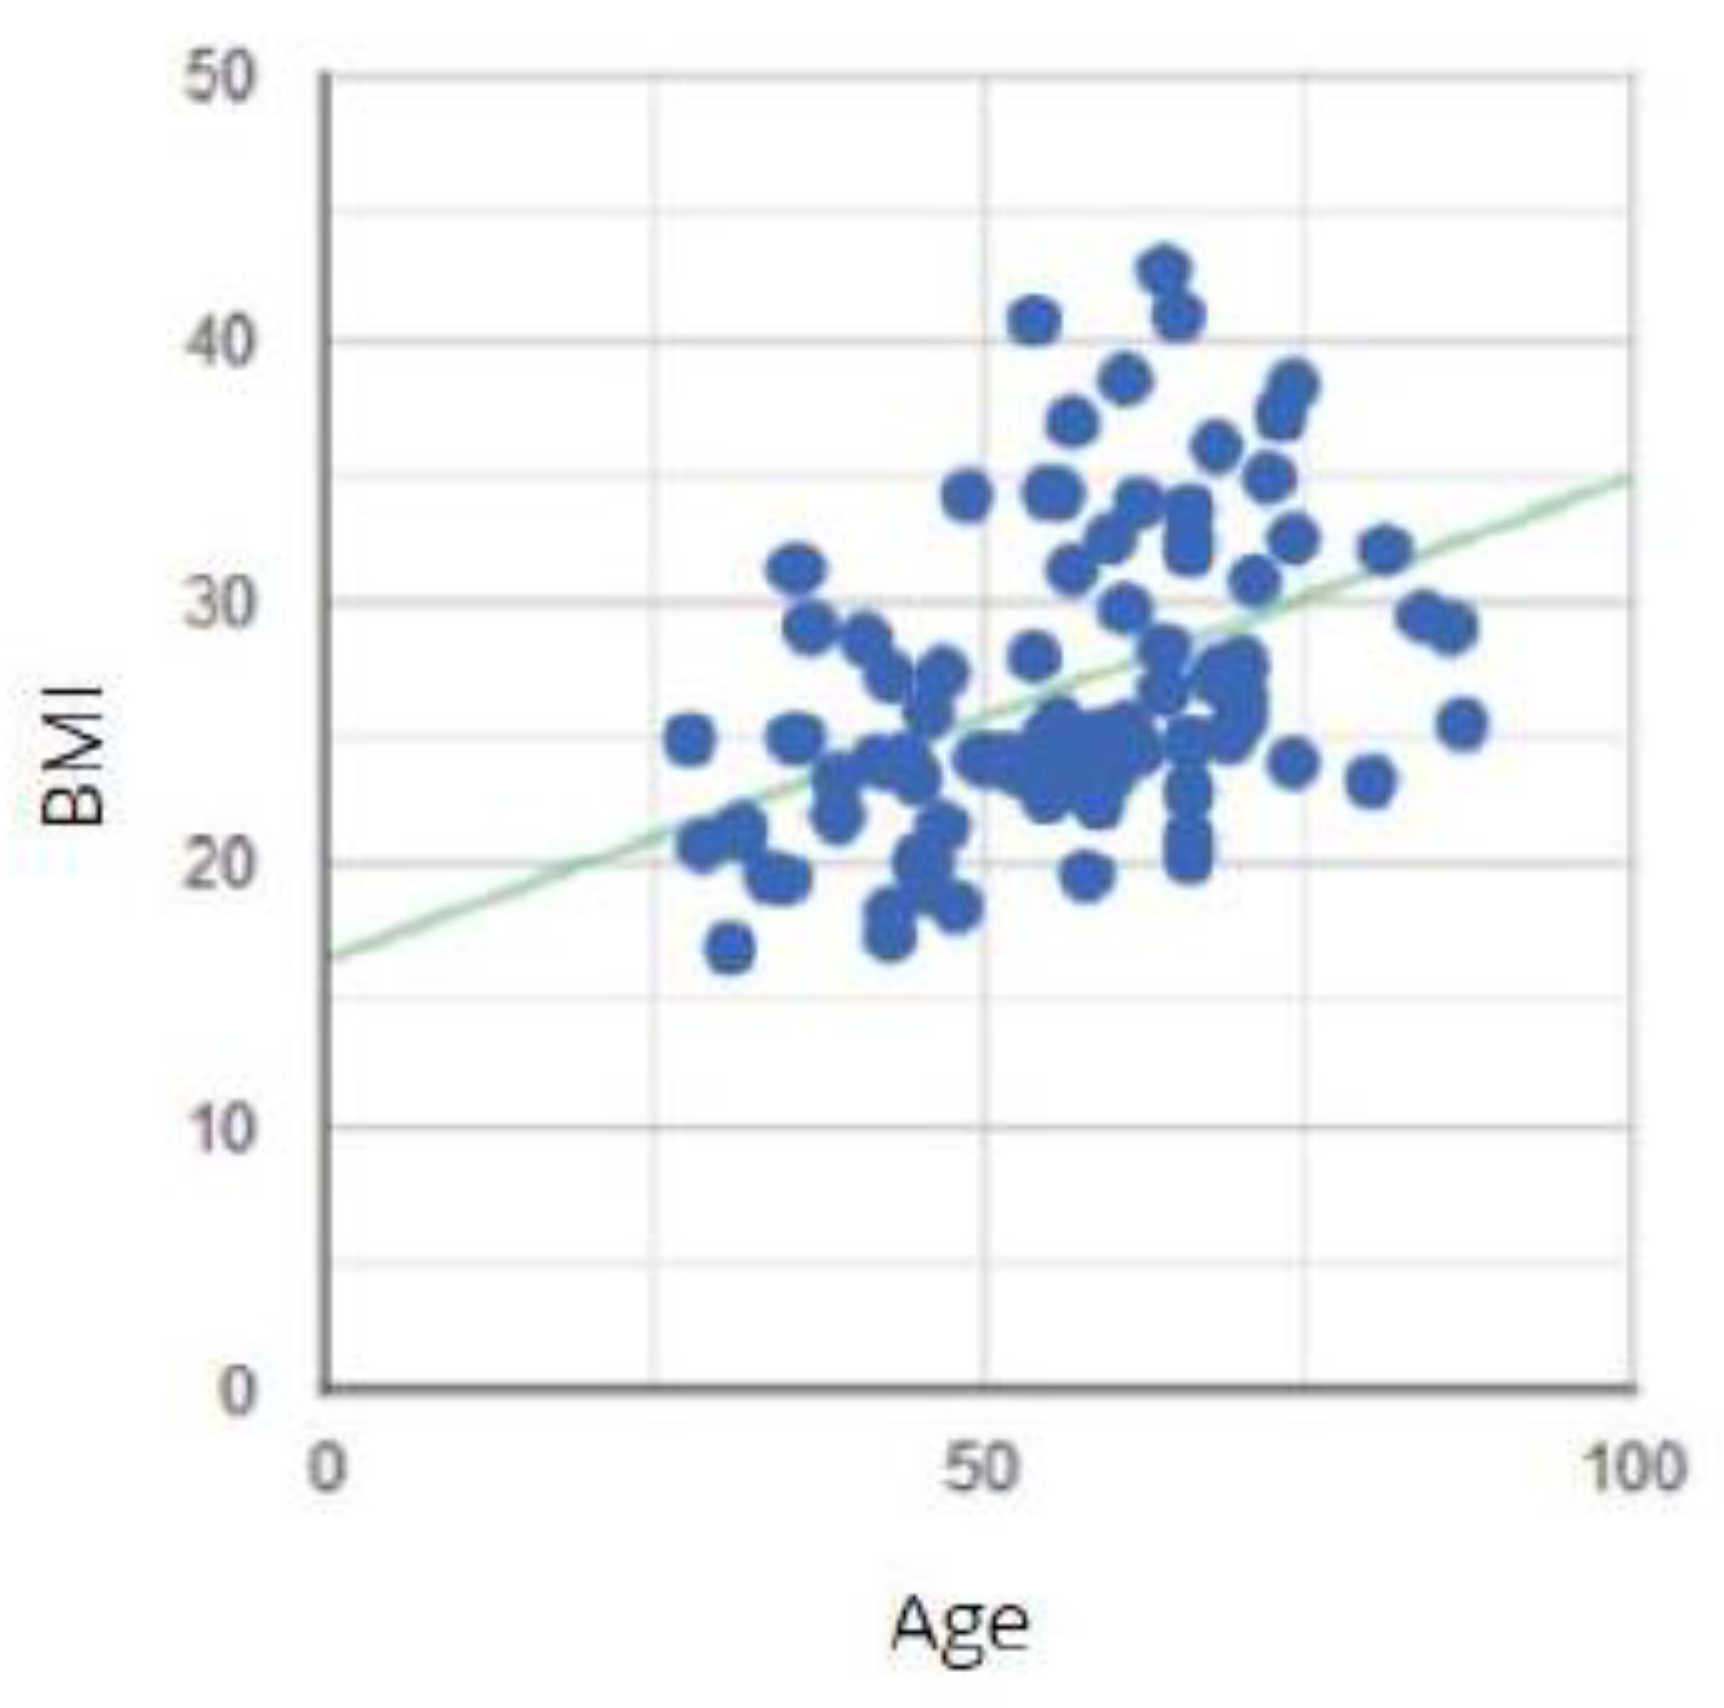
Figure 17.
Histogram of the study group according to AR.
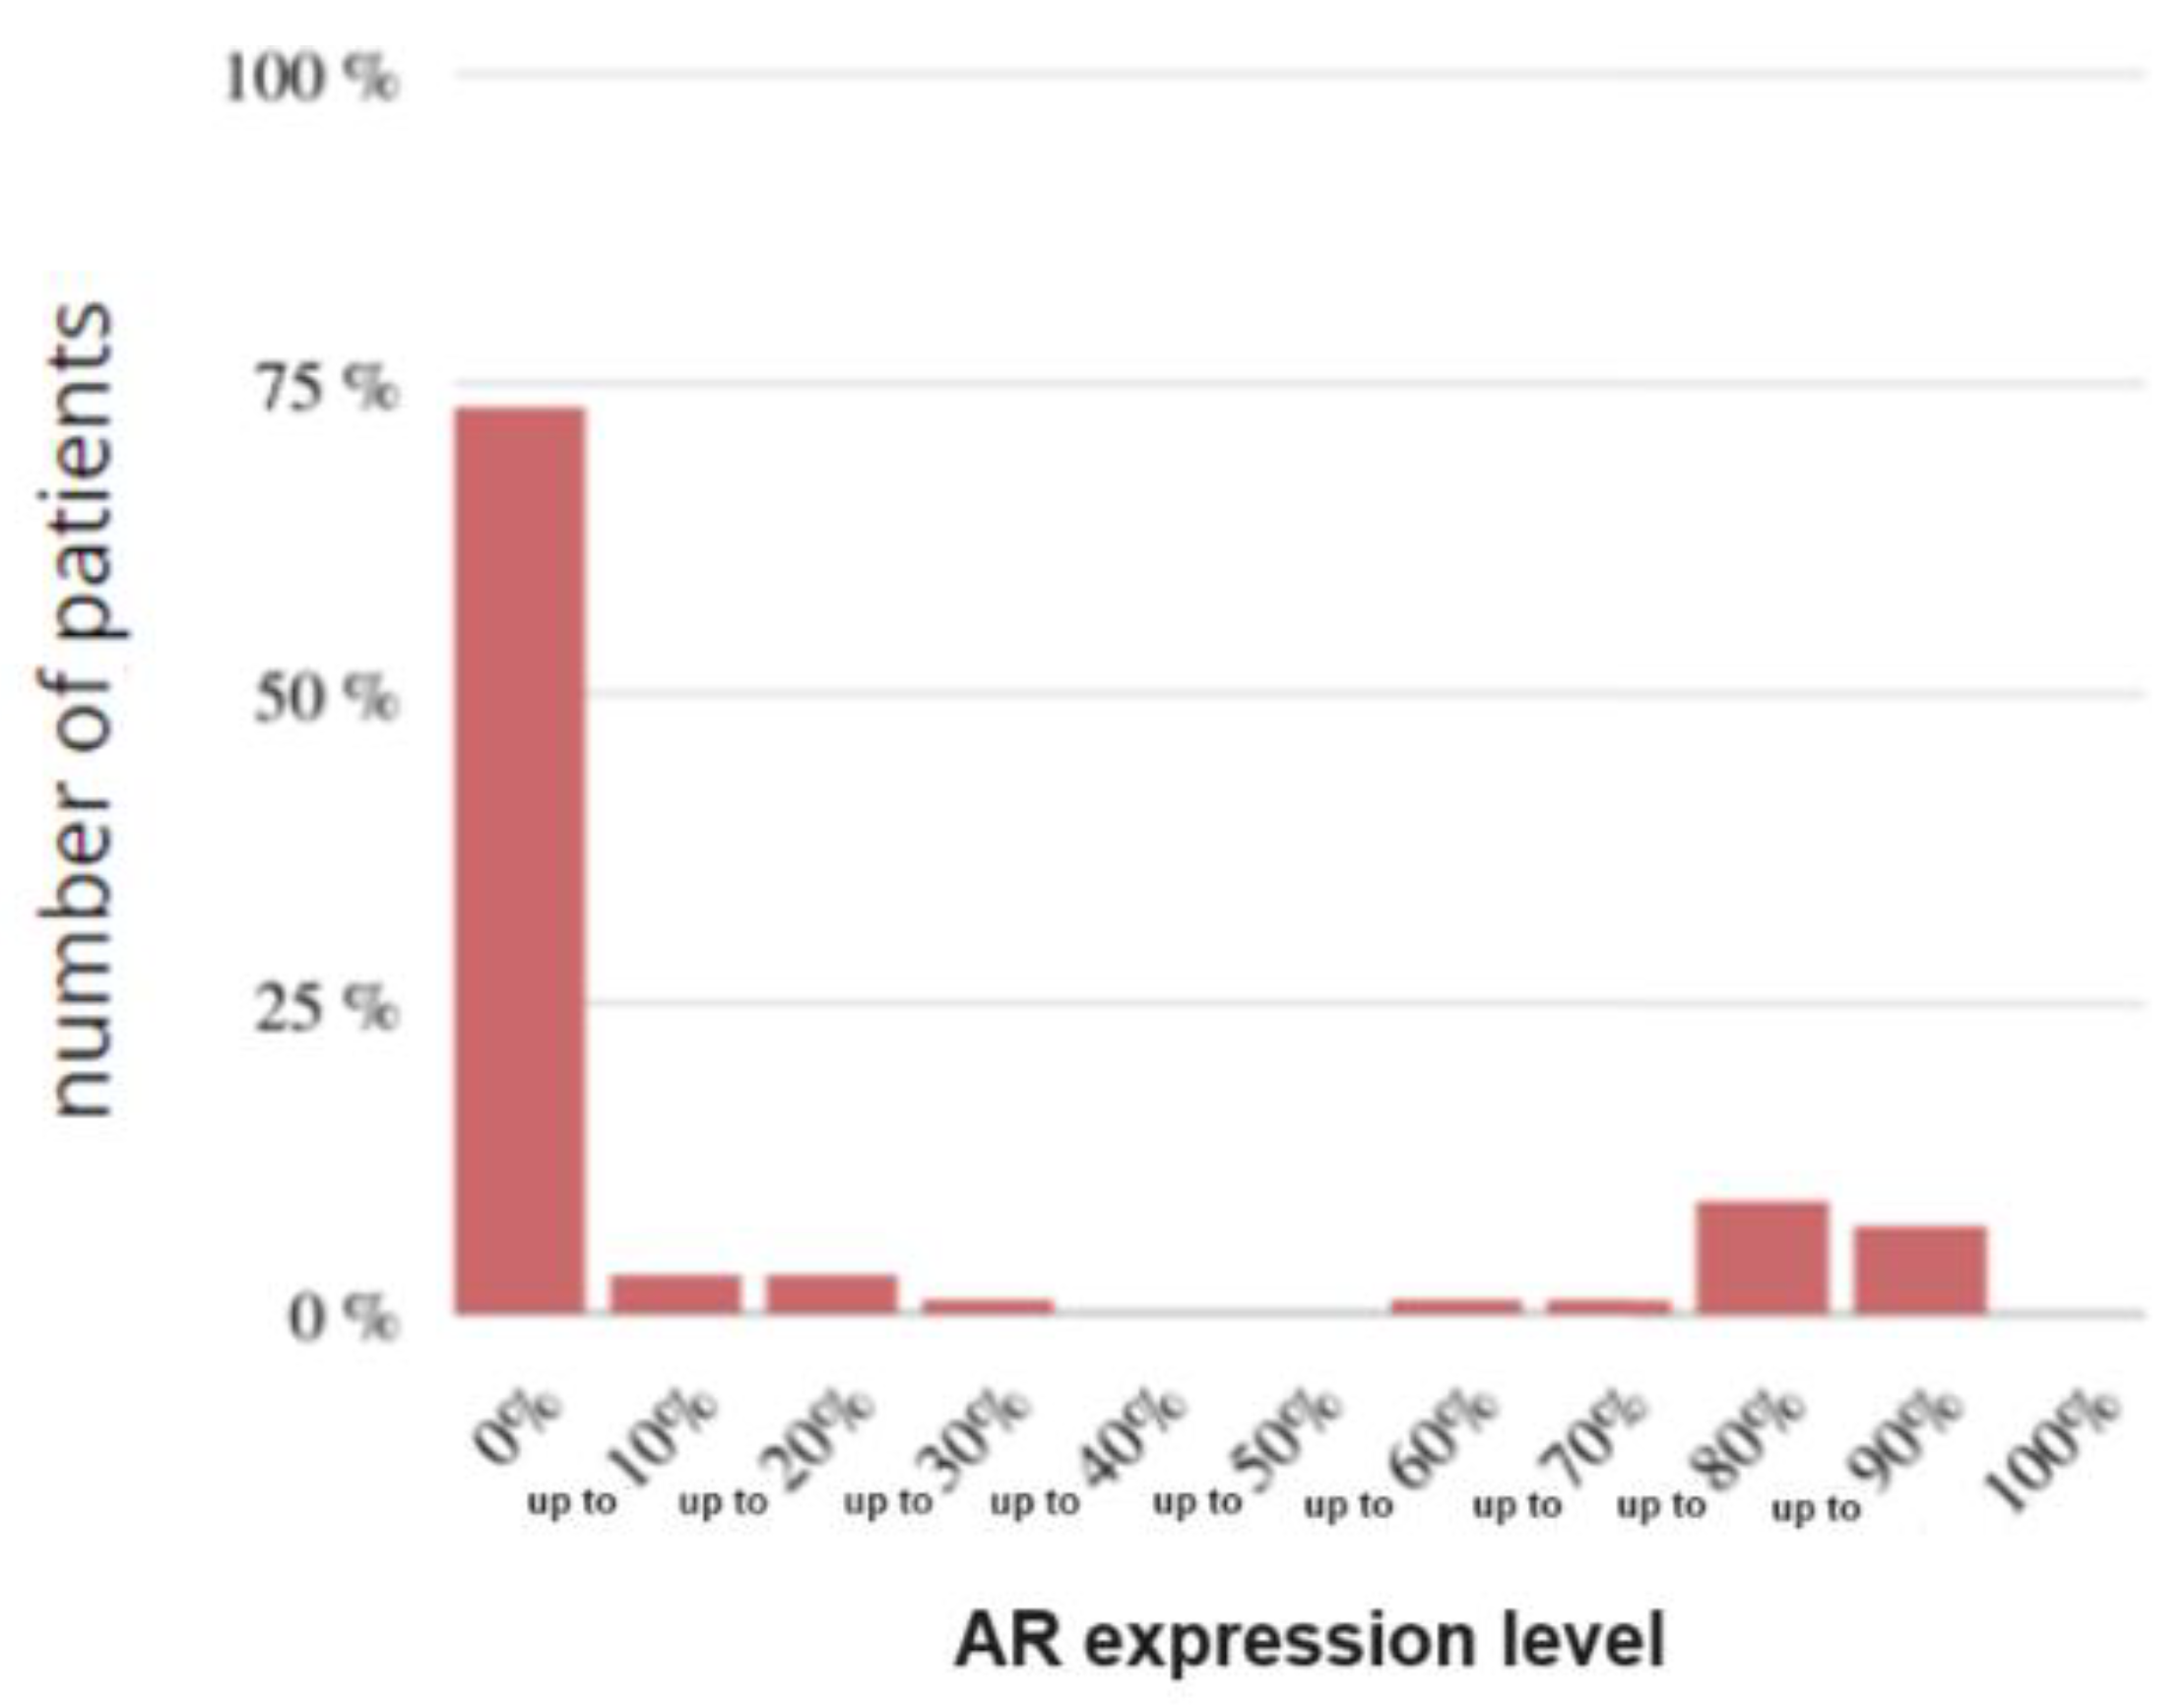
Figure 18.
Histogram of the study group according to the TILs.
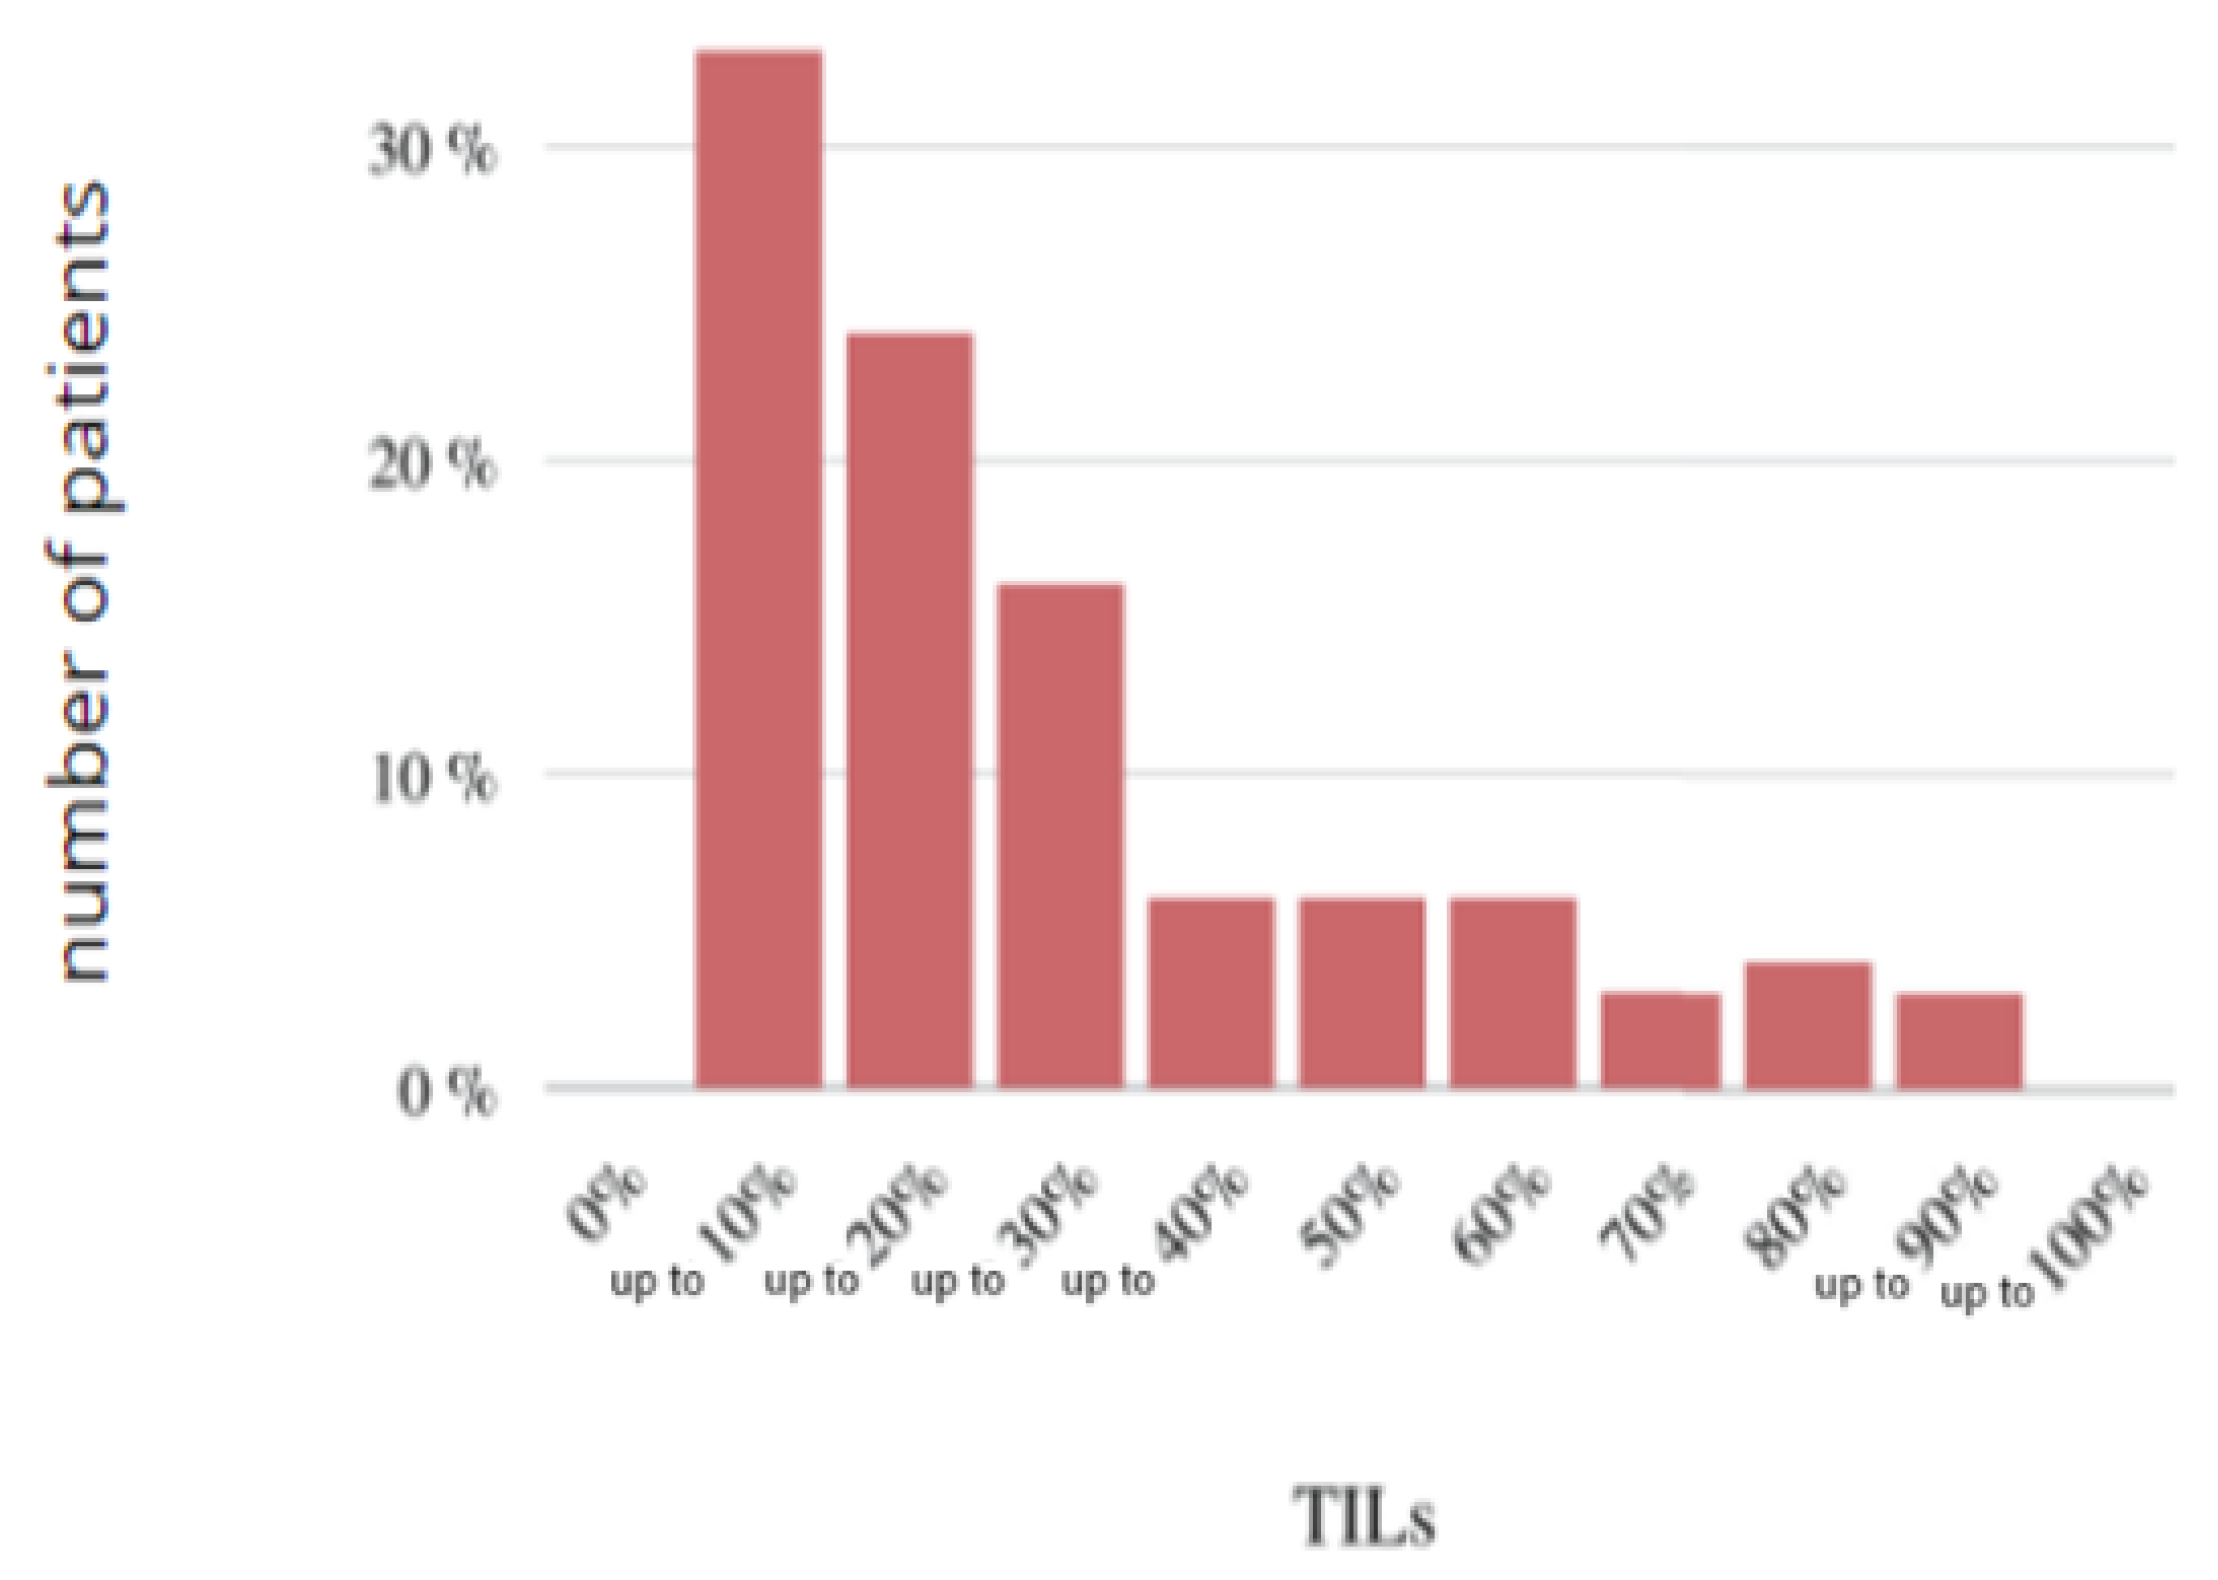
Figure 19.
Correlation between the level of AR expression and TILs.
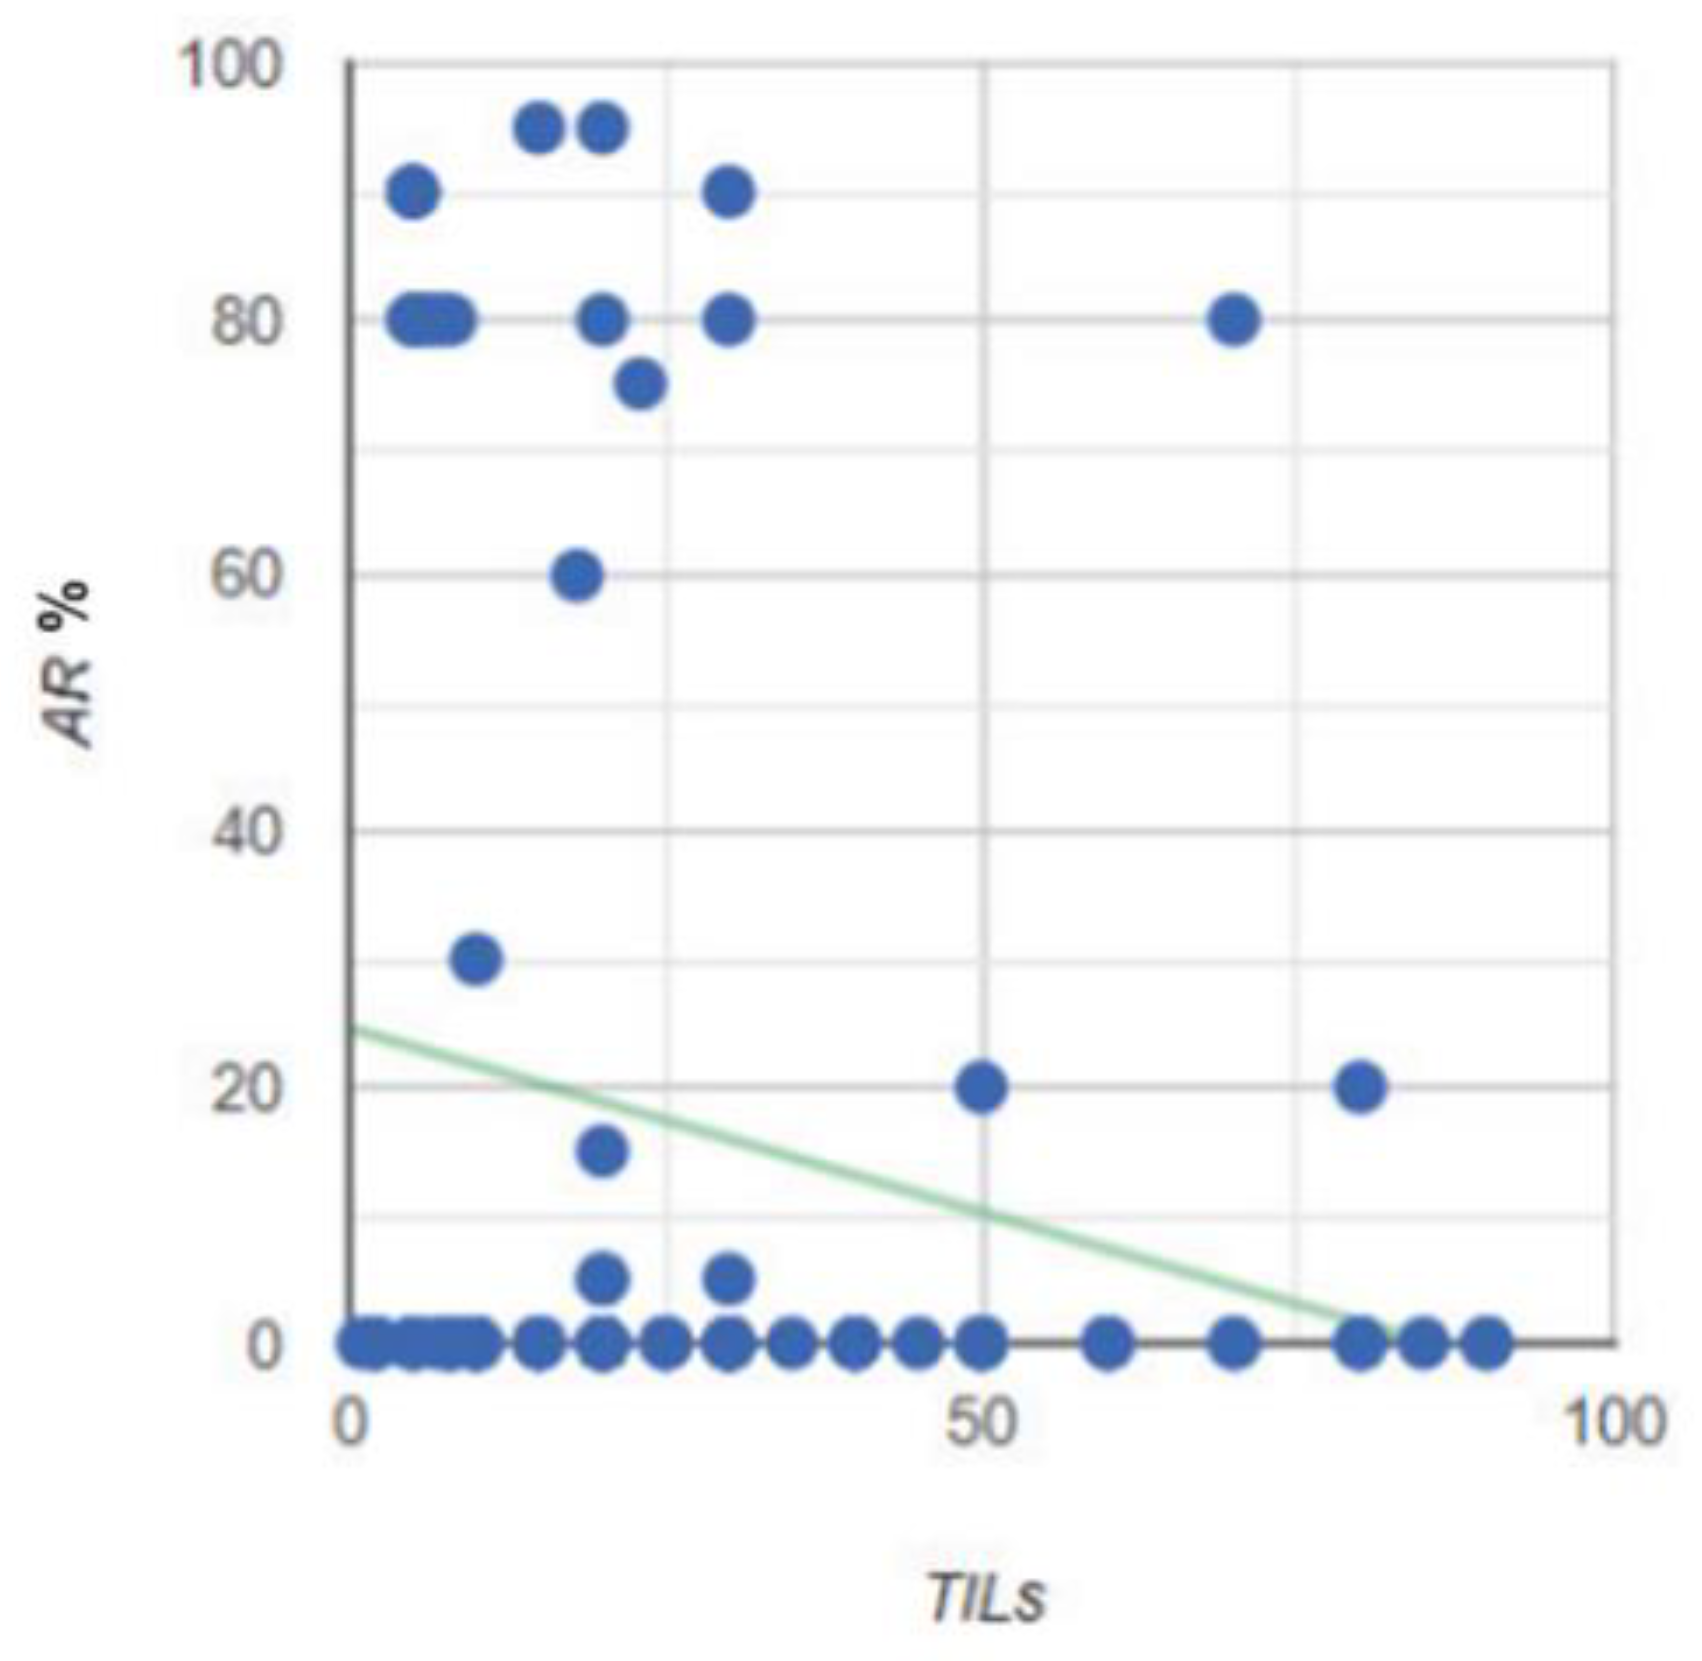
Figure 20.
Comparison of high (≥80%) and low (<80%) AR expression groups by TILs.
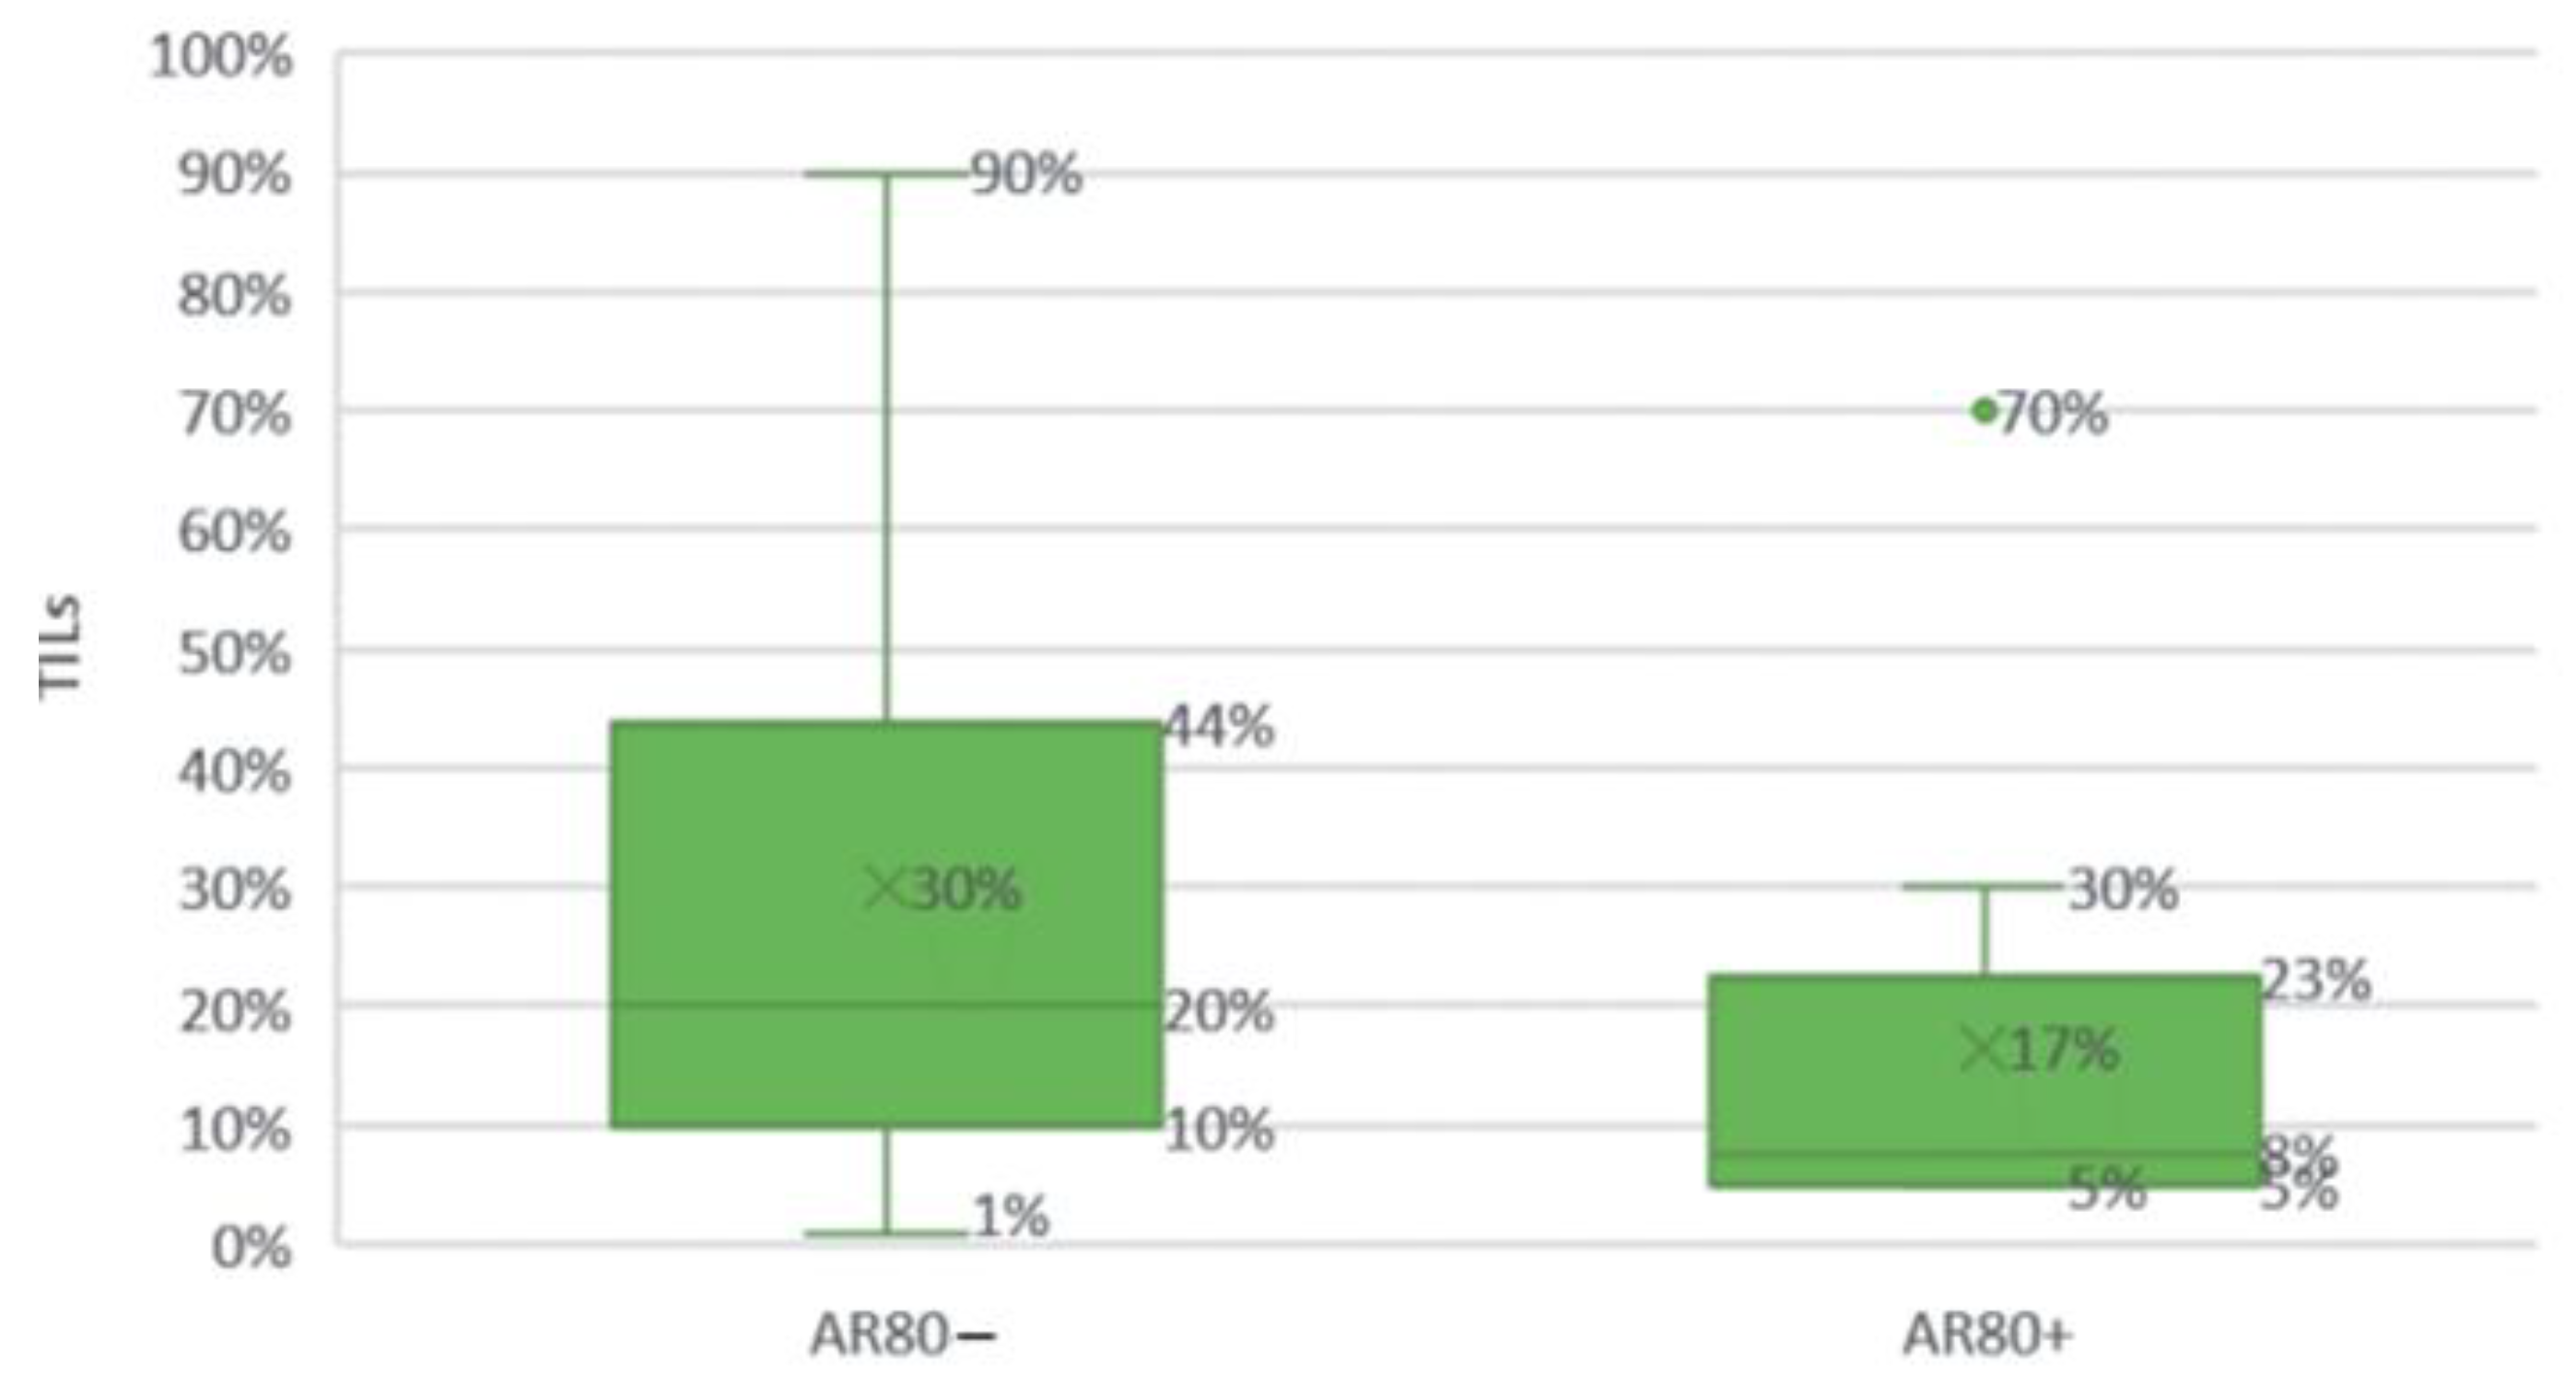
Figure 21.
Comparison of the groups with high (≥80%) and low (<80%) androgen receptor expression levels according to the CD4 T cell infiltration in the tumor stroma.
Figure 21.
Comparison of the groups with high (≥80%) and low (<80%) androgen receptor expression levels according to the CD4 T cell infiltration in the tumor stroma.
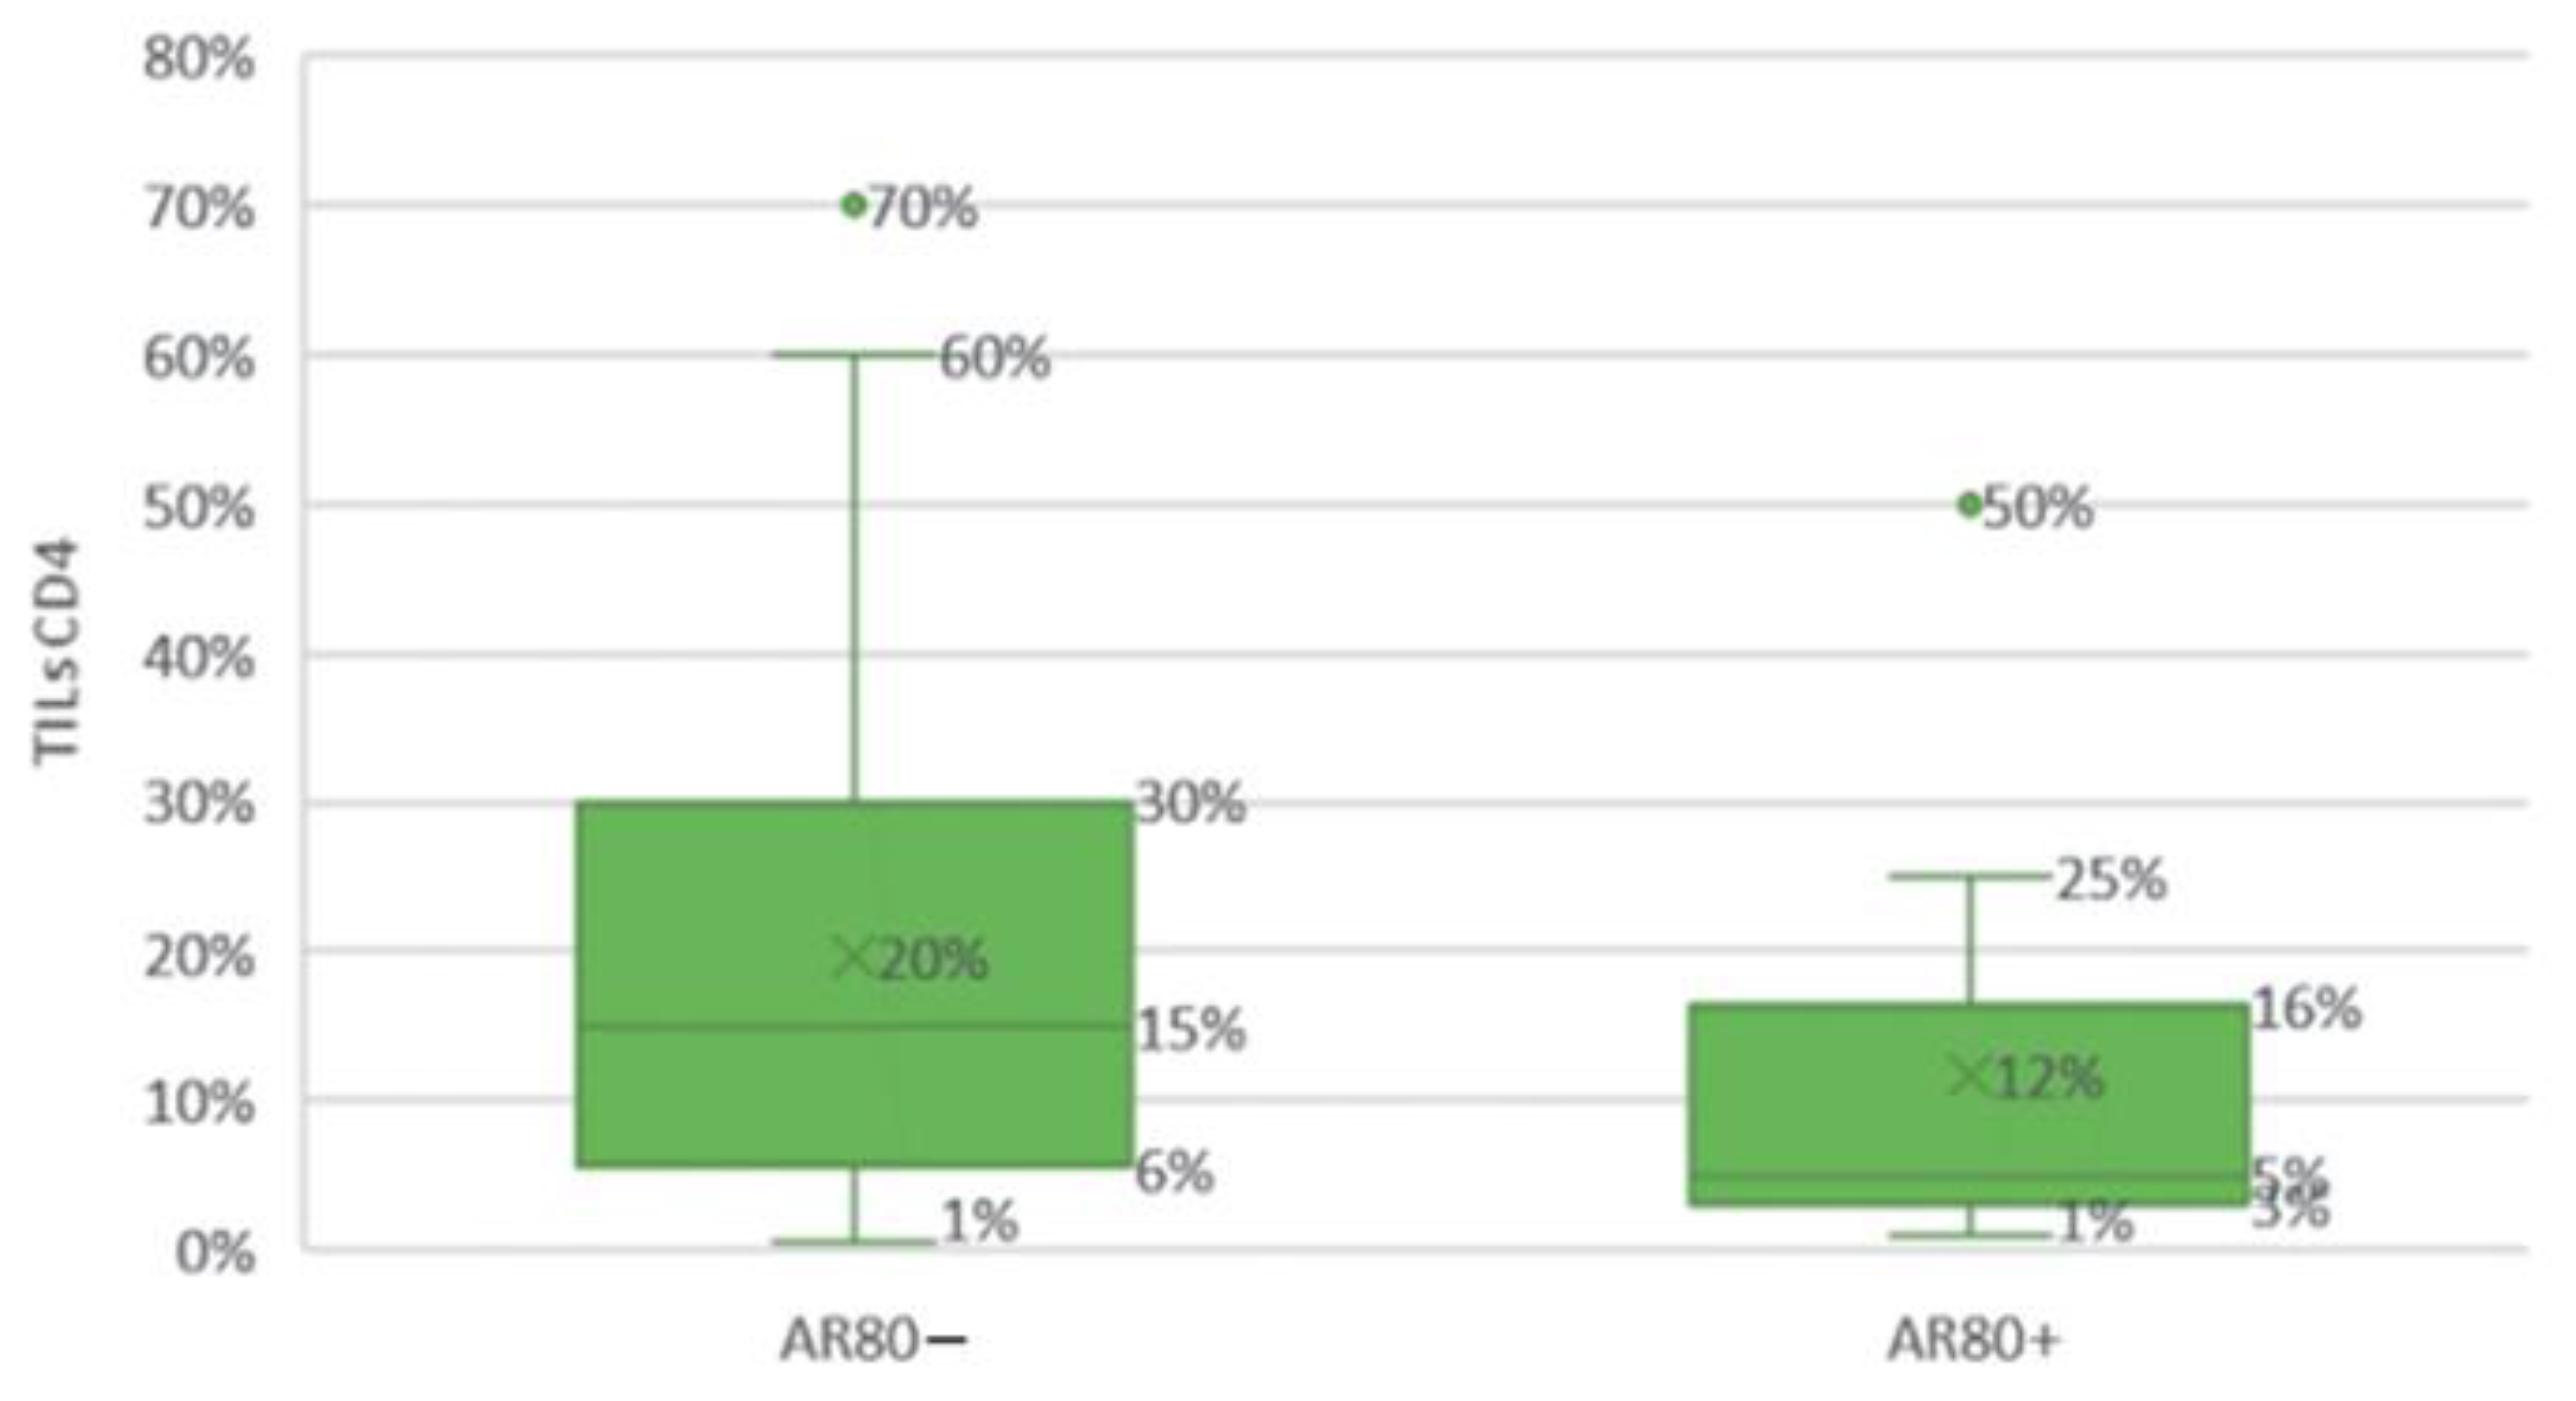
Figure 22.
Correlation between the expression level of the AR and the CD8 TILs cells in the stroma of the tumor.
Figure 22.
Correlation between the expression level of the AR and the CD8 TILs cells in the stroma of the tumor.
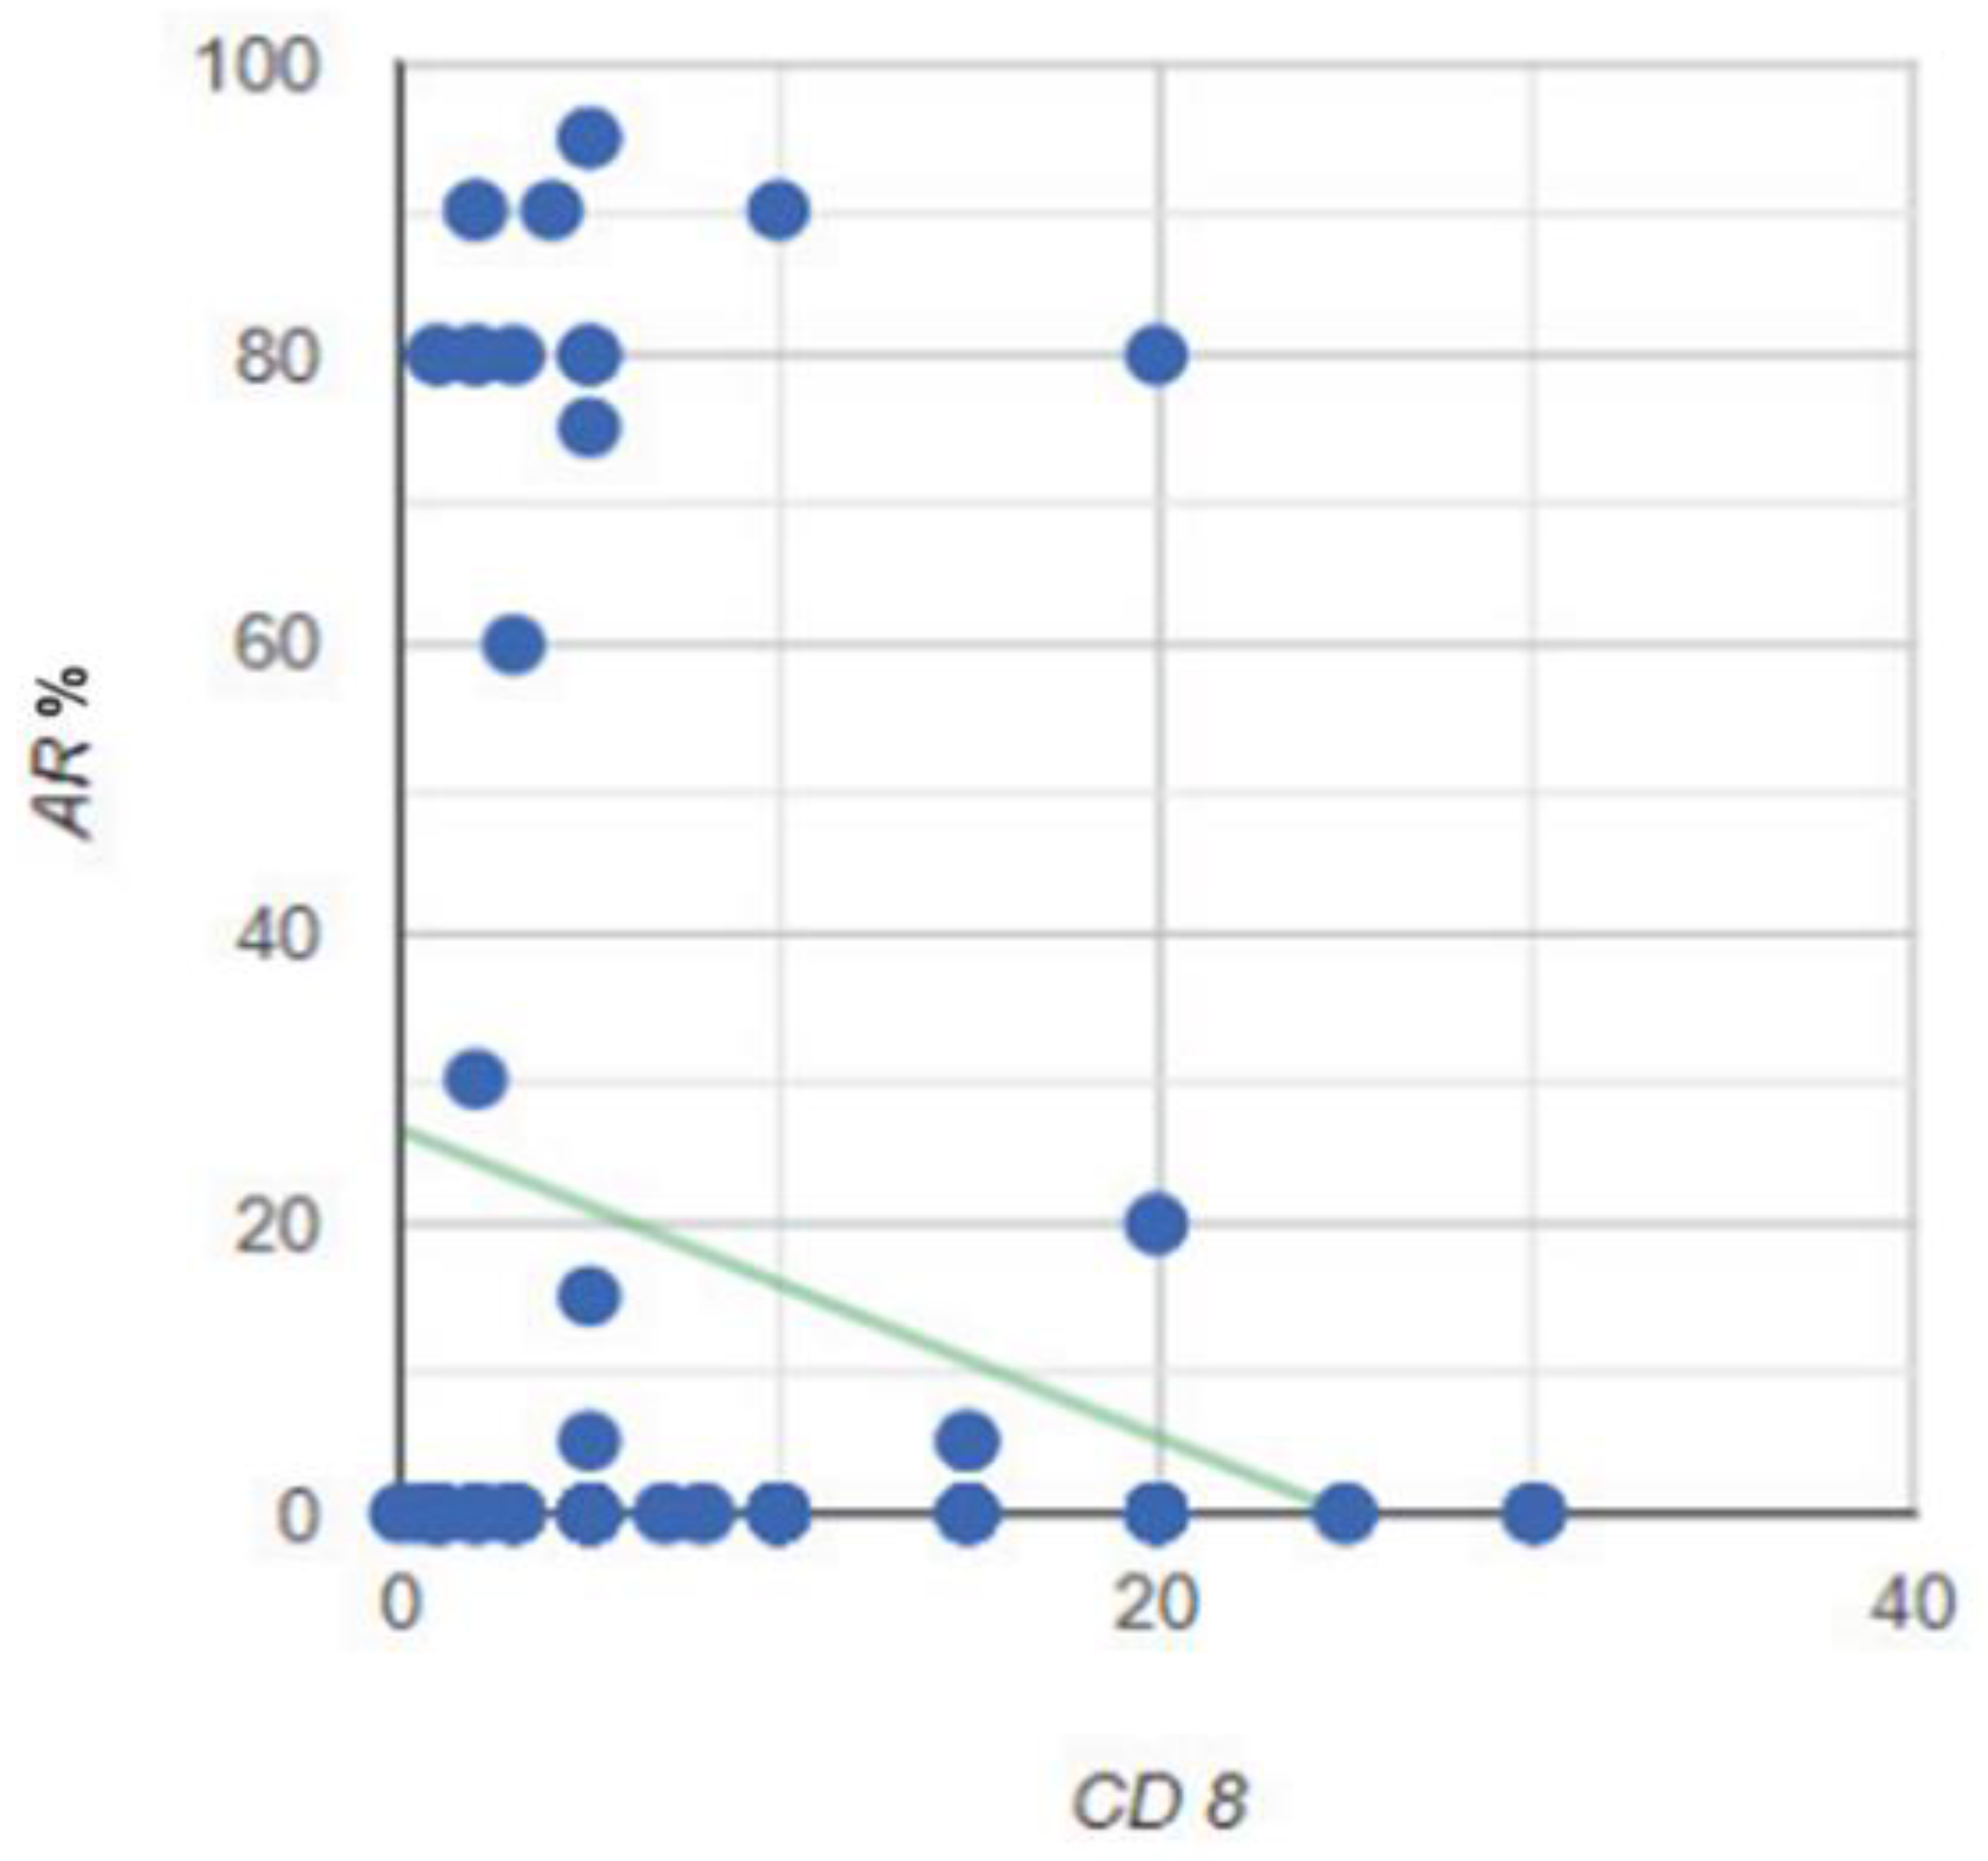
Figure 23.
Comparison of groups with high (≥80%) and low (<80%) AR expression levels depending on CD8 TILs.
Figure 23.
Comparison of groups with high (≥80%) and low (<80%) AR expression levels depending on CD8 TILs.
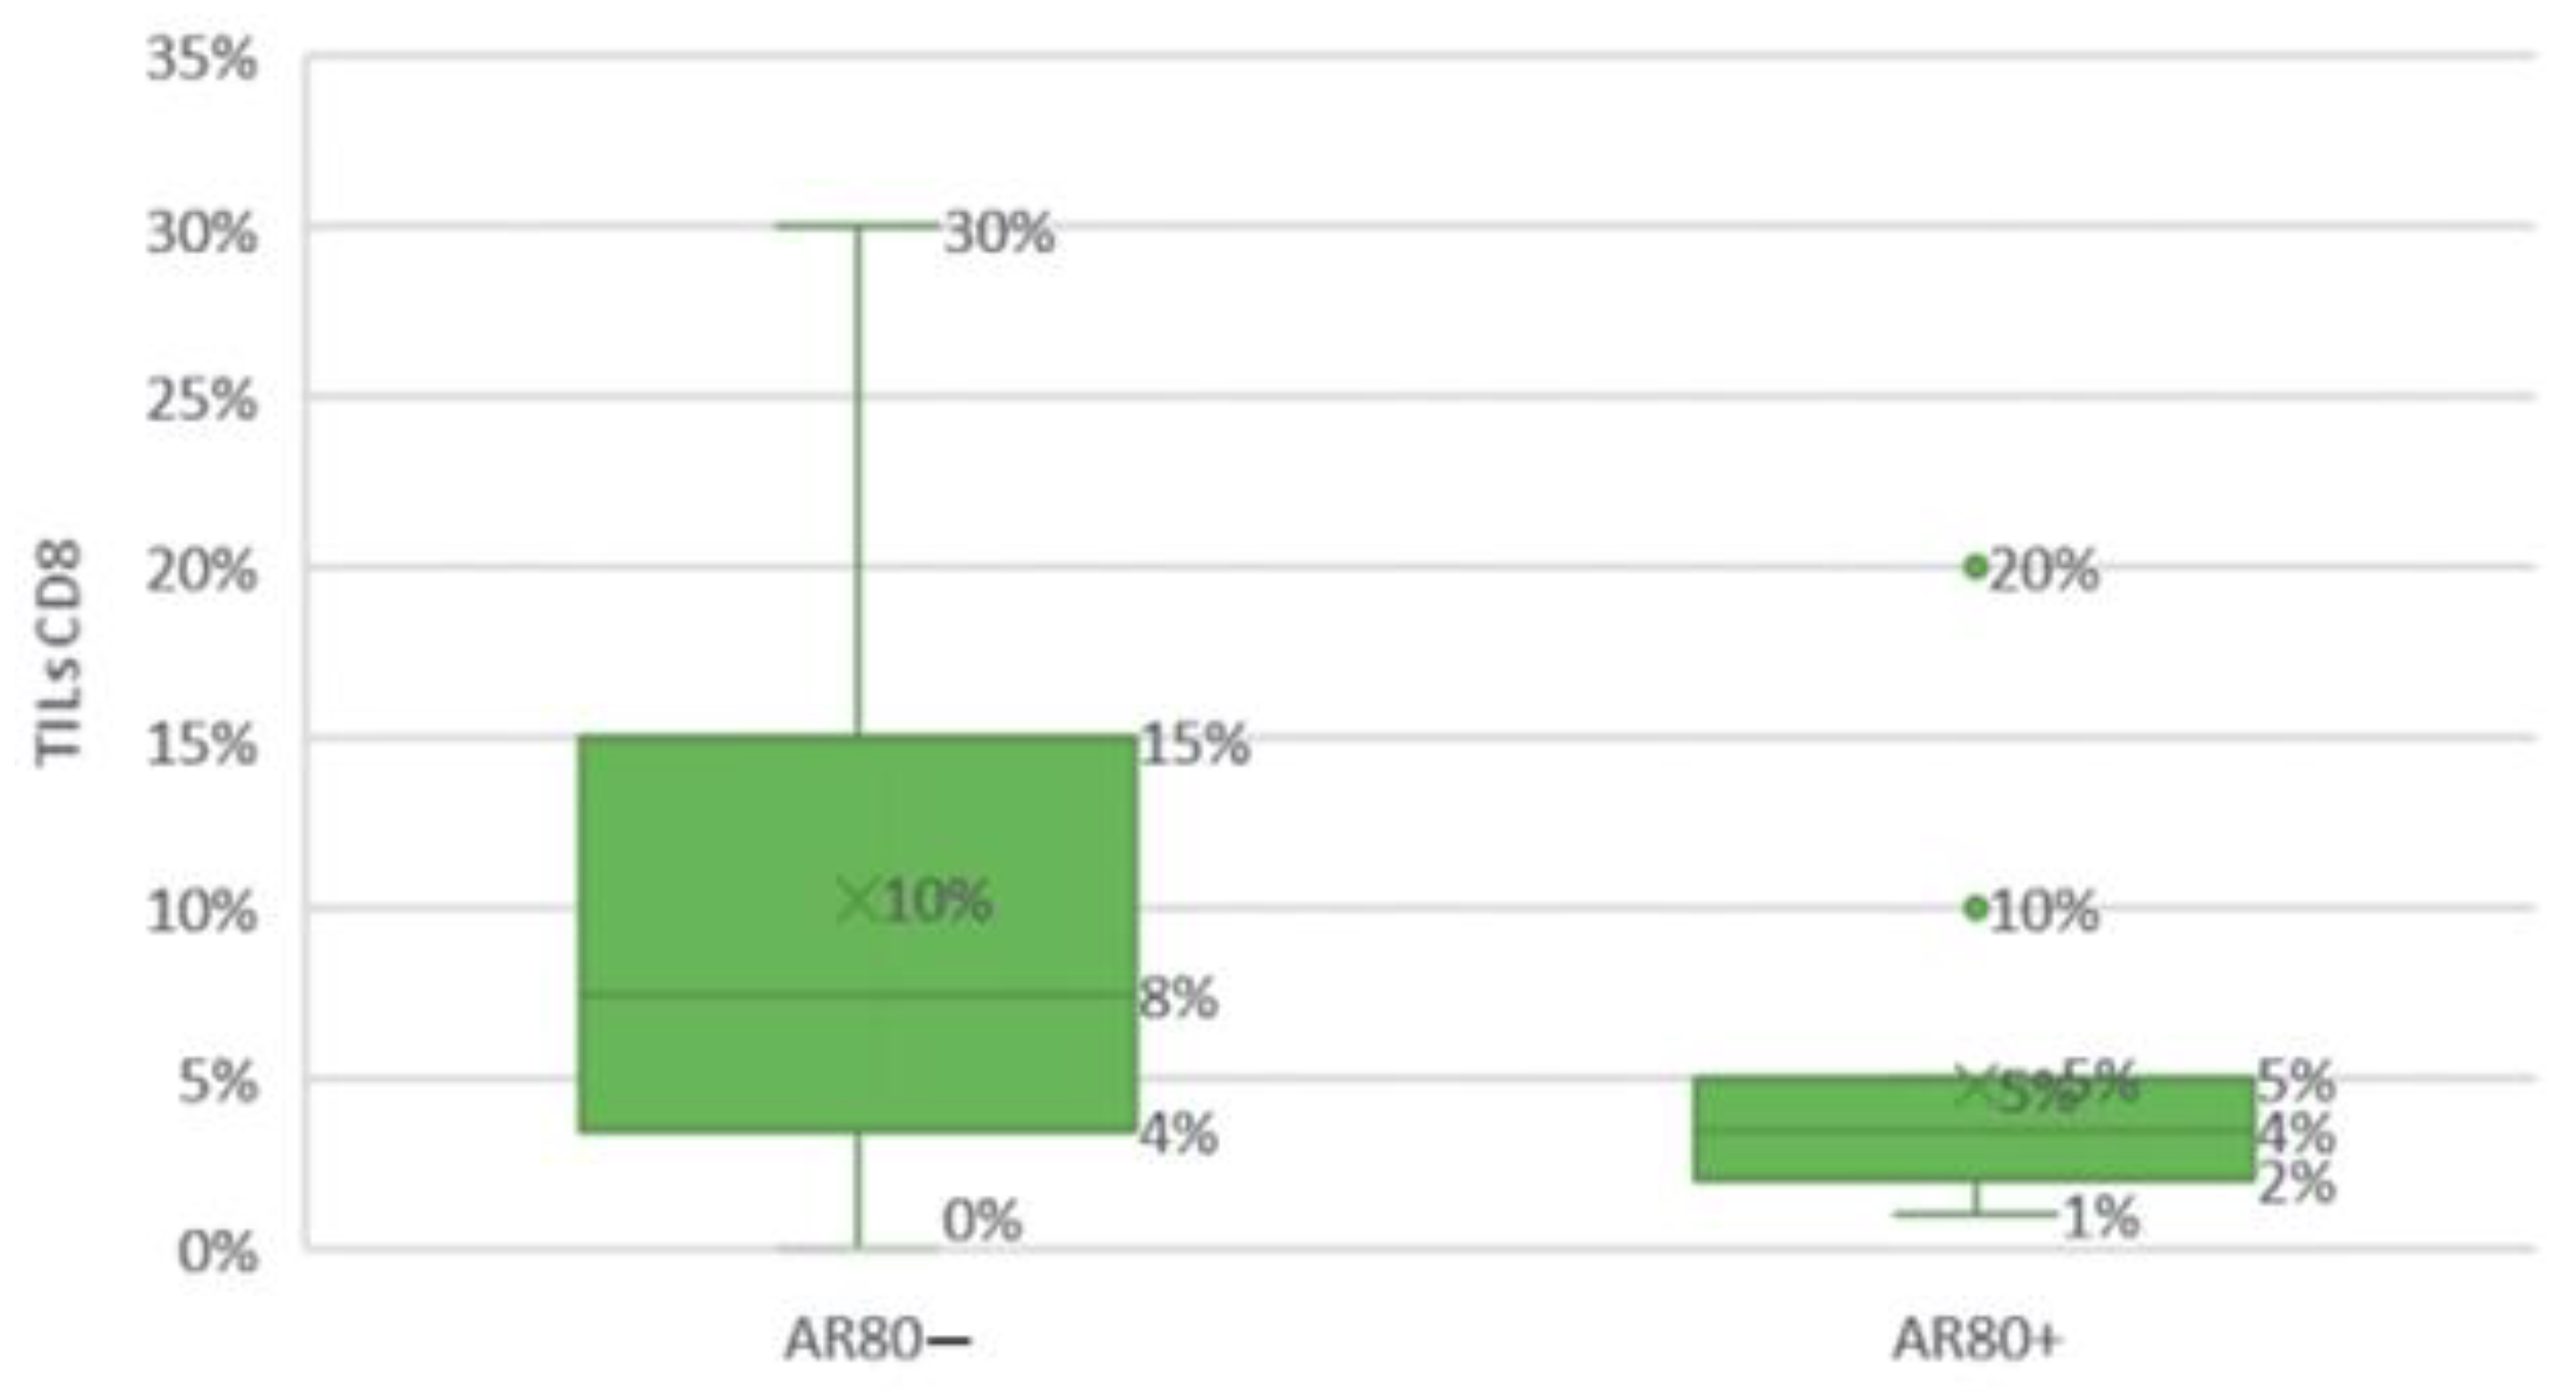
Figure 24.
Overall survival time of 3 years for the entire study group of patients with TNBC (Kaplan–Meier survival function).
Figure 24.
Overall survival time of 3 years for the entire study group of patients with TNBC (Kaplan–Meier survival function).
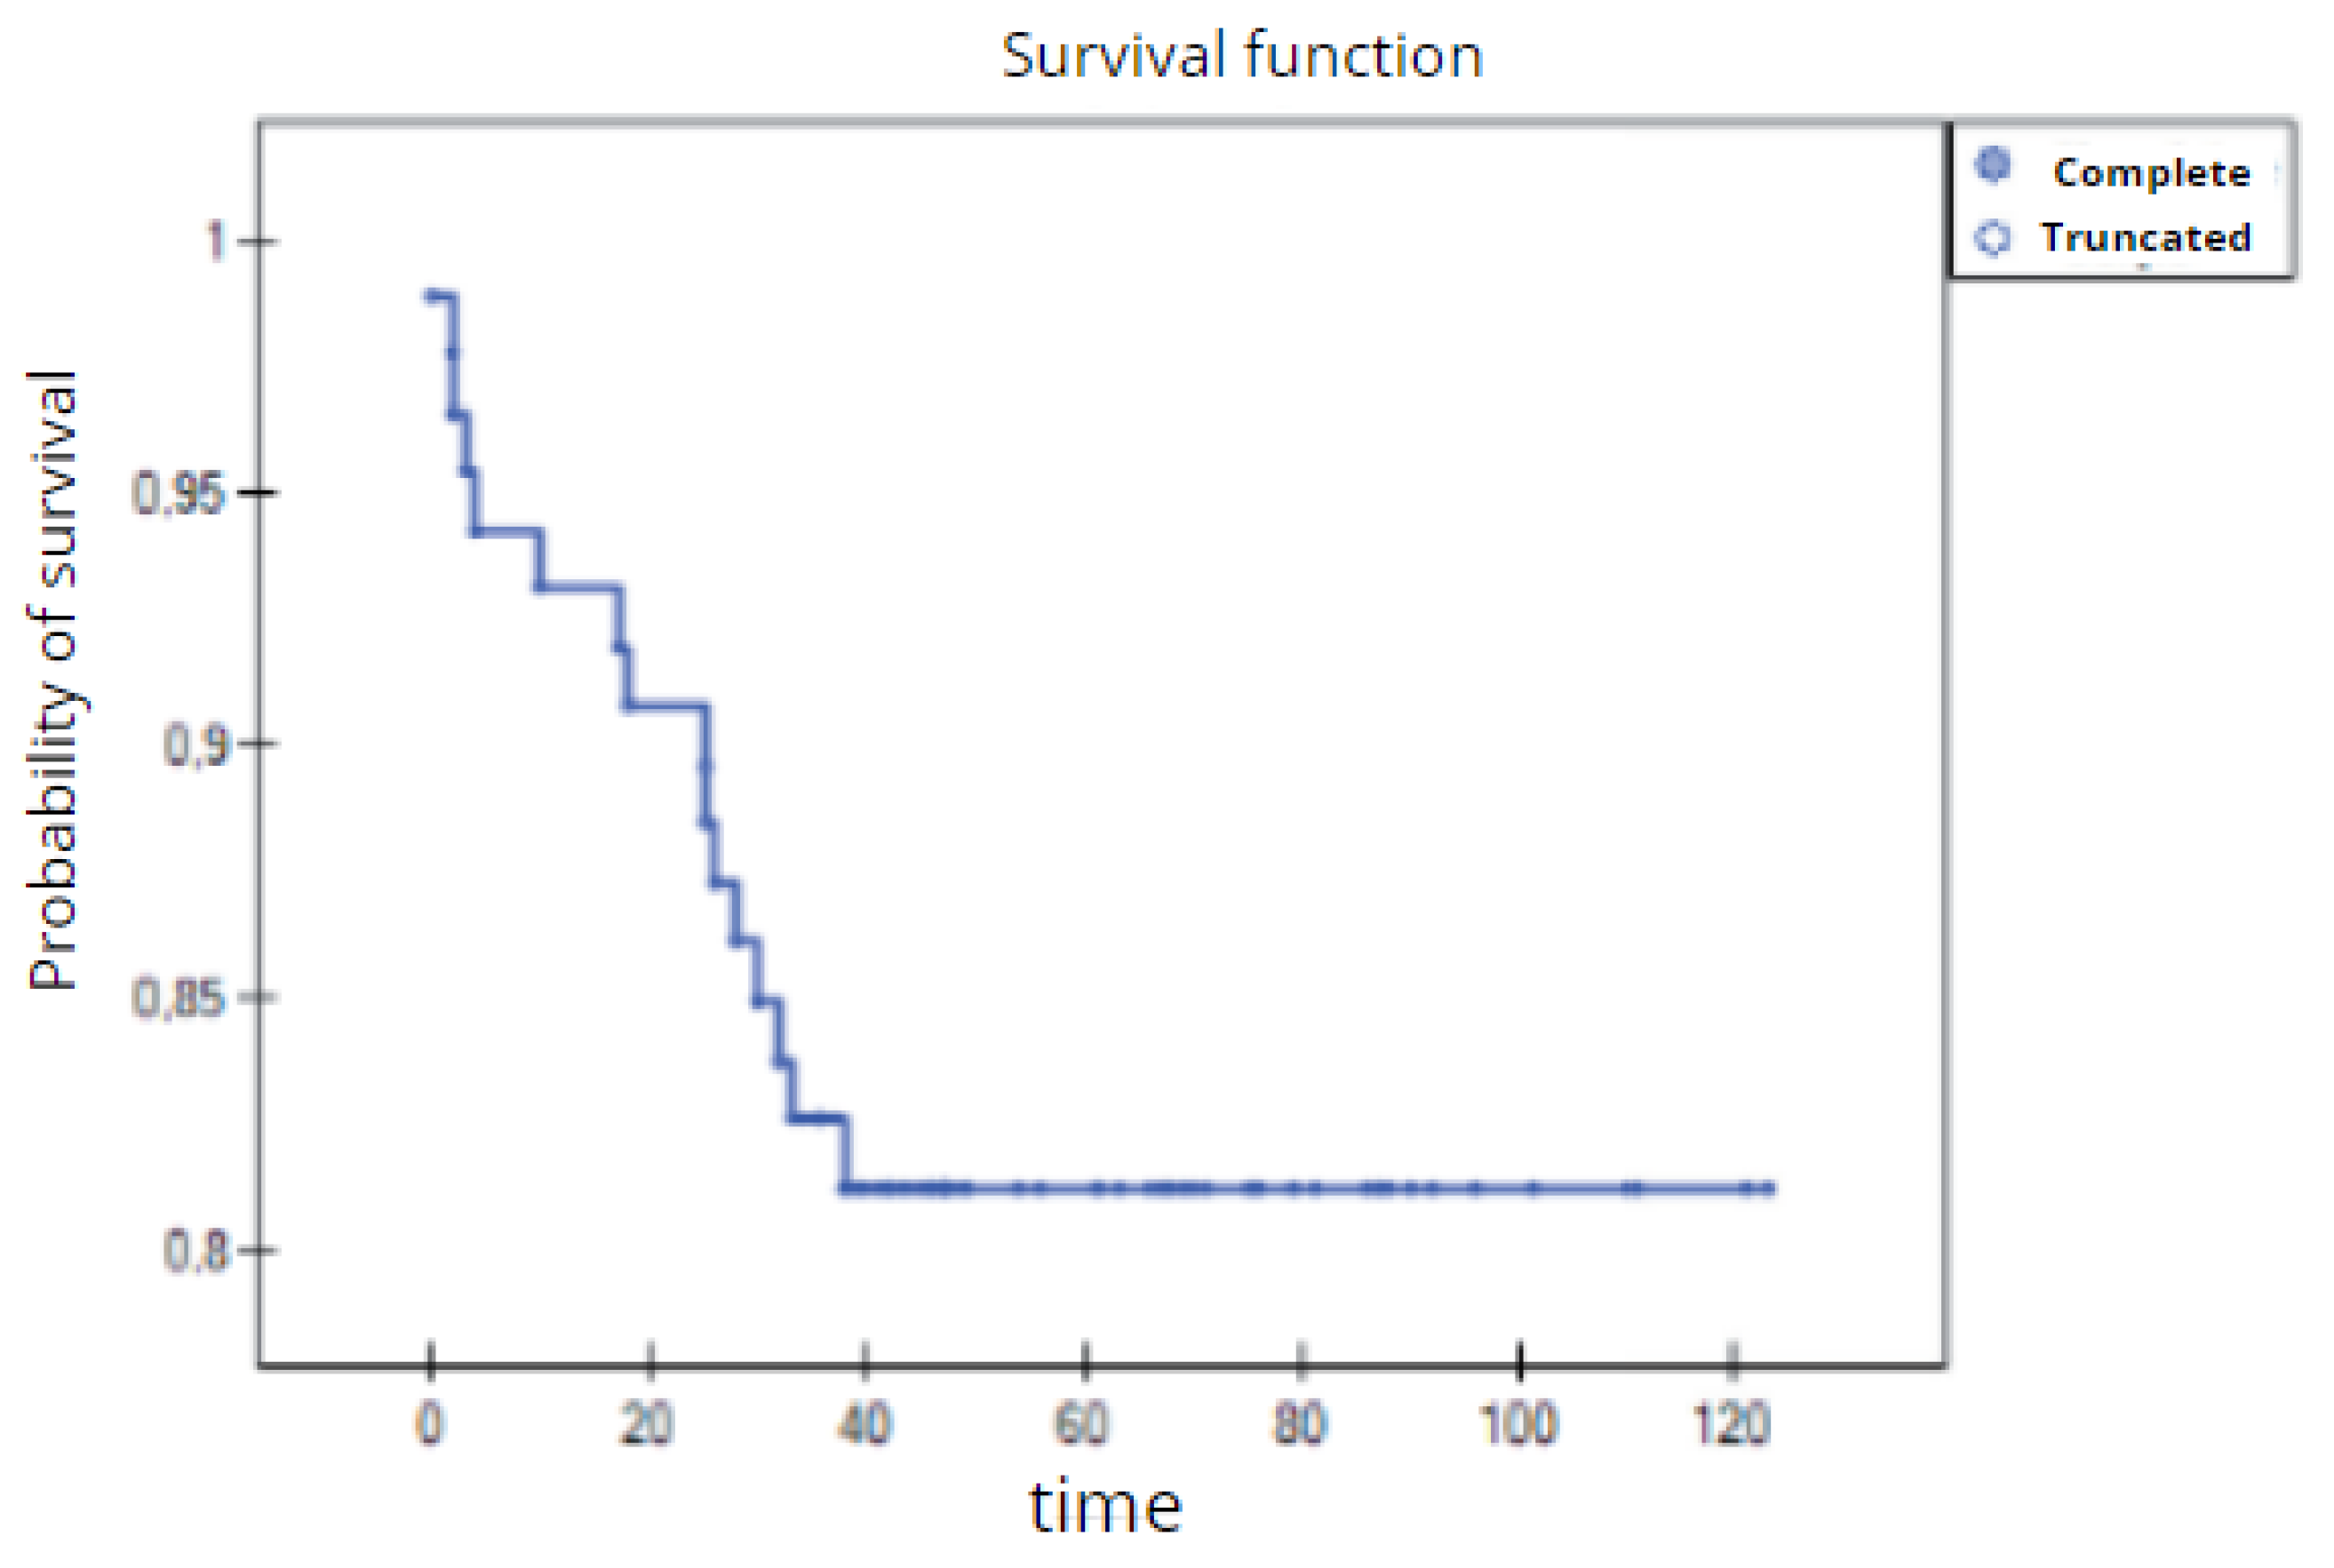
Figure 25.
Comparison of the OS < 36 and OS ≥ 36 groups by T grade.
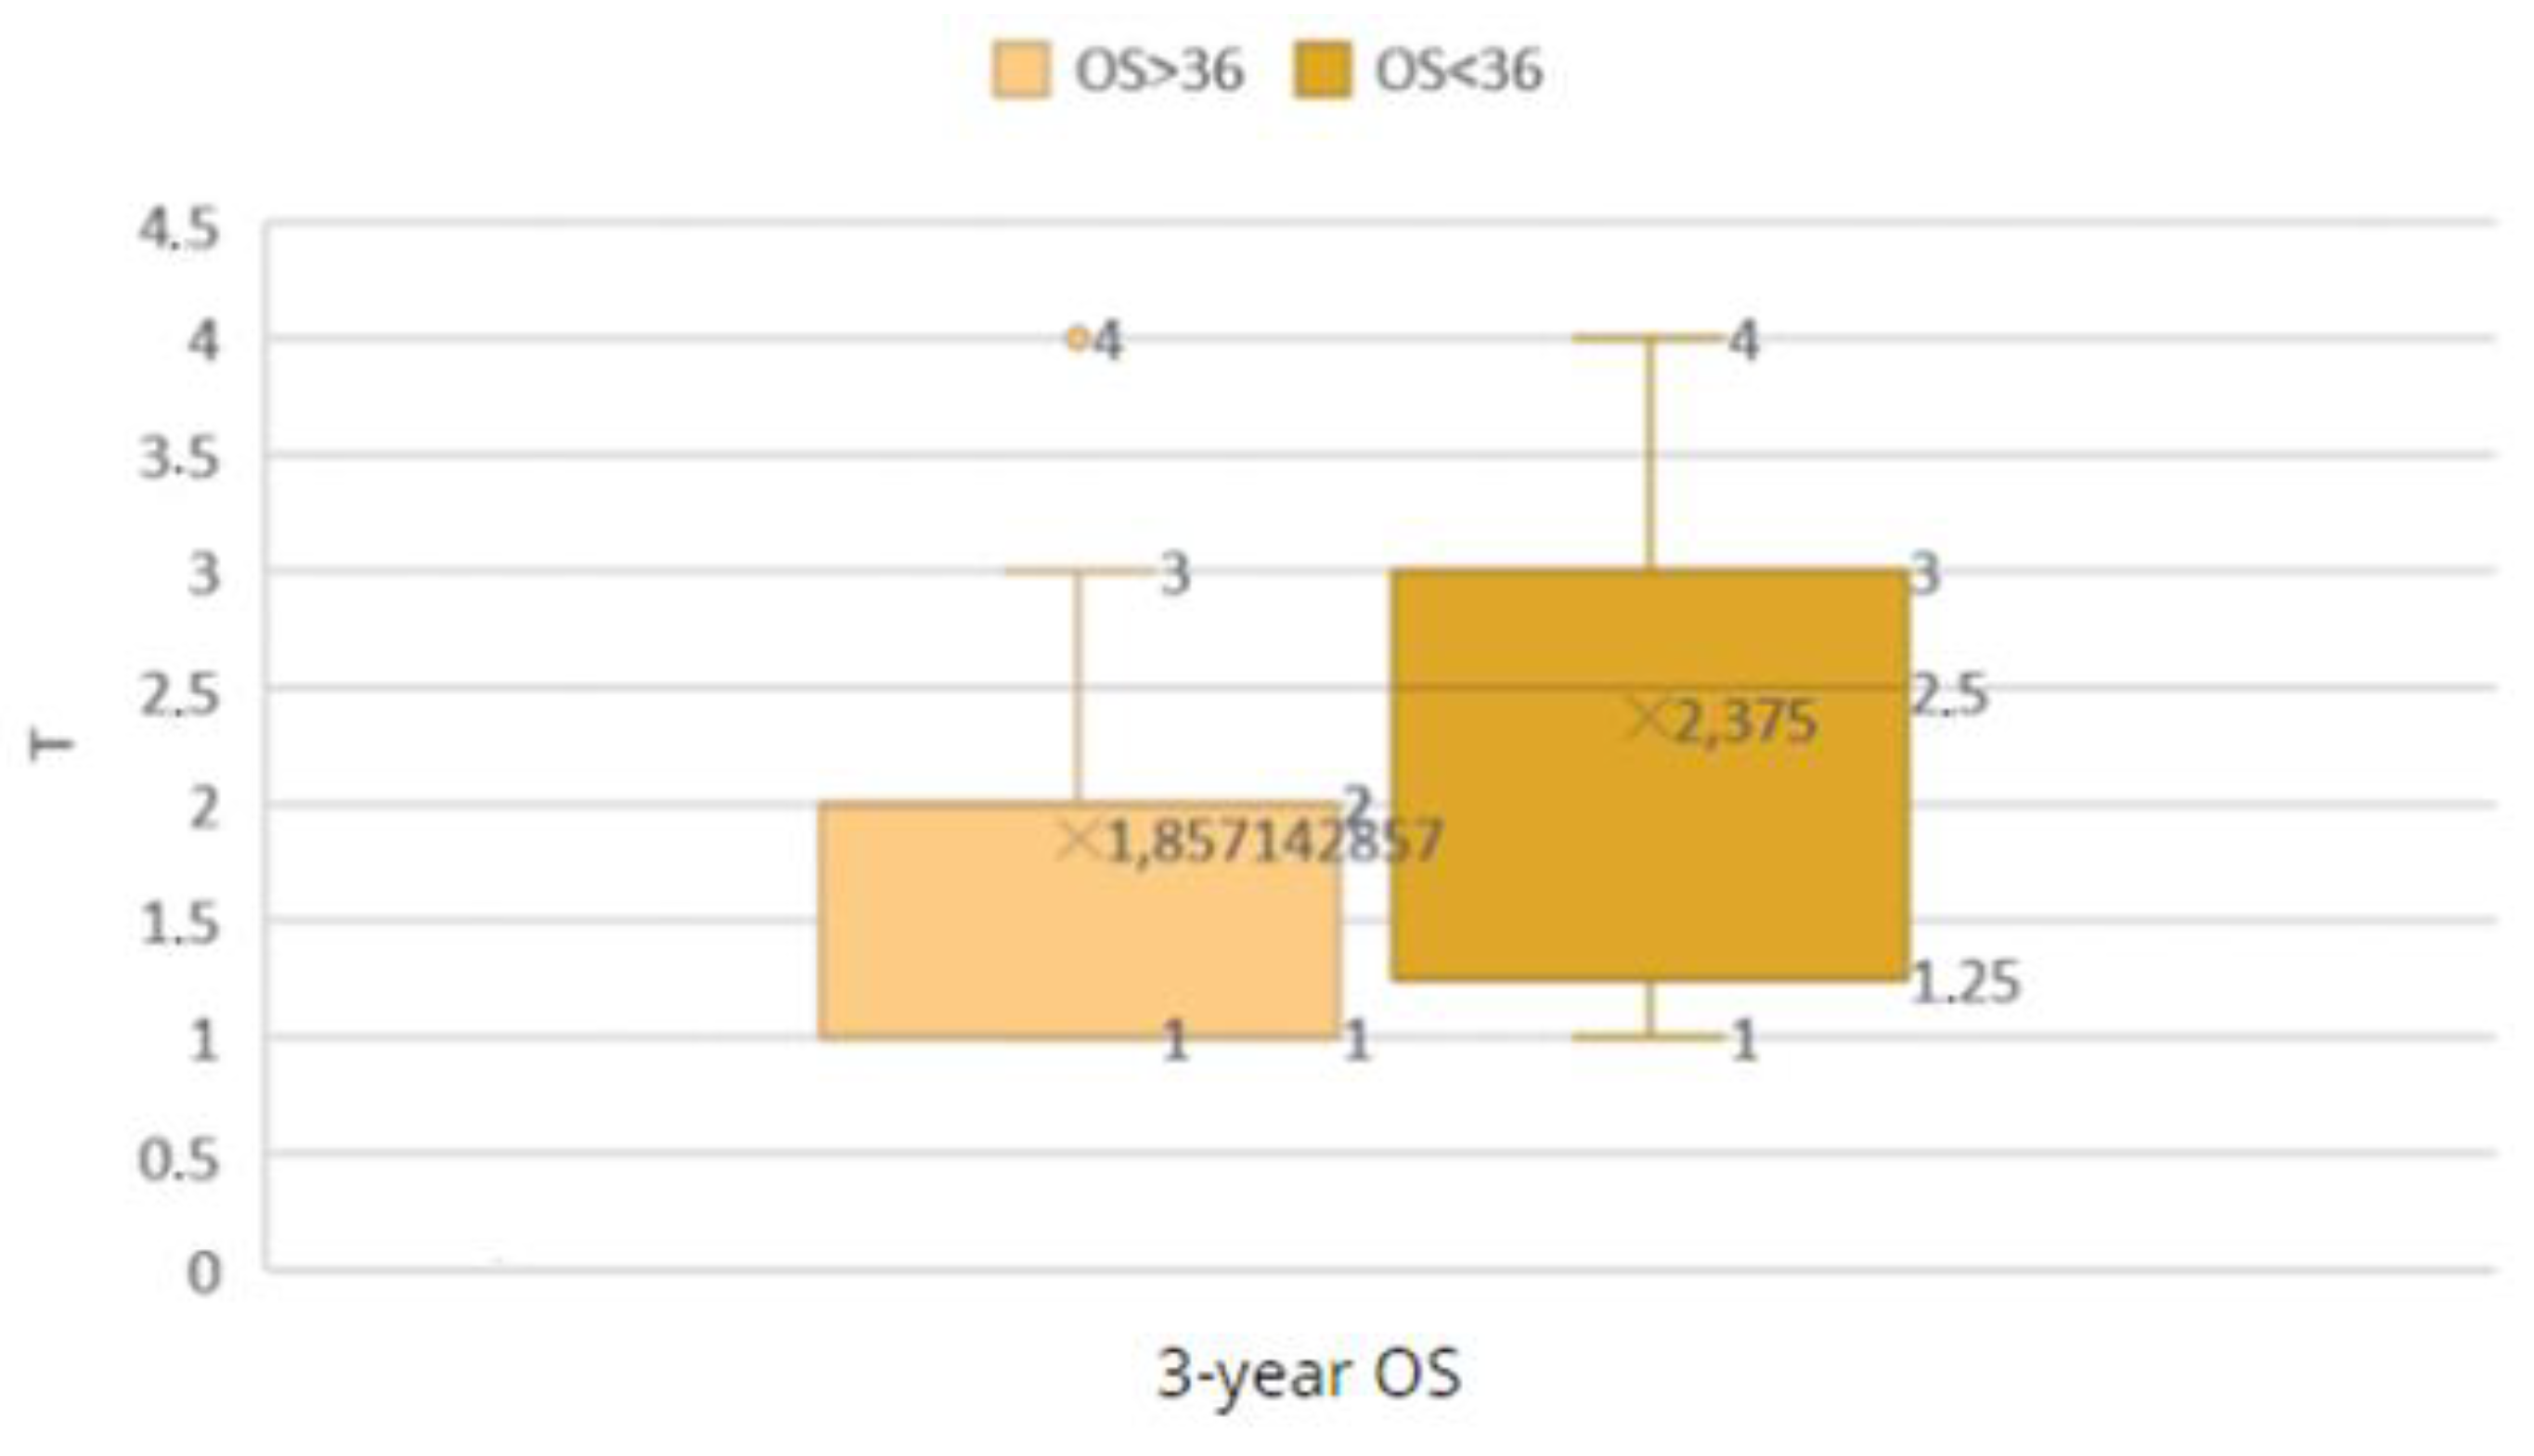
Figure 26.
Comparison of the OS < 36 and OS ≥ 36 groups by N grade.
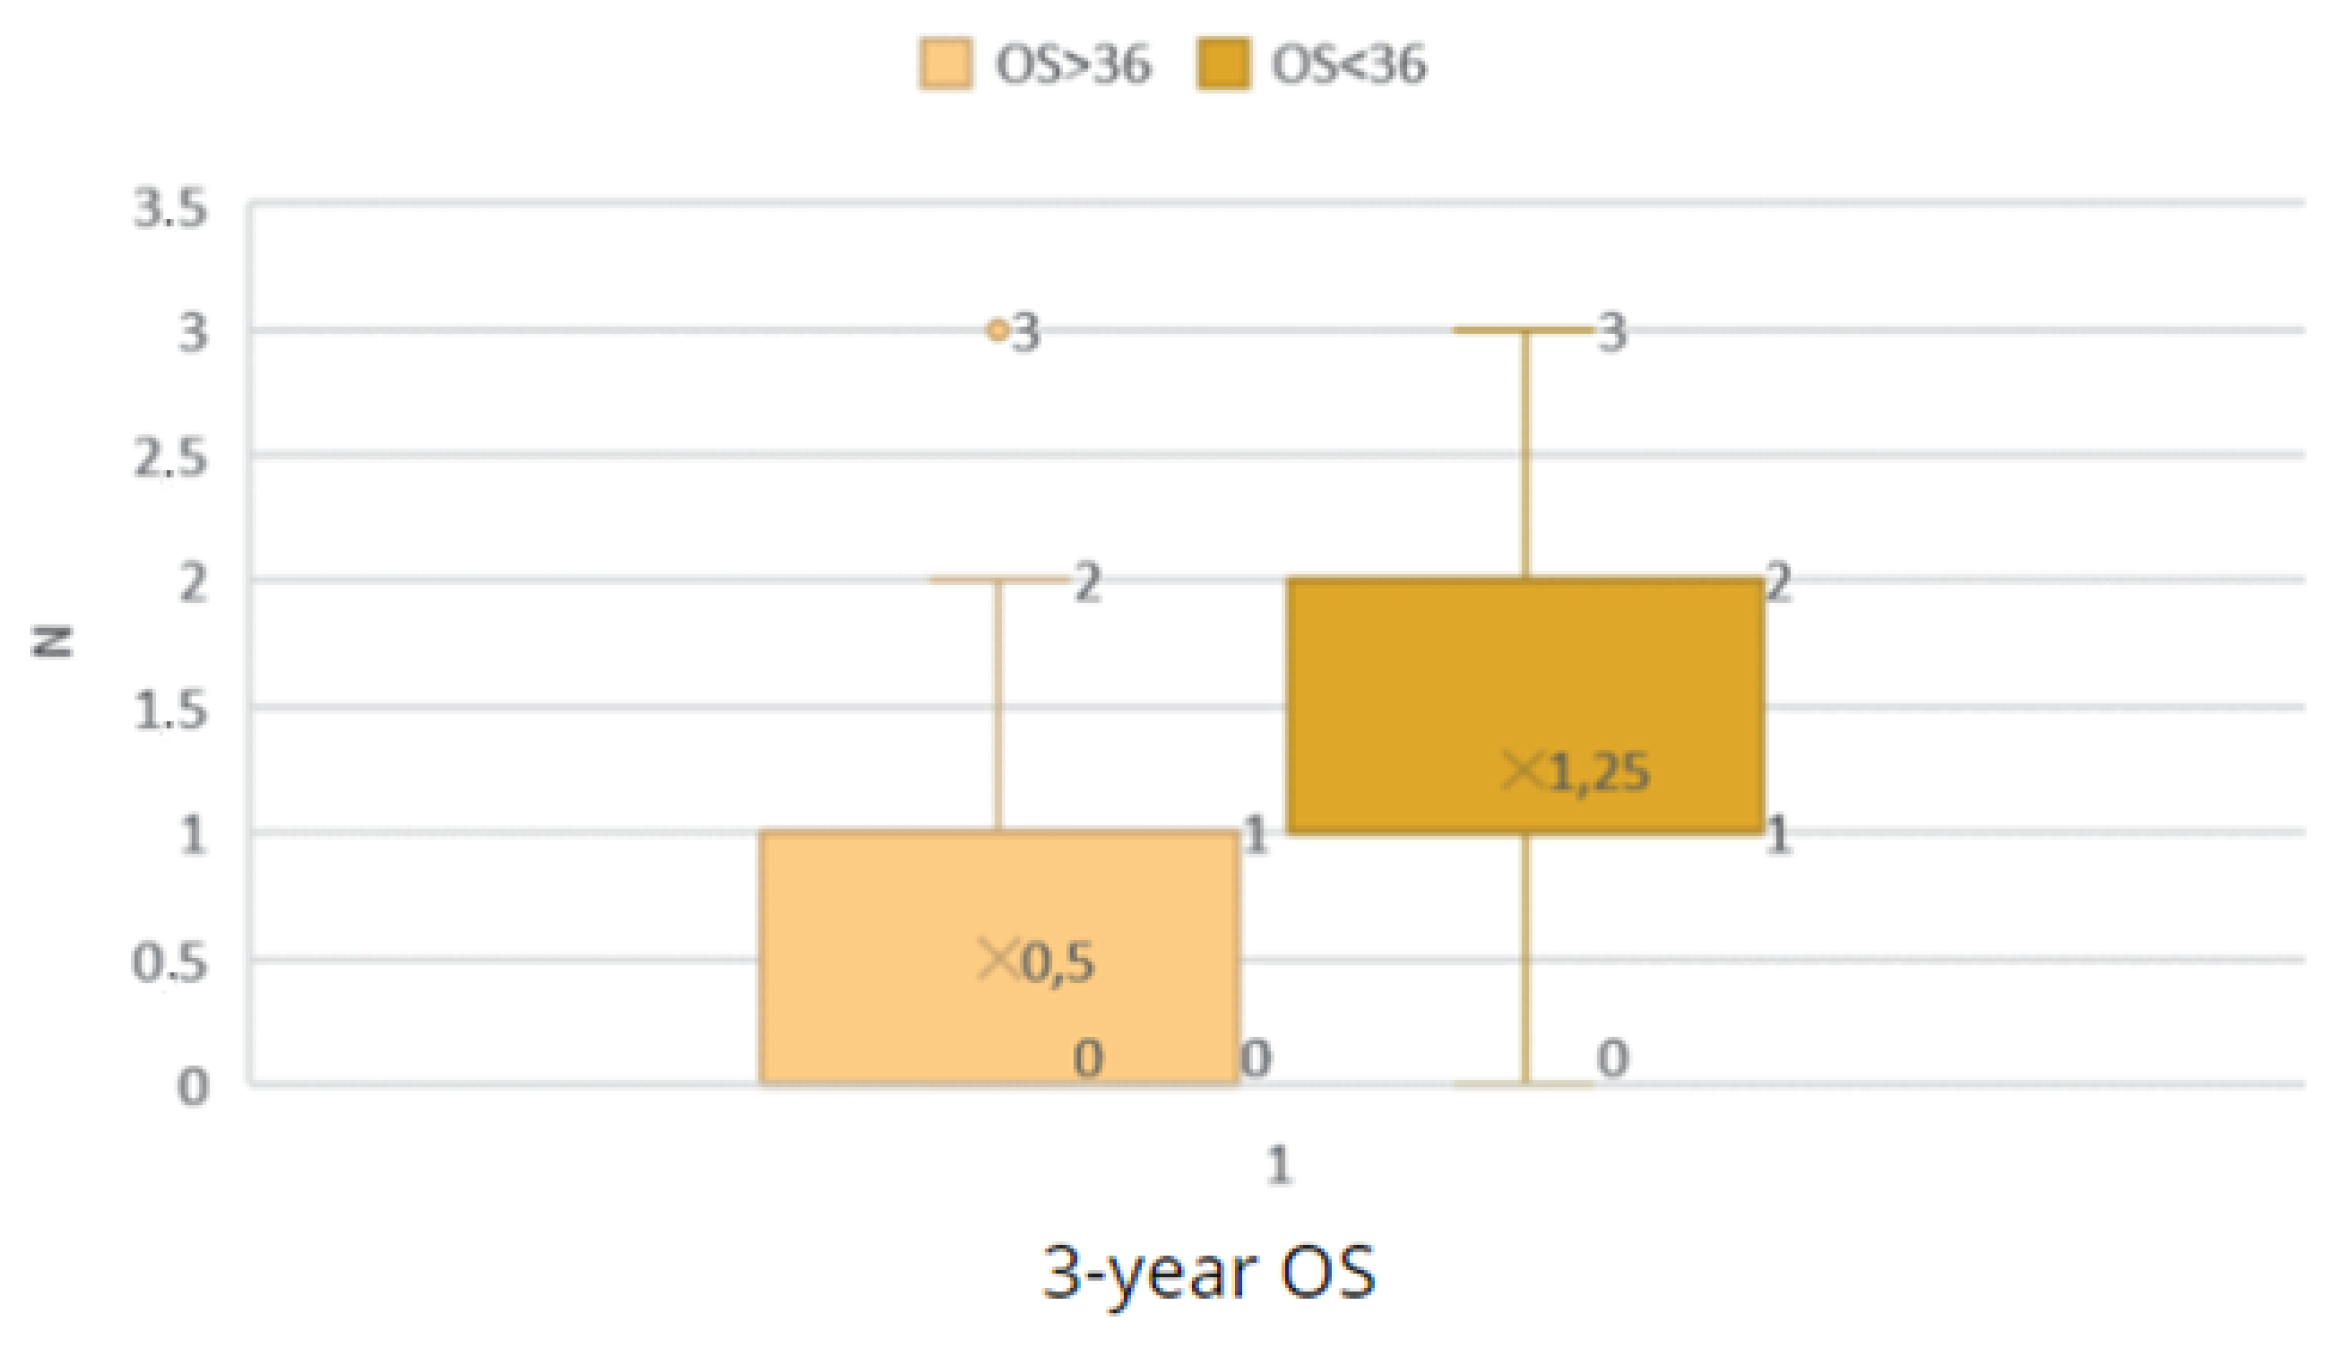
Figure 27.
Comparison of the OS < 36 and OS ≥ 36 groups by M grade.
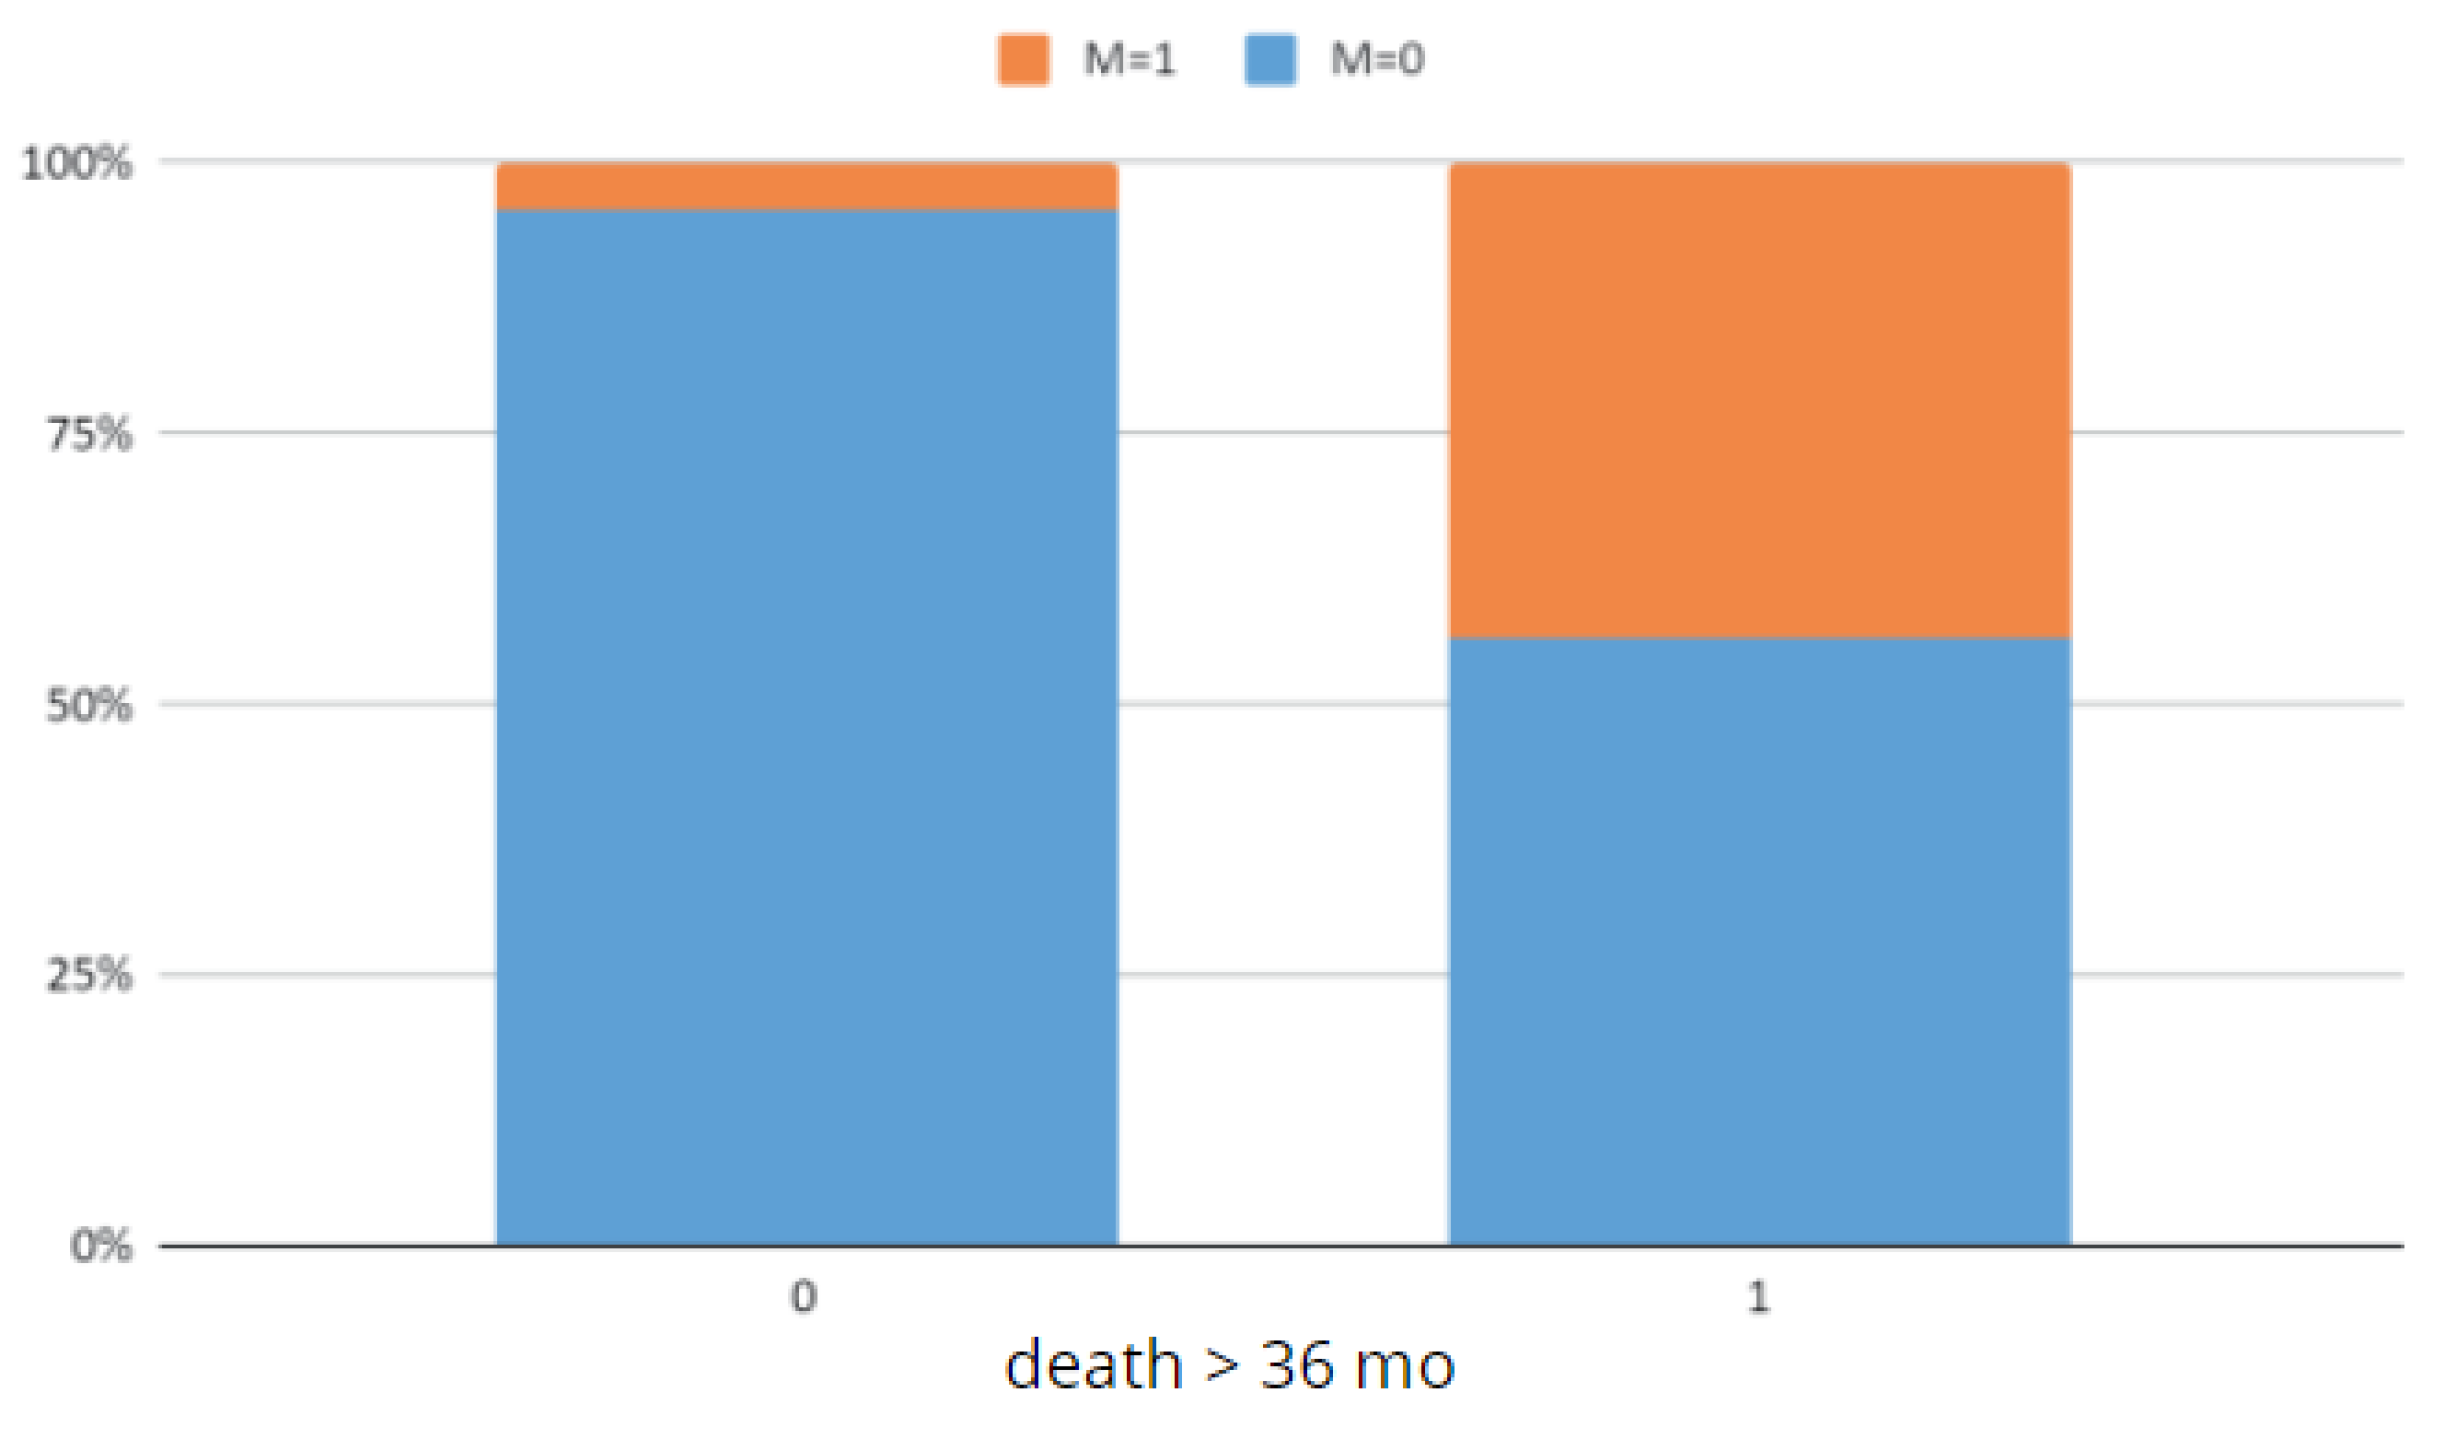
Figure 28.
Comparison of the groups with an OS < 36 and OS ≥ 36 according to TILs.
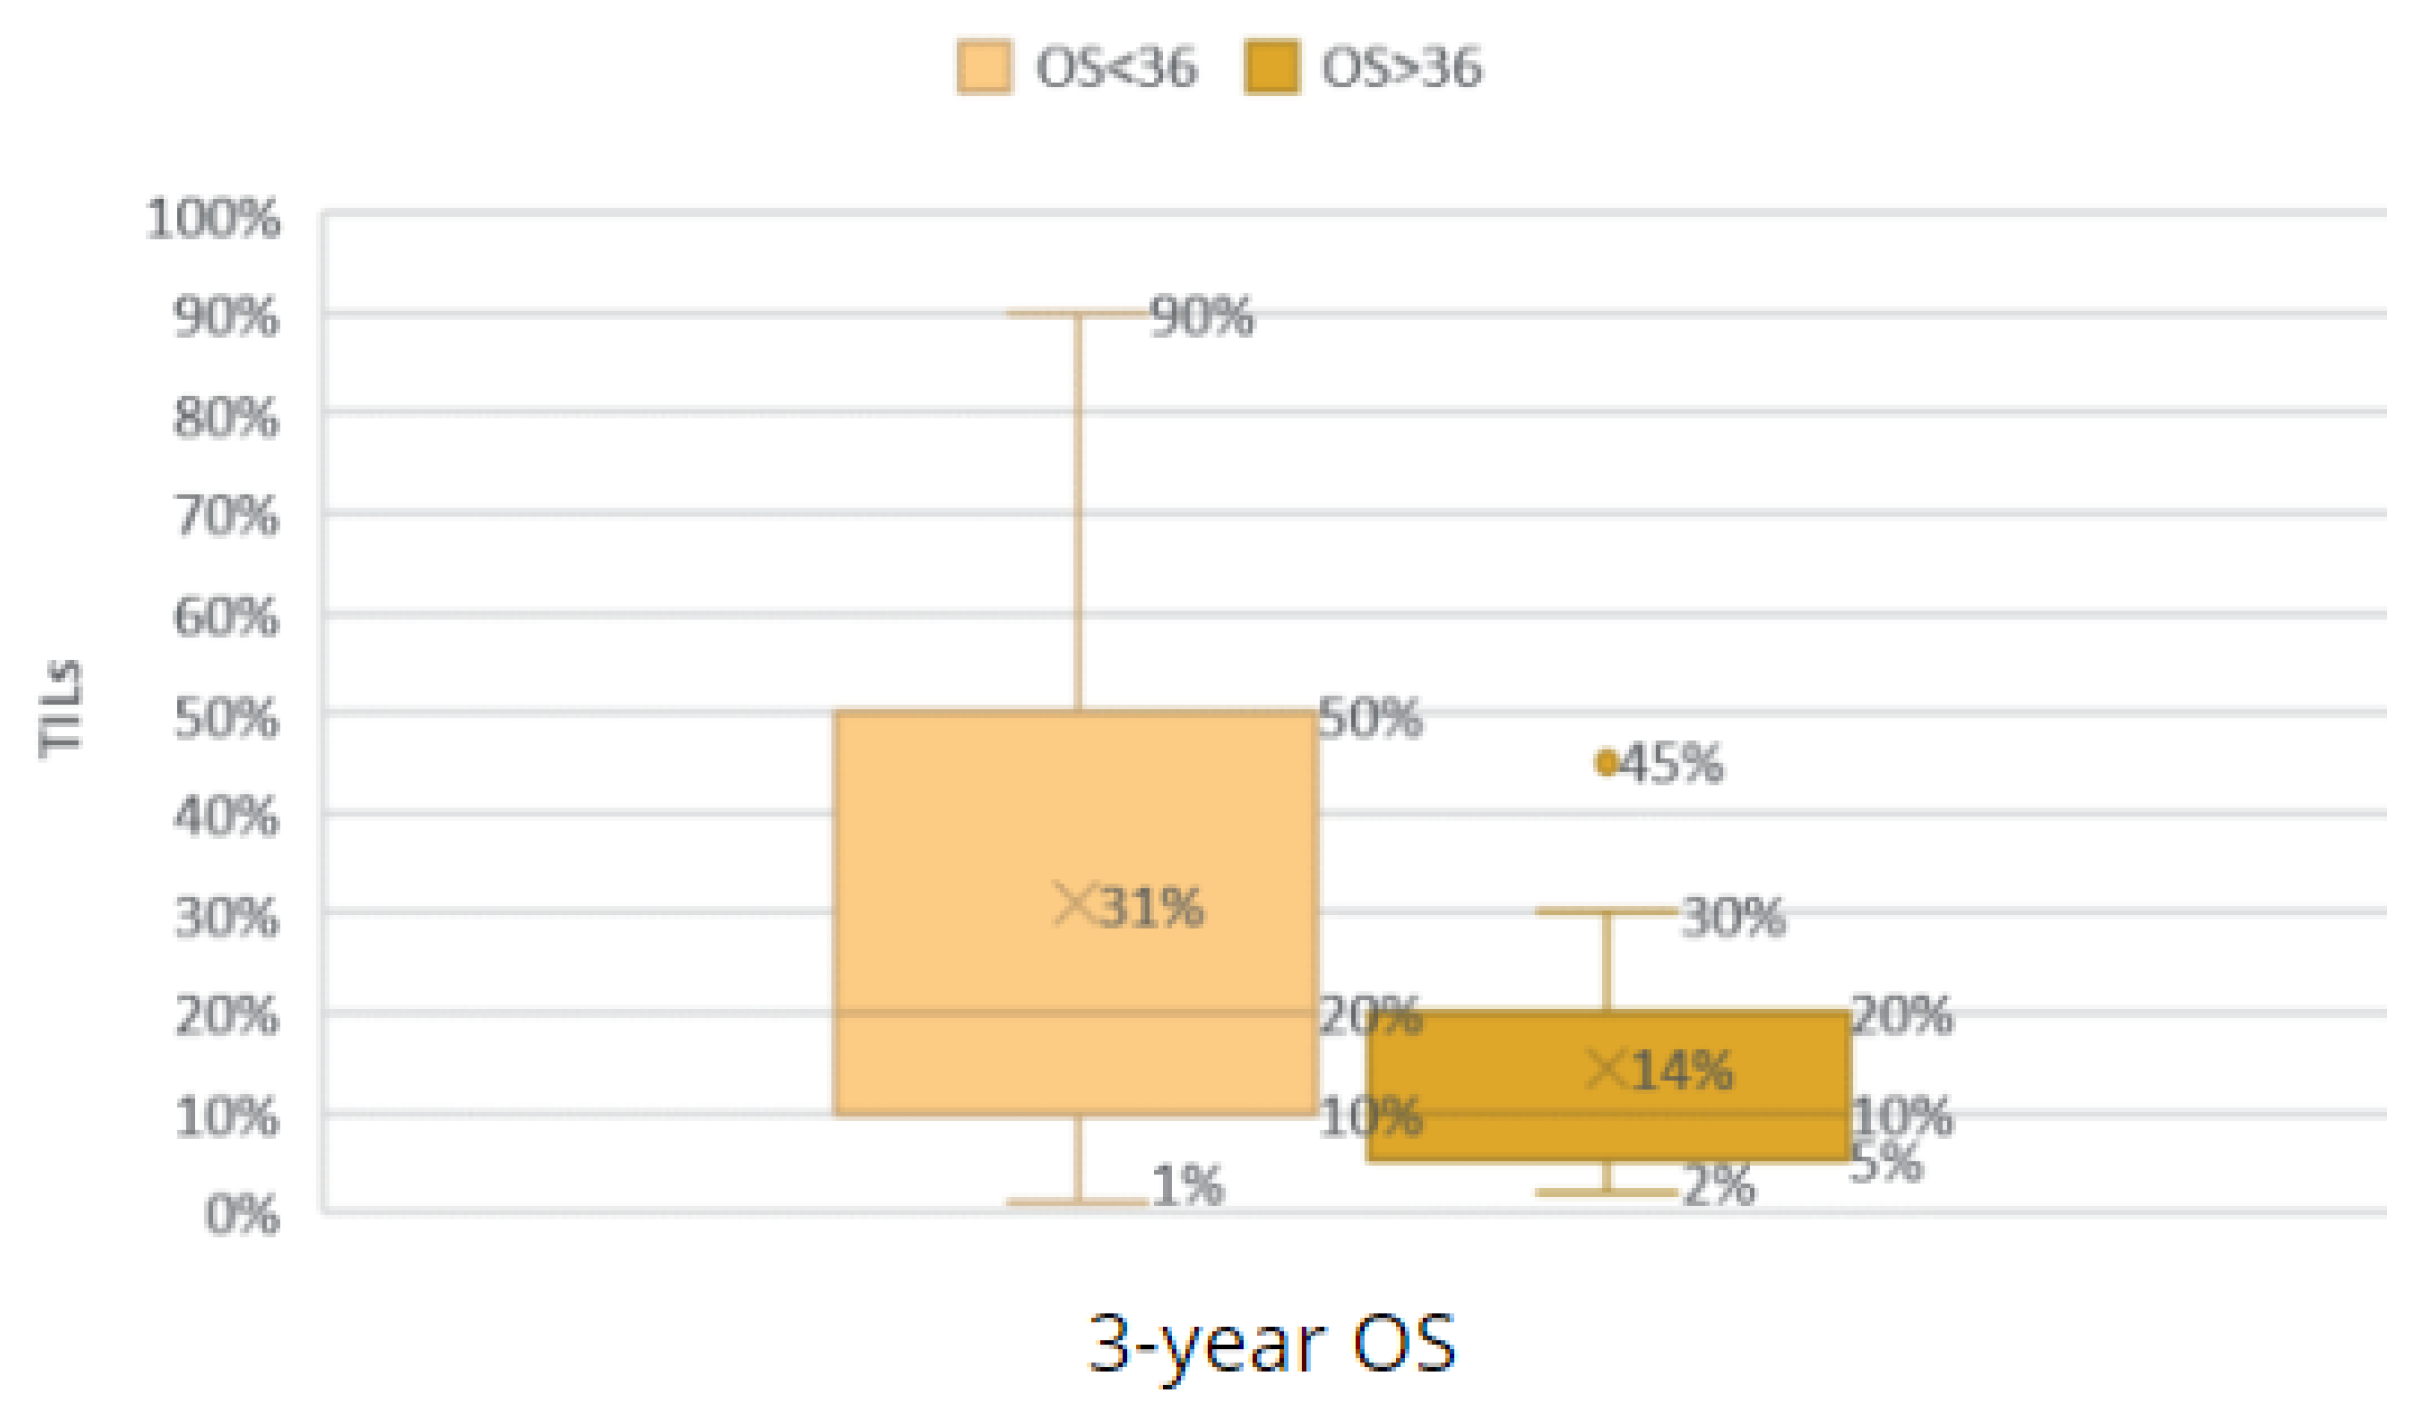
Figure 29.
Comparison of the groups with an OS < 36 and OS ≥ 36 according to CD4 TILs.
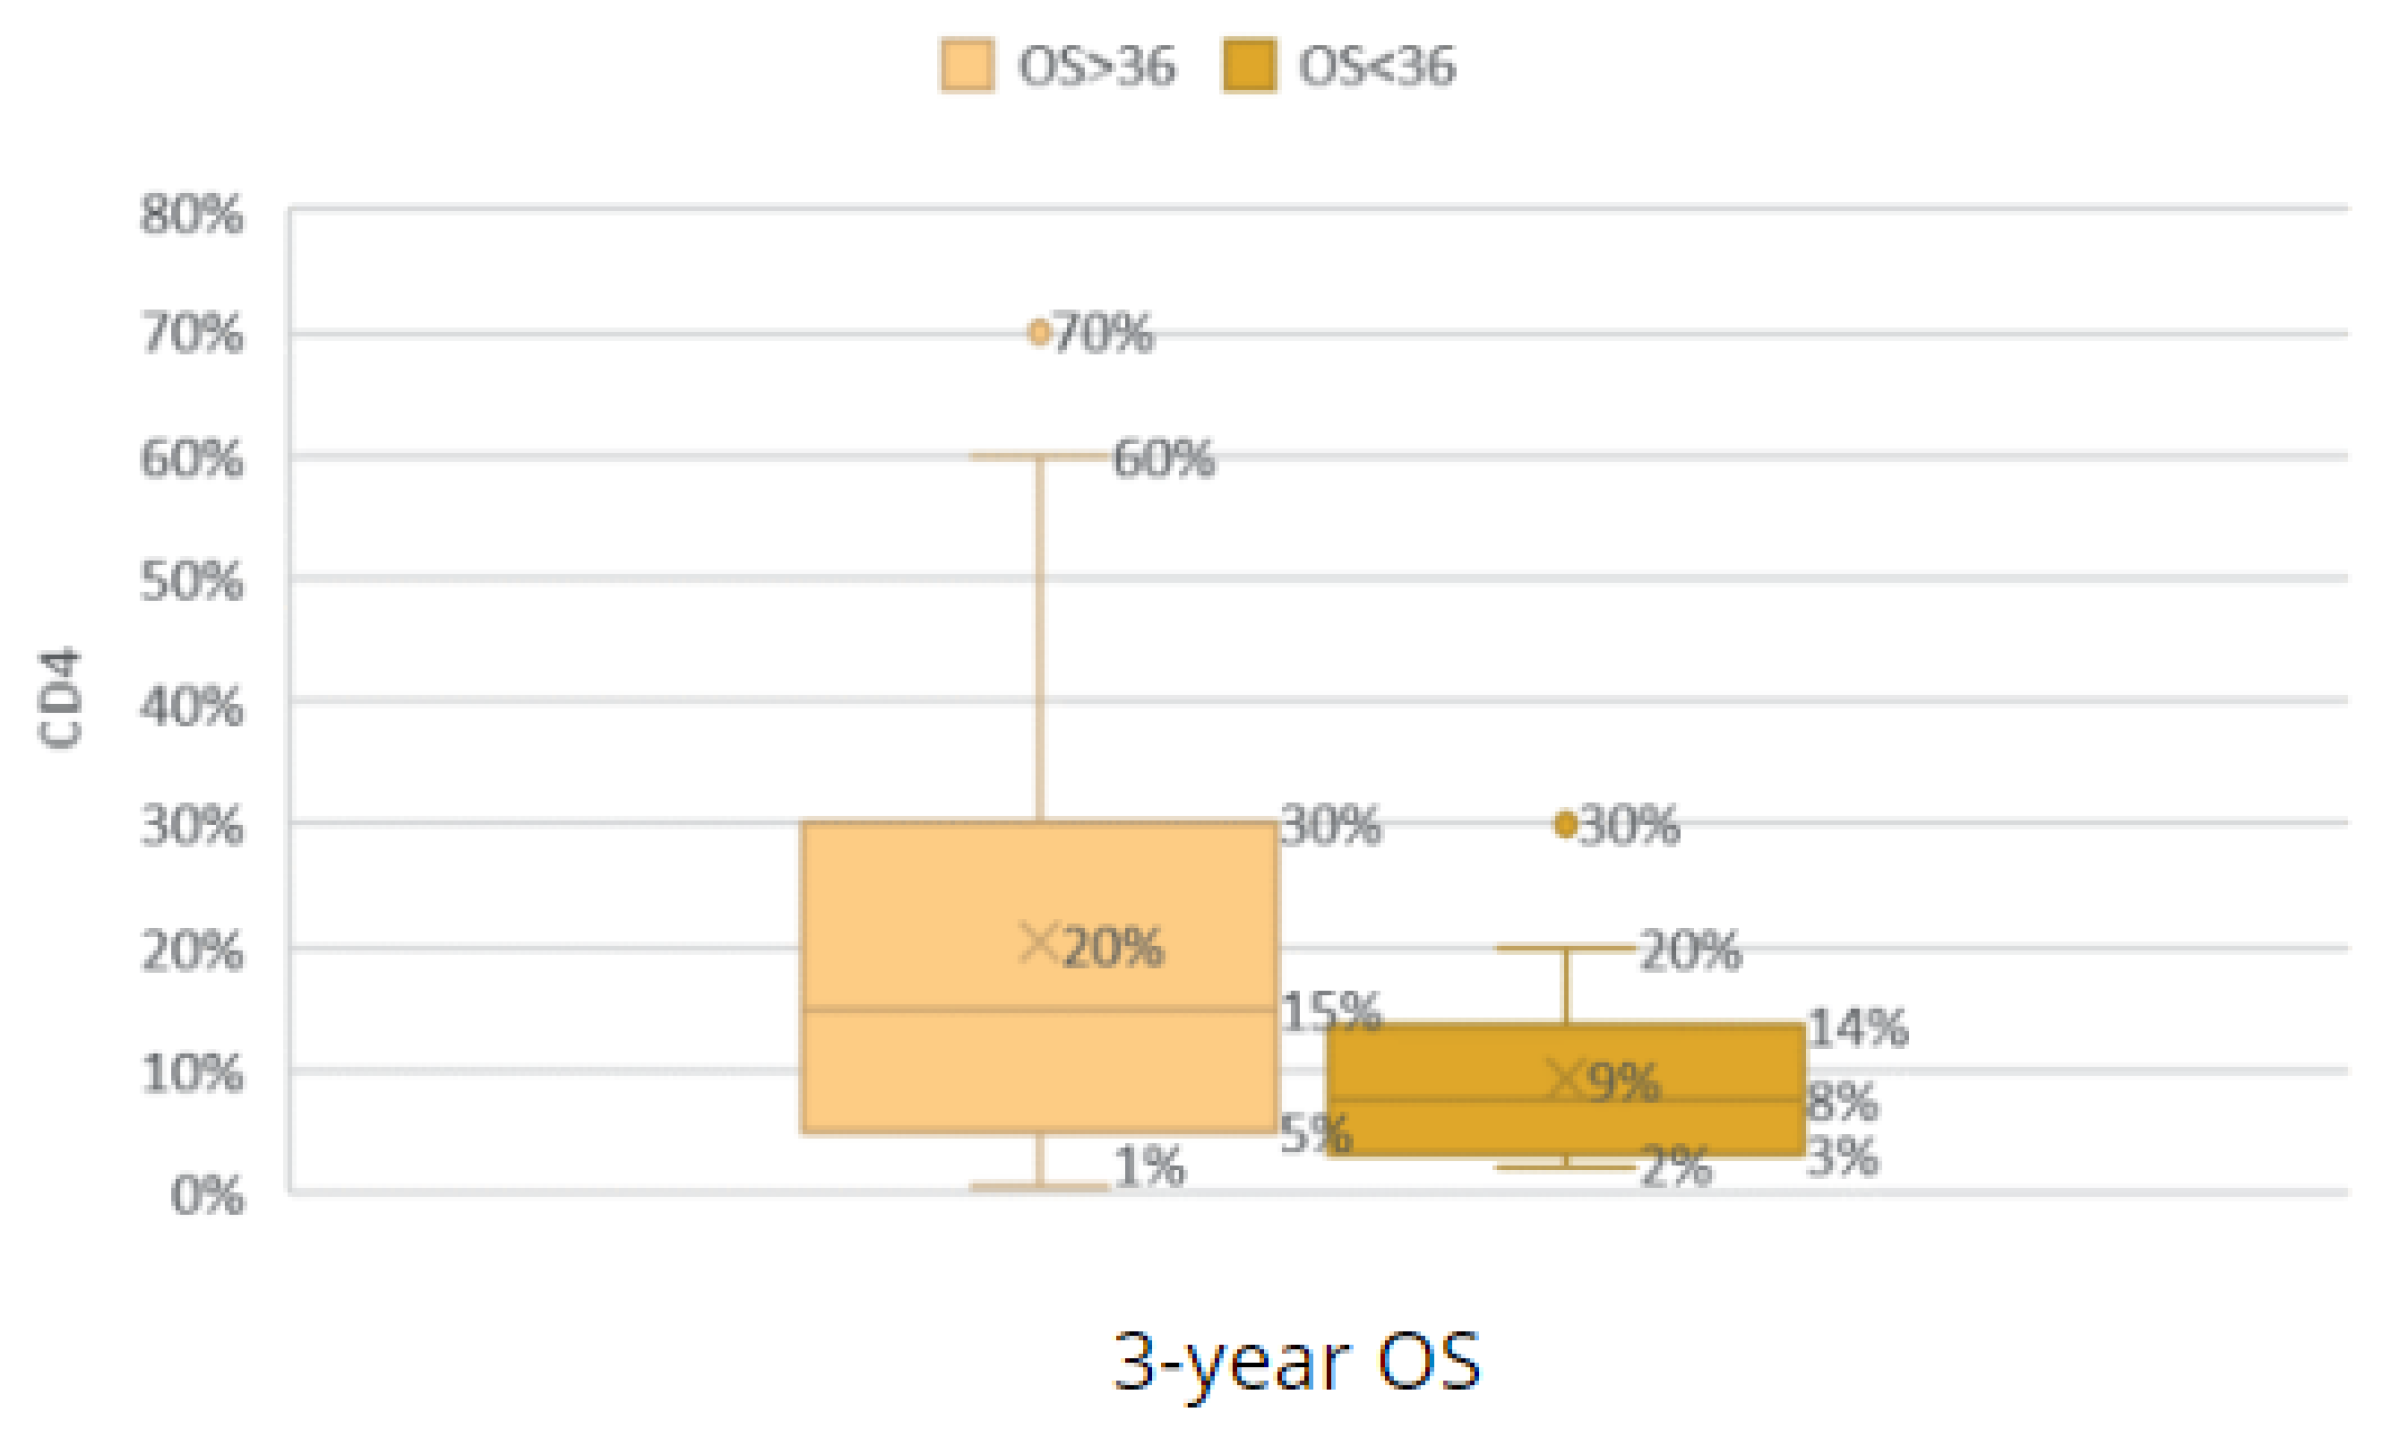
Figure 30.
Comparison of the groups with an OS < 36 and OS ≥ 36 according to CD8 TILs.
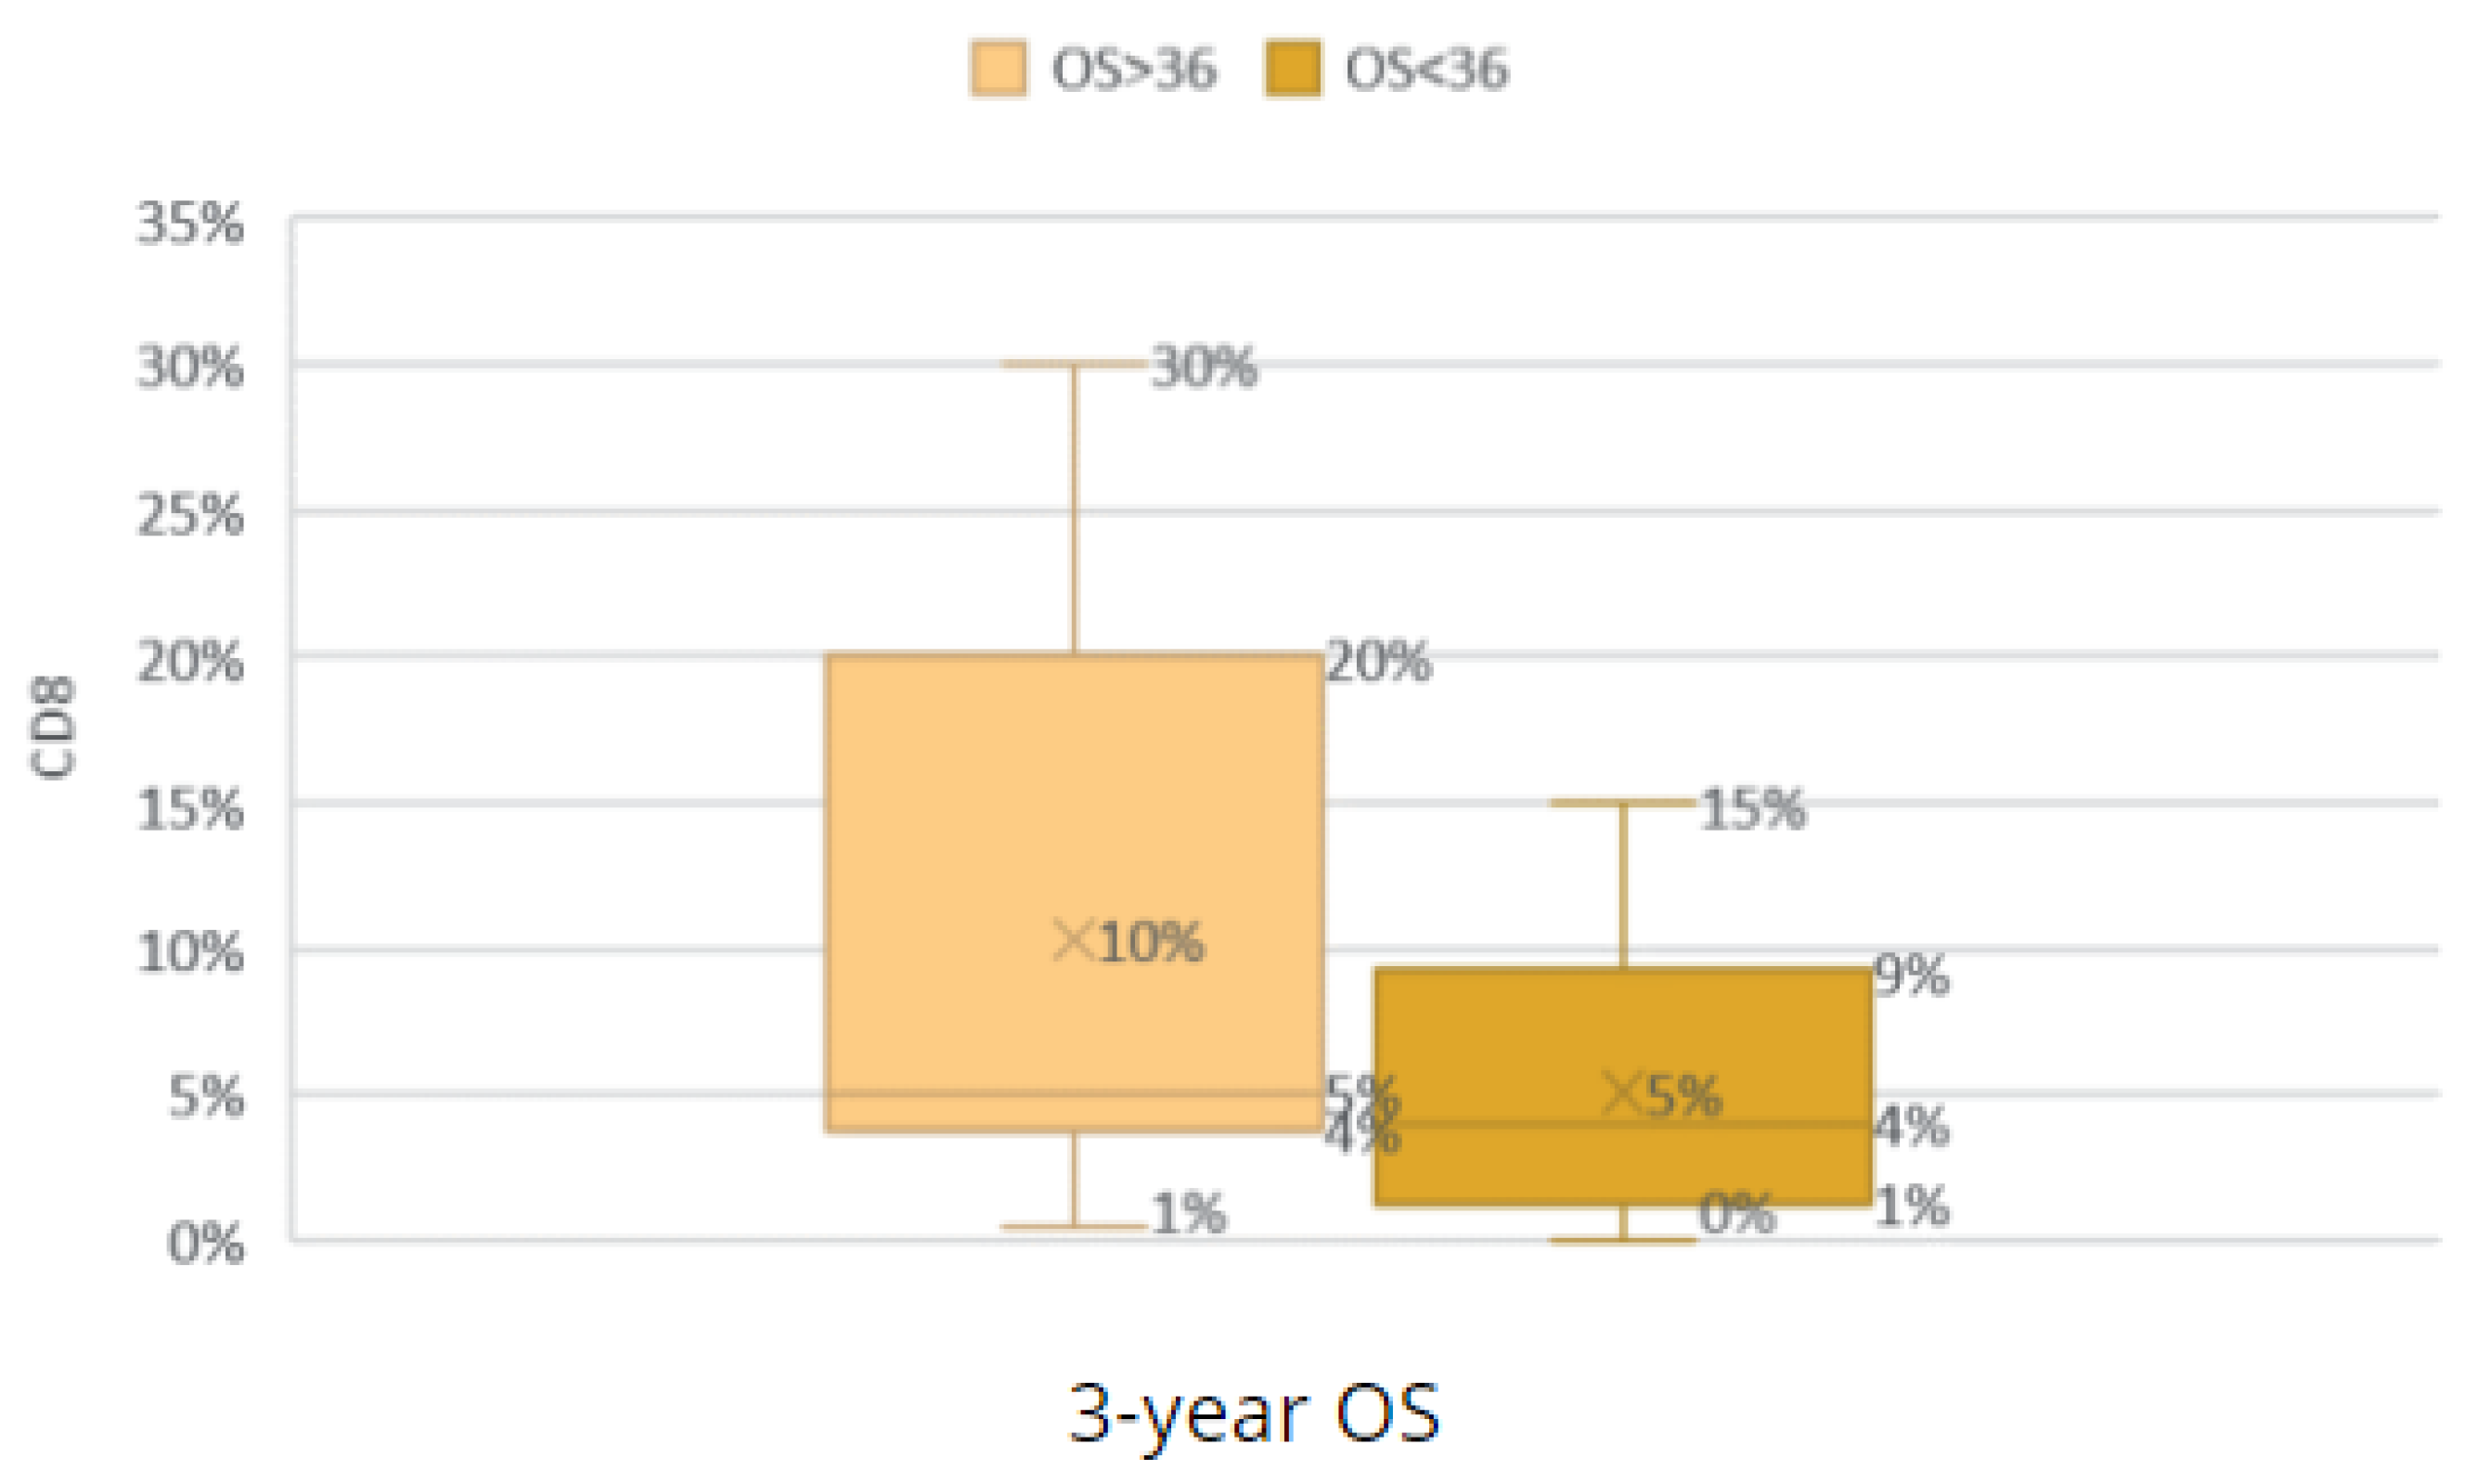
Figure 31.
Comparison of the groups with an OS < 36 and OS ≥ 36 according to AR expression.
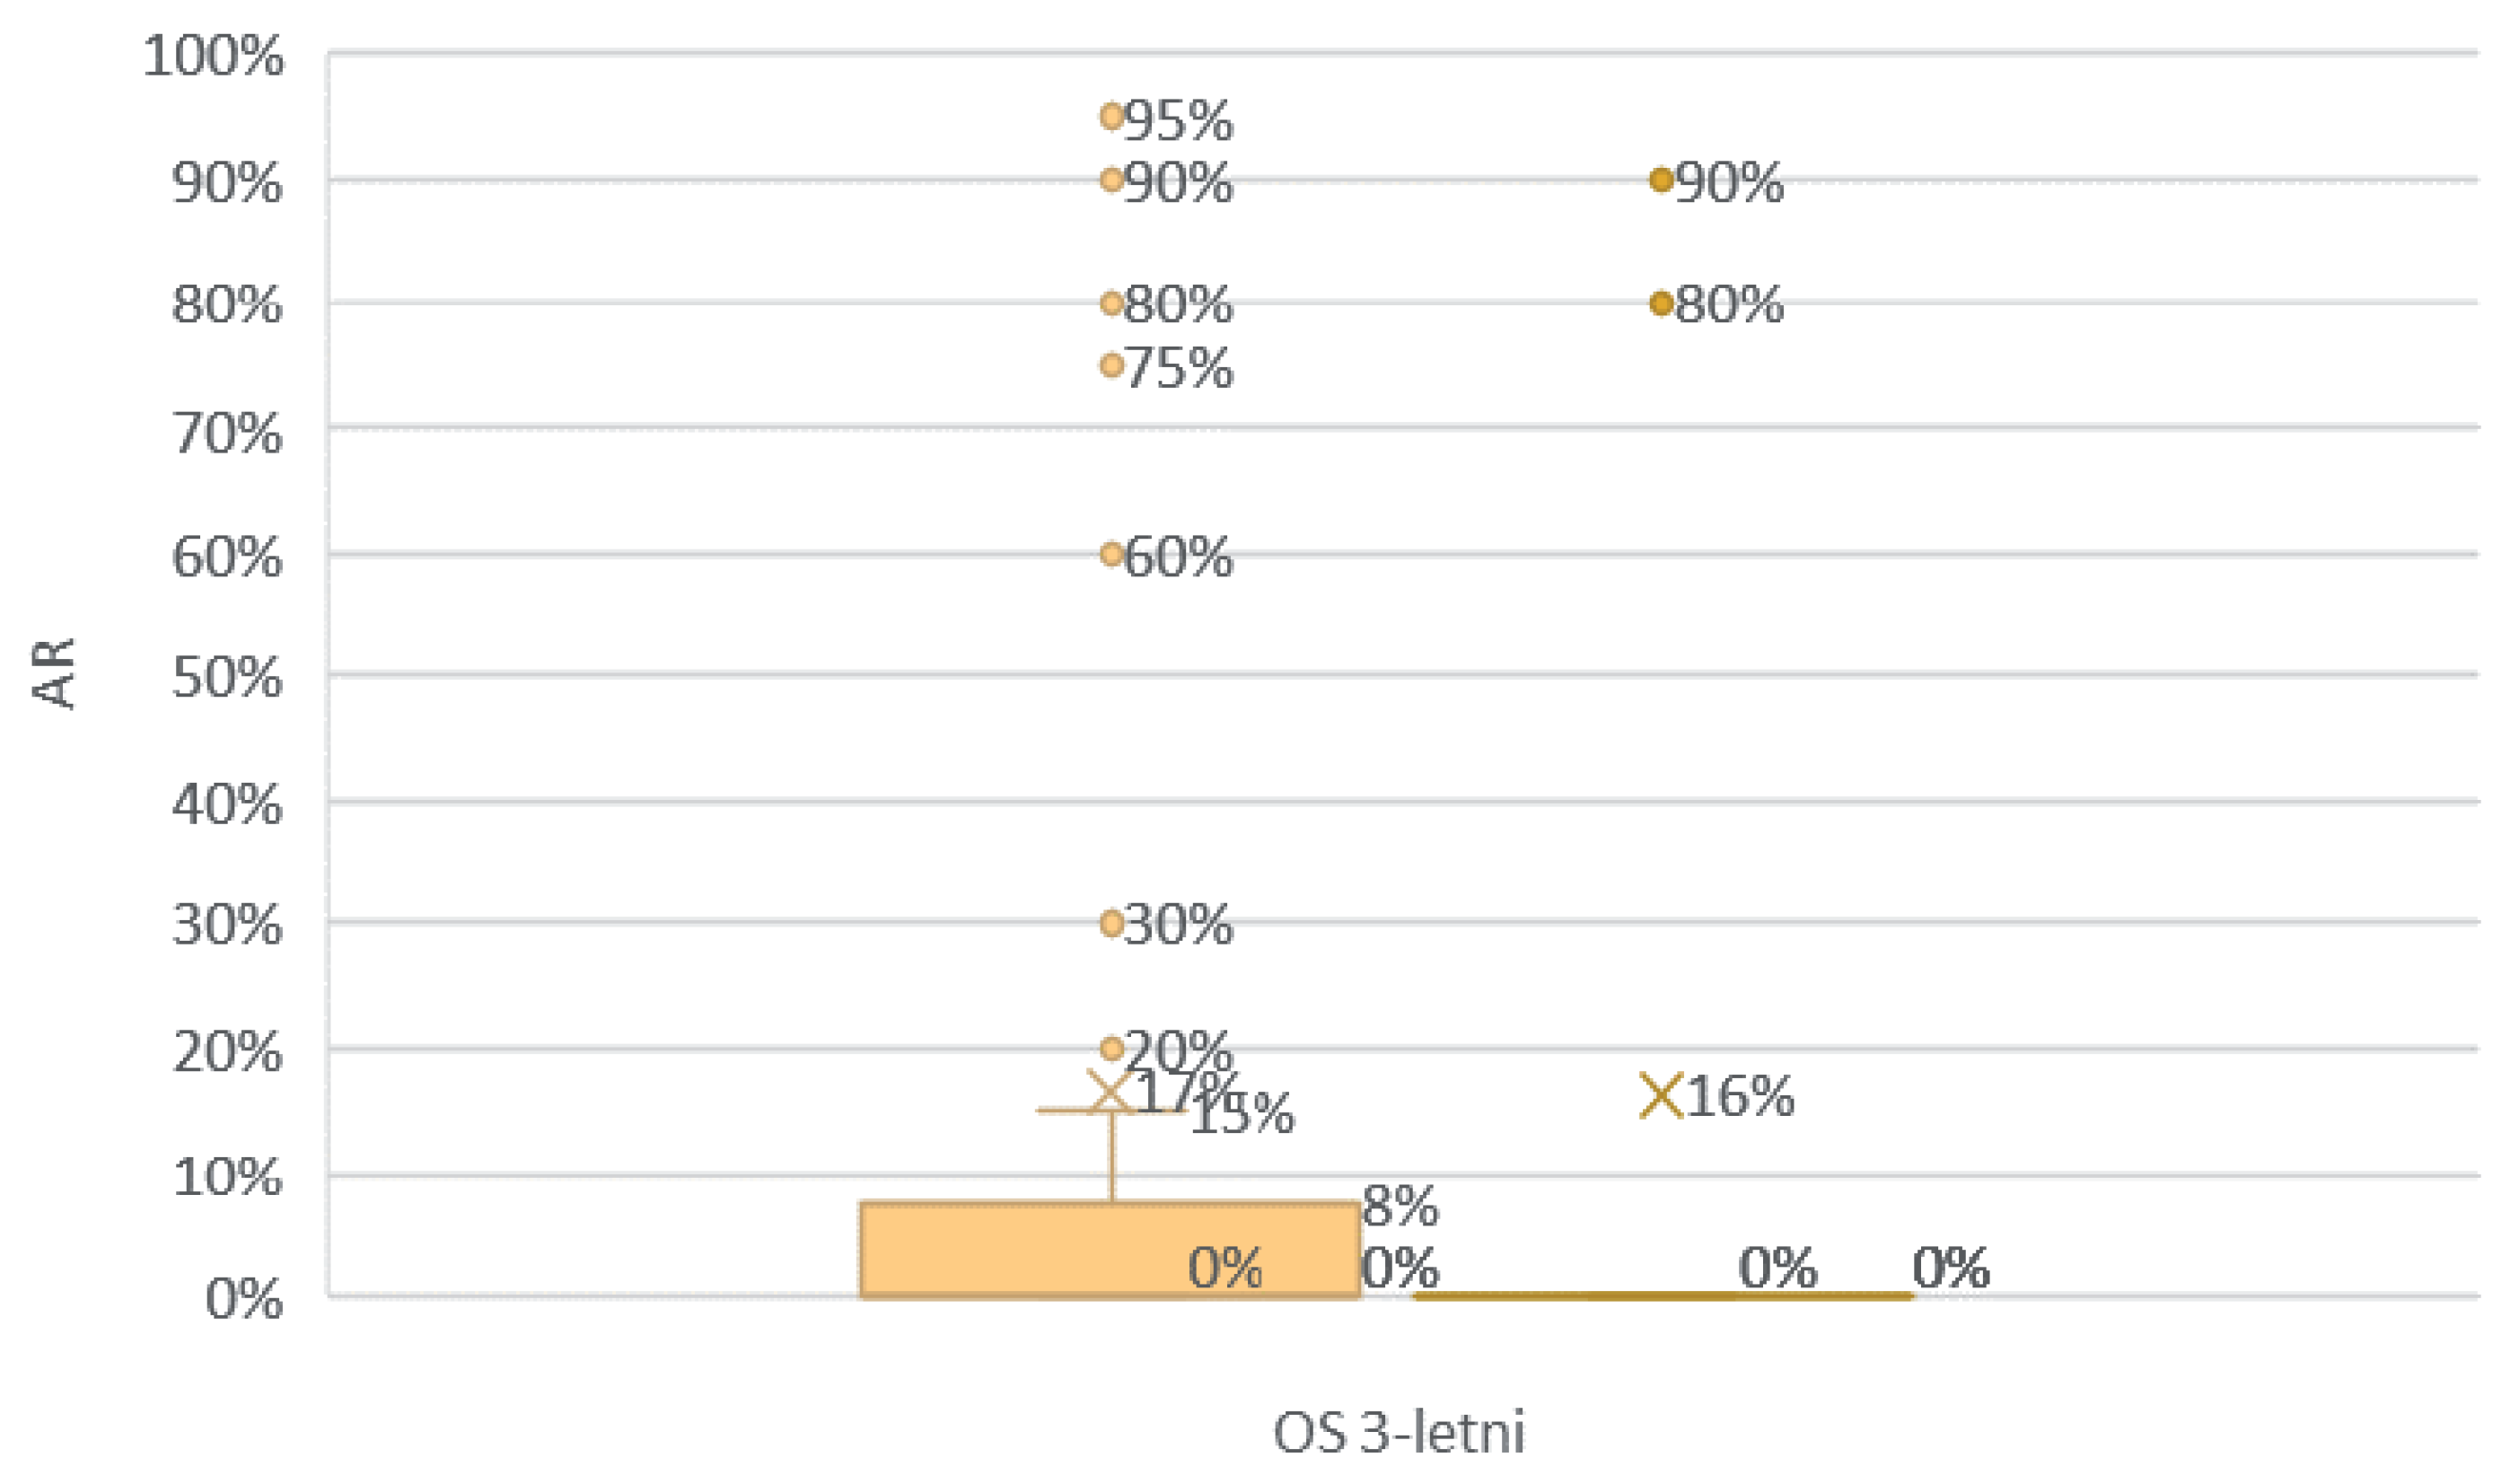
Figure 32.
The 3-year overall survival by the four groups of TNBC patients (Kaplan–Meier survival function).
Figure 32.
The 3-year overall survival by the four groups of TNBC patients (Kaplan–Meier survival function).
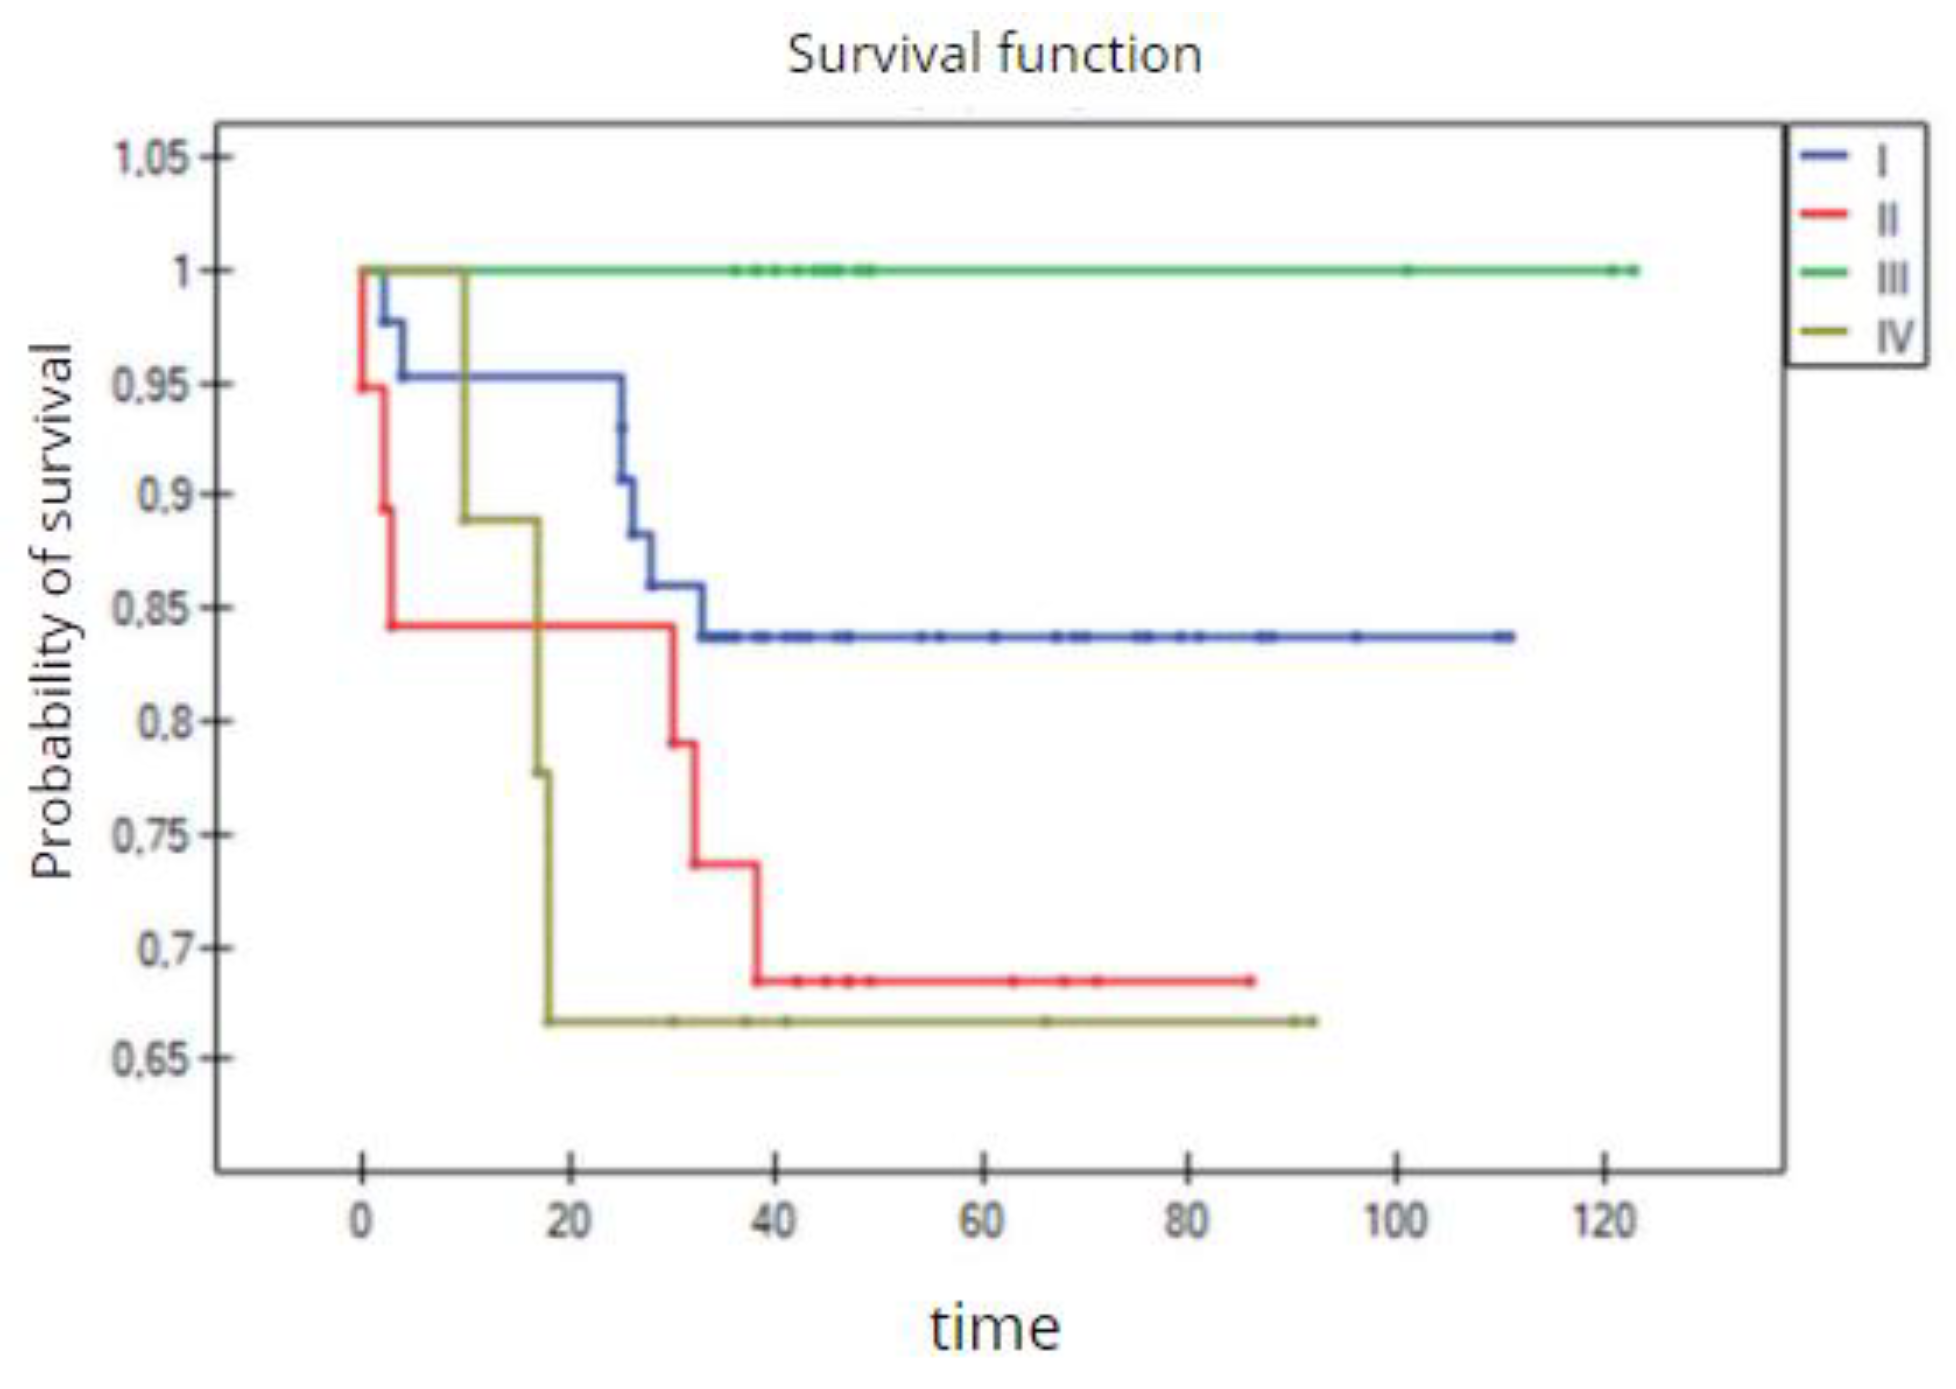
Figure 33.
The 3-year overall survival by the two groups of TNBC patients (Kaplan–Meier survival function).
Figure 33.
The 3-year overall survival by the two groups of TNBC patients (Kaplan–Meier survival function).
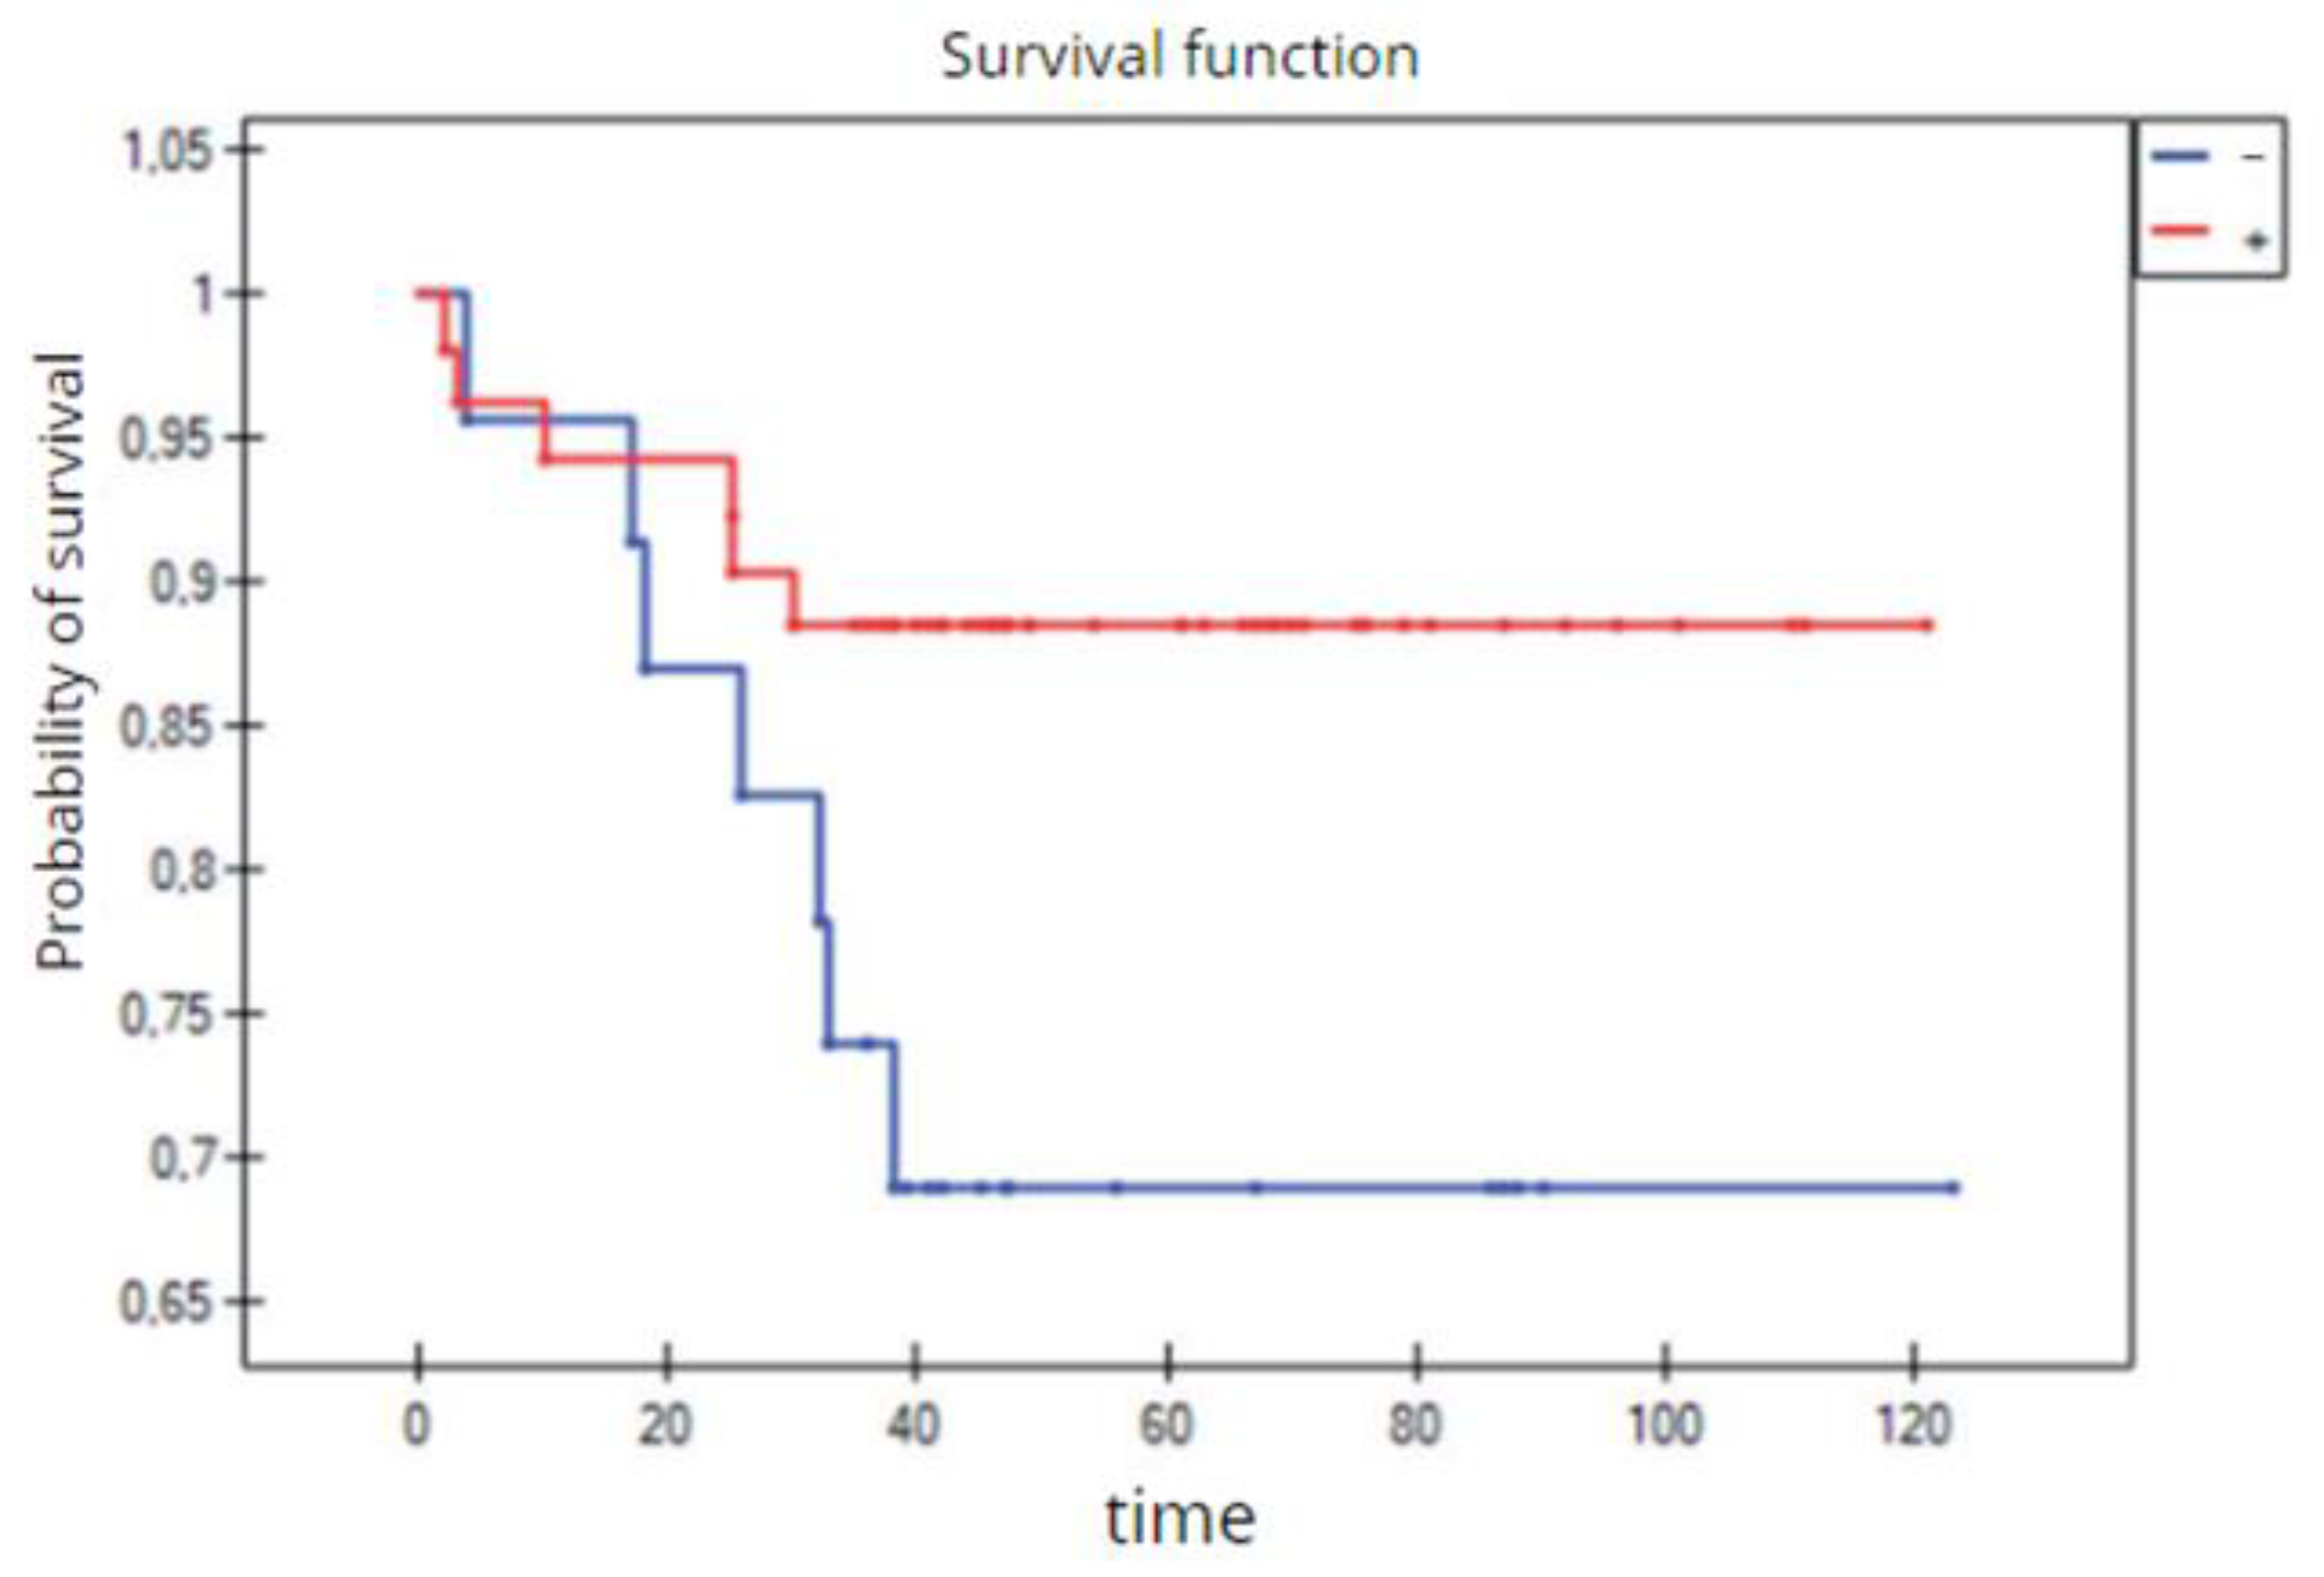

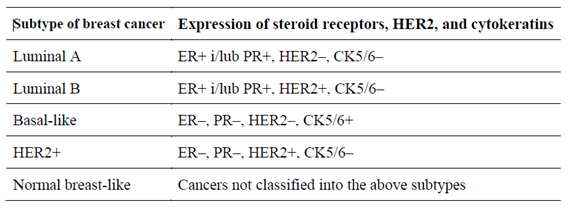
Table 2.
Definition of the invasive breast cancer subtypes based on immunohistochemical surrogates [5].
Table 2.
Definition of the invasive breast cancer subtypes based on immunohistochemical surrogates [5].
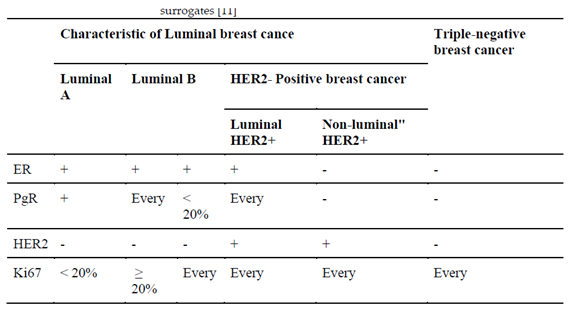
Table 3.
Characteristics of the study group according to clinical features.
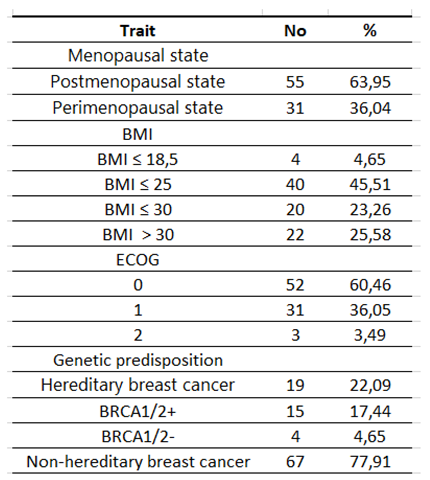
Table 4.
Characteristics of the study group by age at diagnosis and index Ki proliferation 67.
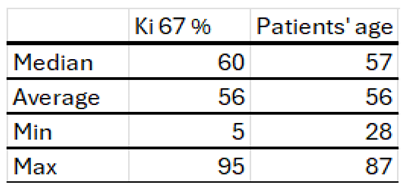
Table 5.
Characteristics of the study group by histopathological type.
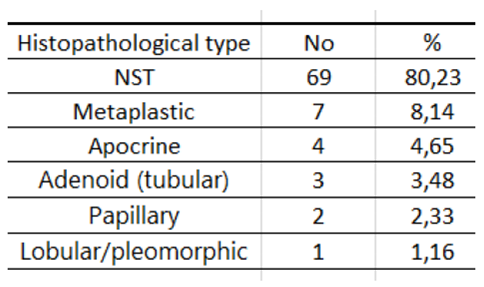
Table 6.
Characteristics of the study group according to G and clinical TNM (according to AJCC classification).
Table 6.
Characteristics of the study group according to G and clinical TNM (according to AJCC classification).
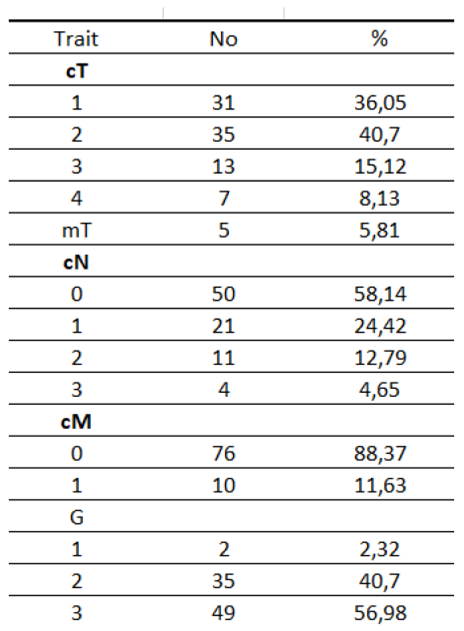
Table 7.
Characteristics of the study group according to the TILs and AR.
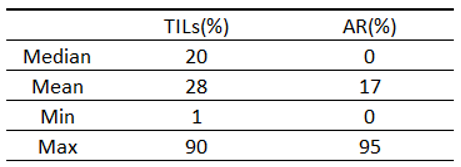
Table 8.
Characteristics of the study group by AR = 0% and AR > 0%.
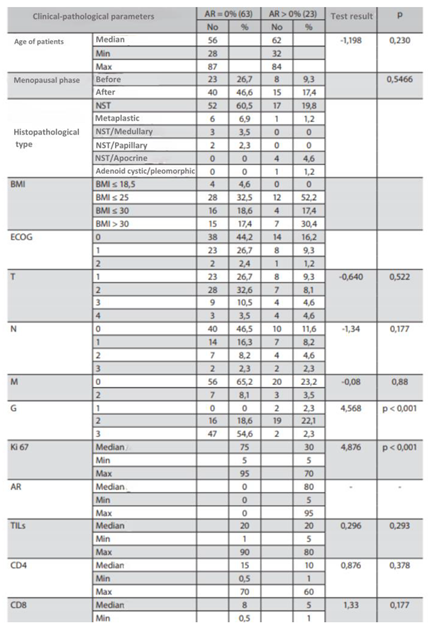
Table 9.
Characteristics of the study group based on division into AR<80% and AR>80%.
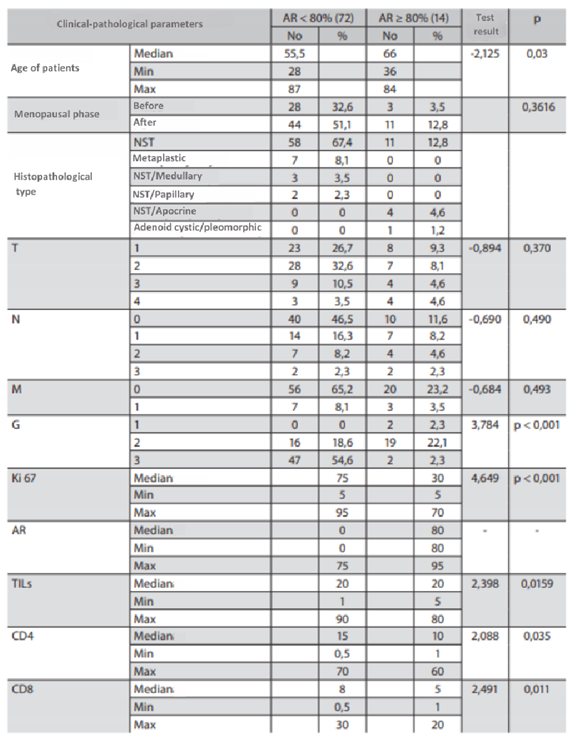
Table 10.
Characteristics of the study group according to the 3-year OS depending on the standardly assessed parameters.
Table 10.
Characteristics of the study group according to the 3-year OS depending on the standardly assessed parameters.
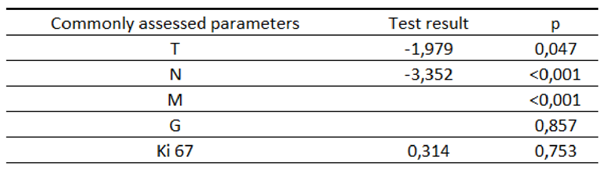
Table 11.
Characteristics of the study group according to the 3-year OS depending on the newly assessed parameters.
Table 11.
Characteristics of the study group according to the 3-year OS depending on the newly assessed parameters.
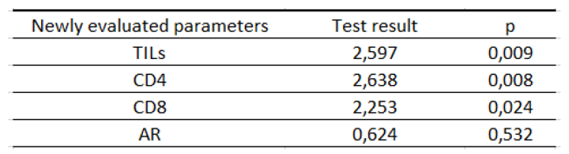
Table 12.
Comparison of the number of deaths within 3 years from the diagnosis in subgroups.
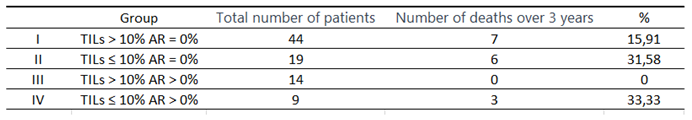
Table 13.
Significance of the log rank test by the subgroups in the analysis of deaths within 3 years from diagnosis.
Table 13.
Significance of the log rank test by the subgroups in the analysis of deaths within 3 years from diagnosis.
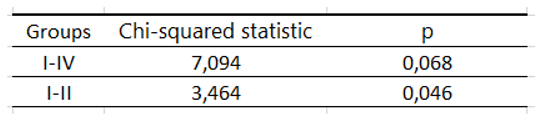
Table 14.
Cox proportional hazards logistic regression.
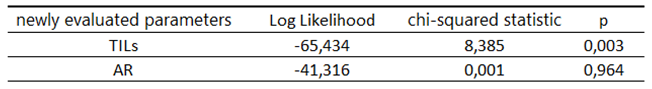
Table 15.
Significance of the Cox model for the TILs and AR.
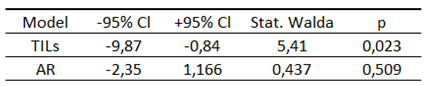
Table 16.
OR depending on the increase in the level of TILs.
Disclaimer/Publisher’s Note: The statements, opinions and data contained in all publications are solely those of the individual author(s) and contributor(s) and not of MDPI and/or the editor(s). MDPI and/or the editor(s) disclaim responsibility for any injury to people or property resulting from any ideas, methods, instructions or products referred to in the content. |
© 2024 by the authors. Licensee MDPI, Basel, Switzerland. This article is an open access article distributed under the terms and conditions of the Creative Commons Attribution (CC BY) license (https://creativecommons.org/licenses/by/4.0/).
Copyright: This open access article is published under a Creative Commons CC BY 4.0 license, which permit the free download, distribution, and reuse, provided that the author and preprint are cited in any reuse.


