
Submitted:
17 June 2024
Posted:
19 June 2024
You are already at the latest version
Abstract
Extensive polymorphism screening of elacestrant dihydrochloride, an Active Pharmaceutical Ingredient (API), was conducted using various methods and solvents. The solubility assessment and polymorph screening of elacestrant dihydrochloride (referred to as elacestrant throughout the paper) utilized both crystalline and amorphous forms of the API as input material with 40 non-conventional solvents, employing slow cooling, maturation, and/or evaporation. Crystalline material underwent further screening via anti-solvent addition, polymer templating, and solvent-drop grinding. A total of 7 new polymorphs were identified. No solvated forms were identified, but some samples contained notable water content, tentatively classified as hydrated forms. Comprehensive solid-state characterization data for representative crystalline samples of each polymorph is presented. Polymorph A exhibited the highest melt (225-226 °C, onset). Thermal analysis of polymorphs B, C, D, E, F and G showed an endothermic-exothermic event (with an onset temperature between 136 and 184 °C), indicating a form conversion, followed by a melt at 205-222 °C (onset), consistent with the previously identified and most stable form of elacestrant. This suggests that these materials convert to the most stable form prior to melting. Pattern G does not show an endothermic-exothermic event, but after desolvation, the material melts at 222 °C (onset temperature).
Keywords:
Polymorphism
; Elacestrant
; Characterization
; Amorphous
; Crystalline
; Anti-solvent Addition
; Polymer Templating
; Solvent-Drop Grinding
1. Introduction
Elacestrant, a selective estrogen receptor degrader (SERD) (Orserdu®) was approved by the FDA in January 2023 for ER-positive, HER2-negative advanced breast cancer with ESR1 mutation after prior endocrine therapy [1,2]. Elacestrant is available in oral dosage forms of 86 mg and 345 mg [3]. Elacestrant dihydrochloride is the active ingredient for the oral tablets [4].
Elacestrant's oral administration is simple and convenient for patients. Oral absorption of medicine can be dependent on the polymorphic form, which in some cases can impact dissolution and subsequently the absorption rate. Understanding the polymorph landscape for a molecule is useful to ensure the most appropriate polymorphic form for clinical development and commercialization is selected, underscoring the importance of tailored drug development and formulation strategies [5].
The need to assess polymorphism in the pharmaceutical industry primarily arises for two reasons. Firstly, polymorphism is inevitable, and may occur during discovery, development, and manufacturing processes as an inherent characteristic of materials. Secondly, the formulator can modify the physicochemical properties of a given compound by using different polymorphs [6]. McCrone stated in 1965 "Every compound has different polymorphic forms and that, in general, the number of forms known for that compound is proportional to the time and money spent researching it." [8].
Modifying the physical forms of a compound, such as polymorphs, solvates, amorphous structures, salts, cocrystals, and hydrates, is a common strategy for enhancing and optimizing drug characteristics [5]. Solubility, dissolution, bioavailability, and physical/chemical stability are critical properties in drug discovery and development. For example, Chloramphenicol palmitate polymorphs show significantly different bioavailability in human studies [7].
To assess polymorphic behavior of elacestrant dihydrochloride, extensive studies were performed. Our recently published manuscript described the discovery and characterization of three polymorphic forms of elacestrant, identified as Form 1, Form 2, and Form 3. These forms will be referred to throughout the paper.
Numerous methods exist for generating polymorphs, including crystallization from single or mixed solvents, thermal activation of solid substrates, crystallization from the melt, desolvation/dehydration, crystallization in nano-confined structures, seeding/pseudo seeding, solution-mediated polymorphic transformation, solid-state polymorphic transformation, mechanical activation, exposure to vapor, directed crystallization on molecular substrates, crystallization with additives, laser-induced crystallization, crystallization from supercritical fluid, and structure prediction [8].
To discover novel polymorphs of elacestrant, and supplement the three forms mentioned in the earlier published study, extensive screening was performed using nonconventional methods. Amorphous and crystalline forms of elacestrant were utilized in this study. This comprehensive approach enhances the understanding of polymorphic behavior and expands the potential forms of a given compound. To our knowledge, this is the first ever study describing the discovery of additional polymorphic forms of elacestrant, which will enable further development of elacestrant for better biopharmaceutical, and pharmacodynamic properties. The additional polymorphic forms identified in this paper are designated by an alphabetical letter scheme to clearly differentiate them from the previously identified polymorphic forms.
2. Materials and Methods
2.1. Materials
Elacestrant Dihydrochloride (Form 2/3) was used as the input material for these studies. The drug was provided by Radius Health/Stemline Therapeutics, Inc. (NY, NY, USA). All organic solvents and other excipients were purchased from third party scientific vendors. The studies were performed by Pharmorphix, Inc. (Cambridge, MA, USA) under the scientific guidance of Radius Health/Stemline Therapeutics, Inc. (NY, NY, USA).
2.2. Instruments & Method
2.2.1. X-Ray Powder Diffraction (XRPD)
Bruker AXS C2 GADDS
X-ray Powder Diffraction patterns were collected on a Bruker AXS C2 GADDS diffractometer (Bruker AXS, Madison, WI, USA) using Cu Kα radiation (40 kV, 40 mA), automated XYZ stage, laser video microscope for auto-sample positioning, and a HiStar 2-dimensional area detector. X-ray optics consists of a single Göbel multilayer mirror coupled with a pinhole collimator of 0.3 mm.
The beam divergence, i.e., the adequate size of the X-ray beam on the sample, was approximately 4 mm. A θ-θ continuous scan mode was employed with a detector distance of 20 cm, which gives an effective 2θ range of 1.5° – 32.5°. Typically, the sample would be exposed to the X-ray beam for 120 seconds. The data were analyzed and presented using Diffrac Plus EVA v15.0.0.0 software.
Samples were run under ambient conditions and prepared as flat plate specimens (whole discs) using a mechanical disc press.
Bruker AXS D8 Advance
X-Ray Powder Diffraction patterns were also collected on a Bruker D8 diffractometer (Bruker, Madison, WI, USA) using Cu Kα radiation (40 kV, 40 mA), θ - 2θ goniometer, and divergence of V4 and receiving slits, a Ge monochromator and a Lynxeye detector. The data were analyzed and presented using Diffrac Plus XRD Commander & Diffrac Plus EVA v15.0.0.0 software.
Samples were run under ambient conditions as flat plate specimens using powder as received. The sample was prepared on a polished, zero-background (510) silicon wafer by gently pressing onto the flat surface or packed into a cut cavity. The sample was rotated in its plane.
PANalytical Empyrean
X-Ray Powder Diffraction patterns were collected on a PANalytical Empyrean diffractometer using Cu Kα radiation (45 kV, 40 mA) in transmission geometry. A 0.5° slit, 4 mm mask, and 0.04 rad Soller slits with a focusing mirror were used on the incident beam. A PIXcel3D detector, placed on the diffracted beam, was fitted with a receiving slit and 0.04 rad Soller slits. The software used for data collection was X’Pert Data Collector using X’Pert Operator Interface. The data were analyzed and presented using Diffrac Plus EVA software.
Samples were prepared and analyzed in either a metal or Millipore 96 well-plate in transmission mode. A transparent X-ray film was used between the metal sheets on the metal well plate, and powders (approximately 1–2 mg) were used as received. The Millipore plate was used to isolate and analyze solids from suspensions by adding a small amount of rest directly to the plate before filtration under a light vacuum. The scan mode for the metal plate used the gonio scan axis, whereas a 2θ scan was utilized for the Millipore plate.
2.2.2. Nuclear Magnetic Resonance (NMR)
1H NMR spectra were collected on a Bruker 400 MHz instrument (Bruker, Madison, WI, USA) equipped with an auto-sampler and controlled by a DRX400 console. Samples were prepared in DMSO-d6 solvent unless otherwise stated. Automated experiments were acquired using ICON-NMR configuration within Topspin software, using standard Bruker-loaded experiments (1H, 13C {1H}, DEPT135). Off-line analysis was performed using ACD Spectrus Processor.
2.2.3. Differential Scanning Calorimetry (DSC)
TA Instruments Q2000
DSC data were collected on a TA Instruments Q2000 (TA Instruments, New Castle, DE, USA) equipped with a 50-position auto-sampler. Typically, 1-5 mg of each sample was placed in a pin-holed aluminum pan and heated at 10 °C/min from 25 °C to 300 °C. A purge of dry nitrogen at 50 ml/min was maintained over the sample. Modulated temperature DSC was carried out using an underlying heating rate of 2 °C/min and temperature modulation parameters of ±0.636 °C (amplitude) every 60 seconds (period). The data were analyzed using Universal Analysis software.
TA Instruments Discovery DSC
DSC data were collected on a TA Instruments Discovery DSC equipped with a 50-position auto-sampler. Typically, 0.5-3 mg of each sample was placed in a pin-holed aluminum pan and heated at 10 °C/min from 25 °C to 300 °C. A purge of dry nitrogen at 50 ml/min was maintained over the sample. The data were analyzed using TRIOS or Universal Analysis software.
2.2.4. Thermo-Gravimetric Analysis (TGA)
TA Instruments Q500
TGA data were collected on a TA Instruments Q500 TGA (TA Instruments, New Castle, DE, USA), equipped with a 16-position auto-sampler. Typically, 5-10 mg of each sample was loaded onto a pre-tared aluminum DSC pan and heated at 10 °C/min from ambient temperature to 350 °C. A nitrogen purge at 60 ml/min was maintained over the sample. The data were analyzed using Universal Analysis software.
TA Instruments Discovery TGA
TGA data were collected on a TA Instruments Discovery TGA equipped with a 25-position auto-sampler. Typically, 5 - 10 mg of each sample was loaded onto a pre-tared aluminum DSC pan and heated at 10 °C/min from ambient temperature to 350 °C. A nitrogen purge at 25 ml/min was maintained over the sample. The data were analyzed using TRIOS or Universal Analysis software.
2.2.5. Chemical Purity Determination by HPLC
API purity analysis was performed on an Agilent HP1100 series HPLC (Agilent, Waldbronn, Germany) equipped with a diode array detector and using ChemStation software. The full method details are provided below:
| Parameter | Value |
| Type of method | Reverse phase with gradient elution |
| Sample Preparation | 0.5-0.7 mg/ml in acetonitrile : water 1:1 |
| Column | Supelco Ascentis Express C18, 100 x4.6 mm, 2.7 μm |
| Column Temperature (°C) | 25 |
| Injection (µl) | 2 or 4 |
| Wavelength, Bandwidth (nm) | 255, 90 |
| Flow Rate (ml/min) | 2 |
| Phase A | 0.1% TFA in water |
| Phase B | 0.085% TFA in acetonitrile |
2.2.6. Ion Chromatography (IC)
Data were collected on a Metrohm 930 Compact IC Flex with 858 Professional autosampler and 800 Dosimo dosage unit monitor, using IC MagicNet software v3.1. Accurately weighed samples were prepared as stock solutions in an appropriate dissolving solution and diluted appropriately before testing. Quantification was achieved by comparison with standard solutions of known ion concentration being analyzed. IC method for anion chromatography is given below,
| Parameter | Value |
| Type of method | Anion exchange |
| Column | Metrosep A Supp 5 – 150 (4.0 x 150 mm) |
| Column Temperature (°C) | Ambient |
| Injection (µL) | Various |
| Detection | Conductivity detector |
| Flow Rate (ml/min) | 0.7 |
| Eluent | 3.2 mM sodium carbonate,1.0 mM sodium hydrogen carbonate in a 5% acetone aqueous solution. |
2.3. Experimental Crystallization Methodologies
The choice of crystallization method significantly influences which polymorphic form is produced, and it is essential to perform crystallization using various techniques and conditions when looking for polymorphs [9,10]. Classical crystallization methods used in the course of this project are listed together below with the degrees of freedom available for each process [11].
| Method | Degrees of freedom |
| Maturation (suspension equilibration or “slurry ripening”) | Solvent or solvent mixture type, temperature, ratio of solvent to solid, solubility, temperature programs, stirring/shaking rate, incubation time |
| Cooling crystallization | Solvent or solvent mixture type, cooling profile, temperature at start or end, concentration |
| Controlled evaporation | Solvent or solvent mixture type, initial concentration, evaporation rate, temperature, pressure, ambient |
| Precipitation by anti-solvent addition | Solvent, anti-solvent, rate of addition, order of mixing, temperature |
2.3.1. Solvent Mediated Techniques
These are classical techniques used for generating crystalline material. Theoretically, crystallization occurs when the concentration of a compound in a solvent is higher than its solubility product. Generally, crystallization is kinetically hindered, and crystals grow only under supersaturated solutions.
For a crystallization screen, solvents with highly diverse properties should be chosen (hydrogen bond donor/acceptor propensity, dipole moment, dielectric constant, viscosity, etc.). Often, solvent mixtures help obtain systems with suitable solubilities, polarities, etc. It also must be ensured that the substance is chemically stable in the given solvents or solvent mixtures. Maturation / Slurry Ripening
To investigate crystalline forms, maturation experiments (or slurry ripening) are often performed in various solvents or solvent mixtures and subjected to heat-cool cycles. Repeated heating and cooling cycles may increase the degree of crystallinity or convert a meta-stable state (or out-of-equilibrium state of amorphous material) into a more thermodynamically stable crystalline form. The conversion rate and extent depend upon the input material's solubility [12].
For thermodynamic reasons, the system can only evolve towards more stable forms. Therefore, if the starting material is crystalline, obtaining a less stable crystalline phase is impossible. A greater number of patterns maybe formed if the starting material is amorphous.
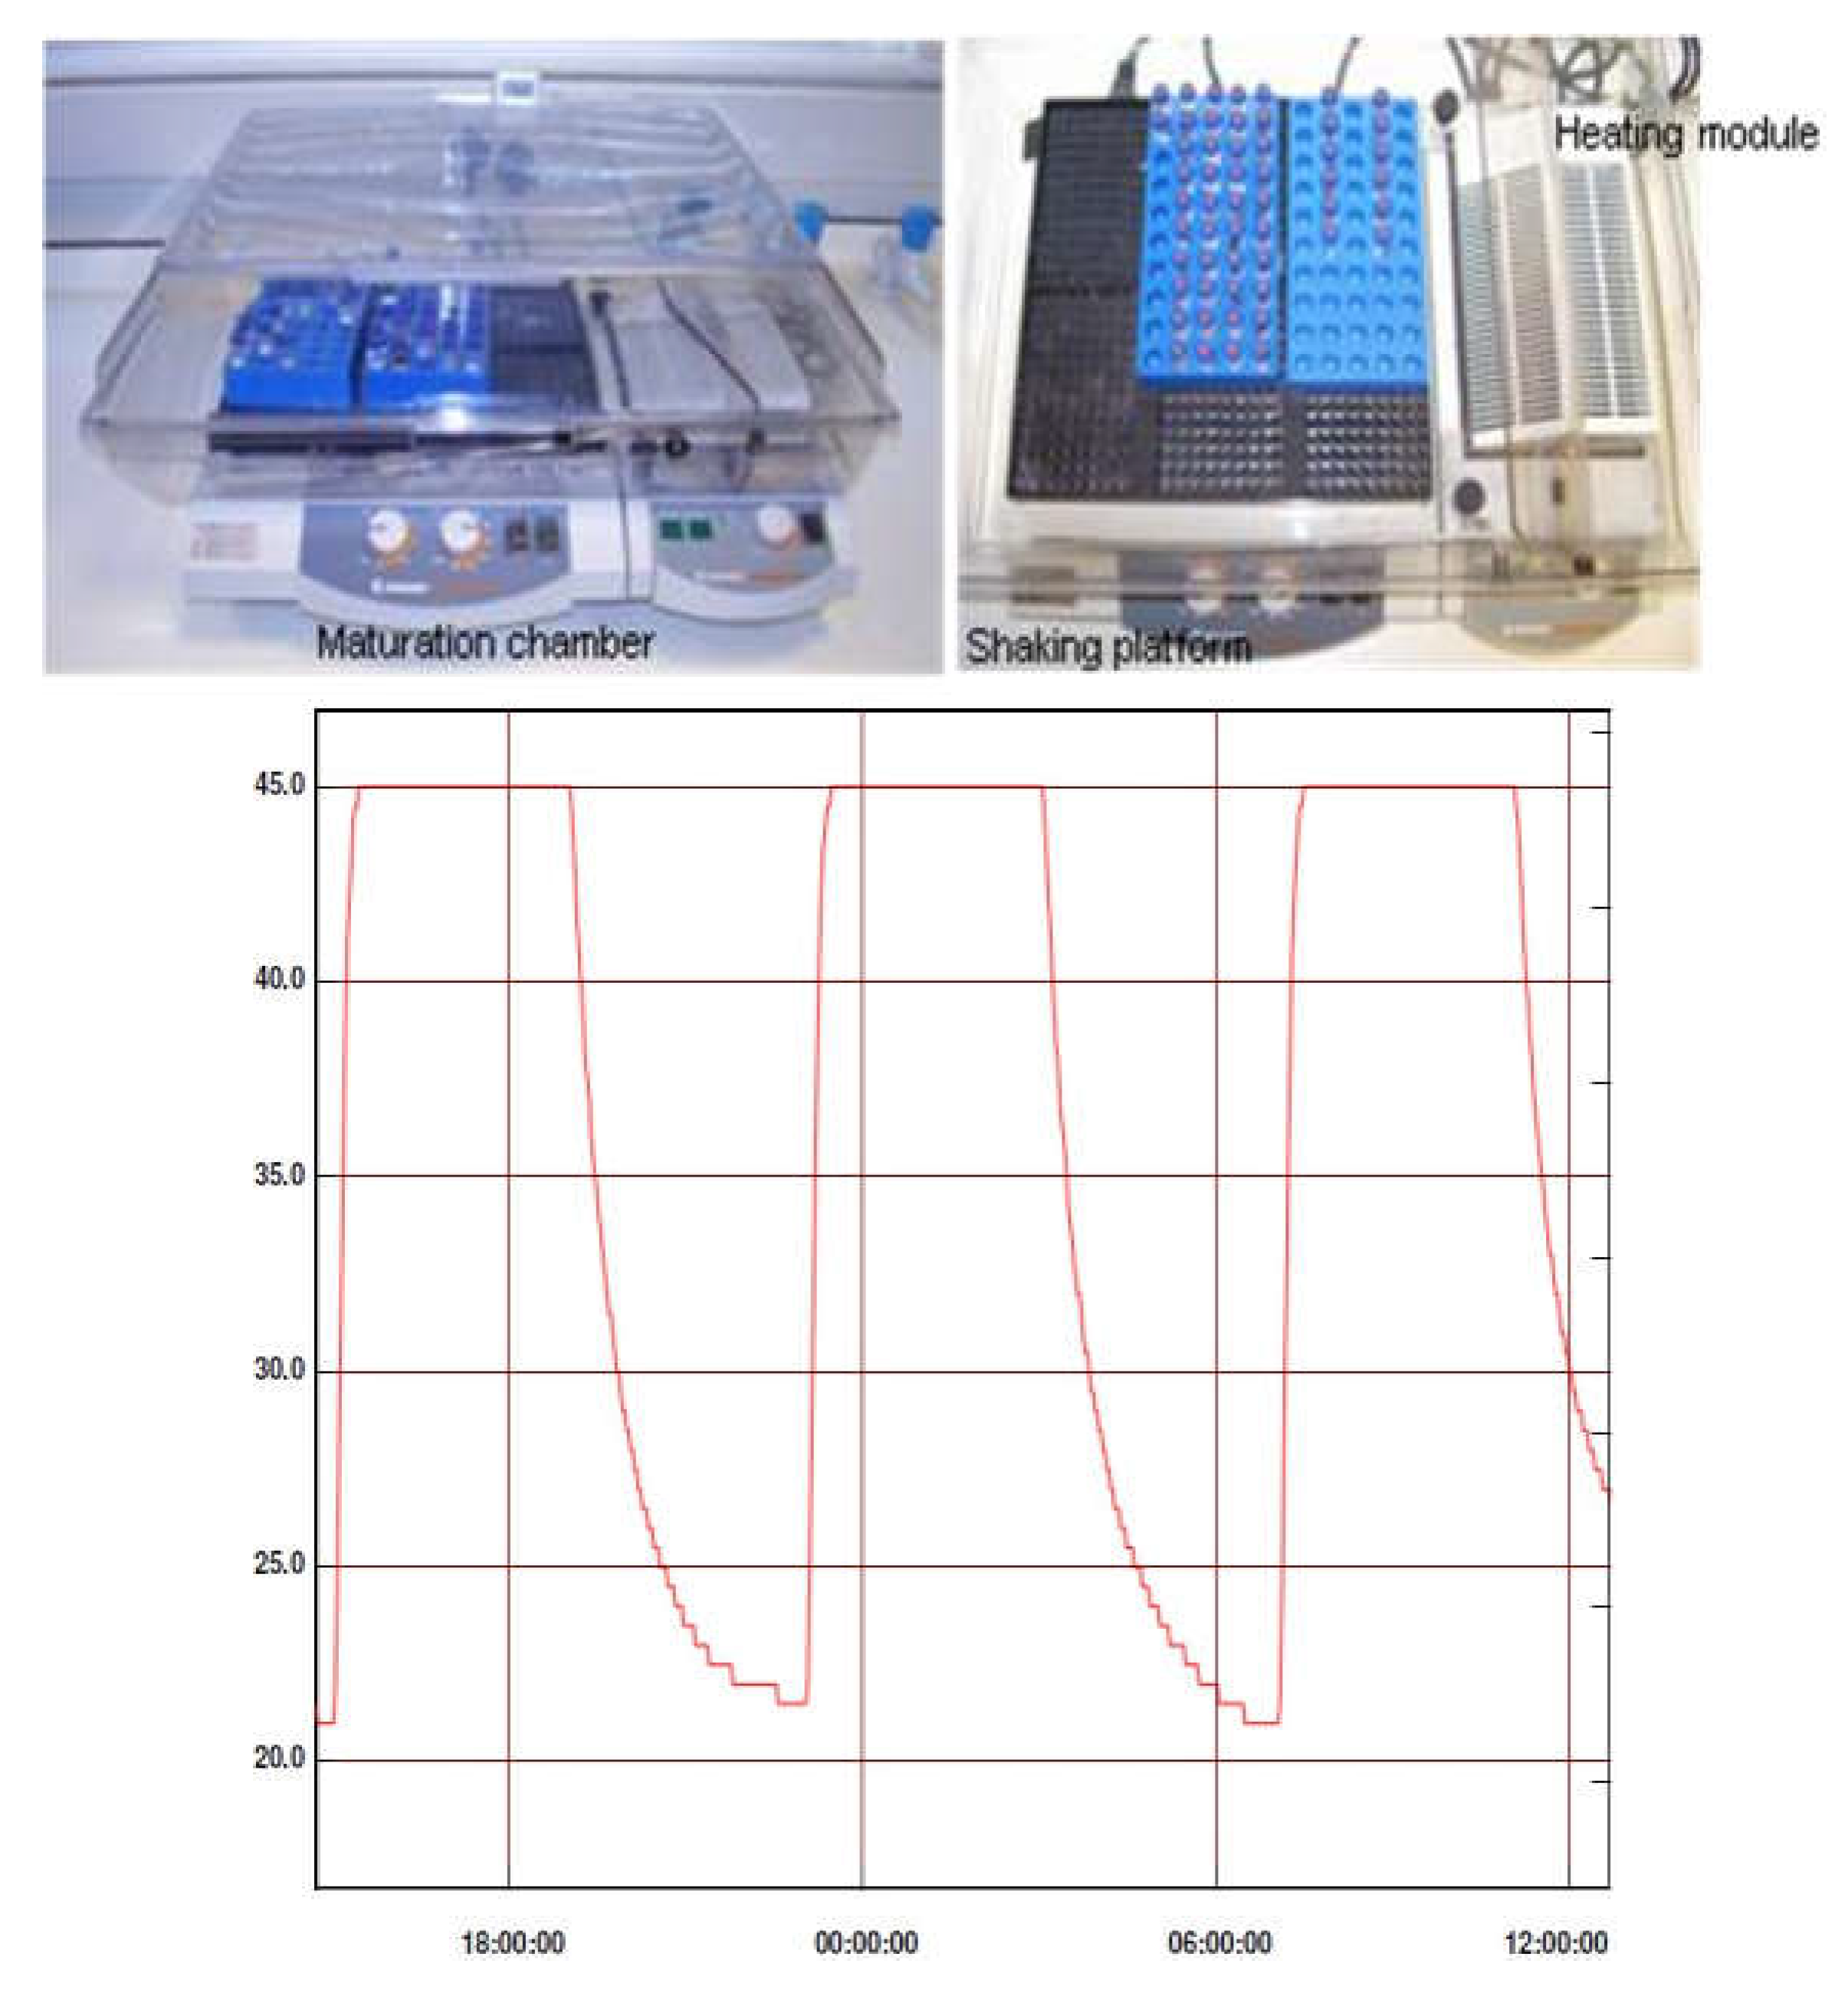
Procedure - Maturation Chamber
Suspensions for maturation were placed in a platform shaker incubator (Heidolph Titramax / Incubator 1000) and subjected to a series of heat-cool cycles from ambient to approximately 50 °C. This is achieved by switching the heating on or off every 4 hours. Shaking is maintained throughout.
Scheme 1.
Maturation chamber and temperature profile.
Procedure - Polar Bear
Suspensions were stirred (400-600 rpm) in a Polar Bear (Cambridge Reactor Design) for four hours at 40 °C. The samples were then cooled to 25 °C and stirred for four hours. The cycle was then repeated.
Cooling Crystallization
Crystallization can be obtained by lowering the temperature of a clear solution. The solubility of most materials decreases with decreasing temperature, so cooling can be used to generate supersaturation. In many cases, however, the solubility of a material remains high even at low temperatures, or the solubility changes very little over the temperature range of interest. In these cases, other methods for the creation of supersaturation must be considered (such as solvent evaporation) [12].
Solutions were cooled to 5 °C at 0.1 °C/min in a Polar Bear and stirred at this temperature for 24 hours. All solids were filtered and analyzed ‘damp’ by XRPD and subsequently allowed to dry under ambient conditions for 1-4 days and reanalyzed ‘dry’ by XRPD. Any remaining solutions were evaporated.
Controlled Evaporation
Crystallization can be generated by controlled evaporation of a clear, particulate free, solution. This is especially true when the solvent has a relatively high vapor pressure. At approximately constant temperature, the solvent is being removed from the system, thereby increasing the solute concentration. The crystal nucleation and growth is obtained when some maximum supersaturation is reached [13]. This technique also has the advantage that since the samples are slowly evaporated it is often possible to generate large single crystals suitable for SCXRD.
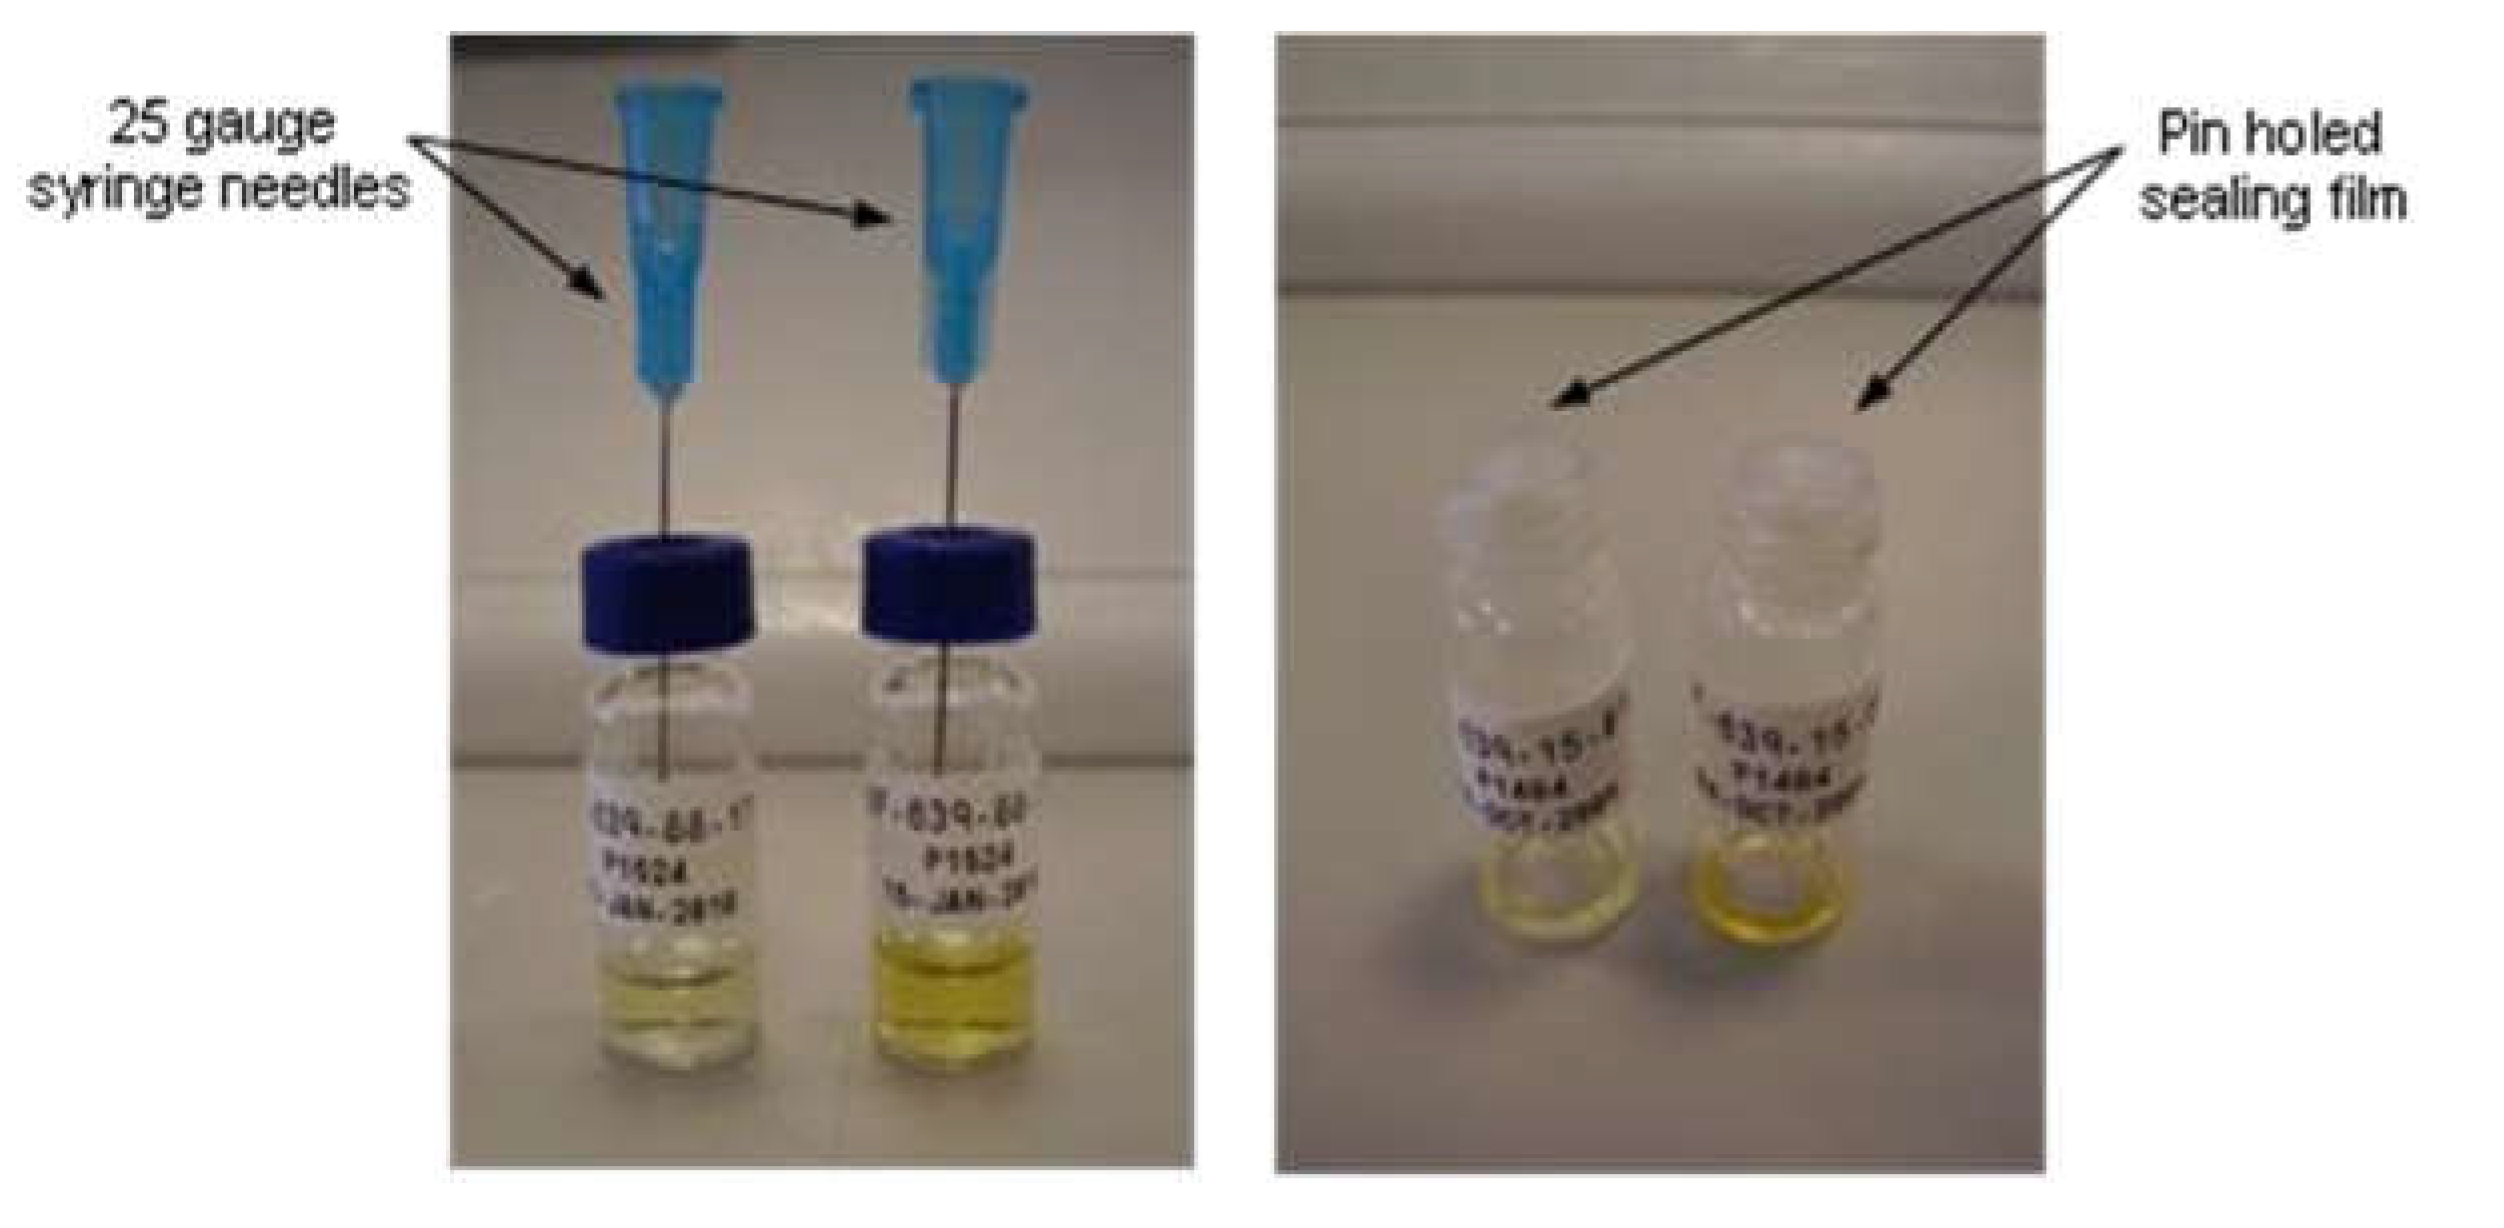
Solutions were evaporated at ambient conditions by inserting a needle into the septum cap of the vials. The samples were allowed to slowly evaporate to dryness or until a solid appeared at ambient conditions.
Scheme 2.
Slow evaporation experiments.
Precipitation/Crystallization by Anti-Solvent Addition
Anti-solvent crystallization (or drown-out crystallization) is a method commonly used to precipitate material from a solution. The addition of a miscible antisolvent into a solute solution reduces the original solubility of the solute, increasing the supersaturation and thus, causing precipitation. The selected anti-solvent should be miscible with the solvent at any proportion, and the solute should be relatively insoluble in it.
Solutions were treated with anti-solvent in aliquots at 50 °C until it became cloudy, or a precipitate formed. Any precipitates were filtered, and an aliquot analyzed by XRPD. All samples were then cooled to 5 °C in the fridge and held isothermally. Suspensions at 5 °C were filtered and analyzed ‘damp’ by XRPD and subsequently allowed to dry under ambient conditions for 24 hours.
2.4. Polymorph Screening Experiments Using Crystalline Elacestrant
2.4.1. Solubility Assessment and Polymorph Screening
Elacestrant (Form 2/3, 30 mg) was weighed into HPLC vials, and a stirrer bar added. The samples were treated with solvent (10 vol, 300 μl) whilst stirring at 25 °C, 500 rpm and visual assessments made after 10 minutes.
Samples that remained as suspensions were treated with additional solvent until they dissolved or a maximum of 50 vol. was added. The temperature was then increased to 50 °C and visual assessments were made after 10 minutes. Solutions obtained were cooled from 50 to 5 °C at 0.1 °C/min and held for 24 hours. Samples which remained suspensions were matured in heat-cool cycles between 50 °C and RT (8 hr/cycle) in a maturation chamber (Section 2.3.1.1.1) for 2 days, and subsequently filtered under suction for 1 hour.
The solids were analyzed by XRPD after isolation and were denoted ‘damp’. After 4 days air-drying at ambient, the samples were re-analyzed and were denoted ‘dry’. Samples which remained as solutions were left to evaporate through a needle inserted into the septum of the vial.
2.4.2. Anti-Solvent Addition Experiments
Elacestrant dihydrochloride (Form 2/3, 50 mg) was weighed into HPLC vials, and dissolved in the minimum volume of solvent (ethanol/water 96:4, 20-30 vol, or methanol, 5 vol), whilst stirring and heating at 50 °C, 600 rpm on a Polar Bear device.
Once dissolved, anti-solvent was added slowly until a 1:1 ratio of antisolvent:solvent (v/v) was reached. A stirring for 5-10 minutes observations were recorded. The ethanol/water sample solutions were transferred to scintillation vials prior to anti-solvent addition. If required, additional anti-solvent (up to a maximum ratio of 5:1 antisolvent:solvent) was added until precipitation was observed.
For thick suspensions, aliquots were taken at 50 °C, filtered on a Millipore plate and analyzed by XRPD. All samples were then cooled to 5 °C in the fridge for 16 hours. The material was initially analyzed ‘damp’ by allowing the solvent to filter through each well under gravity and then each well was re-analyzed ‘dry’ after allowing at least 24 hours to air-dry at RT.
2.4.3. Polymer Template Crystallizations
Elacestrant (Form 2/3, 50 mg) was weighed into HPLC vials whilst stirring at 40 °C, 600 rpm on a Polar Bear device. Samples were dissolved in the minimum volume of solvent (ethanol/water 96:4, 30 vol, or MeOH, 10 vol). Low solubility was observed in chloroform (50 vol), therefore the resulting suspension was filtered, and the filtrate used to seed with the polymer. 5% wt. (2.5 mg) of polymer was added to each solution. The samples were held at 40 °C for 15 minutes, and then the sample was allowed to evaporate to dryness at RT with the vial cap removed. The residue obtained was analyzed by XRPD. The solubility of the polymers differed in each solvent and often did not completely dissolve in solution.
2.4.4. Solvent-Drop Grinding Experiments
Elacestrant (Form 2/3, 30 mg) was weighed into HPLC vials with two stainless steel ball bearings (3 mm ø) and a drop of dry solvent (15 μl) added. The samples were ground in a Fritsch planetary mill for 2 hours (500 rpm). The resulting solids were analyzed by XRPD.
2.5. Procedure of the Polymorph Screening Experiments Using Amorphous API
2.5.1. Preparation of Amorphous Material
Amorphous material was generated from the elacestrant (Form 2/3) by lyophilization from t-BuOH/H2O (1:1). elacestrant (Form 2/3, 800 mg) was weighed in duplicate into 20 ml scintillation vials and dissolved, whilst stirring at 50 °C, in t-BuOH/H2O (20 vol, 16 ml). The solution was filtered and decanted into HPLC vials (700 μl, ~ 35 mg of elacestrant per vial). The vials were snap-frozen in a dry ice/acetone bath and lyophilized overnight.
One of the 44 samples were analyzed by XRPD, 1H NMR and HPLC. The other samples were used directly for solubility assessment and polymorph screening of the amorphous form.
2.5.2. Solubility Assessment and Polymorph Screening Procedure
Amorphous solid (~ 35mg) was treated with an aliquot of solvent (10 vol, 300 μl) whilst stirring at 25 °C, 500 rpm. Visual assessments were made after 10 minutes. Samples that remained as suspensions were treated with additional solvent (up to a maximum of 50 vol.) until dissolution occurred. The temperature was then increased to 40 °C and visual assessments were made after 10 minutes.
Samples which formed solution were cooled from 40 to 5 °C at 0.1 °C/min and held for 24 hours. Any solutions remaining after this time were allowed to evaporate slowly at RT to produce single crystals. These experiments were repeated with addition of 2.5 vol. solvent and stirring at 40 °C. Samples which remained suspensions were matured in heat-cool cycles between 40 °C and 25 °C (8 hr/cycle) for 2 days on a Polar Bear device.
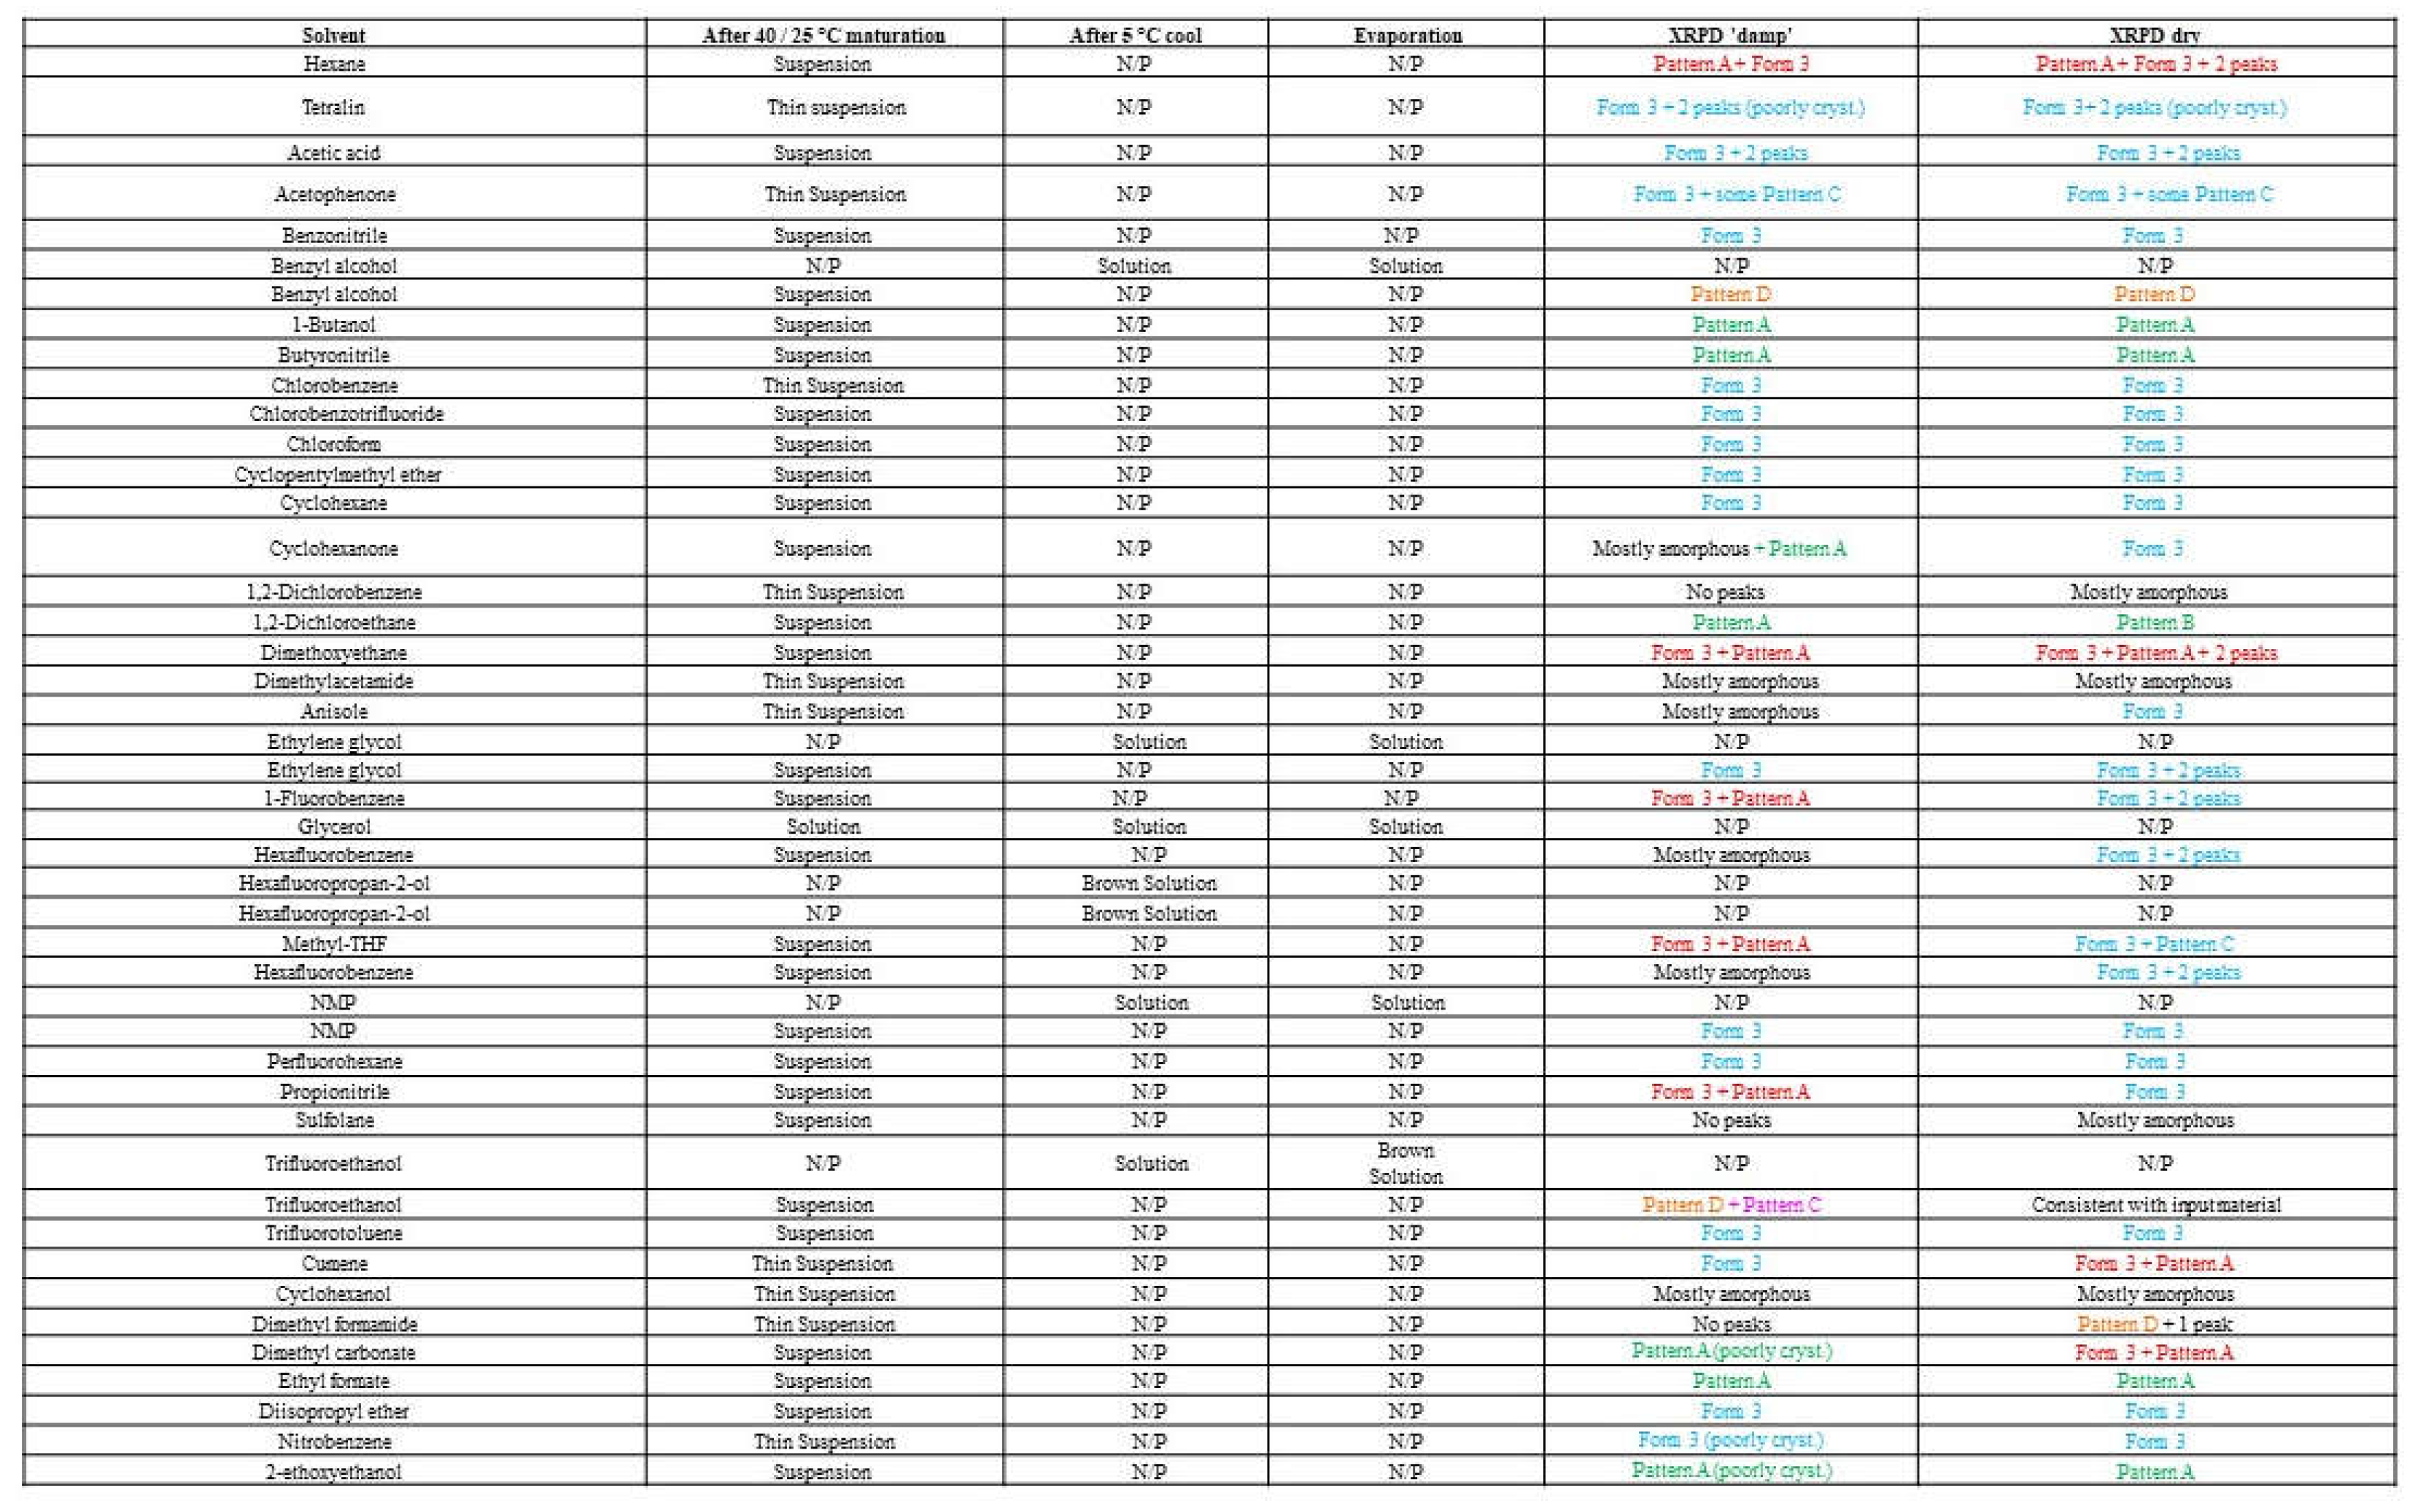
All suspensions obtained from cooling/maturation were filtered under suction for 1 hour and the resulting solids analyzed by XRPD, denoted as ‘damp’ samples. After 4 days drying under ambient conditions to air-dry, samples were reanalyzed by XRPD, denoted as ‘dry’ samples.
3. Results and Discussion
3.1. Elacestrant (Form 2/3) Characterization
Elacestrant (Form 2/3) was shown to be a mixture of Form 2 (anhydrous) and Form 3 (hydrate), with the ratio of each dependent on the prevailing relative humidity. An overlay of the XRPD diffractograms for the API was consistent with a mixture of Form 2 and Form 3, predominantly Form 3, as shown in Figure 1A. Elacestrant (Form 2/3) exhibited good chemical purity (99.2% by HPLC). The 1H NMR spectrum was consistent with the spectrum of the previous study (Form 2/3) (Figure S1A). As seen in Figure S1B, thermal analysis of the material showed similar events as the previously studied batch for Form 2/3: a broad endotherm from RT to 150 °C and an endothermic event at ~ 160 °C (onset). However, the weight loss associated with the broad endotherm (RT to 150 °C) was greater for this batch (8.4% wt. vs. 5.2% wt.), equating to ~ 2.5 eq. water. The onset of degradation occurred earlier (~ 200 °C), so it was impossible to observe a recrystallization-melt (exothermic-endothermic) event in this batch, as seen in Figure 1B.
3.2. Extensive Polymorphic Screening Experiment on Crystalline Elacestrant (Form 2/3)
Solubility assessment and polymorph screening were performed using elacestrant with 40 non-conventional solvents, with subsequent treatment of slow cooling, maturation and/or slow evaporation. Further polymorph screening was performed on the crystalline material by anti-solvent addition (12 anti-solvents, 2 solvents), polymer templating (12 polymers, 3 solvents), and solvent-drop grinding (36 solvents). For all these studies, the crystalline form was used to discover new polymorphs for elacestrant.
3.2.1. Solubility Assessment and Polymorph Screening.
Polymorph studies were performed using crystalline material (Form 2/3) as the input material with 40 neat solvent systems to isolate new crystalline polymorphs, hydrates, or solvates of the API. Since polymorphism studies had been performed in the previously published study for elacestrant in common Class 2/Class 3 solvents, the solvents selected in this screen were less conventional to increase the chance of identifying additional polymorphs.
The solubility assessment procedure was selected for the 10-50 vol of solvent at 25 °C and 50 vol of solvent at 50 °C for the crystalline form. Solubility assessments on elacestrant showed low solubility in all organic solvents tested, except benzyl alcohol, ethylene glycol hexafluoropropan-2-ol (HFIP), and trifluoroethanol (TFE) as shown as Table 1A. The resulting solids collected from the solubility assessment procedure generated 5 different XRPD patterns of which three were new. (Figure S2). New pattern A and Form 3 were observed in several solvents, a range of solid-state techniques characterized a mixture as well as representative crystalline samples of each. New pattern C and the potential new polymorph plus degradant pattern D were only observed in 1 or 2 solvents, as shown in Table 1B.
3.2.2. Anti-Solvent Addition Experiments
Anti-solvents were selected from the solubility assessment of elacestrant (Form 2/3), including those that gave low solubility, exhibited new polymorphs, and did not show significant degradation by HPLC. In addition, ethyl acetate and isopropyl acetate anti-solvents were selected based on their common use in process development. Ethanol and methanol were selected as solvents. Ethanol can be used to obtain Form 1, and methanol is known to favor hydrate formation (Form 3) from water activity experiments conducted during the previous study.
Based on prior water activity experiments, it was found that Form 1 could be obtained from slurrying in ethanol in up to 5-10% aq./EtOH. To increase the solubility of crystalline elacestrant, dissolution was performed in EtOH/water (96:4, v/v). This enabled dissolution in 30 vol. of the solvent system at 50 °C. Antisolvent addition experiments in the presence of ethanol/water (96:4) mainly produced the expected Form 1. Two new XRPD patterns were identified during anti-solvent addition in EtOH/water (96:4) when using chloroform (denoted Pattern F) and when using 1,2-dichloroethane or butan-1-ol (denoted Pattern G). In addition, solids were obtained from anisole and chlorobenzene with XRPD patterns similar to Form 3.
The same anti-solvents were added to methanol using 5 vol. of solvent at 50 °C by different ratios. Experiments in the presence of methanol mostly produced material exhibiting a new XRPD pattern, denoted Pattern E.
Pattern A was obtained from MeOH or EtOH/water (96/4) in the presence of 1,2-dimethoxyethane or other anti-solvents when analyzed damp. This material is converted to Form 1 or Pattern E on drying. The polymorphs screening procedure and results are shown in Table 2, and supportive XRPD graphs are provided in Figure S3.
3.2.3. Polymer Template Crystallizations
Polymer template crystallization is a method used to influence the crystallization process and provides an alternative route to screen for new polymorphs. Depending on the polymer solubility in a selected solvent, it can provide a foreign surface upon which to crystallize, or alter solution parameters, e.g., API solubility, viscosity, etc. Suitable solvents for templating experiments were selected based on the known solubility of elacestrant and its relevance to process development (e.g. ethanol, methanol) or if they produced new polymorphs during screening studies (chloroform). All solvents exhibited good compound solubility at suitable volumes and moderate volatility for slow evaporation. A range of up to 12 polymers were utilized to provide templates for crystallization screening.
Polymer template crystallization using the 3 solvent systems, in the presence of up to 12 different polymers (with varying functional groups and structures), did not produce material exhibiting any additional new XRPD pattern. Form 1 was predominant from templating experiments in the presence of ethanol, and Form 2/3 mixtures, Form 3, or pattern E were produced in the presence of methanol. No crystalline material was isolated from templating experiments in chloroform due to the high solubility of elacestrant in this solvent. The screening procedure and results are shown in Table 3 and supportive XRPD graphs are provided as Figure S4.
3.2.4. Solvent-Drop Grinding Experiments
Solvent-drop grinding experiments were conducted using crystalline material to further discover new polymorphs. The solid was wetted with a solvent drop and ground in a Fritsch planetary ball mill.
Solvent-drop grinding experiments using 36 solvent systems, including process-relevant solvents (EtOH, EtOAc, MeOH, iPrOAc), did not produce material exhibiting any additional new XRPD patterns. Most samples were not pure forms, and the XRPD diffractograms were a mixture of XRPD patterns, e.g., Pattern A + Form 2/3. Importantly, the desired form, Form 1, was produced by solvent-drop grinding in ethanol. However, grinding in ethyl acetate or isopropyl acetate produced a mixture of Patterns A + Form 2/3, and grinding in methanol produced Pattern E. Therefore, it may be useful to limit the volume of ethyl acetate/isopropyl acetate used in the production of Form 1, to avoid crystallization of undesired forms. The detailed results are shown in Table 4 and supportive XRPD graphs are provided in Figure S5.
3.3. Polymorphic Screening Experiments on Amorphous Elacestrant
Amorphous samples were generated by lyophilization of elacestrant using the procedure in Section 2.5.1. Solubility assessments of amorphous elacestrant showed low solubility in all organic solvents explored, except for benzyl alcohol, ethylene glycol, HFIP, and TFE. In total, 4 different XRPD patterns were identified. Pattern A and Form 3 were observed in several solvents, often as a range of solid-state techniques characterized a mixture and representative crystalline samples of each. Pattern C and Pattern D were only observed in 1 or 2 solvents and may exist as mixtures with other forms. Pattern C was only observed as a mixture with different patterns when starting from amorphous material. HPLC purity analysis of Pattern D material showed significant degradation (~78% purity); therefore, no further analyses were performed on Pattern D material. The polymorphs screening procedure and results are shown in Table 5 and supportive XRPD graphs are in Figure S6.
In summary, new patterns A, B, C, D, E, F, and G were generated throughout the extensive screening process. The most frequently obtained pattern was A, which exhibited thermodynamic behavior similar to Form 1. Pattern C obtained from the Chloroform on one occasion was also tentatively assigned as a dihydrate form, Pattern D generated from dimethyl formamide and benzyl alcohol was found to be a degradant. Pattern E found from the antisolvent addition experiment with methanol (dihydrate form), Pattern F obtained by adding chloroform antisolvent to the solution of ethanol:water (96:4) which assigned as a hemi-hydrate form (poorly crystalline) and Pattern G produced by adding butan-1-ol or 1,2-dichloroethane to a solution of elacestrant in ethanol:water (96:4) which also assigned as a hemi hydrate form shown as Figure 2A and the XRPD of the all-new generated pattern A, B, C, D, E, F, and G shown as Figure 2B.
3.4. Solid State Characterization of the Representative Sample from Generated New Patterns
A representative crystalline sample of Pattern A, B, C, E, F, and G (1,2-dichloroethane, anisole & chloroform, butyronitrile, EtOAc, Chloroform & Butan-1-ol) was characterized by solid-state techniques.
A representative crystalline sample of Pattern A (1,2-dichloroethane) and Form 3 (chlorobenzene & anisole), generated from screening using crystalline and amorphous forms of the elacestrant were characterized by solid-state techniques. The solid-state characterization results of XPRD, NMR, DSC, TGA, IC, HPLC, and 1-week samples of XRPD stability were compared to the characteristics of Form (2/3) and Form 1. Pattern A material exhibited the highest melt (225-226 °C, onset) and was similar to but less crystalline than Form 1 (anhydrous, ‘desired form). Pattern B was similar to Form 3 (hydrate) and contained ~5% wt. water (~ 2 mol eq.) but differed subtly by XRPD. Pattern C was only observed in chloroform and was non-solvated but had a significant water content (5.2% wt, ~ 2 mol eq.). It can be concluded that Pattern A shows the behavior of Form 1, Pattern B is a hydrate and is Form 3, and Pattern E showed water loss, assigned as a dihydrate form as shown in Table 6A.

Table 6.
(A): Solid-state characterization data for crystalline samples of Patterns A, B, C and D compared to Form 1.
Table 6.
(A): Solid-state characterization data for crystalline samples of Patterns A, B, C and D compared to Form 1.
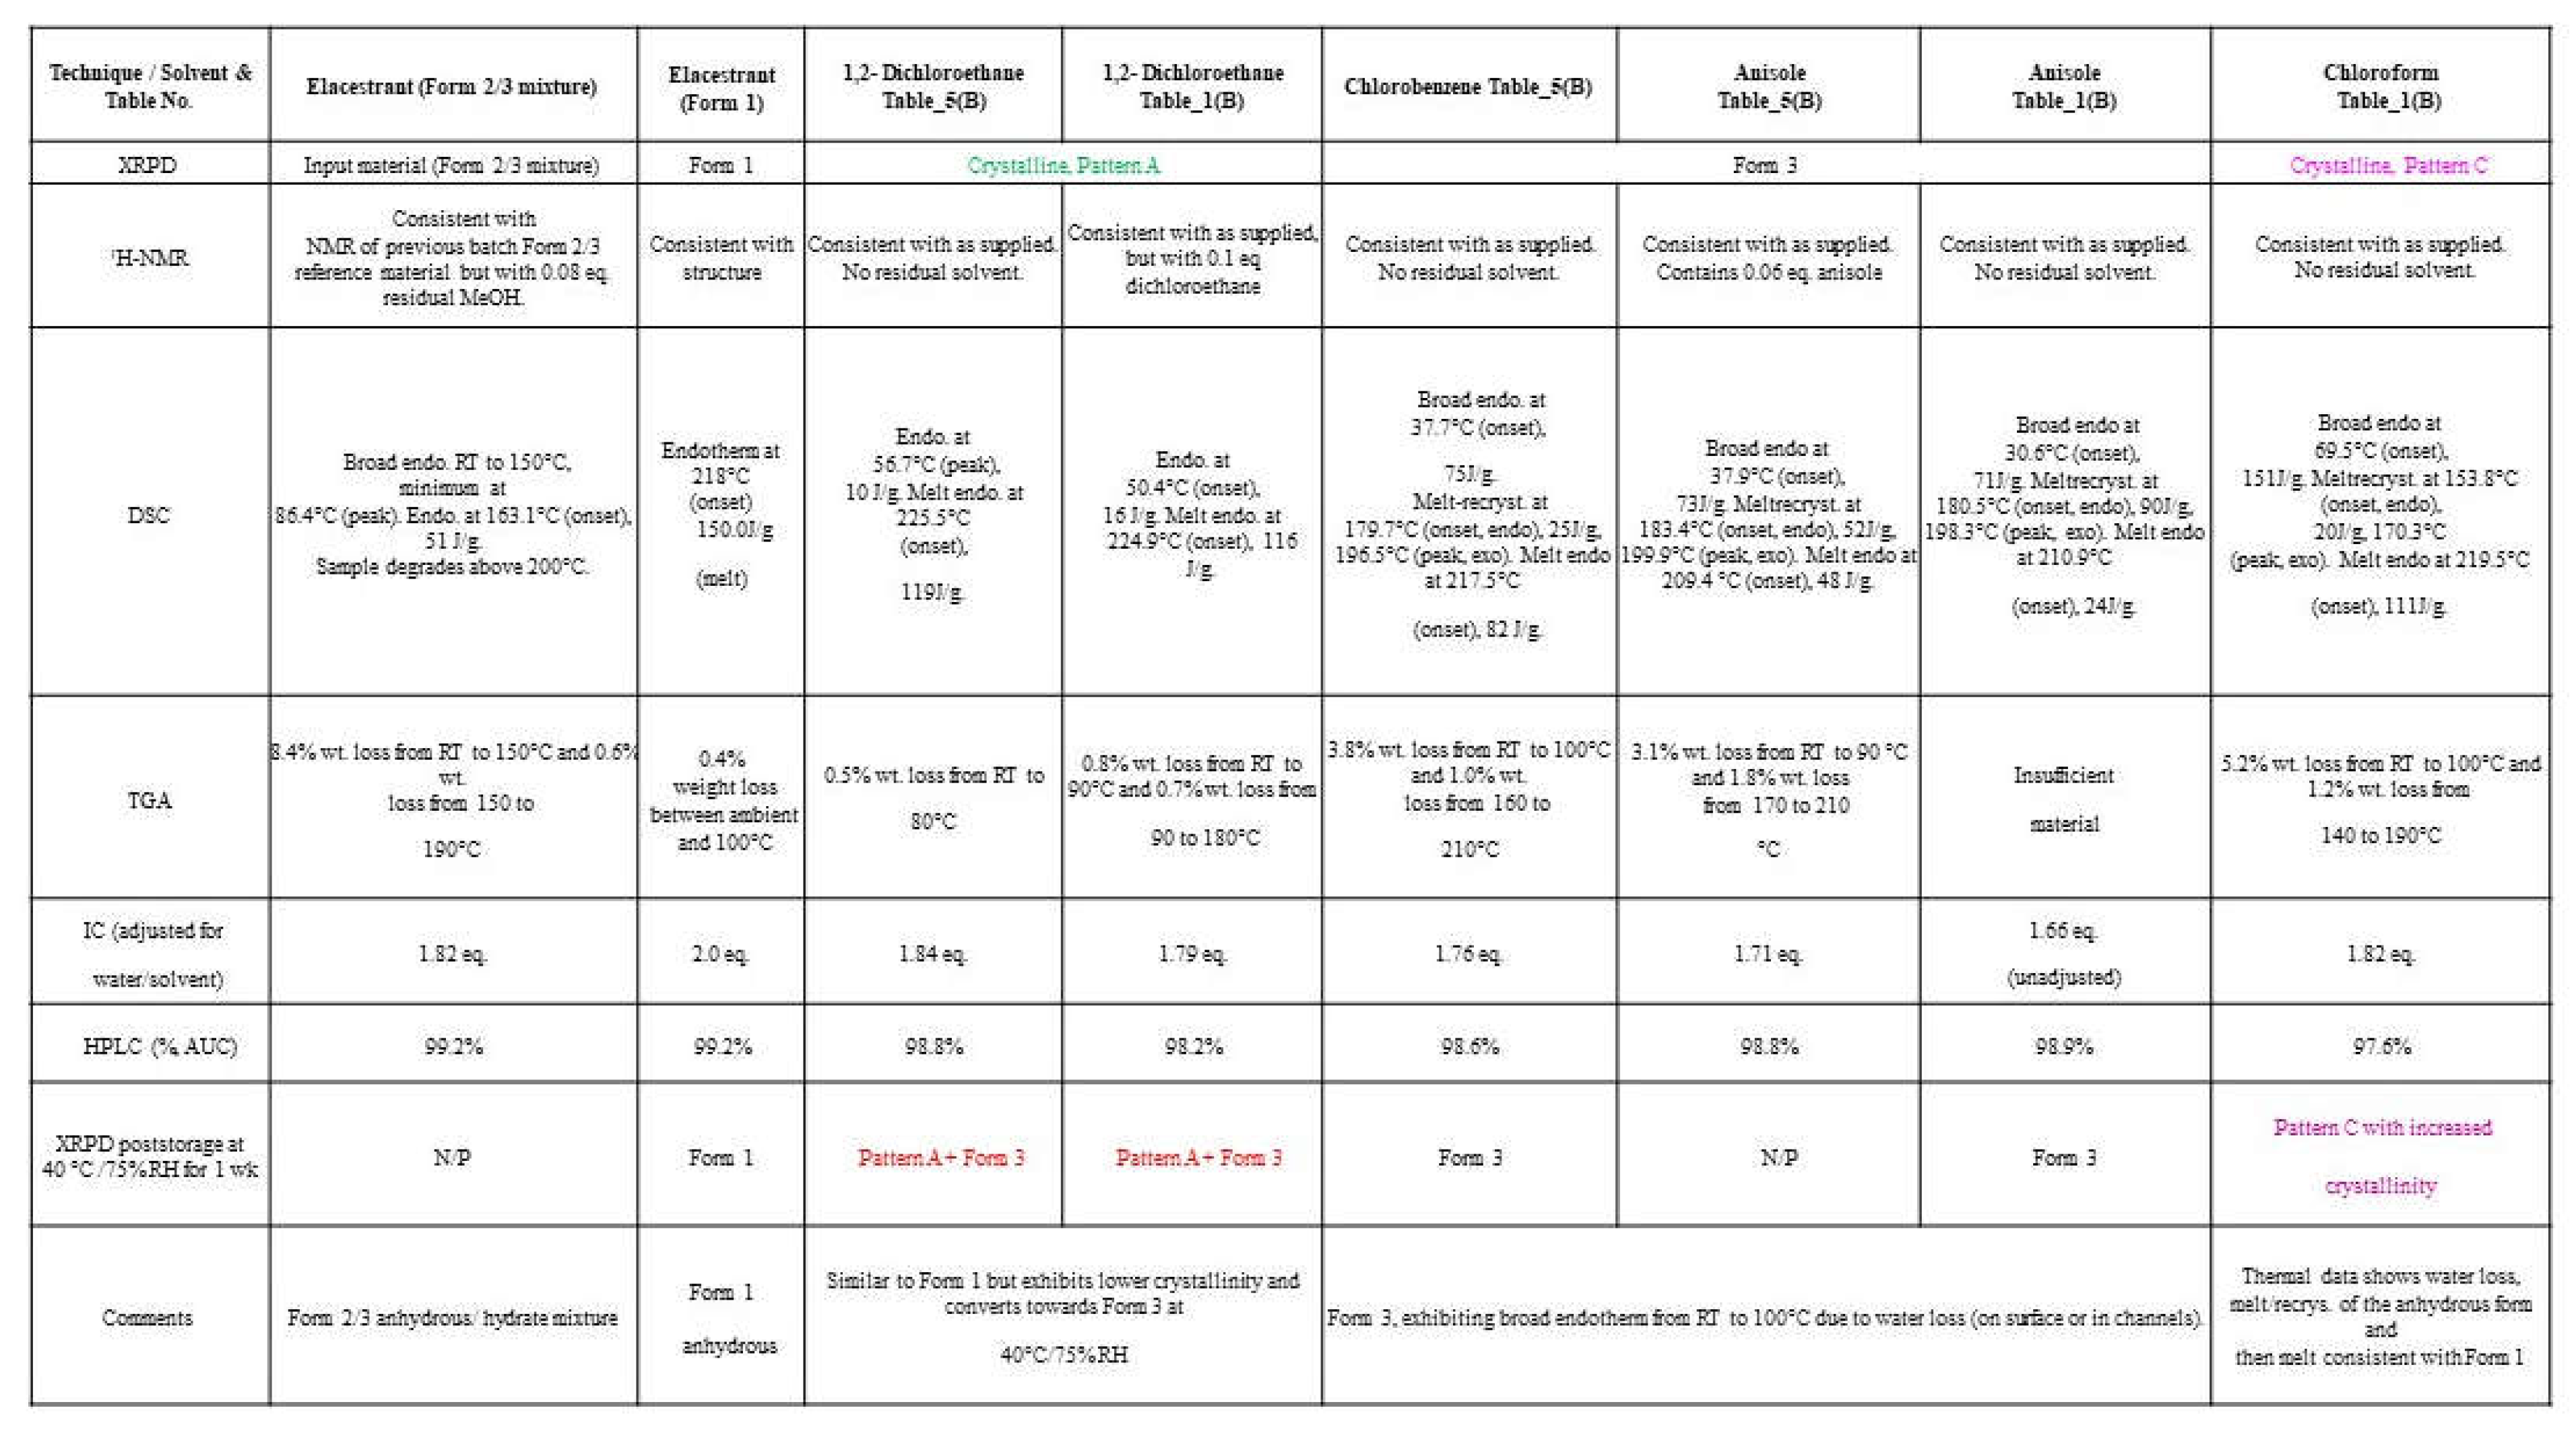 |
Table 6.
(B): Solid-state characterization data for crystalline samples of Patterns B, E, F and G, compared to Form 1.
Table 6.
(B): Solid-state characterization data for crystalline samples of Patterns B, E, F and G, compared to Form 1.
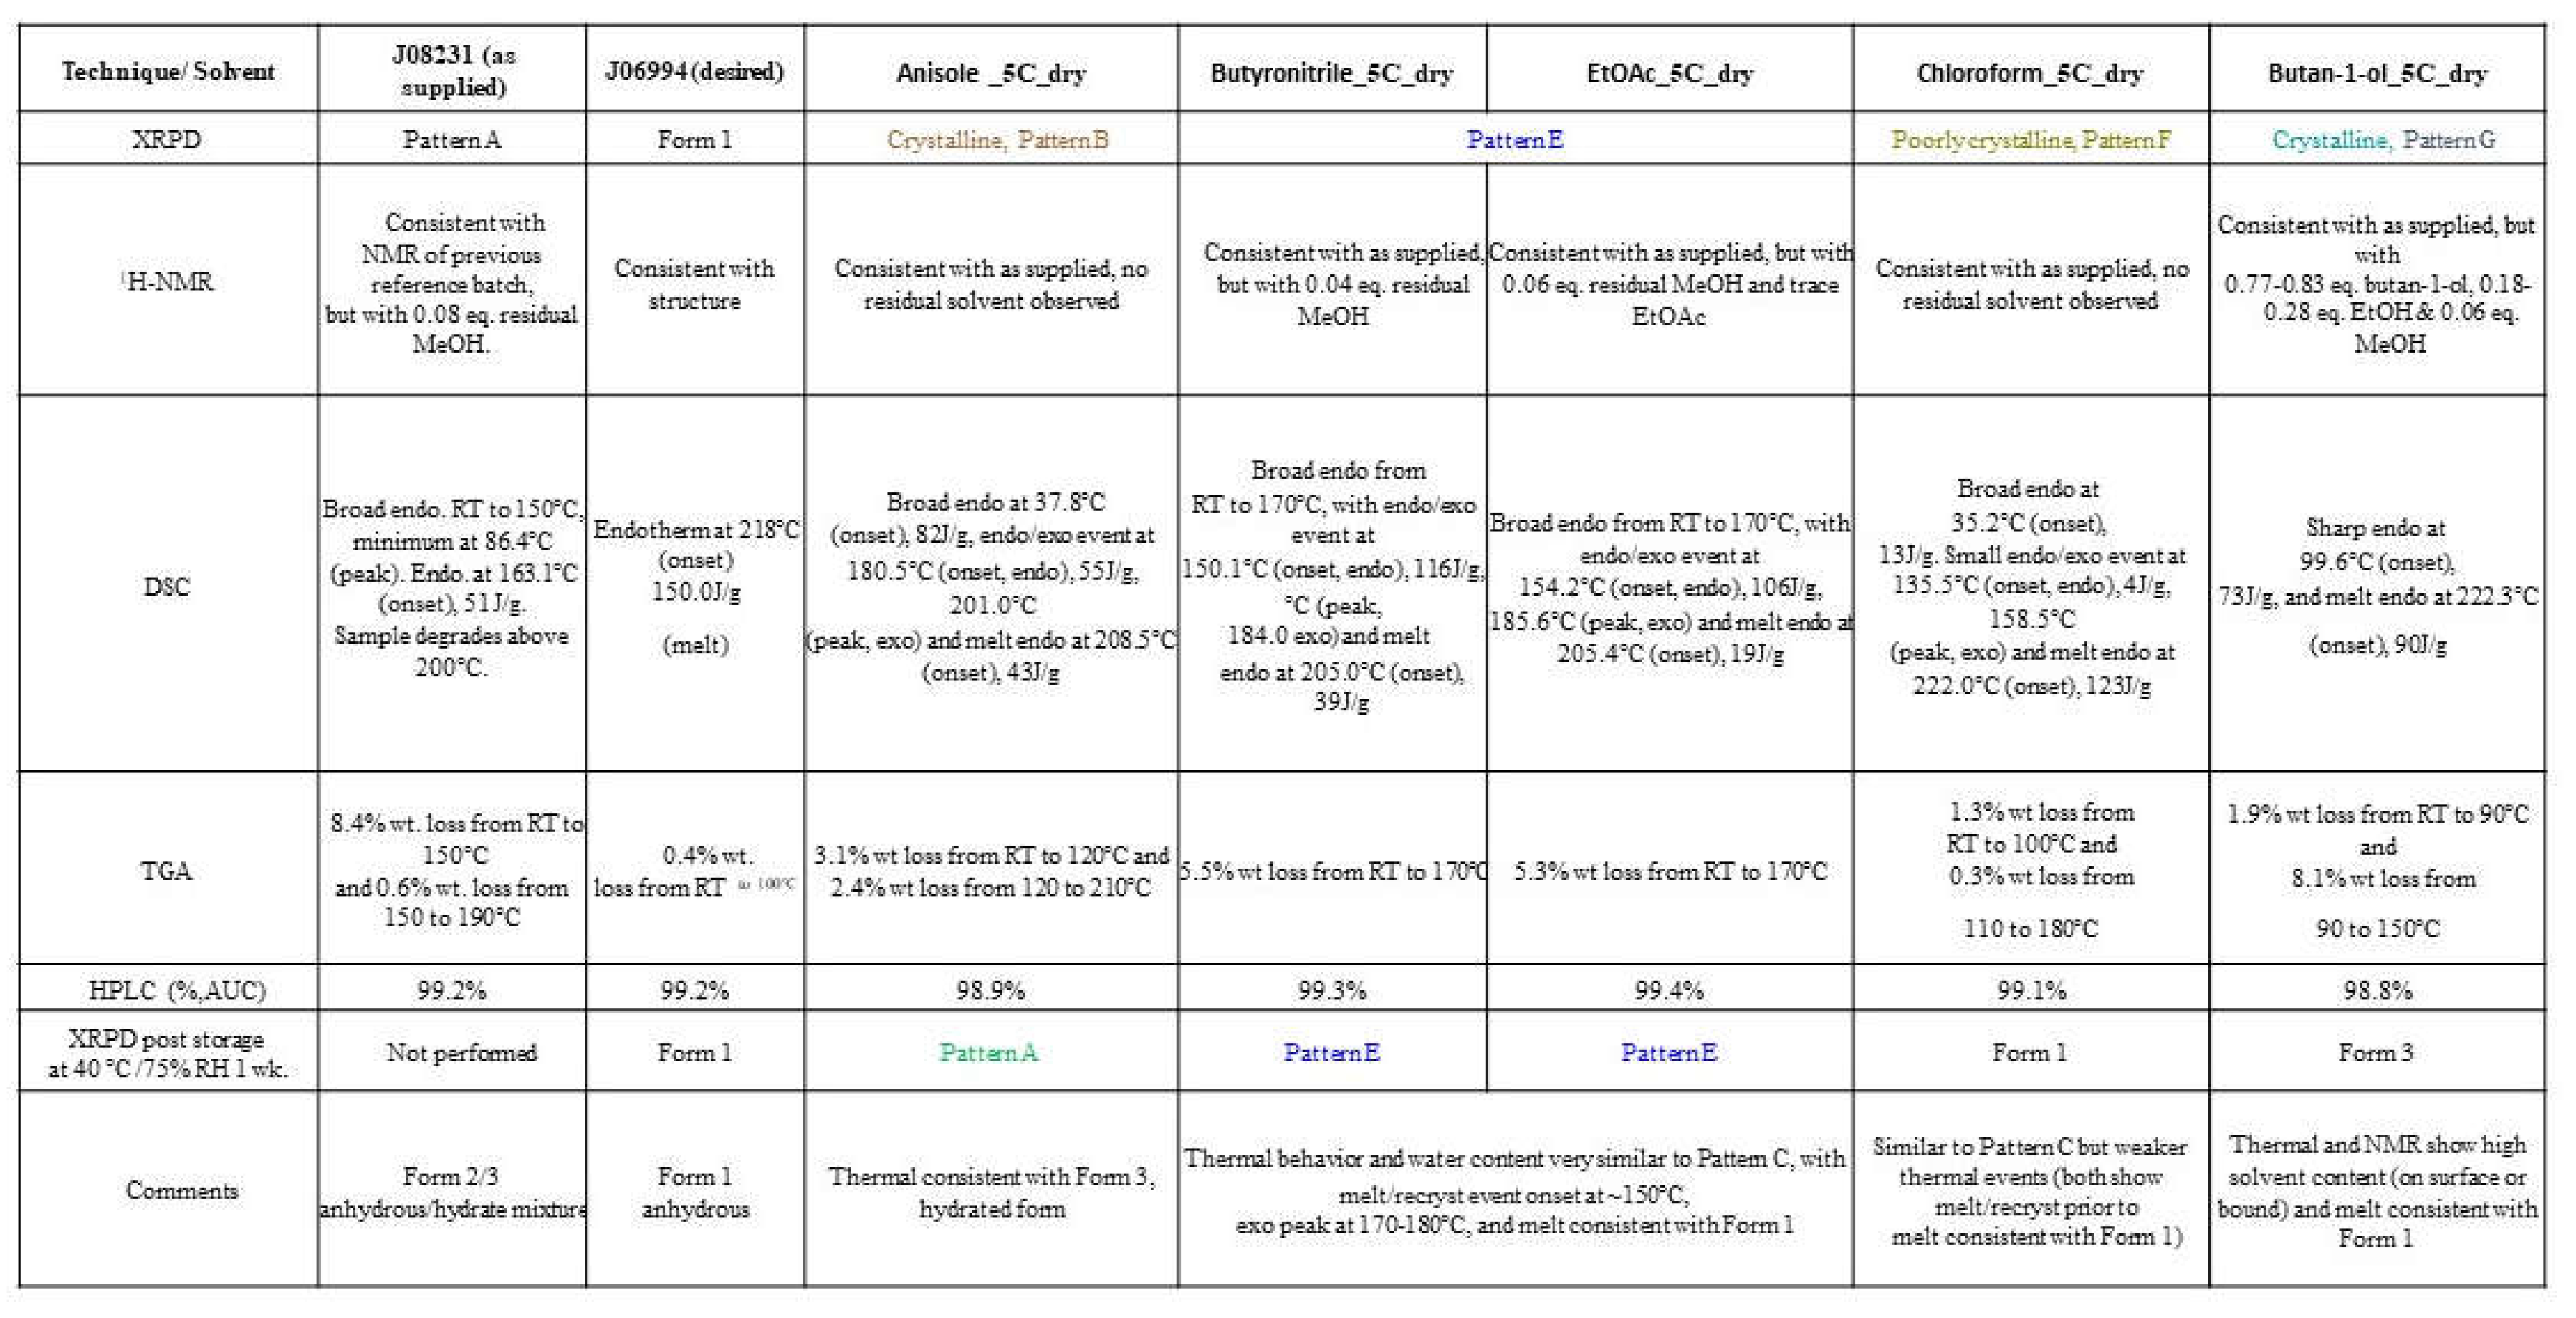 |
A representative crystalline sample of Patterns B (anisole), E (butyronitrile & EtOAc), F (chloroform), and G (butan-1-ol), which were generated from the antisolvent addition experiments and characterized by solid-state techniques. The solid-state characterization results of XPRD, NMR, DSC, TGA, HPLC, and 1-week samples XRPD stability were compared to the characteristics along with Form (2/3) as well as Form 1. Pattern B materials were consistent with Form 3 (hydrate) and contained ~5% wt. water (~ 2 mol eq.) but differed subtly by XRPD. Pattern E contained ~5.5% water (~ 2 mol eq.) and residual methanol. Pattern F was only obtained in chloroform/ ethanol: water (96:4) (antisolvent:solvent ratio 5:1) and exhibited similar thermal events and XRPD to Pattern E but showed a mass loss of 1.6% by TGA (equating to ~ 0.5 mol eq. water). Pattern G was observed only in butane-1-ol or butyronitrile/ ethanol:water (96:4) (5:1) and only showed thermal events relating to solvent loss prior to a melt consistent with Form 1. It can be concluded that Pattern B shows the same thermal behavior as Form 3. Pattern E thermal behavior and water content as similar to Pattern C, with melt/request event onset at ~150°C, exothermic peak at 170-180°C, and melt consistently with Form 1. Pattern F is similar to Pattern C but has weaker thermal events (both show melt/recrystallization event followed by a melt that is consistent with Form 1. Pattern G thermal and NMR show high solvent content (on surface or bound) and melt consistent with Form 1 as given in Table 6B.
Thermal analysis of Patterns B, C, D, E, and F all showed an endothermic-exothermic. event (at onset between 136 and 184 °C), indicating a form conversion, prior to melting at 205-222 °C (onset). This melt is consistent with Form 1 or Pattern A and suggests that these materials convert to Form 1 or Pattern A prior to melting. Pattern G does not show an endothermic-exothermic event, but after desolvation, the material melts at 222 °C (onset).
4. Conclusions
A total of 6 new XRPD patterns/polymorphs were identified from all screening experiments, denoted as Pattern A, B, C, E, F, and G in addition to the starting material. Pattern D, initially considered a new crystalline material, was later confirmed as a degradant. Pattern A exhibited behavior similar to Form 1, while Pattern B was identified as the hydrate of Form 3. Pattern C, with water loss, was assigned as a dihydrate form. Thermal analysis of Patterns B, C, E, F, and G indicated an endothermic-exothermic event (136-184 °C) before melting (205-222 °C), consistent with Form 1 or Pattern A. Pattern G, lacking the endothermic-exothermic event, melted at 222 °C after desolvation. Solid-state characterization led to the selection of Patterns A, C, and E as suitable candidates for potential commercialization. A summary of our findings is presented in Figure 3.
Supplementary Materials
The following supporting information can be downloaded at the website of this paper posted on Preprints.org. Figure S1: (A) NMR of starting material (B). TGA & DSC of starting material. Figure S2: (I) -(VII): XRPD diffractograms of solids obtained after 50 °C / RT maturation or cooling of crystalline material in different solvents. XRPD diffractograms are shown for ‘damp’, then ‘dry’ samples. Figure S3: (I): XRPD of solids obtained at 50 °C upon anti-solvent,(II) - (VII): . XRPD solids obtained at 5 °C upon anti-solvent are shown damp, then dry. Figure S4: I. XRPD of solids obtained after polymer templating experiments_ EtOH (4% aq.), (II) - (III): . XRPD of solids obtained after polymer templating experiments_ MeOH (IV):.XRPD of solids obtained after polymer templating experiments_ Chloroform. Figure S5: (I) - (IV): XRPD of solids obtained after solvent-drop grinding experiments. Figure S6: (I) - (VIII): XRPD diffractograms of solids obtained after cooling or maturation of Amorphous material in different solvents. XRPD diffractograms are shown for ‘damp’, then ‘dry’ samples.
Funding
Funds for this study were provided by Stemline Therapeutics, Inc, A Menarini Group Company. VG was supported by a research contract grant by Stemline Therapeutics, Inc, A Menarini Group Company. ZUM was supported by a teaching assistantship from College of Pharmacy & Health Sciences, St. John’s University.
Conflicts of Interest
Authors report no conflict of interest.
References
- Hoy, S.M. Elacestrant: First Approval. Drugs. 2023, 83, 555–561. [Google Scholar] [CrossRef]
- Research C for DE and. FDA approves elacestrant for ER-positive, HER2-negative, ESR1-mutated advanced or metastatic breast cancer. FDA [Internet]. 2023 Jan 27 [cited 2023 Dec 4]; Available from: https://www.fda.gov/drugs/resources-information-approved-drugs/fda-approves-elacestrant-er-positive-her2-negative-esr1-mutated-advanced-or-metastatic-breast-cancer.
- ER+/HER2- ESR1m mBC Treatment | ORSERDUTM (elacestrant) [Internet]. [cited 2023 Dec 4]. Available from: https://www.orserdu.com/.
- 074802s038lbl.pdf [Internet]. [cited 2023 Nov 19]. Available from: https://www.accessdata.fda.gov/drugsatfda_docs/label/2014/074802s038lbl.pdf.
- Hilfiker R, Raumer M von. Polymorphism in the Pharmaceutical Industry: Solid Form and Drug Development. John Wiley & Sons; 2019. 512 p.
- Gardner CR, Walsh CT, Almarsson Ö. Drugs as materials: Valuing physical form in drug discovery. Nat Rev Drug Discov. 2004, 3, 926–934. [Google Scholar] [CrossRef] [PubMed]
- Aguiar, A.J.; Krc, J.; Kinkel, A.W.; Samyn, J.C. Effect of polymorphism on the absorption of chloramphenicol from chloramphenicol palmitate. J Pharm Sci. 1967, 56, 847–853. [Google Scholar] [CrossRef]
- Lee, E.H. A practical guide to pharmaceutical polymorph screening & selection. Asian J Pharm Sci. 2014, 9, 163–175. [Google Scholar]
- Wiley.com [Internet]. [cited 2023 Dec 5]. Polymorphism in the Pharmaceutical Industry: Solid Form and Drug Development | Wiley. Available from: https://www.wiley.com/en-us/Polymorphism+in+the+Pharmaceutical+Industry%3A+Solid+Form+and+Drug+Development-p-9783527340408.
- Griesser, U.; Stowell, J. Solid-state analysis and polymorphism, in Pharmaceutical Analysis (eds D.C. Lee ML Webb. 2003 Jan 1;240–94.
- Brittain, HG. Polymorphism in Pharmaceutical Solids. CRC Press; 2018. 654 p.
- Lee AY, Myerson AS, Erdemir D, editors. Handbook of Industrial Crystallization. In: Handbook of Industrial Crystallization [Internet]. 3rd ed. Cambridge: Cambridge University Press; 2019 [cited 2023 Dec 5]. p. i–ii. Available from: https://www.cambridge.org/core/books/handbook-of-industrial-crystallization/handbook-of-industrial-crystallization/8D5743015690D66269CCD7A18452E72A.
- Blatter F, Szelagiewicz M, Raumer MV. Process for the parallel detection of crystalline forms of molecular solids [Internet]. WO2005037424A1, 2005 [cited 2023 Dec 6]. Available from: https://patents.google.com/patent/WO2005037424A1/en.
Figure 1.
(A) XRPD of Elacestrant Dihydrochloride (Form 2/3), Forms 1, 2 and 3, (B) Characterization of the starting materials.
Figure 1.
(A) XRPD of Elacestrant Dihydrochloride (Form 2/3), Forms 1, 2 and 3, (B) Characterization of the starting materials.
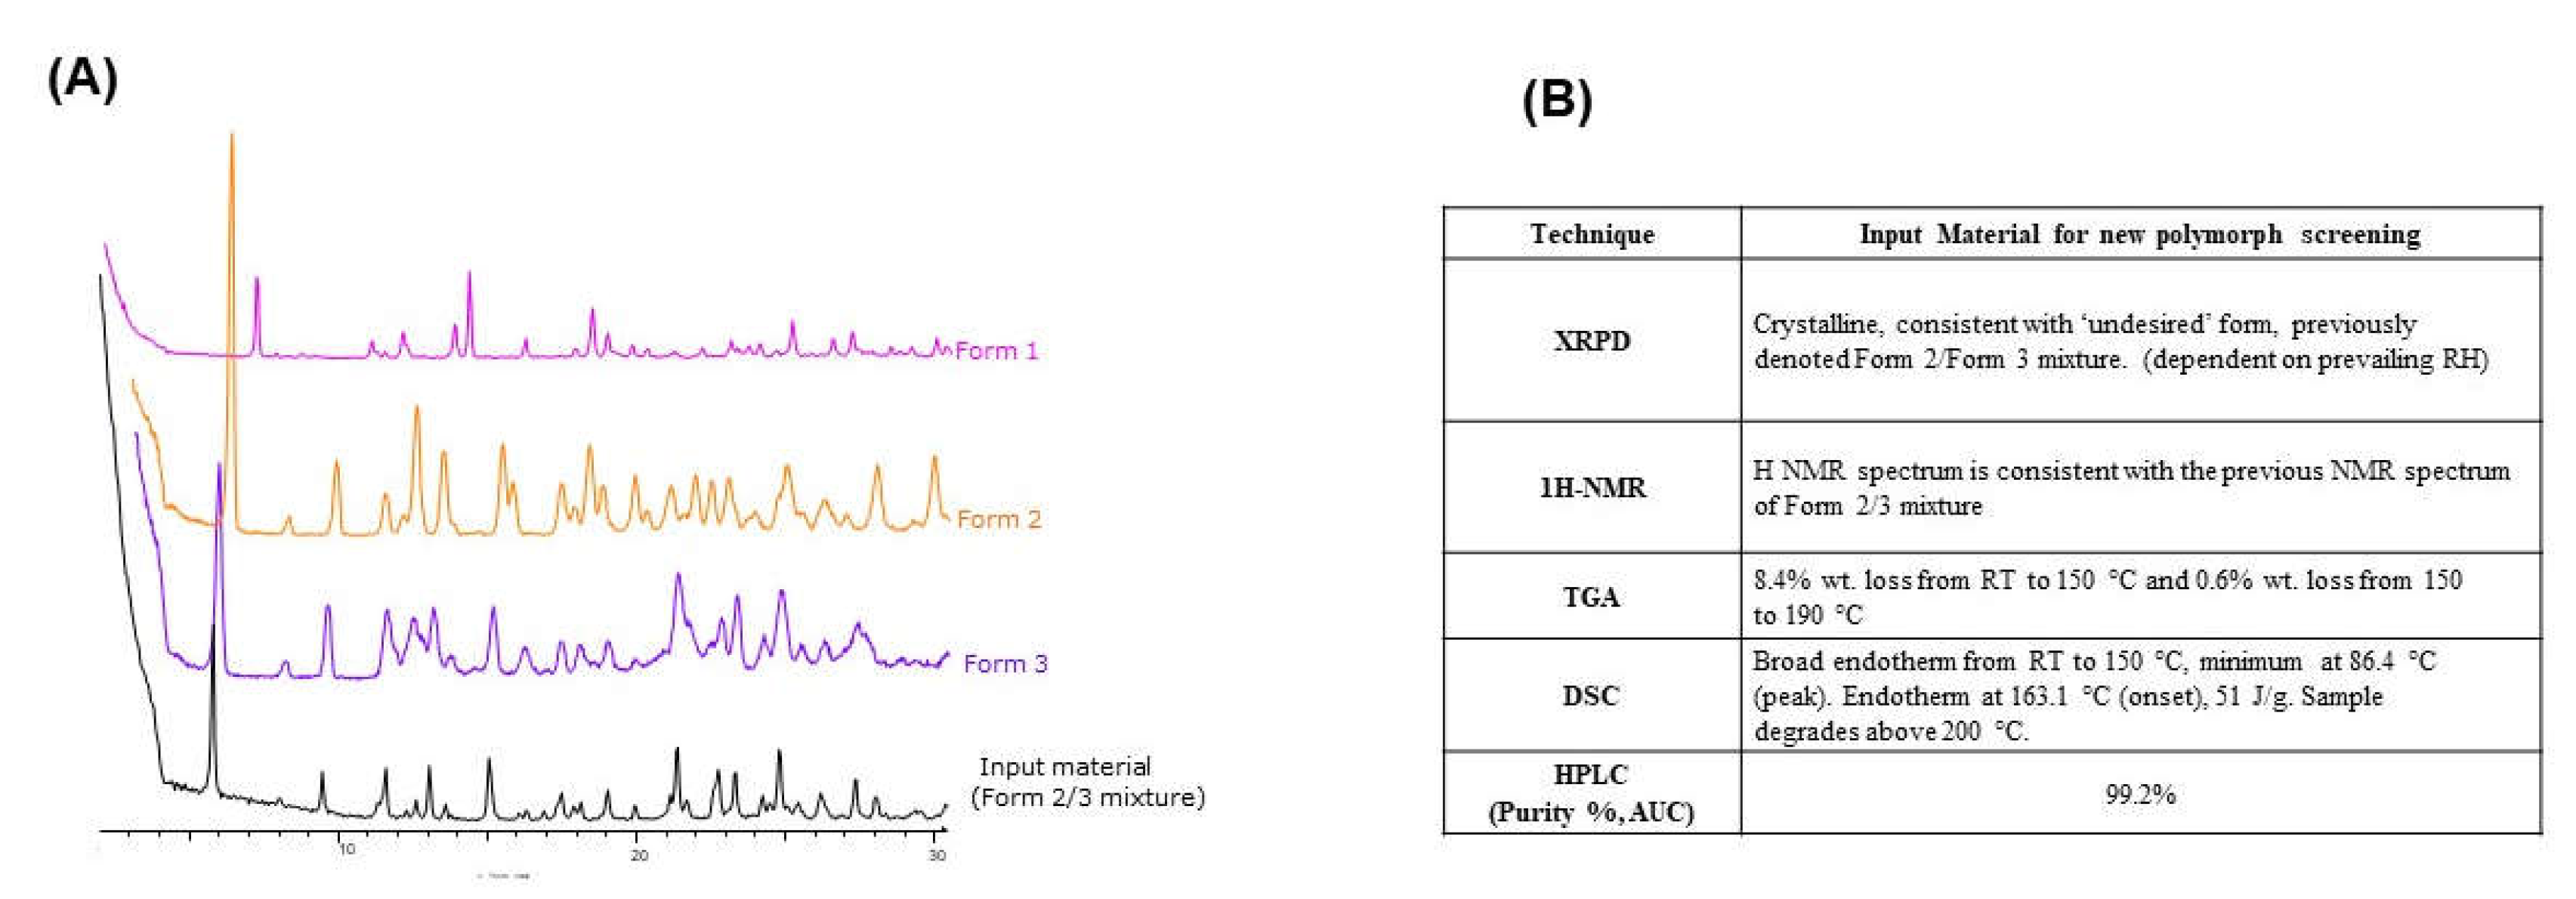
Figure 2.
(A) Summary of generated new patterns, (B) XRPD of generated new patterns.
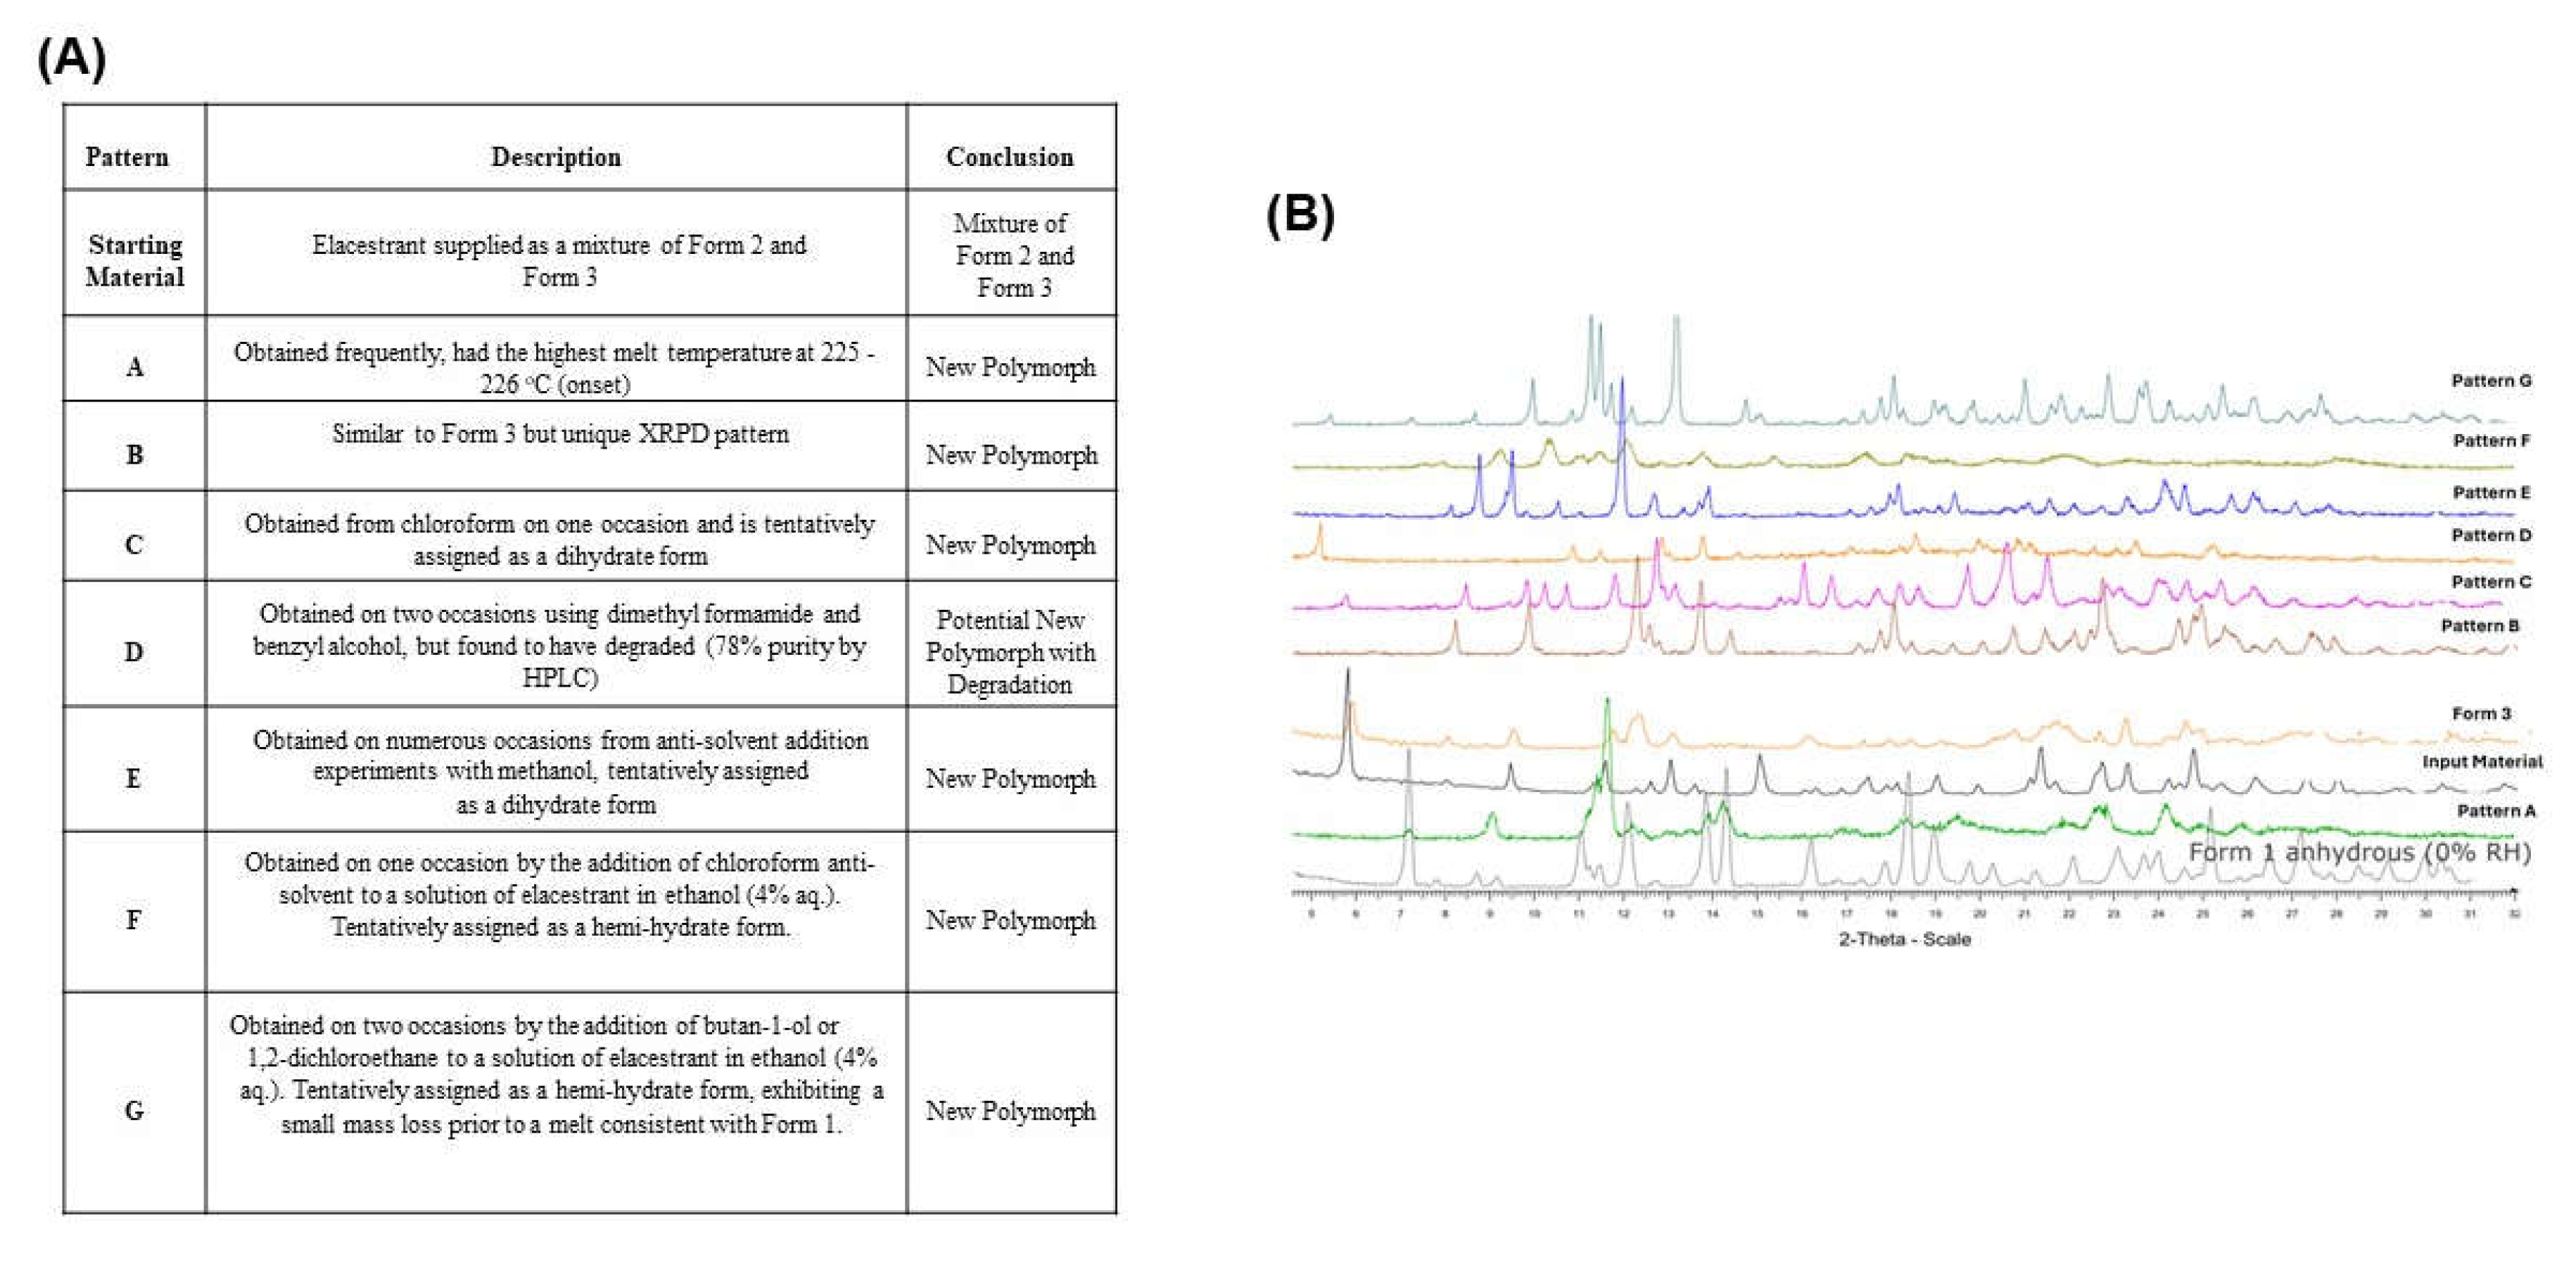
Figure 3.
Process diagram and summary of generated polymorphs.
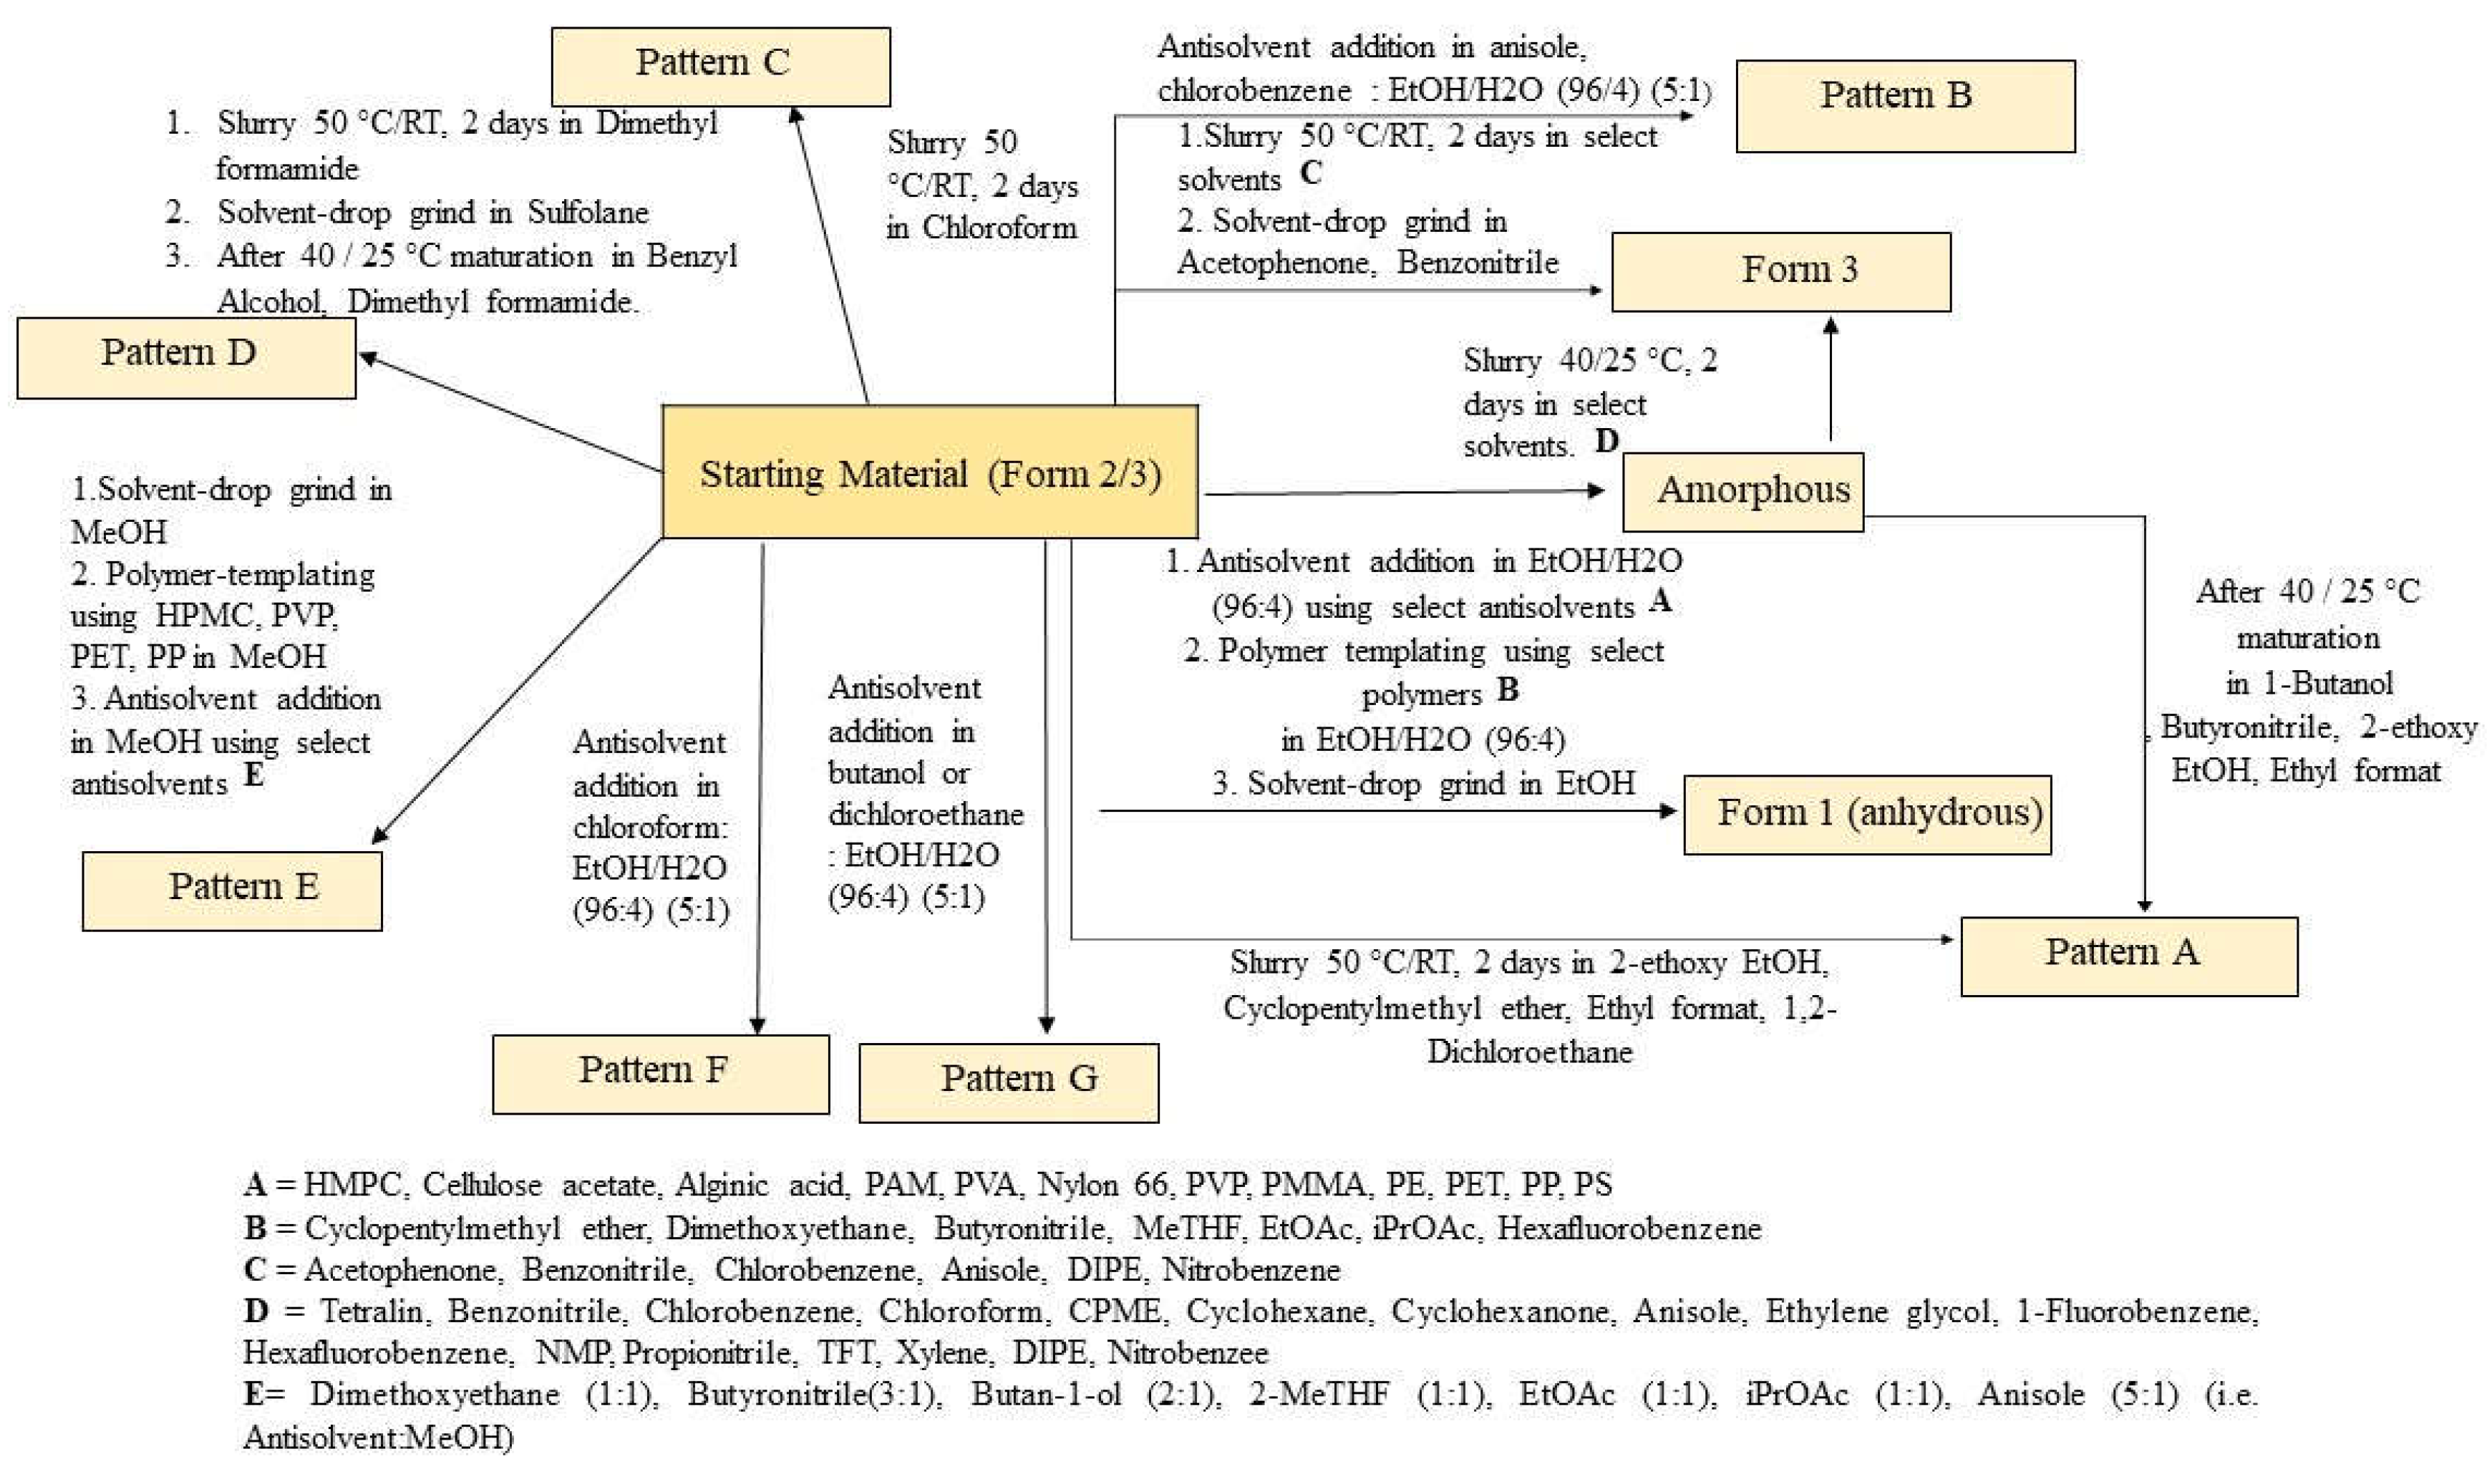
Table 1.
(A): Solubility assessment of Crystalline form by using different solvents.
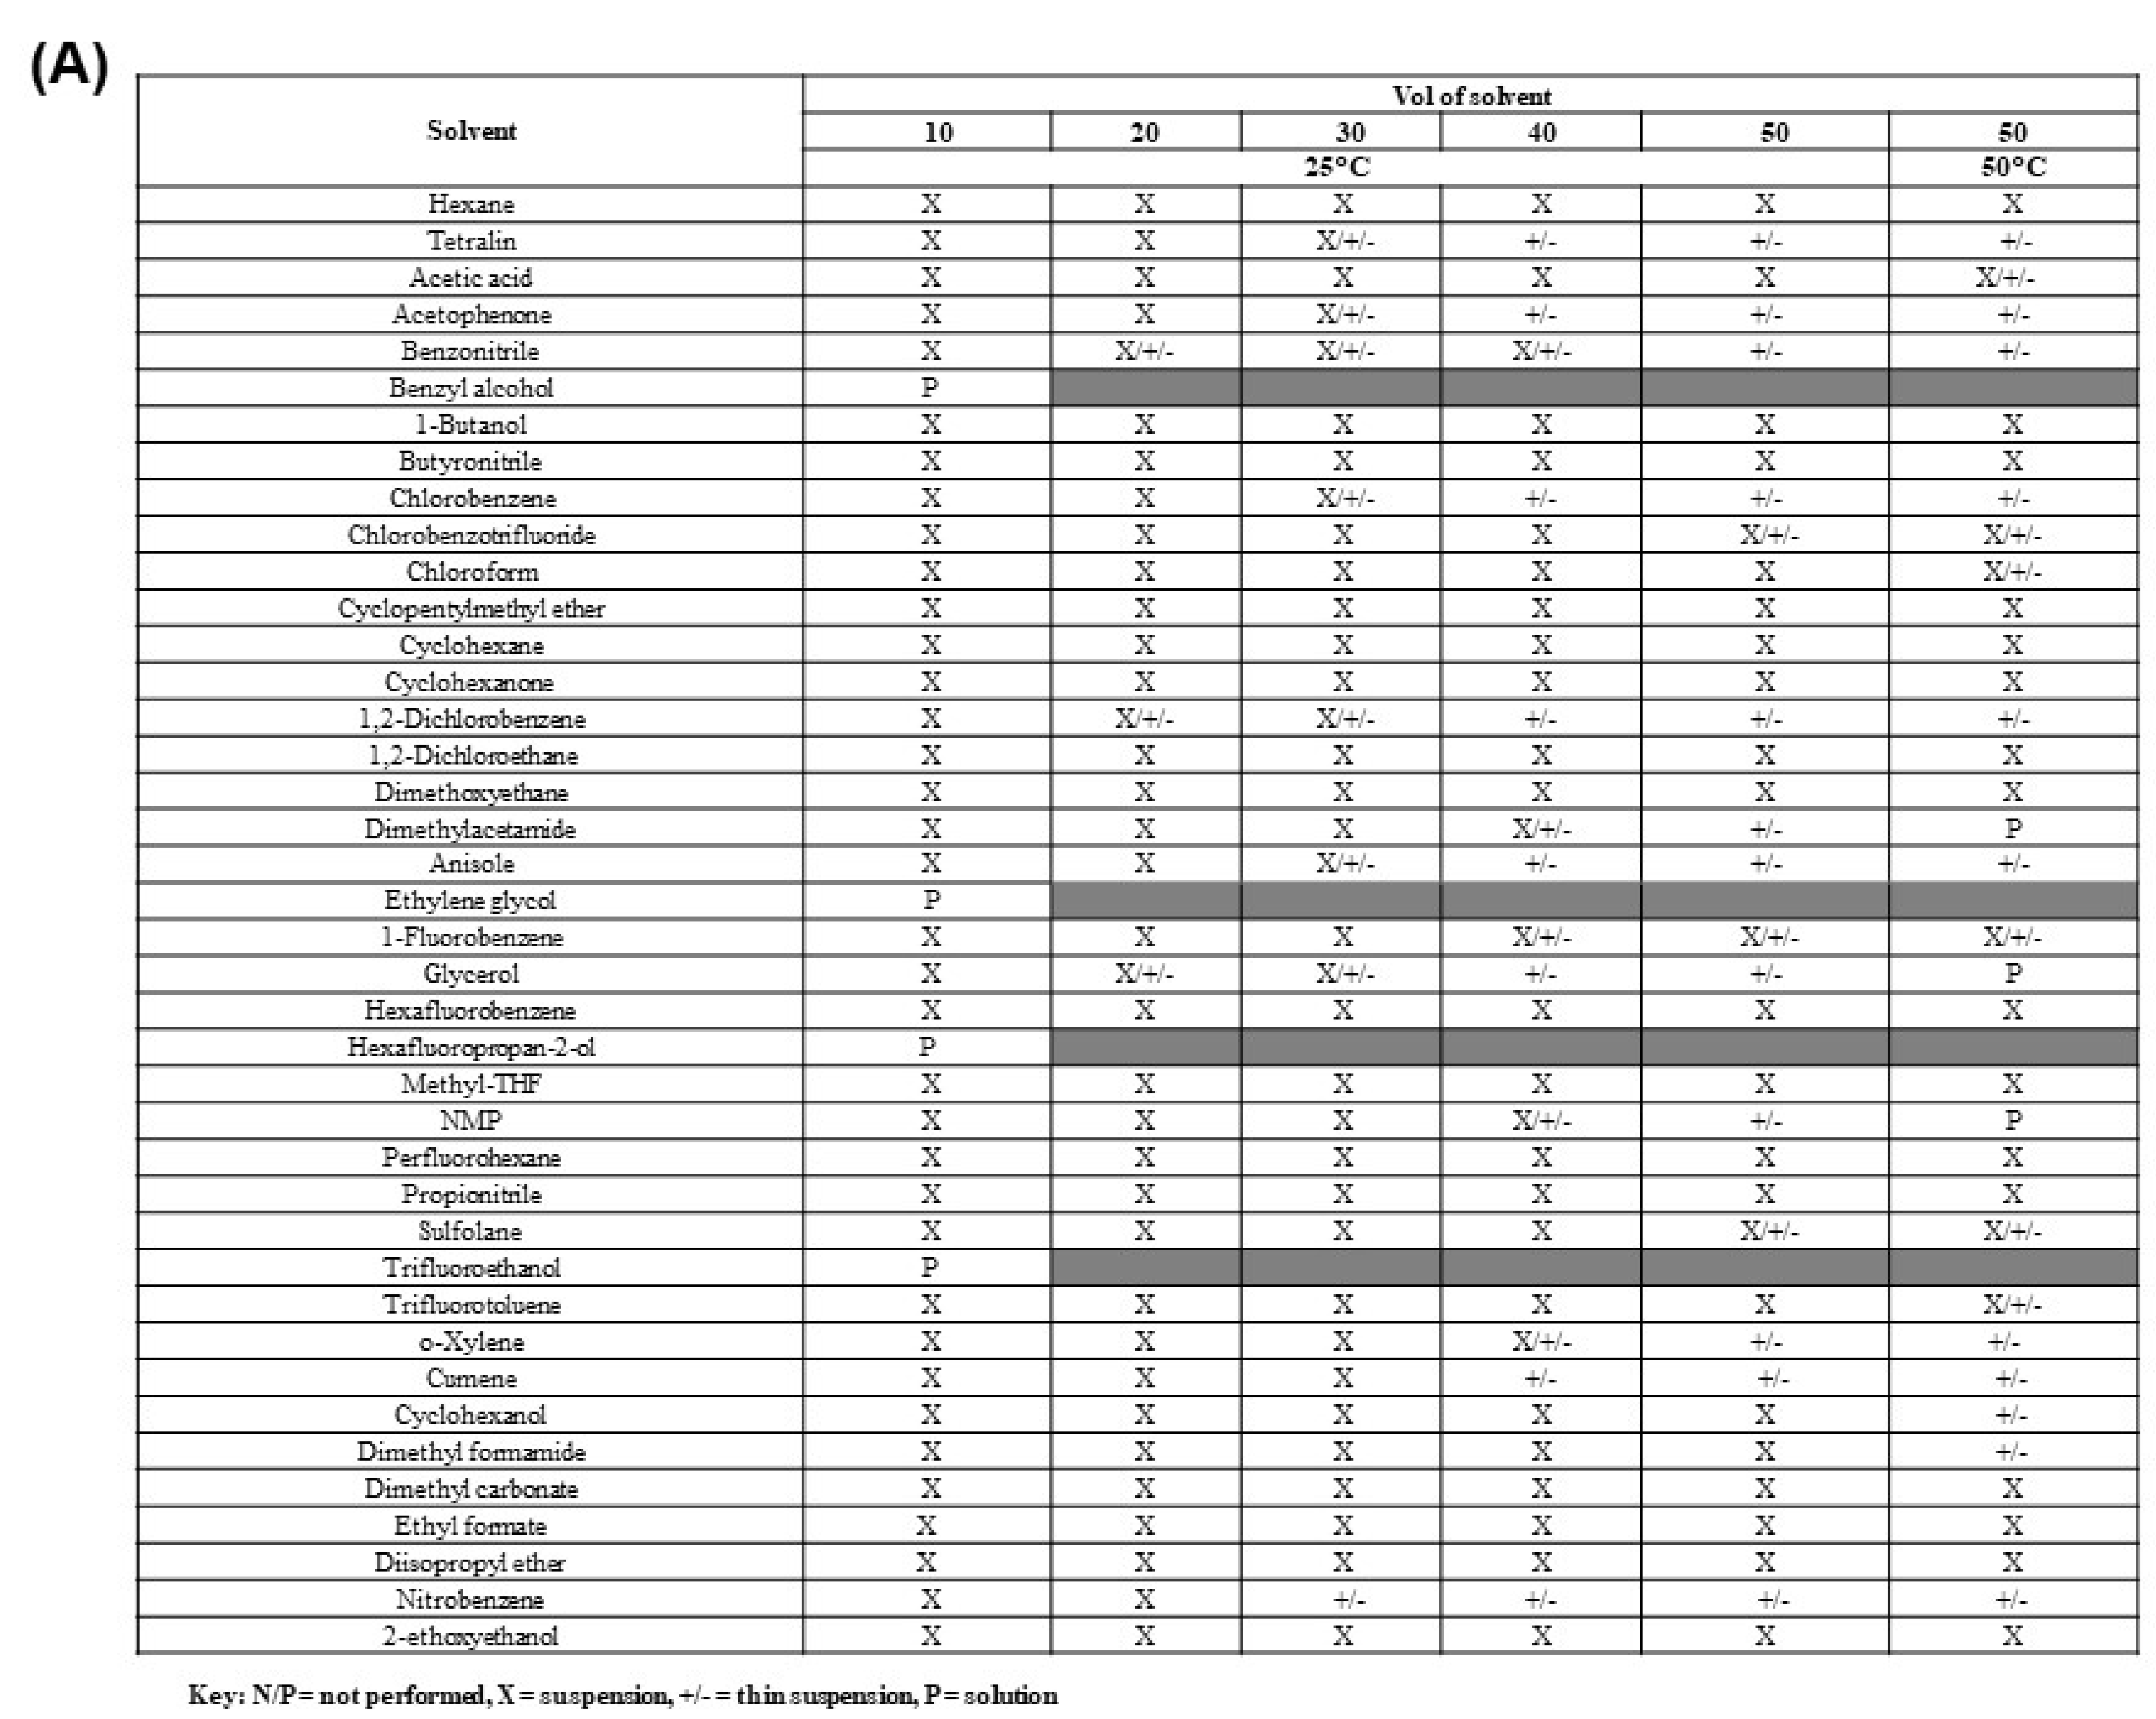 |
Table 1.
(B) Polymorph screening experiments on samples of crystalline material post-solubility assessment.
Table 1.
(B) Polymorph screening experiments on samples of crystalline material post-solubility assessment.
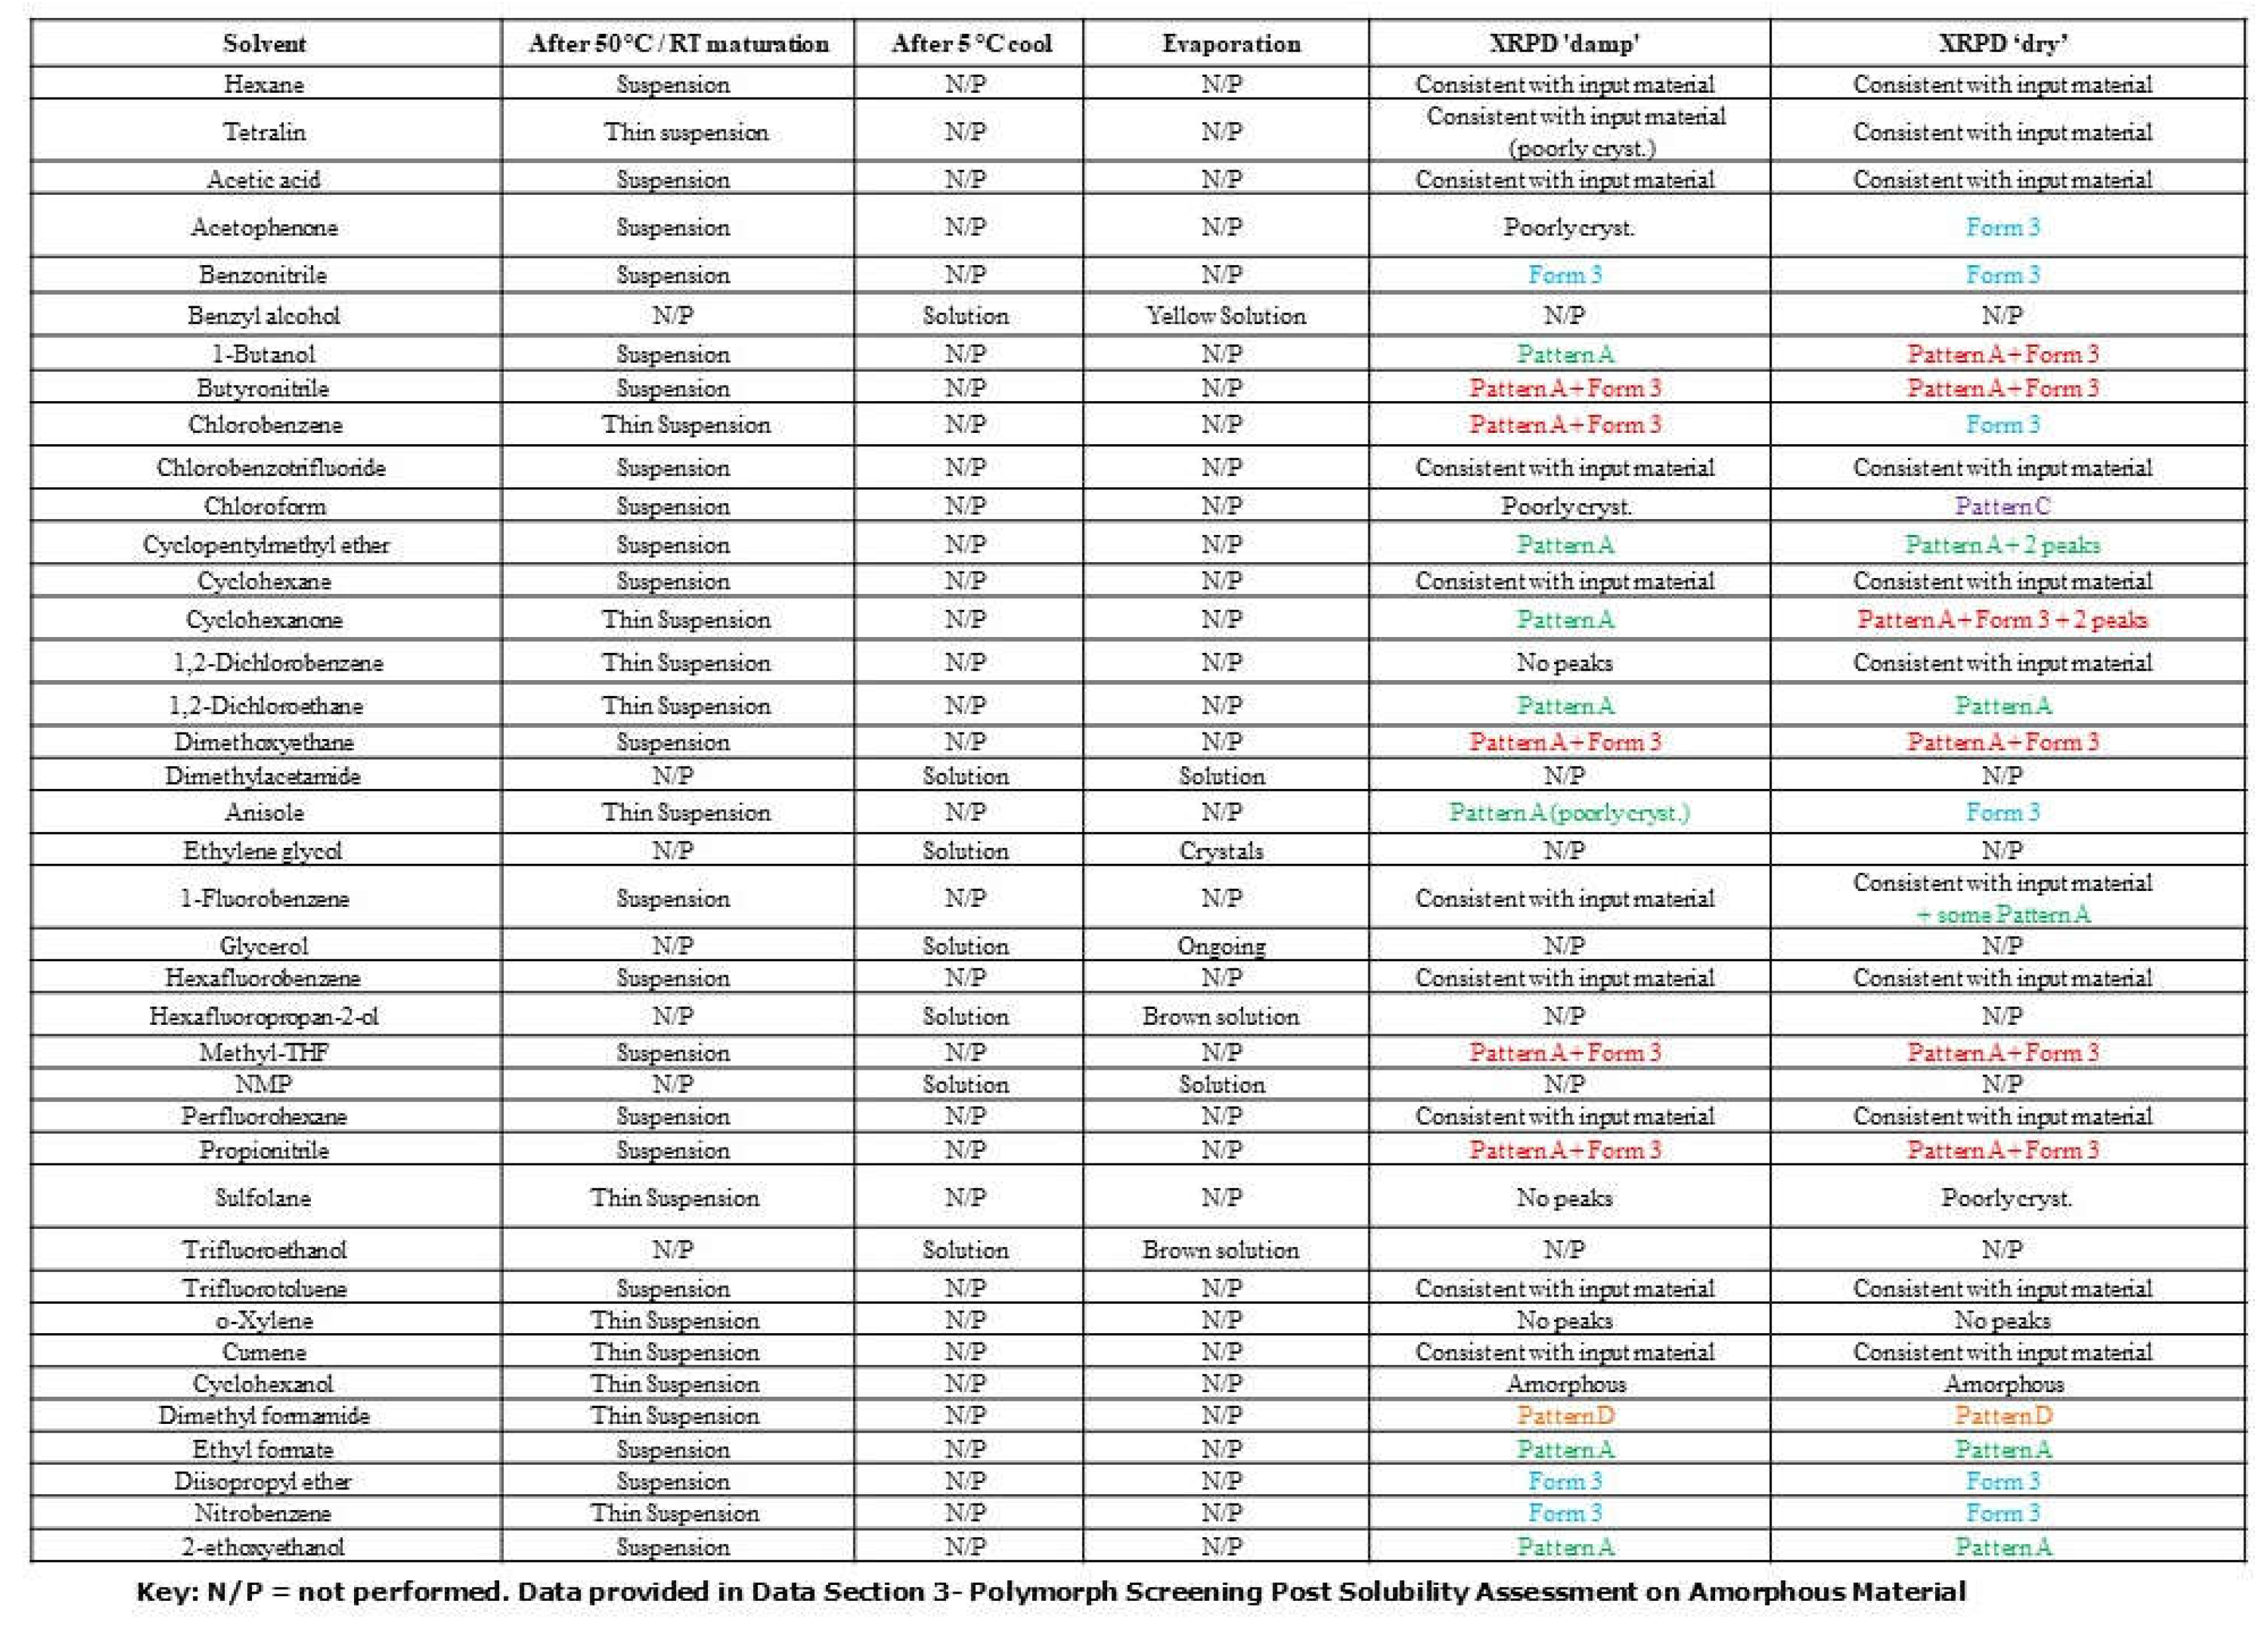 |
Table 2.
Anti-solvent addition experiments using crystalline material.
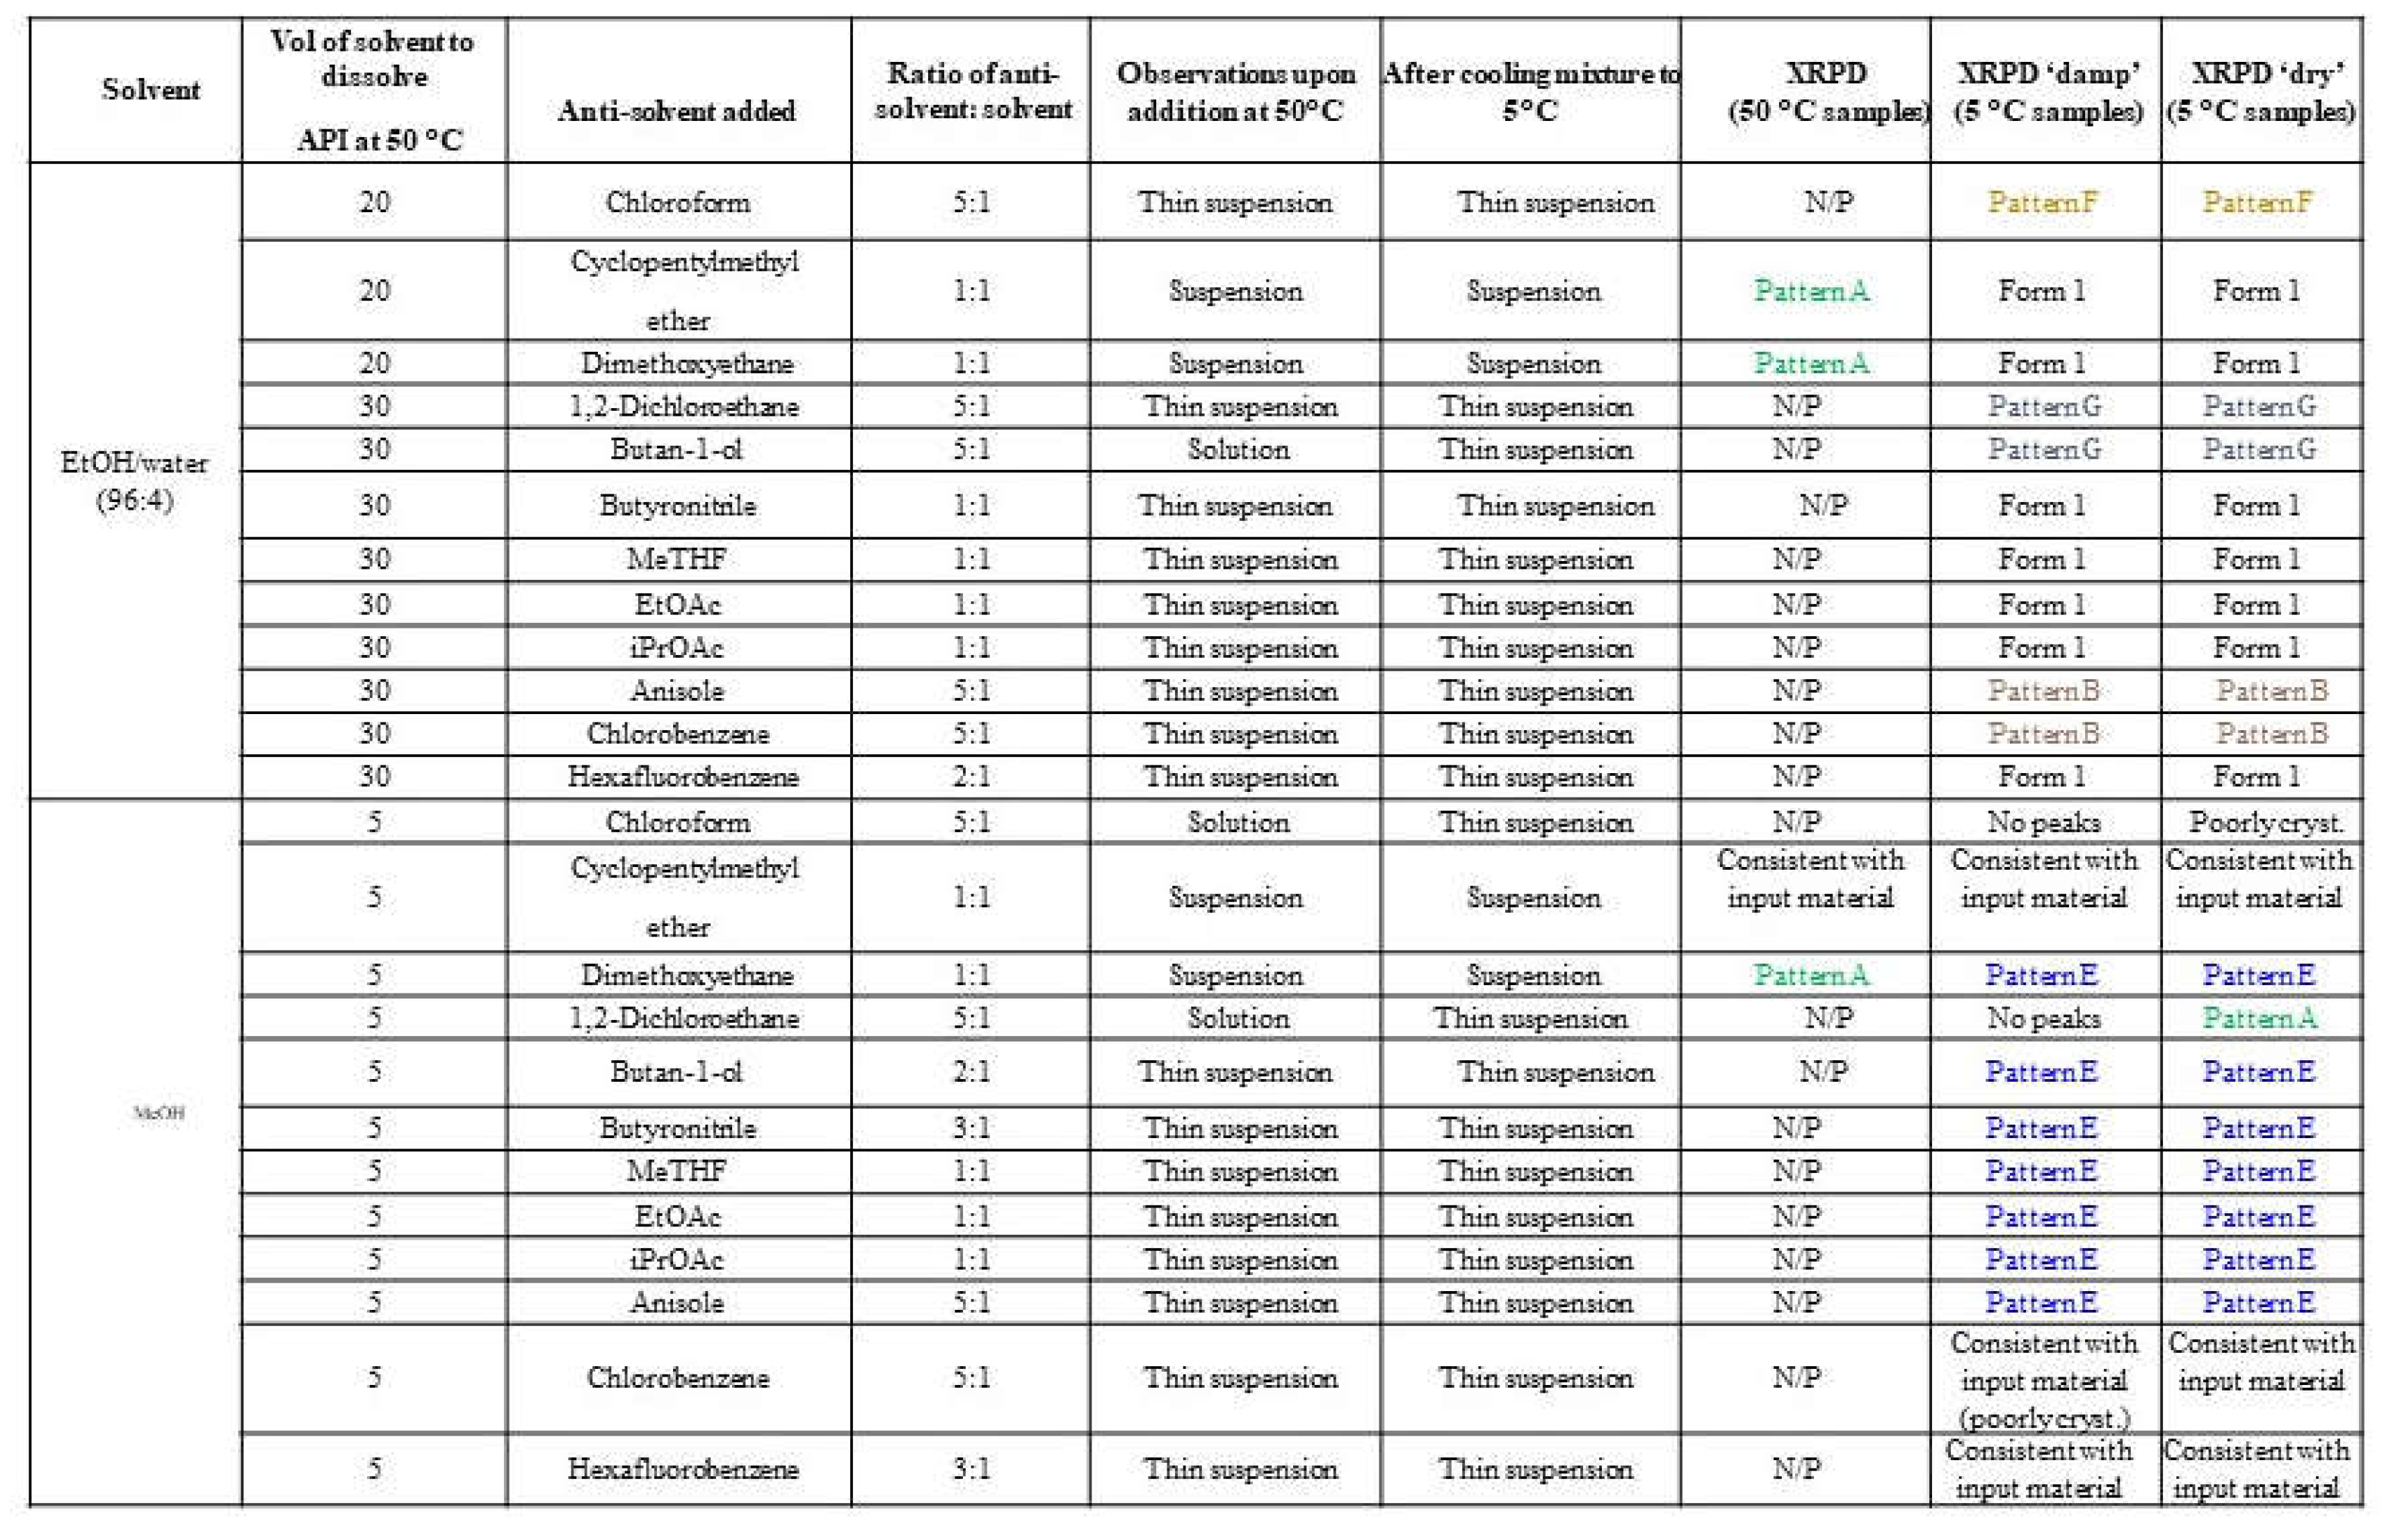 |
Table 3.
Polymer template crystallization using the crystalline material.
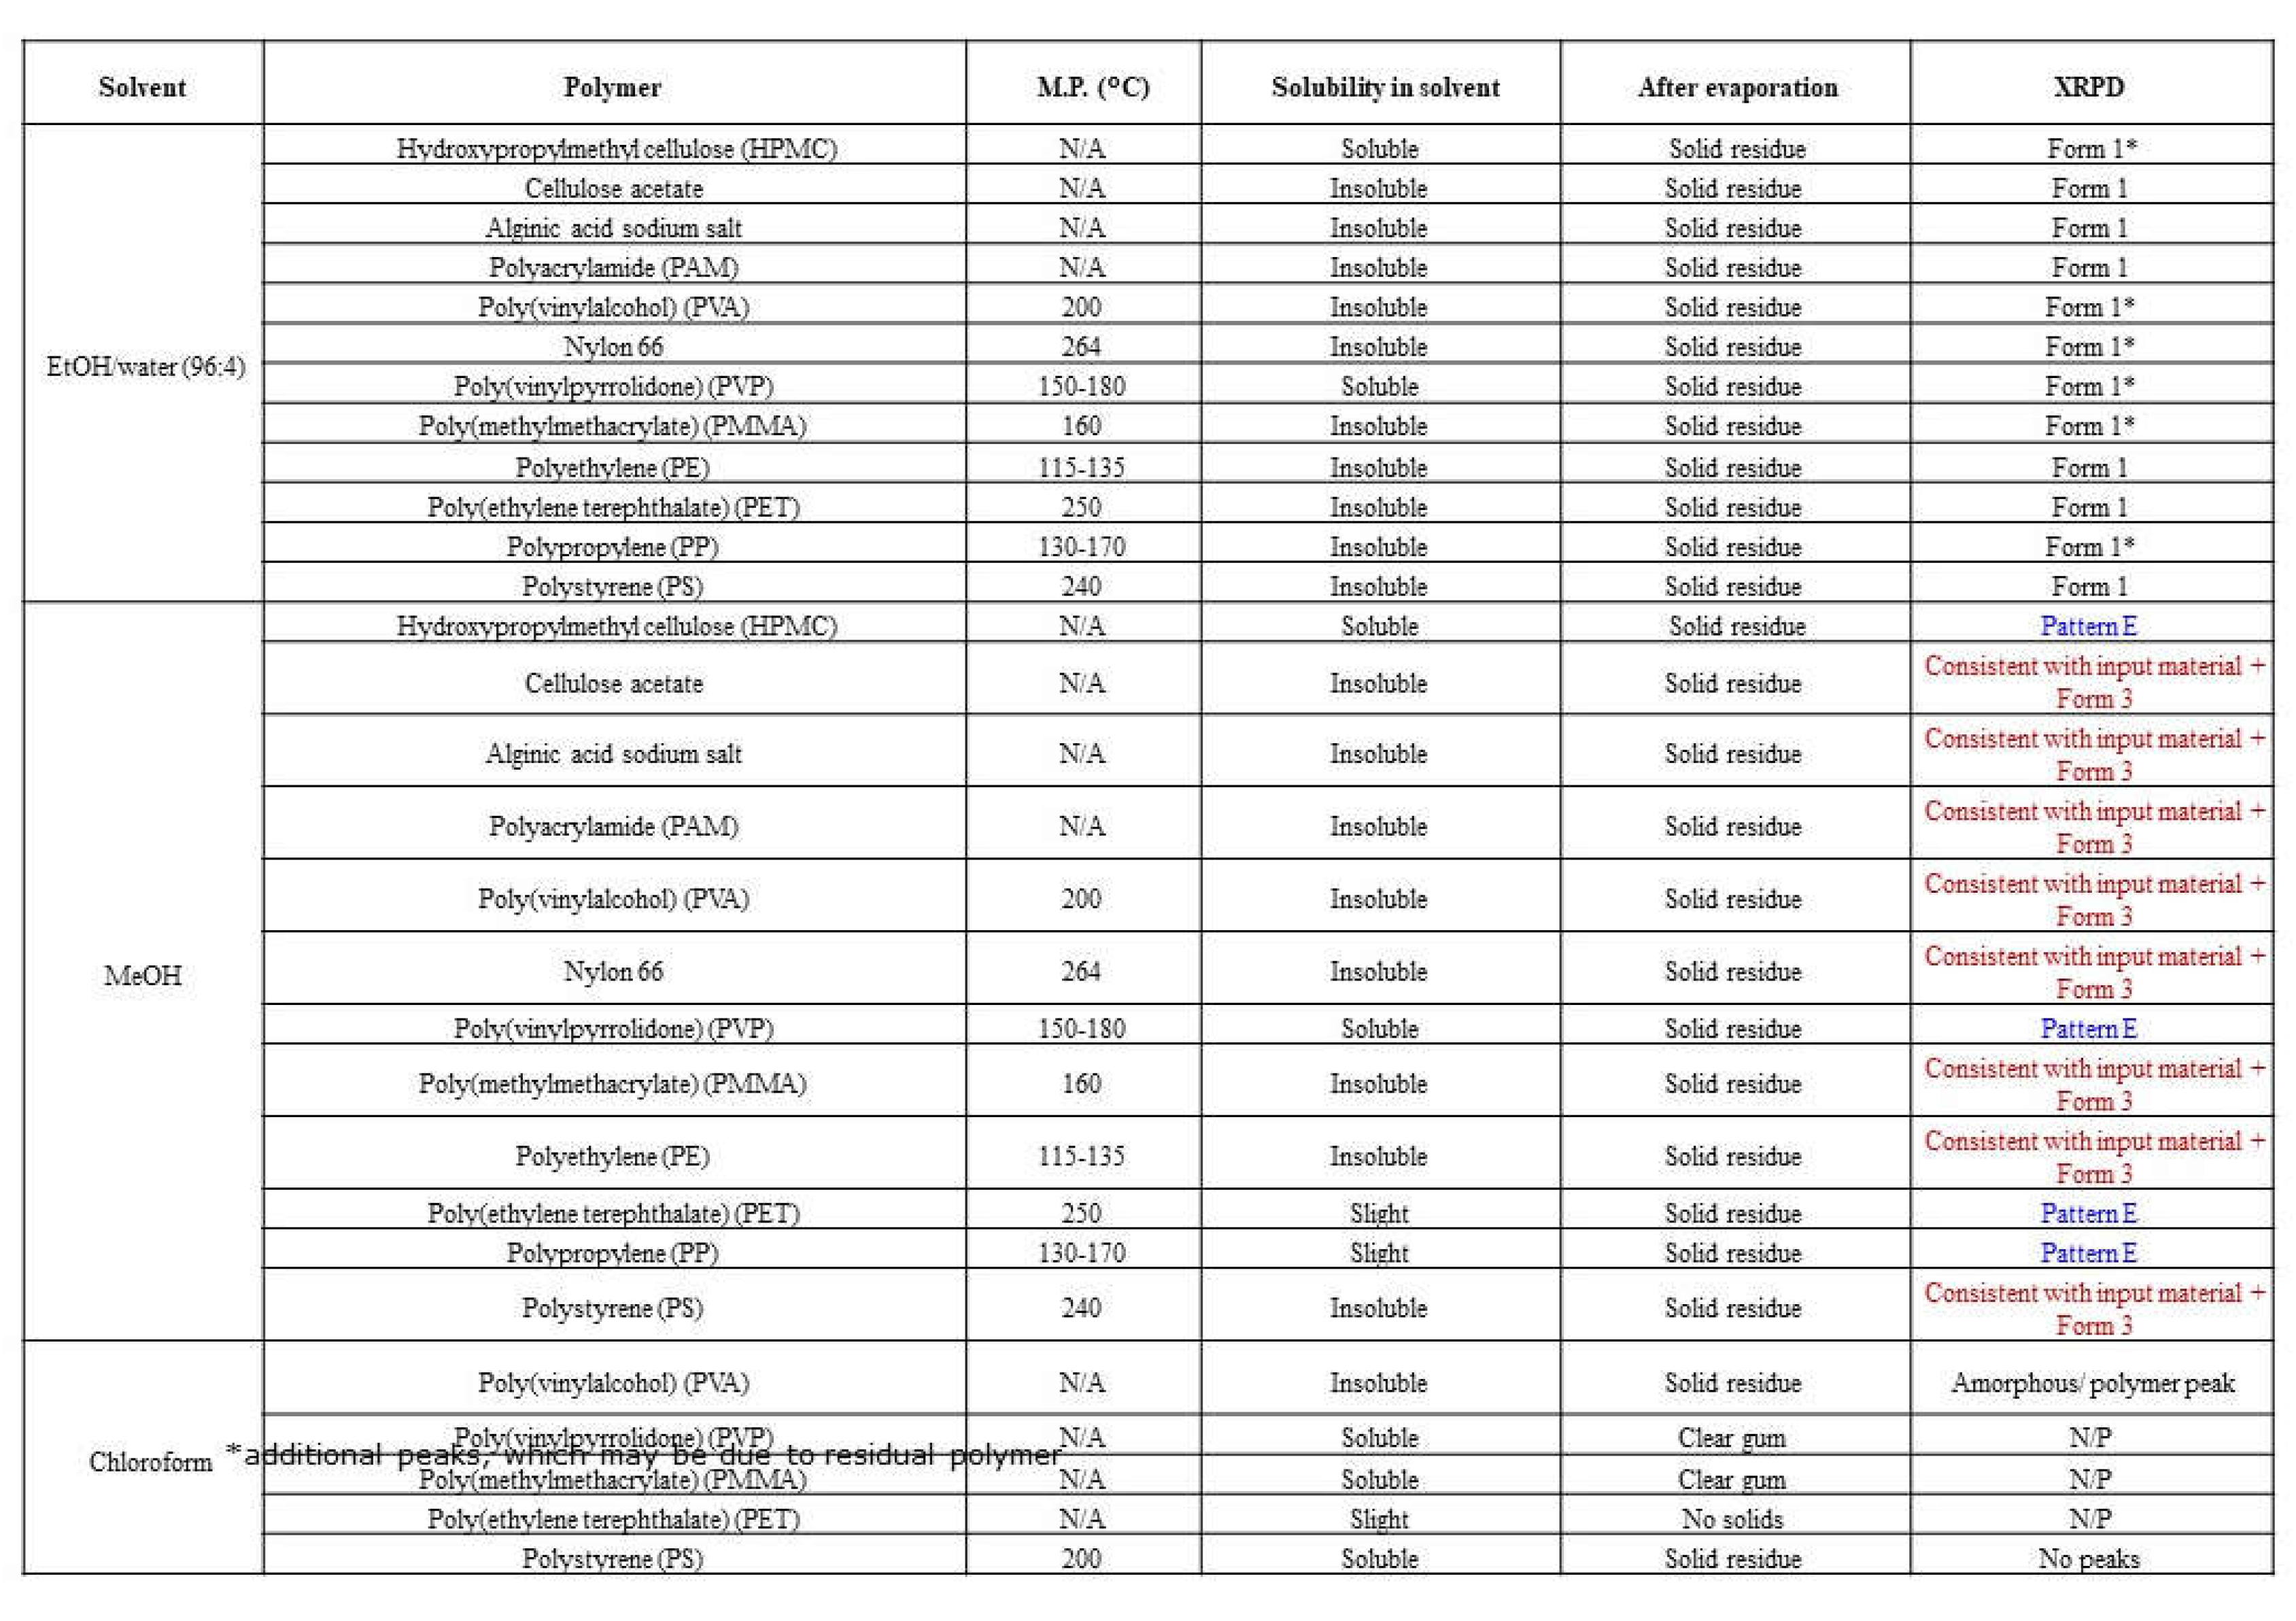 |
Table 4.
Solvent-drop grinding experiments using crystalline material.
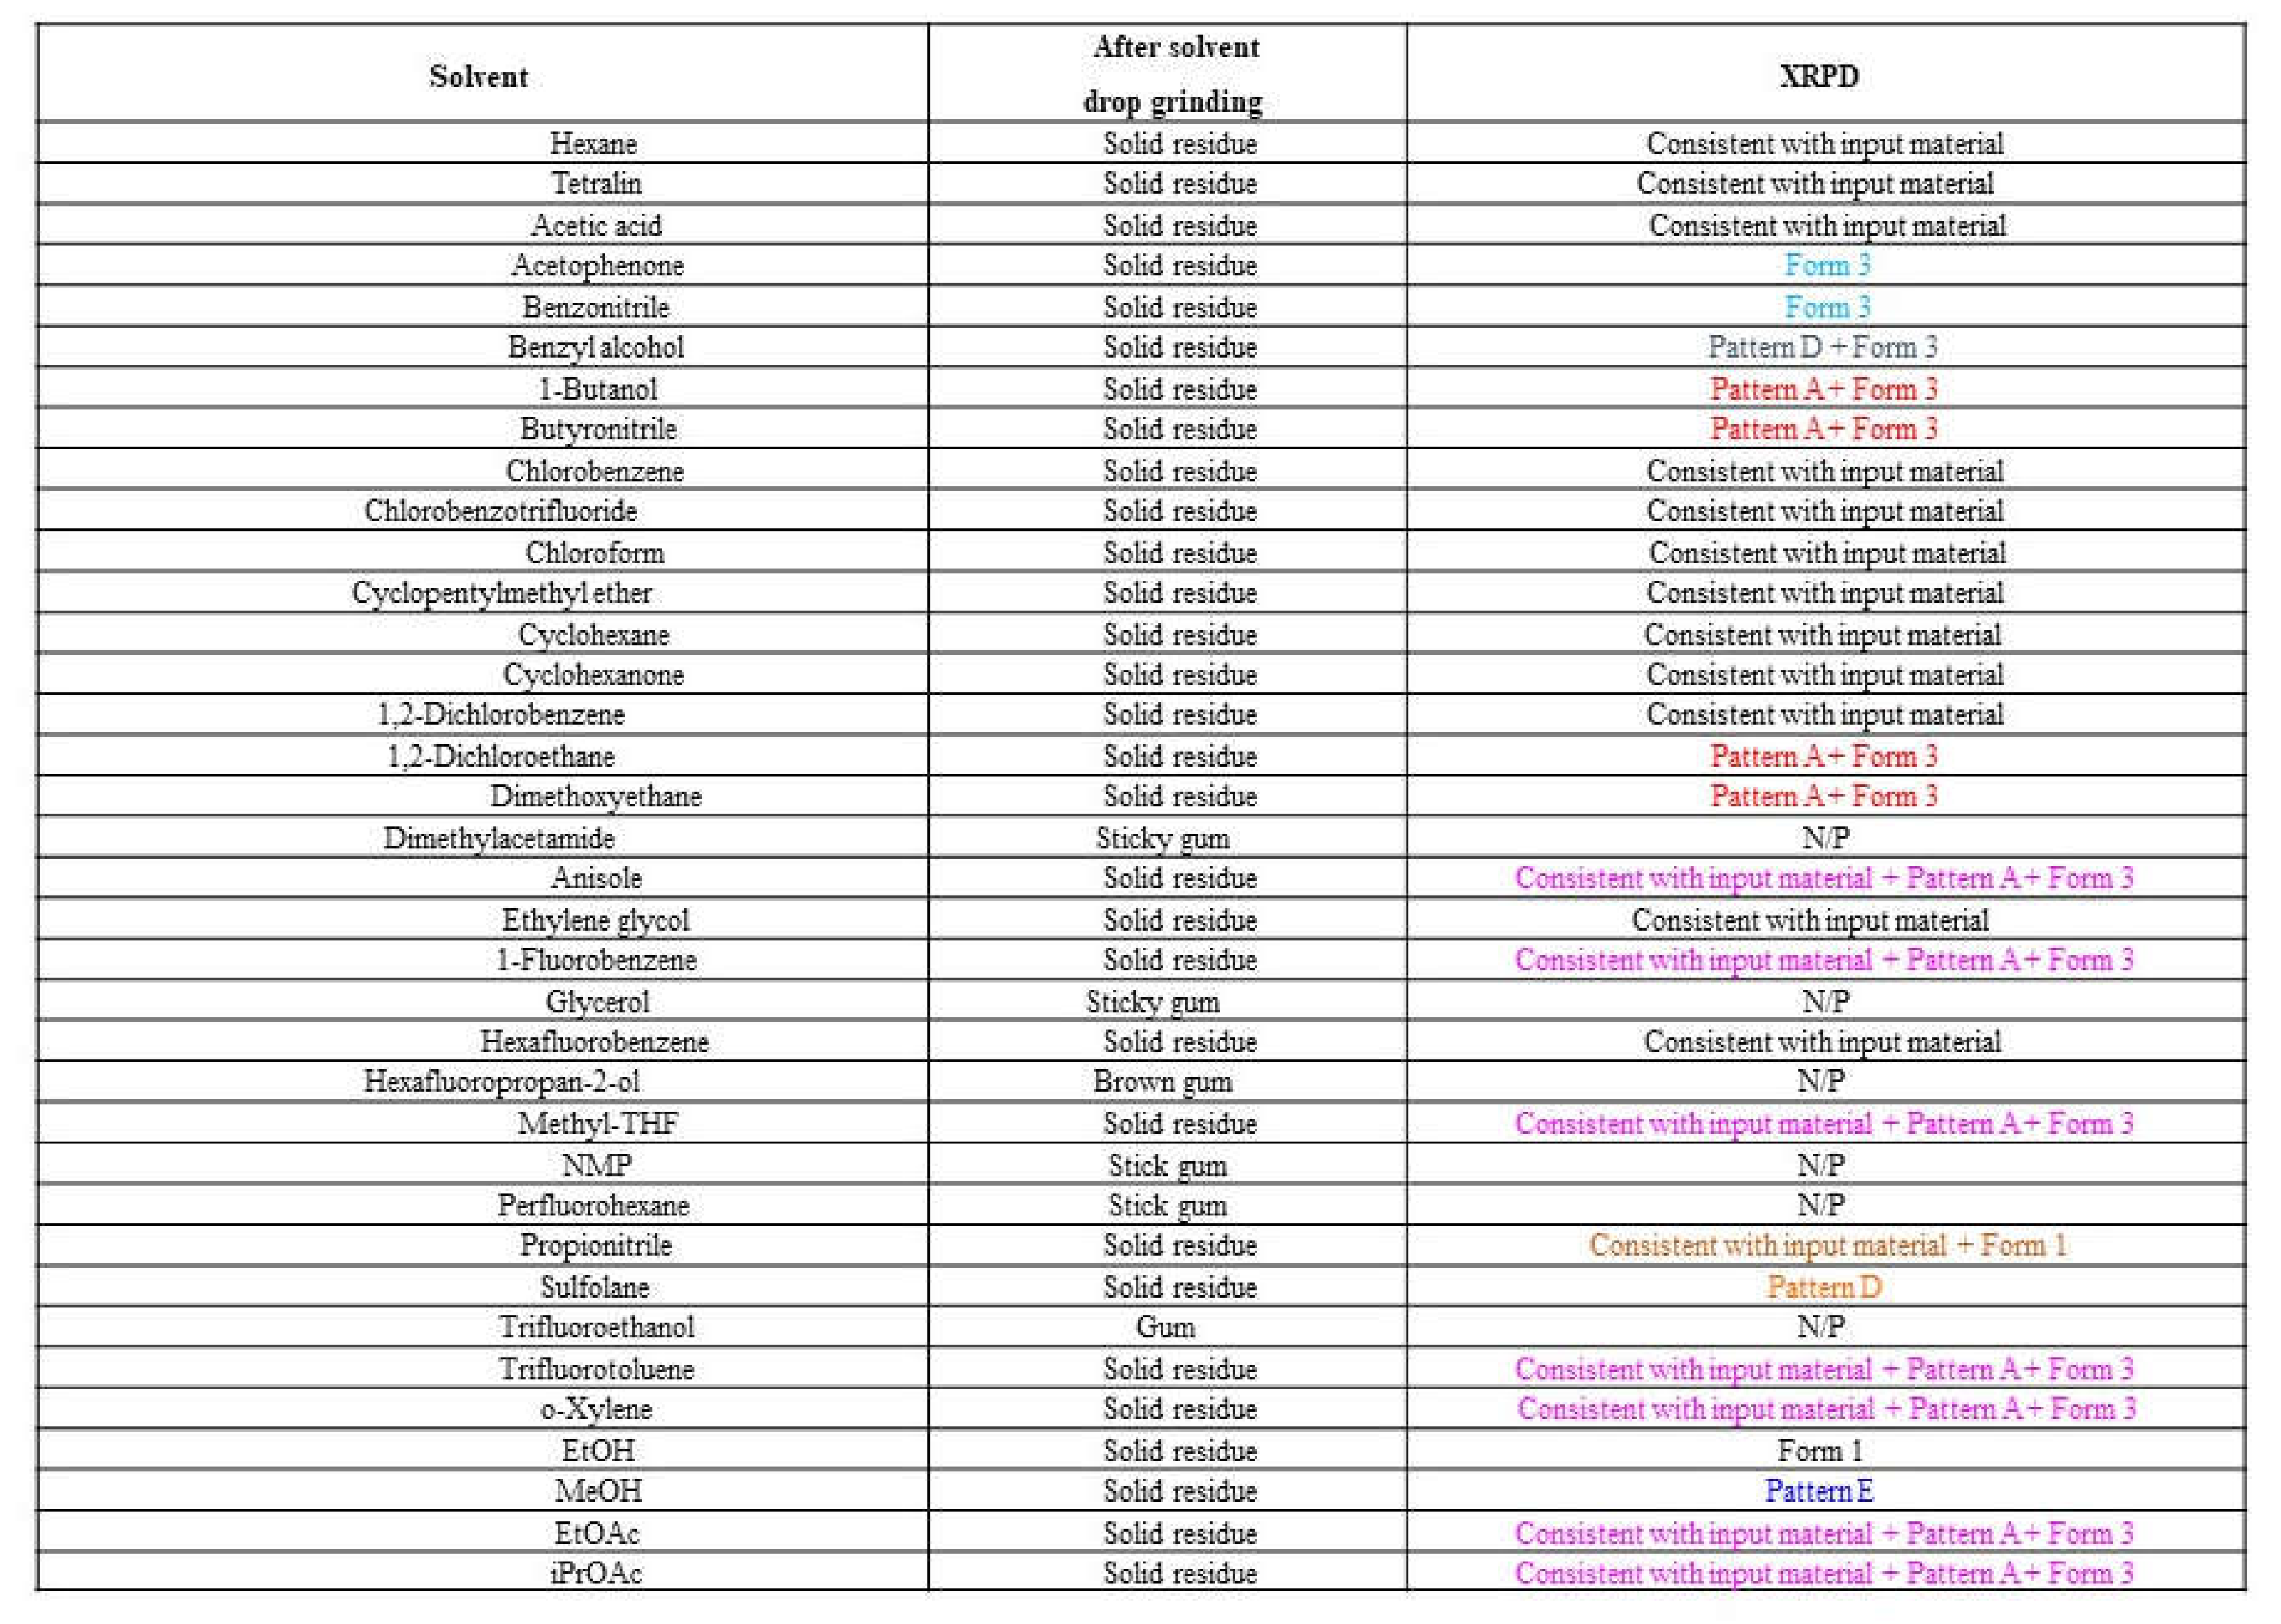 |
Table 5.
(A): Solubility assessment by using different solvents of Amorphous form.
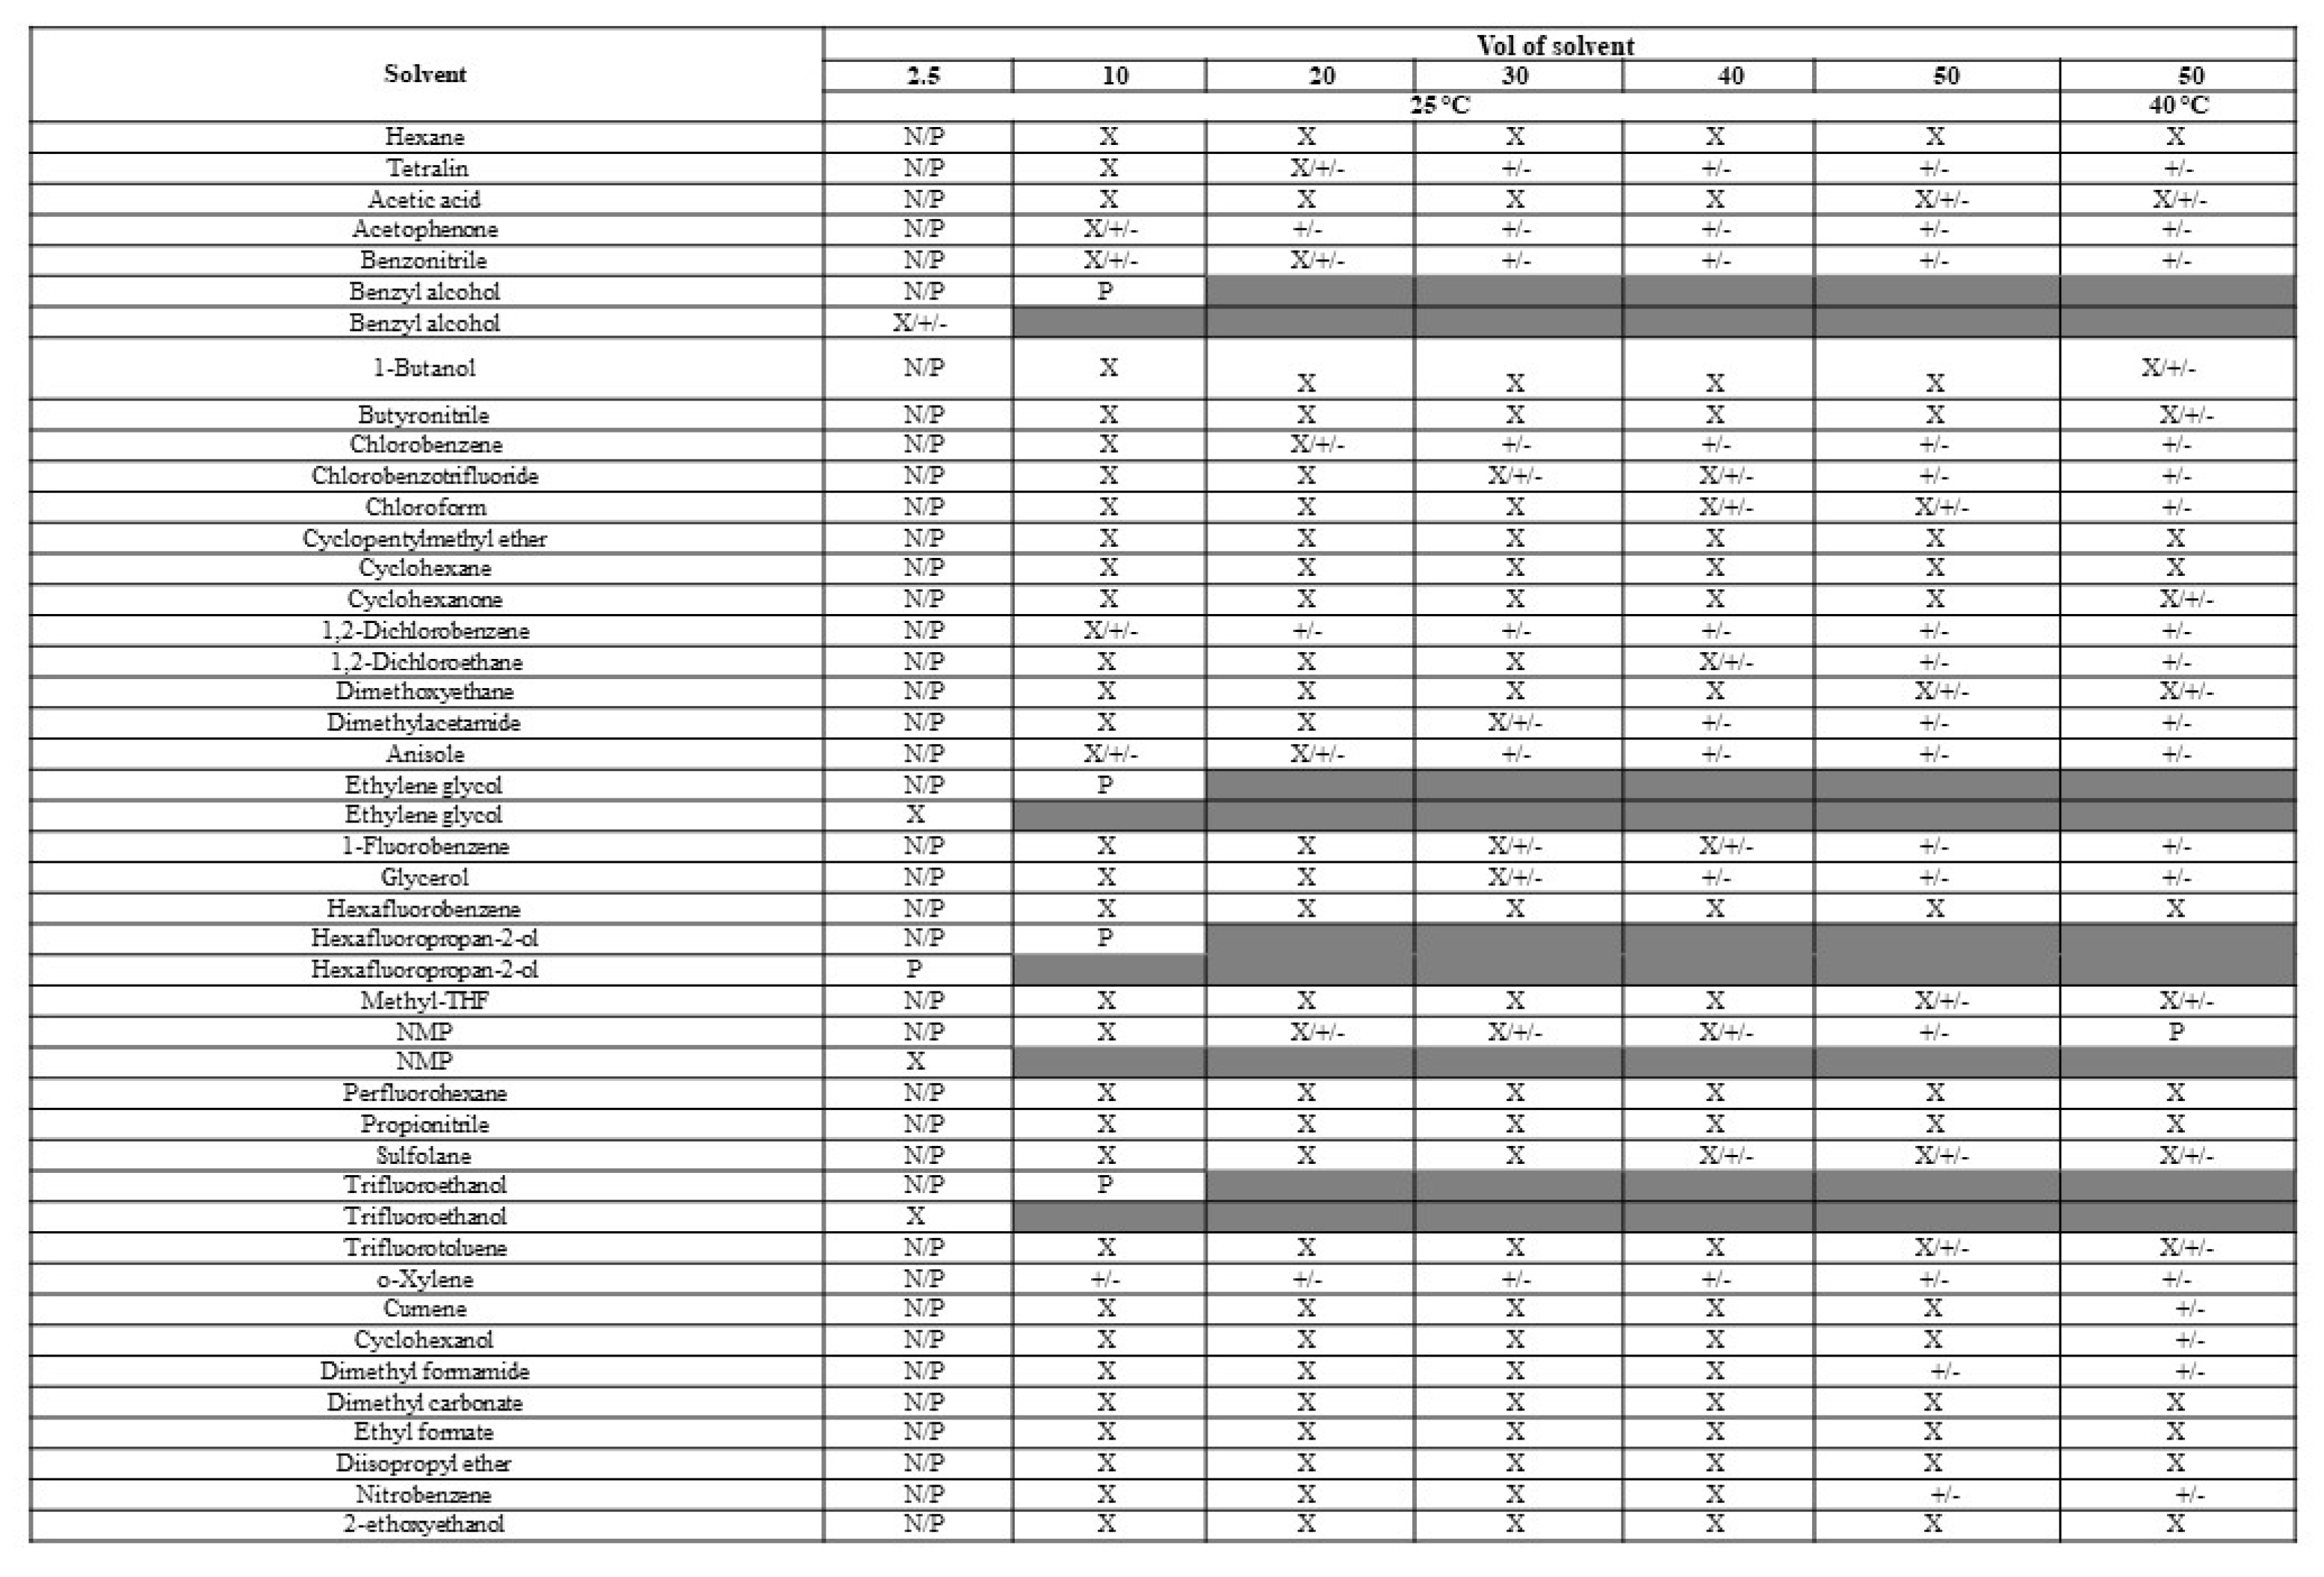 |
Table 5.
(B) Polymorph screening experiments on samples of Amorphous material post-solubility assessment.
Table 5.
(B) Polymorph screening experiments on samples of Amorphous material post-solubility assessment.
 |
Disclaimer/Publisher’s Note: The statements, opinions and data contained in all publications are solely those of the individual author(s) and contributor(s) and not of MDPI and/or the editor(s). MDPI and/or the editor(s) disclaim responsibility for any injury to people or property resulting from any ideas, methods, instructions or products referred to in the content. |
© 2024 by the authors. Licensee MDPI, Basel, Switzerland. This article is an open access article distributed under the terms and conditions of the Creative Commons Attribution (CC BY) license (http://creativecommons.org/licenses/by/4.0/).
Copyright: This open access article is published under a Creative Commons CC BY 4.0 license, which permit the free download, distribution, and reuse, provided that the author and preprint are cited in any reuse.


