
Submitted:
31 August 2025
Posted:
03 September 2025
You are already at the latest version
Abstract
Pharmaceutical cocrystals represent a promising strategy to enhance drug properties while preserving molecular integrity. This study investigates cocrystallization of a poorly soluble drug with different organic acids (benzoic acid, tartaric acid, succinic acid) at various ratios using solvent evaporation and anti-solvent precipitation methods. The resulting cocrystals had a lower melting peak, with formation of O-H···N hydrogen bonds (band shifts 2928®3264 cm−¹ and C=O vibration alterations at 1726 cm−¹), and novel crystalline phases at 12.4°, 16.7°, and 24.9°. Further study revealed that cocrystals formed with benzoic acid (1:2 ratio) had a monoclinic lattice (space group P2₁/n) and achieved 64-fold solubility enhancement and 2-fold dissolution rate. The pharmacokinetic study in animals showed a 3-fold maximum plasma drug concentration and 4-fold improvement in systemic exposure (AUClast), with a delayed time to peak concentration (Tmax), confirming a sustained release. These findings demonstrate that organic acid as a coformer in appropriate stoichiometric ratio, incorporated to a poorly soluble drug using a suitable preparation method, can drastically improve the physicochemical properties and bioavailability. Amongst the evaluated coformers, benzoic acid cocrystals have a potential to overcome the solubility barrier and promote the effective oral dosage form.
Keywords:
pharmaceutical cocrystals
; organic acids
; solubility enhancement
; solvent evaporation
; anti-solvent precipitation
1. Introduction
In conventional tablet or capsule formulations, active pharmaceutical ingredients (APIs) are typically incorporated as crystalline solids [1]. In the preliminary stages of oral dosage formulation development, the crystalline form of API should be determined. The bioavailability of hydrophobic APIs, classified as BCS Class II or IV, is significantly impeded by their low aqueous solubility and dissolution rate [2]. Pharmaceutical cocrystallization can produce various solid forms of an API, facilitating the optimization of key drug properties [3]. This well-established method enhances the biopharmaceutical properties of APIs without the need for covalent modifications [4]. The components that are solid under ambient conditions have significant practical implications: cocrystals can be discovered and prepared using solid-state methods, exhibit greater thermal stability compared to solvates or hydrates, and display unique design or crystal engineering characteristics that are distinct from those of solvates and single−component molecular solids [5,6]. Cocrystals can be classified into molecular cocrystals (comprised of neutral cocrystals) and ionic cocrystals (comprised of least one ionic coformer). Ionic cocrystals display excellent compositional diversity and properties compared to single-component ones [7].
The systematic study of pharmaceutical cocrystals gained momentum in the 2000s and has now reached an important phase, demonstrating their potential to enhance the physicochemical properties of APIs and even improving their therapeutic effects [8]. In this study, we investigated the cocrystallization of ezetimibe, a hypolipidemic agent used to lower cholesterol levels, as a model drug. Ezetimibe inhibits the absorption of cholesterol in the small intestine, thereby reducing the amount of cholesterol delivered to the liver. It is used for the treatment and prevention of atherosclerosis [8]. Ezetimibe’s highly hydrophobic nature leads to poor solubility, limiting its bioavailability [9]. Incorporating hydrophilic coformers into the cocrystals of hydrophobic APIs has been shown to enhance drug solubility and in vitro release profiles [10,11].
The objective of the study is to comprehensively explore the suitable coformer for the specific drug compound, optimize preparation method, and improve the pharmaceutical attributes. Firstly, we aim to examine the molecular determinants and design principles of coformer pairs that facilitate the formation of cocrystals. This primary objective is challenging because API-improving cocrystals are rare, isolated systems, and predictive design rules have yet to be established [12]. This study offers novel insights by identifying the key structural characteristics of coformers that facilitate the formation of cocrystals. Secondly, we aim to understand the factors influencing the number and nature of cocrystals, a challenging task due to the interplay of multiple contributing factors. For rational cocrystal design, it is essential to streamline the screening of diverse cocrystal formers and efficiently navigate their chemical characteristics [13]. This study explores the structures and properties of the molecules, identifies the factors influencing the favorable formation of cocrystals, and allows rapid classification of promising API molecules. The crystal structure, hydrogen bonds, solubility, melting point, dissolution, and in vivo pharmacokinetics are studied as well.
2. Materials and Methods
2.1. Materials
Ezetimibe (CAS no. 163222-33-1, melting point 163 °C) was purchased from Zhejiang Peptides (Zhejiang Peptides, Shengzhou City, China). Benzoic acid, tartaric acid, succinic acid, sodium lauryl sulfate (SLS), polyethylene glycol (PEG) 8000, cetyltrimethylammonium bromide (CTAB), and ethyl acetate were procured from Daejung Chemicals & Metals (Siheung, South Korea). Transcutol® HP was purchased from Gattefosse (Saint−Priest, France). Tween 80 was purchased from Sigma−Aldrich (St. Louis, MO, USA). Methanol (MeOH − HPLC grade) was purchased from J.T. Baker® (Phillipsburg, NJ, USA).
2.2. Preparation of Cocrystals with Solvent Evaporation (SEV) Method
Ezetimibe and each coformer (benzoic acid, tartaric acid, and succinic acid) were dissolved in ethyl acetate at weight ratios of 1: 0.5, 1: 1, and 1: 2 (Figure S1). These solutions were heated to 70 °C on a hot plate while stirring until a clear solution was obtained. The mixtures were dried in an oven at 30 °C for 7 days.
2.3. Preparation of Cocrystals with Solvent/Anti−Solvent (SAS) Method
Ezetimibe and each coformer were separately dissolved in MeOH (solvent) at molar ratios of 1: 0.5, 1: 1, and 1: 2 (Figure S1). These solutions were gradually added dropwise to water (anti-solvent) at 25 oC while stirring at 300 rpm. The mixtures were then dried in an oven set at 30 °C for 7 days.
The cocrystals formed using the SEV method were denoted as “M1,” while those formed using the SAS method were denoted as ″M2″. The ezetimibe/benzoic acid cocrystals were denoted as follows: M1EBA1_0.5, M1EBA1_1, M1EBA1_2, M2EBA1_0.5, M2EBA1_1, and M2EBA1_2. The ezetimibe/tartaric acid cocrystals were denoted as follows: M1ETA1_0.5, M1ETA1_1, M1ETA1_2, M2ETA1_0.5, M2ETA1_1, and M2ETA1_2. The ezetimibe/succinic acid cocrystals were denoted as follows: M1ESA1_0.5, M1ESA1_1, M1ESA1_2, M2ESA1_0.5, M2ESA1_1, and M2ESA1_2. The physical mixtures of ezetimibe with each coformer were denoted as follows: PMEBA1_0.5, PMEBA1_2, PMETA1_0.5, PMETA1_1, PMETA1_2, PMESA1_0.5, PMESA1_1, and PMESA1_2.
2.4. Preparation of Single Crystal
Ezetimibe and each coformer were mixed at a molar ratio of 1: 1 and dissolved in 20 mL MeOH. The sample was prepared in a glass petri dish and stirred until a clear solution was obtained. It was then slowly dried at 25 oC without stirring until the solvent completely evaporated. The obtained single cocrystal samples were denoted as SCEBA (ezetimibe/benzoic acid), SCETA (ezetimibe/tartaric acid), and SCESA (ezetimibe/succinic acid). One hundred mg sample was prepared for the analysis.
2.5. Morphology Evaluation
The morphology of the cocrystals was analyzed under microscope (Olympus Corporation, Tokyo, Japan) using a software provided from the manufacturer. Additionally, the samples were further examined via scanning electronic microscope (SEM) (CLARA LMH, Tescan, Brno, Czech Republic).
2.6. Fourier-Transform Infrared Spectroscopy (FTIR)
The samples were subjected to FTIR (Thermo Fisher Scientific, MA, USA) over a wavenumber region of 4000−500 cm−1, with 32 scan rates at a resolution of 4 cm−1. The data collected was analyzed using the OMNIC software.
2.7. Differential Scanning Calorimetry (DSC)
The samples were subjected to DSC using DSC Q2000 (TA Instruments, New Castle, DE, USA). The samples (2−5 mg) were placed in non-hermetic aluminum pans and heated from 25 to 200 °C at a scan rate of 5 °C/min. The thermal data were analyzed using the Universal Analysis 2000 software equipped with the Instruments.
2.8. Powder X−Ray Diffraction (PXRD) and Single-Crystal X-Ray Diffraction (SCXRD)
The PXRD patterns were measured using D2 phaser benchtop X−ray diffractometer (Ultima IV, Rigaku, Japan) equipped with a Ni−filtered Cu−Kα laser (λ = 1.54056 Å) and a scintillation center detector. The powder samples were placed in a quartz holder and scanned over a range of 4–40o at a scanning rate of 6o/min. SCXRD patterns were measured at −173.15 oC using Bruker D8 Venture (Billerica, MA, USA).
2.9. Bioanalytical Method Development
The calibration curve was constructed with five standards ranging from 500 ppm to 1.95 ppm. The absorbance of the standards at 233 nm was measured using a UV-VIS spectrophotometer (Optizen pop, Mecasys®, Seoul, South Korea). The stock standard solution was prepared by dissolving ezetimibe at 0.5 mg/mL in 40% MeOH. The bioanalytical method was developed using an Agilent 1290 Infinity II BioLC system coupled with an Agilent 6495D Triple-Quadrupole mass spectrometer, employing electrospray ionization (ESI). Chromatographic separation was achieved on a Kintex C18 column (2.6 μm, 100×3 mm) maintained at 30 °C, using an isocratic mobile phase of water-acetonitrile (20:80 v/v) at 0.25 mL/min flow rate. The total running time was optimized to 5 min with a 2 μL injection volume. Mass spectrometric detection utilized multiple reaction monitoring (MRM) in negative polarity mode for ezetimibe ([M−H]⁻ m/z 408.1→271.1) and positive mode for the internal standard itraconazole ([M+H]+ m/z 705.2→391.6). Source parameters were optimized: gas temperature 290 °C with 13 L/min flow, nebulizer pressure 35 psi, and sheath gas heated to 250 °C at 11 L/min. Collision energies were set at 14 eV for ezetimibe and 48 eV for IS, achieving optimal fragmentation while maintaining signal intensity.
Sample preparation involved protein precipitation with acetonitrile (75 μL added to 20 μL plasma), followed by vortex mixing and centrifugation at 13,000 ×g for 10 min. The method demonstrated linearity (R² = 0.995) across 1−100 ng/mL, with calibration standards prepared by spiking blank plasma. Quality control samples at four concentrations (1, 3, 40, and 80 ng/mL) showed acceptable accuracy (88.47−103.08%) and precision (CV≤9.8%). The lower limit of quantification (LLOQ) was established at 1 ng/mL with 103.08% accuracy and 8.87% precision.
2.10. Saturation Solubility
The solubility of ezetimibe and 1: 0.5 samples were assessed in solvents containing 0.5% w/v SLS, 0.5% w/v PEG 8000, 0.5% w/v Transcutol® HP, and 0.1% w/v CTAB. The samples were mixed in a 5 mL tube with 2 mL of the solvent at a concentration of 1 mg/mL using a multi-mixer (SLRM-3, Seoulin Biosciences, Pangyo, South Korea) for 48 h at 25 oC. The mixtures were then centrifuged at 13,000 rpm for 10 min (Eppendorf 5425R, Hamburg, Germany) and filtered using a 0.45 μm syringe filter. The absorbance of the filtered samples at 233 nm was measured using a UV-VIS spectrophotometer.
2.11. In Vitro Dissolution
In vitro release profiles were assessed using the USP dissolution apparatus II (paddle) (Varian 705 DS, Cary, NC, USA) at 50 rpm in 500 mL of 0.45% w/v SLS in 0.05 M acetate buffer (pH 4.5) at 37 ± 0.5 oC. The cocrystal samples (equivalent to 10 mg ezetimibe) were weighed and added into the dissolution vessel (n = 3). Aliquots were collected at predetermined time points: 5 min, 10 min, 15 min, 30 min, 45 min, 60 min, 90 min, and 120 min. The displaced volume was replenished with fresh buffer after each sampling. The collected samples were filtered through a 0.45 µm RC syringe filter and subjected to UV-VIS spectrophotometer.
2.12. In Vivo Pharmacokinetics
In vivo pharmacokinetic profile of ezetimibe cocrystal formulations was assessed in male Sprague-Dawley rats (n = 4 per group, 7–8-week-old, mean weight 271.1 g). The SD rats were obtained from G-Bio (Gwangju, Republic of Korea) and housed at 23 ± 2 °C and 55 ± 10% RH. They were maintained under a 12 h light/dark cycle and provided with free access to food and water. The animal experimental protocol was approved by the Institutional Animal Care and Use Committee (IACUC) of Mokpo National University (Mokpo, Republic of Korea; approval no. MNU-IACUC-2025-015).
The rats were fasted overnight before oral administration, and four formulation groups received single oral doses through gavage: Group 1 (CRYS101) at 10 mg/kg and Groups 2-4 (CRYS102-104) at 30 mg/kg. Blood samples (200 μL) were collected from the femoral artery at predetermined time points after the administration. The collected samples were centrifuged at 16,000× g for 5 min at 4 °C, and the plasma was stored at −70 °C until analysis. The plasma samples analyzed using a validated UPLC-MS/MS method with 1 ng/mL lower quantification limit. The bioanalytical method demonstrated acceptable validation parameters with 88−103% accuracy and ≤ 9.8% precision across the calibration range (1−100 ng/mL), utilizing protein precipitation with acetonitrile (3.75: 1 solvent: plasma ratio) and isocratic chromatographic separation (ACN: H₂O = 80: 20).
2.13. Statistical Analysis
The data are expressed as mean ± standard deviation (SD). Statistical analysis was performed using MS Excel (Microsoft Corporation, Malvern, PA, USA), with comparisons of means conducted using Student’s t-test. A p−value <0.05 was considered statistically significant.
3. Results and Discussion
3.1. Thermodynamic Properties
Thermal events in the DSC provided key preliminary information on the presence of a new solid phase. The thermograms of ezetimibe, benzoic acid, tartaric acid, succinic acid, and the corresponding cocrystals are shown in Figure 1. Ezetimibe, benzoic acid, tartaric acid, and succinic acid exhibited single melting endotherms (Tm) at 162.36 °C, 123.19 °C, 172.67 °C, and 188.91 °C, respectively (Table 1), which were consistent with the previously reported values [14,15,16,17]. The EBA cocrystals’ melting endotherm was found to be lower (ΔTm = 12.4 °C) than those of the parent compounds. In contrast, the ETA and ESA cocrystals exhibited melting endotherms between those of the ezetimibe and the corresponding coformers. Most of the cocrystals exhibited two endothermic peaks, suggesting the formation of a new phase [18]. Changes in enthalpy between the two peaks were also observed depending on the ratio of API/coformer. The peak thermograms of the physical mixtures were like those of the corresponding cocrystals. This was attributed to the minor interactions between the coformer and the API, leading to weaker intensity peaks comparable to those of the corresponding cocrystals [19]. In a previous screening of 50 distinct cocrystal samples, 26 samples (51%) showed melting points between those of the API and the coformer, 19 (39%) showed lower melting points, 3 (6%) showed higher melting points, and 2 (4%) showed melting point identical to either the API or the coformer [20].
3.2. Physicochemical Interactions
FTIR analysis (Figure 2) confirmed the interaction between ezetimibe and the employed coformers, showing main peaks and the characteristic shifts for ezetimibe, EBA, ETA, and ESA (Table 2). The formation of cocrystals induced several significant changes. The FTIR spectrum of ezetimibe showed the O−H stretching band at 3264.09 cm⁻¹, which may have overlapped with the N−H stretching band. The FTIR spectra of the cocrystals (M1EBA1_0.5, M2EBA1_0.5, M1EBA1_1, M1ETA1_0.5, M1ETA1_1, M2ETA1_0.5, M2ETA1_1, M1ESA1_0.5, M1ESA1_1, M1ESA1_2, and M2ESA1_0.5) showed broader peaks that shifted to lower wavelengths. The C−H stretching band at 2928.09 cm⁻¹ was corresponded to API. However, the C−H band was not observed in the spectra of M1EBA1_1, M1EBA1_2, M2EBA1_2, and ETA cocrystals. The C=O stretching band corresponding to carboxylic acids was observed at 1726.06 cm⁻¹, appearing at similar or lower wavelengths in the spectra of the cocrystals. The C=C stretching band corresponding to benzene was observed at 1507.08 cm⁻¹. In the spectra of the cocrystals, this band appeared at a similar wavelength but was more pronounced and narrower. The C−F stretching band, indicating fluorination, was observed at 1212.71 cm⁻¹. The intensity of this peak was reduced in the cocrystals. Comparing these spectra with those shown in Table 2 indicated multiple band shifts upon cocrystal formation, suggesting the presence of hydrogen bonding and other weak interactions. The shifts in characteristic peaks and altered peak intensity indicated changes in the corresponding crystal structure and orientation due to molecular interactions with the cocrystal-forming agents.
3.3. Crystallinity
Alterations in the PXRD pattern of the solid product obtained following cocrystallization, compared to the starting materials, confirm the formation of a new solid phase [21]. As shown in Figure 3, the cocrystals showed PXRD patterns distinct from those of the API, coformers, and other cocrystals. The API exhibited characteristic reflections at 15.72°, 17.12°, 18.58°, 19.29°, 21.71°, 22.75°, 23.40°, 25.22°, 26.97°, 28.14° and 32.96°. The cocrystals showed shifted peaks compared to their parent and guest crystals, suggesting significant changes in their internal structures and crystal morphology [22]. The ezetimibe/succinic acid cocrystals formed at 1: 1 and 1: 2 ratios showed exceptionally low yields, with distinct PXRD patterns compared to other cocrystals and significantly reduced peak intensities. The ezetimibe/benzoic acid cocrystals (1: 2 ratio) revealed novel crystalline phase displaying unique peaks at 12.4°, 16.7°, and 24.9°. These results suggested that the employed process promoted cocrystallization.
The structure of single crystals comprising ezetimibe, benzoic acid, tartaric acid, succinic acid, and methanol was determined by SCXRD analysis (Figure 3). The corresponding crystallographic parameters are provided in Table 3. The analysis indicated that EBA crystallizes in a monoclinic system with space group P2₁/n and lattice parameters a = 5.42 Å, b = 5.05 Å, c = 21.61 Å, and angles α = 90°, β = 95.95°, γ = 90°. In contrast, ETA and ESA were found to cocrystallize in an orthorhombic system with space group P212121, with the following lattice parameters and angles (ETA, ESA): a = 6.18 Å, 6.19 Å; b = 15.45 Å, 15.47 Å; and c = 21.91 Å, 21.96 Å; α = 89.98°, 90°; β = 90.03°, 90°; and γ = 90°, 90°. The structure formed with the organic acids were consistent with the prior study [11].
3.4. Phase Diagram
In this study, phase diagrams were experimentally determined and complemented with theoretical calculations. Ternary phase diagrams are typically represented using equilateral triangles, where compositions are represented by points. These compositions are determined by projecting the points onto the sides of the triangle [23]. The COSMO quick program (Biovia, San Diego, CA, USA) was used to construct the phase diagrams of the cocrystals. Figure 4 shows the phase diagrams of the cocrystals, with Figure 4A–Figure 4C specifically depicting the cocrystal formation of ezetimibe with benzoic acid, tartaric acid, or succinic acid, using the SEV method in ethyl acetate at 70 °C. Similarly, Figure 4D–Figure 4F shows the phase diagrams of the cocrystals formed using SAS method (MeOH, ezetimibe, and coformers). The phase diagrams showed a broad spectrum of cocrystal formation (highlighted in red and labeled ′C′) with benzoic acid, which was followed by tartaric acid and then succinic acid in terms of formation tendency. Thus, the formation of ezetimibe/benzoic acid cocrystals is considered highly likely with the proposed solvent system, molar ratios, and coformers. The formation of ezetimibe/tartaric acid and ezetimibe/succinic acid cocrystals is relatively less probable and more challenging. However, under well-controlled conditions, these cocrystals can still be obtained, as demonstrated by the crystallographic analysis presented later.
3.5. Solubility
To quantitatively assess solubility and in vitro release profiles, an ezetimibe calibration in a range of 1.95 μg/mL to 31.25 μg/mL showed a linear curve (Figure S2). The curve showed a correlation coefficient (R²) of 0.9994, with a limit of quantification (LOQ) of 0.04 µg/mL and a limit of detection (LOD) of 0.01 µg/mL (Table 4). When a hydrophilic coformer is introduced into the cocrystals of hydrophobic API, both the solubility and dissolution are enhanced compared to the parent compound. The solubility of the cocrystals is shown in Figure 5. The cocrystals prepared using the SEV method showed up to 3.9−fold higher solubility than ezetimibe in 0.5% w/v SLS, while those prepared using the SAS method did not show significant improvements. The SAS method and EBA−based cocrystals showed improved solubility in both 0.5% w/v PEG 8000 and 0.5% w/v Transcutol®, with the most notable increase observed in 0.5% w/v Transcutol®, achieving up to a 64−fold enhancement. On the other hand, most cocrystals other than EBA showed insignificant improvements in solubility. The most notable enhancement was observed for the EBA cocrystals prepared using the SEV method in 0.1% w/v CTAB, achieving approximately a 13−fold enhancement (solubility of 0.81 mg/mL); M1ESA cocrystals showed approximately a 3−fold enhancement. In general, the benzoic acid-based cocrystals displayed high solubility. The increase in solubility could be due to decreased relative free energy of solvation [24].
The enhanced solubility of cocrystals has been associated with improvements in dissolution and bioavailability. The prepared cocrystals of ezetimibe indeed displayed higher solubility than the parent compound. To assess whether this increased solubility enhances the dissolution, in vitro release was assessed using biorelevant media containing 0.45% w/v SLS in 0.05 M acetate buffer (pH 4.5) (Figure 6). The release rate was fastest for the benzoic acid cocrystals followed by the tartaric acid ones and then succinic acid ones (benzoic acid > tartaric acid > succinic acid). M1EBA, M2EBA, and M1ETA showed significantly improved release profiles (p−value <0.05). Among the cocrystals, EBA1_2 prepared using the SEV and SAS methods displayed the highest dissolution rate. Notably, M2EBA1_2 showed a dissolution rate of 0.22 mg/mL, which is approximately twice that of ezetimibe (89% vs. 45% at 120 min). The dissolution rates of ETA and ESA were comparable, and both showed improved in vitro release profiles compared to the API itself (p−value <0.05). This was consistent with the solubility results and attributed to the lower melting points of the cocrystals: benzoic acid (123 °C) < ezetimibe (162 °C) < tartaric acid (172 °C) < succinic acid (188 °C). The enhanced dissolution rate of ezetimibe from its cocrystals was attributed to alterations in its crystallinity, particle size, morphology, and crystalline properties, all of which contributed to increased solubility in the dissolution medium [21].
3.6. Morphology
The surface characteristics of the cocrystals were investigated by conventional microscopic imaging (Figure 7) and SEM (Figure 8). Figure 7A-Figure 7I and Figure 8A-Figure 8I images depict large crystals produced using the SEV method, while Figure 7J-Figure 7R and Figure 8J-Figure 8R images depict small crystals formed using the SAS method. In the SEV method, the API dissolves in a solvent, which gradually evaporates. This enables stable crystal growth as the solute concentration increases and typically leads to a larger crystal size and improved crystallinity. On the other hand, the SAS method involves the use of an additional solvent, resulting in rapid supersaturation and immediate crystallization of the solute. This process limits the time needed for sufficient crystal formation, leading to the production of smaller crystals.
3.7. Effects of SEV and SAS Methods on Cocrystals
Previously, an average mean diameter of approximately 4.66 µm was reported for particles produced using the SAS method. Particles produced using the traditional SEV method have been reported to have an average mean diameter of approximately 38.09 µm [25]. As aforementioned, a slower evaporation rate tends to yield larger and more uniform crystals, enhancing their stability and reproducibility in applications [26]. The SEV method offers more effective control over the crystallization process compared to the SAS method, where the introduction of an anti−solvent rapidly increases supersaturation, resulting in prompt nucleation of crystalline particles [27]. The two methods produce same cocrystals and only exhibit fundamental differences in particle formation [28].
3.8. Impact of the Drying Rate on Cocrystals
For APIs with absorption limited by dissolution rate, employing a cocrystal strategy can enhance their bioavailability by improving their dissolution rates [29]. The presence of evaporating droplets can impact cocrystal formation by altering the drying rate during crystallization. When drying occurs over a sufficient period, crystal growth proceeds more regularly and stably, enhancing the integrity of the crystal structure. In contrast, rapid drying can result in incomplete crystal formation, leading to irregular shapes with weaker bonding.
The drying rate is dependent on temperature and humidity [30]. Controlling this factor is common and effective for increasing both solubility (Cs) and dissolution rates (dC/dt) of both acidic and basic APIs. This factor also impacts the wettability, which in turn influences the diffusion layer thickness (h) [31]. This phenomenon can enhance solubility by several orders of magnitude, significantly enhancing the dissolution rate [32].
3.9. In Vivo Pharmacokinetic Evaluation
The pharmacokinetic evaluation of ezetimibe cocrystals revealed dose-dependent absorption dynamics mediated by formulation design and physiological conditions. CRYS101, CRYS102, CRYS103, and CRYS104 are ezetimibe, ezetimibe/benzoic acid (1:2 ratio), M1EBA1_2 (SEV), and M2EBA1_2 (SAS), respectively. At the optimized 30 mg/kg dose, BA cocrystals (1:2 ratio, SEV method) demonstrated a 3−fold increase in maximum plasma drug concentration (Cmax = 18.38 ± 9.52 ng/mL) and 4−fold improvement in systemic exposure (AUClast = 40.36 ± 30.94 h·ng/mL) compared to ezetimibe (Table 5, p−value <0.05). The delayed time to peak concentration (Tmax = 2.83 ± 2.75 h vs. 1.33 ± 0.76 h) correlated with in vitro dissolution data showing sustained release (89% at 120 min vs. 45% ezetimibe), suggesting cocrystal lattice stability prolongs gastric retention. However, 43.75% of samples fell below quantification limits at 10 mg/kg, exposing a critical solubility threshold, despite a 64−fold solubility enhancement in vitro, in vivo absorption remained dose-dependent below 20 mg/kg. On contrary, the higher pharmacokinetic results for SAS method were not observed. The possible reason could be: rapid cocrystal dissolution may overwhelm absorption capacity, triggering API recrystallization; variable gastric emptying rates (Tmax range: 0.5–6 h) modulated absorption windows; and bile−assisted solubilization of the lipophilic drug (logP 4.14) might be disrupted by BA coformer interactions [33,34]. The monoclinic crystal lattice (space group P2₁/n) provided thermodynamic stability but triggered size-dependent dissolution challenges. SAS batches showed faster initial release (45% at 15 min) vs. SEV (22%), yet in vivo data revealed paradoxical exposure patterns where some 30 mg/kg subjects underperformed 10 mg/kg counterparts. The cocrystal production with SAS method, targeting size range of 50–100 μm could balance dissolution rate and prevent supersaturation precipitation. Bile acid sequestrants addition may prevent micellar entrapment, while extended sampling to 24 h with 15−min intervals during the first 2 h would better capture absorption variability. The overall findings convincingly position BA cocrystallization as a viable strategy for BCS class II drugs but emphasize the need for integrated particle design, dose optimization, and biorelevant dissolution modeling to translate in vitro advantages into consistent in vivo performance. While the method validation met regulatory criteria (R² = 0.995, accuracy 88-103%), the frequent BQL occurrences in vivo indicate that 1 ng/mL LLOQ may be inadequate for preclinical studies, necessitating either dose increment or analytical sensitivity improvements.
4. Conclusions
Ezetimibe cocrystals prepared at different drug/coformer ratios using SEV or SAS had improved solubility, stability, dissolution, and pharmacokinetics compared to drug compound. The DSC thermograms, FTIR spectra, PXRD pattern, and single crystal analysis confirmed a distinct peak, hydrogen bonding, and crystalline lattice, confirming the formation of cocrystals. The BA cocrystals (1:2 ratio) achieved a 64−fold higher solubility, 2−fold improved dissolution, and 3−fold increase in maximum plasma concentration compared to drug compound. The cocrystals represent a promising strategy to enhance the solubility of a poorly soluble drug.
Supplementary Materials
The following supporting information can be downloaded at the website of this paper posted on Preprints.org, Table S1. System Suitability testing conducted with four parameters (retention time, peak area, tailing factor, and theoretical plates) for ezetimibe analysis method along with acceptance criteria; Table S2. Accuracy and precision parameters for the analytical method validation of ezetimibe assay determination; Table S3. parameter for the analytical method validation of ezetimibe assay determination; Figure S1. Preparation of ezetimibe cocrystals using (A) solvent evaporation and (B) anti-solvent precipitation methods; Figure S2. Ezetimibe calibration curves over the range of 1.95 µg/mL to 31.25 µg/mL.
Author Contributions
Ravi Maharjan: Conceptualization, Data curation, Writing – review and editing; Ha Eun Park: Methodology, Data curation, Formal analysis, Writing – original draft; Ki Hyun Kim: Conceptualization, Methodology; Ki-Taek Kim: Methodology, Data curation; Minji Kim Methodology; Hea-Young Cho: Methodology, Data curation; Seong Hoon Jeong: Conceptualization, Methodology, Supervision, Funding acquisition, Writing – review and editing. All authors have read and agreed to the published version of the manuscript.
Funding
This work was partly supported by National Research Foundation of Korea (NRF) grant funded by the Korea government (MSIT) (RS-2022-NR070862).
Informed Consent Statement
Not applicable, as this study did not involve human participants.
Data Availability Statement
The data supporting the findings of this study are available from the corresponding author upon reasonable request.
Conflicts of Interest
The authors declare that they have no known competing financial interests or personal relationships that can influence the present work.
References
- Kavanagh, O.N. An analysis of multidrug multicomponent crystals as tools for drug development. J. Control. Release 2024, 369, 1–11. [Google Scholar] [CrossRef]
- Bhalani, D.V.; Nutan, B.; Kumar, A.; Singh Chandel, A.K. Bioavailability enhancement techniques for poorly aqueous soluble drugs and therapeutics. Biomedicines 2022, 10, 2055. [Google Scholar] [CrossRef]
- Aakeröy, C.B.; Fasulo, M.E.; Desper, J. Cocrystal or salt: does it really matter? Mol. Pharmaceutics 2007, 4, 317–322. [Google Scholar]
- Haneef, J.; Amir, M.; Sheikh, N.A.; Chadha, R. Mitigating drug stability challenges through cocrystallization. AAPS PharmSciTech 2023, 24, 62. [Google Scholar] [CrossRef]
- Shan, N.; Zaworotko, M.J. The role of cocrystals in pharmaceutical science. Drug Discov. Today 2008, 13, 440–446. [Google Scholar] [CrossRef]
- D’Abbrunzo, I.; Gigli, L.; Demitri, N.; Sabena, C.; Nervi, C.; Chierotti, M.R.; Bertoni, S.; Škorić, I.; Häberli, C.; Keiser, J. Higher-order multicomponent crystals as a strategy to decrease the IC50 parameter: the case of praziquantel, niclosamide and acetic acid. J. Drug Deliv. Sci. Technol. 2025, 109, 106974. [Google Scholar] [CrossRef]
- Duggirala, N.K.; Perry, M.L.; Almarsson, Ö.; Zaworotko, M.J. Pharmaceutical cocrystals: along the path to improved medicines. Chem. Commun. 2016, 52, 640–655. [Google Scholar] [CrossRef]
- Kavanagh, O.N.; Croker, D.M.; Walker, G.M.; Zaworotko, M.J. Pharmaceutical cocrystals: from serendipity to design to application. Drug Discov. Today 2019, 24, 796–804. [Google Scholar] [CrossRef]
- Shimpi, M.R.; Childs, S.L.; Boström, D.; Velaga, S.P. New cocrystals of ezetimibe with L-proline and imidazole. CrystEngComm 2014, 16, 8984–8993. [Google Scholar] [CrossRef]
- Prajapati, P.; Pandey, J.; Tandon, P.; Sinha, K.; Shimpi, M.R. Molecular Structural, Hydrogen Bonding Interactions, and Chemical Reactivity Studies of Ezetimibe-L-Proline Cocrystal Using Spectroscopic and Quantum Chemical Approach. Front. Chem. 2022, 10, 848014. [Google Scholar]
- Childs, S.L.; Chyall, L.J.; Dunlap, J.T.; Smolenskaya, V.N.; Stahly, B.C.; Stahly, G.P. Crystal engineering approach to forming cocrystals of amine hydrochlorides with organic acids. Molecular complexes of fluoxetine hydrochloride with benzoic, succinic, and fumaric acids. J. Am. Chem. Soc. 2004, 126, 13335–13342. [Google Scholar] [PubMed]
- Grecu, T.; Hunter, C.A.; Gardiner, E.J.; McCabe, J.F. Validation of a computational cocrystal prediction tool: comparison of virtual and experimental cocrystal screening results. Cryst. Growth Des. 2014, 14, 165–171. [Google Scholar] [CrossRef]
- Abramov, Y.A.; Shah, H.S.; Michelle, C.; Wan, Z.; Xie, T.; Kuang, S.; Wang, J. Computational and Experimental Cocrystal Screening of Tiopronin and Dapagliflozin APIs: Development and Validation of a New Virtual Screening Model. Cryst. Growth Des. 2025. [Google Scholar] [CrossRef]
- Vogt, F.G.; Roberts-Skilton, K.; Kennedy-Gabb, S.A. A solid-state NMR study of amorphous ezetimibe dispersions in mesoporous silica. Pharm. Res. 2013, 30, 2315–2331. [Google Scholar] [CrossRef]
- Indrayanto, G.; Syahrani, A.; Rahman, A.; Tanudjojo, W.; Susanti, S.; Yuwono, M.; Ebel, S. Benzoic acid. In Analytical profiles of drug substances and excipients; Elsevier: 1999; Volume 26, pp. 1-46.
- Shen, J.; Zheng, J.; Che, Y.; Xi, B. Growth and properties of organic nonlinear optical crystals: l-tartaric acid–nicotinamide and d-tartaric acid–nicotinamide. J. Cryst. Growth 2003, 257, 136–140. [Google Scholar] [CrossRef]
- Wang, Y.; Wu, Y.; Wu, L.; Wang, J.; Huang, C.; Leng, Y. Determination and molecular simulation of ternary solid–liquid phase equilibrium of succinic acid+ maleic acid+ water from 283. 15 K to 333.15 K. J. Chem. Thermodyn. 2024, 191, 107228. [Google Scholar] [CrossRef]
- Gong, N.; Yu, H.; Wang, Y.; Xing, C.; Hu, K.; Du, G.; Lu, Y. Crystal structures, stability, and solubility evaluation of a 2: 1 diosgenin–piperazine cocrystal. Nat. Prod. Bioprospect. 2020, 10, 261–267. [Google Scholar] [CrossRef]
- Anand, R.; Nanda, A. Formulation and Evaluation of Cocry-stals of a Bcs Class Ii Drug Using Glycine As Coformer. Int. J. Appl. Pharm. 2022, 14, 68–76. [Google Scholar]
- Schultheiss, N.; Newman, A. Pharmaceutical cocrystals and their physicochemical properties. Cryst. Growth Des. 2009, 9, 2950–2967. [Google Scholar] [CrossRef]
- Sugandha, K.; Kaity, S.; Mukherjee, S.; Isaac, J.; Ghosh, A. Solubility enhancement of ezetimibe by a cocrystal engineering technique. Cryst. Growth Des. 2014, 14, 4475–4486. [Google Scholar] [CrossRef]
- Mulye, S.P.; Jamadar, S.A.; Karekar, P.S.; Pore, Y.V.; Dhawale, S.C. Improvement in physicochemical properties of ezetimibe using a crystal engineering technique. Powder Technol. 2012, 222, 131–138. [Google Scholar] [CrossRef]
- Ainouz, A.; Authelin, J.-R.; Billot, P.; Lieberman, H. Modeling and prediction of cocrystal phase diagrams. Int. J. Pharm. 2009, 374, 82–89. [Google Scholar] [CrossRef] [PubMed]
- Surov, A.O.; Ramazanova, A.G.; Voronin, A.P.; Drozd, K.V.; Churakov, A.V.; Perlovich, G.L. Virtual Screening, Structural Analysis, and Formation Thermodynamics of Carbamazepine Cocrystals. Pharmaceutics 2023, 15, 836. [Google Scholar] [CrossRef]
- Tjandrawinata, R.R.; Hiendrawan, S.; Veriansyah, B. Processing paracetamol-5-nitroisophthalic acid cocrystal using supercritical CO2 as an anti-solvent. Int. J. Appl. Pharm 2019, 11, 194–199. [Google Scholar] [CrossRef]
- Kumar, R.; Siril, P.F.; Soni, P. Preparation of Nano-RDX by Evaporation Assisted Solvent? Antisolvent Interaction. Propell. Explos. Pyrotech. 2014, 39, 383–389. [Google Scholar]
- Gadhiya, D.T.; Patel, J.K.; Bagada, A.A. An impact of nanocrystals on dissolution rate of Lercanidipine: Supersaturation and crystallization by addition of solvent to antisolvent. Future J. Pharm. Sci. 2021, 7, 1–17. [Google Scholar] [CrossRef]
- Yu, J.; Henry, R.F.; Zhang, G.G. Cocrystal screening in minutes by solution-mediated phase transformation (SMPT): Preparation and characterization of ketoconazole cocrystals with nine aliphatic dicarboxylic acids. J. Pharm. Sci. 2025, 114, 592–598. [Google Scholar]
- Nernst, W. Theorie der Reaktionsgeschwindigkeit in heterogenen Systemen. Z. Phys. Chem. 1904, 47, 52–55. [Google Scholar]
- Shahidzadeh, N.; Schut, M.F.; Desarnaud, J.; Prat, M.; Bonn, D. Salt stains from evaporating droplets. Sci. Rep. 2015, 5, 10335. [Google Scholar] [CrossRef]
- Elder, D.P.; Holm, R.; De Diego, H.L. Use of pharmaceutical salts and cocrystals to address the issue of poor solubility. Int. J. Pharm. 2013, 453, 88–100. [Google Scholar] [CrossRef]
- Serajuddin, A.T. Salt formation to improve drug solubility. Adv. Drug Deliv. Rev. 2007, 59, 603–616. [Google Scholar] [CrossRef] [PubMed]
- Gupta, D.; Mak, A.T.; Lakerveld, R. Intensified solid-state transformation during anti-solvent cocrystallization in flow. Chem. Eng. Process. Process Intensif. 2025, 208, 110108. [Google Scholar] [CrossRef]
- Cheung, A.K.; Liu, D.; Peukert, S.; Ge, H.; Gai, Y.; Chang, X. Naphthyridinone derivatives for the treatment of a disease or disorder. 2025.
Figure 1.
DSC thermograms of (A) ezetimibe/benzoic acid, (B) ezetimibe/tartaric acid, and (C) ezetimibe/succinic acid cocrystals. The thermograms of the parent compound and their physical mixtures, obtained using solvent evaporation and anti-solvent precipitation methods at 1:0.5, 1:1, and 1:2 ratios.
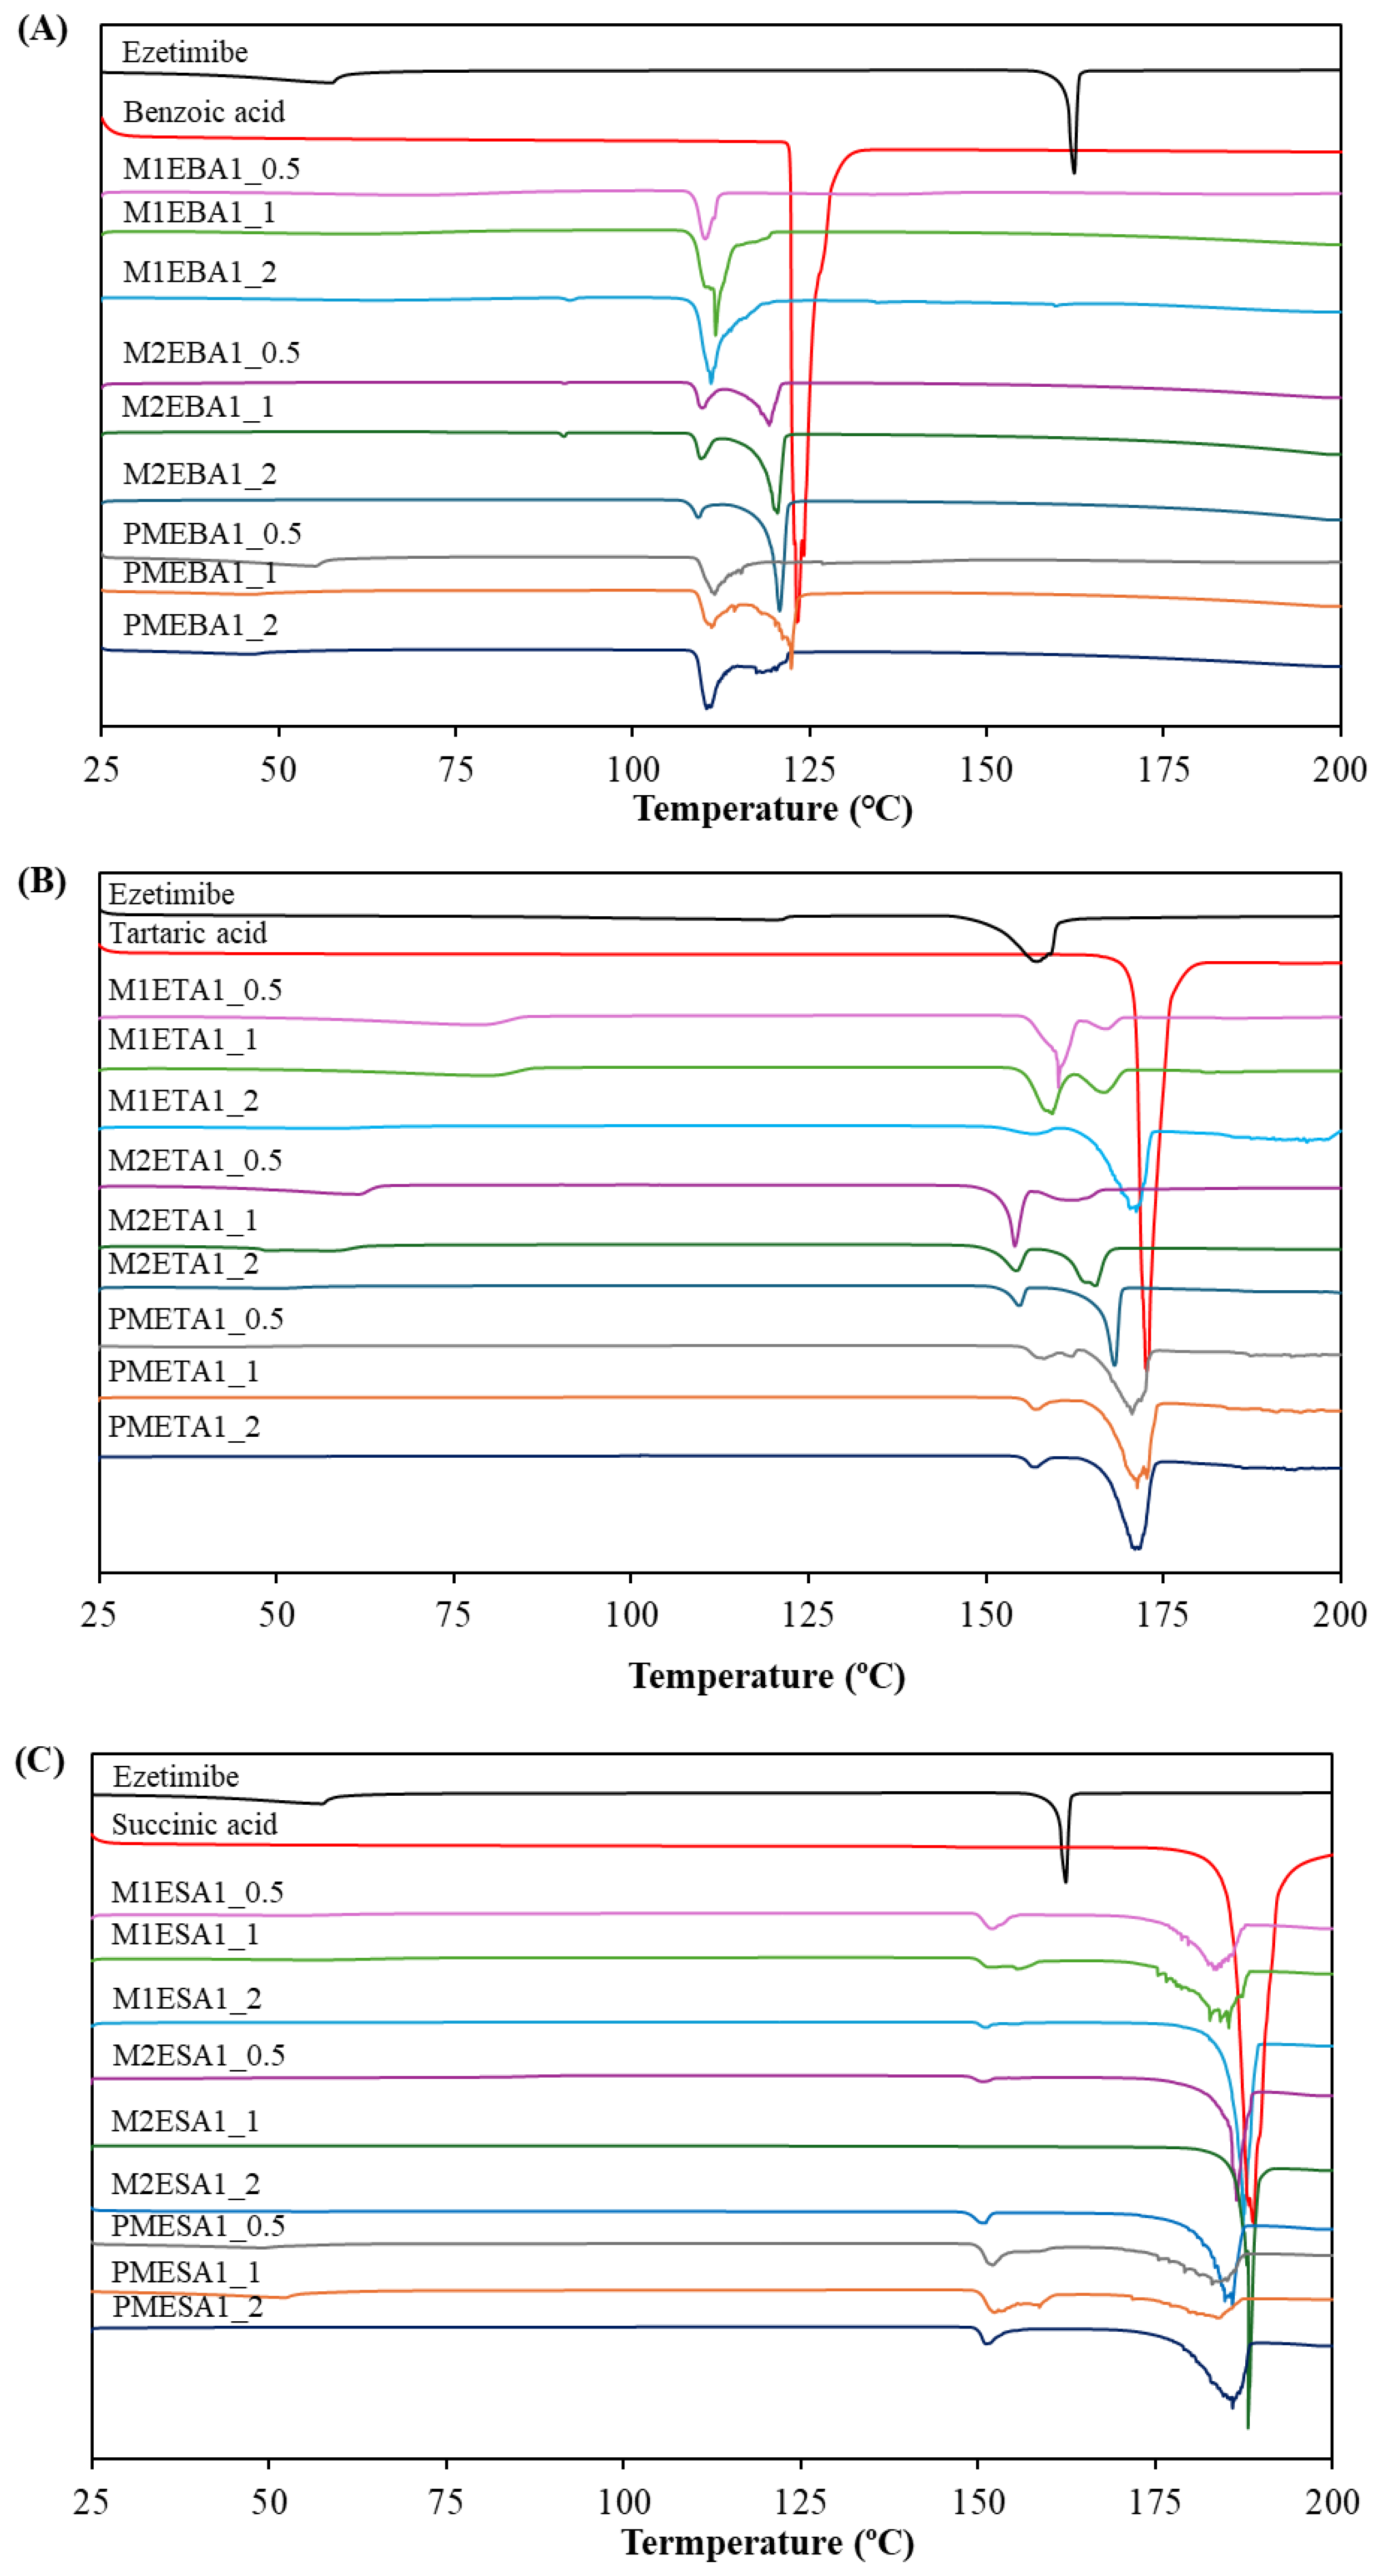
Figure 2.
FTIR spectra of (A) ezetimibe/benzoic acid, (B) ezetimibe/tartaric acid, and (C) ezetimibe/succinic acid cocrystals. The spectra of the parent compound obtained using solvent evaporation and anti-solvent precipitation methods at 1:0.5, 1:1, and 1:2 ratios.
Figure 2.
FTIR spectra of (A) ezetimibe/benzoic acid, (B) ezetimibe/tartaric acid, and (C) ezetimibe/succinic acid cocrystals. The spectra of the parent compound obtained using solvent evaporation and anti-solvent precipitation methods at 1:0.5, 1:1, and 1:2 ratios.
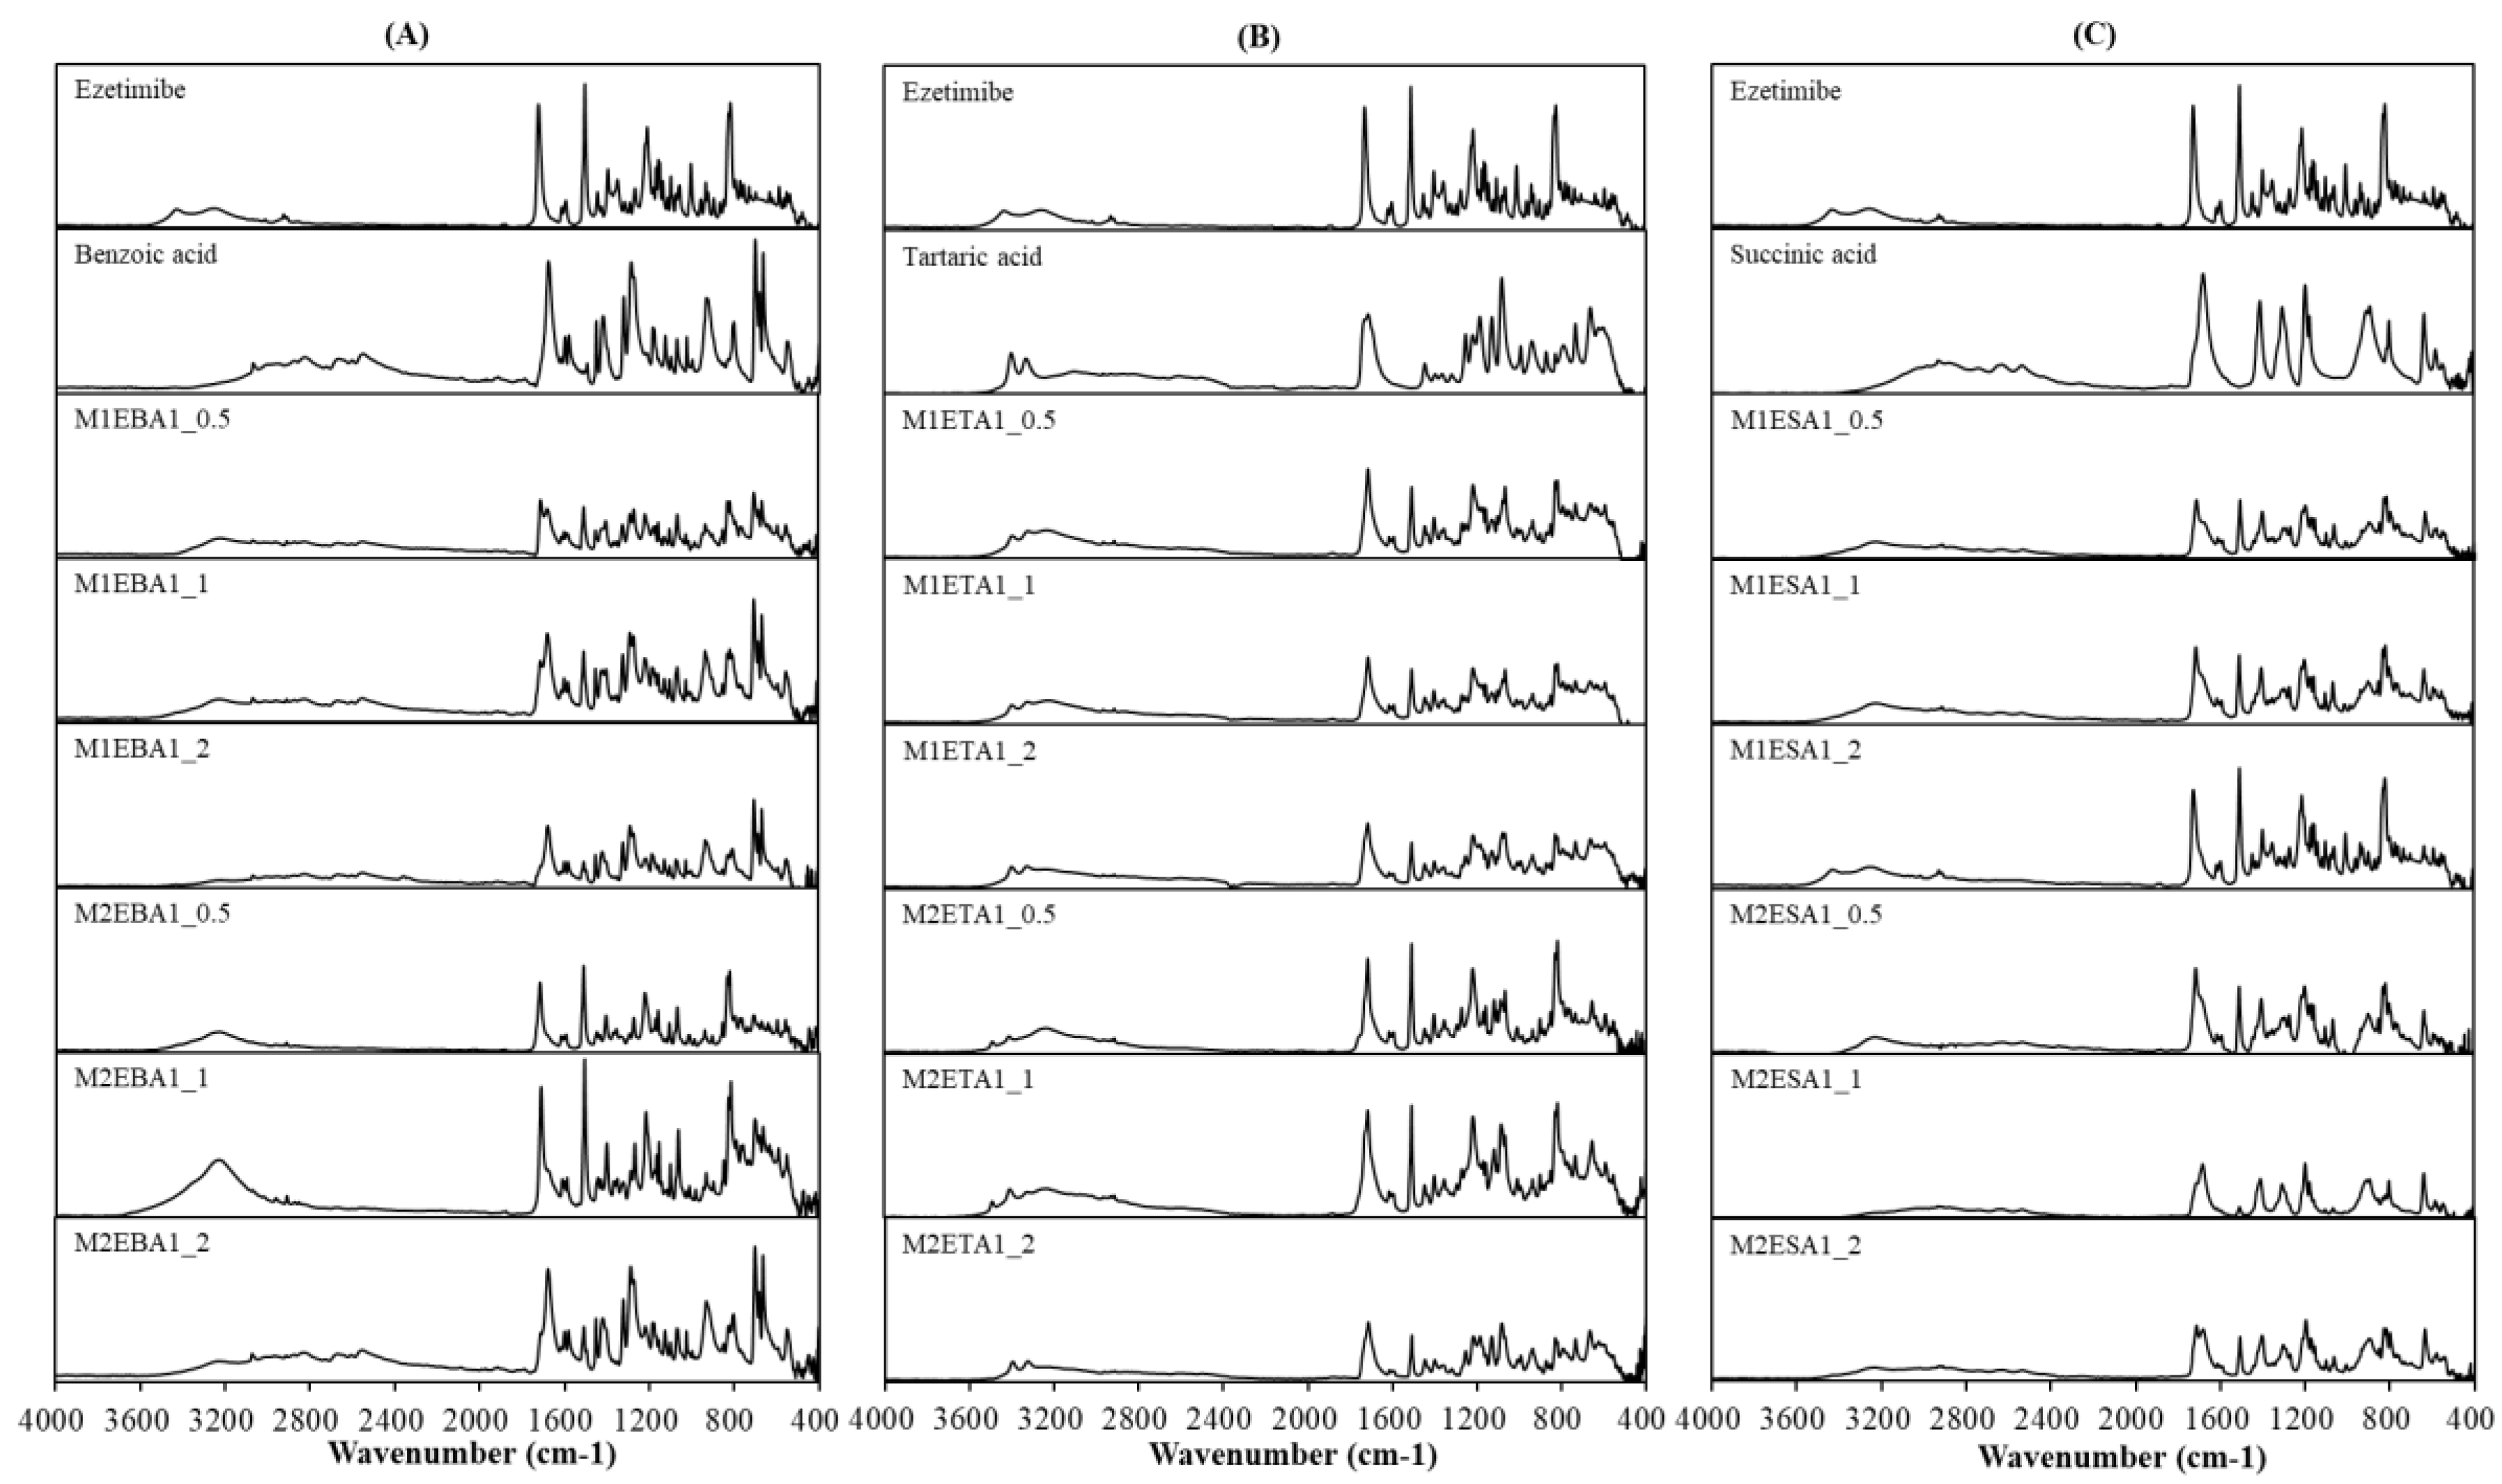
Figure 3.
PXRD patterns of the (A) ezetimibe/benzoic acid, (B) ezetimibe/tartaric acid, and (C) ezetimibe/succinic acid cocrystals. The patterns of the parent compound were obtained using solvent evaporation and anti-solvent precipitation methods at 1:0.5, 1:1, and 1:2 ratios.
Figure 3.
PXRD patterns of the (A) ezetimibe/benzoic acid, (B) ezetimibe/tartaric acid, and (C) ezetimibe/succinic acid cocrystals. The patterns of the parent compound were obtained using solvent evaporation and anti-solvent precipitation methods at 1:0.5, 1:1, and 1:2 ratios.
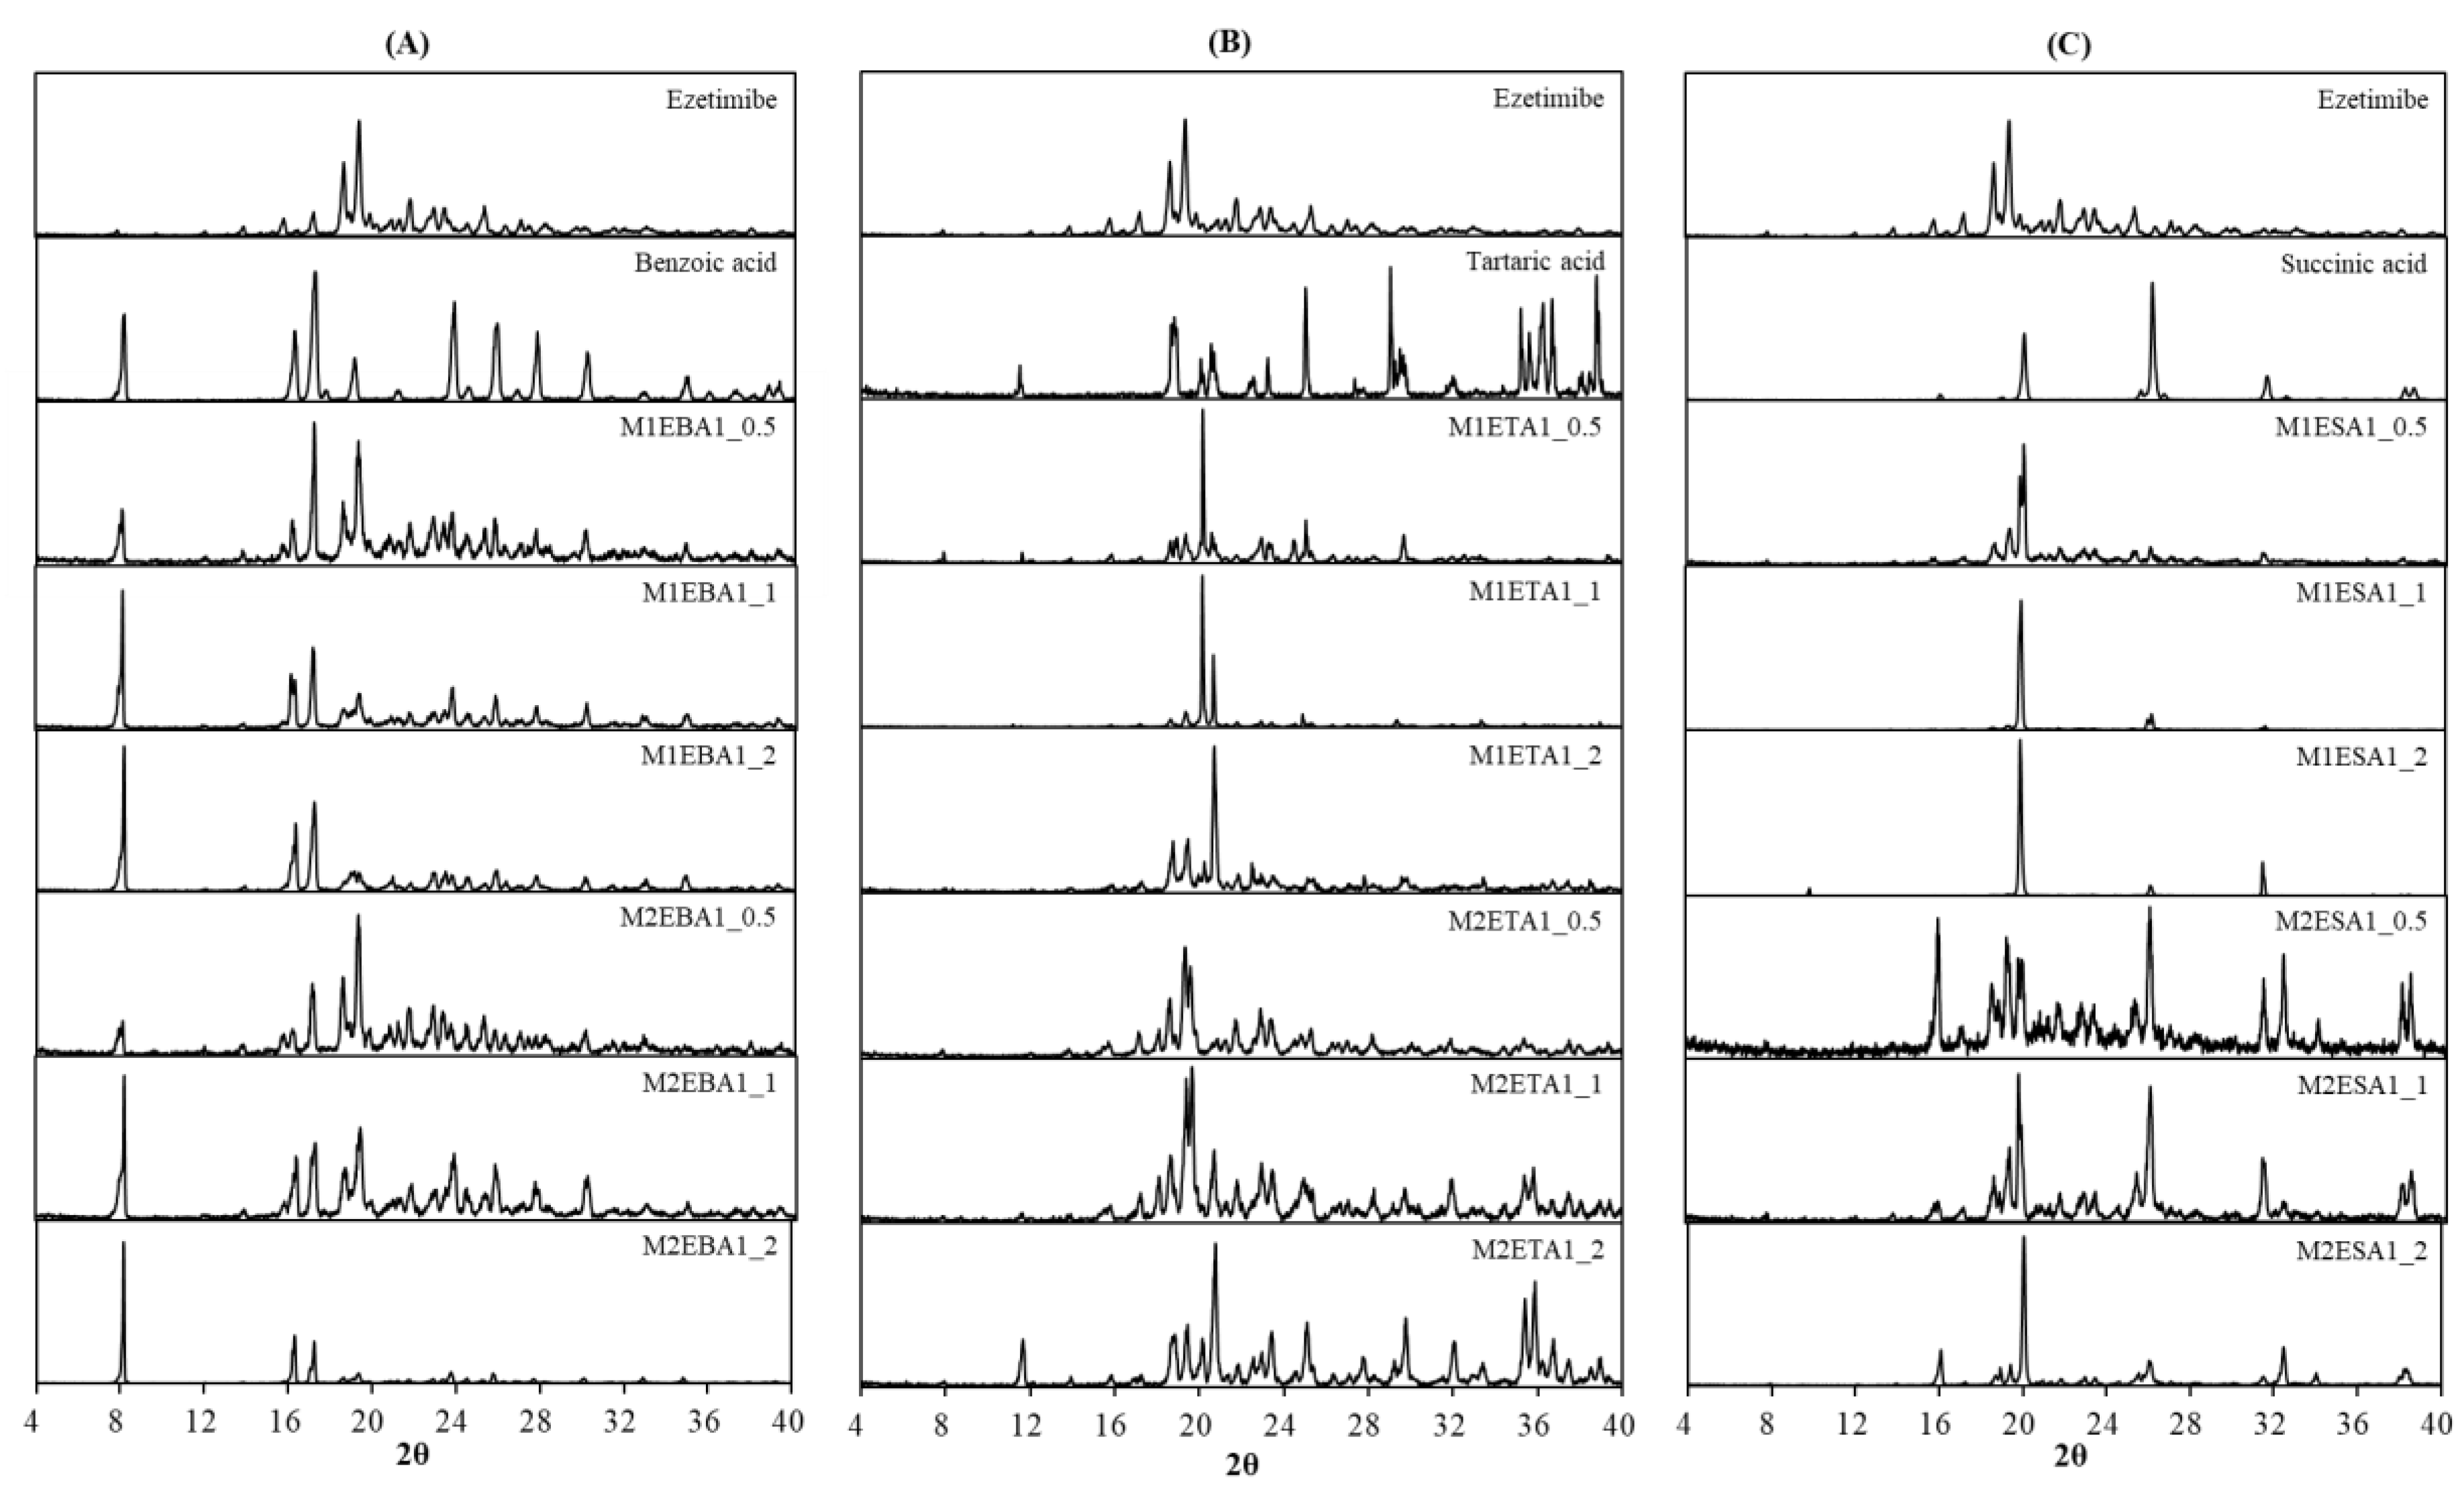
Figure 4.
Cocrystal phase diagrams of (A) ezetimibe/benzoic acid, (B) ezetimibe/tartaric acid, and (C) ezetimibe/succinic acid cocrystals prepared using solvent evaporation method; and (D) ezetimibe/benzoic acid, (E) ezetimibe/tartaric acid, and (F) ezetimibe/succinic acid cocrystals prepared using anti-solvent precipitation method.
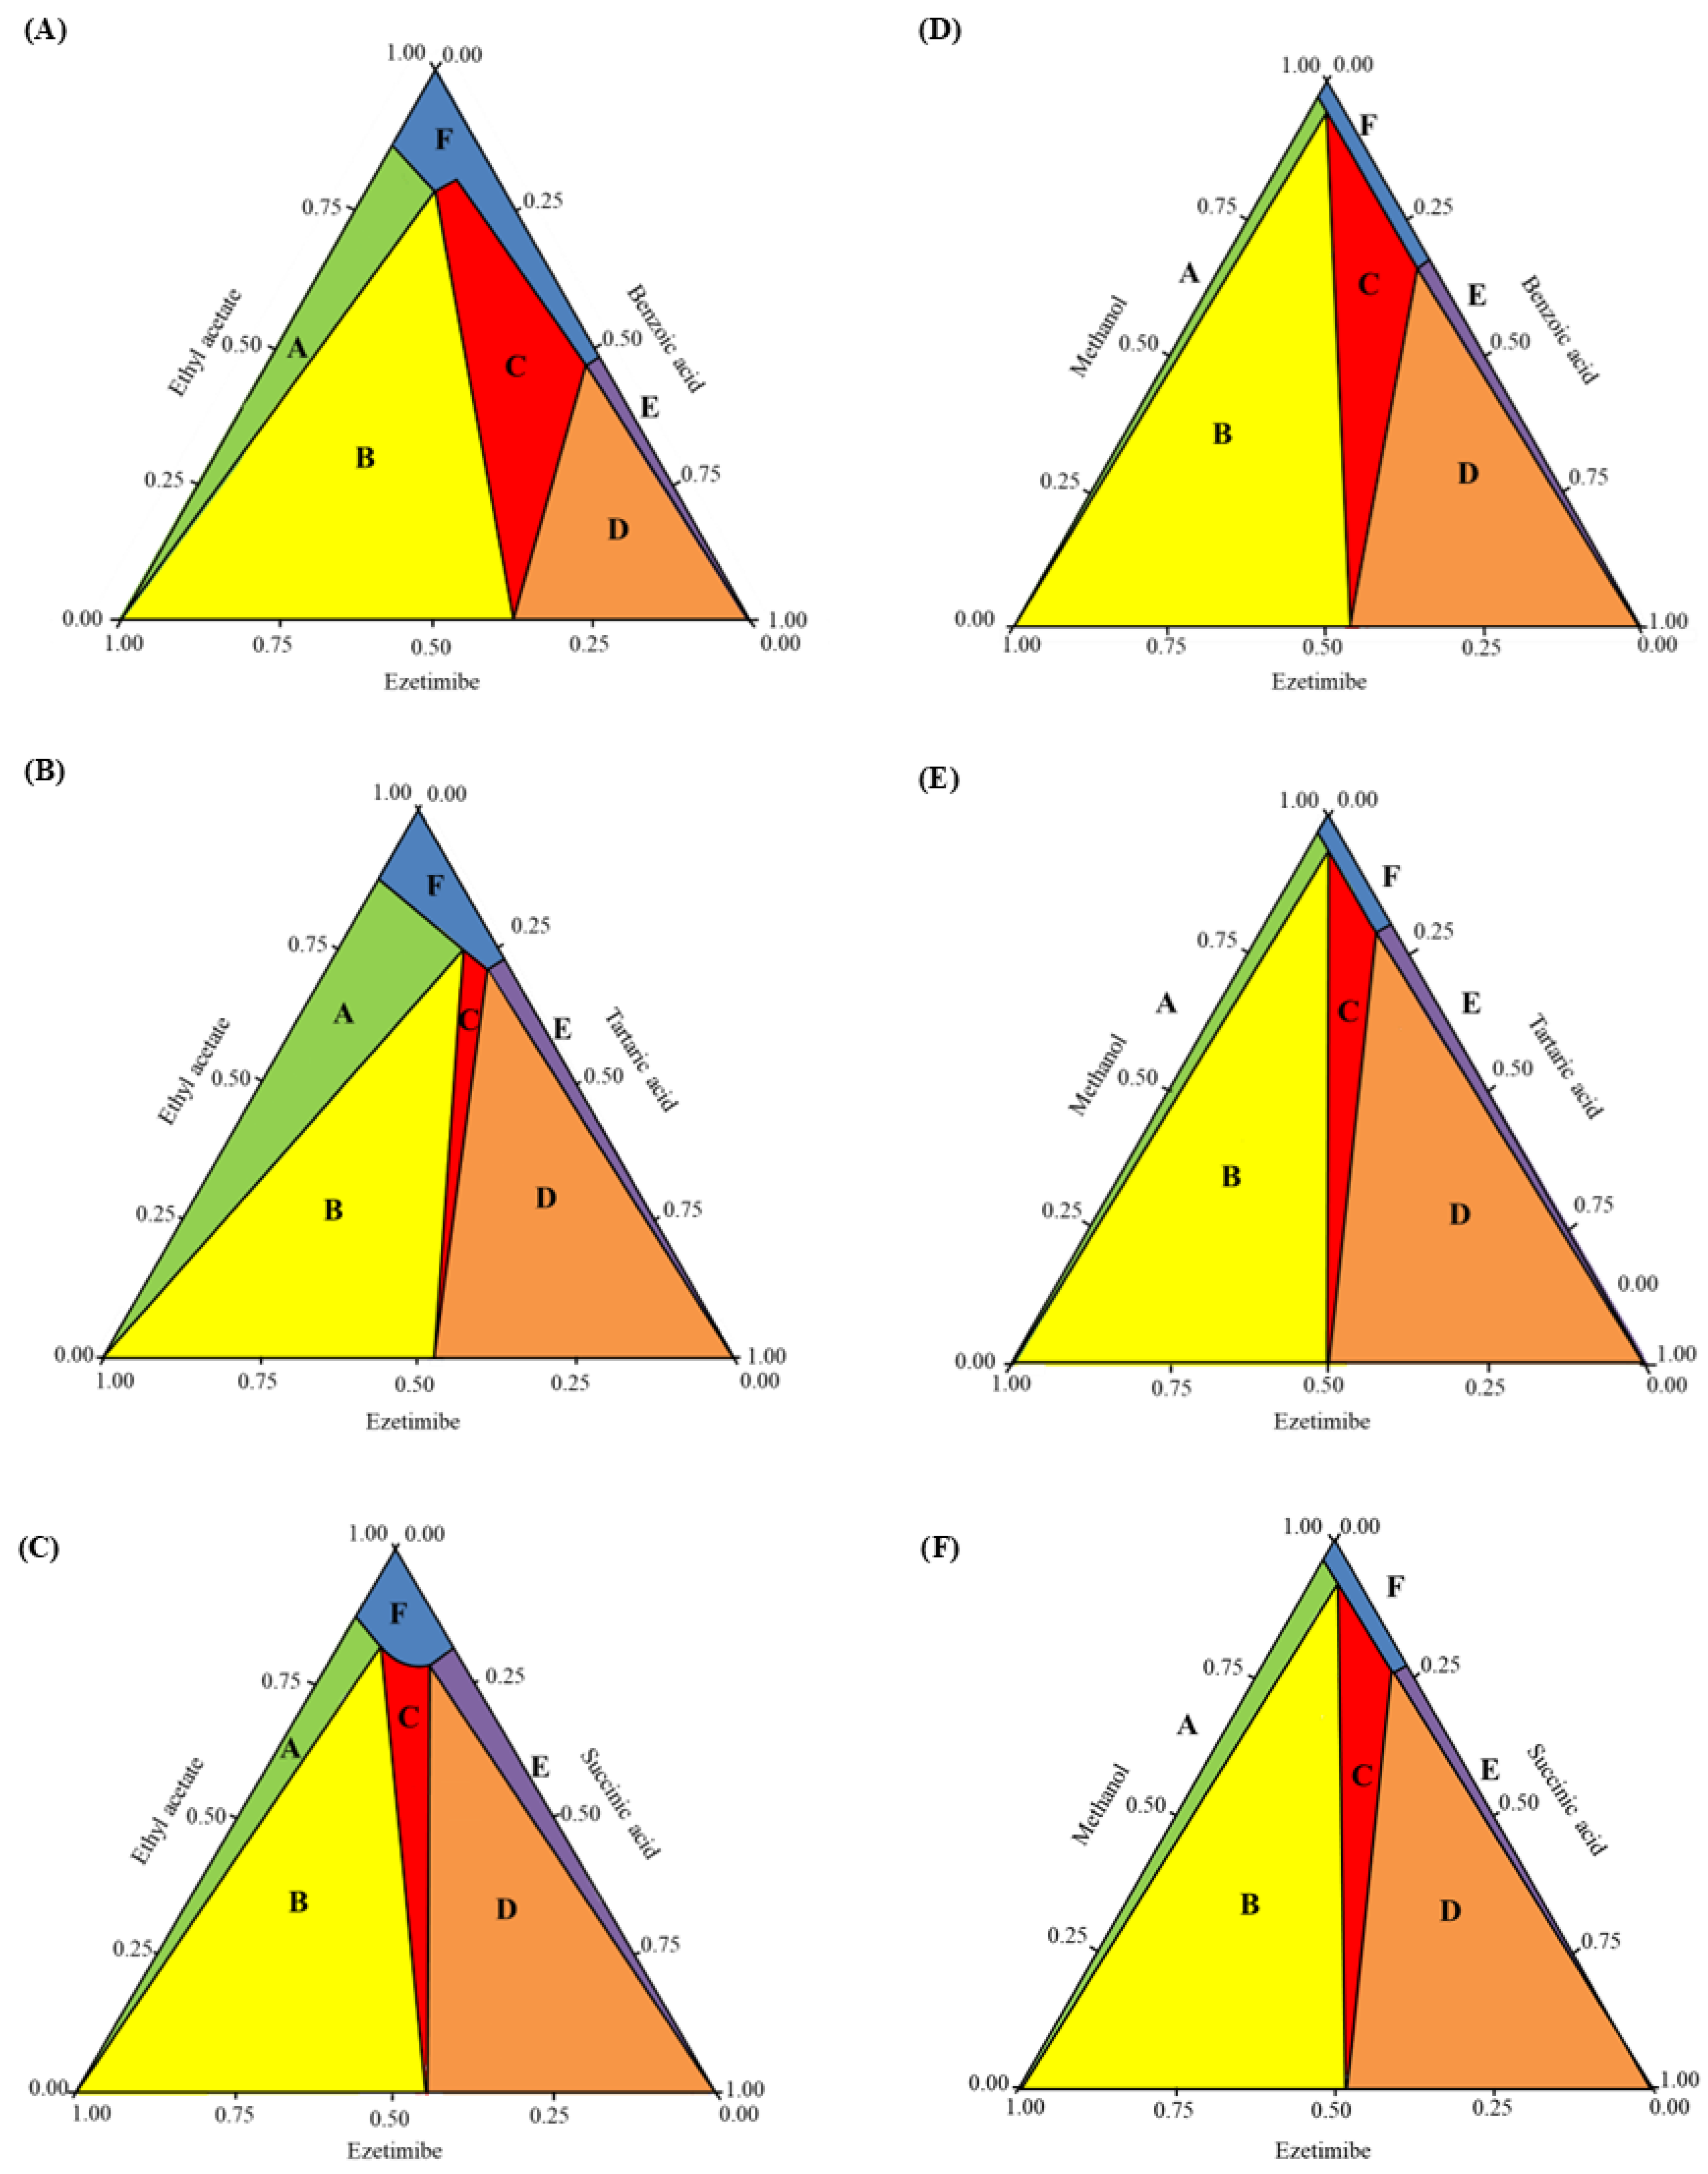
Figure 5.
Solubility of ezetimibe/benzoic acid, ezetimibe/tartaric acid, and ezetimibe/succinic acid cocrystals, along with ezetimibe compound, evaluated in 0.5% w/v SLS, 0.5% w/v PEG, 0.5% w/v Transcutol®, and 0.1% w/v CTAB. The samples were prepared using (A) solvent evaporation and (B) anti-solvent precipitation methods.
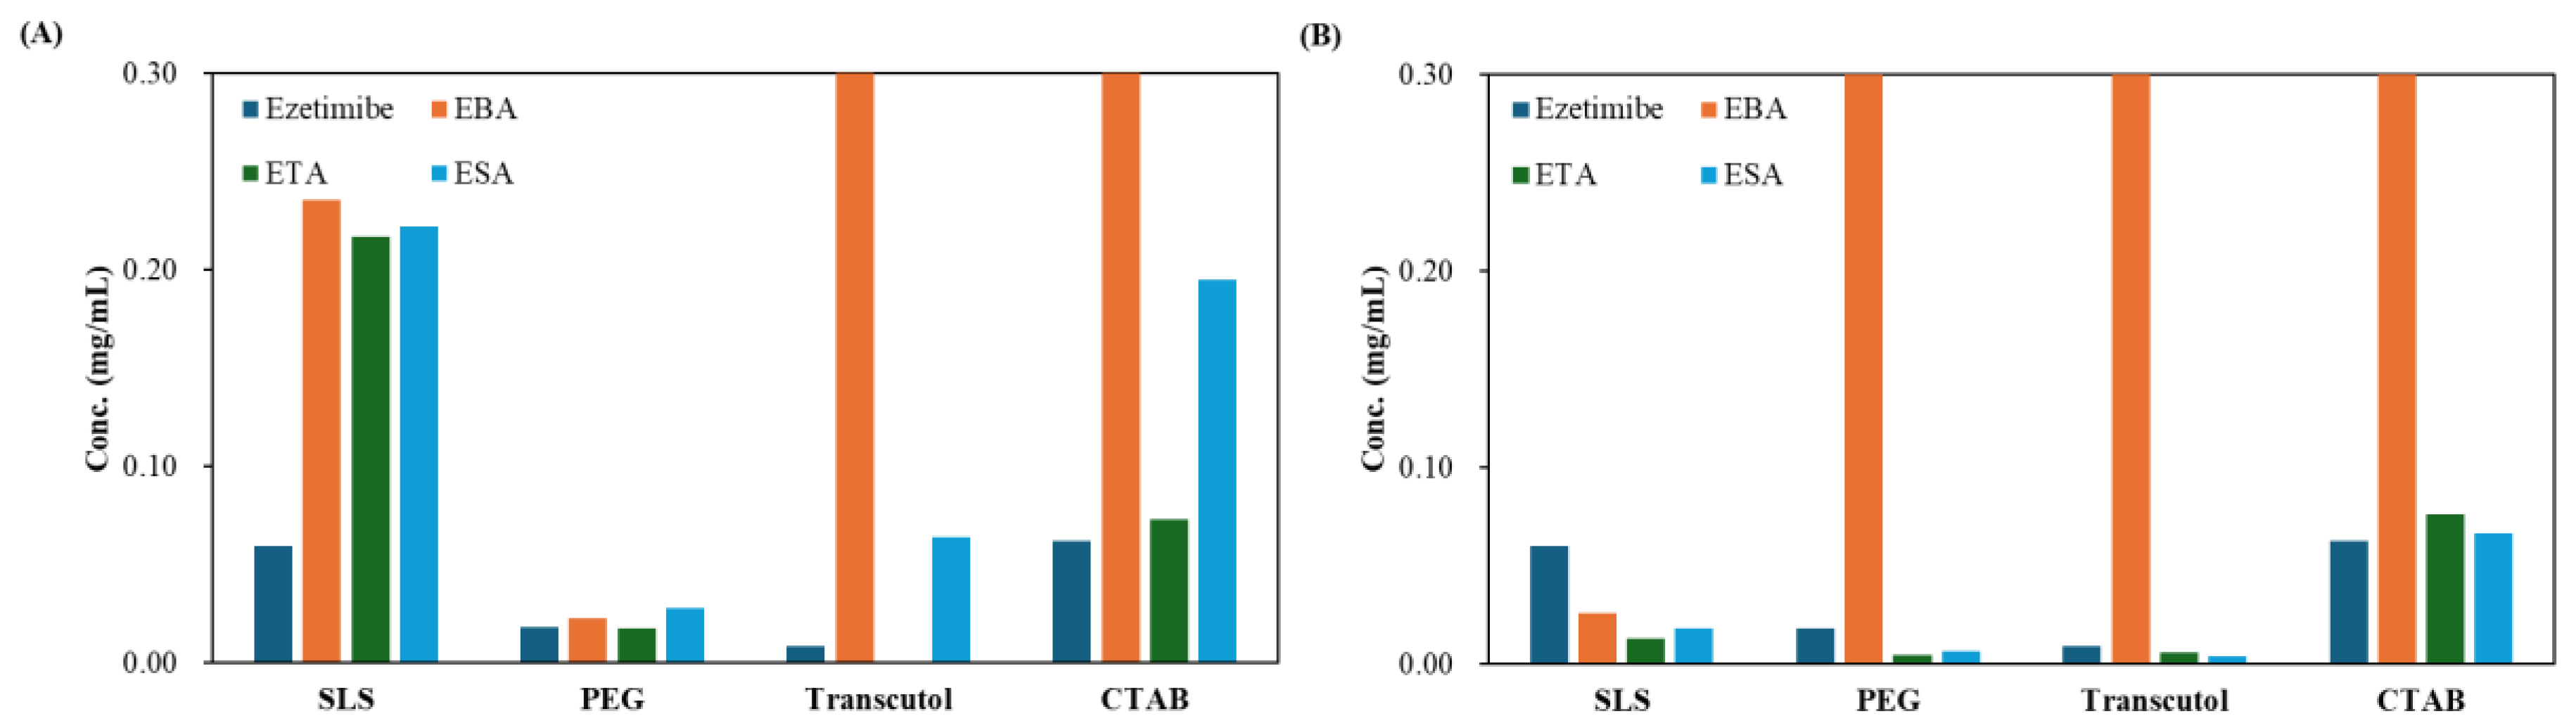
Figure 6.
In vitro release of ezetimibe/benzoic acid, ezetimibe/tartaric acid, and ezetimibe/succinic acid cocrystals, along with ezetimibe compound, in 0.45% w/v SLS 0.05 M phosphate buffer (pH 4.5). The samples were prepared using (A) solvent evaporation and (B) anti-solvent precipitation methods.
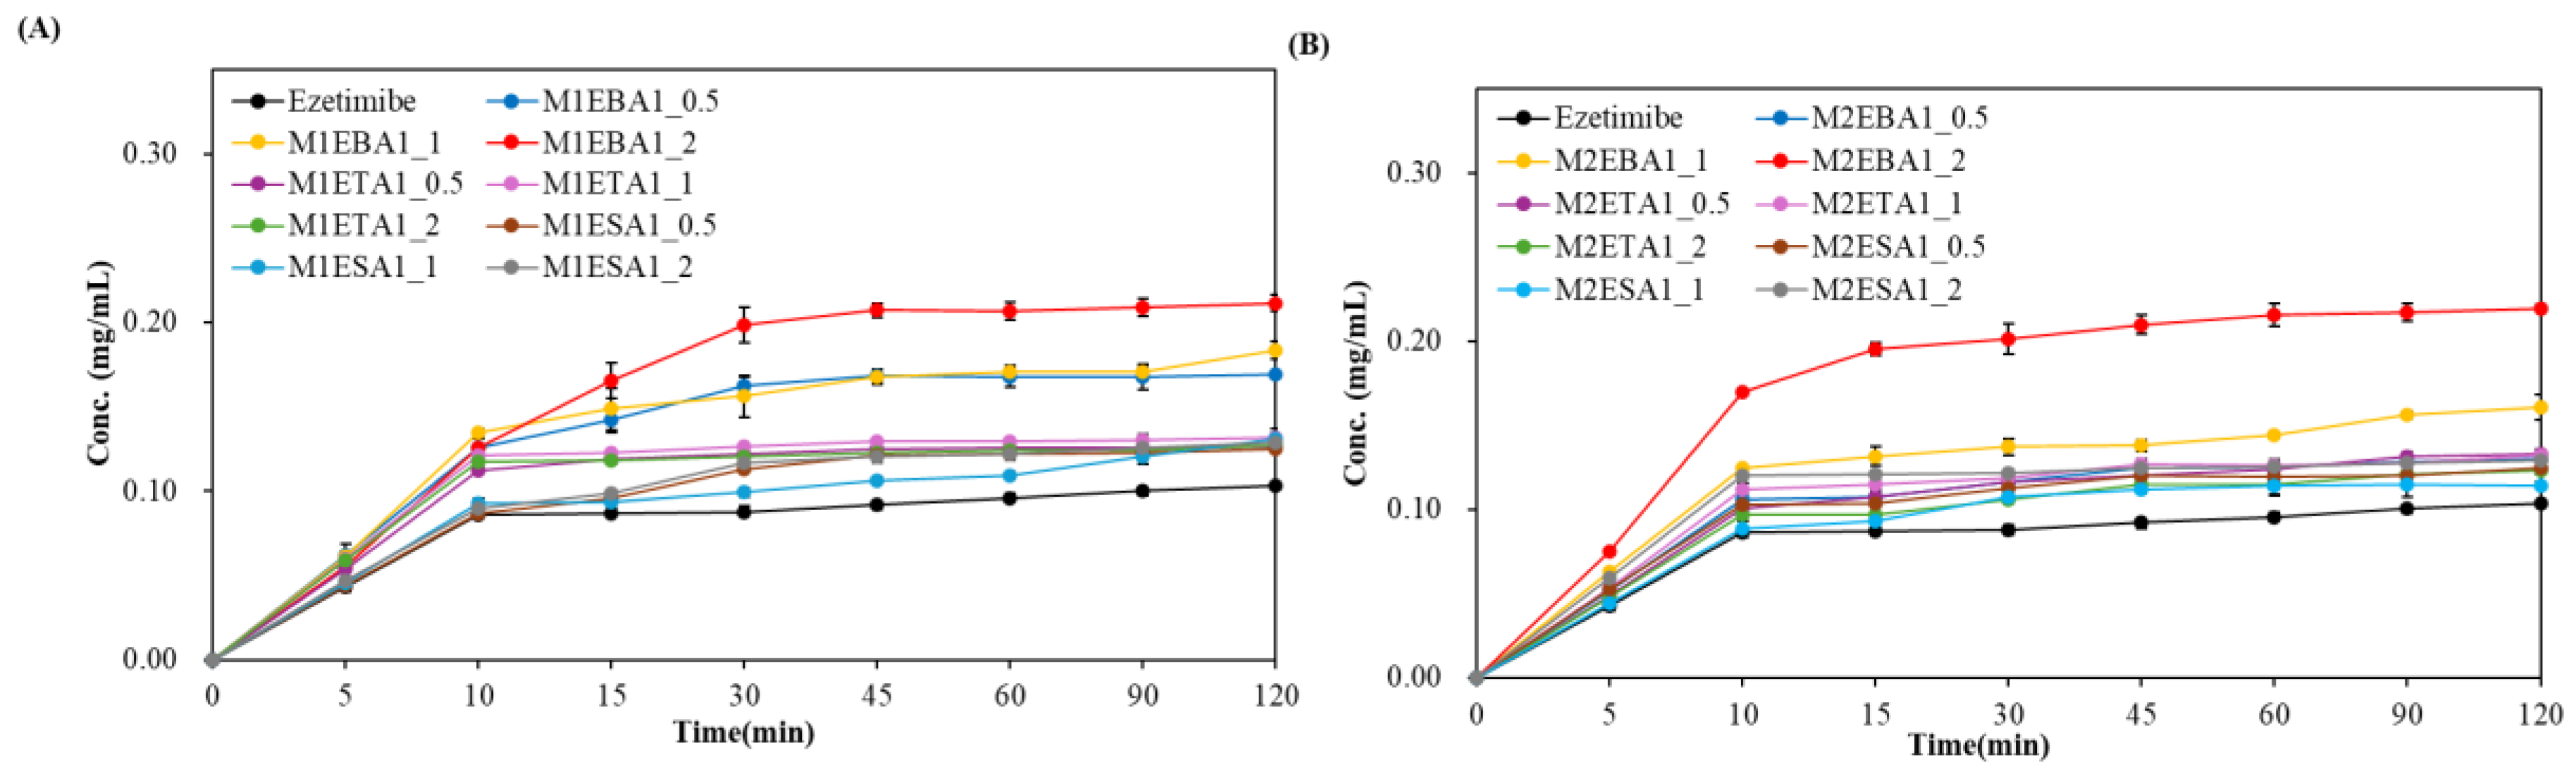
Figure 7.
Microscopic images of ezetimibe/benzoic acid cocrystals prepared using (A-C) solvent evaporation and (J-L) anti-solvent precipitation methods at 1:0.5, 1:1, 1:2 ratios. Images of the ezetimibe/tartaric acid cocrystals using the (D-F) solvent evaporation and (M-O) anti-solvent precipitation methods at 1:0.5, 1:1, 1:2 ratios. Images of the ezetimibe/succinic acid cocrystals using the (G-I) solvent evaporation and (P-R) anti-solvent precipitation methods at 1:0.5, 1:1, and 1:2 ratios.
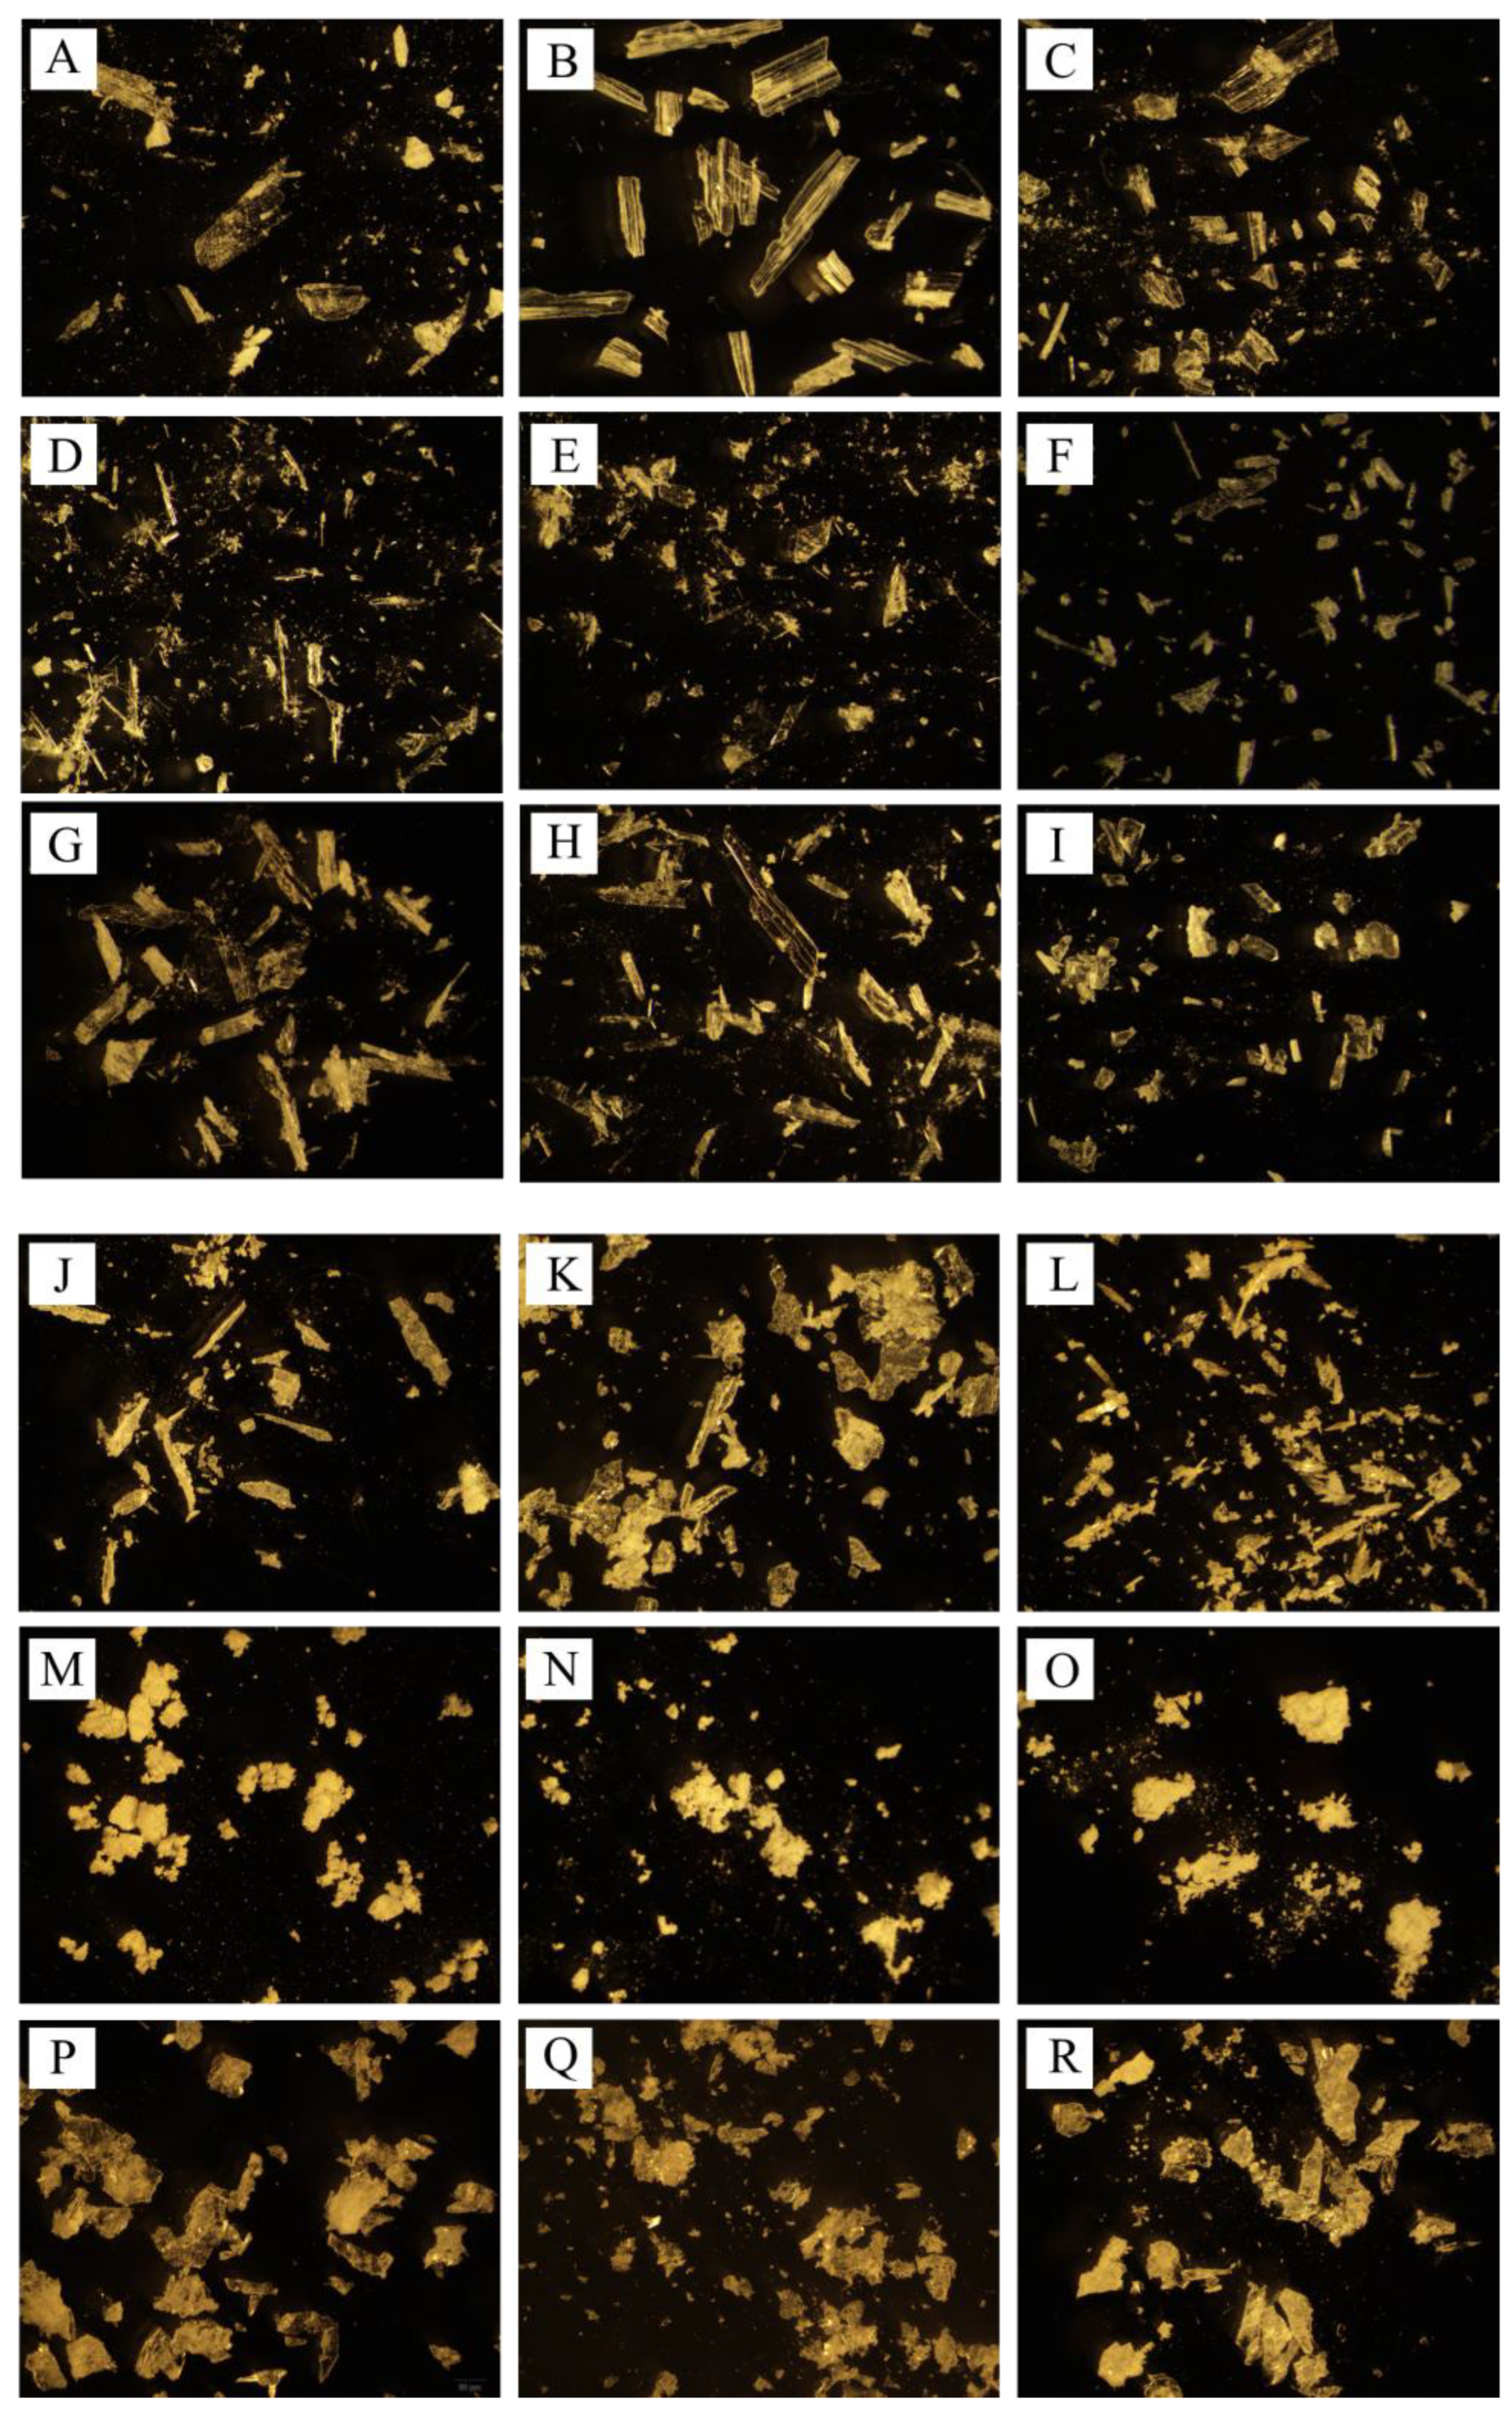
Figure 8.
SEM images of ezetimibe/benzoic acid cocrystals prepared using the (A-C) solvent evaporation and (J-L) anti-solvent precipitation methods at 1:0.5, 1:1, 1:2 ratios. Images of the ezetimibe/tartaric acid cocrystals using the (D-F) solvent evaporation and (M-O) anti-solvent precipitation methods at 1:0.5, 1:1, 1:2 ratios. Images of the ezetimibe/succinic acid cocrystals using the (G-I) solvent evaporation and (P-R) anti-solvent precipitation methods at 1:0.5, 1:1, 1:2 ratios.
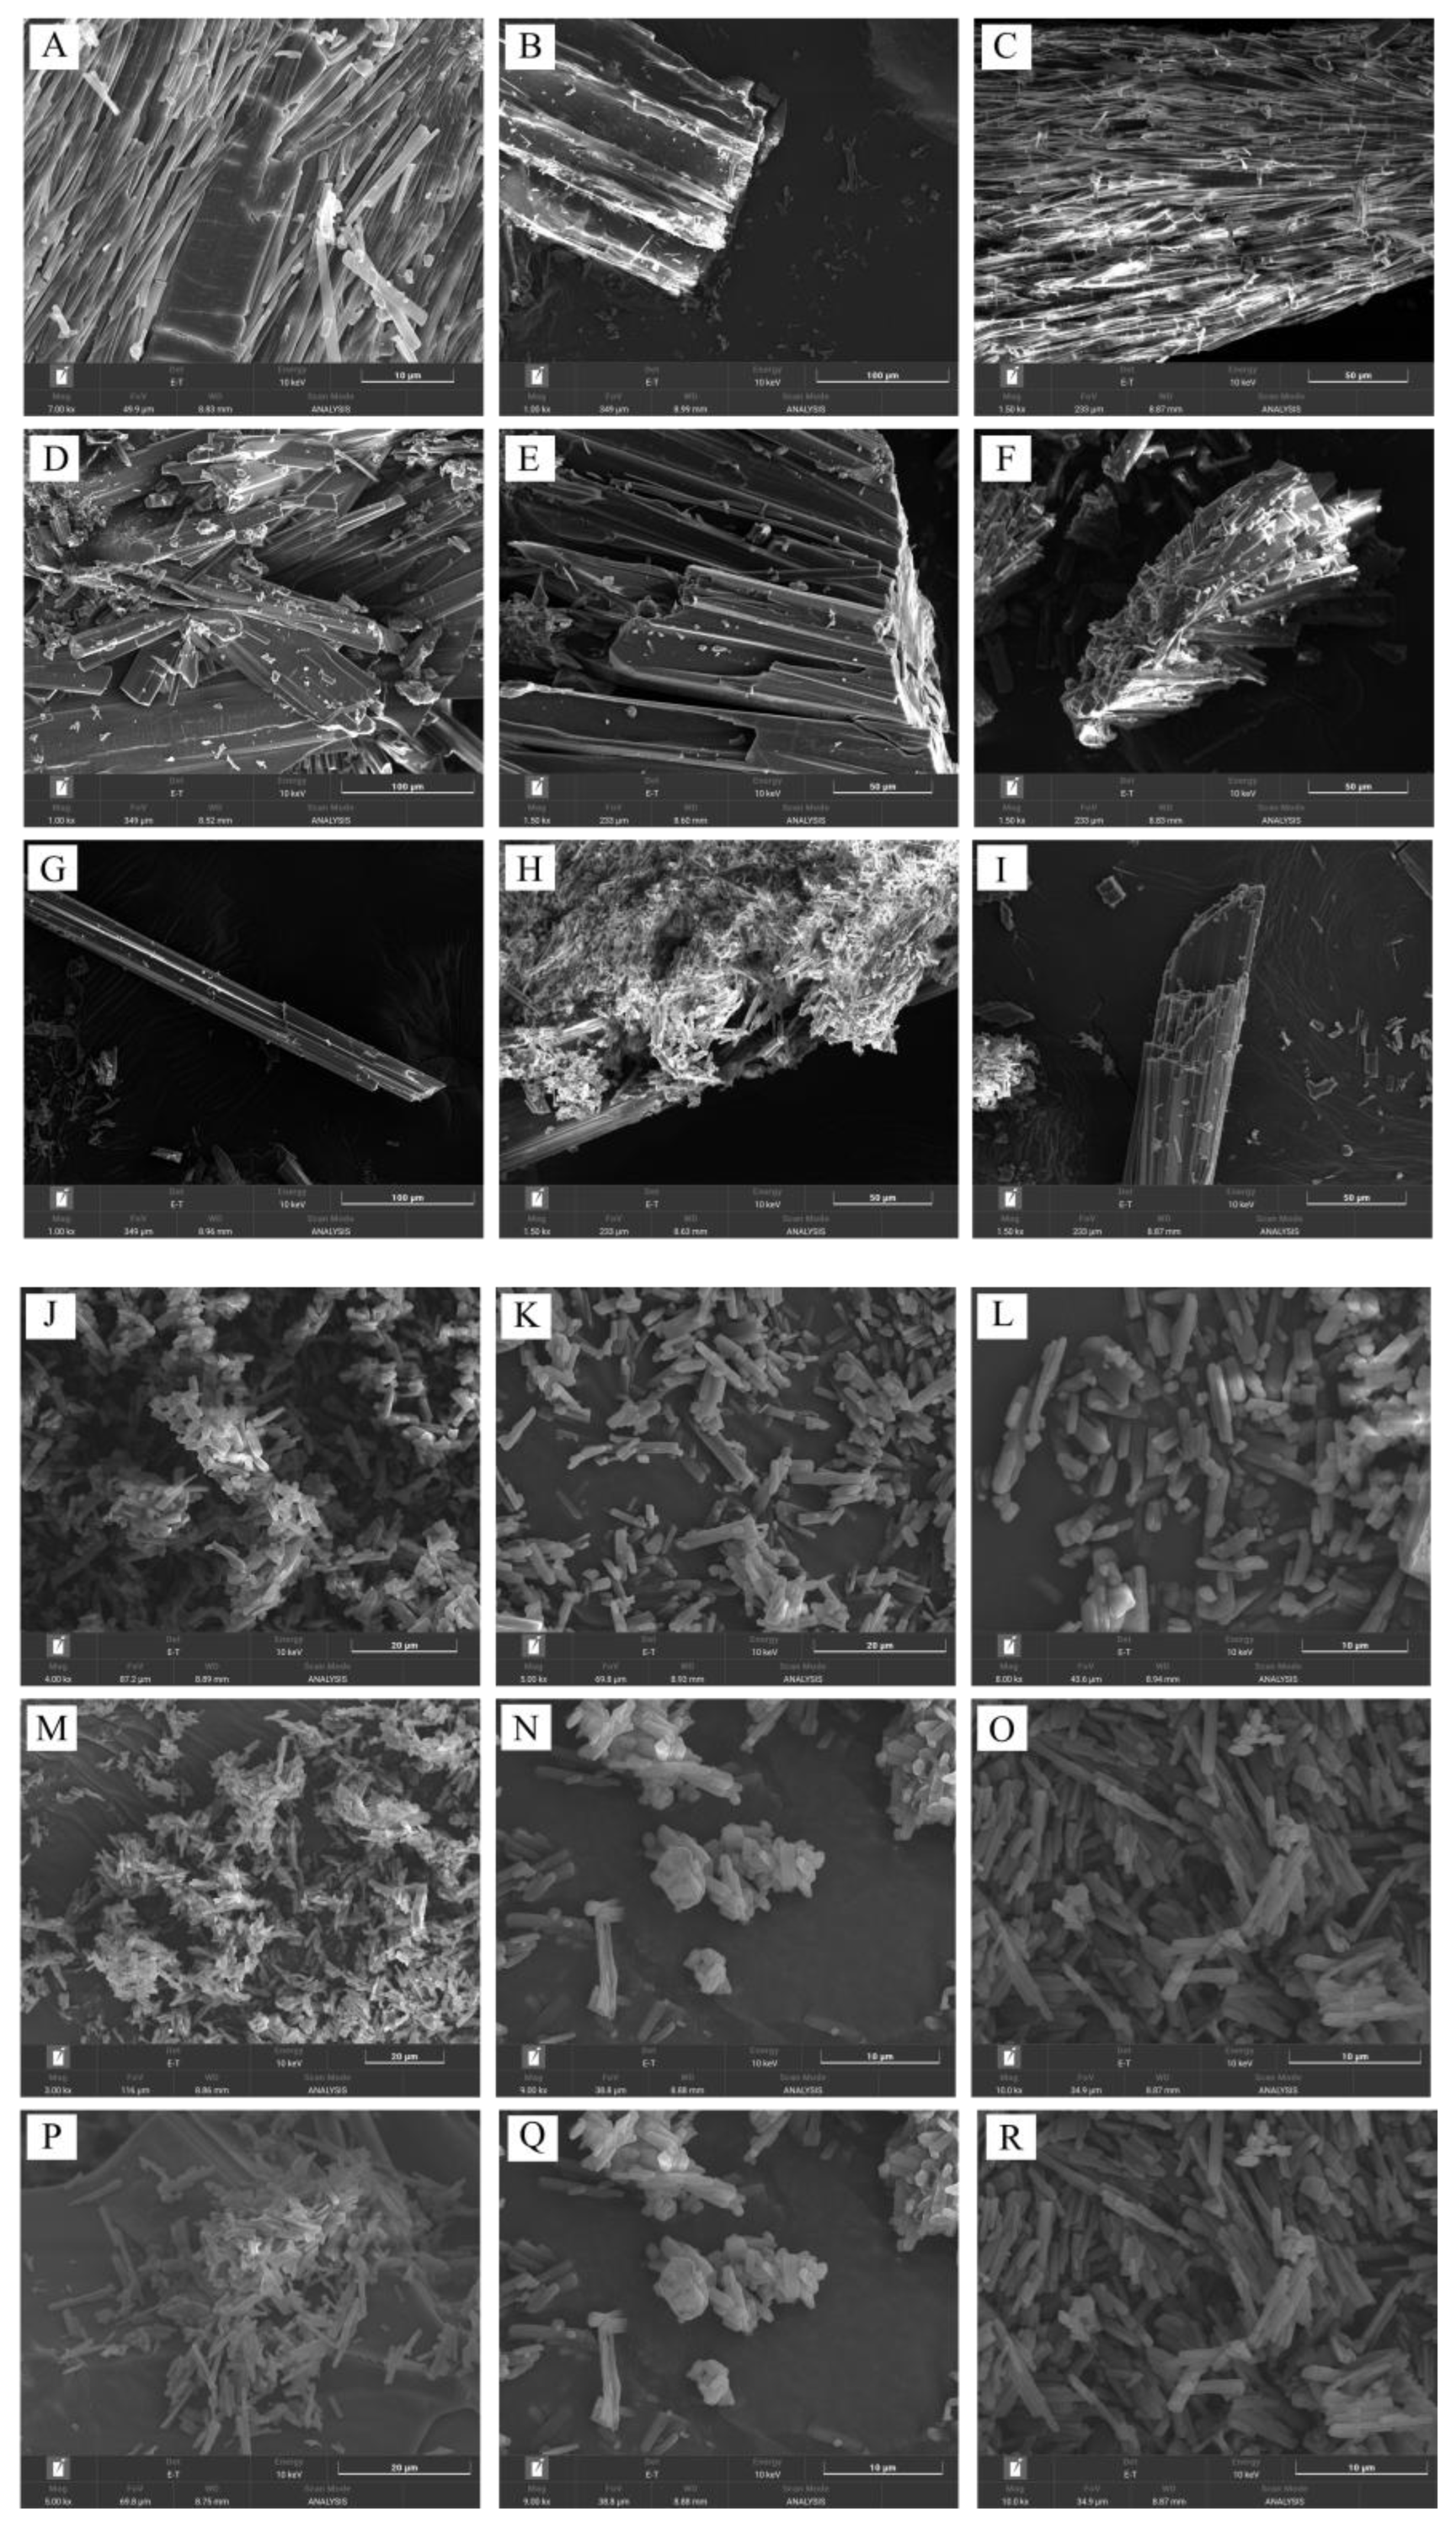

Table 1.
DSC thermogram analysis of ezetimibe, coformers, cocrystals (ezetimibe/benzoic acid, ezetimibe/tartaric acid, and ezetimibe/succinic acid), and their physical mixtures.
Table 1.
DSC thermogram analysis of ezetimibe, coformers, cocrystals (ezetimibe/benzoic acid, ezetimibe/tartaric acid, and ezetimibe/succinic acid), and their physical mixtures.
| 1st Tm | 2nd Tm | ||||
| ºC | J/g | ºC | J/g | ||
| API | Ezetimibe | 162.36 | 87.04 | - | - |
| Coformer | Benzoic acid | 123.19 | 148.9 | - | - |
| SEV method | M1EBA1_0.5 | 110.24 | 50.05 | - | - |
| M1EBA1_1 | 111.68 | 120.5 | - | - | |
| M1EBA1_2 | 111.06 | 107.8 | - | - | |
| SAS method | M21EBA1_0.5 | 109.76 | 26.89 | 119.27 | 70.56 |
| M2EBA1_1 | 109.65 | 18.04 | 120.44 | 96.95 | |
| M2EBA1_2 | 109.22 | 10.18 | 120.76 | 109.5 | |
| Physical mixture | PMEBA1_0.5 | 110.24 | 8.277 | 162.44 | 68.03 |
| PMEBA1_1 | 111.14 | 33.87 | 122.38 | 56.96 | |
| PMEBA1_2 | 110.43 | 56.01 | 119.55 | 22.84 | |
| Coformer | Tartaric acid | 172.67 | 251.2 | - | - |
| SEV method | M1ETA1_0.5 | 160.24 | 82.41 | 167.25 | 13.83 |
| M1ETA1_1 | 159.32 | 68.19 | 166.70 | 35.06 | |
| M1ETA1_2 | 156.38 | 13.31 | 171.18 | 182.4 | |
| SAS method | M21ETA1_0.5 | 154.14 | 61.87 | 162.58 | 33.18 |
| M2ETA1_1 | 154.22 | 39.60 | 165.35 | 89.38 | |
| M2ETA1_2 | 154.67 | 29.09 | 168.12 | 144.3 | |
| Physical mixture | PMETA1_0.5 | 158.11 | 11.478 | 170.59 | 143.8 |
| PMETA1_1 | 157.01 | 12.39 | 171.33 | 183.4 | |
| PMETA1_2 | 156.84 | 12.09 | 171.01 | 188.9 | |
| Coformer | Succinic acid | 188.91 | 299.6 | - | - |
| SEV method | M1ESA1_0.5 | 151.82 | 17.62 | 183.22 | 111.1 |
| M1ESA1_1 | 155.57 | 24.83 | 185.36 | 154.0 | |
| M1ESA1_2 | 150.92 | 2.79 | 187.38 | 231.8 | |
| SAS method | M21ESA1_0.5 | 150.39 | 4.55 | 186.44 | 174.8 |
| M2ESA1_1 | - | - | 188.08 | 245.4 | |
| M2ESA1_2 | 149.55 | 1.78 | 187.06 | 223.3 | |
| Physical mixture | PMESA1_0.5 | 152.03 | 21.01 | 182.97 | 118.8 |
| PMESA1_1 | 152.25 | 52.72 | 183.65 | 70.14 | |
| PMESA1_2 | 151.16 | 22.04 | 185.89 | 177.1 | |
Table 2.
Significant functional groups observed in the FTIR spectra of ezetimibe, Cocrystal I (ezetimibe/benzoic acid), Cocrystal II (ezetimibe/tartaric acid), and Cocrystal III (ezetimibe/succinic acid).
Table 2.
Significant functional groups observed in the FTIR spectra of ezetimibe, Cocrystal I (ezetimibe/benzoic acid), Cocrystal II (ezetimibe/tartaric acid), and Cocrystal III (ezetimibe/succinic acid).
| Cocrystal I (benzoic acid) |
Cocrystal II (tartaric acid) |
Cocrystal III (succinic acid) |
Ezetimibe | Functional group | ||||
| SEV | SAS | SEV | SAS | SEV | SAS | |||
| 1: 0.5 | 3224.89 | 3228.57 | - | - | 3230.96 | 3228.57 | 3264.09 | O-H |
| 2912.29 | 2912.94 | - | - | 2912.90 | 2912.94 | 2928.09 | C-H | |
| - | 1714.46 | 1713.08 | 1715.16 | 1714.11 | 1714.46 | 1726.06 | C=O | |
| 1507.88 | 1507.70 | 1507.63 | 1507.92 | 1507.89 | 1507.70 | 1507.08 | C=C | |
| 1218.85 | 1218.67 | 1218.64 | 1219.11 | 1200.53 | 1218.67 | 1212.71 | C-F | |
| 1: 1 | - | 3234.65 | - | 3406.25 | 3220.01 | - | 3264.09 | O-H |
| - | 2912.69 | - | - | 2912.97 | 2930.36 | 2928.09 | C-H | |
| 1713.53 | 1713.42 | 1713.46 | 1715.19 | 1713.14 | - | 1726.06 | C=O | |
| 1507.94 | 1507.58 | 1507.53 | 1507.99 | 1507.81 | 1506.62 | 1507.08 | C=C | |
| 1219.04 | 1218.49 | 1217.82 | 1218.20 | 1200.78 | 1196.61 | 1212.71 | C-F | |
| 1: 2 | - | - | 3324.29 | 3396.99 | 3230.96 | - | 3264.09 | O-H |
| - | 2828.22 | - | - | 2928.02 | 2912.70 | 2928.09 | C-H | |
| 1712.60 | 1678.48 | 1714.94 | 1713.99 | 1724.75 | 1713.97 | 1726.06 | C=O | |
| 1507.76 | 1508.94 | 1507.93 | 1508.27 | 1506.87 | 1507.74 | 1507.08 | C=C | |
| 1219.82 | 1220.23 | 1217.57 | 1217.08 | 1212.61 | 1197.52 | 1212.71 | C-F | |
Table 3.
Crystallographic properties (space group, crystal structure, and lattice parameters) of Cocrystal I (ezetimibe/benzoic acid), Cocrystal II (ezetimibe/tartaric acid), and Cocrystal III (ezetimibe/succinic acid).
Table 3.
Crystallographic properties (space group, crystal structure, and lattice parameters) of Cocrystal I (ezetimibe/benzoic acid), Cocrystal II (ezetimibe/tartaric acid), and Cocrystal III (ezetimibe/succinic acid).
| Property |
Cocrystal I (benzoic acid) |
Cocrystal II (tartaric acid) |
Cocrystal III (succinic acid) |
| Mol. Wt. | Ezetimibe: 404.45 g/mol | Ezetimibe: 404.45 g/mol | Ezetimibe: 404.45 g/mol |
| Benzoic acid: 122.12 g/mol | Tartaric acid: 150.09 g/mol | Succinic acid: 118.09 g/mol | |
| Space group | P2₁/n | P212121 | P212121 |
| Monoclinic | Orthorhombic | Orthorhombic | |
| a = 5.42 Å | a = 6.18 Å | a = 6.19 Å | |
| b = 5.05 Å | b = 15.45 Å | b = 15.47 Å | |
| c = 21.61 Å | c = 21.91 Å | c = 21.96 Å | |
| α = 90.00° | α = 89.98° | α = 90.00° | |
| β = 95.95° | β = 90.03° | β = 90.00° | |
| γ = 90.00° | γ = 90.00° | γ = 90.00° | |
| Z (Units/cell) | 4 | 4 | 4 |
Table 4.
The parameters of the calibration curve correspond to the linearity range for ezetimibe.
| Parameters | Mean ± SD |
| Slope | 44.58 ± 0.02 |
| Intercept | 0.01 |
| Correlation coefficient (R2) | 0.9994 |
| Limit of quantification (LOQ) | 0.04 µg/mL |
| Limit of detection (LOD) | 0.01 µg/mL |
Table 5.
Summary of mean (±SD) in vivo pharmacokinetic parameters for four ezetimibe formulations (CRYS101–CRYS104) in Sprague-Dawley rats.
Table 5.
Summary of mean (±SD) in vivo pharmacokinetic parameters for four ezetimibe formulations (CRYS101–CRYS104) in Sprague-Dawley rats.
| Formulation | Dose (mg/kg) | Cmax (ng/mL) | Tmax (h) | AUClast (ng·h/mL) | AUCinf (ng·h/mL) |
| CRYS101 | 10 | 6.73 ± 4.29 | 1.33 ± 0.76 | 11.03 ± 8.63 | 41.83# |
| CRYS102 | 30 | 5.50 ± 4.23 | 1.13 ± 0.48 | 15.26 ± 7.08 | 31.08# |
| CRYS103 | 30 | 18.38 ± 9.52 | 2.83 ± 2.75 | 40.36 ± 30.94 | 17.75# |
| CRYS104 | 30 | 4.30 ± 3.25 | 1.00# | 9.62 ± 8.82 | ND |
ND : Not determined, below quantification limit (1 ng/mL). # : SD not determined.
Disclaimer/Publisher’s Note: The statements, opinions and data contained in all publications are solely those of the individual author(s) and contributor(s) and not of MDPI and/or the editor(s). MDPI and/or the editor(s) disclaim responsibility for any injury to people or property resulting from any ideas, methods, instructions or products referred to in the content. |
© 2025 by the authors. Licensee MDPI, Basel, Switzerland. This article is an open access article distributed under the terms and conditions of the Creative Commons Attribution (CC BY) license (http://creativecommons.org/licenses/by/4.0/).
Copyright: This open access article is published under a Creative Commons CC BY 4.0 license, which permit the free download, distribution, and reuse, provided that the author and preprint are cited in any reuse.


