Submitted:
17 June 2024
Posted:
18 June 2024
You are already at the latest version
Abstract
Flaring in the SS 433 microquasar is dominated by outbursts from material at distances from the centre of mass of the binary system comparable to the separation of the two components. This note completes a demonstration that ejected plasma leaves the system in the region of the L_2 point, there overflowing the outer Roche lobe and giving rise to a spiral structure as it leaves the system as part of the local environment.
Keywords:
X-rays: binaries: ULX
; stars: binaries: SS 433
; galaxies: stellar content: microquasar
1. Introduction
The Galactic microquasar SS 433 is best known for its precessing jets and for being, in all probability, the only ULX source in the Galaxy. The precessing jets, initially defining a cone, are collimated into a cylindrical conformation about 40 pc from launch. The collimated jets punch though the expanding supernova remnant to produce extrusions in the nebula W50, which envelopes the central engine. In the process of collimation, it seems that shocks are responsible for generating TeV gamma radiation [1]. The collimation is the result of ambient pressure in the SNR cavity [2], in turn dependent on the interstellar environment; collimation is expected to take place 35pc downstream [3], just where the origin of the TeV gammas is located [1]. The environment of SS 433 is not only of interest on this scale and the more that is understood about the environment of this unique object the better. Here we are not concerned with the recent TeV gamma observations, but with the phenomenon of flaring, which occurs on the very different scale of the binary structure, ~1 mpc.
These flares are intermittent outbursts and have been observed at radio wavelengths and in optical line spectra, notably in Balmer H. Analysis of a sequence of such observations, accompanied by radio at 2.15 GHz, may be found in [4]. The H data therein can be seen in [5]. The flare onset is rapid and manifested by a broad and complex structure. The wind from the accretion disk doubles in speed; both red and blue flaring appear simultaneously, with Doppler shifts ~ 500 The general appearance is what might be expected from a ring rotating with this speed and looked at almost edge on. The data were originally interpreted as from the accretion disk [4,6] and this interpretation proved to be completely wrong [7].
2. The H
ta
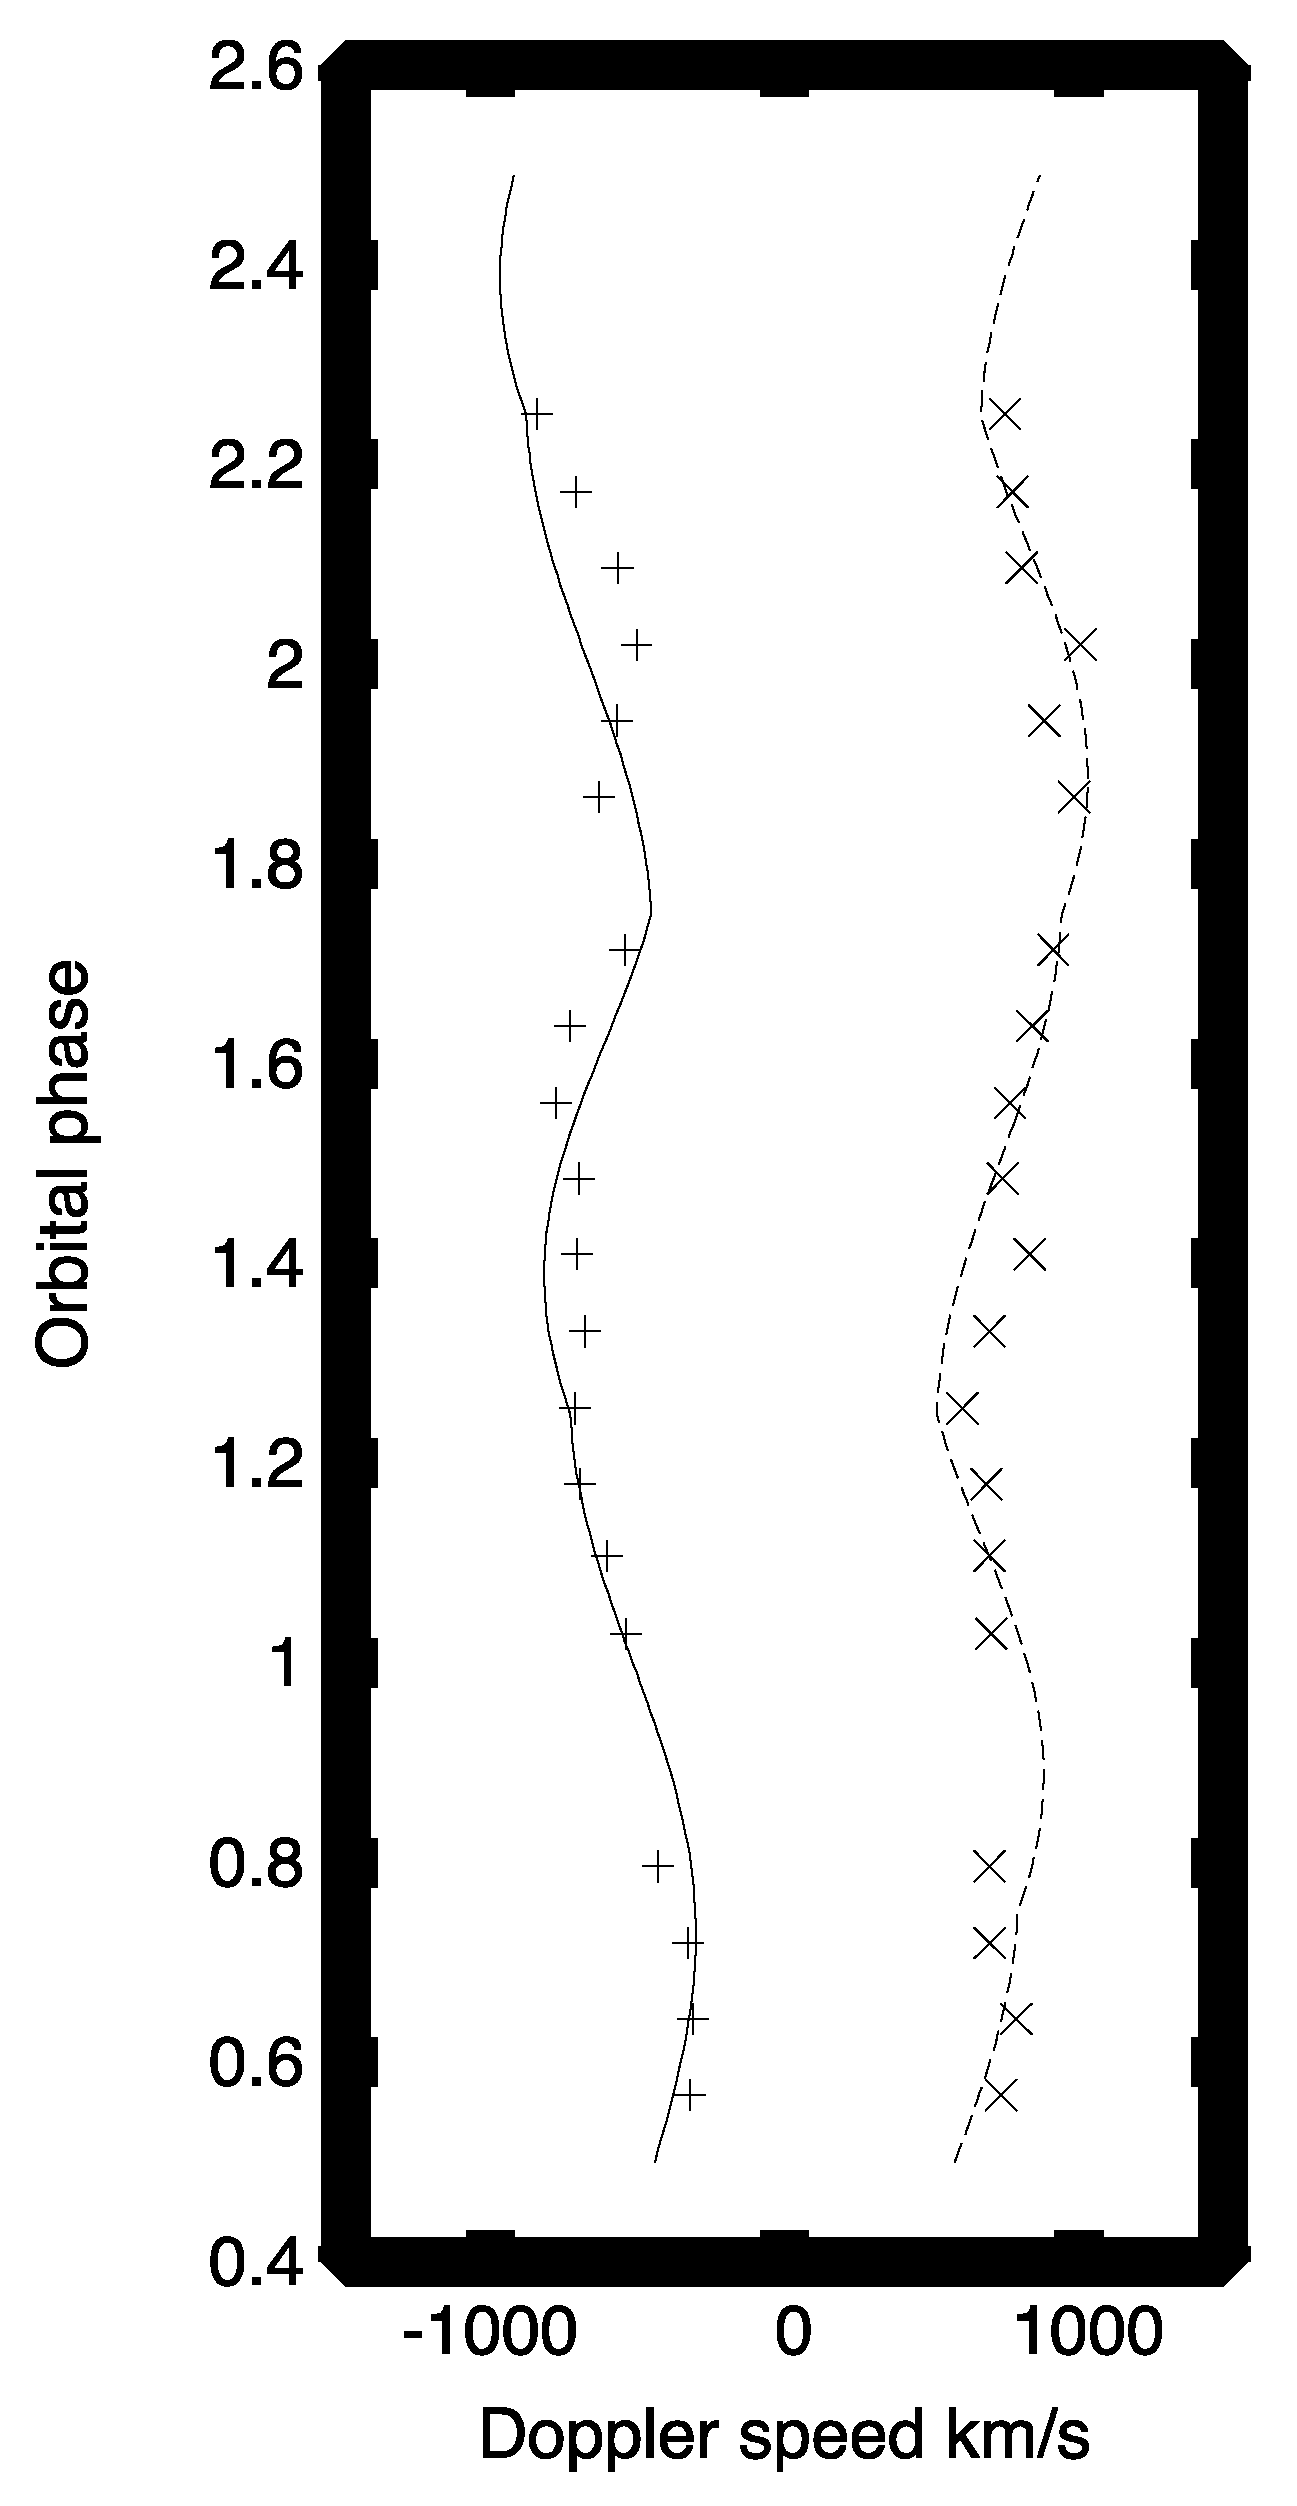
The most relevant representation of these deceptive data is provided in Figure 1; originally shown in [6] (and again in [7]). The red and blue flare components were fitted to gaussian distributions and the Doppler shifts of the mid points plotted, day by day, as a function of the phase of the binary system. The red and the blue swing together from the red (at phase 0.75) to the blue (at 1.25). Separated by ~ 1000 they each exhibit a change in velocity of ~350 . This is just twice the orbital velocity of the compact object itself and is the most deceptive feature of these data, almost demanding interpretation as radiation from anaccretion disk about the compact object. There are some minor features in addition, for the two trajectories draw apart with time (suggesting that the supposed ring or disk rotates faster as time goes on) and it also appears that the maximum red and blue shifts of the trajectories move to later phases. The curves in Figure 1 represent a very simple model embodying these features, a rotating ring speeding up with time in orbit about the compact object, augmented by an infalling stream on its way to join the accretion disk and hence streaming in its direction. Such a stream would augment the red between phases of 0.75 and 0.25, the blue between 0.25 and 0.75, see equations (1 & 2) in [6]. This crude model captured the principal features well, in particular the difference of 350 between the extremes of variation with orbital phase.
expulsion of Roche lobe overflow (see text).
3. The Red and Blue Flares Cannot Be Glimpses of the Accretion Disk
What could be wrong is that the radius of the accretion disk would have to be visible deep inside the photosphere surrounding the compact object, given an orbital velocity ~500 . Then in 2017 interferometric measurements using the GRAVITY instrument [8] sampled a Br signal in (angular) position as well as redshift, finding speeds ~ 500 at radii from the system centre of mass , the separation of the two components. These observations were interpreted in [8] in terms of a circumbinary disk, both rotating and expanding radially. This stimulated me to investigate whether it would be possible to distinguish H spectra from an accretion disk or, rather, from material in the outer regions of the system. To my considerable surprise I obtained an unambiguous result [7], in that those flare spectra did not experience any eclipse by the Companion and so could not be a series of views of the accretion disk. This raised the question of how could it be that the trajectories exhibited a Doppler shift of ~ 350 between extremes, over half the orbital period of the binary? If the intermittent flares are the result of the (comparatively) normal Companion overflowing the Roche lobes, the overflow is likely to favour the region of the point. This point rotates with the same angular velocity as the compact object and so the effluent is likely to retain some memory; on an escape orbit it drifts outward and slows down. If ejecta leave the point with perhaps 500 towards us, the ejecta from half a period earlier are now further out and now slower, with a corresponding red shift. After another half period we observe the full red shift (and the blue is less blue). Thus the red trajectory in Figure 1 (and with it the blue) oscillate with time (that is, orbital phase), having the period of rotation of the system, 13.8 days. The difference in recessional speeds is responsible for the perceived difference in Doppler shift between phase 0.75 and on to 0.25. This is as far as the analysis went in [7], which was primarily concerned with the evidence that the flare spectra were not visions of the accretion disk, but formed in the wider environment. This paper takes up the investigation at that point. It must be an unfortunate coincidence that this speed difference is ~ equal to that for the compact object coming and going. Unfortunate this may have been, but it is not devoid of interest, proving to be a direct result of the mass ratio of the binary. If it is indeed correct that the radiating material is spilled from the implication is that the speed of the point is twice the speed of the compact object (175 ) and so its radius twice the orbit radius. This ratio is a function of the mass ratio q [9] - it is obvious that for a small value of q the speeds of the compact object and would be equal. The observed factor of 2 corresponds to a mass ratio of 0.7, the important point is that this is the value established, quite independently, for this binary system [10]. The radiating flare environment could, conversely, provide a measure of mass ratio q. At this point it is illuminating to return to Figure 1.
4. Qualitative Analysis of Figure 1
The crude representation of a model based on an accretion disk orbiting the compact object gave the curves in Figure 1. In that model the red trajectory is contributed by the rim rotating locally away along the line of sight, the blue trajectory from the opposite side. The two oscillate in phase with the orbital motion of the compact object. The red trajectory is augmented by an infalling stream near phase zero, the blue augmented near phase 0.5. The model as illustrated displays idealised trajectories, to represent the data points. To the same level of approximation, we now realise, it could equally well represent the radiating material spilled onto escape orbits through the point, albeit with different interpretation. Such a configuration at any one instant presents a spiral when viewed normal to the orbit of the binary. Viewed in the plane of the orbit the blue is contributed primarily by material leaving close to the approaching point, with red receding from earlier ejection. The red is contributed primarily when the point is receding, when the blue is contributed by earlier source material, now further out and slower. As the spiral rotates both trajectories oscillate redward and blueward together, faking the orbital motion of a compact object with an accretion disk. Material from the Companion flowing towards or leaving with a significant component of velocity normal to the motion of the point is all that is needed to complete the analogy. It is then no surprise that the trajectories in Figure 1 are a good cruderepresentation of the data. These can now be taken as evidence for spiral aspects to the flareejecta.
5. Quantitative Analysis
Even with the crude picture sketched above, there are useful numerical results. These are conveniently approached via a simple version of the spiral con trail. Take as a model for the spiral a succession of quarter circles, each quarter having a larger radius and linked tangentially to its predecessor. When this spiral is looked at edge on, tangential to a segment with speed V, that speed is perceived at a radius R, which we take as the radius of the first segment about the binary centre of mass. On the opposite side the radius is greater and the speed is less, the second segment has speed v at a radius r. Conservation of angular momentum then requires that these characteristics are related by . We do not know the radius at which ejecta light up and so take for R the radius of the point, ~1.2A, where A is the separation of the two components of the binary. The speed of the point is a little under 400 but we do not know the velocity vectors of ejecta leaving . The first half cycle in Figure 1 suggests that V is rather more than 500 and . V is unlikely to be much more than 500 and with these numbers we solve to obtain the quantities characteristic of the second segment of the spiral. The results are then in half a period the radius has increased by ~3A. This is a mean rate of increase of between the start of the first segment and the end of the second. If it should be that velocity V were as great as 600 then and the radial speed . For comparison, material leaving the point tangentially with the local escape velocity follows a parabolic trajectory and about 8 days later is moving opposite to the motion, at a radius of 3.4A and a speed of ~180 [9]. Constructing the spiral from successive quarter circles should be an adequate approximation and might be used as a basis for modelling the observations in [8].
6. Relation to Other Calculations
These numbers are reasonable, although there is not that much with which they can be compared. Fabrika [11] first discussed the spiral structure resulting from overflow from the point, with an outgoing component ~ 200 ; when the jets are more or less in the plane of the sky there are absorption features with about this speed. Fabrika also estimated an “orbital step” in the spiral of about 4A [11]. The GRAVITY data [8] show rotational motion ~ 500 at a radius ~A (Figure 3 of that paper) and were interpreted by the authors as centrifugal expulsion of the circumbinary disk, with a radial component of ~ 230 . That model has circular symmetry and does not associate the outflow with the vicinity of the point, consequently it lacks the spiral structure of the ejecta characteristic of Fabrika’s proposal and now revealed in the data shown in Figure 1. I have found nothing in the GRAVITY paper [8] that conflicts with such a spiral structure.
7. Conclusions
The flaring in the SS 433 system, as studied in both Hand Br is dominated by ejections from the vicinity of the point. The spiral structure of the ejecta predicted in [11] has now been confirmed observationally, for the first time. The remarkable resemblance of the flare spectral shapes to those expected from an accretion disk is now understood and may be discounted, but could be taken as providing a measure of the mass ratio. The source of the ejected material must be eruptions of the Companion, feeding accretion by the compact object, the wind from the accretion disk and overflowing the outer Roche lobe. One might venture to speculate that the ejected material does not merely dribble out through the point, but is actively discharged. The wind from the accretion disk doubles in speed [4] (but the shape of the optical continuum from the photosphere does not change [7]); both the wind and the escape spiral become part of the local environment of the microquasar SS 433.
References
- Olivera-Nieto, L. et al. Acceleration and transport of relativistic electrons in the jets of the microquasar SS 433. Science. 2024, 383, 402-406 (HESS). [CrossRef]
- Bowler, M. G. & Keppens, R. W50 and SS 433. A&A. 2018, 617, A 29 1-7.
- Bowler, M. G. W50 morphology and the dynamics of SS 433 formation. arXiv:2008.10042v2, 2024 1-6. [CrossRef]
- Blundell, K. M. et al. SS433’s accretion disc, wind and jets: before, during and after a major flare. MNRAS. 2011, 417, 2401-2410.
- Schmidtobreick, L. & Blundell, K. M. The emission distribution in SS433. PoS 2006 (MQW6) 094 ,1-5.
- Bowler, M. G. SS 433: the accretion disk revealed in Hα. A&A 2010 516, A24 1-6.
- Bowler, M. G. SS 433 Optical Flares: A New Analysis Reveals Their Origin in Overflow Episodes. Galaxies 2021 9, 46 1-10. [CrossRef]
- Waisberg, I. et al. Super-Keplerian equatorial outflows in SS 433. A&A. 2019, 623, A47 1–13 (GRAVITY). [CrossRef]
- Bowler, M. G. Interpretation of observations of the circumbinary disk of SS 433. A&A. 2010, 521, A81 1-8. [CrossRef]
- Bowler, M. G. SS 433: Two robust determinations fix the mass ratio. A&A. 2018, 619, L4 1-4. [CrossRef]
- Fabrika , S. N. An extended disc around SS 433. MNRAS. 1993, 261, 241-245.
Disclaimer/Publisher’s Note: The statements, opinions and data contained in all publications are solely those of the individual author(s) and contributor(s) and not of MDPI and/or the editor(s). MDPI and/or the editor(s) disclaim responsibility for any injury to people or property resulting from any ideas, methods, instructions or products referred to in the content. |
© 2024 by the authors. Licensee MDPI, Basel, Switzerland. This article is an open access article distributed under the terms and conditions of the Creative Commons Attribution (CC BY) license (http://creativecommons.org/licenses/by/4.0/).
Copyright: This open access article is published under a Creative Commons CC BY 4.0 license, which permit the free download, distribution, and reuse, provided that the author and preprint are cited in any reuse.


