Submitted:
14 June 2024
Posted:
17 June 2024
You are already at the latest version
Abstract
DNA-methylation clocks inform not only about chronological but also biological age, which brings a high resolution and precise understanding of age-related pathology and physiology. Attempts based on transcriptomic and epigenetic approaches arise as integrative biomarkers linking the quantification of stress response with a given fitness trait and may help to identify biological age markers, also considered welfare indicators. In gilthead sea bream, targeted gene expression and DNA-methylation analyses in white skeletal muscle proved sirt1 as a reliable marker of age-mediated changes of energy metabolism. To complete the list of welfare auditing biomarkers, wide-analyses of gene expression and DNA-methylation in one- and three-year old fish were combined. After discriminant analysis, 668 differentially expressed transcripts were matched with those containing differentially methylated (DM) regions (14,366), and 172 were overlapping. Through enrichment analyses and selection, two sets of genes were retained: 33 showing an opposite trend for DNA-methylation and expression, and 57 down-regulated and hypo-methylated. The first set displayed apparently a more reproducible and reliable pattern and 10 multifunctional genes with DM CpG in regulatory regions (sirt1, smad1, ramp1, psmd2 – up-regulated; col5a1, calcrl, bmp1, thrb, spred2, atp1a2 – down-regulated) were deemed candidate biological age markers for an improved welfare auditing in gilthead sea bream.
Keywords:
biological age
; chronological age
; DNA methylation
; epigenetics
; transcriptomics
; fish welfare
1. Introduction
Aquaculture industry is rapidly expanding and becoming more intensified in order to meet the increased global demand for fish protein [1,2]. This intensification of production may bring about impairments in health and growth performance [3,4,5], which has contributed to increase the ethical concerns of the consumers on aquaculture welfare issues [6,7]. In that sense, it is essential that the monitoring of welfare status might cover a wide-range of welfare indicators, either input-based, referring to the conditions in which the animals are subjected, or outcome-based, which reflect the degree of fulfilment of their welfare needs [8,9,10]. Examples of the first type of indicators are stocking density or water oxygen concentration and temperature, whereas growth performance, survival rates, external appearance (skin/fin erosion), sex ratio or maturation state are outcome-based indicators. Another approach for classifying welfare indicators is to divide them by whether they are practical and easy to use on a farm (operational welfare indicators, OWIs), or complex and difficult without access to a laboratory for evaluation (laboratory welfare indicators, LABWIs). However, the range and diversity of welfare needs are constantly evolving as more knowledge and new technologies become available. In that sense, it is noteworthy that common measurements of cortisol on blood plasma are now moving towards other target tissues (e.g., faeces, scales and mucus) [11] to minimize large variability and dramatic increases by the sampling itself in the aquatic environment [12,13], though each target tissue would provide different information on the welfare state and particularly on the timing of the stress response. Likewise, behavioural monitoring is often difficult in the aquatic environment [14,15], but the use of miniaturized data-loggers externally attached to the operculum of sentinel fish represent a practical solution for a continuous and accurate individual tracking of swimming activity and breathing rates in tank-based rearing systems [16].
The monitoring of the microorganisms living in or around the farmed animals is also a very promising aquaculture welfare indicator that can serve to plan corrective actions to mitigate an environmental issue, or to modulate the physiological state and the response of the organism from a holobiont perspective [17]. Thus, experimental evidence supports the use of some bacteria taxa as strong markers of thermal stress [18,19] or microplastic exposure [20,21] in both salmonid and non-salmonid fish, which could be monitored in a real time and in a cost-effective manner with the advent of the 16S metabarcoding techniques based on the Nanopore technology [22,23], though we are far to establish references values for a wide spectrum of species and culture condition across the production cycle [24,25]. Other welfare indicators that can aid in developing an improved welfare assessment system are those based on age-related cellular and molecular modifications. Certainly, age-associated DNA methylation changes allow the construction of extremely accurate age estimators, termed “epigenetic” or “DNA methylation” clocks, which have been developed for a number of vertebrates, including mammals, birds and fish [26,27,28]. Thus, several piscine DNA methylation clocks have been built, to be applied in fisheries and conservation biology programs, with a focus on searching CpGs that mostly reflect the chronological age [28]. Nevertheless, many age-related epigenetic variations are also sensitive to environmental influences [29], either in mammals [30] or fish [31], and there is accumulating evidence that, depending on the CpG loci used, epigenetic clocks can inform not only about chronological but also biological age [32,33,34], which bring the possibility of a high resolution and precise understanding of the age-related pathology and physiology of an individual [35,36].
According to the above findings, epigenetic markers of biological age have been proposed as reliable markers of cumulative welfare in animal production [37,38,39,40]. However, the integration of data from more than one omics layer will add potential value to the measure [34,41], and the combination of transcriptomic and DNA methylation data may link in a more precise manner age-regulated epigenetic marks with specific cellular functions or fitness traits [41,42]. This also applies to fish, and such integrative omic approach has been used in gilthead sea bream to evaluate the success of nutritional programming in the offspring of broodstock fish fed low fish meal/fish oil diets [43], to reveal genotype-by-temperature interactions in male sex determination and spermatogenesis in zebrafish [44], or to better understand the challenge of moderate hypoxia and temperature increases in Atlantic salmon [45]. Likewise, a targeted transcriptomic/epigenetic approach have disclosed the use of the changing gene expression and DNA methylation pattern of sirtuin 1 as a marker of age- and seasonally-mediated changes of energy metabolism in the skeletal muscle of gilthead sea bream [46]. However, to the best of our knowledge, the integration of wide transcriptomic and DNA methylation data as markers of biological age remains to be largely explored in farmed fish, though experimental evidence highly supported a strong effect of main aquaculture stressors on several biological functions [47,48], through epigenetic marks preferentially located at the gene-promoter regulatory regions [49,50,51]. In agreement with all this, our starting hypothesis was that the integration of wide transcriptomic and epigenomic approaches, filtered by the involvement in multiple functions and differentially methylated CpGs in the gene-promoter regulatory region, would provide a list of putative gene markers of biological age for an extended and precise assessment of cumulative fish welfare. For that purpose, massive gene expression analysis (RNA-seq) combined with a genome-wide DNA methylation (MBD-seq) approach was conducted to disclose the different omics multilayer of white skeletal muscle in one- and three-year old gilthead sea bream, the most highly cultured fish in the Mediterranean region. This allowed to identify up to 10 age-regulated genes, with particular epigenetic marks and multifunction capabilities, as an array of potential biological age gene markers that will require to be further validated in independent studies.
2. Results
2.1. Age-Related Patterns of Gene Expression and Their Discriminant Analysis
Illumina sequencing of mRNA muscle samples from three (S+3) and one (S+1) year old animals generated ~526 million single-end (SE) reads (1 x 75), with an average of ~37.6 million reads per sample (Table S1). After trimming and quality filtering, around 0.4% of all muscle reads were discarded, and the remaining reads ranged between 30.2 million (~2.27 Gb) and 46.9 million (~3.52 Gb) in all samples. Over 90% of these pre-processed reads were mapped against the IATS-CSIC gilthead sea bream reference genome, which retrieved 43,257 expressed coding transcripts (78% of total predicted unique transcripts and corresponding to 20,764 unique descriptions, UD) and 52,844 non-coding transcripts. Differential gene expression analysis between S+3 and S+1 fish resulted in 2,237 transcripts significantly changing between groups when One-way ANOVA (P < 0.05) was applied (Figure 1A), whereas the number of differentially expressed (DE) transcripts decreased to 78 with FDR-adjusted P < 0.05. To better explore the differences due to age, a partial least squares-discriminant analysis (PLS-DA) was conducted with the data filtered by One-Way ANOVA. A clear separation of both groups was observed (Figure 1B), being the segregation mainly due to component 1 (91.6%), in a discriminant model that was validated significantly (explained variance, R2Y=97%, and predicted variance, Q2=88%). Over 1,000 discriminant transcripts (VIP ≥ 1) were identified, being 668 known coding transcripts that were generally down-regulated (75.3 %) in older fish (S+3 vs S+1). Of note, all animals were correctly classified in each group by hierarchical cluster analysis (Figure 1C).
2.2. Age-Related Patterns of Differentially Methylated DNA and Its Discriminant Analysis
Using MBD-seq, ~568 million SE reads (1 x 75), containing at least one methylated CpG, were obtained, with an average of ~40.5 million reads per sample (Table S1). After trimming and quality filtering, around 8% of all muscle reads were discarded, and the remaining reads ranged between 30.2 million (~2.27 Gb) and 46.9 million (~3.52 Gb) in all samples. Over 95% of these pre-processed reads were mapped against the IATS-CSIC gilthead sea bream reference genome (1,6 Gb), which was divided in 25-bp windows (the unit for calculating the level of methylation). Such analysis identified a total of ~10.9M 25-bp genomic regions that appeared to contain CG dinucleotides susceptible to be altered by methylation. These methylated regions spanned ~273Mb of the total gilthead sea bream genome, and comprised ~14.1M CpG (77.5% of the total 18.3M CG in the gilthead sea bream genome).
Differential methylation studies detected a total of 107,232 25-bp genomic regions changing (P < 0.05) between S+3 and S+1 groups when One-way ANOVA (P < 0.05) was applied (Figure 2A), while the number of differentially methylated (DM) regions decreased to 164 with FDR-adjusted P < 0.05. The normalized methylation values (rpkm, reads per kilo base per million mapped reads) of these DM regions were used as input in discriminant analysis (PLS-DA) to assess the effect of age over DNA-methylation patterns. Like RNA-seq results, when both groups were compared, the discriminant separation was clear and statistically significant (P < 0.01; Figure 2B). The segregation was mostly due to component 1 (97.9%) and all animals were again correctly classified in each group by the hierarchical clustering analyses (Figure 2C). The resulting model showed percentage values of explained (R2Y) and predicted (Q2) variance around 99% and 97%, respectively (Figure 2B). When VIP threshold (VIP ≥ 1) was applied in the validated PLS-DA model, up to 51,100 25-bp DM genomic regions drove the separation between experimental groups. These DM regions of discriminant value were found to be located in the promoter/coding sequence of 14,366 DM transcripts (Figure 2B), and most of those regions (58.5 %) presented a hypo-methylated condition with advancing age (S+3 vs S+1).
2.3. Functional Network Analysis of Differentially Expressed Transcripts and of Transcripts with Concomitant Differential Expression and Methylation
When results from S+3 vs S+1 fish were compared and the identified discriminant DE transcripts known to be located in coding areas (668) were matched with those containing DM regions of discriminant value (14,366), only 172 were overlapping (Figure 3A). The over-representation analysis of the list of discriminant DE coding transcripts (668) discerned 442 enriched functions (Gene ontology - Biological process, GO-BP, unique terms; Table S2A). The resulting over-represented functions were clustered in 51 supra-categories (GO-BP ancestors), and the different numbers of DE transcripts within each one are presented in Figure 3B. The GO-BP ancestor Regulation of cellular process showed the largest number of DE transcripts, followed by N compound metabolic process and System development. Interestingly, the expression of most transcripts in all assigned supra-categories (nearly 80 % globally) were down-regulated with age (S+3 vs S+1 animals) and only around 20% presented an up-regulated gene expression.
A functional network analysis of the 172 overlapping transcripts (DE containing DM regions) was also conducted, displaying up to 81 different GO-BP terms (Table S2B). These over-represented functions were clustered in 19 GO-BP ancestors, and the different numbers of DM regions within each one are presented in Figure 3C. Among these regions, around 52 % showed hypo-methylation when S+3 and S+1 fish were compared, and the remaining 48 % were hyper-methylated. This contrasts with the proportions of down- and up-regulated DE transcripts after the enrichment analysis. When the results of the latter analysis (Figure 3B) were compared with those of the enrichment of the overlapping DE transcripts with DM regions (Figure 3C), all GO-BP ancestors identified in the latter appeared in the former, containing most of them a substantial number of DE transcripts.
2.4. The Different Patterns of DNA Methylation and Expression
After the enrichment analysis of the 172 overlapping transcripts, the resulting 108 enriched transcripts were identified and separated in two groups. First, we selected those transcripts with DM regions that showed an opposite trend for DNA-methylation and expression (i.e., hyper-methylated regions with down-regulation of the matching transcript or vice versa). After filtering for transcripts with at least 75 % of their DM regions with a negative correlation, a total of 33 transcripts (33 UD), corresponding to 141 regions, were displayed, and they showed a strong and significant negative relationship between differential methylation and expression (Figure 4A). Regarding in-depth these genes, the position of the DM regions and the number of CpGs are presented in Table S3. Additionally, the genomic organization and number of position of DM CpGs are graphically represented in Figure S1.
The second group contained down-regulated transcripts containing hypo-methylated regions and, again, they were filtered for those with at least 75 % of their DM regions with hypo-methylation. A total of 61 transcripts (57 UD), containing 140 DM regions, were identified. In this case, there was no significant relationship within this group of transcripts between differential methylation and expression (Figure 4B), which indicates that, unlike the first set of genes, no clear pattern on the effect of differential methylation on expression was observed here. The position of the DM regions and the number of CpGs of the latter transcripts are also presented in Table S4, and their genomic organization and number of position of DM CpGs, graphically represented in Figure S2. Overall, most genes (UD) were down-regulated (24 containing hyper-methylated regions and 57 with hypo-methylated CpGs), and only a few presented an up-regulated expression (9 associated to hypo-methylated regions). Only those from the first group, presenting a clearer relationship between gene expression and level of DNA methylation (opposite trend, 24 hyper-methylated and down-regulated and 9 hypo-methylated and up-regulated, Figure 4C), were retained.
2.5. Candidate Markers of Biological Age
The selected genes had been previously assigned, as mentioned, to one of the 19 GO-BP ancestors through the functional network analysis, and the corresponding genes within each biological function are presented in Table 1 (i.e., down-regulated genes linked with hyper-methylated regions or vice versa). The functional processes are ordered by the number of associated genes, being the System development the GO-BP term with the highest number of genes, followed by Anatomical structure development and Anatomical structure morphogenesis. Additionally, these selected genes are ordered by the number of associated functions (Table 2 and Table S3), and the first 14 genes, chosen by their involvement in multiple functions (i.e., at least 4 processes), were selected and are presented in Table 2 (sirt1, NAD-dependent deacetylase sirtuin-1; smad1, Mothers against decapentaplegic homolog 5; col5a1, Collagen alpha-1(V) chain; calcrl, Calcitonin gene-related peptide type 1 receptor-like; nrp2, Neuropilin-2; bmp1, Bone morphogenetic protein 1; ramp1, Receptor activity-modifying protein 1; abi3bp, Target of Nesh-SH3; mical2, Protein MICAL-2; thrb, Thyroid hormone receptor beta; spred2, Sprouty-related, EVH1 domain-containing protein 2; arhgap24, Rho GTPase-activating protein 24; psmd2, 26S proteasome non-ATPase regulatory subunit 2; atp1a2, Sodium/potassium-transporting ATPase subunit alpha-2). Interestingly, among the 14 selected genes, a substantial proportion (71 %; 10 out of 14) contained at least one regulatory DM region (i.e., positioned in promoter, the first intron or the first exon). Thus, those 10 genes with a methylation mark in a regulating region (sirt1, smad1, ramp1, psmd2 – up-regulated; col5a1, calcrl, bmp1, thrb, spred2, atp1a2 – down-regulated) have been proposed as putative candidate markers of biological age.
3. Discussion
Refining approaches to safeguard and optimise the wellbeing of fish can help to increase the profitability and sustainability of aquaculture through the production of more robust fish. There is now a vast array of fish welfare indicators, but there is little consensus on the most adequate criteria to evaluate differences in welfare needs among species, rearing systems or biological features [52,53]. Thus, in the gonochoristic teleost European sea bass, elevated temperatures during early development (thermosensitive period) resulted in a masculinization of the population [54,55]. Conversely, an accelerated male-female sex reversal in the protandrous hermaphrodite gilthead sea bream seems to be the phenotypic expression of a cumulative impaired welfare that is both nutritionally and genetically regulated [56,57]. This latter process exemplifies a biological age deviation as the result of a pseudo-feminization process with a lowered estradiol/11ketosterone plasma ratio in reproductive females, which would denote a failure of the negative feedback inhibition of male-female sex reversal. Likewise, at a cellular and molecular level, the present study disclosed a vast number of age-regulated muscle transcripts by comparing one- and three-year old fish with homogeneous weights within groups and with no sex bias. Indeed, in the hermaphrodite gilthead sea bream nearly all one-year old fish are usually males and in this work the three-year old fish employed for sampling had a similar weight of around 1 kg, as expected for males at that age compared to the heavier females when fed a control diet with high levels of fish meal and fish oil [57]. Overall, this study finally allowed to obtain an enriched list of 10 candidate markers of biological aging after the integration of two omics layers (transcriptomics and epigenetics) and filtering by multifunctional genes with DM CpGs in regulatory regions, which will require a final functional validation in independent studies.
Age-mediated shifts in gene expression have been reported in numerous species [58,59], though the type of genes that are regulated vary among different tissues and organisms [60]. Accordingly, a clear impact of age on the muscle transcriptome was observed in the current study (Figure 1), which is consistent with previous studies in mammals [61,62] and fish [63,64]. Moreover, we observed that most discriminant coding DE transcripts were down-regulated with advancing age, which would reflect the normal declining with age of a wide-range of biological processes [59,65,66], though paradoxically it is not the common feature in a number of previous studies in mammals and fish [61,62,64]. In any case, it is well accepted that aging is related, in mammals [67] and fish (killifish) used a model of vertebrate aging, with an overall hypomethylation that becomes first associated to a down-regulation of DNA methyltransferases. In the present study, this fits well with a global hypo-methylation (58.5 %) among the discriminant DM regions in our age model of one- and three-year old fish, that at the same time would co-exist with a site-specific hypermethylation, as reported upon aging in both humans [69] and other animal models [67,70], including fish [28,71,72].
Methylation of DNA is usually associated with the silencing of gene expression [73]. Nonetheless, as mentioned before, most DE genes presented a lowered expression with age regardless of methylation pattern. Certainly, two different types of transcriptomic and epigenetic interplays were found herein with the age-related down-regulated gene expression. Accordingly, a first set of transcripts presented an opposite trend for DNA methylation and expression (33 transcripts and UD), which means that they showed a down-regulated expression due to hyper-methylation (24 transcripts) or vice versa (9 transcripts), resulting in a significant negative correlation between DNA methylation and their expression level (Figure 4A). Conversely, a second group of 61 down-regulated transcripts (57 UD) were linked to hypo-methylated DM regions. The effect of the differential methylation on gene expression may rely on the position of the epigenetic mark because increased methylated CpG sites in the promoter region of a gene results normally in shutdown of its expression [74,75,76]. Likewise, methylation of the first exon/intron may be also strongly related to the transcriptional silencing [77,78]. Nevertheless, DNA methylation patterns are far more complex than originally thought. For instance, hypo-methylation does not seem to be always an activating epigenetic change, since the loss of DNA methylation in the gene body may be accompanied by formation of repressive chromatin, resulting in a decreased expression [79]. Alternatively, a lower methylation level at gene bodies may result in gene silencing due to nucleosome destabilization in transcribed regions and reduced efficiencies of transcription elongation or splicing [80,81]. This hypo-methylation-induced gene expression shutdown might contribute to a certain degree of instability in the chromatin or nucleosome, which could explain the less clear pattern on the effect of the reduced level of methylation in this second set of retained transcripts (Figure 4B) and suggests that this impact seems to be less reproducible and reliable. Hence, only the transcripts of the first group, whose changes in expression are likely a result of the direct action of enzymes involved in the DNA methylation or demethylation, were kept herein for further selection.
Among the 33 transcripts presenting an opposite trend for DNA methylation and expression, those linked to a greater number of processes (>4 GO-BP ancestors) were retained as a first list of selected markers. Such filtering approach rendered 14 multiple function genes that would be more likely affected by environmental insults (e.g., increased temperatures and hypoxia), which in turn serves to disclose a set of molecular markers that become potentially highly responsive to aging and common aquaculture stressors [47,48,82,83]. In that sense, it must be noted that the resulting list of selected genes are largely involved in developmental processes, which agrees with the fact that aging is viewed as an evolutionary conserved developmental process across mammals [84], and vertebrates in general. Moreover, the observation that most of the above selected genes (10 out of 14; 71%) shared a DM region in their promoter regulatory region further supports a physiological role as age-related markers of environmental perturbations [49,50,51], which makes our final set of 10 genes a reliable list of candidate markers of chronological age deviations.
From a functional point of view, it must be noted that the suppression of cellular senescence by SIRTs is mainly mediated through delaying the age-related telomere attrition, sustaining genome integrity, and promoting DNA damage repair [85,86,87,88]. Certainly, the increasing evidence of SIRTs in the field of aging and age-related diseases indicates that they may provide novel targets for treating diseases associated with aging and extended human lifespan [89]. This becomes especially evident for SIRT1, the most extensively studied mammalian SIRT. In that sense, the observation that the gene sirt1 is included in our final list of biological markers confirms and extend our previous gilthead sea bream study, in which muscle sirt1 was shaped by age at the transcriptional and epigenetic level in a farmed fish trough the production cycle [46]. Moreover, this outcome served as a methodological checkpoint of the procedure that we have used herein for revealing potential markers of chronological age that at the same time have the potential to be regulated at a large extent by a challenging environment. Regarding the gene psmd2 (26S proteasome non-ATPase regulatory subunit 2), it encodes for one of the non-ATPase subunits of the 19S regulator lid within the 26S proteasome, a multicatalytic proteinase complex that is involved in the ubiquitin–proteasome system, recognised as a major intracellular protein degradation system with an important role for muscle homeostasis and health [90]. It has been suggested that proteasome activity decreases with age in several tissues [91,92], including skeletal muscle [93]. Nevertheless, proteasomes might play a relevant role in DNA damage signaling and DNA repair [94], as previously indicated for SIRTs, and this psmd2 gene may be involved in cell cycle and increase cell proliferation [95], which might be related to the high levels of psmd2 significantly associated with age [95] and explain its up-regulation in our model of older fish.
Other two sets of genes with a complementary role with aging are those of bmp1 - smad1 and ramp1- calcrl. First, bmp1 (Bone morphogenetic protein 1) encodes for one of the bone morphogenetic proteins (BMP) that bind to dedicated receptors that in turn phosphorylate BMP-responsive Smad proteins (e.g., Smad1 encoded by gene smad1, mothers against decapentaplegic homolog 5) [96]. BMP signalling is indispensable for the regulation of adult muscle mass in normal and pathological situations [97]. So, it may be speculated that the down-regulation of bmp1 might be related to the progressive reduction in muscle mass with age [98,99], whereas smad1 is up-regulated to maximize the use of the available BMP. The other two linked genes, calcrl (Calcitonin gene-related peptide type 1 receptor-like) and ramp1 (Receptor activity-modifying protein 1), encode for two components of G protein-coupled receptors, specifically the calcitonin receptor-like receptor and a receptor activity-modifying protein, respectively. These receptors mediate the effects of peptide hormones, such as calcitonin gene related peptide (CGRP), which play important roles during adulthood and aging, particularly in the neuromuscular system [100,101]. Indeed, in skeletal muscle, CGRP has been shown to potentiate muscle contraction [102] and increase the rate of blood flow locally following muscle contraction [103,104,105]. In the present study, the expression of calcrl is down-regulated and that of ramp1, up-regulated with age. Thus, it may be proposed that increased transcription of ramp1 might be an effective strategy for increasing the effectiveness of CGRP-induced effects [106], so its expression may be increased with age to compensate the reduction in calcrl transcription. Another down-regulated gene was thrb (Thyroid hormone receptor beta), which encodes for a nuclear hormone receptor for thyroid hormones that participate in skeletal muscle contractile function, myogenesis and muscle regeneration [107]. Thus, its down-regulation may be related to the progressive decline in muscle activity with age [98,99,108].
In our experimental model, another candidate marker that was down-regulated with advancing age is col5a1, (collagen alpha-1(V) chain). Collagen is the main structural protein in the extracellular matrix (ECM) of the skeletal muscle and it is essential for the mechanical support of tissue, although the gene expression of ECM components, including collagenic genes, decreases with age [63,109]. Likewise, the gene spred2 (Sprouty Related EVH1 Domain Containing 2) encodes for one of the proteins that regulate growth factor-induced activation of the mitogen-activated protein kinase (MAPK) cascade [110], which is considered a positive regulator of muscle atrophy [111]. Hence, the lower expression of this gene in older animals, and consequently a lower inhibition of MAPK, could be the cause of an increased muscle atrophy with age. Finally, atp1a2 (Sodium/potassium-transporting ATPase subunit alpha-2) is one of the genes encoding for different Na+, K+ ATPase (NKA) α-isoforms and is mainly expressed in muscle, either in mammals [112,113] or fish [114,115,116]. As a euryhaline teleost, gilthead sea bream may exhibit high NKA activity in seawater [117,118,119,120], and the lower expression of this gene might be linked with the reduction of ATPase activity in muscle with age [121].
In summary, as depicted in Figure 5, an integrative approach of transcriptomics and DNA methylation data from one- and three-year old fish applied over successive selection steps allowed to generate a candidate list of muscle markers of biological age in farmed gilthead sea bream. Previous attempts of age-related markers in fisheries and conservation biology studies have been focused on chronological age markers, but in farmed animals attention is now moved towards indicators of the cumulative burden of environmental experiences, which may accelerate or decelerate the age progression along the production cycle. In comparison to common biomarkers of age, such as telomere length, DNA methylation marks have very often a better predictive ability [122], which would be reinforced herein by the integration of two omics layer (transcriptomics and epigenetics), followed by the use of successive filters to disclose age-related markers highly influenced by cumulative life insults. The result is a reduced list of 10 potential biological age markers that require to be validated in independent studies. Afterwards, the generated knowledge (i.e., the gene expression data from these biomarkers) might be applied through an appropriate estimation algorithm (e.g., multiple linear regression) [123,124] to compute individual’s biological age at a field scale as part of an improved welfare assessment system for auditing farmed fish welfare.
4. Materials and Methods
4.1. Ehics Statement
All procedures of animal rearing and sampling were carried out according to present IATS-CSIC Review Board, European animal directives (2010/63/EU), and Spanish laws (Royal Decree RD53/2013) for the protection of animals used in scientific experiments.
4.2. Experimental Setup
One- (S+1) and three- (S+3) year-old gilthead sea bream (GSB) of Atlantic origin were reared at the indoor experimental facilities of the Institute of Aquaculture Torre de la Sal (IATS-CSIC) in 3000-L tanks under natural photoperiod and temperature conditions at the IATS-CSIC latitude (40°5 N; 0°10E). Water temperature was between 23 and 28 °C in the summer when sampling was conducted, the water oxygen concentration was always higher than 75% saturation, and unionized ammonia remained below toxic levels (< 0.02 mg/L). Fish were fed a standard commercial diet (EFICO YM 568; BioMar, Dueñas, Spain) once a day until visual satiety (5 or 6 times per week depending on fish size). Seven fish per age class (one year old, S+1, 100–115 g body weight; three years old, S+3, 1 kg body weight) were anesthetized with 3-aminobenzoic acid ethyl ester (MS-222, 100 μg/mL), and white skeletal muscle (WSM) was rapidly excised, frozen in liquid nitrogen and stored at − 80 °C until RNA and DNA extraction.
4.3. DNA/RNA Extraction
White skeletal muscle DNA was extracted using the Quick-DNA™ Mini-prep Plus Kit (Zymo Research, Irvine, CA, USA) following the manufacturer’s instructions. The quantity and quality of DNA were assessed by a NanoDrop 2000cSpectrophotometer (Thermo Fisher Scientific, Waltham, MA, USA), and DNA integrity was assessed in a 1% agarose gel. Total RNA (70–100 μg) from WSM was extracted with the MagMAXTM-96 Total RNA Isolation Kit (Applied Biosystems, Foster City, CA, United States). The RNA concentration and purity were determined using a Nanodrop 2000c Spectrophotometer (Thermo Fisher Scientific, Waltham, MA, United States). Quality and integrity of the isolated RNA were checked on an Agilent Bioanalyzer 2100 total RNA Nano series II chip (Agilent, Amstelveen, Netherlands), yielding RNA integrity numbers (RINs) between 8 and 10. Samples were stored at -80 ºC until DNA and RNA sequencing.
4.4. DNA/RNA Illumina Sequencing
For the Methyl-binding domain sequencing (MBD-seq) analysis, 300 ng of DNA from S+1 and S+3 samples were fragmented to 200-550 pb using the methylation-insensitive restriction enzyme MseI (New England Biolabs, United States), which recognizes genomic T↓TAA sites, typically found outside of CGIs. The enzyme action and inactivation temperatures, as well as its actuation times and concentration were fixed according to manufacturer’s indications. Products were obtained using AMPure beads and checked and quantified with Picogreen (Invitrogen, Carlsbad, United States). Fragmented DNA was then submitted to methylation enrichment using the MethylCollectorTM Ultra kit (Active Motif, Carlsbad, CA, United States), following the instructions. Briefly, methylated DNA was captured from 75 ng of fragmented DNA via binding to the methyl-CpG binding domain of the MBD2 protein. Illumina MBD-seq libraries were prepared from 15 ng of methylated DNA fragments using the NEBNext® Ultra™ II DNA Library Prep Kit (Illumina Inc. San Diego, CA, USA) according to the manufacturer’s instructions. All libraries were sequenced on an Illumina NextSeq 500 HO sequencer as a 1 × 75 nucleotides single-end (SE) read format, according to the manufacturer’s protocol. Raw sequenced data were deposited in the Sequence Read Archive (SRA) of the National Center for Biotechnology Information (NCBI) under the Bioproject accession number PRJNA1096613 (BioSample accession numbers: SAMN40757284-297).
Illumina RNA-seq libraries were prepared from 500 ng total RNA using the Illumina TruSeq™ Stranded mRNA LT Sample Prep Kit (Illumina Inc. San Diego, CA, USA) according to the manufacturer’s instructions. All RNA-seq libraries were sequenced on an Illumina NextSeq 500 HO sequencer as 1 × 75 nucleotides SE read format according to the manufacturer’s protocol. Raw sequenced data were deposited in the Sequence Read Archive (SRA) of the National Center for Biotechnology Information (NCBI) under the Bioproject accession number PRJNA1096613 (BioSample accession numbers: SAMN40757298-311).
4.5. Bioinformatic Analyses
After sequencing, the quality of the RNA-seq and MBD-seq resulting raw reads was evaluated with FASTQC (https://www.bioinformatics.babraham.ac.uk/projects/fastqc/). In the case of RNA-seq data, libraries were filtered with Prinseq [125] eliminating those with quality < 18, length < 60 bp, and > 5% of Ns in the sequence. Cleaned reads were mapped against gilthead sea bream reference genome [126] (available at https://seabreamdb.nutrigroup-iats.org/), using TopHat [127]. A representative transcriptome per sample was constructed using Cufflinks, being data quality-checked with CummeRbund [128].
In the case of MBD-seq data, pre-processing was performed with Prinseq [125], eliminating those with quality < 20, length < 60 bp, and > 5% of Ns in the sequence. Before mapping, the repeat regions of the gilthead sea bream reference were masked using the BSgenome R package. Then, high-quality reads were aligned to this masked genome using the Bowtie2 software [129]. After MBD-seq mapping, the methylated reads were located in their corresponding genomic region using five training sets created ad-hoc for this analysis. The exon and intron training sets contained the coordinates of these elements along the genome. The promoter region of a gene was considered 5000 bp before its start codon. Finally, two training sets were established for CGI, depending on if these islands were found in promoters or intergenic regions. Predictions of CGI were done with NewCpGReport tool from the EMBOSS suite [130]. Search parameters for CGI were: length ≥ 200, C+G content ≥ 50%, ratio of observed/expected CpGs ≥ 0.60 and window size = 100.
4.6. Statistical Analysis and Data Filtering
DE transcripts in RNA-seq data were retrieved using DESeq2 at two significance thresholds (P < 0.05 and FDR < 0.05) [131]. DM regions in MBD-seq data were obtained using the MEDIPS R package (P < 0.05) [132] over regions of 25-bp size, containing at least one dinucleotide CG. To study the separation of the experimental groups, we performed several partial least-squares discriminant analyses (PLS-DA) using EZinfo v3.0 (Umetrics, Umeå, Sweden). DE transcripts and DM regions with a P < 0.05 were introduced in the analyses. The fitness and predictability of these models were validated by a 500 random permutation test (pR2Y < 0.05; pQ2 < 0.05) using the ropls R package [133]. The discriminant ability of each marker was ranked after the creation of the models according to its Variable Importance in the Projection (VIP), and useful markers were detected under a VIP ≥ 1 [134]. Discriminant DE transcripts were matched with those transcripts containing discriminant DM regions (multiomic layer integration) and different bioinformatic analysis and filters (i.e., functional GO enrichment, integrative correlation analysis, multifunction filtering, regulatory region – either promoter, first intron or first exon – filter) were applied over the obtained overlapping transcripts (Figure 6) in order to obtain the list of candidate biological age markers. Over-representation tests of GO-BP terms was implemented in the ShinyGO 0.77 web application [135] and statistical significance was accepted at FDR < 0.05. GO-BP levels and supra-categories were retrieved using GOATools [136]. Pearson correlation coefficients between the expression and methylation Log2FC were performed using the SigmaPlot v14.5 (Systat Software Inc.) software. Gene structure representations were obtained using the genemodel R package (https://github.com/greymonroe/genemodel) and the IBS software [137].
Supplementary Materials
The following supporting information can be downloaded at Preprints.org, Figure S1: Organization of the selected genes with opposite effect of DNA methylation and expression (33). Red boxes indicate the location of the DM regions; Figure S2: Organization of the down-regulated overlapping genes associated to hypo-methylated CpGs (57). Red boxes indicate the location of the DM regions; Table S1: Detailed sequencing data obtained in this study; Table S2: A. List of enriched GO-BP obtained from selected DE transcripts (p < 0.05 and VIP ≥ 1) from the PLS-DA using RNAseq data in S+3 vs S+1 animals; B. List of enriched GO-BP obtained from selected genes after integrating data from PLS-DA (p < 0.05 and VIP ≥ 1) using RNAseq and MBDseq data in S+3 vs S+1 animals; Table S3: Differential expression (log2 fold-change S+3 vs S+1, log2 FC (exp)) and location (scaffold and chromosome, chr) of the selected genes with opposite effect of methylation and expression (potential epigenetic markers) and their corresponding putative differentially methylated (DM) regions. The genomic area (Feature: promoter, Prom, exon or intron) where these DM regions are positioned and their differential methylation (log2 fold-change S+3 vs S+1, log2 FC (met)) and the number of CpGs are also shown. Genes in red indicates up-regulation and in bold means that are located in a regulating area (Prom, Exon 1, Intron 1); Table S4: Differential expression (log2 fold-change S+3 vs S+1, log2 FC (exp)) and location (scaffold and chromosome, chr) of the selected genes with similar effect of methylation and expression (potential epigenetic markers) and their corresponding putative differentially methylated (DM) regions. The genomic area (Feature: promoter, Prom, exon or intron) where these DM regions are positioned and their differential methylation (log2 fold-change S+3 vs S+1, log2 FC (met)) and the number of CpGs are also shown. Genes in bold means that are located in a regulating area (Prom, Exon 1, Intron 1).
Author Contributions
Conceptualization, J.P.S.; methodology, F.N.C., J.C.G. and J.P.S.; software, F.N.C.; validation, J.C.G. and J.P.S.; formal analysis, F.N.C. and A.B..; investigation, F.N.C., A.B. and J.P.S.; resources, F.N.C., J.C.G., A.B. and J.P.S.; data curation, F.N.C. and A.B.; writing—original draft preparation, F.N.C., A.B. and J.P.S.; writing—review and editing, F.N.C., J.C.G., A.B. and J.P.S.; visualization, F.N.C., J.C.G., A.B. and J.P.S.; supervision, J.P.S.; project administration, J.P.S.; funding acquisition, J.P.S. All authors have read and agreed to the published version of the manuscript.
Funding
This study forms part of the ThinkInAzul program and was supported by MCIN with funding from European Union NextGenerationEU (PRTR-17.I1) and by Generalitat Valenciana (THINKINAZUL/2021/024) to JP-S.
Institutional Review Board Statement
The animal study protocol was approved by the Ethics and Animal Welfare Committee of the Institute of Aquaculture Torre de la Sal (IATS, CSIC), CSIC Ethics Committee (permission 1295/2022) and Generalitat Valenciana (permission 2022-VSC-PEA-0230). They were carried out in the IATS’s registered aquaculture infrastructure facility (code ES120330001055) in accordance with the principles published in the European Animal Directive (2010/63/EU) and Spanish laws (Royal Decree RD53/2013) for the protection of animals used in scientific experiments.
Informed Consent Statement
Not applicable.
Data Availability Statement
Most data generated or analysed during this study are included in this article and its Supplementary Information files. Raw sequenced data were deposited in the Sequence Read Archive (SRA) of the National Center for Biotechnology Information (NCBI) under the Bioproject accession numbers PRJNA1096613 (BioSample accession numbers: SAMN40757284-297) and PRJNA1096613 (BioSample accession numbers: SAMN40757298-311).
Conflicts of Interest
The authors declare no conflicts of interest.
References
- Ahmad, A.; Sheikh Abdullah, S.R.; Hasan, H.A.; Othman, A.R.; Ismail, N. ‘Izzati Aquaculture Industry: Supply and Demand, Best Practices, Effluent and Its Current Issues and Treatment Technology. J Environ Manage 2021, 287, 112271. [Google Scholar] [CrossRef] [PubMed]
- Naylor, R.L.; Hardy, R.W.; Buschmann, A.H.; Bush, S.R.; Cao, L.; Klinger, D.H.; Little, D.C.; Lubchenco, J.; Shumway, S.E.; Troell, M. A 20-Year Retrospective Review of Global Aquaculture. Nature 2021, 591, 551–563. [Google Scholar] [CrossRef] [PubMed]
- North, B.P.; Turnbull, J.F.; Ellis, T.; Porter, M.J.; Migaud, H.; Bron, J.; Bromage, N.R. The Impact of Stocking Density on the Welfare of Rainbow Trout (Oncorhynchus Mykiss). Aquaculture 2006, 255, 466–479. [Google Scholar] [CrossRef]
- Liu, B.; Liu, Y.; Sun, G. Effects of Stocking Density on Growth Performance and Welfare-Related Physiological Parameters of Atlantic Salmon Salmo Salar L. in Recirculating Aquaculture System. Aquac Res 2017, 48, 2133–2144. [Google Scholar] [CrossRef]
- Wu, F.; Wen, H.; Tian, J.; Jiang, M.; Liu, W.; Yang, C.; Yu, L.; Lu, X. Effect of Stocking Density on Growth Performance, Serum Biochemical Parameters, and Muscle Texture Properties of Genetically Improved Farm Tilapia, Oreochromis Niloticus. Aquaculture International 2018, 26, 1247–1259. [Google Scholar] [CrossRef]
- Jennings, S.; Stentiford, G.D.; Leocadio, A.M.; Jeffery, K.R.; Metcalfe, J.D.; Katsiadaki, I.; Auchterlonie, N.A.; Mangi, S.C.; Pinnegar, J.K.; Ellis, T.; et al. Aquatic Food Security: Insights into Challenges and Solutions from an Analysis of Interactions between Fisheries, Aquaculture, Food Safety, Human Health, Fish and Human Welfare, Economy and Environment. Fish and Fisheries 2016, 17, 893–938. [Google Scholar] [CrossRef]
- Raposo de Magalhães, C.S.F.; Cerqueira, M.A.C.; Schrama, D.; Moreira, M.J.V.; Boonanuntanasarn, S.; Rodrigues, P.M.L. A Proteomics and Other Omics Approach in the Context of Farmed Fish Welfare and Biomarker Discovery. Rev Aquac 2020, 12, 122–144. [Google Scholar] [CrossRef]
- Stien, L.H.; Bracke, M.B.M.; Folkedal, O.; Nilsson, J.; Oppedal, F.; Torgersen, T.; Kittilsen, S.; Midtlyng, P.J.; Vindas, M.A.; Øverli, Ø.; et al. Salmon Welfare Index Model (SWIM 1.0): A Semantic Model for Overall Welfare Assessment of Caged Atlantic Salmon: Review of the Selected Welfare Indicators and Model Presentation. Rev Aquac 2013, 5, 33–57. [Google Scholar] [CrossRef]
- Noble, C.; Gismervik, K.; Iversen, M.H.; Kolarevic, J.; Nilsson, J.; Stien, L.H.; Turnbull, J.F. Welfare Indicators for Farmed Atlantic Salmon: Tools for Assessing Fish Welfare; Nofima: Tromso, Norway, 2018; 351p, ISBN 9788282965569. [Google Scholar]
- Noble, C.; Gismervik, K.; Iversen, M.H.; Kolarevic, J.; Nilsson, J.; Stien, L.H.; Turnbull, J.F. Welfare Indicators for Farmed Rainbow Trout: Tools for Assessing Fish Welfare, Nofima: Tromso, Norway, 2020, 310 pp; ISBN 9788282966207.
- Sadoul, B.; Geffroy, B. Measuring Cortisol, the Major Stress Hormone in Fishes. J Fish Biol 2019, 94, 540–555. [Google Scholar] [CrossRef] [PubMed]
- Winberg, S.; Höglund, E.; Øverli, Ø. Variation in the Neuroendocrine Stress Response. In Fish Physiology; Elsevier Inc., 2016; Vol. 35, pp. 35–74.
- Madaro, A.; Nilsson, J.; Whatmore, P.; Roh, H.J.; Grove, S.; Stien, L.H.; Olsen, R.E. Acute Stress Response on Atlantic Salmon: A Time-Course Study of the Effects on Plasma Metabolites, Mucus Cortisol Levels, and Head Kidney Transcriptome Profile. Fish Physiol Biochem 2023, 49, 97–116. [Google Scholar] [CrossRef]
- Matley, J.K.; Johansen, L.K.; Klinard, N.V.; Eanes, S.T.; Jobsis, P.D. Habitat Selection and 3D Space Use Partitioning of Resident Juvenile Hawksbill Sea Turtles in a Small Caribbean Bay. Mar Biol 2021, 168, 120. [Google Scholar] [CrossRef]
- Georgopoulou, D.G.; Vouidaskis, C.; Papandroulakis, N. Swimming Behavior as a Potential Metric to Detect Satiation Levels of European Seabass in Marine Cages. Front Mar Sci 2024, 11, 1350385. [Google Scholar] [CrossRef]
- Calduch-Giner, J.; Holhorea, P.G.; Ferrer, M.A.; Naya-Català, F.; Rosell-Moll, E.; Vega García, C.; Prunet, P.; Espmark, A.M.; Leguen, I.; Kolarevic, J.; et al. Revising the Impact and Prospects of Activity and Ventilation Rate Bio-Loggers for Tracking Welfare and Fish-Environment Interactions in Salmonids and Mediterranean Farmed Fish. Front Mar Sci 2022, 9, 854888. [Google Scholar] [CrossRef]
- Bozzi, D.; Rasmussen, J.A.; Carøe, C.; Sveier, H.; Nordøy, K.; Gilbert, M.T.P.; Limborg, M.T. Salmon Gut Microbiota Correlates with Disease Infection Status: Potential for Monitoring Health in Farmed Animals. Anim Microbiome 2021, 3, 30. [Google Scholar] [CrossRef] [PubMed]
- Domingo-Bretón, R.; Cools, S.; Belenguer, A.; Calduch-Giner, J.A.; Croes, E.; Holhorea, P.G.; Naya-Català, F.; Boon, H.; Pérez-Sánchez, J. Gilthead Sea Bream Microbiota Shifts Associated with Thermal Stress and Dietary Intervention during a Record Heat Summer. In Proceedings of the Aquaculture Europe 2023, Viena, Austria, 2023 (19-21 September 2023). [Google Scholar]
- Steiner, K.; Laroche, O.; Walker, S.P.; Symonds, J.E. Effects of Water Temperature on the Gut Microbiome and Physiology of Chinook Salmon (Oncorhynchus Tshawytscha) Reared in a Freshwater Recirculating System. Aquaculture 2022, 560, 738529. [Google Scholar] [CrossRef]
- Montero, D.; Rimoldi, S.; Torrecillas, S.; Rapp, J.; Moroni, F.; Herrera, A.; Gómez, M.; Fernández-Montero, Á.; Terova, G. Impact of Polypropylene Microplastics and Chemical Pollutants on European Sea Bass (Dicentrarchus Labrax) Gut Microbiota and Health. Science of the Total Environment 2022, 805, 150402. [Google Scholar] [CrossRef] [PubMed]
- Bao, R.; Cheng, Z.; Peng, L.; Mehmood, T.; Gao, L.; Zhuo, S.; Wang, L.; Su, Y. Effects of Biodegradable and Conventional Microplastics on the Intestine, Intestinal Community Composition, and Metabolic Levels in Tilapia (Oreochromis Mossambicus). Aquatic Toxicology 2023, 265, 106745. [Google Scholar] [CrossRef] [PubMed]
- Toxqui-Rodríguez, S.; Naya-Català, F.; Sitjà-Bobadilla, A.; Piazzon, M.C.; Pérez-Sánchez, J. Fish Microbiomics: Strengths and Limitations of MinION Sequencing of Gilthead Sea Bream (Sparus Aurata) Intestinal Microbiota. Aquaculture 2023, 569, 739388. [Google Scholar] [CrossRef]
- Older, C.E.; Yamamoto, F.Y.; Griffin, M.J.; Ware, C.; Heckman, T.I.; Soto, E.; Bosworth, B.G.; Waldbieser, G.C. Comparison of High-Throughput Sequencing Methods for Bacterial Microbiota Profiling in Catfish Aquaculture. N Am J Aquac 2024, 86, 39–54. [Google Scholar] [CrossRef]
- Sun, F.; Wang, Y.; Wang, C.; Zhang, L.; Tu, K.; Zheng, Z. Insights into the Intestinal Microbiota of Several Aquatic Organisms and Association with the Surrounding Environment. Aquaculture 2019, 507, 196–202. [Google Scholar] [CrossRef]
- Naya-Català, F.; Piazzon, M.C.; Torrecillas, S.; Toxqui-Rodríguez, S.; Calduch-Giner, J.A.; Fontanillas, R.; Sitjà-Bobadilla, A.; Montero, D.; Pérez-Sánchez, J. Genetics and Nutrition Drive the Gut Microbiota Succession and Host-Transcriptome Interactions through the Gilthead Sea Bream (Sparus Aurata) Production Cycle. Biology (Basel) 2022, 11, 1744. [Google Scholar] [CrossRef] [PubMed]
- Horvath, S. DNA Methylation Age of Human Tissues and Cell Types. Genome Biol 2013, 14, R115. [Google Scholar] [CrossRef] [PubMed]
- De Paoli-Iseppi, R.; Deagle, B.E.; Polanowski, A.M.; McMahon, C.R.; Dickinson, J.L.; Hindell, M.A.; Jarman, S.N. Age Estimation in a Long-Lived Seabird (Ardenna Tenuirostris) Using DNA Methylation-Based Biomarkers. Mol Ecol Resour 2019, 19, 411–425. [Google Scholar] [CrossRef] [PubMed]
- Piferrer, F.; Anastasiadi, D. Age Estimation in Fishes Using Epigenetic Clocks: Applications to Fisheries Management and Conservation Biology. Front Mar Sci 2023, 10, 1062151. [Google Scholar] [CrossRef]
- O’Dea, R.E.; Noble, D.W.A.; Johnson, S.L.; Hesselson, D.; Nakagawa, S. The Role of Non-Genetic Inheritance in Evolutionary Rescue: Epigenetic Buffering, Heritable Bet Hedging and Epigenetic Traps. Environ Epigenet 2016, 2, 1–12. [Google Scholar] [CrossRef] [PubMed]
- Parrott, B.B.; Bertucci, E.M. Epigenetic Aging Clocks in Ecology and Evolution. Trends Ecol Evol 2019, 34, 767–770. [Google Scholar] [CrossRef] [PubMed]
- Bertucci, E.M.; Wason, M.W.; Rhodes, O.E.; Parrott, B.B. Exposure to ionizing radiation disrupts normal epigenetic aging in Japanese medaka. Aging 2021, 13, 22752–22771. [Google Scholar] [CrossRef] [PubMed]
- Bell, C.G.; Lowe, R.; Adams, P.D.; Baccarelli, A.A.; Beck, S.; Bell, J.T.; Christensen, B.C.; Gladyshev, V.N.; Heijmans, B.T.; Horvath, S.; et al. DNA Methylation Aging Clocks: Challenges and Recommendations. Genome Biol 2019, 20, 249. [Google Scholar] [CrossRef] [PubMed]
- Gensous, N.; Sala, C.; Pirazzini, C.; Ravaioli, F.; Milazzo, M.; Kwiatkowska, K.M.; Marasco, E.; De Fanti, S.; Giuliani, C.; Pellegrini, C.; et al. A Targeted Epigenetic Clock for the Prediction of Biological Age. Cells 2022, 11, 4044. [Google Scholar] [CrossRef] [PubMed]
- Rutledge, J.; Oh, H.; Wyss-Coray, T. Measuring Biological Age Using Omics Data. Nat Rev Genet 2022, 23, 715–727. [Google Scholar] [CrossRef] [PubMed]
- Duan, R.; Fu, Q.; Sun, Y.; Li, Q. Epigenetic Clock: A Promising Biomarker and Practical Tool in Aging. Ageing Res Rev 2022, 81, 101743. [Google Scholar] [CrossRef] [PubMed]
- Tangili, M.; Slettenhaar, A.J.; Sudyka, J.; Dugdale, H.L.; Pen, I.; Palsbøll, P.J.; Verhulst, S. DNA Methylation Markers of Age(Ing) in Non-Model Animals. Mol Ecol 2023, 32, 4725–4741. [Google Scholar] [CrossRef] [PubMed]
- Bateson, M.; Poirier, C. Can Biomarkers of Biological Age Be Used to Assess Cumulative Lifetime Experience? Animal Welfare 2019, 28, 41–56. [Google Scholar] [CrossRef]
- Keeling, L.J.; Winckler, C.; Hintze, S.; Forkman, B. Towards a Positive Welfare Protocol for Cattle: A Critical Review of Indicators and Suggestion of How We Might Proceed. Front Anim Sci 2021, 2, 753080. [Google Scholar] [CrossRef]
- da Silva, A.N.; Araujo, M.S.; Pértille, F.; Zanella, A.J. How Epigenetics Can Enhance Pig Welfare? Animals 2022, 12, 32. [Google Scholar] [CrossRef] [PubMed]
- Colditz, I.G.; Smith, E.G.; Ingham, A.B.; Dominik, S. Indicators of Functional Integrity in Production Animals. Anim Prod Sci 2023, 63, 825–843. [Google Scholar] [CrossRef]
- Simpson, D.J.; Chandra, T. Epigenetic Age Prediction. Aging Cell 2021, 20, e13452. [Google Scholar] [CrossRef] [PubMed]
- Jung, S.; Arcos Hodar, J.; del Sol, A. Measuring Biological Age Using a Functionally Interpretable Multi-Tissue RNA Clock. Aging Cell 2023, 22, e13799. [Google Scholar] [CrossRef] [PubMed]
- Naya-Català, F.; Belenguer, A.; Montero, D.; Torrecillas, S.; Soriano, B.; Calduch-Giner, J.; Llorens, C.; Fontanillas, R.; Sarih, S.; Zamorano, M.J.; et al. Broodstock Nutritional Programming Differentially Affects the Hepatic Transcriptome and Genome-Wide DNA Methylome of Farmed Gilthead Sea Bream (Sparus Aurata) Depending on Genetic Background. BMC Genomics 2023, 24, 670. [Google Scholar] [CrossRef] [PubMed]
- Valdivieso, A.; Anastasiadi, D.; Ribas, L.; Piferrer, F. Development of Epigenetic Biomarkers for the Identification of Sex and Thermal Stress in Fish Using DNA Methylation Analysis and Machine Learning Procedures. Mol Ecol Resour 2023, 23, 453–470. [Google Scholar] [CrossRef] [PubMed]
- Beemelmanns, A.; Ribas, L.; Anastasiadi, D.; Moraleda-Prados, J.; Zanuzzo, F.S.; Rise, M.L.; Gamperl, A.K. DNA Methylation Dynamics in Atlantic Salmon (Salmo Salar) Challenged With High Temperature and Moderate Hypoxia. Front Mar Sci 2021, 7, 604878. [Google Scholar] [CrossRef]
- Simó-Mirabet, P.; Perera, E.; Calduch-Giner, J.A.; Pérez-Sánchez, J. Local DNA Methylation Helps to Regulate Muscle Sirtuin 1 Gene Expression across Seasons and Advancing Age in Gilthead Sea Bream (Sparus Aurata). Front Zool 2020, 17, 15. [Google Scholar] [CrossRef] [PubMed]
- Li, Y.; Huang, J.; Liu, Z.; Zhou, Y.; Xia, B.; Wang, Y.; Kang, Y.; Wang, J. Transcriptome Analysis Provides Insights into Hepatic Responses to Moderate Heat Stress in the Rainbow Trout (Oncorhynchus Mykiss). Gene 2017, 619, 1–9. [Google Scholar] [CrossRef] [PubMed]
- Beemelmanns, A.; Zanuzzo, F.S.; Xue, X.; Sandrelli, R.M.; Rise, M.L.; Gamperl, A.K. The Transcriptomic Responses of Atlantic Salmon (Salmo Salar) to High Temperature Stress Alone, and in Combination with Moderate Hypoxia. BMC Genomics 2021, 22, 261. [Google Scholar] [CrossRef] [PubMed]
- Burgerhout, E.; Mommens, M.; Johnsen, H.; Aunsmo, A.; Santi, N.; Andersen, O. Genetic Background and Embryonic Temperature Affect DNA Methylation and Expression of Myogenin and Muscle Development in Atlantic Salmon (Salmo Salar). PLoS One 2017, 12, e0179918. [Google Scholar] [CrossRef] [PubMed]
- Veron, V.; Marandel, L.; Liu, J.; Vélez, E.J.; Lepais, O.; Panserat, S.; Skiba, S.; Seiliez, I. DNA Methylation of the Promoter Region of Bnip3 and Bnip3l Genes Induced by Metabolic Programming 06 Biological Sciences 0604 Genetics. BMC Genomics 2018, 19, 677. [Google Scholar] [CrossRef] [PubMed]
- Zheng, J.L.; Guo, S.N.; Yuan, S.S.; Xia, H.; Zhu, Q.L.; Lv, Z.M. Preheating Mitigates Cadmium Toxicity in Zebrafish Livers: Evidence from Promoter Demethylation, Gene Transcription to Biochemical Levels. Aquatic Toxicology 2017, 190, 104–111. [Google Scholar] [CrossRef] [PubMed]
- Stien, L.H.; Bracke, M.; Noble, C.; Kristiansen, T.S. Assessing Fish Welfare in Aquaculture. In The welfare of the fish; Kristiansen, T.S., Ferno, A., Pavlidis, M.A., van de Vis, H., Eds.; Springer Nature Switzerland AG: Cham, Switzerland, 2020; pp. 303–322. [Google Scholar]
- van de Vis, H.; Kolarevic, J.; Stien, L.H.; Kristiansen, T.S.; Gerritzen, M.; van de Braak, K.; Abbink, W.; Sæther, B.-S.; Noble, C. Welfare of Farmed Fish in Different Production Systems and Operations. In The welfare of the fish; Kristiansen, T.S., Ferno, A., Pavlidis, M.A., van de Vis, H., Eds.; Springer Nature Switzerland AG: Cham, Switzerland, 2020; pp. 323–362. [Google Scholar]
- Piferrer, F.; Blázquez, M.; Navarro, L.; González, A. Genetic, Endocrine, and Environmental Components of Sex Determination and Differentiation in the European Sea Bass (Dicentrarchus Labrax L.). Gen Comp Endocrinol 2005, 142, 102–110. [Google Scholar] [CrossRef] [PubMed]
- Navarro-Martín, L.; Blázquez, M.; Viñas, J.; Joly, S.; Piferrer, F. Balancing the Effects of Rearing at Low Temperature during Early Development on Sex Ratios, Growth and Maturation in the European Sea Bass (Dicentrarchus Labrax). Limitations and Opportunities for the Production of Highly Female-Biased Stocks. Aquaculture 2009, 296, 347–358. [Google Scholar] [CrossRef]
- Simó-Mirabet, P.; Felip, A.; Estensoro, I.; Martos-Sitcha, J.A.; de las Heras, V.; Calduch-Giner, J.; Puyalto, M.; Karalazos, V.; Sitjà-Bobadilla, A.; Pérez-Sánchez, J. Impact of Low Fish Meal and Fish Oil Diets on the Performance, Sex Steroid Profile and Male-Female Sex Reversal of Gilthead Sea Bream (Sparus Aurata) over a Three-Year Production Cycle. Aquaculture 2018, 490, 64–74. [Google Scholar] [CrossRef]
- Holhorea, P.G.; Felip, A.; Calduch-Giner, J.A.; Afonso, J.M.; Pérez-Sánchez, J. Use of Male-to-Female Sex Reversal as a Welfare Scoring System in the Protandrous Farmed Gilthead Sea Bream (Sparus Aurata). Front Vet Sci 2023, 9, 1083255. [Google Scholar] [CrossRef] [PubMed]
- Frenk, S.; Houseley, J. Gene Expression Hallmarks of Cellular Ageing. Biogerontology 2018, 19, 547–566. [Google Scholar] [CrossRef] [PubMed]
- López-Otín, C.; Blasco, M.A.; Partridge, L.; Serrano, M.; Kroemer, G. Hallmarks of Aging: An Expanding Universe. Cell 2023, 186, 243–278. [Google Scholar] [CrossRef] [PubMed]
- Stegeman, R.; Weake, V.M. Transcriptional Signatures of Aging. J Mol Biol 2017, 429, 2427–2437. [Google Scholar] [CrossRef] [PubMed]
- Shavlakadze, T.; Morris, M.; Fang, J.; Wang, S.X.; Zhu, J.; Zhou, W.; Tse, H.W.; Mondragon-Gonzalez, R.; Roma, G.; Glass, D.J. Age-Related Gene Expression Signature in Rats Demonstrate Early, Late, and Linear Transcriptional Changes from Multiple Tissues. Cell Rep 2019, 28, 3263–3273.e3. [Google Scholar] [CrossRef] [PubMed]
- Hernando-Herraez, I.; Evano, B.; Stubbs, T.; Commere, P.H.; Jan Bonder, M.; Clark, S.; Andrews, S.; Tajbakhsh, S.; Reik, W. Ageing Affects DNA Methylation Drift and Transcriptional Cell-to-Cell Variability in Mouse Muscle Stem Cells. Nat Commun 2019, 10, 4361. [Google Scholar] [CrossRef] [PubMed]
- Kijima, Y.; Wantong, W.; Igarashi, Y.; Yoshitake, K.; Asakawa, S.; Suzuki, Y.; Watabe, S.; Kinoshita, S. Age-Associated Different Transcriptome Profiling in Zebrafish and Rats: An Insight into the Diversity of Vertebrate Aging. Mar Biotechnol 2022, 24, 895–910. [Google Scholar] [CrossRef] [PubMed]
- Xu, A.; Teefy, B.B.; Lu, R.J.; Nozownik, S.; Tyers, A.M.; Valenzano, D.R.; Benayoun, B.A. Transcriptomes of Aging Brain, Heart, Muscle, and Spleen from Female and Male African Turquoise Killifish. Sci Data 2023, 10, 695. [Google Scholar] [CrossRef] [PubMed]
- López-Otín, C.; Blasco, M.A.; Partridge, L.; Serrano, M.; Kroemer, G. The Hallmarks of Aging. Cell 2013, 153, 1194. [Google Scholar] [CrossRef] [PubMed]
- López-Gil, L.; Pascual-Ahuir, A.; Proft, M. Genomic Instability and Epigenetic Changes during Aging. Int J Mol Sci 2023, 24, 14279. [Google Scholar] [CrossRef] [PubMed]
- Jung, M.; Pfeifer, G.P. Aging and DNA Methylation. BMC Biol 2015, 13, 7. [Google Scholar] [CrossRef] [PubMed]
- Zupkovitz, G.; Kabiljo, J.; Kothmayer, M.; Schlick, K.; Schöfer, C.; Lagger, S.; Pusch, O. Analysis of Methylation Dynamics Reveals a Tissue-Specific, Age-Dependent Decline in 5-Methylcytosine Within the Genome of the Vertebrate Aging Model Nothobranchius Furzeri. Front Mol Biosci 2021, 8, 627143. [Google Scholar] [CrossRef] [PubMed]
- Heyn, H.; Li, N.; Ferreira, H.J.; Moran, S.; Pisano, D.G.; Gomez, A.; Diez, J.; Sanchez-Mut, J.V.; Setien, F.; Carmona, F.J.; et al. Distinct DNA Methylomes of Newborns and Centenarians. Proc Natl Acad Sci U S A 2012, 109, 10522–10527. [Google Scholar] [CrossRef] [PubMed]
- Johnson, A.A.; Akman, K.; Calimport, S.R.G.; Wuttke, D.; Stolzing, A.; De Magalhães, J.P. The Role of DNA Methylation in Aging, Rejuvenation, and Age-Related Disease. Rejuvenation Res 2012, 15, 483–494. [Google Scholar] [CrossRef] [PubMed]
- Shimoda, N.; Izawa, T.; Yoshizawa, A.; Yokoi, H.; Kikuchi, Y.; Hashimoto, N. Decrease in Cytosine Methylation at CpG Island Shores and Increase in DNA Fragmentation during Zebrafish Aging. Age (Omaha) 2014, 36, 103–115. [Google Scholar] [CrossRef]
- Anastasiadi, D.; Piferrer, F. A Clockwork Fish: Age Prediction Using DNA Methylation-Based Biomarkers in the European Seabass. Mol Ecol Resour 2020, 20, 387–397. [Google Scholar] [CrossRef] [PubMed]
- Newell-Price, J.; Adrian, J.L.C.; King, P. DNA Methylation and Silencing of Gene Expression. Trends Endocrinol Metab 2000, 11, 142–148. [Google Scholar] [CrossRef] [PubMed]
- Biermann, K.; Steger, K. Epigenetics in Male Germ Cells. J Androl 2007, 28, 466–480. [Google Scholar] [CrossRef] [PubMed]
- Jones, P.A. Functions of DNA Methylation: Islands, Start Sites, Gene Bodies and Beyond. Nat Rev Genet 2012, 13, 484–492. [Google Scholar] [CrossRef] [PubMed]
- Moore, L.D.; Le, T.; Fan, G. DNA Methylation and Its Basic Function. Neuropsychopharmacol 2013, 38, 23–38. [Google Scholar] [CrossRef] [PubMed]
- Brenet, F.; Moh, M.; Funk, P.; Feierstein, E.; Viale, A.J.; Socci, N.D.; Scandura, J.M. DNA Methylation of the First Exon Is Tightly Linked to Transcriptional Silencing. PLoS One 2011, 6, e14524. [Google Scholar] [CrossRef] [PubMed]
- Anastasiadi, D.; Esteve-Codina, A.; Piferrer, F. Consistent Inverse Correlation between DNA Methylation of the First Intron and Gene Expression across Tissues and Species. Epigenet Chromatin 2018, 11, 37. [Google Scholar] [CrossRef]
- Hon, G.C.; Hawkins, R.D.; Caballero, O.L.; Lo, C.; Lister, R.; Pelizzola, M.; Valsesia, A.; Ye, Z.; Kuan, S.; Edsall, L.E.; et al. Global DNA Hypomethylation Coupled to Repressive Chromatin Domain Formation and Gene Silencing in Breast Cancer. Genome Res 2012, 22, 246–258. [Google Scholar] [CrossRef] [PubMed]
- Yang, X.; Han, H.; DeCarvalho, D.D.; Lay, F.D.; Jones, P.A.; Liang, G. Gene Body Methylation Can Alter Gene Expression and Is a Therapeutic Target in Cancer. Cancer Cell 2014, 26, 577–590. [Google Scholar] [CrossRef]
- Kovalchuk, I. Role of DNA Methylation in Genome Stability. In Genome Stability: From Virus to Human Application; Kovalchuk, I., Kovalchuk, O., Eds.; Academic Press, London, United Kingdom, 2021; pp. 435–452 ISBN 9780323856799.
- Vikeså, V.; Nankervis, L.; Hevrøy, E.M. Appetite, Metabolism and Growth Regulation in Atlantic Salmon (Salmo Salar L.) Exposed to Hypoxia at Elevated Seawater Temperature. Aquac Res 2017, 48, 4086–4101. [Google Scholar] [CrossRef]
- Naya-Català, F.; Martos-Sitcha, J.A.; de las Heras, V.; Simó-Mirabet, P.; Calduch-Giner, J.; Pérez-Sánchez, J. Targeting the Mild-Hypoxia Driving Force for Metabolic and Muscle Transcriptional Reprogramming of Gilthead Sea Bream (Sparus Aurata) Juveniles. Biology (Basel) 2021, 10, 416. [Google Scholar] [CrossRef]
- Lu, A.T.; Fei, Z.; Haghani, A.; Robeck, T.R.; Zoller, J.A.; Li, C.Z.; Lowe, R.; Yan, Q.; Zhang, J.; Vu, H.; et al. Universal DNA Methylation Age across Mammalian Tissues. Nat Aging 2023, 3, 1144–1166. [Google Scholar] [CrossRef] [PubMed]
- Toiber, D.; Sebastian, C.; Mostoslavsky, R. Characterization of Nuclear Sirtuins: Molecular Mechanisms and Physiological Relevance. In Histone deacetylases: the biology and clinical implication; Yao, T.-P., Seto, E., Eds.; Springer: Heidelberg, Germany, 2011; pp. 189–224. [Google Scholar]
- Bellet, M.M.; Sassone-Corsi, P. Mammalian Circadian Clock and Metabolism - The Epigenetic Link. J Cell Sci 2010, 123, 3837–3848. [Google Scholar] [CrossRef] [PubMed]
- Bosch-Presegué, L.; Vaquero, A. Sirtuin-Dependent Epigenetic Regulation in the Maintenance of Genome Integrity. FEBS Journal 2015, 282, 1745–1767. [Google Scholar] [CrossRef] [PubMed]
- Xiao, F.H.; Kong, Q.P.; Perry, B.; He, Y.H. Progress on the Role of DNA Methylation in Aging and Longevity. Brief Funct Genomics 2016, 15, 454–459. [Google Scholar] [CrossRef] [PubMed]
- Zhao, L.; Cao, J.; Hu, K.; He, X.; Yun, D.; Tong, T.; Han, L. Sirtuins and Their Biological Relevance in Aging and Age-Related Diseases. Aging Dis 2020, 11, 927–945. [Google Scholar] [CrossRef] [PubMed]
- Kitajima, Y.; Yoshioka, K.; Suzuki, N. The Ubiquitin-Proteasome System in Regulation of the Skeletal Muscle Homeostasis and Atrophy: From Basic Science to Disorders. J Physiol Sci 2020, 70, 40. [Google Scholar] [CrossRef] [PubMed]
- Zeng, B.Y.; Medhurst, A.D.; Jackson, M.; Rose, S.; Jenner, P. Proteasomal Activity in Brain Differs between Species and Brain Regions and Changes with Age. Mech Ageing Dev 2005, 126, 760–766. [Google Scholar] [CrossRef] [PubMed]
- Dasuri, K.; Nguyen, A.; Zhang, L.; Fernandez-Kim, O.S.; Bruce-Keller, A.J.; Blalock, B.A.; De Cabo, R.; Keller, J.N. Comparison of Rat Liver and Brain Proteasomes for Oxidative Stress-Induced Inactivation: Influence of Ageing and Dietary Restriction. Free Radic Res 2009, 43, 28–36. [Google Scholar] [CrossRef] [PubMed]
- Ferrington, D.A.; Husom, A.D.; Thompson, L.V. Altered Proteasome Structure, Function, and Oxidation in Aged Muscle. The FASEB Journal 2005, 19, 1–24. [Google Scholar] [CrossRef] [PubMed]
- Krogan, N.J.; Lam, M.H.Y.; Fillingham, J.; Keogh, M.C.; Gebbia, M.; Li, J.; Datta, N.; Cagney, G.; Buratowski, S.; Emili, A.; et al. Proteasome Involvement in the Repair of DNA Double-Strand Breaks. Mol Cell 2004, 16, 1027–1034. [Google Scholar] [CrossRef] [PubMed]
- Salah Fararjeh, A.F.; Al-Khader, A.; Al-Saleem, M.; Abu Qauod, R. The Prognostic Significance of Proteasome 26S Subunit, Non-ATPase (PSMD) Genes for Bladder Urothelial Carcinoma Patients. Cancer Inform 2021, 20, 1–10. [Google Scholar] [CrossRef] [PubMed]
- Walsh, D.W.; Godson, C.; Brazil, D.P.; Martin, F. Extracellular BMP-Antagonist Regulation in Development and Disease: Tied up in Knots. Trends Cell Biol 2010, 20, 244–256. [Google Scholar] [CrossRef] [PubMed]
- Sartori, R.; Schirwis, E.; Blaauw, B.; Bortolanza, S.; Zhao, J.; Enzo, E.; Stantzou, A.; Mouisel, E.; Toniolo, L.; Ferry, A.; et al. BMP Signaling Controls Muscle Mass. Nat Genet 2013, 45, 1309–1321. [Google Scholar] [CrossRef] [PubMed]
- Nilwik, R.; Snijders, T.; Leenders, M.; Groen, B.B.L.; van Kranenburg, J.; Verdijk, L.B.; Van Loon, L.J.C. The Decline in Skeletal Muscle Mass with Aging Is Mainly Attributed to a Reduction in Type II Muscle Fiber Size. Exp Gerontol 2013, 48, 492–498. [Google Scholar] [CrossRef] [PubMed]
- Ruparelia, A.A.; Salavaty, A.; Barlow, C.K.; Lu, Y.; Sonntag, C.; Hersey, L.; Eramo, M.J.; Krug, J.; Reuter, H.; Schittenhelm, R.B.; et al. The African Killifish: A Short-Lived Vertebrate Model to Study the Biology of Sarcopenia and Longevity. Aging Cell 2024, 23, e13862. [Google Scholar] [CrossRef] [PubMed]
- Hodges-Savola, C.A.; Fernandez, H.L. A Role for Calcitonin Gene-Related Peptide in the Regulation of Rat Skeletal Muscle G 4 Acetylcholinesterase. Neurosci Lett 1995, 190, 117–120. [Google Scholar] [CrossRef] [PubMed]
- Fernandez, H.L.; Chen, M.; Nadelhaft, I.; Durr, J.A. Calcitonin Gene-Related Peptides: Their Binding Sites and Receptor Accessory Proteins in Adult Mammalian Skeletal Muscles. Neuroscience 2003, 119, 335–345. [Google Scholar] [CrossRef] [PubMed]
- Lu, B.; Fu, W.-m.; Greengard, P.; Poo, M.-m. Calcitonin gene-related peptide potentiates synaptic responses at developing neuromuscular junction. Letters to Nature 1993, 363, 76–79. [Google Scholar] [CrossRef] [PubMed]
- Arden, W.A.; Fiscus, R.R.; Beihn, L.D.; Derbin, M.; Oremus, R.; Gross, D.R. Skeletal Muscle Microcirculatory Response to Rat α-Calcitonin Gene-Related Peptide. Neuropeptides 1994, 27, 39–51. [Google Scholar] [CrossRef] [PubMed]
- Yamada, M.; Ishikawa, T.; Fujimori, A.; Goto, K. Local Neurogenic Regulation of Rat Hindlimb Circulation: Role of Calcitonin Gene-Related Peptide in Vasodilatation after Skeletal Muscle Contraction. Br J Pharmacol 1997, 122, 703–709. [Google Scholar] [CrossRef] [PubMed]
- Yamada, M.; Ishikawa, T.; Yamanaka, A.; Fujimori, A.; Goto, K. Local Neurogenic Regulation of Rat Hindlimb Circulation: CO 2-Induced Release of Calcitonin Gene-Related Peptide from Sensory Nerves. Br J Pharmacol 1997, 122, 710–714. [Google Scholar] [CrossRef] [PubMed]
- Zhang, Z.; Dickerson, I.M.; Russo, A.F. Calcitonin Gene-Related Peptide Receptor Activation by Receptor Activity-Modifying Protein-1 Gene Transfer to Vascular Smooth Muscle Cells. Endocrinology 2006, 147, 1932–1940. [Google Scholar] [CrossRef] [PubMed]
- Bloise, F.F.; Cordeiro, A.; Ortiga-Carvalho, T.M. Role of Thyroid Hormone in Skeletal Muscle Physiology. J Endocrinol 2018, 236, R57–R68. [Google Scholar] [CrossRef] [PubMed]
- Zhou, Q.; Kerbl-Knapp, J.; Zhang, F.; Korbelius, M.; Kuentzel, K.B.; Vujić, N.; Akhmetshina, A.; Hörl, G.; Paar, M.; Steyrer, E.; et al. Metabolomic Profiles of Mouse Tissues Reveal an Interplay between Aging and Energy Metabolism. Metabolites 2022, 12, 17. [Google Scholar] [CrossRef] [PubMed]
- Chen, W.J.; Lin, I.H.; Lee, C.W.; Chen, Y.F. Aged Skeletal Muscle Retains the Ability to Remodel Extracellular Matrix for Degradation of Collagen Deposition after Muscle Injury. Int J Mol Sci 2021, 22, 1–14. [Google Scholar] [CrossRef] [PubMed]
- Nonami, A.; Kato, R.; Taniguchi, K.; Yoshiga, D.; Taketomi, T.; Fukuyama, S.; Harada, M.; Sasaki, A.; Yoshimura, A. Spred-1 Negatively Regulates Interleukin-3-Mediated ERK/Mitogen-Activated Protein (MAP) Kinase Activation in Hematopoietic Cells. Journal of Biological Chemistry 2004, 279, 52543–52551. [Google Scholar] [CrossRef]
- Yuasa, K.; Okubo, K.; Yoda, M.; Otsu, K.; Ishii, Y.; Nakamura, M.; Itoh, Y.; Horiuchi, K. Targeted Ablation of P38α MAPK Suppresses Denervation-Induced Muscle Atrophy. Sci Rep 2018, 8, 9037. [Google Scholar] [CrossRef] [PubMed]
- Lingrel, J.B.; Kuntzweiler, T. Na+,K+-ATPase. J Biol Chem 1994, 269, 19659–19662. [Google Scholar] [CrossRef] [PubMed]
- Blanco, G.; Mercer, R.W. Isozymes of the Na-K-ATPase: Heterogeneity in Structure, Diversity in Function. Am J Physiol 1998, 275, (Renal Physiol 44) F633-F650. [Google Scholar] [CrossRef] [PubMed]
- Canfield, V.A.; Loppin, B.; Thisse, B.; Thisse, C.; Postlethwait, J.H.; Mohideen, M.-A.P.K.; Johannes, S.; Rajarao, R.; Levenson, R. Na,K-ATPase a and b Subunit Genes Exhibit Unique Expression Patterns during Zebrafish Embryogenesis. Mech Develop 2002, 116, 51–59. [Google Scholar] [CrossRef] [PubMed]
- Richards, J.G.; Semple, J.W.; Bystriansky, J.S.; Schulte, P.M. Na+/K+-ATPase α-Isoform Switching in Gills of Rainbow Trout (Oncorhynchus Mykiss) during Salinity Transfer. Journal of Experimental Biology 2003, 206, 4475–4486. [Google Scholar] [CrossRef] [PubMed]
- Doǧanli, C.; Kjaer-Sorensen, K.; Knoeckel, C.; Beck, H.C.; Nyengaard, J.R.; Honoré, B.; Nissen, P.; Ribera, A.; Oxvig, C.; Lykke-Hartmann, K. The A2Na+/K+-ATPase Is Critical for Skeletal and Heart Muscle Function in Zebrafish. J Cell Sci 2012, 125, 6166–6175. [Google Scholar] [CrossRef]
- Jensen, M.K.; Madsen, S.S.; Kristiansen, R. Osmoregulation and Salinity Effects on the Expression and Activity of Na+,K+-ATPase in the Gills of European Sea Bass, Dicentrarchus Labrax (L.). Journal of Experimental Zoology 1998, 282, 290–300. [Google Scholar] [CrossRef]
- Marshall, W.S.; Bryson, S.E. Transport Mechanisms of Seawater Teleost Chloride Cells: An Inclusive Model of a Multifunctional Cell. Comp Biochem Physiol 1998, 119, 97–106. [Google Scholar]
- Lin, C.H.; Tsai, R.S.; Lee, T.H. Expression and Distribution of Na, K-ATPase in Gill and Kidney of the Spotted Green Pufferfish, Tetraodon Nigroviridis, in Response to Salinity Challenge. Comp Biochem Physiol Part A 2004, 138, 287–295. [Google Scholar] [CrossRef] [PubMed]
- Laiz-Carrión, R.; Guerreiro, P.M.; Fuentes, J.; Canario, A.V.M.; Martín Del Río, M.P.; Mancera, J.M. Branchial Osmoregulatory Response to Salinity in the Gilthead Sea Bream, Sparus Auratus. J Exp Zool A Comp Exp Biol 2005, 303, 563–576. [Google Scholar] [CrossRef] [PubMed]
- Prochniewicz, E.; Thompson, L.V.; Thomas, D.D. Age-Related Decline in Actomyosin Structure and Function. Exp Gerontol 2007, 42, 931–938. [Google Scholar] [CrossRef] [PubMed]
- Jylhävä, J.; Pedersen, N.L.; Hägg, S. Biological Age Predictors. EBioMedicine 2017, 21, 29–36. [Google Scholar] [CrossRef] [PubMed]
- Holly, A.C.; Melzer, D.; Pilling, L.C.; Henley, W.; Hernandez, D.G.; Singleton, A.B.; Bandinelli, S.; Guralnik, J.M.; Ferrucci, L.; Harries, L.W. Towards a Gene Expression Biomarker Set for Human Biological Age. Aging Cell 2013, 12, 324–326. [Google Scholar] [CrossRef] [PubMed]
- Bafei, S.E.C.; Shen, C. Biomarkers Selection and Mathematical Modeling in Biological Age Estimation. npj Aging 2023, 9, 13, doi.org/10.1038/s41514–023. [Google Scholar] [CrossRef]
- Schmieder, R.; Edwards, R. Quality Control and Preprocessing of Metagenomic Datasets. Bioinformatics 2011, 27, 863–864. [Google Scholar] [CrossRef]
- Pérez-Sánchez, J.; Naya-Català, F.; Soriano, B.; Piazzon, M.C.; Hafez, A.; Gabaldón, T.; Llorens, C.; Sitjà-Bobadilla, A.; Calduch-Giner, J.A. Genome Sequencing and Transcriptome Analysis Reveal Recent Species-Specific Gene Duplications in the Plastic Gilthead Sea Bream (Sparus Aurata). Front Mar Sci 2019, 6, 760. [Google Scholar] [CrossRef]
- Trapnell, C.; Roberts, A.; Goff, L.; Pertea, G.; Kim, D.; Kelley, D.R.; Pimentel, H.; Salzberg, S.L.; Rinn, J.L.; Pachter, L. Differential Gene and Transcript Expression Analysis of RNA-Seq Experiments with TopHat and Cufflinks. Nat Protoc 2012, 7, 562–578. [Google Scholar] [CrossRef] [PubMed]
- Goff, L.; Trapnell, C.; Kelley, D. CummeRbund: Analysis, Exploration, Manipulation, and Visualization of Cufflinks High-Throughput Sequencing Data R Package. Version 2. 2013.
- Langmead, B.; Trapnell, C.; Pop, M.; Salzberg, S.L. Ultrafast and Memory-Efficient Alignment of Short DNA Sequences to the Human Genome. Genome Biol 2009, 10, R25. [Google Scholar] [CrossRef]
- Rice, P.; Longden, I.; Bleasby, A. EMBOSS: The European Molecular Biology Open Software Suite. Trends Genet 2000, .16, 276–277. [Google Scholar] [CrossRef] [PubMed]
- Love, M.I.; Huber, W.; Anders, S. Moderated Estimation of Fold Change and Dispersion for RNA-Seq Data with DESeq2. Genome Biol 2014, 15, 550. [Google Scholar] [CrossRef] [PubMed]
- Lienhard, M.; Grimm, C.; Morkel, M.; Herwig, R.; Chavez, L. MEDIPS: Genome-Wide Differential Coverage Analysis of Sequencing Data Derived from DNA Enrichment Experiments. Bioinformatics 2014, 30, 284–286. [Google Scholar] [CrossRef] [PubMed]
- Thévenot, E.A.; Roux, A.; Xu, Y.; Ezan, E.; Junot, C. Analysis of the Human Adult Urinary Metabolome Variations with Age, Body Mass Index, and Gender by Implementing a Comprehensive Workflow for Univariate and OPLS Statistical Analyses. J Proteome Res 2015, 14, 3322–3335. [Google Scholar] [CrossRef]
- Weiss, S.; Van Treuren, W.; Lozupone, C.; Faust, K.; Friedman, J.; Deng, Y.; Xia, L.C.; Xu, Z.Z.; Ursell, L.; Alm, E.J.; et al. Correlation Detection Strategies in Microbial Data Sets Vary Widely in Sensitivity and Precision. ISME Journal 2016, 10, 1669–1681. [Google Scholar] [CrossRef] [PubMed]
- Ge, S.X.; Jung, D.; Yao, R. ShinyGO: A Graphical Gene-Set Enrichment Tool for Animals and Plants. Bioinformatics 2020, 36, 2628–2629. [Google Scholar] [CrossRef]
- Klopfenstein, D.V.; Zhang, L.; Pedersen, B.S.; Ramírez, F.; Vesztrocy, A.W.; Naldi, A.; Mungall, C.J.; Yunes, J.M.; Botvinnik, O.; Weigel, M.; et al. GOATOOLS: A Python Library for Gene Ontology Analyses. Sci Rep 2018, 8, 10872. [Google Scholar] [CrossRef] [PubMed]
- Liu, W.; Xie, Y.; Ma, J.; Luo, X.; Nie, P.; Zuo, Z.; Lahrmann, U.; Zhao, Q.; Zheng, Y.; Zhao, Y.; et al. IBS: An Illustrator for the Presentation and Visualization of Biological Sequences. Bioinformatics 2015, 31, 3359–3361. [Google Scholar] [CrossRef] [PubMed]
Figure 1.
(A) Differentially expressed (DE) transcripts between one- (S+1) and three-year old fish (S+3). Numbers indicate DE transcripts (based on One-way ANOVA P<0.05 or FDR-adjusted P < 0.05, in brackets). (B) Scores plot of partial least-squares discriminant analysis (PLS-DA) of muscular transcripts from S+1 and S+3 animals. RNA-seq data in the analysis were normalized values of differentially expressed transcripts (One-way ANOVA, P < 0.05). (C) Heatmap showing the abundance distribution (z-score) of the DE genes identified to be driving the separation between age groups.
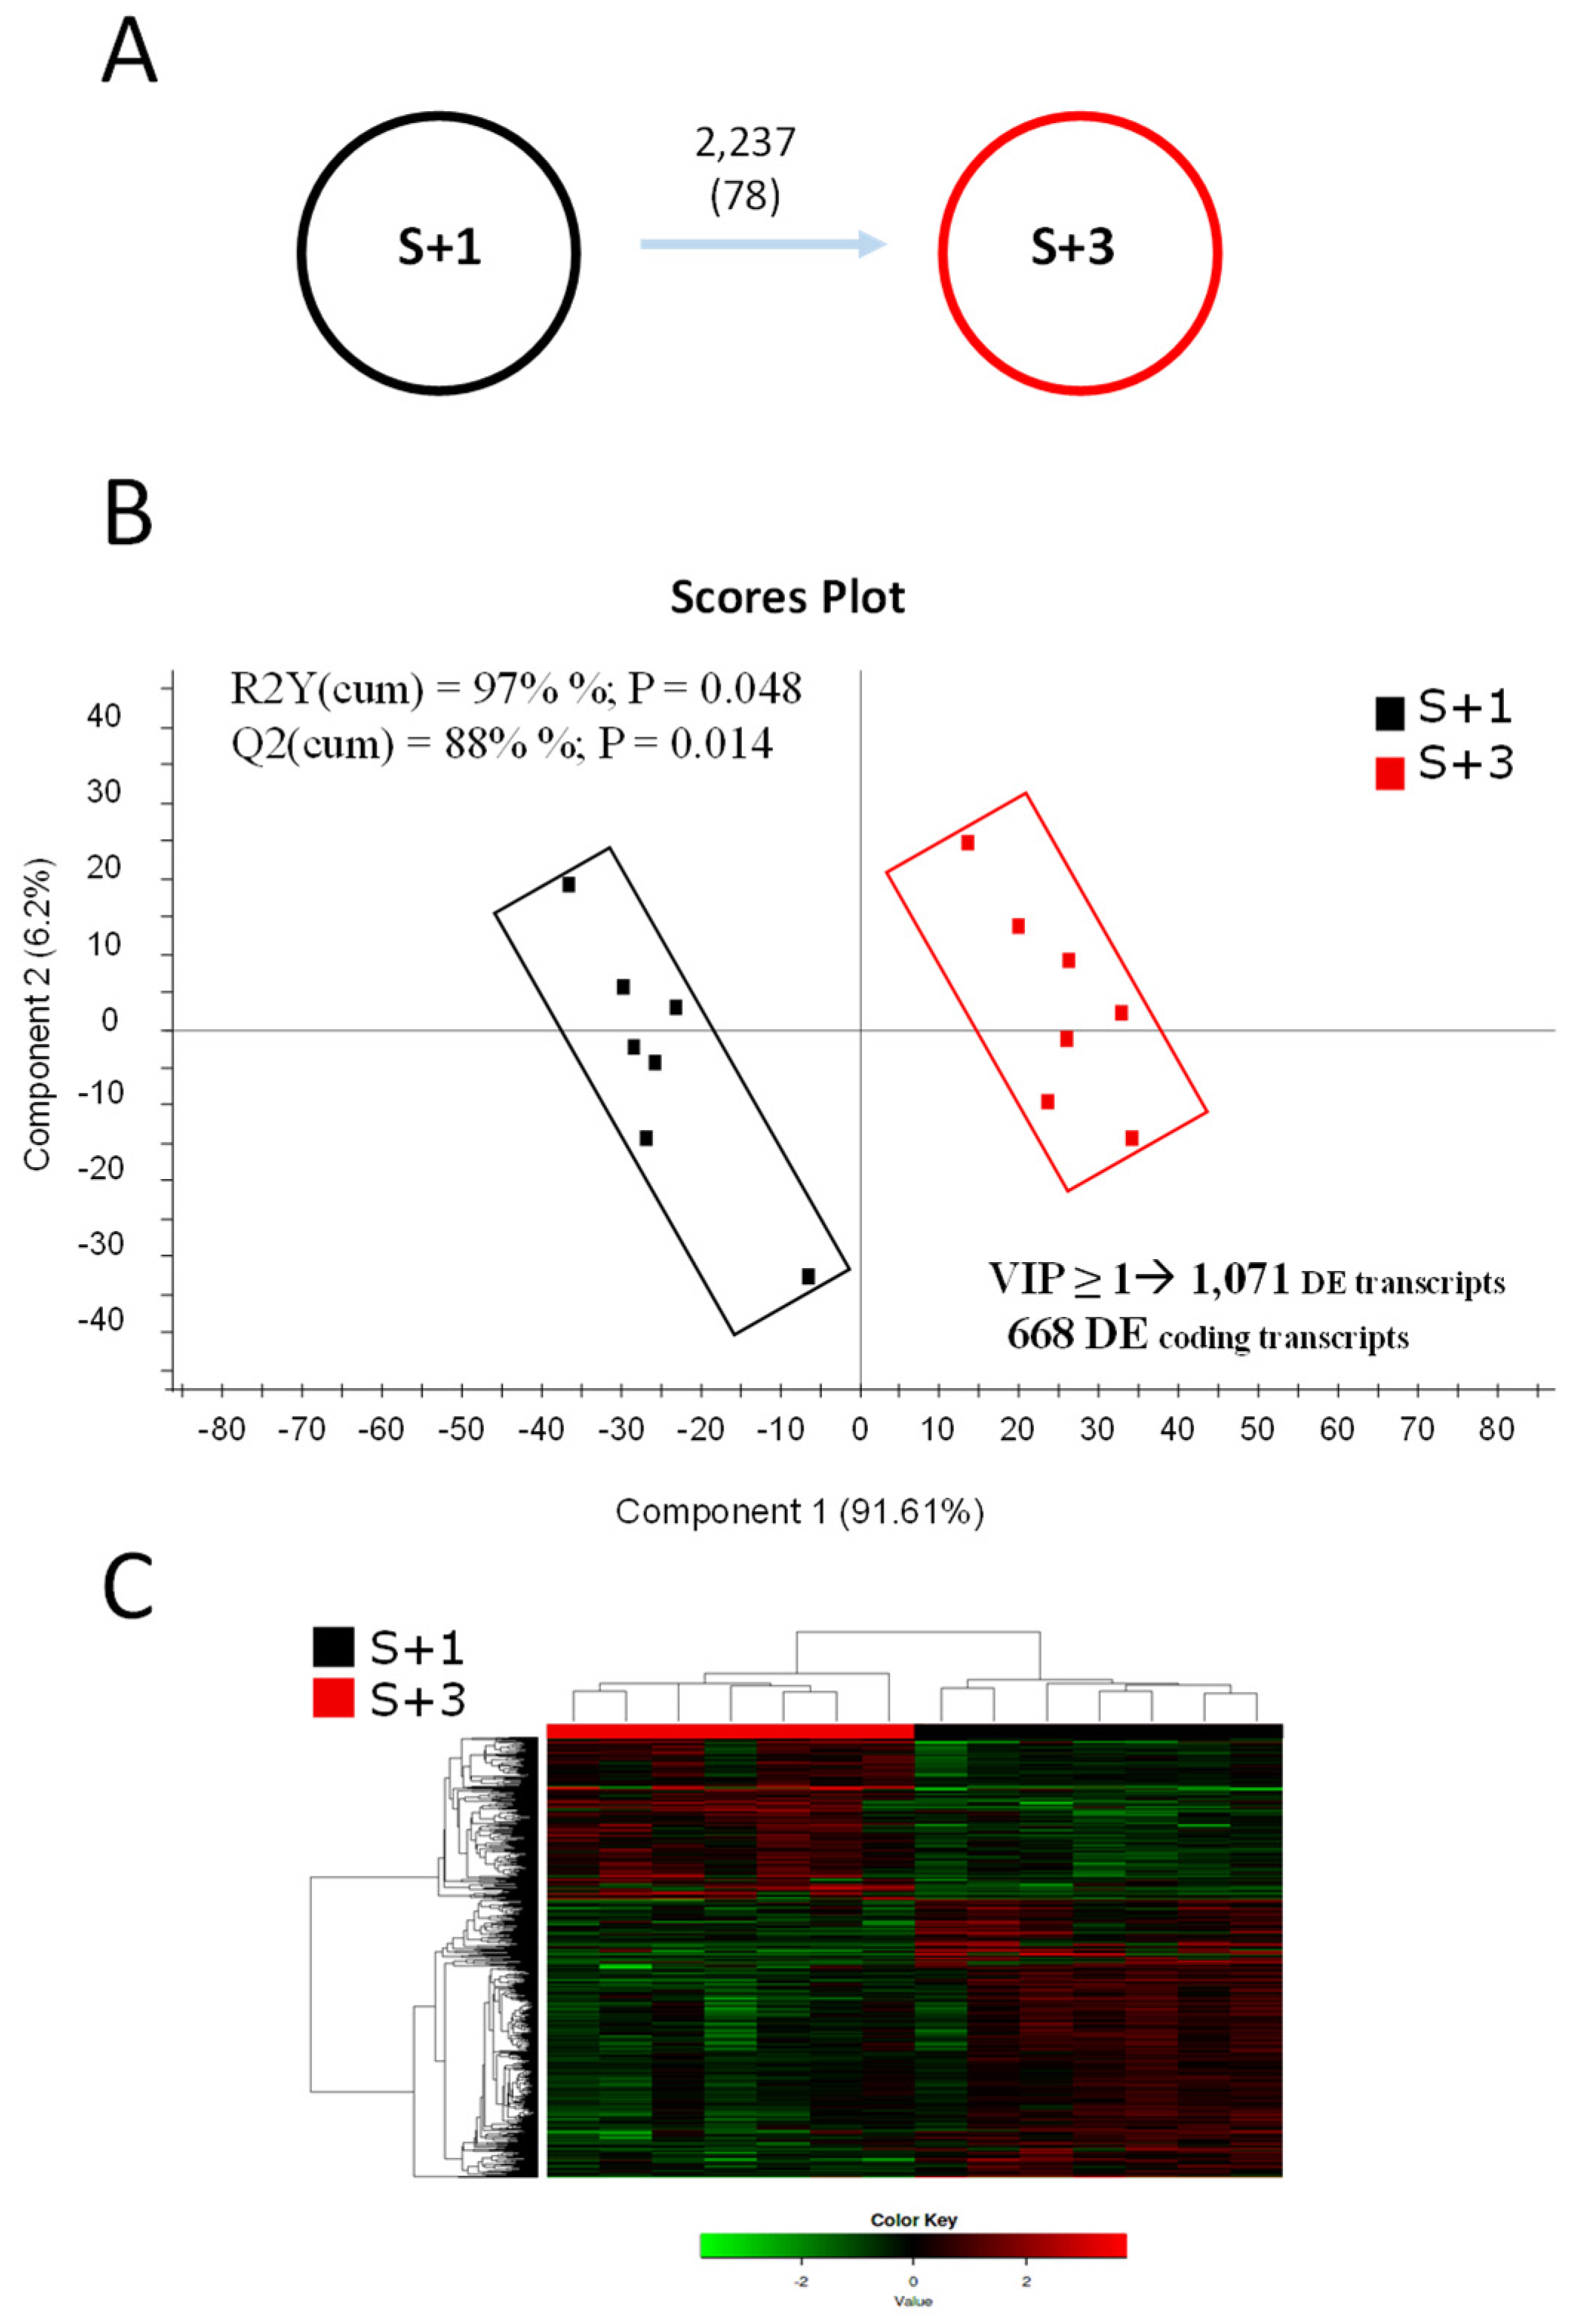
Figure 2.
(A) Differentially methylated (DM) regions between one- (S+1) and three-year old fish (S+3). Numbers indicate DM regions (based on One-way ANOVA P<0.05 or FDR-adjusted P < 0.05, in brackets). (B) Scores plot of partial least-squares discriminant analysis (PLS-DA) of muscular methylated regions from S+1 and S+3 animals. MBD-seq data were the normalized values of differentially methylated 25-bp genomic regions (One-way ANOVA, P < 0.05). (C) Heatmap showing the abundance distribution (z-score) of the DM regions identified to be driving the separation between age groups.
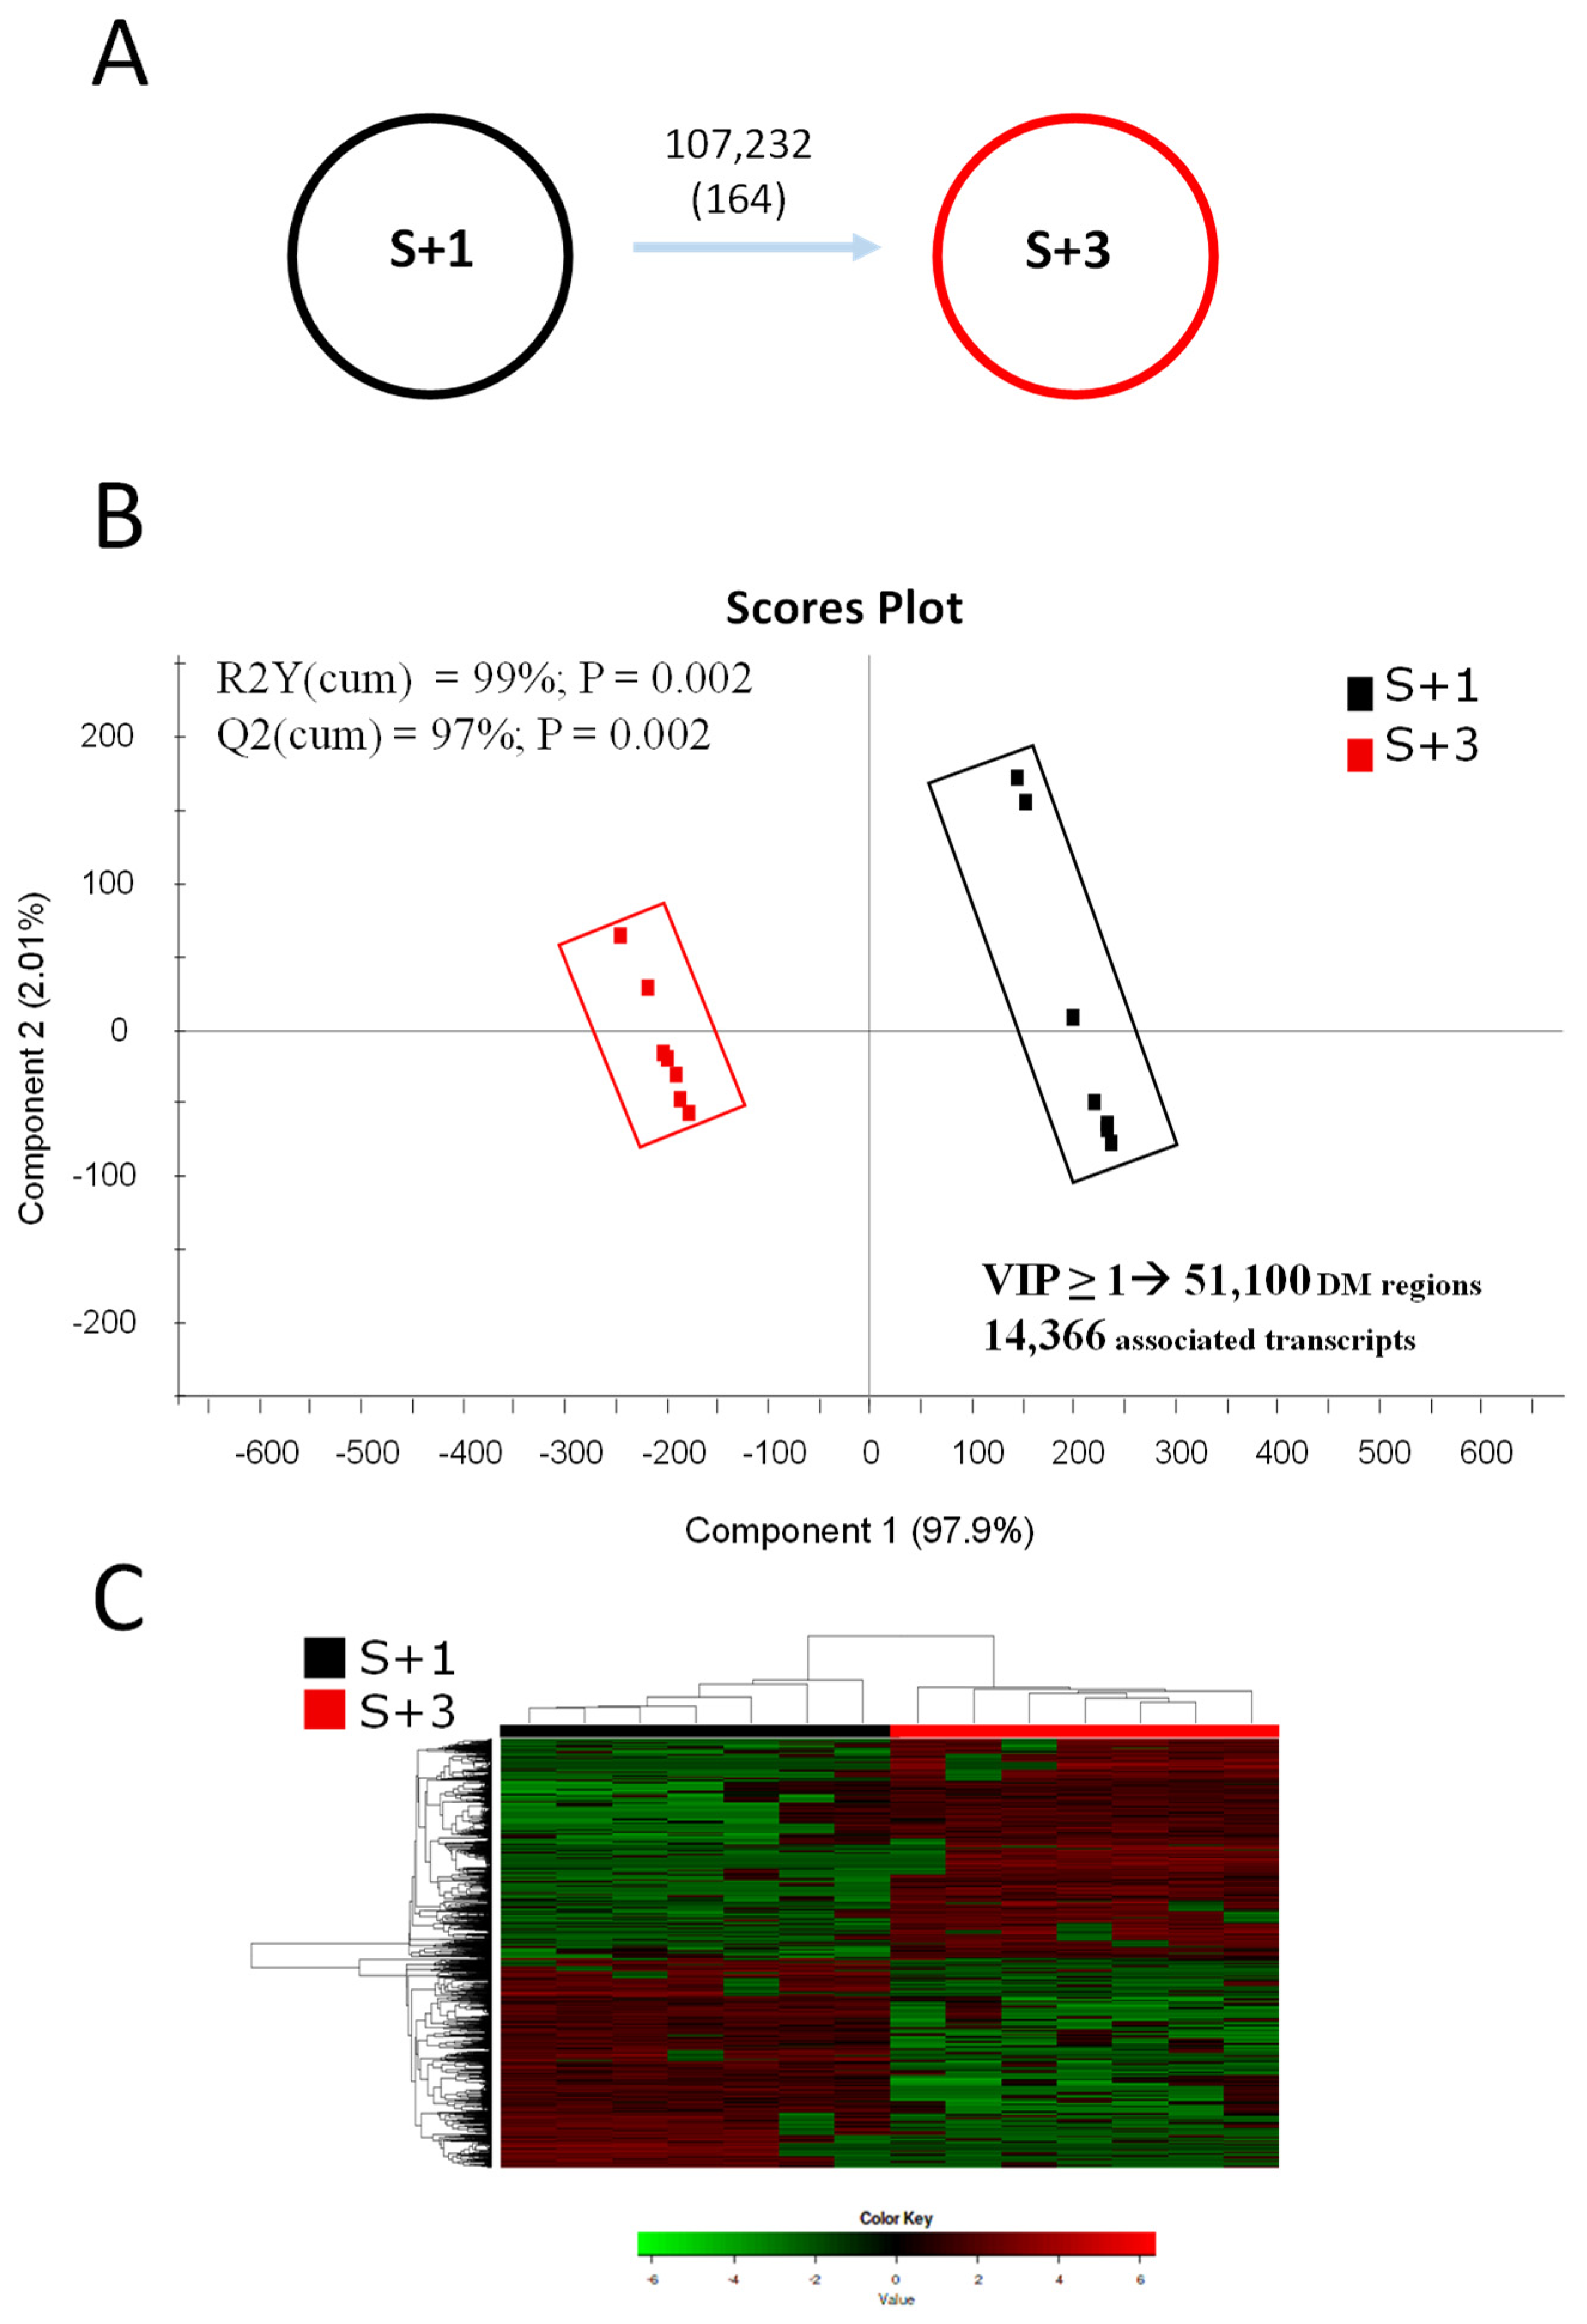
Figure 3.
(A) Numbers of discriminant DE transcripts, discriminant DM transcripts (containing DM regions), and the overlapping discriminant DE transcripts with DM regions. Bar plots depicting the results of an over-representation test performed over the GO-BP terms of the discriminant DE transcripts (B) and of the overlapping discriminant DE transcripts with DM regions (C). * indicates that the supra-category appears in C. Met., metabolic; Cel., cellular; Reg., regulation; Multicel., multicellular.
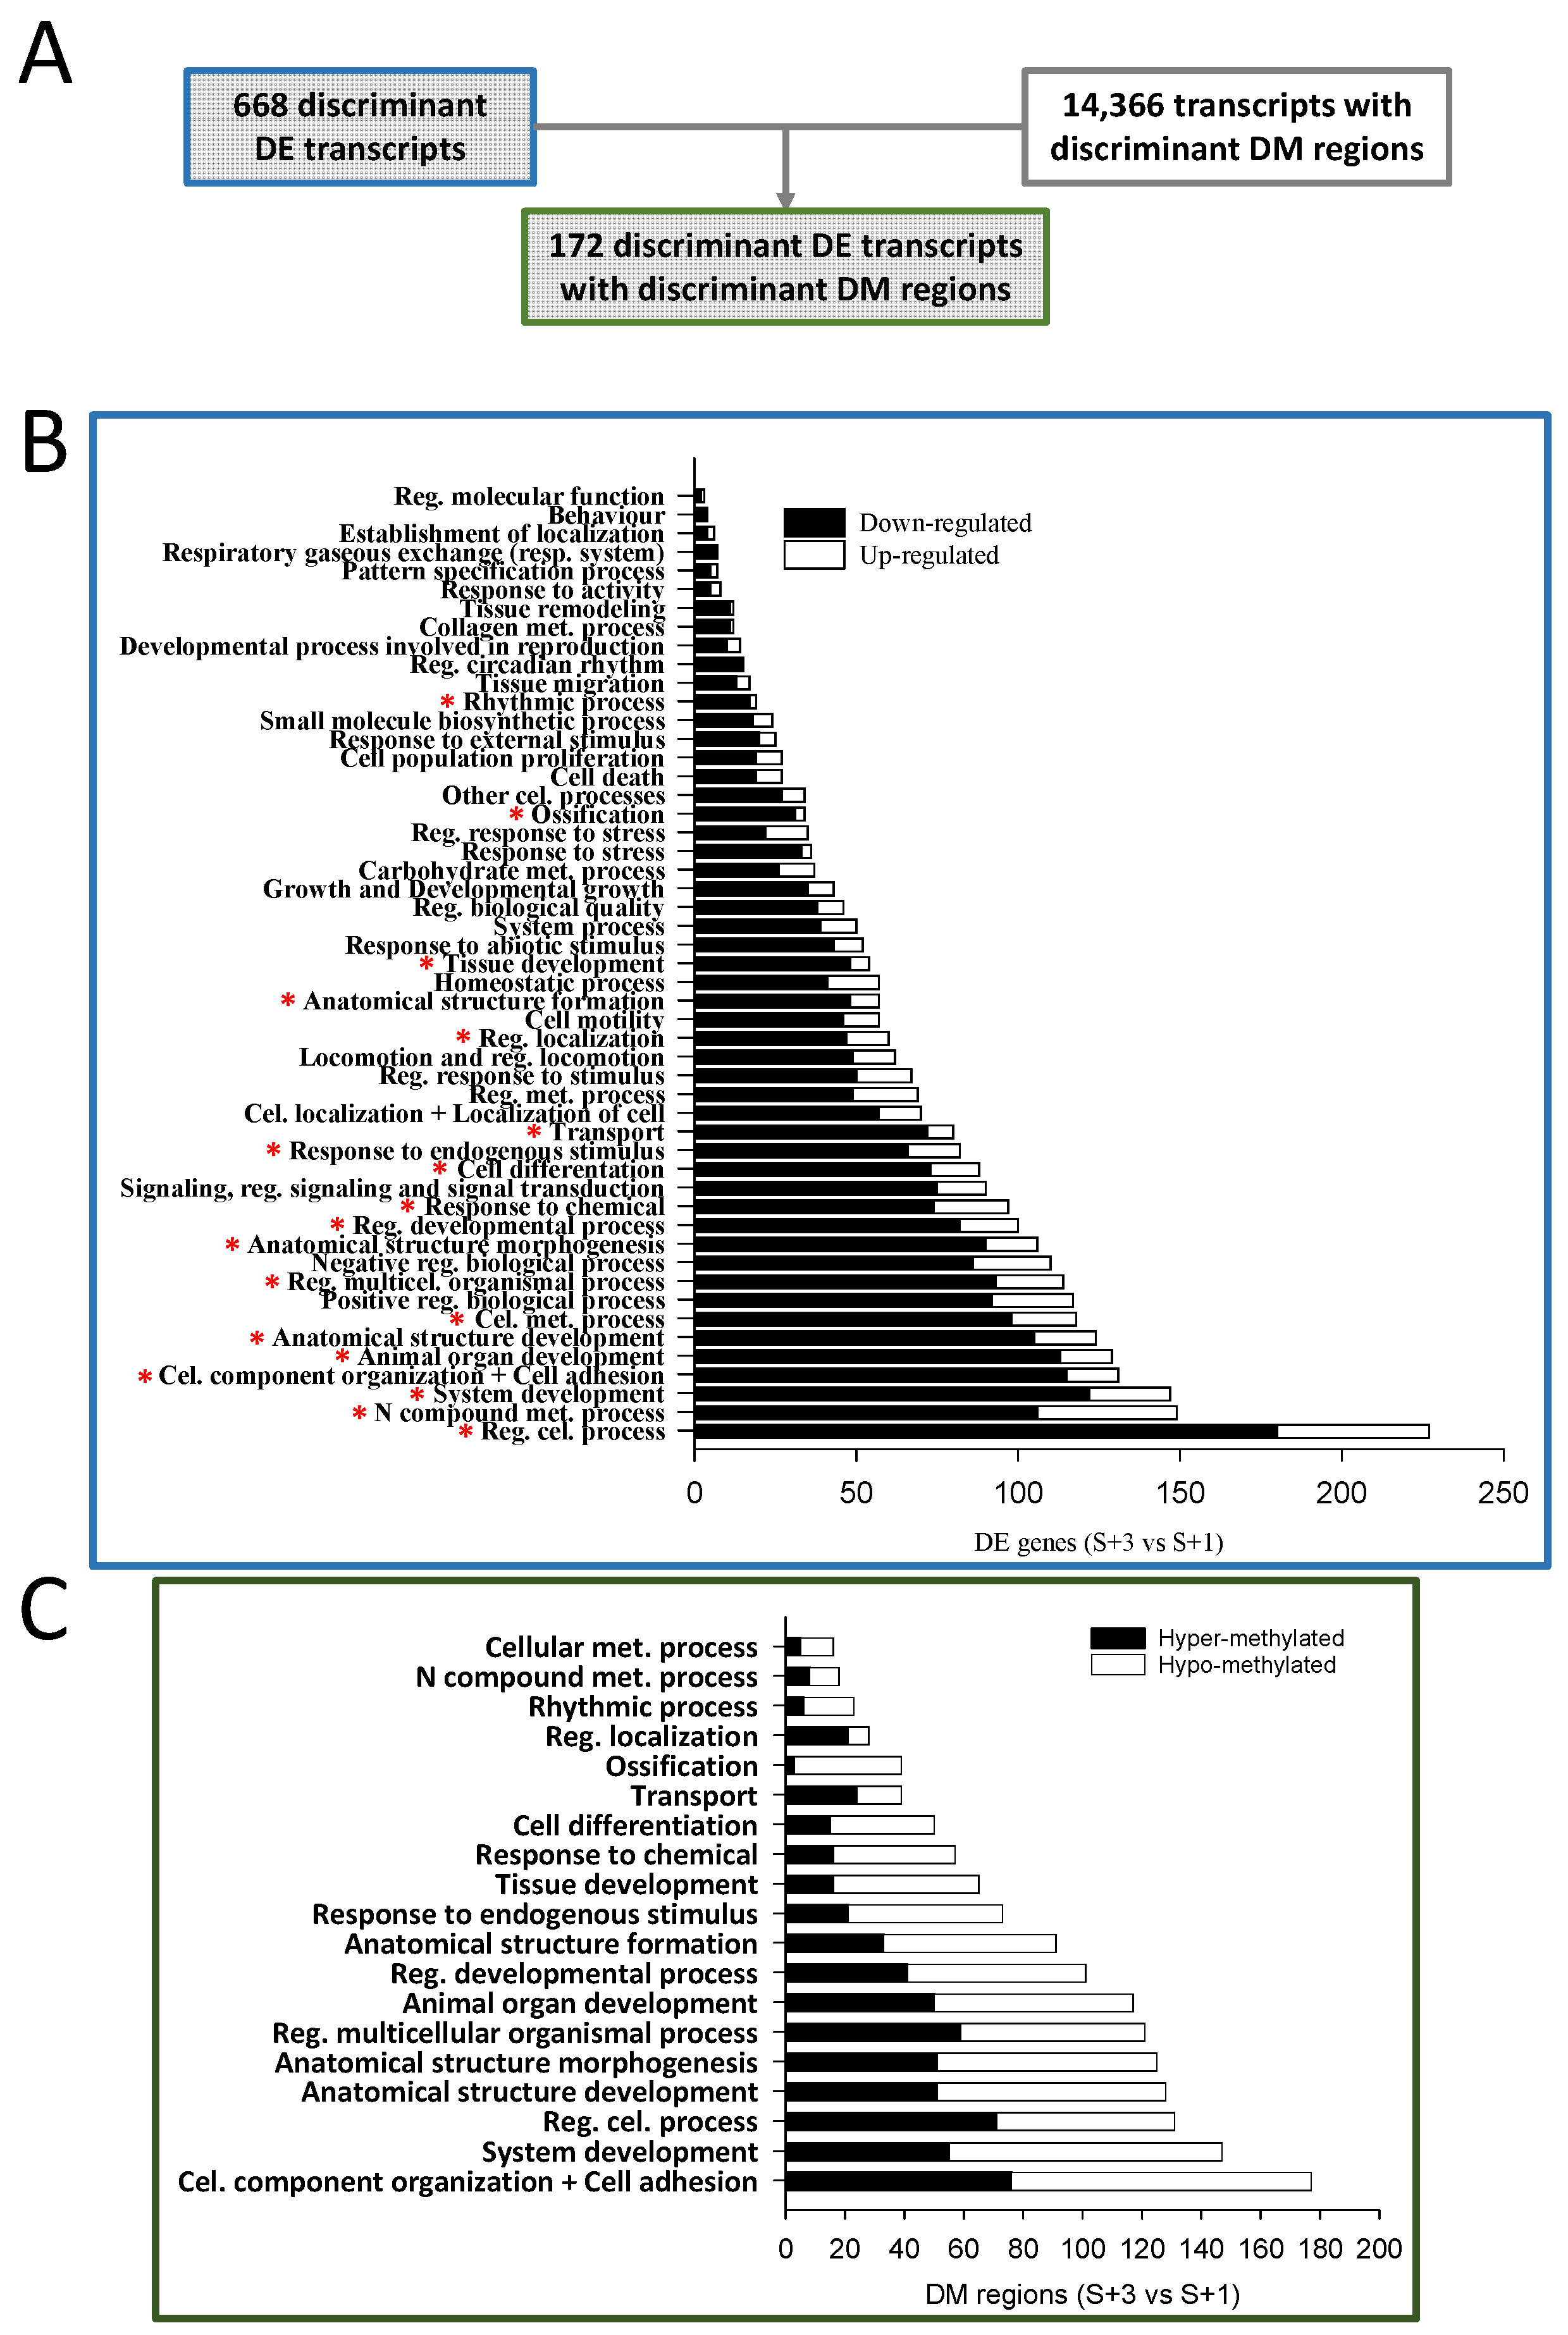
Figure 4.
Correlation analysis between differentially methylation and differential expression (both as log2 fold change in rpkm values between S+3 and S+1 fish) of the overlapping transcripts showing an opposite effect of DNA methylation and expression (A) and of the down-regulated overlapping transcripts associated to hypo-methylated CpGs (B). (C) Bar plot representing the numbers of selected genes showing an opposite trend for DNA methylation and expression (hyper-methylated + down-regulated and hypo-methylated + up-regulated).
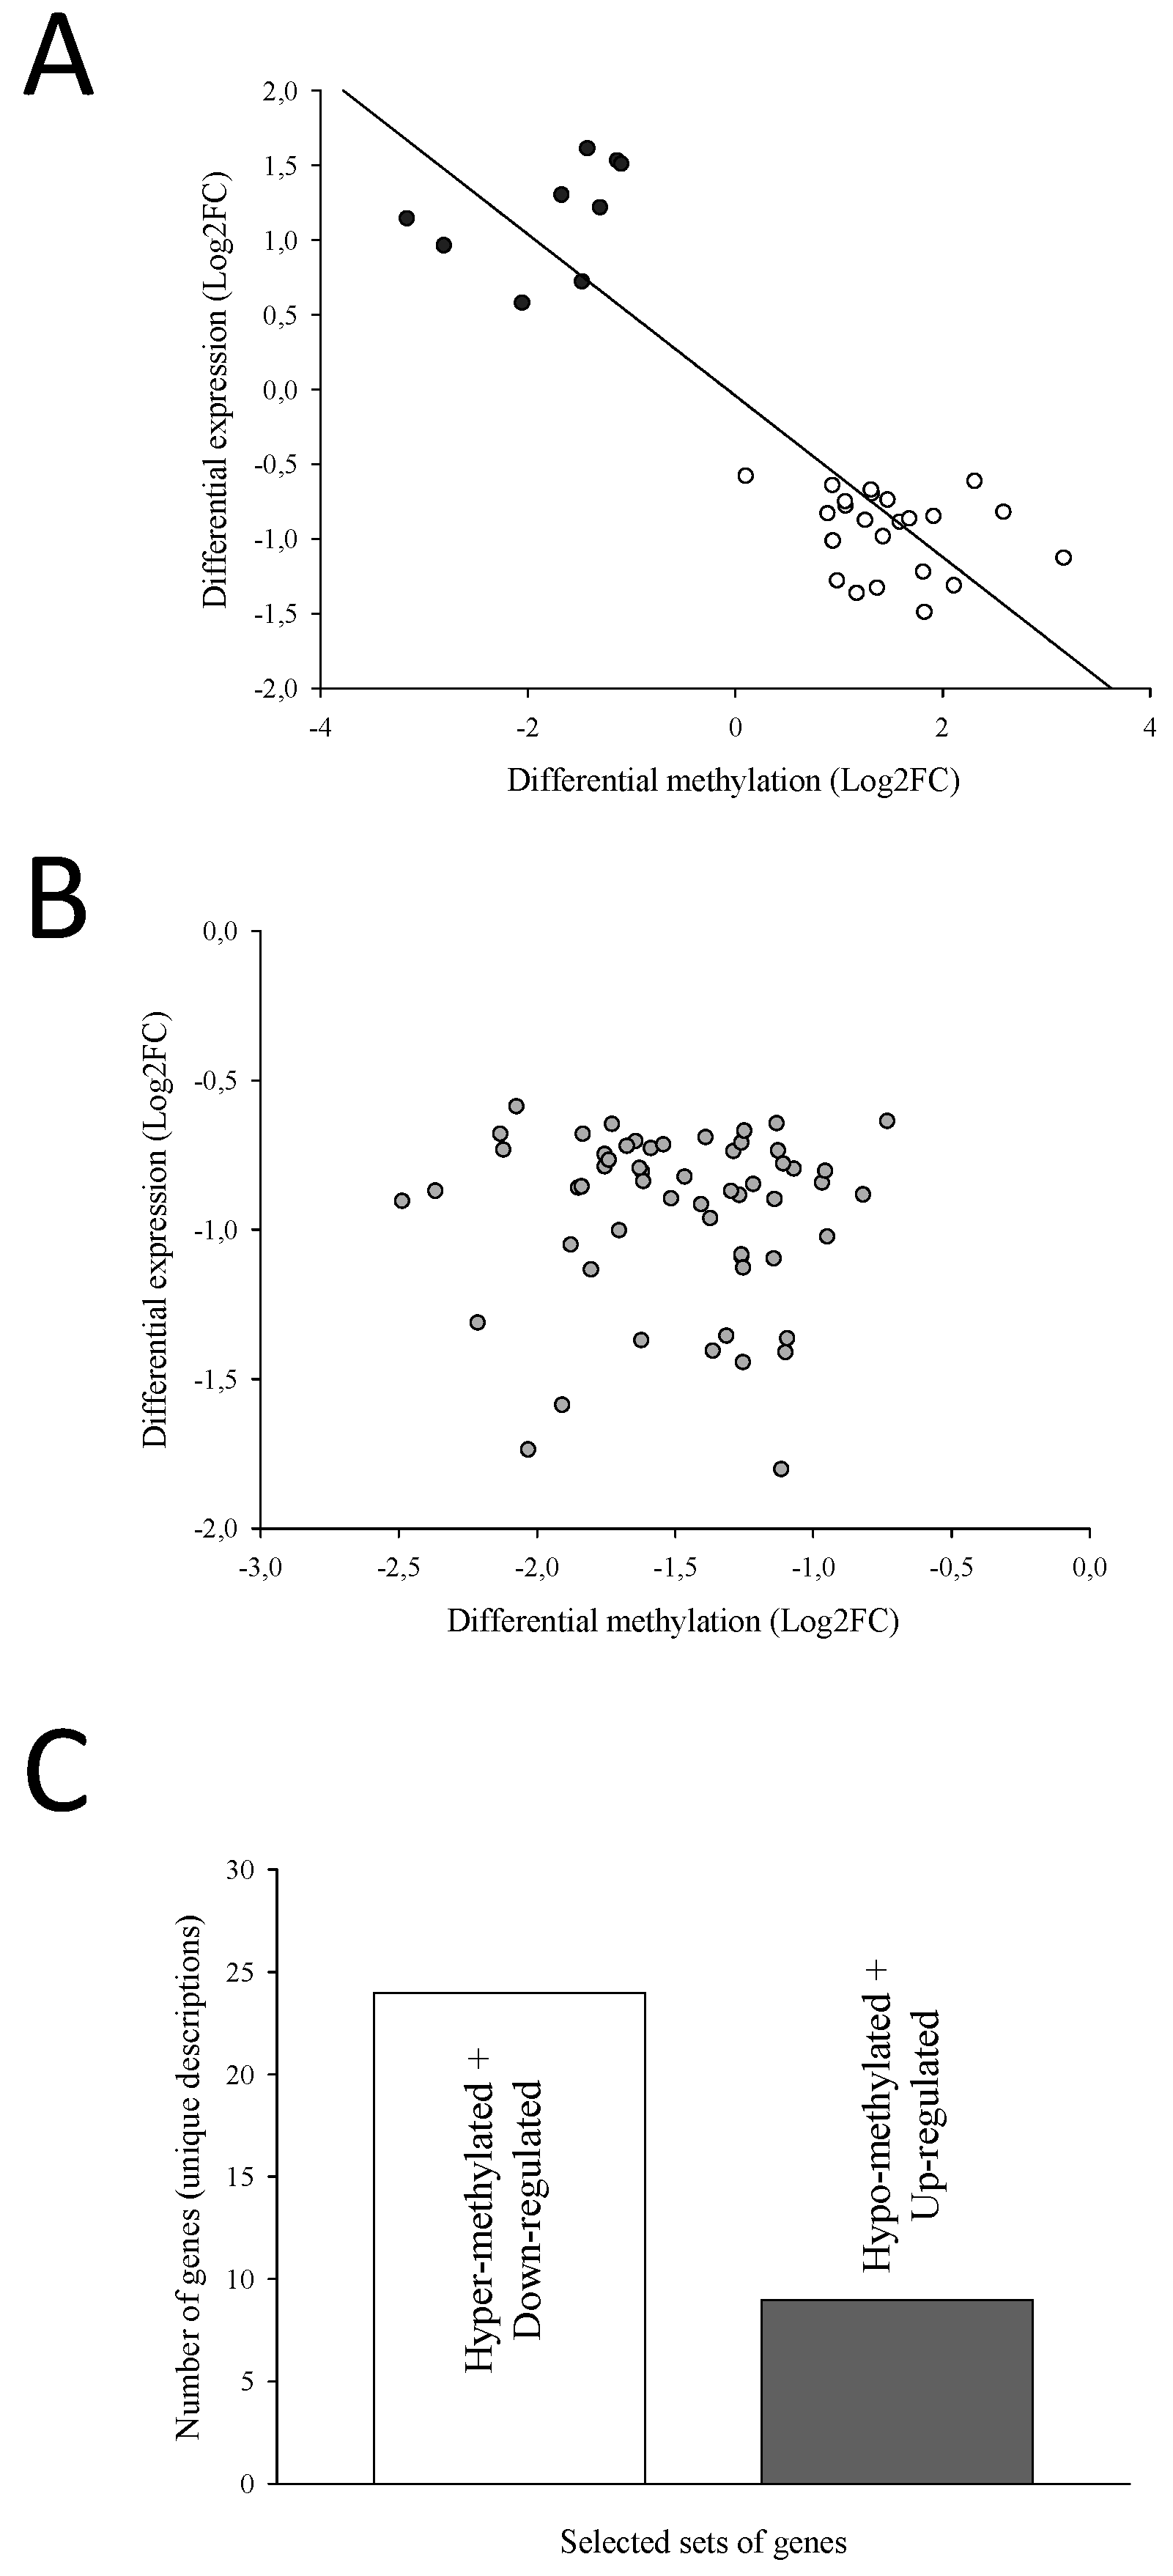
Figure 5.
Chart representing the filters and criteria applied for matching wide-transcriptomics (RNA-seq) and wide-genomic DNA methylation (MBD-seq) approaches in order to record candidate markers of biological age in gilthead sea bream.
Figure 5.
Chart representing the filters and criteria applied for matching wide-transcriptomics (RNA-seq) and wide-genomic DNA methylation (MBD-seq) approaches in order to record candidate markers of biological age in gilthead sea bream.
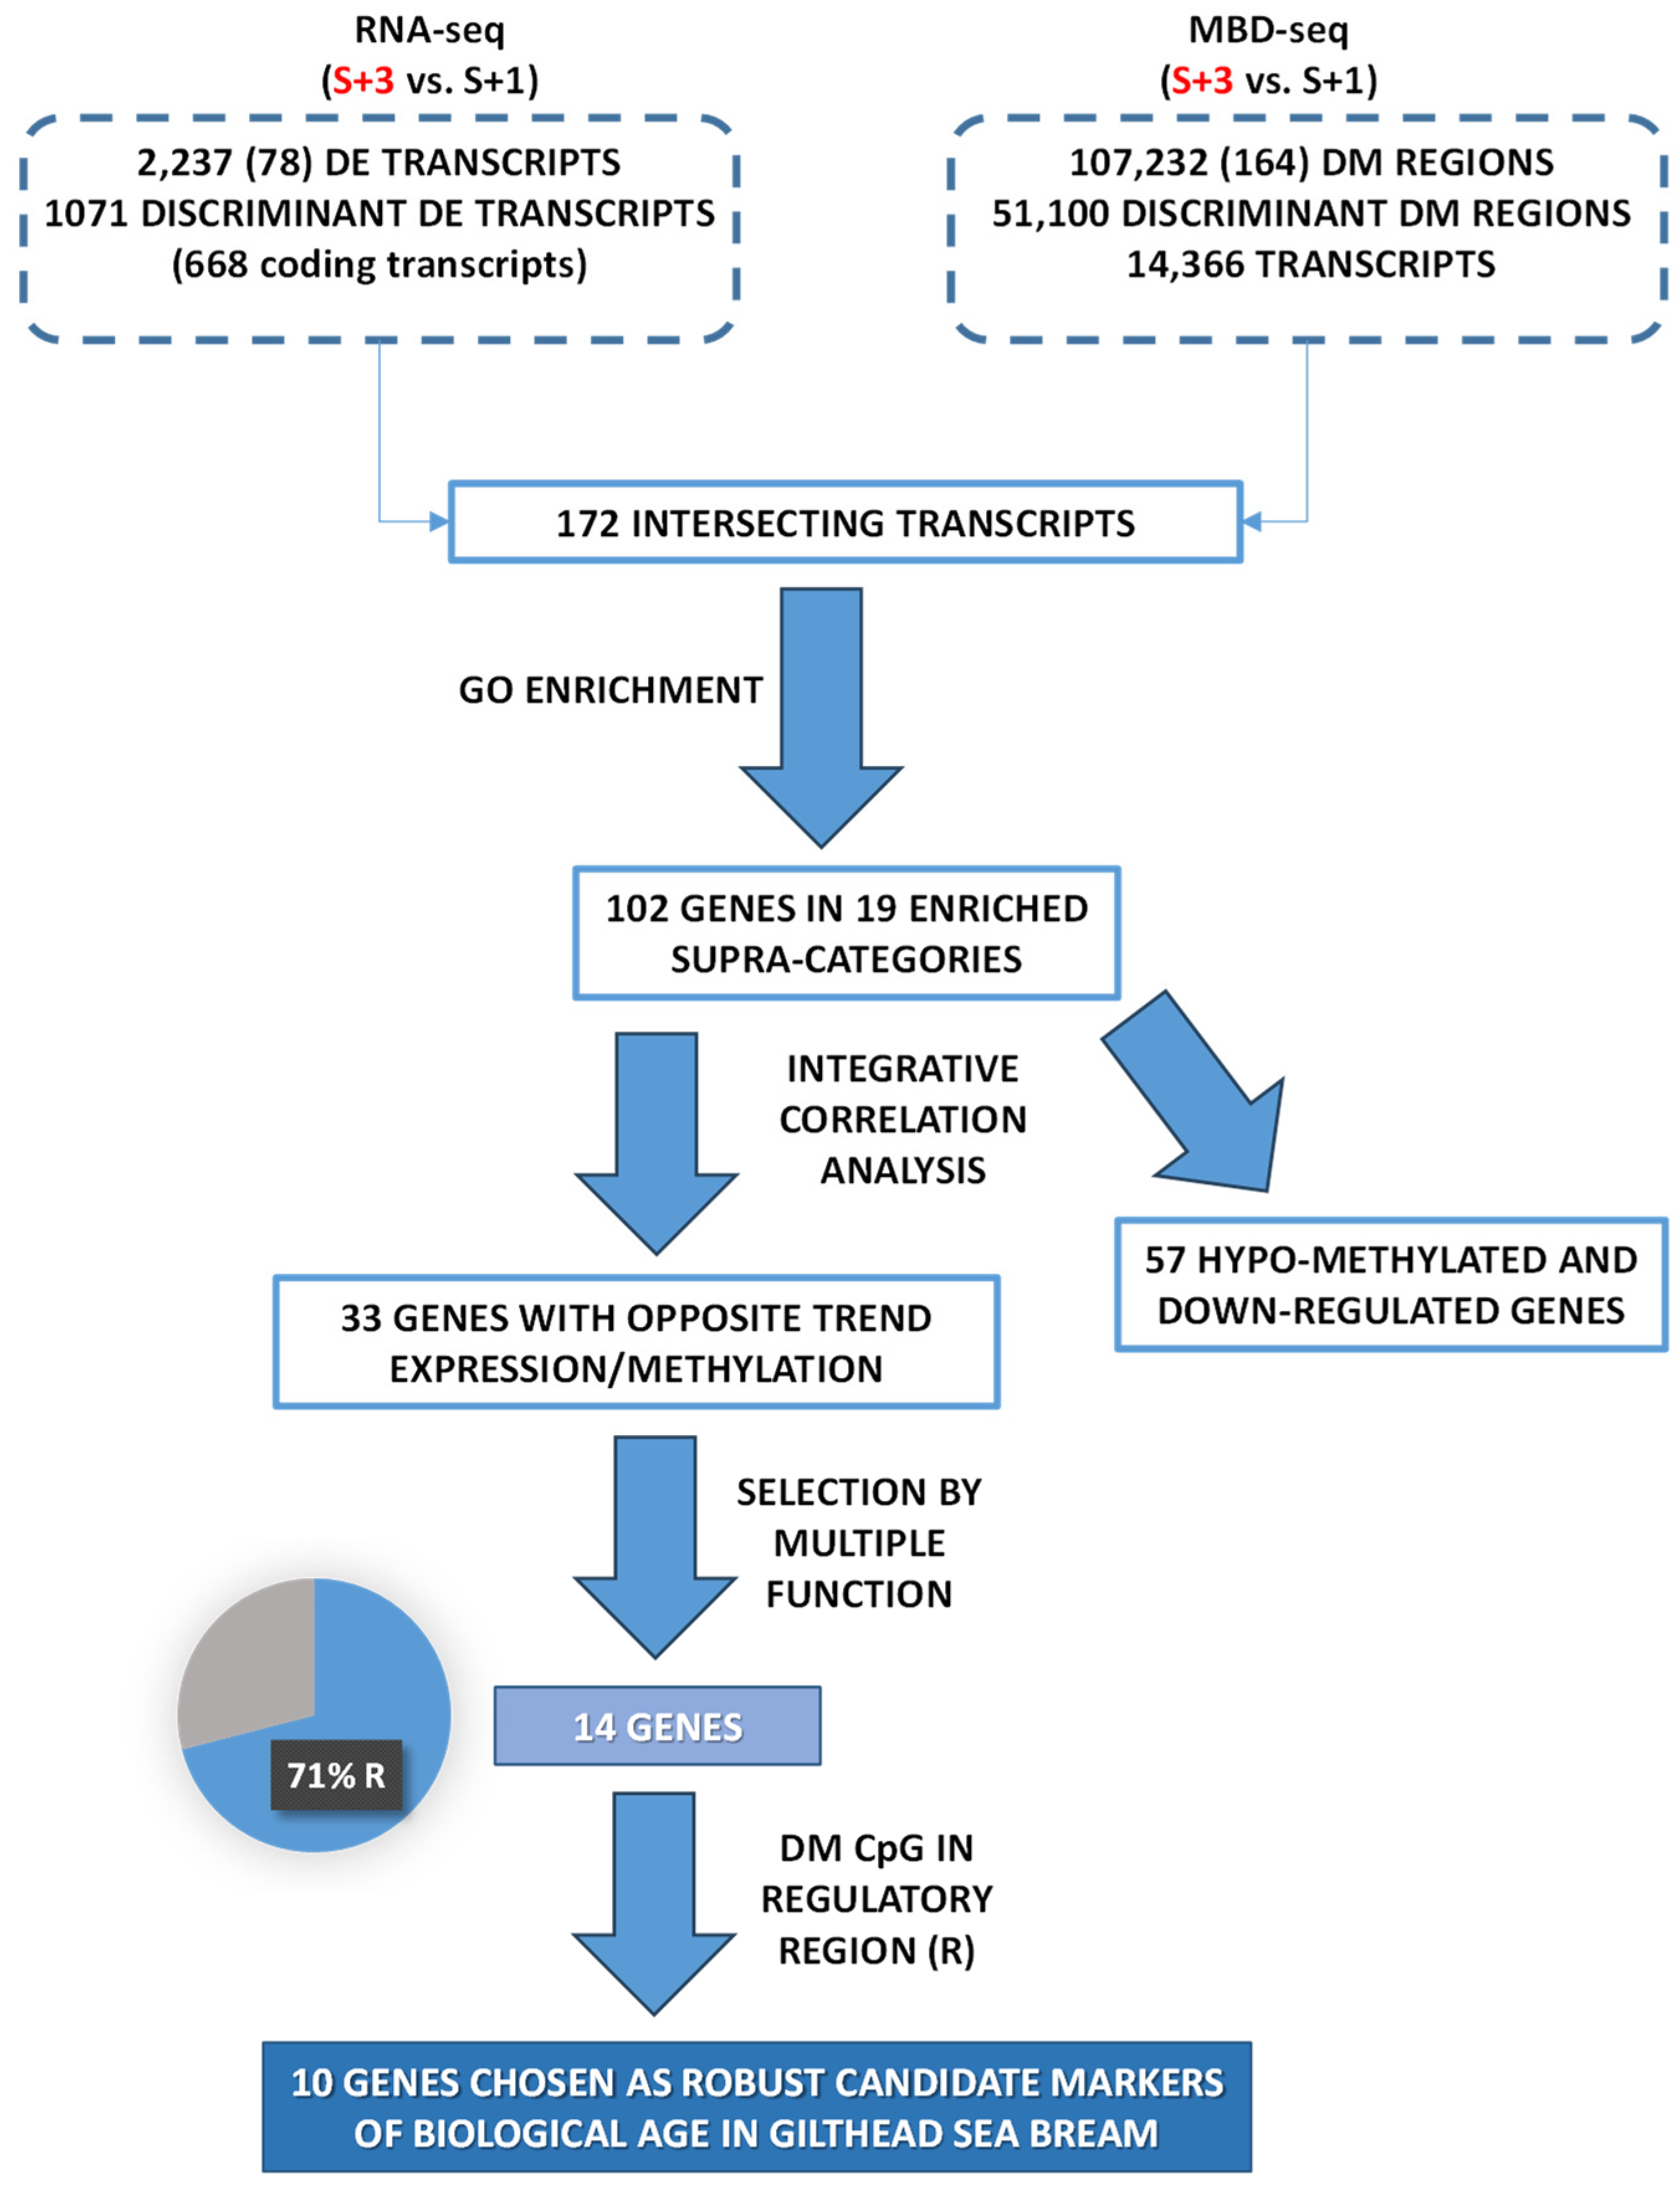
Figure 6.
Flow chart representing the multiomic layer integration and the different bionformatic analysis and filters applied after wide-transcriptomics (RNA-seq) and wide-genomic DNA methylation (MBD-seq) approaches in order to obtain a list of candidate markers of biological age in gilthead sea bream.
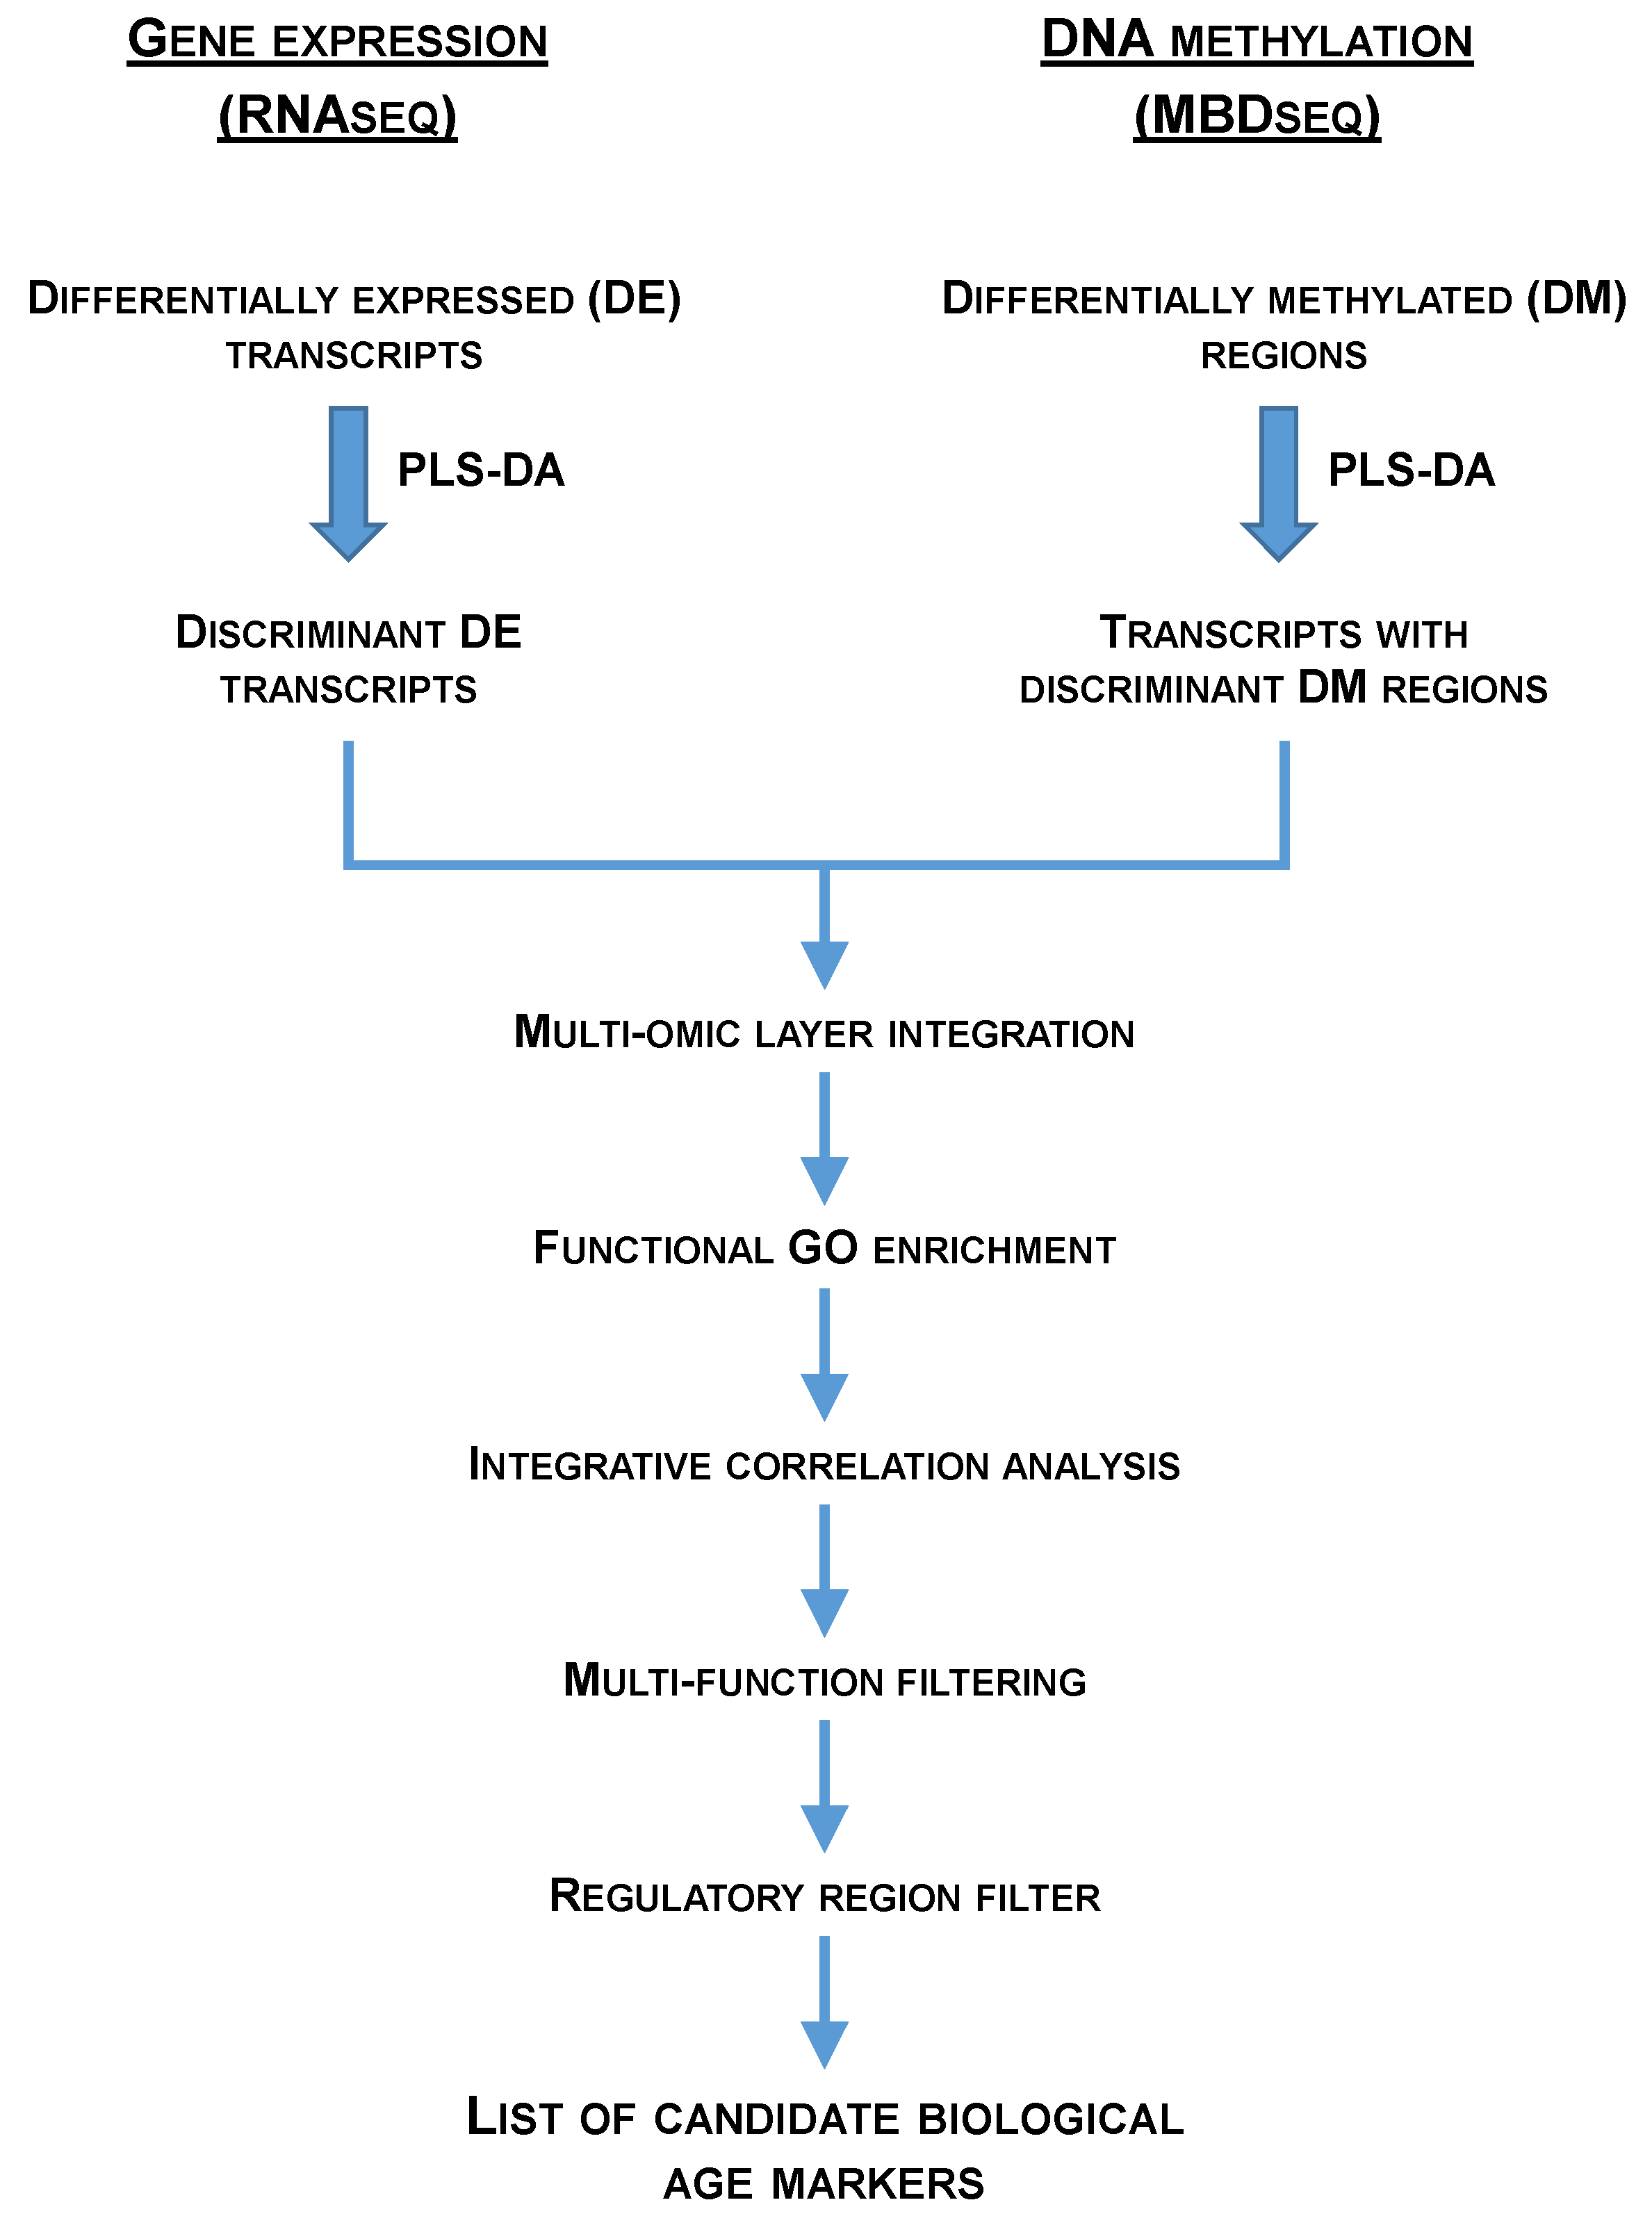

Table 1.
Functional processes (GO-BP ancestors) associated to the selected genes with opposite effect of DNA methylation and expression (33), ordered by the number of selected linked genes (n). The name of these genes and the corresponding age-related changes in DNA methylation and expression are also presented (genes in green, hyper-methylated and down-regulated; gene in red, hypo-methylated and up-regulated). Met., metabolic; Cel., cellular; Reg., regulation; Multicel., multicellular.
| Functional process | n | Genes |
|---|---|---|
| System development | 17 | abi3bp, arhgap24, bmp1, calcrl, col5a1, kcp, mical2, myo18b, nrp2, spred2, thrb, wfikkn2, parp3, psmd2, ramp1, sirt1, smad1 |
| Anatomical structure development | 12 | arhgap24, calcrl, col5a1, kidins220, mical2, myo18b, nrp2, thrb, phf6, ramp1, sirt1, smad1 |
| Anatomical structure morphogenesis | 12 | arhgap24, bmp1, calcrl, col5a1, mical2, myo18b, nrp2, thrb, psmd2, ramp1, sirt1, smad1 |
| Reg. multicel. organismal process | 11 | abi3bp, atp1a2, bmp1, calcrl, sema6d, spred2, zbtb20, parp3, scn3b, sirt1, smad1 |
| Cel. component organization | 10 | abi3bp, bmp1, col5a1, col6a3, colgalt1, kirrel1, mical2, nrp2, olfml2a, myoz2 |
| Response to endogenous stimulus | 10 | atp1a2, kcp, kidins220, nrp2, spred2, thrb, wfikkn2, ramp1, sirt1, smad1 |
| Animal organ development | 9 | abi3bp, bmp1, calcrl, col5a1, mical2, nrp2, spred2, thrb, smad1 |
| Reg. cel. process | 9 | abi3bp, calcrl, col5a1, colgalt, ksr1, nrp2, ramp1, sirt1, smad1 |
| Anatomical structure formation | 8 | arhgap24, calcrl, col5a1, nrp2, myoz2, ramp1, sirt1, smad1 |
| Reg. developmental process | 8 | abi3bp, bmp1, col5a1, sema6d, spred2, psmd2, sirt1, smad1 |
| Reg. localization | 4 | atp1a2, fgf14, hecw2, scn3b |
| Tissue development | 4 | bmp1, col5a1, sirt1, smad1 |
| Transport | 4 | atp1a2, fgf14, hecw2, scn3b |
| Response to chemical | 3 | calcrl, zbtb20, sirt1 |
| N compound met. process | 2 | psmd2, srm |
| Ossification | 2 | bmp1, smad1 |
| Rhythmic process | 2 | tef, sirt1 |
| Cell differentiation | 1 | col5a1 |
Table 2.
Selected genes with opposite effect of DNA methylation and expression (33) ordered by the number of functional processes (GO-BP ancestors; n) they are involved (genes in green, hyper-methylated and down-regulated; gene in red, hypo-methylated and up-regulated; genes in bold, containing methylated CpG in a regulating area). The names of the corresponding functional processes are also presented. Met., metabolic; Cel., cellular; Reg., regulation; Multicel., multicellular.
| Genes | n | Functional processes |
|---|---|---|
| sirt1 | 11 | Anatomical structure development, Anatomical structure formation, Anatomical structure morphogenesis, Reg. cel. process, Reg. developmental process, Reg. multicel. organismal process, Response to chemical, Response to endogenous stimulus, Rhythmic process, System development, Tissue development |
| smad1 | 11 | Anatomical structure development, Anatomical structure formation, Anatomical structure morphogenesis, Animal organ development, Ossification, Reg. cel. process, Reg. developmental process, Reg. multicel. organismal process, Response to endogenous stimulus, System development, Tissue development |
| col5a1 | 10 | Anatomical structure development, Anatomical structure formation, Anatomical structure morphogenesis, Animal organ development, Cell differentiation, Cel. component organization, Reg. cel. process, Reg. developmental process, System development, Tissue development |
| calcrl | 8 | Anatomical structure development, Anatomical structure formation, Anatomical structure morphogenesis, Animal organ development, Reg. cel. process, Reg. multicel. organismal process, Response to chemical, System development |
| nrp2 | 8 | Anatomical structure development, Anatomical structure formation, Anatomical structure morphogenesis, Animal organ development, Cel. component organization, Reg. cel. process, Response to endogenous stimulus, System development |
| bmp1 | 8 | Anatomical structure morphogenesis, Animal organ development, Cel. Component organization, Ossification, Reg. developmental process, Reg. multicel. Organismal process, System development, Tissue development |
| ramp1 | 6 | Anatomical structure development, Anatomical structure formation, Anatomical structure morphogenesis, Reg. cel. process, Response to endogenous stimulus, System development |
| abi3bp | 6 | Animal organ development, Cel. component organization, Reg. cel. process, Reg. developmental process, Reg. multicel. organismal process, System development |
| mical2 | 5 | Anatomical structure development, Anatomical structure morphogenesis, Animal organ development, Cel. component organization, System development |
| Thrb | 5 | Anatomical structure development, Anatomical structure morphogenesis, Animal organ development, Response to endogenous stimulus, System development |
| spred2 | 5 | Animal organ development, Reg. developmental process, Reg. multicel. organismal process, Response to endogenous stimulus, System development |
| arhgap24 | 4 | Anatomical structure development, Anatomical structure formation, Anatomical structure morphogenesis, System development |
| psmd2 | 4 | Anatomical structure morphogenesis, N compound met. process, Reg. developmental process, System development |
| atp1a2 | 4 | Reg. localization, Reg. multicel. organismal process, Response to endogenous stimulus, Transport |
Disclaimer/Publisher’s Note: The statements, opinions and data contained in all publications are solely those of the individual author(s) and contributor(s) and not of MDPI and/or the editor(s). MDPI and/or the editor(s) disclaim responsibility for any injury to people or property resulting from any ideas, methods, instructions or products referred to in the content. |
© 2024 by the authors. Licensee MDPI, Basel, Switzerland. This article is an open access article distributed under the terms and conditions of the Creative Commons Attribution (CC BY) license (https://creativecommons.org/licenses/by/4.0/).
Copyright: This open access article is published under a Creative Commons CC BY 4.0 license, which permit the free download, distribution, and reuse, provided that the author and preprint are cited in any reuse.


