

Submitted:
12 June 2024
Posted:
14 June 2024
You are already at the latest version
Abstract
In recent years, using pre-sprouted seedlings for sugarcane establishment has been developed in Brazil. Despite yielding promising results, the optimal irrigation management for this method during the Brazilian winter planting season has yet to be determined. Additionally, information regarding water demand and seedling behavior when subjected to different irrigation levels remains unclear. This study aimed to assess the response of pre-sprouted sugarcane seedlings to different irrigation levels during the winter in southeastern Brazil. Pre-sprouted sugarcane seedlings were subjected to different irrigation levels during the winter season in the region of Piracicaba, using a sprinkler irrigation system. Periodic evaluations were conducted, such as seedlings mortality rate, root size, root dry mass, number of sugarcane tillers sprouted per meter, total number of tillers, plant height, leaf area index, shoot dry mass, and total leaf chlorophyll index. The findings of this investigation indicate that a 10 mm irrigation level facilitated optimal fixation depth and achieved a 97.8% survival rate. Moreover, a correlation between seedling mortality rate and irrigation management was observed, emphasizing the critical role of irrigation in establishing and developing seedlings. Based on these findings, a 10 mm irrigation may represent the optimal irrigation strategy for pre-sprouted sugarcane seedlings in this scenario.
Keywords:
irrigation management
; Saccharum officinarum
; winter season planting
; water balance.
1. Introduction
The sugarcane (Saccharum officinarum) production chain is among the most important in the Brazilian agribusiness scenario. The sugarcane sector has expanded in the local and global markets because of the attractiveness of the biofuels market. This has produced increased investments in the sugar-energy industry and the development of new technologies, with more significant income generation [1]. Consequently, the cultivation of sugarcane has expanded to many regions of Brazil. According to [2], the cultivated area in the 2019/2020 harvest was about 10 million hectares, with an estimated production of 642,7 million Mg, making Brazil the largest sugarcane producer worldwide. The state of São Paulo has the biggest participation, with approximately 50% of the national producing area and an estimated production of roughly 341 million Mg. Therefore, studies performed in the state of São Paulo are relevant for improvements in sugarcane production.
The sugar-energy sector has been facing problems in recent years because of sugarcane fields’ decrease in yield and longevity [2]. This is related to the mechanization of agricultural operations such as planting and the absence of varietal management. Additionally, very low precipitations during several months of the year in the central-western regions of São Paulo state, Brazil, contribute to the decrease in yield and longevity of sugarcane fields. Water deficiency periods affect the crop development in sprouting, tillering, stalks lengthening stages, and thus yield because such stages present a high-water demand for the sugarcane culture [3,4]. Therefore, it is necessary to use supplemental, complementary, or salvage irrigation in São Paulo state to ensure the sugarcane production cycle. The irrigation can be complemented with better cultivation conditions, such as the pre-sprouted sugarcane seedlings, which could increase planting uniformity ratoon sprouting, tillering, closure of lines, and better sanity of the sugarcane fields compared to mechanized planting [5,6,7].
The newly developed production system of pre-sprouted sugarcane seedlings is a technology with great potential. This new technology combines fast production of seedlings, linking high vigor and planting uniformity standards [8,9]. Another benefit is the reduction of the number of seedlings necessary for planting. The number of seedlings required for planting one hectare drops from 18-20 Mg in conventional (mechanized) planting to 2 Mg in pre-sprouted seedlings planting. That means the industry can process approximately 18 Mg of sugarcane for planting one hectare, generating direct gains to the production chain [5,10].
Few publications describe developing and establishing pre-sprouted seedlings submitted to different irrigation levels or under maximum water deficit. Thus, the hypothesis that irrigation provides a better fixation index and vigor for establishing and developing pre-sprouted sugarcane seedlings in areas of low winter precipitation is proposed. Therefore, the current research aims to evaluate establishing and developing pre-sprouted sugarcane seedlings in winter planting under different irrigation levels. Thus, the ideal irrigation level necessary to ensure the best fixation index and high vigor on establishing and developing pre-sprouted sugarcane seedlings could be determined for the sugarcane-producing region of Sao Paulo state, Brazil.
2. Materials and Methods
2.1. Experimental Site Description
The work was conducted at the Santana farm, 22° 36’ 40” South and 47° 37’ 28” West, and 583 m.a.s.l, in Piracicaba – Sao Paulo, Brazil. The experiment was conducted for 206 days, from June 18th, 2014, to January 9th, 2015. The climate is Cwa according to the Köppen system, a Monsoon-influenced humid subtropical climate with a dry winter. The average temperature in the coldest month is 18ºC, and in the hottest month is 22ºC; the average annual temperature is 21.4ºC with an average yearly rainfall of 1257 mm.
2.2. Experimental Setup
The experimental design was randomized complete blocks with five treatments and three repetitions. The experimental area was 3806.4 m2, divided into 15 experimental plots. Each plot had a total area of 192 m2 (20.0 m length and 9.6 m width), containing eight planting lines in the spacing of 1.5 x 0.9 m, with the two upper lines and the two bottom lines considered plot borders [11]. The treatments are displayed in Table 1. The total irrigation level (h) and the fixed irrigation frequency (IF) after planting were based on irrigation management through the weather.
Afterward, the treatments were analyzed according to water balance, evapotranspiration, and water deficit and excess. The eventual precipitations during the data analysis period (206 Days after planting) were considered in each treatment’s water balance.
The number and frequency of irrigations adopted in each treatment were chosen to ensure the necessary salvage irrigation for the winter planting of the pre-sprouted seedlings. The aim was to reach the lowest mortality rate and planting failures, with a consequent increase in productivity and longevity. These adopted treatments represented the best irrigation level necessary to ensure better fixation/establishment and high vigor for the pre-sprouted sugarcane seedlings.
Regarding the disposition of the treatments, a spacing of 7.20 m of borders between blocks and 5.0 m between plots was considered to ensure minimum interference due to water drift caused by wind. Such spacings were enough to avoid most of the drift effect.
2.3. Experiment Management
On June 16th, 2014, the operations for soil preparation were performed, except for the liming, which was performed around 60 days before the planting with 1.5 Mg ha-1 of dolomitic limestone. On June 17th, 2014, the planting lines were grooved, and 500 kg ha-1 of 9–25–25 NPK fertilizer formulation was applied [12].
After the grooving, the grooves were mechanically covered by a layer of soil of approximately 0.1 m, along with the application of the agricultural defensives Furadan 350 SC (6.5 L ha-1), Regent 800 WG (250 g ha-1) and Comet (250 mL ha-1).
The pre-sprouted sugarcane seedlings used were from the variety CTC 20, which is recommended for winter planting in medium—to high-fertility soils.
The pre-sprouted seedlings were planted on June 18th, 2014, with 0.5 m spacing between them. The seedlings were planted evenly in the covered grooves by a manual process. The planting system adopted was in double rows, with 1.5 m between double rows and 0.9 m between lines.
A conventional sprinkler irrigation system with moving lines was used for the treatments, with a flow rate of 675 L h-1 and an application rate of 12.5 mm h-1 at a working pressure of 4,2 kg cm-2. The distribution uniformity was 86.83%, and the Christiansen uniformity coefficient was 90.38%, all considered to be excellent uniformity values. These values were obtained through simulations and estimates using the WinSSIP2 software (SENNINGER, USA). The irrigation levels and duration used for each treatment are shown in Table 1.
2.4. Water Balance Computation
An automatic weather station near the experimental area collected meteorological data for the experimental period. Daily reference evapotranspiration (ETo) values were obtained by the Penman-Monteith method (Equation (1)).
where ETo is the reference evapotranspiration (mm day-1); ∆ is the slope of the saturation vapor pressure function (kPa °C-1); Rn is the net radiation (MJ m-2 day-1); G is the soil heat flux density (MJ m-2 day-1), which was considered as null for daily estimates; γ is the psychrometric constant (kPa °C-1); T is the daily average temperature (°C); U2 is the wind speed at 2 m height (m s-1); es is the vapor pressure of the air at saturation (kPa), and ea is the actual vapor pressure (kPa).
The daily water balance was calculated using the software Bhseq.xls, developed on EXCELTM [13], which presents a spreadsheet for calculating the daily sequential water balance. The methodology was applied to all the treatments; therefore, each treatment’s water balance behavior could be verified.
The soil of the experimental area was classified as Dystrophic Red-Yellow Oxide of Clay Texture [14]. Before planting, soil samples were collected at 0-25 and 25-50 cm layers to determine their chemical (Table 2) and hydraulic (Table 3) properties. These soil analyses allowed better irrigation management and fertilizer dosage calculation.
The software [15] (Table 4) was used to obtain the van Genuchten model parameters [16,17] (Equation (2)), which describe the water retention curves for the layers 0 - 25 cm and 25 - 50 cm. From this data, it was possible to obtain the soil field capacity (⅓ atm), the permanent wilting point (15 atm), and the available water capacity (CAD) (Equation (3)) (Table 2).
where θ is the volumetric water content for a given tension, θr and θs are the residual and saturated soil water contents (L3 L−3), respectively, φm is the tension (L), α (L−1), n and m (–) are dimensionless shape parameters of the soil water retention curve, with m = 1–1/n.
where CAD is the available water capacity (mm), θcc is the water content at field capacity (cm3 cm-3), θPMP is the water content at the wilting point (cm3 cm-3) and ΔZ is the soil depth (mm).
After the soil preparation, an infiltration velocity (IV) test was performed following the double-ring infiltrometer methodology [18]. The IV obtained for the soil in the experimental area reached 12.6 cm h-1 when tending to be constant. According to [18], such a value classifies the soil with a high IV.
2.5. Parameters evaluated
- Accumulated seedling mortality (SM): For the survival analysis and the seedling fixation index, all the living and dead pre-sprouted seedlings were considered the total planted for each treatment and replication. The mortality follow-up was performed at 7,15, 34, 51, 76, 114, and 156 days after planting (DAP) when the mortality stabilization occurred.
- Root length (RL): The maximum size of the roots of the pre-sprouted seedlings was measured using metric tape at the end of the experimental period.
- Root dry mass (RDM): For this measurement, the initial substrate and root volume inside the tube perimeter were not considered, and the roots that exceeded this perimeter were cut out and separated for evaluation. After the separation, the roots were washed on top of a 1 mm sieve, and the material was taken to an oven with a forced hot air circulation system at 65 ºC until constant weight was achieved. Then, the dry mass was measured in analytical balance (precision: 0.01 g). The data was collected from a 30 x 30 x 30 cm ditch with three samples of pre-sprouted seedlings or one clump per plot, representing one replication each. The soil volume sampled was sieved with a 2 mm sieve for soil-root separation.
- Number of tillers sprouted per meter (TPM): At 15, 34, 51, 76, 114, and 156 DAP, the tillering was evaluated in all treatments. The number of tillers in 10 random pre-sprouted seedlings (clumps) was measured for each replication and divided by the planting spacing (0,5 m between seedlings). Every sprout from the seedlings that emerged through the soil surface was considered a tiller. The number of stalks per linear meter was obtained from the sum of all stalks found in the planting line of each replication divided by the length of the line (16 m).
- Total number of tillers (TNT): The tillering of all pre-sprouted seedlings was evaluated in all treatments by simply summing up the tillers. Every sprout from the seedlings was considered a tiller, whether it emerged or not through the soil surface.
- Plant height (ALT): At 15, 34, 51, 76, 114, and 156 DAP, the maximum height of the primary stalk of the sugarcane pre-sprouted seedlings was measured using a metric tape (from the soil surface to the end of the highest leaf).
- Leaf area index (LAI): The leaf area index was measured at 34, 51, 76, 114, and 156 DAP, considering the number of tillers per square meter times the leaf area of the primary tiller, as an adaptation of the equation proposed by [19], which did not consider the green leaves relatively open in the maize whorl. All leaves with green pigmentation above 20% and participation in active photosynthesis were considered. Thus, the Equation (4) was used:where LAI is the leaf area of the primary stalk of the seedlings (cm2), C is the leaf length +2 (cm), L is the greatest leaf width +2 (cm), 0.75 is the leaf shape coefficient (dimensionless) and N is the total number of leaves with green pigmentation above 20%.
- Shoot dry mass (SDM): At the end of the experimental period, the shoot dry mass (leaves and tillers) was analyzed. The leaves and tillers were separated from the roots and dried in the oven with a forced hot air circulation system at 65 ºC until constant weight was achieved. Then, the dry mass was measured in an analytical balance (precision: 0.01 g). The data was collected from three pre-sprouted seedlings or clump samples per plot, representing one replication each.
2.6. Data Analysis Strategy
The results obtained by evaluating the establishment and development of the pre-sprouted sugarcane seedlings in winter planting were analyzed using the statistical software Sisvar Version 5.3. Initially, a test of data uniformity was performed, and then the data was submitted for analysis of variance. When the results were significant, the means were compared by the Tukey test at a significance level of 5%.
3. Results
Figure 1 presents the observed values for temperature (ºC), humidity (%), solar radiation (MJ m-2 day-1), and reference evapotranspiration (mm day-1) at the study site.
In Figure 2 the water balance results are shown. The water balance of the control treatment (T0) was defined as a period from 0 to 69 DAP (Figure 2) because, after this date, the data suggests uniformity of the water deficit between the treatments. Therefore, after 69 DAP, the different irrigation managements applied to the treatments did not influence the soil-water-climate interaction. The rainfall observed between 0 and 30 DAP was important and directly influenced the decreasing mortality rate behavior of the sugarcane pre-sprouted seedlings.
The water balance in T1 (Figure 2B) presented a behavior like T0 (Figure 2A); however, in T1, the days without water deficit occurred during the three irrigations of 10 mm at 1, 6, and 13 DAP. These irrigations were insufficient to guarantee excess water (Figure 2B). For the water balance in T2, the three irrigations of 20 mm at 1, 6, and 13 DAP were sufficient to reduce the water deficit in the analyzed period and to guarantee water excess at 6 and 13 DAP (Figure 2C). For the water balance in T3, the three irrigations of 30 mm at 1, 6, and 13 DAP were sufficient to guarantee a certain number of days without water deficit and to guarantee water excess at 1, 6, and 13 DAP (Figure 2D). For T4, the water balance behavior was like that of T3 (Figure 2E).
The sugarcane pre-sprouted seedlings’ mortality rate (SM) was evaluated during the establishment and development cycle (Figure 3). After 114 DAP there was no change in the number of dead plants for all treatments. The total mortality at 156 DAP was 37.9% (T0: without irrigation), 2.1% (T1: 30 mm of irrigation), 1.9% (T2: 60 mm of irrigation), 0.3% (T3: 90 mm of irrigation) and 0.8% (T4: 120 mm of irrigation).
The rainfall (mm) up to 76 DAP was equivalent to an accumulated precipitation of 26.3 mm, and the strongest rainfall registered was 6.3 mm at 36 DAP. Thus, the rainfall occurred until the 76 DAP was enough to guarantee the survival of part of the pre-sprouted sugarcane seedlings planted for treatment T0 (control – no irrigation). The expectation for this treatment was the death of all planted seedlings in case of no rainfall interference during this mortality analysis period for the winter planting.
The treatment with the lowest mortality percentage was T3 (three irrigations of 30 mm), but all treatments using irrigation presented a low mortality percentage. For this parameter, considering the present days of water shortage, the sustainable irrigation level able to guarantee an excellent fixation index (greater than 97.8%) was T1 (three irrigations of 10 mm).
The root growth and development represented by the most extended length in centimeters achieved by the root (RL) and root dry mass in grams (RDM) are presented in Table 5 and Table 6, respectively. The means compared by the Tukey test at a significance level of 5% presented a significant difference during the evaluations for both parameters, except for the 156 DAP for RL, in which no significant differences were found between the treatments. The root growth of the pre-sprouted seedlings presented varying behaviors between irrigation and dryland treatments. On almost all the RL evaluation periods, the irrigated treatments (T1, T2, T3, T4) presented superior results compared to those without irrigation (T0). There was an exception at 156 DAP, with no significant differences between the treatments. This lower growth in the root size for the treatment with water deficit resulted in a lower area of root exploration and, therefore, reflected in a decrease in RDM, as observed in Table 6. In general, treatments with greater irrigation levels presented higher RDM means.
The number of tillers sprouted per meter (TPM) presented in Table 7 differed statistically (p<0.05) between treatments in all periods evaluated. The TPM of the seedlings presented variability between the treatments with irrigation. In the first analyses at 15, 34, 51, and 76 DAP, the tillering per meter in T1, T2, T3, and T4 benefited and did not show significant differences for the different irrigation levels.
For the total number of tillers (TNT), the means presented significant differences at 76 and 114 DAP (Table 8), and the irrigated treatments (T1, T2, T3, and T4) presented higher TNT than the dryland treatment (T0). At 114 DAP, the mean of T0 was up to 80% lower than the irrigated treatments, with the greatest difference to T2, which presented the highest TNT. At 156 DAP, it was possible to observe that T0 significantly increased TNT, which was statistically equal to the irrigated treatments.
For the analysis of plant height (ALT), there were significant differences in all evaluations (Table 9). In the first evaluation at 15 DAP, the treatments T3 and T4 stood out with the highest ALT values. However, in the subsequent evaluations, the treatments T1 and T2 became statistically equal to T3 and T4. The control treatment without irrigation (T0) presented lower means in all evaluations compared to the irrigated treatments.
For the leaf area index (LAI) presented in Table 10, it was observed that from the first evaluation at 34 DAP until 114 DAP, the treatment T2 stood out with higher means. However, it was still statistically equal to the other irrigated treatments. At 156 DAP, the treatment T2 presented a statistically higher mean than any other irrigated treatment. The irrigation deficit imposed on T0 resulted in lower values of LAI in all evaluation periods.
Significant differences were observed in all evaluation periods between the means of the shoot dry mass (SDM) (Table 11). The total shoot biomass of the clumps presented a very variable behavior among the irrigated treatments. In the analyses at 15 and 34 DAP, the SDM of the treatments T2, T3, and T4 benefited from the greater water availability, but this fast-paced initial growth was matched by T1 at 51 DAP. At 34 DAP, only the dryland treatment (T0) was negatively affected; at 114 DAP, treatment T3 presented a higher mean of SDM, and at 156 DAP, the treatments T2, T3, and T4 presented means of SDM statistically higher than T0 and T1.
For the leaf chlorophyll index (Table 12), significant differences (p>0.05) were observed at 34, 51, and 76 DAP. At 34 DAP, the treatment T2 presented the highest chlorophyll index value; at 51 and 76 DAP, the control treatment (T0) presented the lowest values compared to the irrigated treatments. At 114 DAP, all treatments presented similar behavior and did not differ statistically from each other due to the stabilization of the sugarcane field.
4. Discussion
Plants have countless adaptive characteristics to manage water shortage situations, including morphological, biochemical, and physiological changes [22]. Among the morphological characteristics, changes in root architecture are one of the most important. When submitted to conditions of low water availability in the soil, plants generally present the strategy of fostering root growth, allowing and promoting the exploration of a greater soil volume to reach for water in deeper layers of soil [23], as observed at 156 DAP for RL (Table 5 and Table 6), in which T0 did not significantly differ from the irrigated treatments (T1, T2, T3, and T4). Nonetheless, during the root lengthening, the plants exposed to water deficit prioritize growing in length to the detriment of diameter [24]; thus, in general, the RDM of treatments under water deficit tends to be lower, as observed in all experimental period for T0.
Regarding the total number of tillers (Table 8) it was observed that T2 stood out among all irrigated treatments, supporting the results found by [5], for whom in conditions of dryland in low rainfall seasons, the tillering of sugarcane pre-sprouted seedlings was lower when compared to irrigated treatments. [5] found, in an experiment with pre-sprouted sugarcane seedlings submitted to different irrigation levels, that the number of stalks produced was negatively influenced by the treatment with the most challenging exposure to water deficit, showing that slight water deficits do not interfere with the tillering of sugarcane. These results corroborate the one found in this study, in which only the treatment without irrigation significantly reduced the production of tillers, and all other irrigated treatments did not differ. The intense tillering stage in a clump occurs when the peak of the production of tillers is reached, which for some species can be above 25 stalks per clump. From the peak of tillering, the competition between tillers for the factors that affect plant growth (light, space, water, and nutrients) increases, leading to the decrease and stoppage of the tillering process, as well as to the death of the youngest tillers [25].
Table 11 shows significant changes between the means of the shoot dry mass (SDM). [26] observed that an increase in water availability in the soil speeds up the growth of sugarcane, promoting a greater increase in biomass compared to cultivation in a low water availability situation, which corroborates the observed in the present work. In situations with low water availability, the plants stop their growth as a morphological artifice and present a leaf area reduction by a restriction in cell elongation by turgor loss, accelerated leaves’ senescence, and reduction in the production of new leaves. The decrease in the leaf area index is a strategy plants use to reduce their water use by transpiration [24]. The decrease in the LAI implies a reduction in light interception by the plants, which, when associated with stomata regulation, is responsible for reducing the whole plant photosynthetic rate in plants submitted to water deficit. When sugarcane is subjected to a water deficit, morphological and physiological changes promote changes in its development, which negatively influence the growth and accumulation of biomass. Thus, the decrease in stalk height and leaf area can explain the lower accumulation of shoot biomass in sugarcane plants derived from pre-sprouted seedlings. Such behavior was also observed by [23,27,28] which reinforces the results obtained in this research.
Significant differences were observed for the leaf chlorophyll index (Table 12). The soil’s water deficit can lead to reduced leaf chlorophyll levels, which can be associated with oxidative damage to the chloroplasts and consequent destruction of the chlorophyll molecules [29]. Furthermore, the water deficit can negatively influence nitrogen metabolism by reducing the activity of the enzyme nitrate reductase and reducing carbon availability for nitrogen assimilation [30]. Nitrate reductase is an enzyme mainly responsible for nitrogen assimilation by plants. It is a nutrient of high importance for the development of plants, and it is the main component of the chlorophyll molecule [31,32]. Therefore, the leaf chlorophyll level is also used to predict the nutritional nitrogen (N) levels in plants because the chlorophyll content has a positive correlation with the N levels of the plants. This correlation is mainly linked to 50-70% of the total leaf N integrating the enzymes associated with the chloroplasts [33,34]. Additionally, the lower concentration of chlorophylls may be an acclimatization mechanism to the extent that it allows the leaves to absorb less solar energy and thus evade photoinhibition [35].
5. Conclusions
The irrigation management level of 10 mm during the implementation of the sugarcane field from pre-sprouted seedlings was sufficient to guarantee high survival rates of the seedlings. Although the treatment T2, with an irrigation level of 20 mm, stood out slightly at the final evaluation at 156 DAP, an irrigation level of 10 mm was found to be the most exciting irrigation level to be applied, aiming at guaranteeing the establishment of the crop and the reduction of failures in winter plantings. In the case another irrigation level is adopted for the same experimental conditions water losses can be produced for irrigation level higher than 10 mm. This outcome is not feasible nowadays concerning the rational water management scenario in agriculture.
The absence of irrigation during the implementation of the sugarcane field from pre-sprouted seedlings in the region of Piracicaba-Brazil promoted high mortality rates for the seedlings and substantial reductions in the growth of the plants, demonstrating that this propagation technology associated with the correct irrigation management guarantees higher survival rates and vigorous initial development of the seedlings, which can reflect on the final productivity of the sugarcane fields.
Author Contributions
Conceptualization, Pedro Elia and Jarbas Honorio de Miranda.; methodology, Pedro Elia and Jarbas Honorio de Miranda.; software, Pedro Elia and Jarbas Honorio de Miranda.; validation, Pedro Elia and Jarbas Honorio de Miranda.; formal analysis, Pedro Elia and Jarbas Honorio de Miranda.; investigation, Pedro Elia, Jarbas Honorio de Miranda, Sebastian Elgueta, Marco Garrido, Caterina Castro, Carlos Faúndez.; resources, Jarbas Honorio de Miranda.; data curation, Pedro Elia, Jarbas Honorio de Miranda, Carlos Faúndez and Marco Garrido.; writing—original draft preparation, Marco Garrido, Carlos Faúndez, Sebastian Elgueta, Caterina Castro, Pedro Elia and Jarbas Honorio de Miranda.; writing—Pedro Elia, Marco Garrido, Sebastian Elgueta, Carlos Faúndez and Caterina Castro.; visualization, Pedro Elia, Marco Garrido, Carlos Faúndez.; supervision, Jarbas Honorio de Miranda.; project administration, Jarbas Honorio de Miranda.; funding acquisition, Jarbas Honorio de Miranda. All authors have read and agreed to the published version of the manuscript.” Please turn to the CRediT taxonomy for the term explanation. Authorship must be limited to those who have contributed substantially to the work reported.
Funding
This research received no external funding.
Data Availability Statement
The data that support the findings of this study are available from the corresponding author upon reasonable request.
Acknowledgments
This work thanks the technical support of Escola Superior de Agricultura “Luiz de Queiroz” during the development of this research.
Conflicts of Interest
The authors declare no conflicts of interest.
References
- Poudyal, C.; Costa, L.F.; Sandhu, H.; Ampatzidis, Y.; Odero, D.C.; Arbelo, O.C.; Cherry, R.H. Sugarcane Yield Prediction and Genotype Selection Using Unmanned Aerial Vehicle-Based Hyperspectral Imaging and Machine Learning. Agronomy Journal 2022, 114, 2320–2333. [Google Scholar] [CrossRef]
- CONAB Acompanhamento Da Safra Brasileira de Cana de Acucar.; Brasília, 2020.
- Gentile, A.; Dias, L.I.; Mattos, R.S.; Ferreira, T.H.; Menossi, M. MicroRNAs and Drought Responses in Sugarcane. Front Plant Sci 2015, 6. [Google Scholar] [CrossRef]
- Desalegn, B.; Kebede, E.; Legesse, H.; Fite, T. Sugarcane Productivity and Sugar Yield Improvement: Selecting Variety, Nitrogen Fertilizer Rate, and Bioregulator as a First-Line Treatment. Heliyon 2023, 9. [Google Scholar] [CrossRef]
- Coelho, A.P.; Dalri, A.B.; Faria, R.T.; Landell, E.D.A.; Palaretti, L.F. Perfilhamento Da Cana-de-Açúcar Cultivada Com e Sem Irrigação Suplementar e Plantada Por Mudas Pré-Brotadas: Um Novo Conceito. 2018, 4, 71–84.
- dos Santos, L.C.; Coelho, R.D.; Barbosa, F.S.; Leal, D.P.V.; Fraga Júnior, E.F.; Barros, T.H.S.; Lizcano, J.V.; Ribeiro, N.L. Influence of Deficit Irrigation on Accumulation and Partitioning of Sugarcane Biomass under Drip Irrigation in Commercial Varieties. Agric Water Manag 2019, 221. [Google Scholar] [CrossRef]
- Hu, S.; Shi, L.; Zha, Y.; Huang, K. A New Sugarcane Yield Model Using the SiPAR Model. Agron J 2022, 114, 490–507. [Google Scholar] [CrossRef]
- Landell, M.; Campana, M.; Figueiredo, P.; Xavier, M.; Anjos, I.; Dinardo-Miranda, L.; Scarpari, M.; Garcia, J.; Bidóia, M.; Silva, D.; et al. Sistema de Multiplicação de Cana-de-Açúcar Com Uso de Mudas Pré-Brotadas (MPB), Oriundas de Gemas Individualizadas; Ribeirão Preto, 2012; Vol. 109.
- Gírio, L.A. da S.; Dias, F.L.F.; Reis, V.M.; Urquiaga, S.; Schultz, N.; Bolonhezi, D.; Mutton, M.A. Bactérias Promotoras de Crescimento e Adubação Nitrogenada No Crescimento Inicial de Cana-de-Açúcar Proveniente de Mudas Pré-Brotadas. Pesqui Agropecu Bras 2015, 50. [CrossRef]
- Maldaner, L.F.; Molin, J.P. Data Processing within Rows for Sugarcane Yield Mapping. Sci Agric 2020, 77. [Google Scholar] [CrossRef]
- Cherri, A.C.; Vianna, A.C.G.; Ramos, R.P.; De Oliveira Florentino, H. A Methodology to Determine Size and Shape of Plots for Sugarcane Plantation. Sci Agric 2019, 76. [Google Scholar] [CrossRef]
- Singh, H.; Singh, R.K. Irrigation and Fertigation Scheduling Effect on Phenology and Yield of Spring Sugarcane (Sachhamm Officinarum). Indian Journal of Agricultural Sciences 2020, 90. [Google Scholar] [CrossRef]
- Rolim, G.; Sentelhas, P.; Barbieri, V. Planilhas No Ambiente ExcelTM Para Os Cálculos de Balanços Hídricos: Normal, Sequencial, de Cultura e de Produtividade Real e Potencial. Revista Brasileira de Agrometeorologia 1998, 6, 133–137. [Google Scholar]
- Embrapa Sistema Brasileiro de Classificação de Solos; 2nd ed.; EMBRAPA - SPI: Rio de Janeiro, 2006.
- van Genuchten, M.; Leij, F.; Yates, S.; Williams, J. The RETC Code for Quantifying Hydraulic Functions of Unsaturated Soils. EPA/600/2-91/065, R.S. 1991, 83. [Google Scholar]
- van Genuchten, M. A Closed-form Equation for Predicting the Hydraulic Conductivity of Unsaturated Soils. Soil Science Society of America Journal 1980, 44. [Google Scholar] [CrossRef]
- O’Brien, D.; Richardson, M.; Karcher, D. Adapting Time Domain Reflectometry to Measure Surface Moisture of Sand-Based Putting Greens. Agron J 2023, 115. [Google Scholar] [CrossRef]
- Bernardo, S.; Soares, A.; Mantovani, E. Manual de Irrigação, 8°. ed; UVF: Viçosa, 2008; ISBN 85-7269-242-8. [Google Scholar]
- Francis, C.A.; Rutger, J.N.; Palmer, A.F.E. A Rapid Method for Plant Leaf Area Estimation in Maize (Zea Mays L.) 1. Crop Sci 1969, 9. [Google Scholar] [CrossRef]
- Falker Automação Agrícola LTDA Manual Do Medidor Eletrônico de Teor de Clorofila (ClorofiLOG/ CFL 1030) 2008.
- van Dillewiijn, C. Botany of Sugarcane. Walthham: Chronica Botanica 1952.
- Liu, B.; Liang, J.; Tang, G.; Wang, X.; Liu, F.; Zhao, D. Drought Stress Affects on Growth, Water Use Efficiency, Gas Exchange and Chlorophyll Fluorescence of Juglans Rootstocks. Sci Hortic 2019, 250, 230–235. [Google Scholar] [CrossRef]
- Khonghintaisong, J.; Songsri, P.; Toomsan, B.; Jongrungklang, N. Rooting and Physiological Trait Responses to Early Drought Stress of Sugarcane Cultivars. Sugar Tech 2018, 20. [Google Scholar] [CrossRef]
- Galvão, Í.M.; dos Santos, O.F.; de Souza, M.L.C.; de Jesus Guimarães, J.; Kühn, I.E.; Broetto, F. Biostimulants Action in Common Bean Crop Submitted to Water Deficit. Agric Water Manag 2019, 225. [Google Scholar] [CrossRef]
- Segato, S.; Mattiuz, C.; Mozambani, A.E. Aspectos Fenológicos Da Cana-de-Açúcar. In Atualização em produção de cana-de-açúcar; CP 21: Piracicaba, 2006; pp. 19–36.
- Alamilla-Magaña, J.C.; Carrillo-Ávila, E.; Obrador-Olán, J.J.; Landeros-Sánchez, C.; Vera-Lopez, J.; Juárez-López, J.F. Soil Moisture Tension Effect on Sugar Cane Growth and Yield. Agric Water Manag 2016, 177, 264–273. [Google Scholar] [CrossRef]
- Jangpromma, N.; Thammasirirak, S.; Jaisil, P.; Songsri, P. Effects of Drought and Recovery from Drought Stress on above Ground and Root Growth, and Water Use Efficiency in Sugarcane (Saccharum Officinarum L.). Australian Journal of Soil Science 2012, 6, 1298–1304. [Google Scholar]
- dos Santos, L.; Coelho, R.; Barbosa, F.; Leal, D.; Fraga Jr, E.; Barros, T.; Lizcano, J.; Ribeiro, N. Influence of Deficit Irrigation on Accumulation and Partitioning of Sugarcane Biomass under Drip Irrigation in Commercial Varieties. Agric Water Manag 2019, 221, 322–333. [Google Scholar] [CrossRef]
- dos Santos, C.M.; de Almeida Silva, M. Physiological and Biochemical Responses of Sugarcane to Oxidative Stress Induced by Water Deficit and Paraquat. Acta Physiol Plant 2015, 37. [Google Scholar] [CrossRef]
- Gessler, A.; Schaub, M.; McDowell, N.G. The Role of Nutrients in Drought-Induced Tree Mortality and Recovery. New Phytologist 2017, 214. [Google Scholar] [CrossRef]
- de Castro, S.G.Q.; Neto, J.R.; Kölln, O.T.; Borges, B.M.M.N.; Franco, H.C.J. Decision-Making on the Optimum Timing for Nitrogen Fertilization on Sugarcane Ratoon. Sci Agric 2019, 76. [Google Scholar] [CrossRef]
- de Souza, M.L.C.; Starling, C.S.A.Z.; Machuca, L.M.R.; Zuñiga, E.A.; Galvão, Í.M.; Guimarães, J.J.; Broetto, F. Biochemical Parameters and Physiological Changes in Maize Plants Submitted to Water Deficiency. SN Appl Sci 2020, 2. [Google Scholar] [CrossRef]
- Taiz, L.; Zeiger Eduardo; Møller, I.M.; Murphy, A. Fisiologia e Desenvolvimento Vegetal - 6a Edição; Artmed, 2017. ISBN 9788582713679.
- Matoso, E.S.; Reis, V.M.; Giacomini, S.J.; Silva, M.T. da; Avancini, A.R.; Anjos e Silva, S.E. Diazotrophic Bacteria and Substrates in the Growth and Nitrogen Accumulation of Sugarcane Seedlings. Sci Agric 2021, 78. [Google Scholar] [CrossRef]
- Ort, D.R.; Merchant, S.S.; Alric, J.; Barkan, A.; Blankenship, R.E.; Bock, R.; Croce, R.; Hanson, M.R.; Hibberd, J.M.; Long, S.P.; et al. Redesigning Photosynthesis to Sustainably Meet Global Food and Bioenergy Demand. Proc Natl Acad Sci U S A 2015, 112. [Google Scholar] [CrossRef]
Figure 1.
Daily behavior of the meteorological variables: temperature (T - ºC) and estimated reference evapotranspiration (mm day-1) (A); solar radiation (Rs - MJ m-2 day-1) and average relative humidity (RH - %) (B).
Figure 1.
Daily behavior of the meteorological variables: temperature (T - ºC) and estimated reference evapotranspiration (mm day-1) (A); solar radiation (Rs - MJ m-2 day-1) and average relative humidity (RH - %) (B).
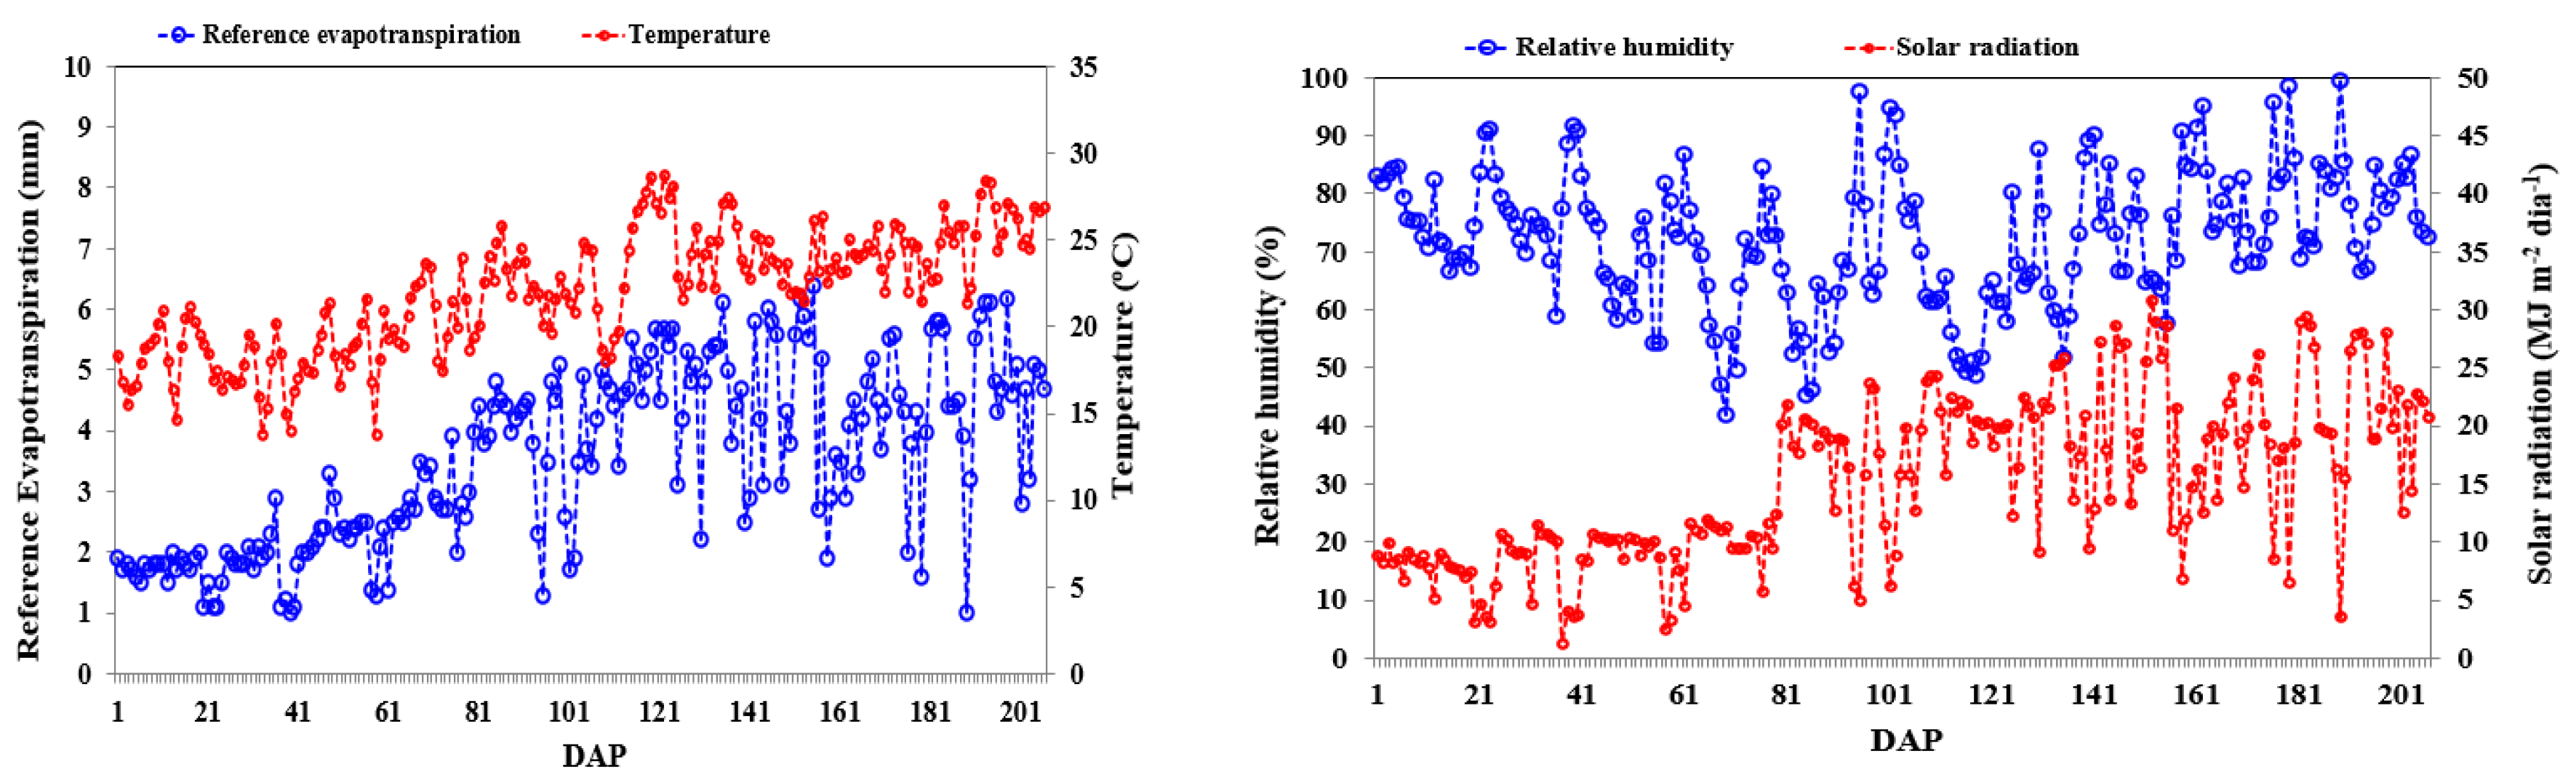
Figure 2.
Water balance for T0 (A), T1 (B), T2 (C), T3 (D), and T4 (E) demonstrating the behavior of the deficit (mm day-1) and excess (mm day-1) for the planting of the seedlings from 0 to 69 DAP.
Figure 2.
Water balance for T0 (A), T1 (B), T2 (C), T3 (D), and T4 (E) demonstrating the behavior of the deficit (mm day-1) and excess (mm day-1) for the planting of the seedlings from 0 to 69 DAP.
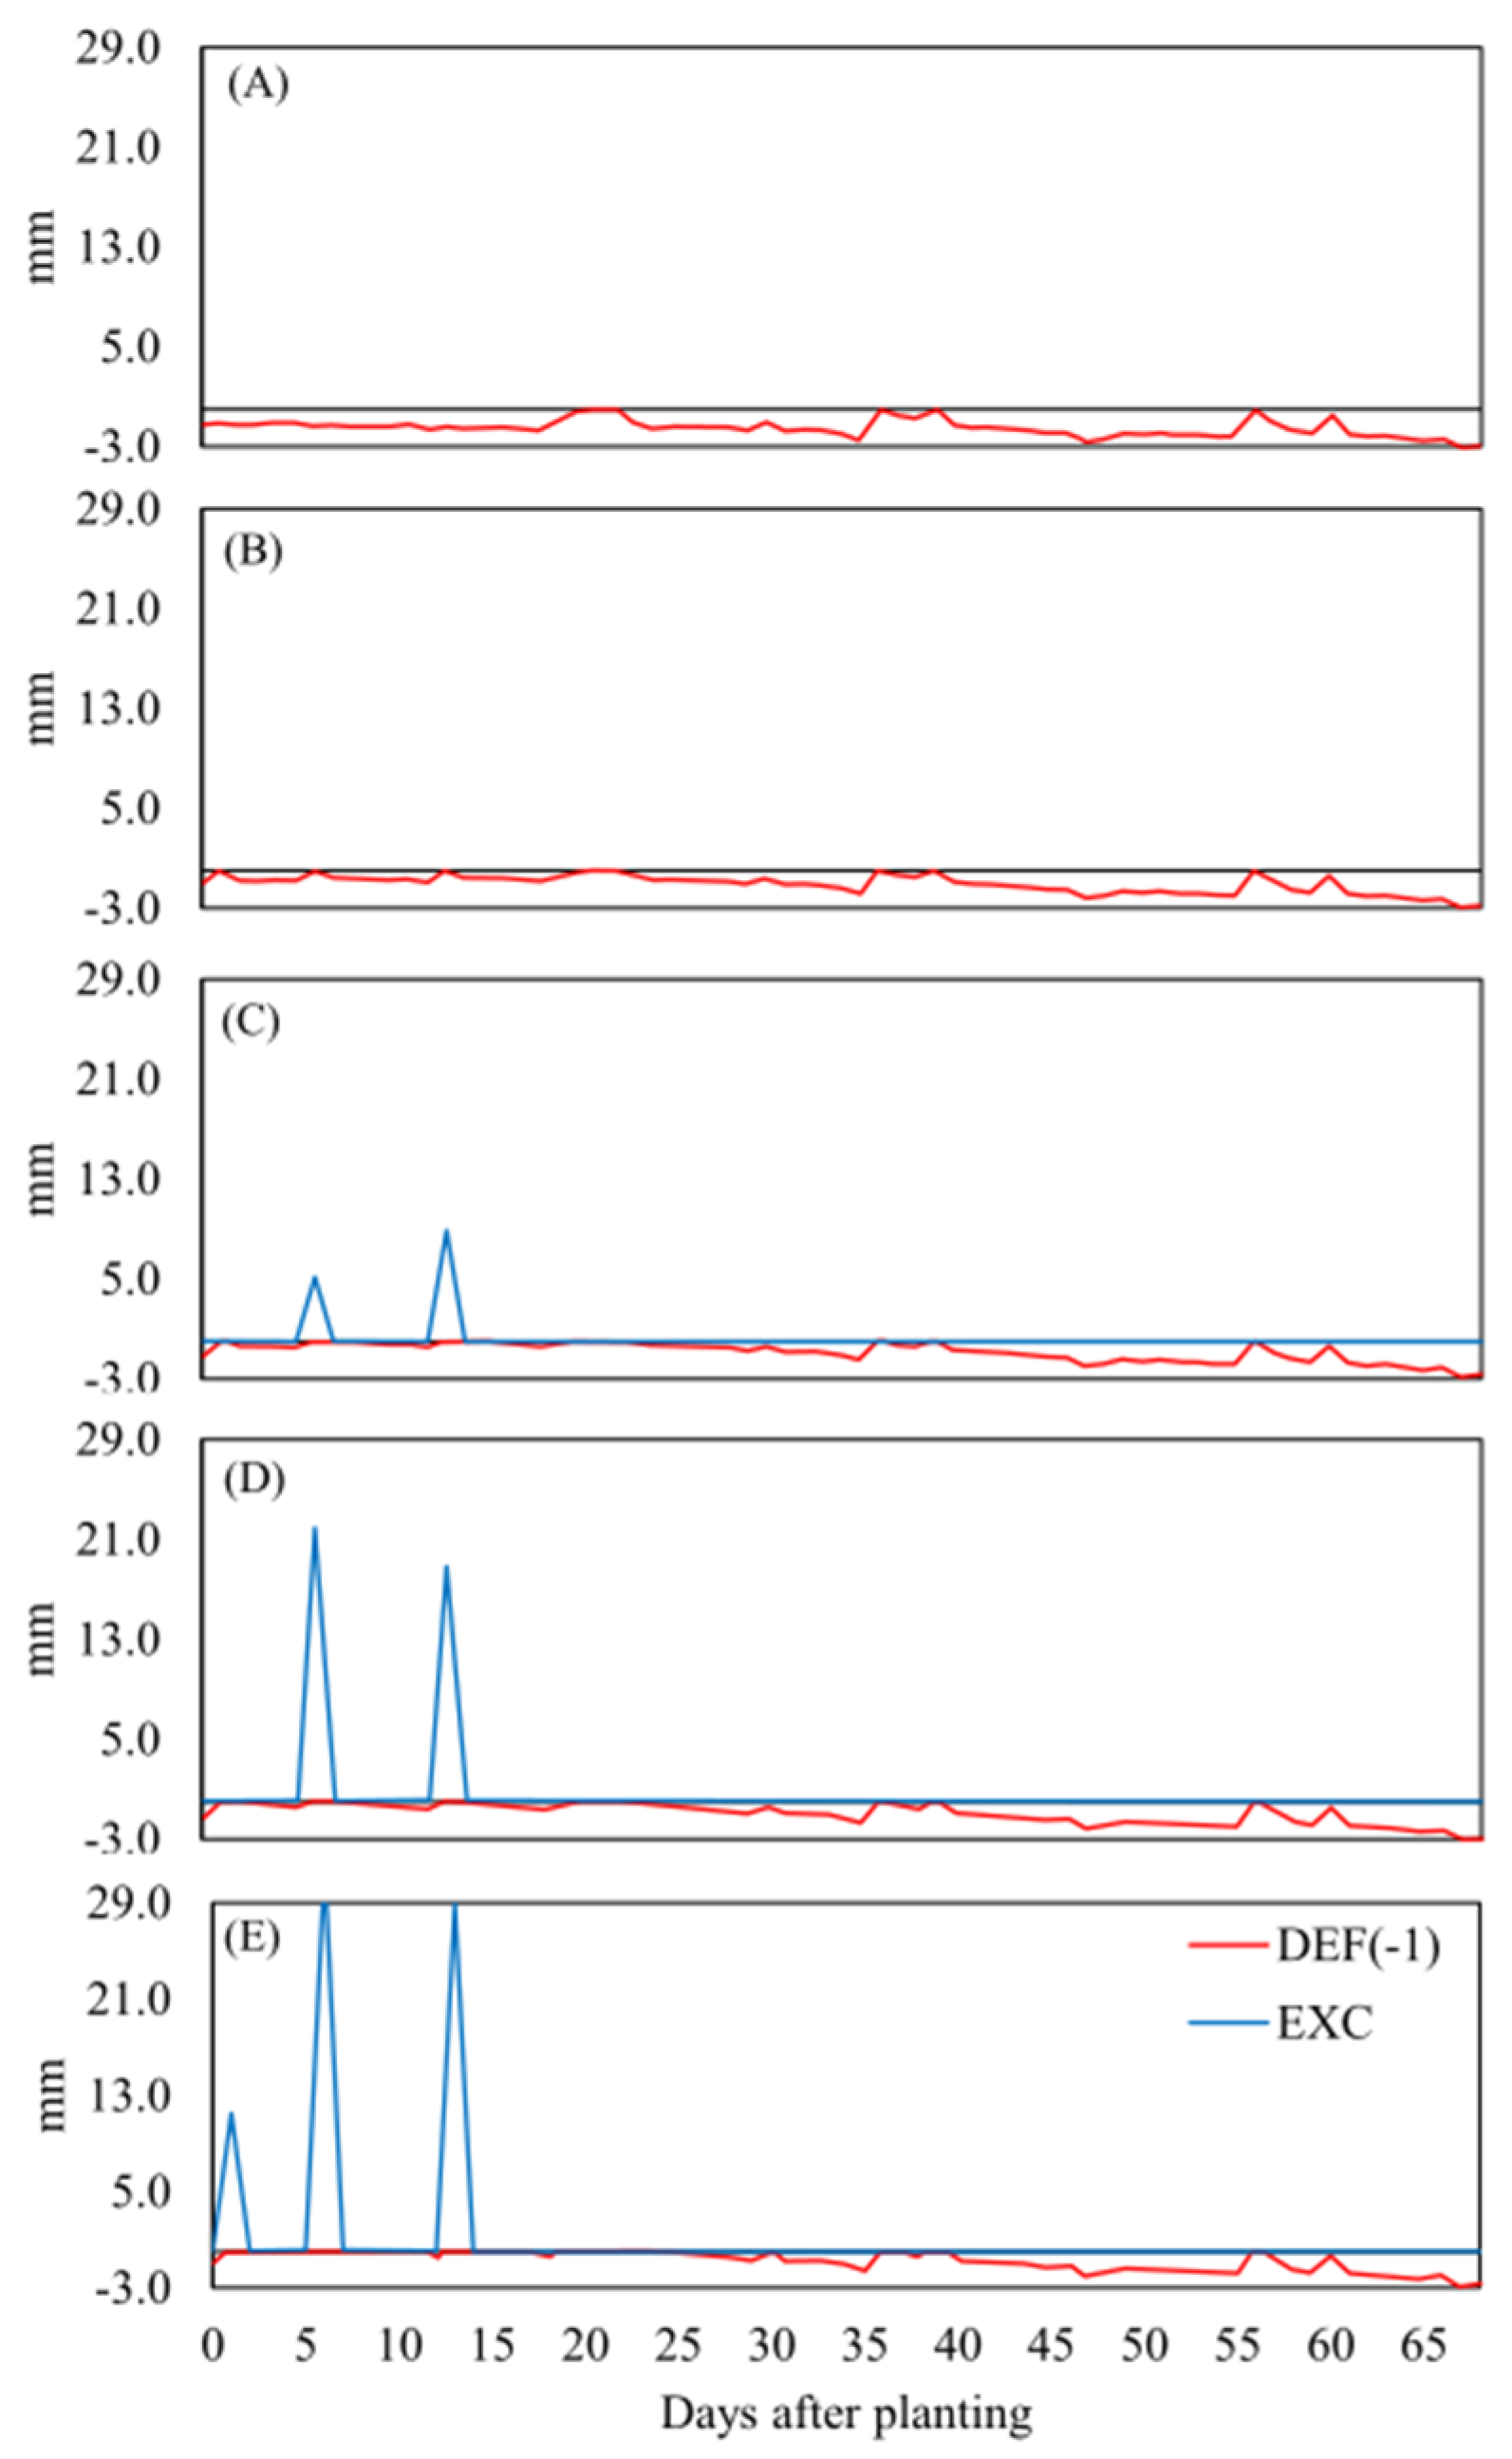
Figure 3.
Accumulated mortality percentage evolution over time.
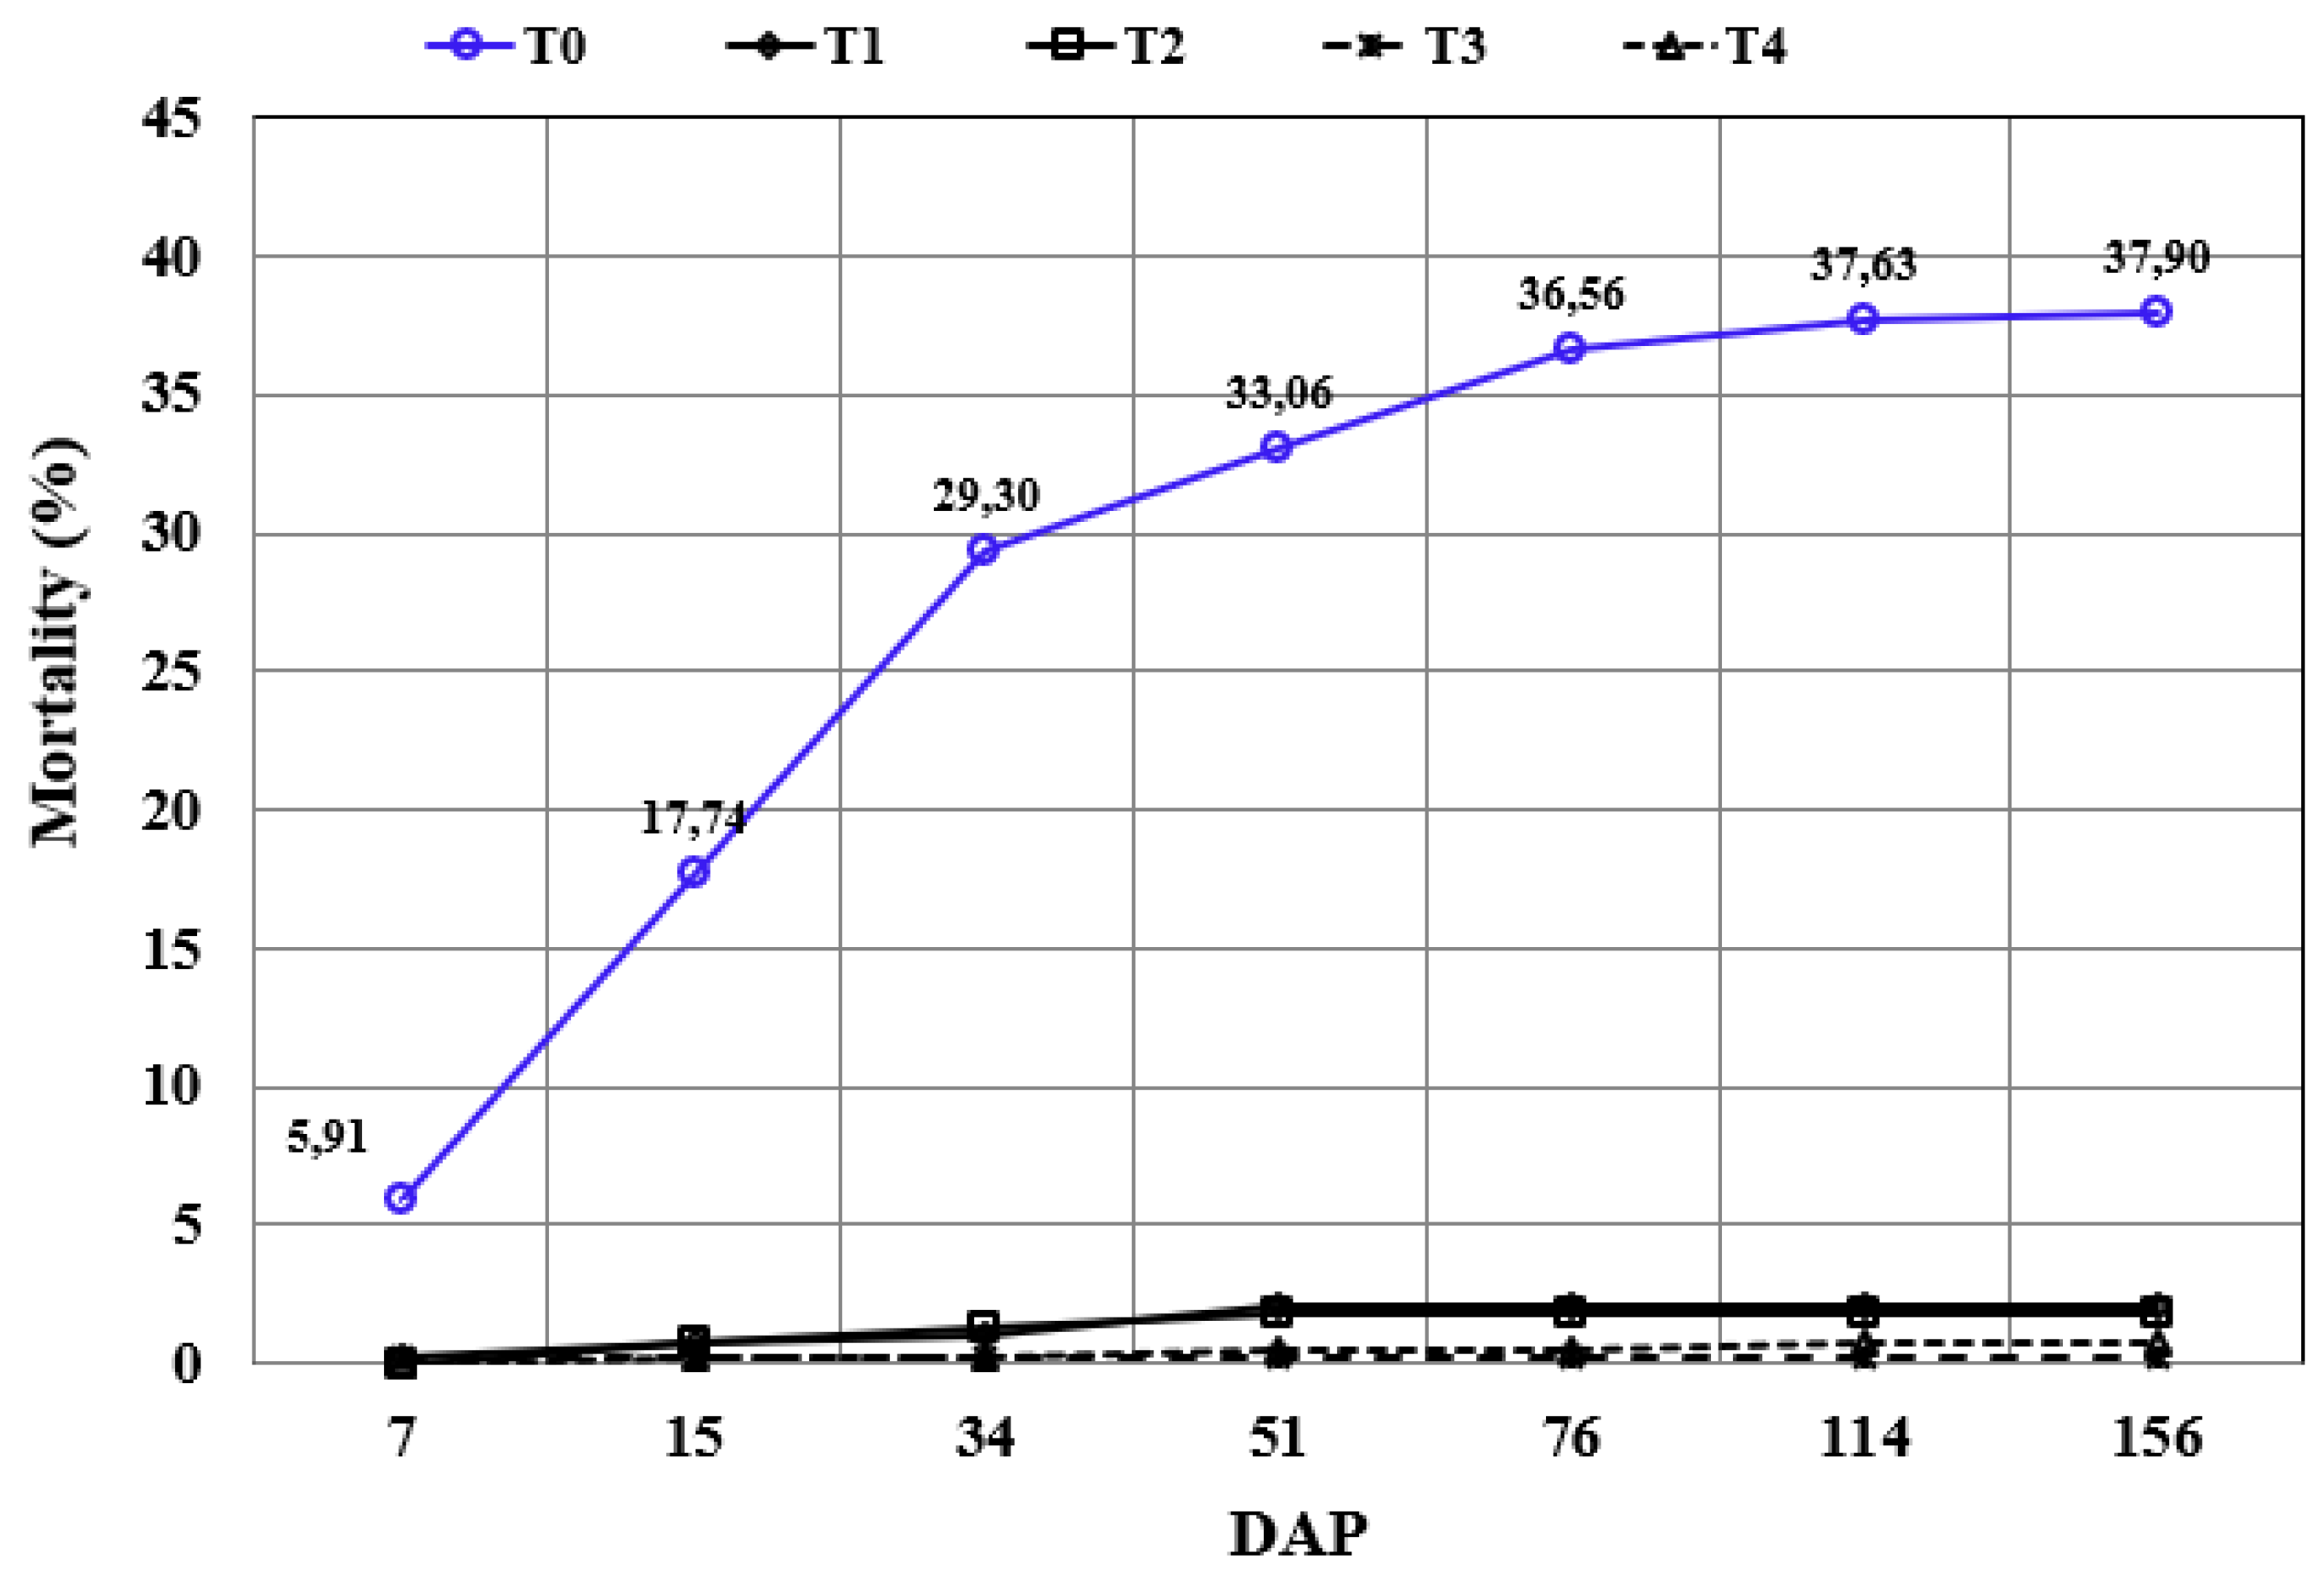

Table 1.
Description of the treatments, total irrigation levels (h), and irrigation frequency (IF) adopted.
Table 1.
Description of the treatments, total irrigation levels (h), and irrigation frequency (IF) adopted.
| Treatments | Description | Total Irrigation Levels (h) | Fixed irrigation frequency (IF) (in DAP) | |
| T0 | Control - no irrigation | - | - | |
| T1 | 3 applications of 10 mm | 30 mm | 1, 6 and 13 | |
| T2 | 3 applications of 20 mm | 60 mm | 1, 6 and 13 | |
| T3 | 3 applications of 30 mm | 90 mm | 1, 6 and 13 | |
| T4 | 3 applications of 40 mm | 120 mm | 1, 6 and 13 |
Table 2.
Soil chemical analysis.
| Layer | pH | M.O | P | K | Ca | Mg | Al | H+Al | SB | CTC | BS |
| Cm | CaCl2 | g.dm-3 | mg.dm-3 | mmolc dm-3 | % | ||||||
| 0 - 25 | 5.2 | 51.8 | 24.1 | 2.5 | 36.3 | 13.8 | 1.7 | 37.9 | 52.6 | 90.5 | 57.7 |
| 25 - 50 | 5.0 | 18.7 | 14.2 | 1.3 | 28.2 | 11.1 | 2.1 | 40.9 | 40.6 | 81.6 | 49.2 |
Table 3.
Physical-hydric analysis of the Red-Yellow Oxisol.
| Layer | Clay | Silt | Sand | Soil density | Field capacity |
Permanent wilting point | Available water capacity |
|
| cm | % | g cm-3 | cm3 cm-3 | mm | ||||
| 0 - 25 | 51.94 | 12.28 | 35.78 | 1.44 | 0.35 | 0.31 | 10.0 | |
| 25 - 50 | 56.13 | 12.43 | 31.44 | 1.41 | 0.35 | 0.3 | 12.5 | |
Table 4.
Values for the van Genuchten model parameters (van Genuchten 1980) for the layers 0 - 25 cm and 25 - 50 cm.
Table 4.
Values for the van Genuchten model parameters (van Genuchten 1980) for the layers 0 - 25 cm and 25 - 50 cm.
| Layer | θs | θr | α | m | n |
| (cm) | (cm3 cm-3) | (cm3 cm-3) | (cm-1) | ||
| 0 - 25 | 0.50 | 0.29 | 0.2446 | 0.203 | 1.255 |
| 25 - 50 | 0.49 | 0.26 | 0.2359 | 0.169 | 1.203 |
Table 5.
Average root length over time in sugarcane plants derived from pre-sprouted seedlings submitted to different levels of water availability.
Table 5.
Average root length over time in sugarcane plants derived from pre-sprouted seedlings submitted to different levels of water availability.
| Treatment | Root length (cm) | |||||||||||
| 15 DAP | 34 DAP | 51 DAP | 76 DAP | 114 DAP | 156 DAP | |||||||
| T0 | 3.4 | b | 5.6 | b | 11.3 | b | 13.3 | b | 19.0 | b | 22.4 | a |
| T1 | 9.3 | a | 10.7 | a | 13.2 | ab | 16.7 | a | 20.6 | ab | 26.7 | a |
| T2 | 11.1 | a | 13.2 | a | 15.0 | ab | 17.2 | a | 22.6 | a | 24.7 | a |
| T3 | 12.8 | a | 16.0 | a | 15.3 | a | 18.0 | a | 21.7 | ab | 26.0 | a |
| T4 | 12.0 | a | 15.3 | a | 15.2 | ab | 17.0 | a | 19.2 | ab | 23.6 | a |
| CV % | 18.71 | 19.05 | 11.63 | 8.29 | 5.56 | 9.09 | ||||||
1 Means followed by the same letters in columns do not differ from each other, according to the Tukey test, at a significance level of 5%.
Table 6.
Accumulated root dry mass (g) over time in sugarcane plants derived from pre-sprouted seedlings submitted to different levels of water availability.
Table 6.
Accumulated root dry mass (g) over time in sugarcane plants derived from pre-sprouted seedlings submitted to different levels of water availability.
| Treatment | Accumulated root dry mass (g seedling-1) | |||||||||||
| 15 DAP | 34 DAP | 51 DAP | 76 DAP | 114 DAP | 156 DAP | |||||||
| T0 | 0.01 | b | 0.04 | b | 0.09 | b | 0.27 | b | 1.66 | c | 5.74 | b |
| T1 | 0.07 | ab | 0.11 | a | 0.21 | a | 0.71 | ab | 5.15 | b | 9.62 | ab |
| T2 | 0.11 | ab | 0.14 | a | 0.19 | ab | 1.33 | a | 7.01 | a | 10.50 | a |
| T3 | 0.12 | ab | 0.16 | a | 0.21 | a | 0.98 | ab | 4.54 | b | 12.82 | a |
| T4 | 0.13 | a | 0.14 | a | 0.20 | ab | 0.64 | ab | 4.73 | b | 10.96 | a |
| CV % | 8.39 | 4.50 | 5.91 | 15.65 | 6.08 | 18.28 | ||||||
1 Means followed by the same letters in columns do not differ from each other, according to the Tukey test, at a significance level of 5%.
Table 7.
Number of tillers sprouted per meter over time in sugarcane plants derived from pre-sprouted seedlings submitted to different levels of water availability.
Table 7.
Number of tillers sprouted per meter over time in sugarcane plants derived from pre-sprouted seedlings submitted to different levels of water availability.
| Treatment | Number of tillers sprouted per meter. | |||||||||||
| 15 DAP | 34 DAP | 51 DAP | 76 DAP | 114 DAP | 156 DAP | |||||||
| T0 | 2.10 | b | 2.20 | b | 2.40 | b | 3.50 | b | 9.70 | c | 20.80 | c |
| T1 | 2.30 | ab | 2.70 | a | 4.10 | a | 7.20 | a | 20.30 | b | 24.70 | b |
| T2 | 2.50 | a | 2.70 | a | 3.90 | a | 7.70 | a | 23.30 | a | 28.00 | a |
| T3 | 2.30 | ab | 2.80 | a | 3.60 | a | 7.00 | a | 20.80 | ab | 24.90 | b |
| T4 | 2.40 | a | 2.50 | ab | 3.50 | a | 7.20 | a | 19.40 | b | 24.40 | b |
| CV % | 11,83 | 15,05 | 22.24 | 22.58 | 21.04 | 16.18 | ||||||
1 Means followed by the same letters in columns do not differ from each other, according to the Tukey test, at a significance level of 5%.
Table 8.
Total number of tillers per clump over time in sugarcane plants derived from pre-sprouted seedlings submitted to different levels of water availability.
Table 8.
Total number of tillers per clump over time in sugarcane plants derived from pre-sprouted seedlings submitted to different levels of water availability.
| Treatment | Total number of tillers per clump | |||||||||||
| 15 DAP | 34 DAP | 51 DAP | 76 DAP | 114 DAP | 156 DAP | |||||||
| T0 | 1.80 | a | 1.60 | a | 2.90 | a | 3.70 | b | 4.30 | b | 16.80 | a |
| T1 | 1.90 | a | 2.30 | a | 4.00 | a | 7.00 | a | 15.80 | a | 20.00 | a |
| T2 | 2.60 | a | 2.90 | a | 3.80 | a | 8.10 | a | 20.40 | a | 21.80 | a |
| T3 | 3.10 | a | 2.90 | a | 4.00 | a | 7.80 | a | 16.10 | a | 20.00 | a |
| T4 | 1.90 | a | 3.00 | a | 4.30 | a | 7.40 | a | 16.30 | a | 20.40 | a |
| CV % | 22.22 | 21.97 | 18.67 | 18.04 | 13.03 | 12.2 | ||||||
1 Means followed by the same letters in columns do not differ from each other, according to the Tukey test, at a significance level of 5%.
Table 9.
Average plant height (cm) over time in sugarcane plants derived from pre-sprouted seedlings submitted to different levels of water availability.
Table 9.
Average plant height (cm) over time in sugarcane plants derived from pre-sprouted seedlings submitted to different levels of water availability.
| Treatment | Plant height (cm) | |||||||||||
| 15 DAP | 34 DAP | 51 DAP | 76 DAP | 114 DAP | 156 DAP | |||||||
| T0 | 18.50 | c | 32.80 | b | 39.40 | c | 42.70 | c | 78.70 | c | 141.20 | b |
| T1 | 30.80 | b | 47.00 | a | 53.40 | ab | 62.60 | b | 114.00 | b | 164.90 | a |
| T2 | 30.90 | b | 48.50 | a | 55.10 | a | 70.60 | a | 122.30 | a | 168.60 | a |
| T3 | 31.80 | ab | 46.60 | a | 51.80 | b | 67.90 | a | 120.90 | ab | 170.00 | a |
| T4 | 32.30 | a | 47.20 | a | 50.80 | b | 68.60 | a | 120.90 | ab | 165.30 | a |
| CV % | 6.32 | 8.39 | 7.95 | 8.19 | 9.75 | 6.10 | ||||||
1 Means followed by the same letters in columns do not differ from each other, according to the Tukey test, at a significance level of 5%.
Table 10.
Leaf area index over time in sugarcane plants derived from pre-sprouted seedlings submitted to different levels of water availability.
Table 10.
Leaf area index over time in sugarcane plants derived from pre-sprouted seedlings submitted to different levels of water availability.
| Treatment | Leaf area index | |||||||||
| 34 DAP | 51 DAP | 76 DAP | 114 DAP | 156 DAP | ||||||
| T0 | 0.006 | c | 0.009 | b | 0.030 | b | 0.300 | c | 1.340 | c |
| T1 | 0.017 | b | 0.036 | a | 0.160 | a | 1.040 | b | 1.650 | b |
| T2 | 0.022 | a | 0.038 | a | 0.190 | a | 1.360 | a | 2.330 | a |
| T3 | 0.019 | ab | 0.031 | a | 0.160 | a | 1.170 | ab | 1.800 | b |
| T4 | 0.015 | b | 0.029 | a | 0.180 | a | 1.110 | b | 1.680 | b |
| CV % | 1.220 | 2.640 | 8.220 | 17.740 | 16.610 | |||||
1 Means followed by the same letters in columns do not differ from each other, according to the Tukey test, at a significance level of 5%.
Table 11.
Accumulated shoot dry mass (g) over time in sugarcane plants derived from pre-sprouted seedlings submitted to different levels of water availability.
Table 11.
Accumulated shoot dry mass (g) over time in sugarcane plants derived from pre-sprouted seedlings submitted to different levels of water availability.
| Treatment | Shoot dry mass (g muda-1) | |||||||||||
| 15 DAP | 34 DAP | 51 DAP | 76 DAP | 114 DAP | 156 DAP | |||||||
| T0 | 0.62 | c | 0.76 | b | 1.40 | b | 2.78 | c | 3.98 | c | 77.12 | c |
| T1 | 0.76 | bc | 1.08 | ab | 2.48 | a | 7.89 | ab | 33.79 | b | 112.13 | bc |
| T2 | 0.81 | ab | 1.20 | a | 2.38 | a | 11.93 | a | 51.09 | a | 216.42 | a |
| T3 | 0.97 | a | 1.34 | a | 2.60 | a | 8.04 | ab | 36.86 | b | 232.83 | a |
| T4 | 0.90 | ab | 1.25 | a | 2.80 | a | 6.60 | b | 37.30 | b | 190.02 | ab |
| CV % | 3.40 | 6.26 | 7.30 | 10.74 | 4.30 | 19.17 | ||||||
1 Means followed by the same letters in columns do not differ from each other, according to the Tukey test, at a significance level of 5%.
Table 12.
Leaf chlorophyll index over time in sugarcane plants derived from pre-sprouted seedlings submitted to different levels of water availability.
Table 12.
Leaf chlorophyll index over time in sugarcane plants derived from pre-sprouted seedlings submitted to different levels of water availability.
| Treatment | Total leaf chlorophyll content | |||||||
| 34 DAP | 51 DAP | 76 DAP | 114 DAP | |||||
| T0 | 37.60 | b | 30.10 | b | 46.40 | b | 47.00 | a |
| T1 | 36.50 | b | 37.20 | a | 52.80 | a | 48.70 | a |
| T2 | 40.00 | a | 37.90 | a | 51.40 | a | 47.40 | a |
| T3 | 36.90 | b | 35.90 | a | 51.90 | a | 48.30 | a |
| T4 | 37.10 | b | 39.50 | a | 51.90 | a | 48.60 | a |
| CV % | 9.23 | 15.63 | 7.94 | 6.47 | ||||
1 Means followed by the same letters in columns do not differ from each other, according to the Tukey test at a significance level of 5%.
Disclaimer/Publisher’s Note: The statements, opinions and data contained in all publications are solely those of the individual author(s) and contributor(s) and not of MDPI and/or the editor(s). MDPI and/or the editor(s) disclaim responsibility for any injury to people or property resulting from any ideas, methods, instructions or products referred to in the content. |
© 2024 by the authors. Licensee MDPI, Basel, Switzerland. This article is an open access article distributed under the terms and conditions of the Creative Commons Attribution (CC BY) license (http://creativecommons.org/licenses/by/4.0/).
Copyright: This open access article is published under a Creative Commons CC BY 4.0 license, which permit the free download, distribution, and reuse, provided that the author and preprint are cited in any reuse.


