
Submitted:
28 August 2023
Posted:
31 August 2023
You are already at the latest version
Abstract
Water resources worldwide are limited, especially in desert areas like Saudi Arabia. Therefore, the rational and sustainable management of irrigation water supply is an imperative required by the conditions of space and time. This study evaluates the irrigation system through partial root-zone drying (PRD) and regulated deficit irrigation (RDI). The effect of applying the PRD and RDI systems on the efficiency and rationalization of irrigation water consumption in a greenhouse and open field cucumber was studied in addition to using the surface (S) and subsurface (SB) drip irrigation methods on irrigation efficiency. The productivity of the RDI-S regular drip irrigation treatment was considered 100% as the control on which the results of all treatments are measured. The results showed that in terms of irrigation technique, the PRD-SB technique had the highest productivity during the winter season in greenhouse cucumbers, with a general average of 13.8 kg m-2 for all irrigation levels, while the RDI-SB technique had the highest productivity during the summer season, with a general average of 16.1 kg m-2. Regarding irrigation level results, the study showed that an irrigation level of 100% is the highest productivity in all irrigation techniques, with a general average of 14.9 kg m-2 for all irrigation techniques during the winter season and 16.4 kg m-2 during the summer. However, the increase in the irrigation level to 150% did not increase productivity. In comparison, the application of the deficit irrigation technique by reducing the level of irrigation to 50% was not accompanied by a similar decrease in productivity. The study results also showed that irrigation with the PRD-SB system was the most productive in the open field at all irrigation levels, with a general average of 7.3 kg m-2. The general average of the percentage decrease in productivity in all irrigation techniques compared to reducing the irrigation percentage to 50% and 75% was 22% and 3 %. The irrigation efficiencies were higher when applying the PRD (PRD-SB) in winter. In contrast, applying a deficit irrigation system (RDI-SB) in the summer season had the highest efficiency. It could be concluded that using PRD and RDI systems for indoor and outdoor cucumber can save irrigation water.
Keywords:
cucumber
; deficit irrigation
; surface and subsurface irrigation
; Saudi Arabia
; water saving
; water use efficiency
1. Introduction
Agricultural development is becoming increasingly dependent on improvements in water use efficiency as its limiting factor. Exponential population growth and climate change conditions pressure potable water supplies, agriculture, and industry, making water management more complex and difficult [1,2]. Therefore, there is an urgent need to increase water productivity due to the shortage of availability to meet the food requirements of the rapid population growth. The method of surface and subsurface drip irrigation is to deliver irrigation water and nutrients to the plant’s root zone in small and continuous quantities according to the plant’s needs without significant losses, either by dripping above or below the soil surface. Umar et al. (2019) [3] reported that sub-surface drip irrigation reduced the amount of crop evapotranspiration by 26% over surface irrigation and by 15% over surface drip irrigation when applied to wheat crops, leading to an increase in irrigation water productivity of 19.59% compared to surface irrigation. The regulated deficit irrigation (RDI) method, which is one of the strategies for the sustainable development of agricultural water resources to achieve food security [4], is one of the best strategies to increase water productivity and shift irrigation management from maximum production of crop per unit area to maximum production per unit of water to sustain water resources for agriculture [5,6,7]. Abolpour (2018) [8] revealed that crop water productivity (CWP) could be increased by 100% with a 27% reduction in the water unit in an area facing a problem with the sustainability of groundwater resources, in which more than 34% of groundwater depletion would be reduced. In this context, the deficit irrigation program has become of strategic value in dry areas [9,10,11]. Among the most important advantages of deficit irrigation are the increase in the value of water productivity and the exploitation of the difference in irrigation water resulting from it in cultivating new areas that generate greater profitability for each unit of water available to the farmer [12], and maximum productivity can also be obtained with less fertilizer [6,13,14]. (Cicogna et al., 2005) [15] found that deficit irrigation reduces the field’s need for fertilization. This feature is considered one of the most important advantages of deficit irrigation, which is the combination of saving water and making the most of fertilization, which leads to increased water productivity and reduces the risk of fungal diseases [15]. It avoids negative conditions during crop growth, such as pests, diseases, and suffocation in the root zone due to excess water [6,12,13,14]. The partial root-zone drying (PRD) technique is based on the principle that plants suggest a drought has occurred by exposing one side of their roots to drought. At the same time, the other side is irrigated to avoid drying out, and in the next irrigation, the other side is irrigated with an alternation between wet/dry [5,16,17]. Hashem et al. (2018) [18] revealed that applying the PRD system and regulated deficit irrigation (RDI) with the subsurface drip irrigation method in tomato crops has enhanced irrigation water use efficiency (IWUE) and reduced transpiration rate compared to full irrigation (FI). They increased the total soluble solids in fruits and vitamin C. Many studies have been conducted on the contribution of the PRD system to rationalizing irrigation water and increasing its productivity [18]. Qin et al. (2018) [19] found that irrigation with the PRD system was more economically beneficial and saved at least 50% of the irrigation water. AlHashmi et al. (2023) [18] reported a general decrease in water stress and salt accumulation inside the root-zone area with PRD. Amorim et al. (2022) [16] revealed that PRD treatments (with alternation of the irrigation side every 15 and 30 days of orange) significantly increased the irrigation water use efficiency by 41–56% compared to the full irrigation treatment. Ahmadi et al. (2010) [20] indicated that the success of the PRD irrigation system in the cucumber crop depends on the soil quality. They did not find significant differences between full irrigation (FI), deficit irrigation, and partial root zone drying (PRD). Still, they found significant differences when applying the technique on different soils, and they reported that the soil quality (loamy sand) was unsuitable for PRD application. However, before using RDI and PRD, one should know crop water requirements, crop response to water stress, critical stages of growth under water stress for each crop, and the economic effects on yield [6]. Playán and Mateos (2006) [21] define water productivity (WP) as the agricultural production per unit of water applied, diverted, or consumed (precipitation and/or irrigation) to produce a crop, which increases water productivity to reduce the amount of irrigation water that contributes to irreversible losses, as seeking to apply the principle of sustainable use of water in agriculture means more food with less water. Water is the determining factor for agriculture, and therefore it means studying the maximum possible exploitation of this marginal factor to achieve the highest possible productivity according to the marginal benefit [22]. The crop response factor (Ky) is another indicator of the tolerance of indoor and open-field cucumber crops to reduce the level of irrigation without significantly affecting productivity, which is the relationship of low production to low crop evapotranspiration. The relationship is linear, as suggested by [23], and its value ranges between 0.2-1.15 according to [24] and between 0.08-1.75 according to [25]. When the value of Ky is greater than one, the percentage of relative decline in production is greater than the percentage of decrease in water consumption, which means that this technique cannot be applied to avoid greater loss, and vice versa.
In recent years, the importance of the factors determining agriculture production has become clear, so maximum agricultural productivity depends mainly on water availability in arid regions and how to maximize its use and limit its waste [26]. However, the effects of PRD and RDI on the performance of cucumbers grown in greenhouses and open fields in arid environments remain unknown. Thus, this study aimed to investigate the effects of PRD and RDI irrigation strategies on the growth of cucumber crops under surface and subsurface drip irrigation in a controlled environment and an open field in central Saudi Arabia.
2. Materials and methods
2.1. Experimental Site
This study was conducted during the years 2013–2018 in the Al-Mohawis Agricultural Project in Thadiq Governorate, which lies between latitudes (25° 16.609) and (25° 17.400) north and longitudes (45° 52.385) and (45° 53.518) east and at an altitude of 722 meters above sea level.
2.2. Climate
The study area has a continental climate that is hot and dry in the summer, and cold in the winter. Temperatures may reach more than 50 °C in the shade in summer, with an average higher than 44.9 °C [27], and may drop below -4.4 °C in winter, with an average low of 8 °C. The winter and spring rains are irregular and do not exceed an average of 101 mm per year [27]. Table 1 shows the average climatic conditions prevailing at the study site from 2005 to 2018. This data was extracted as a common monthly average from three locations: between local daily limits of temperature, humidity, and wind speed with manual devices at the site and averages of daily climatic records of the Hydrology Department of the Water Resources Development Department of the Ministry of Agriculture and Water from the two stations of Hotat-Sudair (50 km northwest of the site) and Riyadh as the two closest stations to monitor approved climate data, and between the General Presidency of Meteorology and Environmental Protection records for the two stations in Riyadh (140 km southeast of the site).
2.3. The soil of the experimental sites
The original soil on the experimental sites is sandy loam or loamy sand (sediments of Wadi Obeithran). It was spread during previous cultivations with Nafud sand (dunes), with the mud of a dam condensing it. Table 2a–c) show some of the soil properties of the physical and chemical experimental sites. Table 2d shows some of the properties of the irrigation water used in the experiments.
2.4. Preparing and processing lysimeters to elicit cucumber crop coefficient
Six non-weighing lysimeters were prepared in the open field and the greenhouse. Half of them were grown with alfalfa, and the other half with cucumber crop sites, with three equal replicates between the main crop and the reference alfalfa to measure crop evapotranspiration of cucumber, as well as evapotranspiration of alfalfa, and then the coefficients of the two crops were estimated. Each lysimeter was filled with fine gravel to a height of 15 cm [28], then soils similar to those in the experimental fields were added. Lysimeters were made of galvanized sheets lined with thermal insulators, with 2 × 1 × 1 m inside the greenhouse and in the open fields. The quantities of irrigation water were manually added daily to each lysimeter to ensure the volume of water added accurately while receiving the discharge from it from the outlet of a perforated pipe to drain excess water along the bottom of the lysimeter, which was received in an underground receiving room outside the cultivated area. The quantities of water consumed were calculated. The moisture content inside the lysimeters was monitored using a hygrometer (ECH2O-5TE with Em50® Data Logger) after calibration, according to [29,30].
The number of experimental units in each site is 48, half with the regulated drip irrigation (RDI) system and the other half with the partial root-zone drying irrigation system (PRD). Each was divided into surface drip irrigation (S) and subsurface drip irrigation (SB). The area of each experimental unit in the open field is 12.5 square meters, and it is 18 square meters inside the greenhouse. Sixteen treatments were carried out with three replicates at each experimental site, and the main treatments were distributed as presented in Figure 1, using surface and sub-surface drip irrigation methods.
The treatments consisted of two groups: the drip irrigation group with a single line (RDI), which includes full irrigation and deficit irrigation, and the group with the partial drying irrigation system (PRD) for the root zone with two lines with the same irrigation ratios as the first group.
2.6. Cultivation
Greenhouse and open-field cucumber crops were cultivated during nineteen seasons and distributed over three sites from 2014 to 2018. The cultivation process was carried out in two ways, according to the irrigation system. The section for regulated drip irrigation (RDI) in cucumber was planted in single lines, each one meter from the other, and seeds were sown at the dripper along the single line. While the planting of seeds in the experiments of the Partial Root-Zone Drying Irrigation System (PRD) was between the two parallel double lines with opposite drippers on each side, the irrigation of this system consists of watering one side of the plant alternately with the other side in each irrigation period so that half of the roots get the total amount of water prescribed for the plant. In contrast, the other half remains dry until the next irrigation time comes to get full irrigation, alternately until the end of the season.
The greenhouse experiment was sown with seeds of cucumber (Cucumis sativus L.cv. Bazz) directly into the experiment site midway between the double lines for the PRD, and seed in front of each of two opposite drippers, so that the seed is 10 cm away from each, at a rate of 3 plants per square meter. A sealing plastic separator was placed between the two double lines, so the seed was in a vertical hole in the middle of the plastic sheet separator. Cucumbers were also planted in the open field with seeds of the same variety in the same manner mentioned inside the greenhouse.
2.7. Crop fertilization
The basic fertilization was carried out with granulated compound fertilizer with a formula (12-12-17 + 2Mg + 6Ca +TE) of 72 kg/ha: total nitrogen (N) at a rate of 72 kg/ha − phosphate (P2O5) at a rate of 102 kg/ha; - potassium (K2O) at a rate of 102 kg/ha. This was mixed with the soil while preparing it for planting as a base fertilizer. With the beginning of the third week of cultivation (beginning of the second stage), the fertilization program was implemented with soluble fertilizers according to the growth stage. For the second stage, soluble fertilizers were used with the formula: 1: 1.5: 1: 1.7: 0.3: 0.19: 0.15 (NPK + Ca + Mg + Fe + TE) at 27 kg/ha nitrogen (N), 41 kg/ha phosphate (P2O5), 27 kg/ha potassium (K2O), 46 kg/ha calcium (CaO), 8 kg/ha magnesium (MgO), and 2.5 kg/ha chelated iron (7% EDDHA). Chelated mixed minerals were added weekly until the end of the second phase. The soil was sterilized with dichloropropene (1-3 dichloropropene, 93%), at a rate of 200 l/ha. Immediately after planting, the seed bed was watered with Metalaxyl 24% w/v at a rate of 4 liters/ha directly in the planting lines using a 12-horsepower mobile spray pump ([31].
2.8. Daily readings of plant environment data
The readings of the climatic data devices inside the greenhouse and in the open field were recorded daily at eight in the morning, and the readings of the evaporation pan were used to estimate the daily crop water requirements for irrigation. The gravimetric method and monitoring devices regularly measure soil moisture content in the root zone.
2.9. Field measurements and data collected
Soil and water samples were taken from the experimental sites for physical and chemical analyses. The greenhouse and open field pan evaporation were prepared. Experimental measurements were taken and calibrated using the FAO/Penman-Monteith equation to ensure that the measured data were related to the computed ones. Daily routine measurements were taken from evaporation pan readings and climate data to calculate water requirements, record irrigation and drainage water quantities, weigh daily harvest quantities of cucumber, make observations during growth, take leaf area measurements, and analyze soil samples periodically. Cucumber harvest quantities were recorded, sorted into fit and unfit for the market, and weighed. At the end of the season, the roots of cucumber plants were exposed by selecting a representative group of plants for each treatment, and a trench was dug around the plant with a depth of 1 meter and a radius of 60 cm. It was finally trimmed to 50 cm, and then the roots were exposed by spraying water. Slowly on the root area to let the soil fall into the trench to a depth of 50 cm, then the roots were quantitatively taken into a large mesh sieve with a diameter of 1 mm and washed well with water, then air dried and transported to the laboratory.
2.10. Estimation of crop water requirements and crop coefficient
The water requirements for irrigation were estimated by calculating the reference evapotranspiration using an evaporation pan Class “A” installed on bare ground (case “B”) according to the FAO paper 56 [32]. The evaporation pan was installed inside the greenhouse, and the pan is 1 meter away from the green plant, while the distance is 10 meters in the open fields, according to the calculation of the pan coefficient [32]. The water requirements were also estimated by applying the Penman-Monteith equation using the average climatic data prevailing during the growing seasons to compare with the daily readings of the evaporation pan.
2.10.1. Derivation of the crop coefficient (Kc) for experimental crops using lysimeters
Crop evapotranspiration (ETc) of cucumber crops was calculated by directly calculating the amounts of evapotranspiration water from their lysimeters by applying the water balance equation [32]:
where:
ETc = P + I –DP ± ∆SW
ET = evapotranspiration of the crop grown (in the lysimeter) over a specific period.
I = depth of water added by irrigation over a specific period
P = the amount of rain that fell over a specific period.
DP = amount of drained water (from the lysimeter) over a specific period.
∆SW = change in soil moisture content (in the lysimeter) over the same period.
The value of the crop coefficient (Kc) was calculated from the crop evapotranspiration (ETc) directly from the lysimeters and the evapotranspiration of the reference alfalfa ETo or (ETr) by evapotranspiration (E-pan) as well as from the FAO/Penman-Monteith equation (PM). The crop coefficient was calculated for both cucumber crop and reference alfalfa according to the following equation [32]:
where:
ETc = ETo Kc = ETr Kc
Kc = ETc/ETo = ETc/ETr
ETc = crop evapotranspiration (mm/day).
Kc = crop coefficient.
ETo = grass-based evapotranspiration reference (mm/day).
ETr = evapotranspiration reference on an alfalfa basis (mm/day).
2.10.2. Equations used in estimating water requirements for irrigation
The total daily water requirements for irrigation were estimated using the evaporation pot method according to the following equation [33]:
where:
GWR = ETc/(I-LR)Eff-r
GWR = (Kc ETo) ((I-LR) Eff-r)−1 = ((Kcb+Ke) (KpEpan)) ((I-LR) Eff-r)−1
GWR = Gross water requirements (mm/day).
Kcb = Basal coefficient of crop transpiration relative to the dry soil surface.
Ke = coefficient of evaporation from the soil surface.
Kp = evaporation pan coefficient.
Ep = evaporation from the evaporation pan over the period (mm/day).
LR = Leaching Requirement %.
Eff-r. = irrigation efficiency %.
2.11. Water Productivity Function (WPF)
The production functions were plotted with added water (AW) and with actual consumed water (ETa) to calculate the change in production per unit area with the addition of each unit of water:
Y = f (AW) Y = f (ETa)
2.12. Yield response factor for deficit irrigation (Ky)
The rate of yield decline when applying the deficit irrigation system was estimated from the equation [23]:
where:
1 − Ya/Ym = Ky (1 − ETa/ETm)
Ky = crop response constant to under-irrigation
Ya = actual yield (kg/ha)
Ym = maximum yield (kg/ha)
ETa = actual evapotranspiration (mm)
ETm = evaporation - maximum transpiration (mm)
2.13. Statistical analysis
The data was analyzed statistically by analysis of variance and comparison between the means using the Least Significant Difference (LSD) between these means, as explained by [34]. In addition, the Statistical Package for the Social Sciences (SPSS) program was used to compare the means. To evaluate the differences between the productivity of the comparison treatment (the productivity of the regular surface drip irrigation treatment by 100%) and other treatments, four statistical indicators were used, which are the mean square root according to [35], but with different meanings.
where:
Msi = productivity of other irrigation methods with different irrigation rates.
Mgi = 100% surface regular drip irrigation treatment yield.
N = is the number of measurement points
The RMS was also calculated according to the following equation as suggested by Loague and Green (1991):
where:
Mg = average year yield of a 100% surface regular drip irrigation treatment. It was calculated by the following equation:
RRMSE values less than 10 are considered to be excellent, 10 to 20 are good, 20 to 30 are acceptable, and greater than 30% are poor, i.e., the actual values are far from expected [36].
The residual mass coefficient (CRM) ([35] was calculated as follows:
Positive values of CRM mean that the productivity of the comparison treatment - standard - (the regular surface drip irrigation treatment of 100%) is the highest. In contrast, negative values mean that the productivity of the comparison treatment was the lowest. The value closest to zero for the CRM and RMSE indices means that the productivity of the two treatments is close while For R2 is the value closest to one.
3. Results
3.1. Crop evapotranspiration (ETc) and gross water requirement (GWR)
The experimental crop was irrigated by estimating the water requirements using the evaporation pan method as described by [32] as the main method, and the water requirements were estimated using the Penman-Monteith method to monitor and compare the amounts of irrigation water estimated by the first method. Table 3 shows the irrigation water used to irrigate the experimental crop.
3.2. Comparison of the average crop coefficient (Kc) of greenhouse cucumber according to the reference crop of alfalfa (ETr)
The cucumber crop coefficient (Kc) was estimated based on three reference estimations of evapotranspiration; crop evapotranspiration of alfalfa (ETr) at 0.5 m height, pan evaporation (Epan), and the FAO/Penman-Monteith method (ETo). Table 4 summarizes the statistical analysis of indoor cucumber crop coefficient values calculated according to the three mentioned methods for the winter and autumn seasons. Kc of autumn seasons was more typical than that of winter; it was noted that the indoor cucumber coefficient measured by the Epan and Penman-Monteith methods was higher than the one calculated by alfalfa, which was within around 1 in the midseason. The three calculation methods showed that all residual mass coefficient values gave a negative sign with all values of experiment crops in all seasons, while the Kc calculated by evaporation pan (Epan) was the highest.
3.3. Shoot measurements during the growth period
To shorten the number of readings and tables, the vegetation measurements were taken during the growth period based on the factors of irrigation level treatments during the summer and winter for comparison. The results showed that the stages of growth and fruiting of the indoor cucumber during the summer season were faster than during the winter season, as it yielded fruit after 35 days of sowing, while harvesting the fruits of the winter season (planting December 1) began after 55 days of sowing. Still, the productivity period was longer in the winter season. The measurements showed that vegetative growth is directly proportional to the irrigation levels, but the 50% irrigation treatment was more productive than the 100% irrigation treatment. The measurements showed that although the average height of greenhouse cucumber plants during winter was slightly longer than in summer, the total number of leaves was higher. However, the average area of leaves for plants during the summer season was more significant than the total area of leaves during the winter (Table 5).
3.4. Effect of irrigation system PRD and RDI on root depth, spread, and root size of greenhouse cucumber
The results of measurements of the average roots of five plants from each treatment (Figure 2) showed that the PRD-SB-150 and RDI-SB-150 treatments gave the highest root extension with the lowest root depth, while the PRD-S-75 treatment gave the most increased root depth then the RDI-SB-150 treatments. PRD-SB-75 and RDI-SB-75. As for the arid root system weights, the highest weight was for the PRD-S-150 treatment, followed by the roots of the RDI-S-150 and PRD-S-100 treatments. It is noted that the root weights of the PRD-S-50 and PRD-SB-50 treatments are higher than those of the RDI-50 and RDI-SB-50 systems by both surface and subsurface methods.
3.5. Effect of (PRD-S, PRD-SB, RDI-S, and RDI-SB) in the winter-spring seasons
The 100% productivity of the surface-regulated drip irrigation treatment was considered the basis for measuring the results of all treatments. The results of the statistical analysis using the residual mass coefficient CRM (Table 6 and Figure 3) showed that the productivity of greenhouse cucumber by the partial root-zone drying system using the PRD-SB subsurface irrigation method was higher than the rest of the treatments by 7.5% compared to the (standard) surface irrigation. And that this treatment PRD-SB was the highest yield when reducing the irrigation level to 75% and even to 50%, where the decrease in production was 9.6% and 19.5%, respectively, and that this method PRD-SB was superior to irrigation with surface dripping of the partial root-zone drying system PRD-S and CDI-S surface regular drip irrigation. However, this effect did not appear clear when increasing irrigation by 150% in the greenhouse during the winter season, and increasing the irrigation rate was not accompanied by an increase in production in all the treatments.
3.6. Comparison of water productivity functions (WPF) and yield response factors (Ky) in the winter and spring seasons
Experimental results showed that water productivity was high after applying the PRD-SB. Still, the water productivity decreased strongly with the increase in irrigation water, and the regular surface drip irrigation was more productive than the surface PRD-S irrigation system (Figure 4a). Irrigation curves from statistical analysis of multiple variances showed that the increase in irrigation water was highly negative for productivity, especially in the PRD irrigation system. Figure 4b shows that the values of the yield response factor to water stress (Ky) were less than “1” with all irrigation treatments used.
3.7. Effect of PRD-S, PRD-SB, RDI-S, and RDI-SB on irrigation efficiencies in the winter-spring seasons
Figure 5a,b show that increased irrigation rates has led to decreased water use efficiency (WUE) and irrigation water use efficiency (IWUE). Partial root-zone drying with the surface irrigation method in this experiment was the least efficient regarding irrigation water use efficiency. The results showed that it was similar among all treatments, with a slight increase in irrigation with the PRD-SB system.
3.8. Effect of PRD-S, PRD-SB, RDI-S, and RDI-SB in the summer-autumn seasons
According to the productivity of the 100% surface drip irrigation treatment as standard, the statistical analysis results by CRM residual mass coefficient were used to determine the extent of an increase or decrease in the productivity of any treatment over the standard treatment. The results of the statistical analysis using the residual mass coefficient CRM (Table 7 and Figure 6) showed that when the irrigation level was reduced to 75% and 50%, productivity did not decrease with that percentage in all treatments; the decrease was only by 1% and 11%, respectively, for CDI-SB subsurface irrigation (Table 7), and the lowest treatments with a reduction in the level of irrigation were PRD treatments. Both surface and subsurface types were 11% and 26% for surface irrigation and 8% and 18% for subsurface irrigation for irrigation levels of 75% and 50%, respectively. The results showed that an increase in productivity did not accompany the increase in irrigation, but, on the contrary, negatively affected the productivity of all treatments in varying proportions, especially those irrigated by PRD.
3.9. Comparison of water productivity functions (WPF) and yield response factor (Ky) summer-autumn seasons
Water productivity with PRD-S treatment was the lowest. PRD-SB, the best water productivity treatment, was received with regular sub-surface drip and surface irrigation systems. It was noted that the effect of increasing the irrigation water inside the greenhouse during the summer-autumn season was negative when using the sub-surface drip irrigation method, whether with the PRD system or with the traditional drip irrigation system (Figure 7a). Figure 7b shows the yield response factor (Ky) values to lack of irrigation are lower than one for the greenhouse cucumber crop during the summer, as was the case during the winter seasons.
3.10. Effect of PRD-S, PRD-SB, RDI-S, and RDI-SB on irrigation efficiencies in the summer and autumn seasons
Figure 8a,b show that the increase in irrigation rates led to a direct decrease in water use efficiency and irrigation water. The experiment results this season showed that the irrigation efficiency of the partial root-zone drying irrigation system using the surface drip irrigation method was the lowest. In contrast, the subsurface irrigation method was the most efficient in WUE and IWUE.
3.11. Effect of (PRD-S, PRD-SB, RDI-S, and RDI-SB) on open field cucumber yield
The results of the study showed that the productivity of cucumber in the open field by the subsurface drip irrigation method was superior to the productivity of the rest of the experimental treatments, whether by partial root-zone drying (PRD-SB) or by subsurface regular drip irrigation (RDI-SB) (as shown in Table 8 and Figure 9), as the productivity was not affected By reducing the level of irrigation to 75% and even maintaining an increase in productivity by 7% and 5% for PRD-SB and RDI-SB, respectively, with a slight decrease when reducing irrigation to 50% by rates of 14% and 18% for PRD-SB and RDI-SB, respectively. At the same time, the decline was apparent in surface drip irrigation, where it was 7 and 26% for partial root-zone drying (PRD-S) and 13 and 29% for regular surface drip irrigation (RDI-S) for treatments, 75% and 50%, respectively. It was observed that increasing the level of irrigation had a negative effect on the productivity of RDI treatments, but it was positive when irrigating with the PRD system.
3.12. Effect of the irrigation technique on water productivity function (WPF) and yield response factor (Ky) for cucumber in an open field
The results showed that the water productivity when irrigating cucumber in the open field using PRD-SB and then PRD-S irrigation systems was the highest compared to RDI-S and RDI-SB irrigation systems. Still, this productivity decreases at a greater rate with increasing levels of irrigation, especially with subsurface irrigation (PRD-SB) without the surface irrigation system (PRD-S), as it did not decrease as shown in the curves of the effect of irrigation water on productivity (Figure 10a). The study showed that the crop response factor to water stress (Ky) for outdoor cucumber values was lower than one, which means that the cucumber crop in the open field was not affected much by reducing irrigation water compared to the scheduled irrigation. However, the Ky values for regular drip irrigation subsurface were the lowest compared to the rest of the coefficients, as shown in Figure 10b.
3.13. Effect of the irrigation technique on irrigation efficiencies for cucumber in an open field
The results revealed that subsurface irrigation (PRD-SB and RDI-SB) treatments were the most efficient for irrigating outdoor cucumbers. Subsurface irrigation with a partial root-zone drying system (PRD-SB) was more efficient than the rest of the treatments than subsurface regular drip irrigation (RDI-SB). Figure 11a,b show that the increase in irrigation rates has led to a direct decrease in water use efficiency and irrigation water use.
4. Discussion
The amounts of water consumed in irrigation are consistent with what was found by [37] and [6,13], where the average water consumption of cucumber in greenhouses was 307 mm/season at a rate of 3.3 mm/day. At the same time, in the open field, it was 617 mm/season at a rate of 8 mm/day. The greenhouse and open-field cucumbers were 453 mm and 653 mm during the summer, respectively. However, these amounts of irrigation water were higher than what was concluded by [38] for the irrigation of greenhouse cucumber during the winter season (November to March), which was 238 mm/crop evapotranspiration season ETc, and also higher than what was found by [37] as well as [6,13], which was 204 mm during the winter season. However, it is less than the estimates of [39] that the drip irrigation water for greenhouse cucumber was at a rate of 2 L/plant/day for the control (i.e., 600 mm). These estimates were also in line with the calculations of [40] for the water requirements of greenhouse cucumber by shade nets from February to May, which amounted to 493.89 mm with a daily rate of 4 mm. The increase in crop water requirements in both the greenhouse and the open field might be related to the increase in temperature in the last 10 years as part of climate change, mainly in the arid regions.
The idea of using PRD as a tool to suggest water stress to plants to motivate them to conserve water stems from the observation that abscisic acid (ABA) produced by roots as a result was important in determining the opening and closing of stomata [41,42], and [43] showed that, in addition, there was a decrease in the concentration of cytokinins (zeatin and zeatin-riboside), which promote the growth of lateral buds and stimulate cell division, by 60, 50, and 70% in roots, apices of new shoots, and shoots, respectively. Also, the increase in ABA in drying roots and the decrease in cytokinin hormones with water availability in wet roots led to an increase in root depth [42,43]. The superiority of PRD in our findings is mainly during the winter and spring seasons due to the reasons mentioned above for using the PRD system.
The study results showed that PRD-SB treatment is the most effective treatment for increasing water use efficiency and productivity. It reached 54.7 kg m-3 in the greenhouse during the winter season and 16.1 kg m-3 in the open field, while during the summer season, the greatest effect of the RDI-SB treatment was in the greenhouse, where it reached 42.8 kg m-3. The study showed that the water use efficiency increased with the reduction of the irrigation level from 100% to 50%, from 45.6 and 33.3 kg m−3 to 67.8 and 54.5 kg m−3 during the winter and summer seasons, respectively, as well as in the open field from 12.7% to 18.4 kg m−3. The water productivity increased by reducing the irrigation level from 100% to 50% by 49%, 64%, and 45% in the winter and summer seasons and in the open field, respectively. These results are consistent with the findings of some previous studies [6,13]. They found that the water use efficiency of the greenhouse cucumber was 48.9, 52, 49, and 47.7 kg m-3 for the general average and for the summer, autumn, and winter seasons, respectively. While for the open fields they were 11.7, 9.3, and 14.4 kg m-3 for the general average and for the summer and autumn seasons, respectively.
The overall average production of indoor cucumber was 13.7, 14.6, 14.3, and 14.7 kg m−2 for the treatments PRD-S, PRD-SB, RDI-S, and RDI-SB, respectively. In open fields 6.3, 7.3, 5.8, and 6.6 kg m-2, these rates are consistent with the findings of previous studies [6,13], where [37] reported that the general average of production in the greenhouse was 150 tons/ha/season, where the productivity of cucumber was 174, 132, and 144 tons/ha/season for the summer, autumn, and winter seasons, respectively. While the average production in the open field was 72 tons/ha/season, the productivity was 64 and 80 tons/ha/season for the summer and autumn seasons, respectively.
5. Conclusion
The sub-surface irrigation method with the PRD system was superior in the winter season, with an average yield of 13.8 kg m−2 for the average of all irrigation levels. The RDI-SB technique yielded the highest summer yield, with an overall average of 16.1 kg m−2. At the same time, surface irrigation with the same system was the least efficient in the summer, as the PRD irrigation system was the least efficient in irrigating greenhouse cucumbers in all treatments. In contrast, the regular subsurface irrigation method was the most efficient, with a general average of 16.1 kg m−2. The results of the open field cucumber experiment showed that irrigation using the PRD-SB system is more efficient in irrigating available cucumber than regular irrigation. Regular subsurface irrigation was more efficient than surface irrigation in all treatments. The study showed that the application of the incomplete irrigation technique by reducing the level of irrigation to 50% was not accompanied by a similar decrease in productivity, as the percentage of deficiency was 24, 17, 27, and 23%, with an average of 23% during the winter season, and 22, 13, 16, and 6% with an average of 14% during the summer season for PRD-S, PRD-SB, RDI-S, and RDI-SB irrigation techniques, respectively. While the decrease in productivity ratios when reducing the level of irrigation to 75% was 14, 6, 14, and 8%, with a general average of 11% during the winter season, and 6, 3, zero, and -4% with an average of 1% for PRD-S, PRD-SB, RDI-S, and RDI-SB, respectively. The results also showed that irrigation with the PRD-SB system is the most productive in the open field at all levels of irrigation, with a general average of 7.3 kg m−2, and that the general average of the percentage decrease in productivity in all irrigation techniques compared to reducing the irrigation percentage to 50% and 75% is 22% and 3%, respectively. The study showed that irrigation efficiencies were higher when applying the sub-surface irrigation technique (PRD-SB) in winter. In contrast, applying the under-irrigation system (RDI-SB) in the summer season had the highest efficiency. The results showed that in terms of water use efficiency (WUE) and irrigation water use efficiency (IWUE), the PRD-SB technique was more efficient during the winter season, as it was 54.7 and 40.6 kg m−3 in WUE and IWUE, respectively, while the (RDI-SB) technique was the most efficient in WUE and IWUE during the summer season, as it was 42.8 and 31.8 kg m−3, respectively. In the open field, the RDI-SB treatment was the most efficient in terms of water use and irrigation water use efficiency, at 16.1 and 14.6 kg m−3, respectively. In terms of irrigation levels, the 50% irrigation level is the most efficient in terms of water use and irrigation water, as it was 67.8 and 53.5 kg m−3, respectively, during the winter season, while it was 54.5 and 43.3 kg m−3 during the summer season, and 18.4 and 14.6 kg-m−3 for open field for WUE and IWUE, respectively.
Acknowledgments
“The authors extend their appreciation to the Deputyship for Research and Innovation, Ministry of Education in Saudi Arabia for funding this research work through the project no. (IFKSUOR3–563).
Author Contributions
A.A. (Abdulrasoul Alomran) and I.L. (Ibrahim Louki); methodology,.: A.A. (Abdulrasoul Alomran) and I.L. (Ibrahim Louki); formal analysis, A.A. and I.L.;investigation, resources, data curation, I.L. (Ibrahim Louki) writing—original draft preparation, A.A. (Abdulrasoul Alomran) writing—review and editing final draft;; A.A. supervision A.A. (Abdulrasoul Alomran); project administration, All authors have read and agreed to the published version of the manuscript.
Funding
This research received no external funding.
Data Availability Statement
Data available by request from the authors.
Conflicts of Interest
The authors declare on conflict of interest.
References
- Bates, B.C.; Kundzewicz, Z.W.; Wu, S.; Palutikof, J.P. Climate Change and Water; IPCC Secretariat: Geneva, Switzerland, 2008. [Google Scholar]
- Elhani, S.; Haddadi, M.; Csákvári, E.; Zantar, S.; Hamim, A.; Villányi, V.; Douaik, A.; Bánfalvi, Z. Effects of partial root-zone drying and deficit irrigation on yield, irrigation water-use efficiency, and some quality traits of potato (Solanum tuberosum L.) under glasshouse conditions. Agricultural Water Management 2019, 224, 105745. [Google Scholar] [CrossRef]
- Umair, M.; Hussain, T.; Jiang Ahmad, A.; Yao, J.; Qi, Y.; Zhang, Y.; Min, L.; Shen, Y. Water-Saving Potential of Subsurface Drip Irrigation for Winter Wheat. Sustainability 2019, 11, 2978. [Google Scholar] [CrossRef]
- Du TKang SZhang, J.; Davies, W.J. The Journal of Experimental Botany. 2015, 66, 2253–2269. [CrossRef]
- Jovanovic Z and Stikic R. 2018. Partial Root-Zone Drying Technique: from Water Saving to the Improvement of a Fruit Quality. Front. Sustain. Food Syst. 1:3. [CrossRef]
- Al-Omran, A.M.; Louki1, I.I.; Aly, A.A.; Nadeem, M.E. Impact of Deficit Irrigation on Soil Salinity and Cucumber Yield under Greenhouse Condition in an Arid Environment. J. Agr. Sci. Tech. 2013, 15, 1247–1259. [Google Scholar]
- Dhaouadi, L. , H. Besser, N. kharbout, , A. Al-Omran, F. Wassar, M. Wahba, K. Yaohu, Y. Hamed . 2021. Irrigation Water Management for sustainable cultivation of date palm. Applied water Science. 11, 171 (2021). [CrossRef]
- Abolpour, B. Realistic evaluation of crop water productivity for sustainable farming of wheat in Kamin Region, Fars province, Iran. Agric. Water Manag. 2018, 195, 94–103. [Google Scholar] [CrossRef]
- Alhashimi, A., Abdulkreem, A., Hashem, M. H., Bakr, B. M., Fekry, W. M., F., H., Hamdy, A. E., Abdelraouf, R. E., & Fathy, M. (2023). Using Deficit Irrigation Strategies and Organic Mulches for Improving Yield and Water Productivity of Mango under Dry Environment Conditions. Agriculture, 13(7), 1415. [CrossRef]
- Yang, B., Fu, P., Lu, J. et al. Regulated deficit irrigation: an effective way to solve the shortage of agricultural water for horticulture. Stress Biology 2, 28 (2022). [CrossRef]
- English, M.J. 1990. Deficit irrigation. I: Analytical framework. J. Am. Soc. Civil Eng. USA.
- Geerts, S.; Raes, D. Deficit irrigation as on-farm strategy to maximize crop water productivity in dry areas. Agricultural Water Management 2009, 96, 1275–1284. [Google Scholar] [CrossRef]
- Al-Omran, A.M.; Louki, I.I.; Aly, A.A.; Al-Harbi, A.R.; Nadeem, M.E. Cucumber yield response to deficit irrigation at open field experiments on Riyadh, Saudi Arabia. Egyption Journal of Soil Science. 2012, 52, 403–415. [Google Scholar]
- Cabello, M., Castellanos, M., Romojaro, F., Martínez-Madrid, C., & Ribas, F. (2009). Yield and quality of melon grown under different irrigation and nitrogen rates. Agricultural Water Management, 96(5), 866-874. [CrossRef]
- Geerts, S., & Raes, D. (2009). Deficit irrigation as an on-farm strategy to maximize crop water productivity in dry areas. Agricultural Water Management, 96(9), 1275-1284. [CrossRef]
- Amorim, M., Toyosumi, I., Lopes, W., Camillo, L., Ferreira, L., Rocha Junior, D., Filho, W., Gesteira, A. Costa. M, & Filho, M. (2021) Partial rootzone drying and regulated deficit irrigation can be used as water-saving strategies without compromising fruit yield and quality in tropically grown sweet orange, The Journal of Horticultural Science and Biotechnology, 96:5, 663-672. [CrossRef]
- Al-Omran, A.M, I.I. Louki. and A. Alkhasha. 2023. Deficit Irrigation and Partial Root-Zone Drying Irrigation System in Arid Area. In Handbook of Irrigation Hydrology and Management (Eds. Eslamian and Eslamian). Pp 337-361. Wiley. New York. USA. [CrossRef]
- Hashem, M.S.; El-Abedin, T.Z.; Al-Ghobari, H.M. Assessing effects of deficit irrigation techniques on water productivity of tomato for subsurface drip irrigation system. Int J Agric & Biol Eng 2018, 11, 156–167. [Google Scholar]
- Qin, J., Ramírez, D. A., Xie, K., Li, W., Yactayo, W., Jin, L., R., Quiroz. 2018. Is Partial Root-Zone Drying More Appropriate than Drip Irrigation to Save Water in China? A Preliminary Comparative Analysis for Potato Cultivation. Potato Research. Volume 61, Issue 4, pp 391–406. [CrossRef]
- Ahmadi, S.H.; Agharezaee, M.; Kamgar-Haghighi, A.A.; Sepaskhah, R. Effects of dynamic and static deficit and partial root zone drying irrigation strategies on yield, tuber sizes distribution, and water productivity of two field grown potato cultivars. Agricultural Water Management 2014, 134, 126–136. [Google Scholar] [CrossRef]
- Playán, E.; Mateos, L. Modernization and optimization of irrigation systems to increase water productivity. Agric. Water Manag. 2006, 80, 100–116. [Google Scholar] [CrossRef]
- Cook, S., Gichuki, F., Turral, H. 2006. Water productivity: Estimation at plot, farm, and basin scale. Basin Focal Project Working Paper No. 2. Challenge Program on Water and Food, Colombo, SirLanka.
- Stewart, J.I., Cu, R.H., Pruitt, W.O., Hagan, R.M. & Tosso, J. 1977. Determination and utilization of water production functions for principal california crops. W-67 California Contributing Project Report. Davis, United States of America, University of California.
- FAO-66. 2012. Crop response factor, Food and Agriculture Organization, Rome, Italy.
- Moutonnet, P. 2000. Yield Response to Field Crops to Deficit Irrigation In Deficit irrigation practices. C. Kirda, P. Moutonnet, C. Hera and D.R. Nielsen (eds). Water Report #22 FAO, Rome.
- Giuliani, M.M., Nardella, E., Gagliardi, A., Gatta. G. 2017. Deficit Irrigation and Partial Root-Zone Drying Techniques in Processing Tomato Cultivated under Mediterranean Climate Conditions. Sustainability 2017, 9, 2197. [CrossRef]
- General presidency of Meteorology. 2018. Statistical report.
- Al-Omran, A.M.; Al-Ghobari, H.; Alazba, A. Determination of evapotranspiration of tomato and squash using lysimeters in central Saudi Arabia. International Agricultural Engineering Journal 2004, 13, 27–36. [Google Scholar]
- Louki, I.I.; Al-Omran, A.M. Calibration of Soil Moisture Sensors (ECH2O-5TE) in Hot and Saline Soils with New Empirical Equation. Agronomy 2023, 13, 51. [Google Scholar] [CrossRef]
- Louki, I.I., A.M. Al-Omran, A.A. Aly and A.R. Alharbi. 2019. Sensors Effectiveness for Soil Water Content Measurements under Normal and Extreme Conditions. Irrigation and Drainage Journal. 68:979-992. [CrossRef]
- Qu, F., Zhang, Q., Jiang, Z., Zhang, C., Zhang, Z., & Hu, X. (2022). Optimizing irrigation and fertilization frequency for greenhouse cucumber grown at different air temperatures using a comprehensive evaluation model. Agricultural Water Management, 273, 107876. (. [CrossRef]
- Allen, R.G., L. S. Pereira, D. Raes and M. Smith. 1998. Crop evapotranspiration guidelines for computing crop water requirements. FAO Irrigation and Drainage paper #56.
- Cuenca, R. 1989. Irrigation System Design: An Engineering Approach. Prentice Hall, New jersey, USA.
- Steel, R. G. and J. H. Torrie. 1982. “Principles and Procedures of Statistics”. 2nd Ed., McGraw Hill Book Company, New York, USA.
- Loague, K.; Green, R.E. Statistical and graphical methods for evaluating solute transport models: Overview and application. J. Contam. Hydrol. 1991, 7, 51–73. [Google Scholar] [CrossRef]
- Despotovic, M.; Nedic, V.; Despotovic, D.; Cvetanovic, S. Evaluation of empirical models for predicting monthly mean horizontal diffuse solar radiation. Renewable and Sustainable Energy Reviews 2016, 56, 246–260. [Google Scholar] [CrossRef]
- Louki, I. I.. 2011. Effect of Deficit Irrigation on Cucumber Yield in Greenhouses and Open Field in Thadiq Governorate, Riyadh Region. Master of Science Thesis from the Department of Soil Sciences - College of Food and Agricultural Sciences, King Saud University, Riyadh, Saudi Arabia.
- Nikolaou, G. , Neocleous, D. , Katsoulas, N., and Kittas C. 2019. Irrigation of Greenhouse Crops. Horticulturae 2019, 5, 7. [Google Scholar] [CrossRef]
- Abdul Hakkim, V.M. and Jisha Chand, A.R. 2014. Effect of Drip Irrigation Levels on Yield of Salad Cucumber under Naturally Ventilated Polyhouse. IOSR Journal of Engineering (IOSRJEN), ISSN (e): 2250-3021, ISSN (p): 2278-8719 Vol. 04, Issue 04 (April. 2014), ||V5|| PP 18-21.
- Gadge, S.B.; Gorantiwar, S.D. Yield Response of Drip Irrigated Cucumber to Mulch and Irrigation Regimes under Different Shading Net. International Journal of Current Microbiology and Applied Sciences 2017, 6 162-167, ISSN: 2319-7706.
- Loveys, B.R. Abscisic acid transport and metabolism in grapevine (Vitis vinifera L.). New Phytologist 1984, 98, 575–582. [Google Scholar] [CrossRef]
- Dry, P. R, Loveys, B.R.; Düring, H. Partial drying of the root-zone of grape. 2. Changes in the pattern of root development. Vitis 2000, 39, 9–12. [Google Scholar]
- Stoll, M.; Loveys, B.; Dry, P. Hormonal changes induced by partial root zone drying of irrigated grapevine. Oxford Journals Life Sciences Journal of Experimental Botany 2000, 51, 1627–1634. [Google Scholar]
Figure 1.
General scheme of root zone partial drying system treatments and deficit irrigation. whereas: PRD = partial root-zone drying irrigation with two double lines and four irrigation levels; RDI = Single Line, Deficit Drip Irrigation System.; RFI = Full Drip Irrigation, or RFI; 100, 75, 50, and 150 = irrigation parameters of 100%, 75%, 50%, and 150% of the prescribed irrigation water, respectively; Control: irrigated by conventional standard irrigation method (100% surface normal drip irrigation).; S = surface drip irrigation.; SB = subsurface drip irrigation.
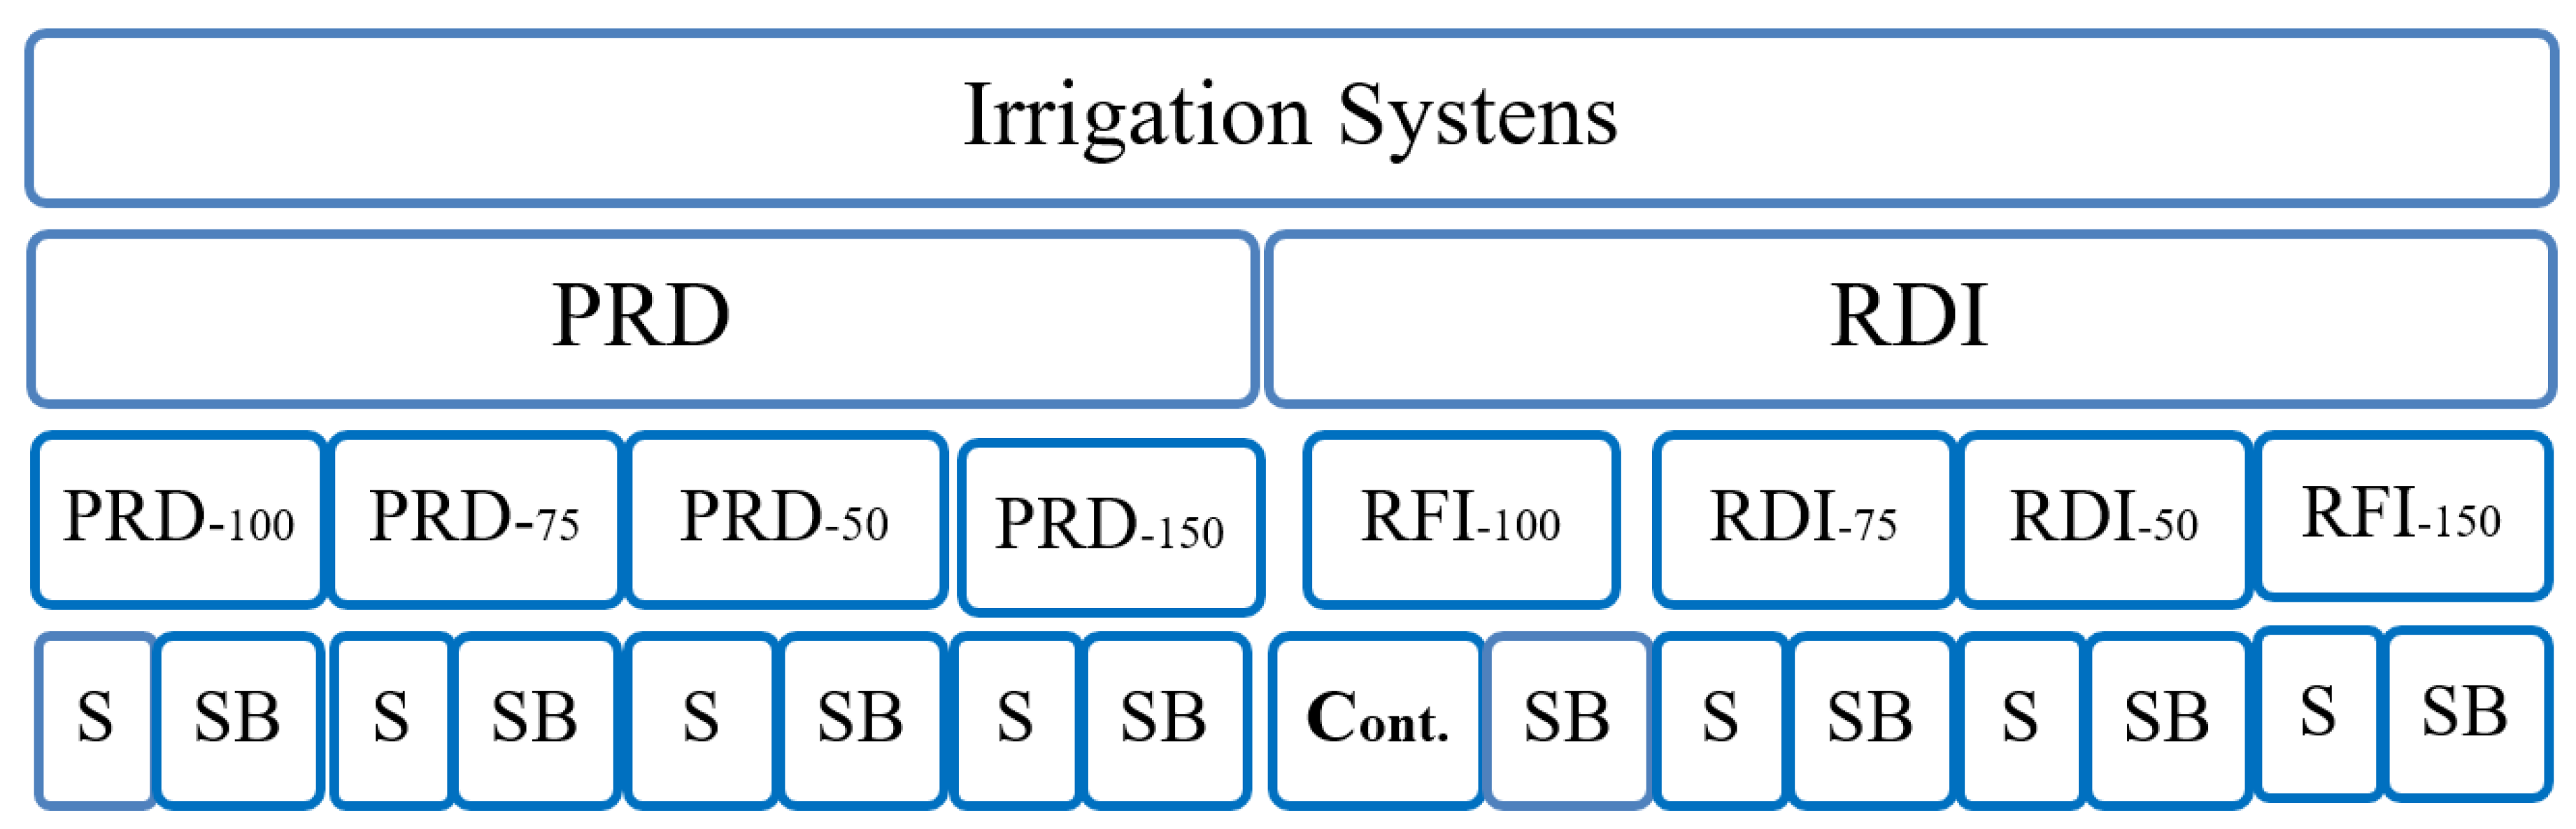
Figure 2.
Effect of the treatments on weight, extension, and depth of the roots of the experimental crop (mean of five plants).
Figure 2.
Effect of the treatments on weight, extension, and depth of the roots of the experimental crop (mean of five plants).
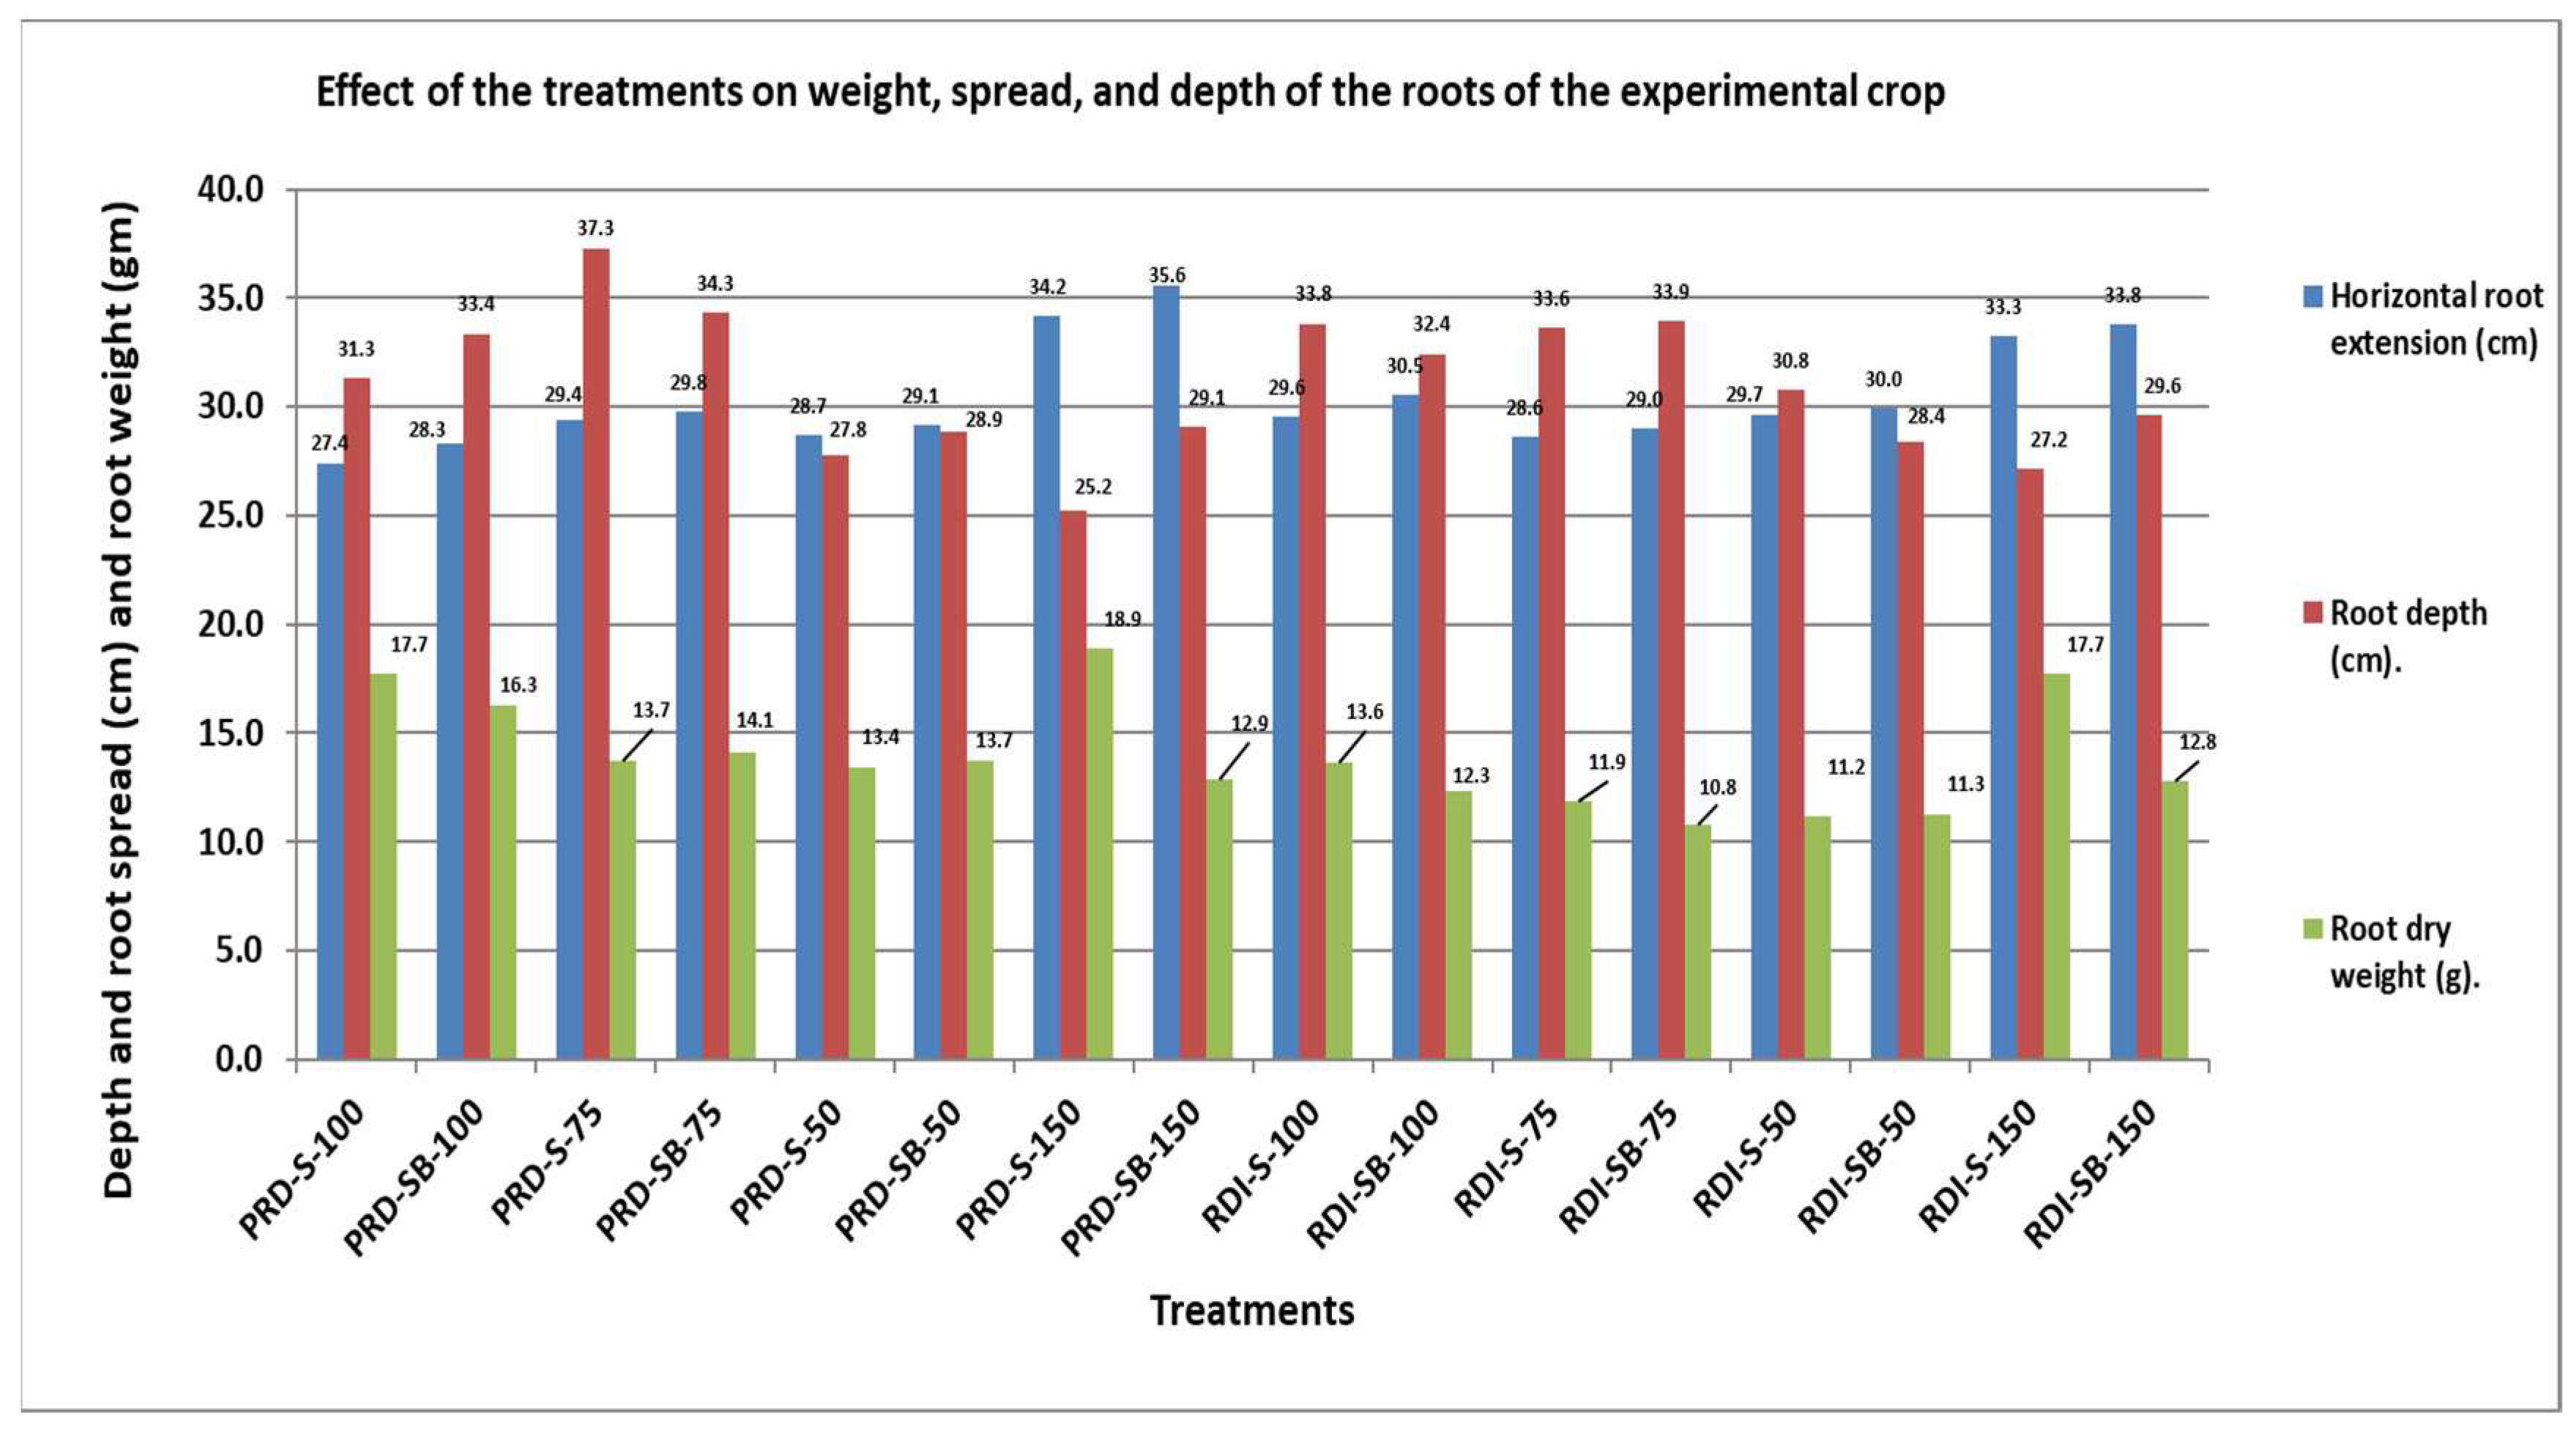
Figure 3.
Effect of partial root-zone drying, regular deficit irrigation, and excess irrigation by surface and sub-surface drip irrigation method on the productivity of greenhouse cucumber in the winter-spring seasons.
Figure 3.
Effect of partial root-zone drying, regular deficit irrigation, and excess irrigation by surface and sub-surface drip irrigation method on the productivity of greenhouse cucumber in the winter-spring seasons.
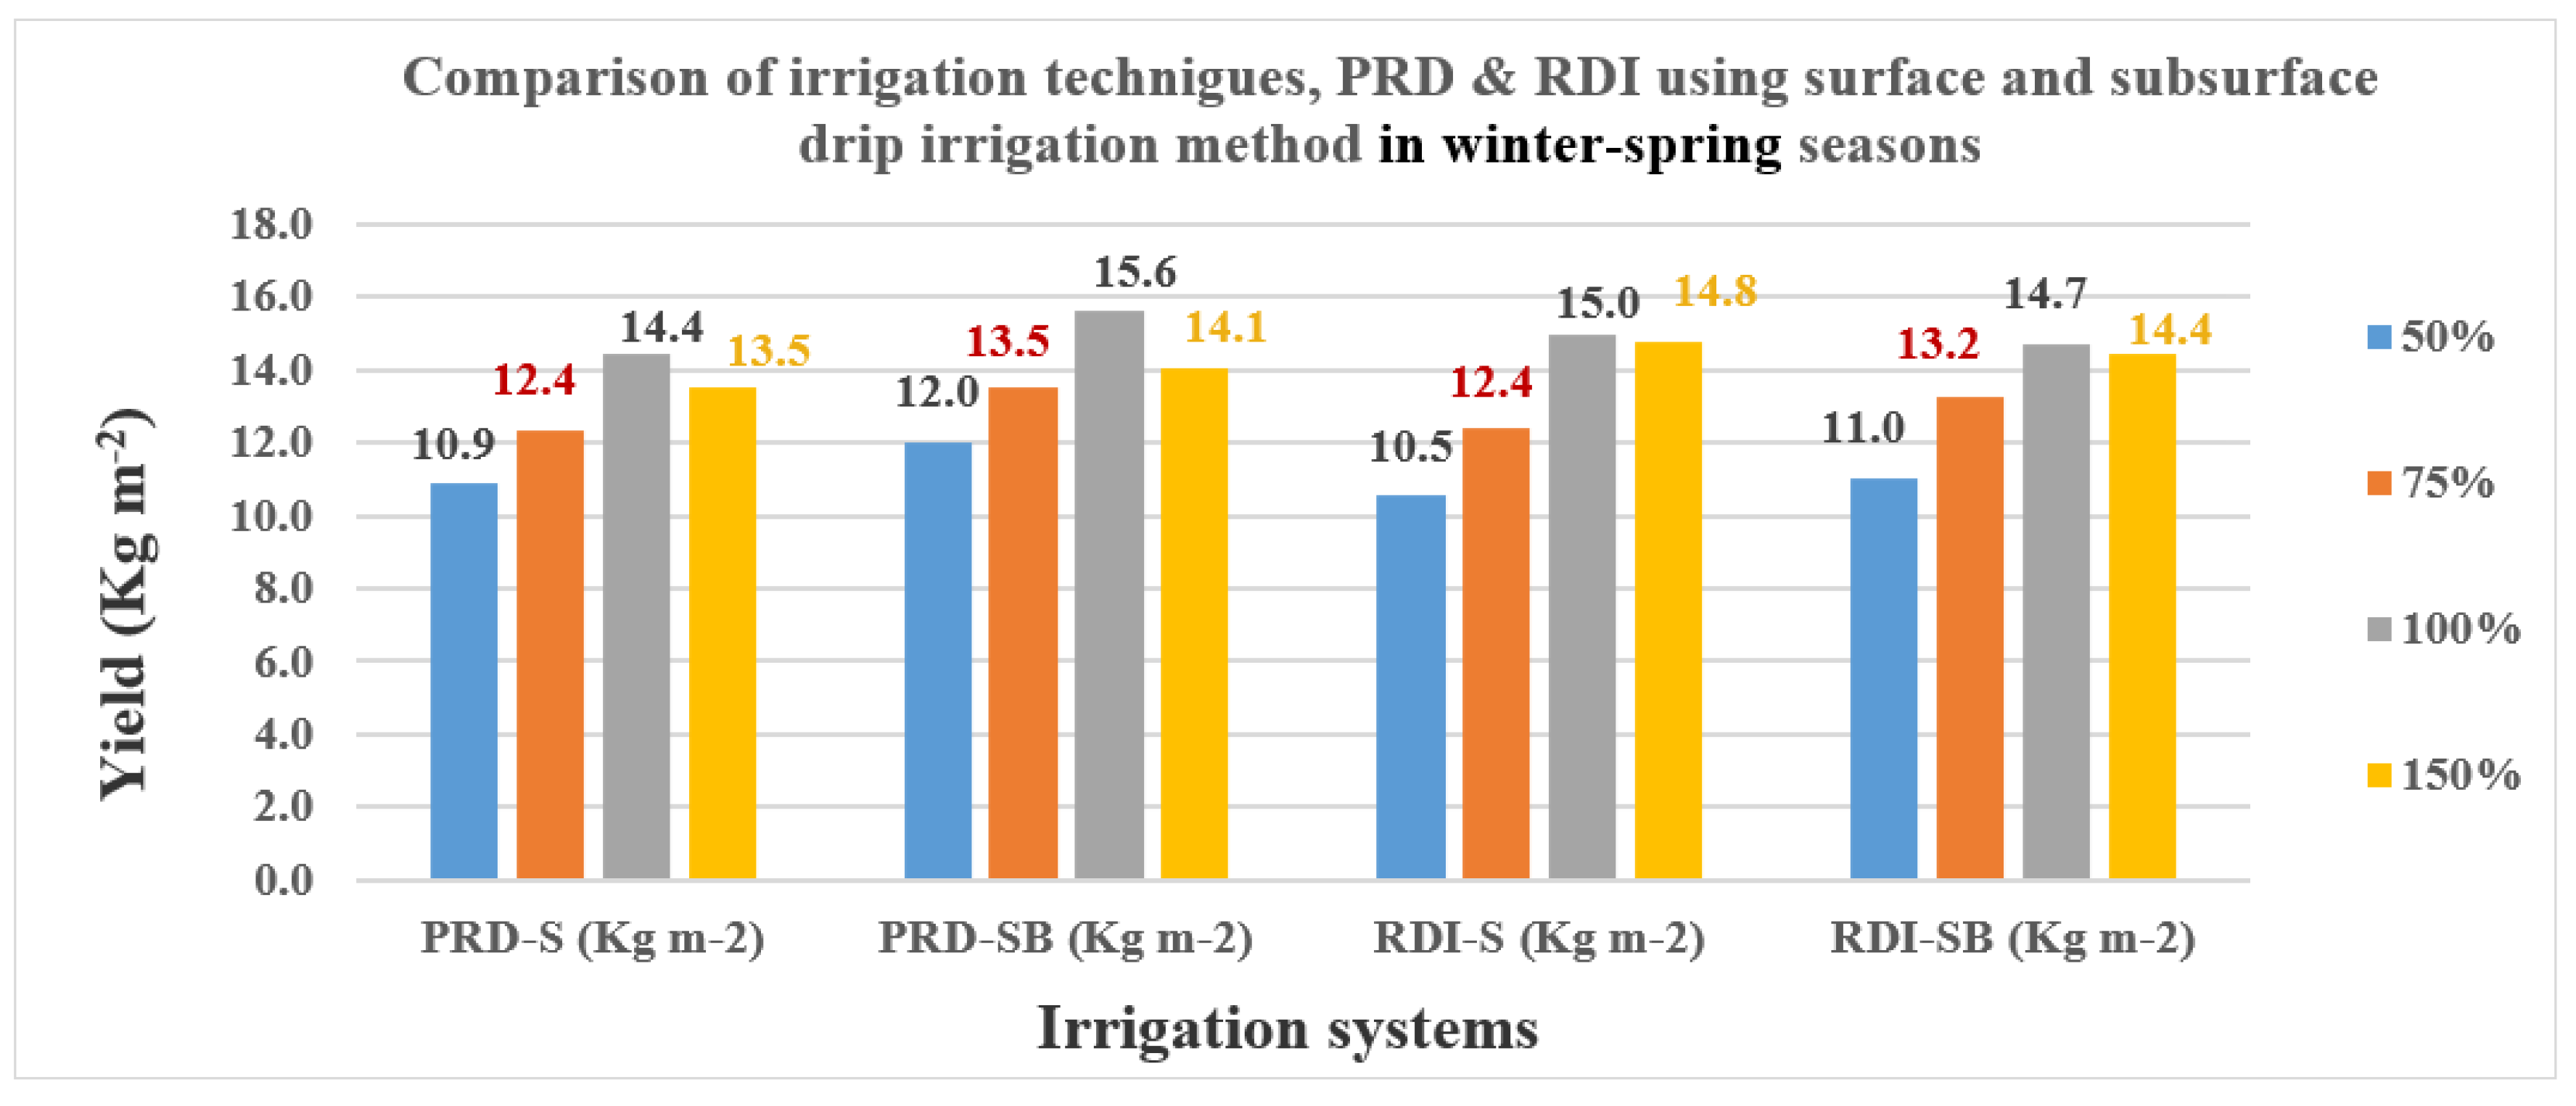
Figure 4.
Comparison of the effect of irrigation systems (PRD-S, PRD-SB, RDI-S, and RDI-SB) on water productivity functions (a) and yield response factor to water stress (b).
Figure 4.
Comparison of the effect of irrigation systems (PRD-S, PRD-SB, RDI-S, and RDI-SB) on water productivity functions (a) and yield response factor to water stress (b).
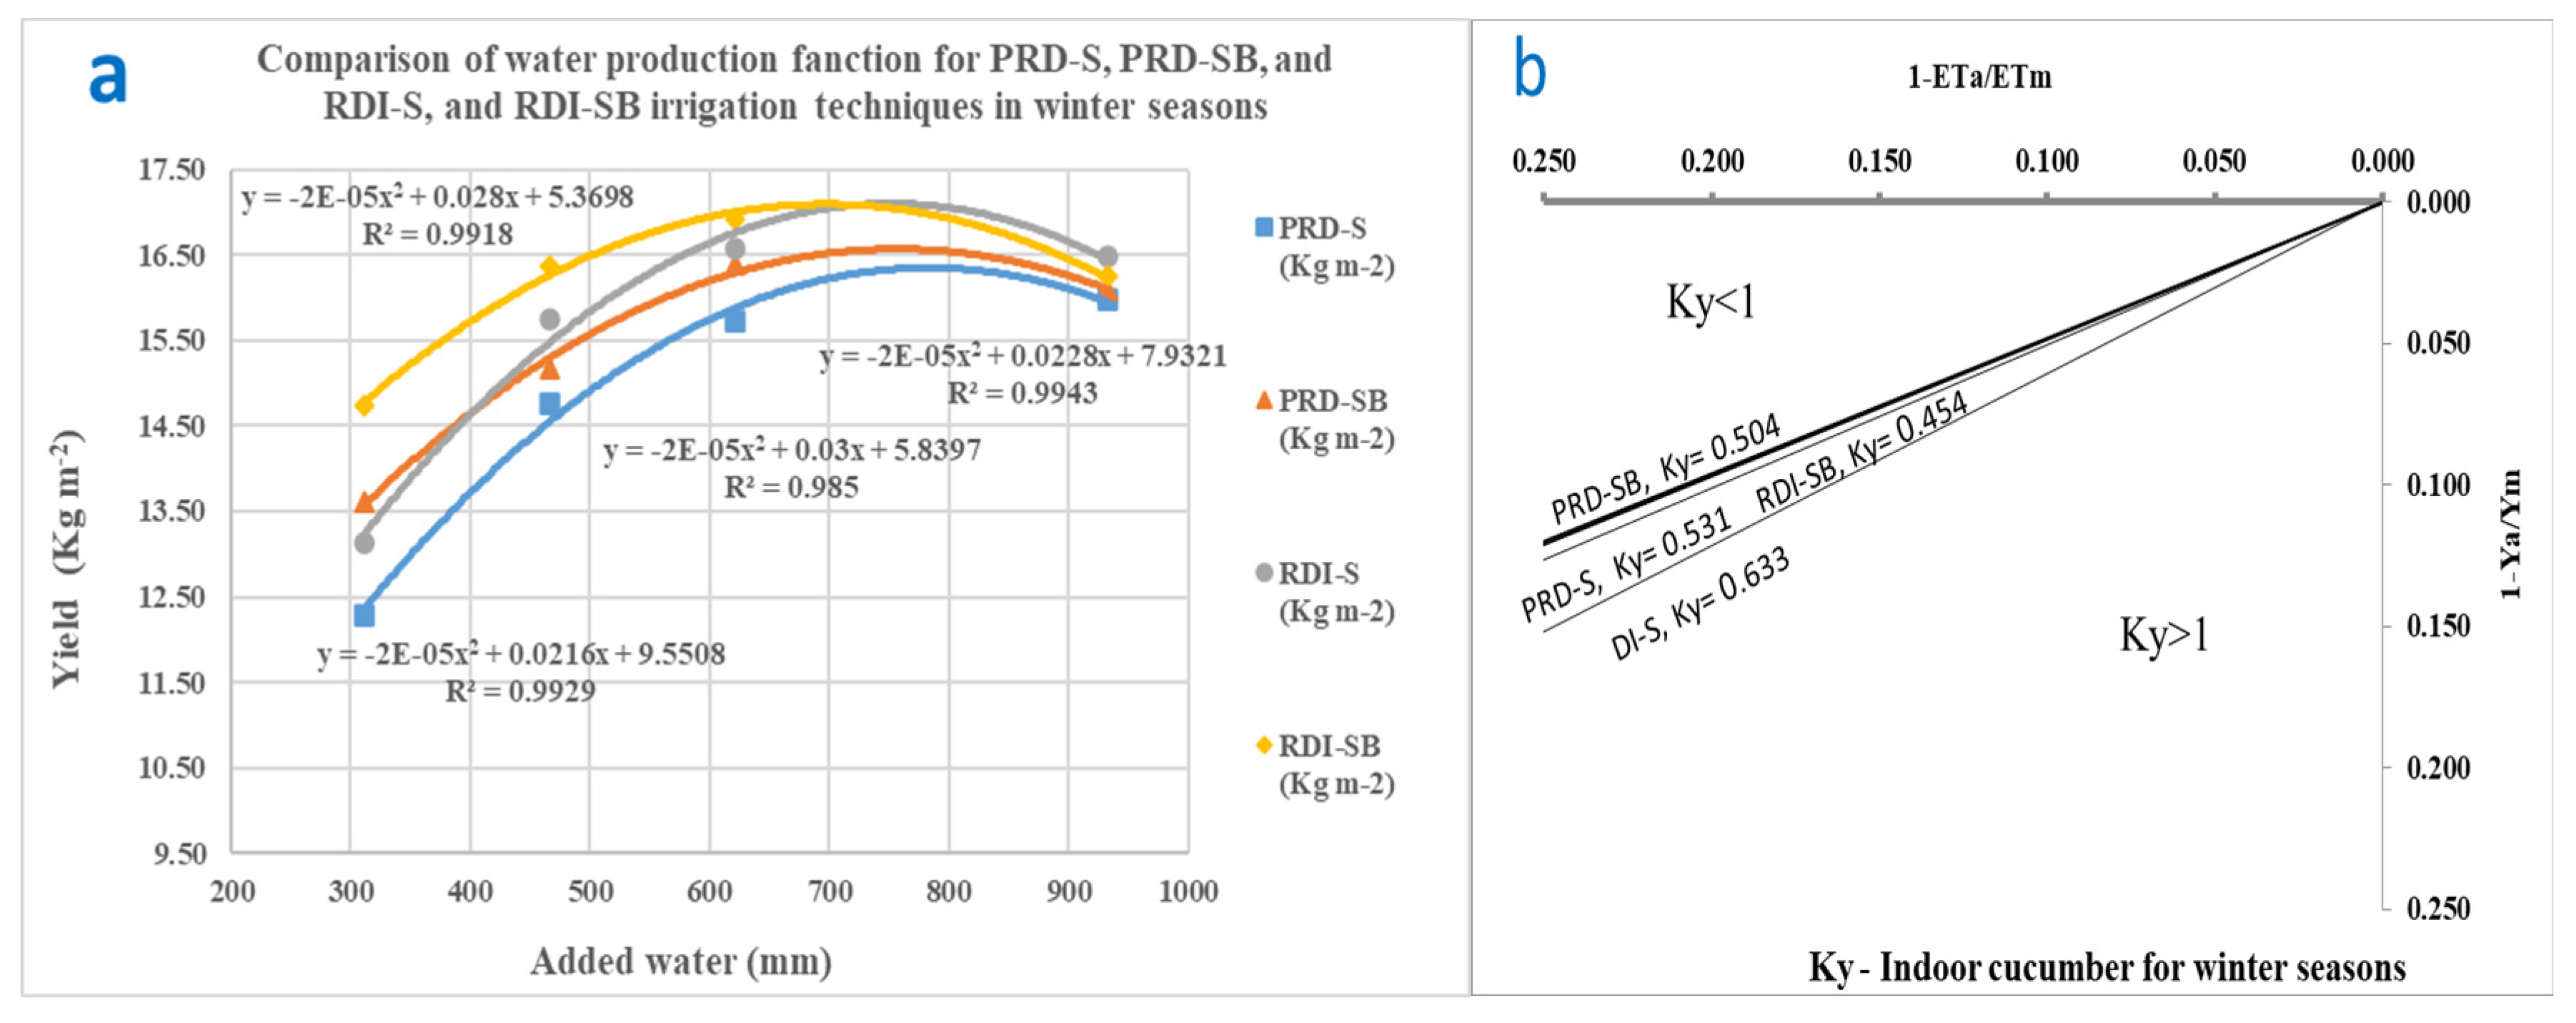
Figure 5.
The effect of applying PRD-S, PRD-SB, RDI-S, and RDI-SB irrigation techniques on water use efficiency (a) and irrigation water use efficiency (b) during the winter-spring seasons.
Figure 5.
The effect of applying PRD-S, PRD-SB, RDI-S, and RDI-SB irrigation techniques on water use efficiency (a) and irrigation water use efficiency (b) during the winter-spring seasons.
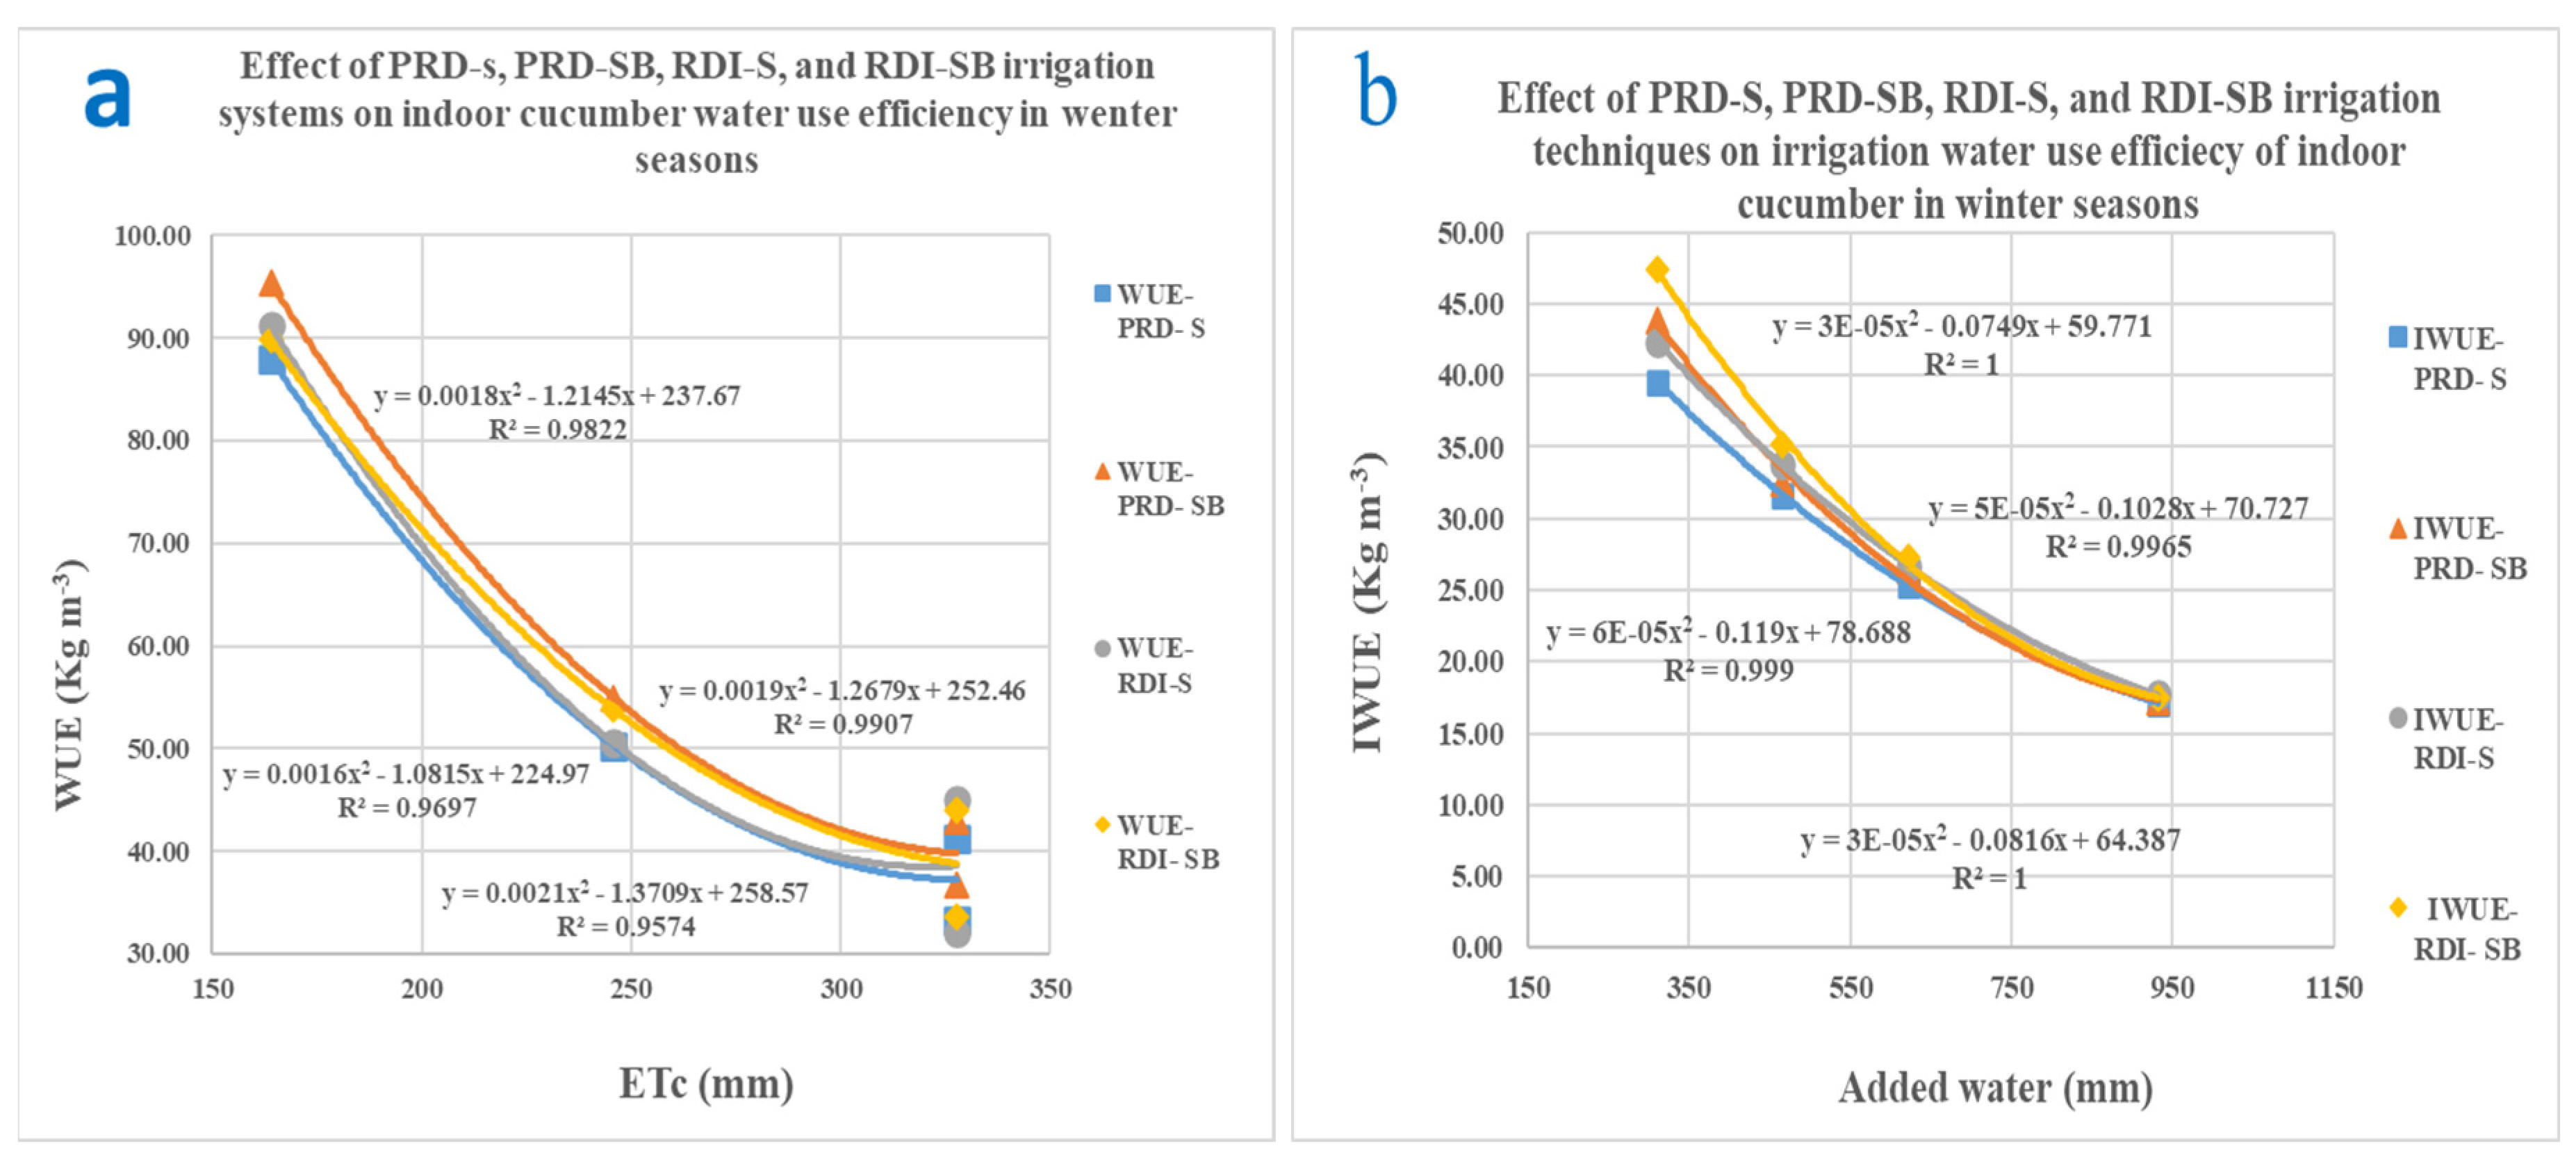
Figure 6.
Effect of irrigation system with partial root-zone drying, regular deficit irrigation, and excess irrigation by surface and sub-surface drip irrigation method on the productivity of greenhouse cucumber in the summer-autumn seasons.
Figure 6.
Effect of irrigation system with partial root-zone drying, regular deficit irrigation, and excess irrigation by surface and sub-surface drip irrigation method on the productivity of greenhouse cucumber in the summer-autumn seasons.
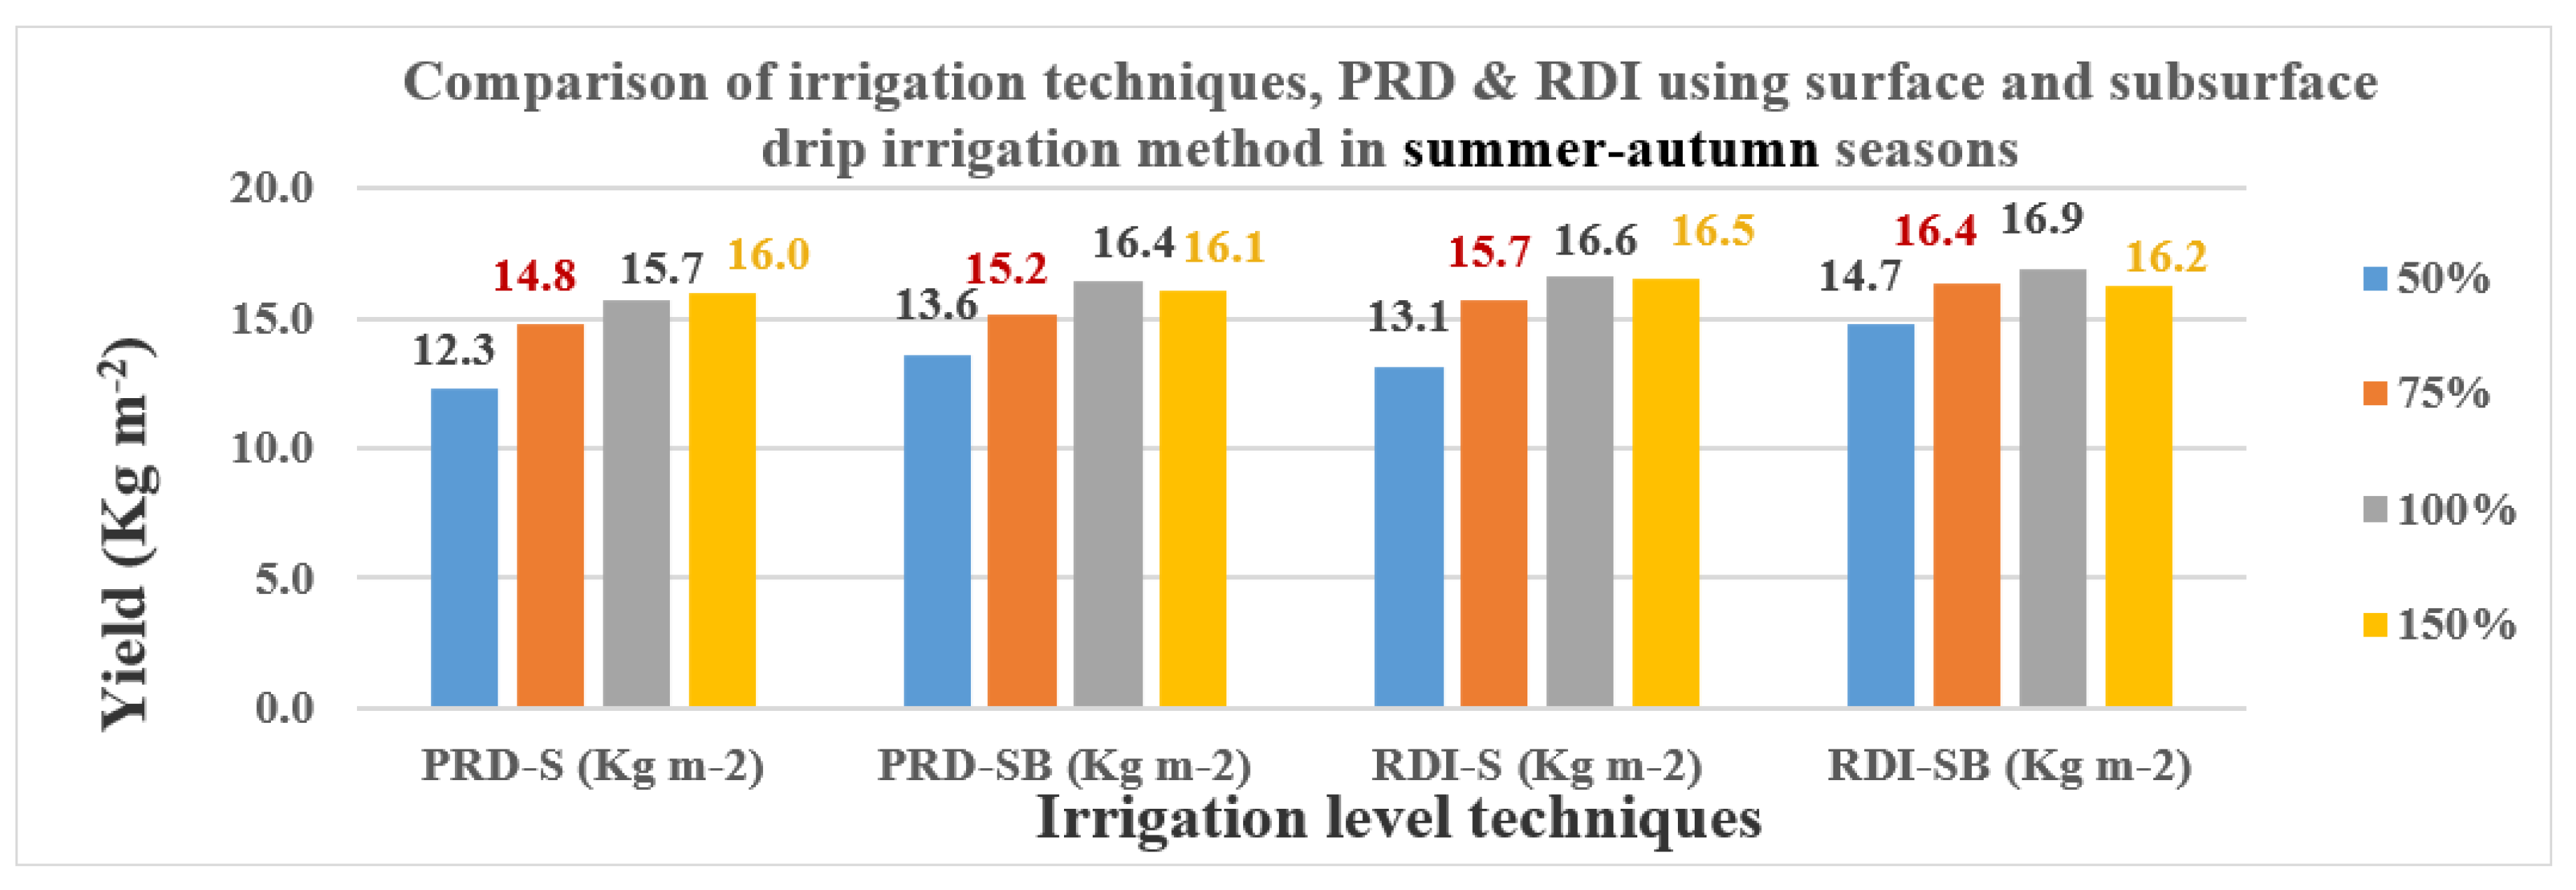
Figure 7.
Comparison of the effect of irrigation systems (PRD-S, PRD-SB, RDI-S, and RDI-SB) on water productivity functions (a) and yield response factor to water stress (b).
Figure 7.
Comparison of the effect of irrigation systems (PRD-S, PRD-SB, RDI-S, and RDI-SB) on water productivity functions (a) and yield response factor to water stress (b).
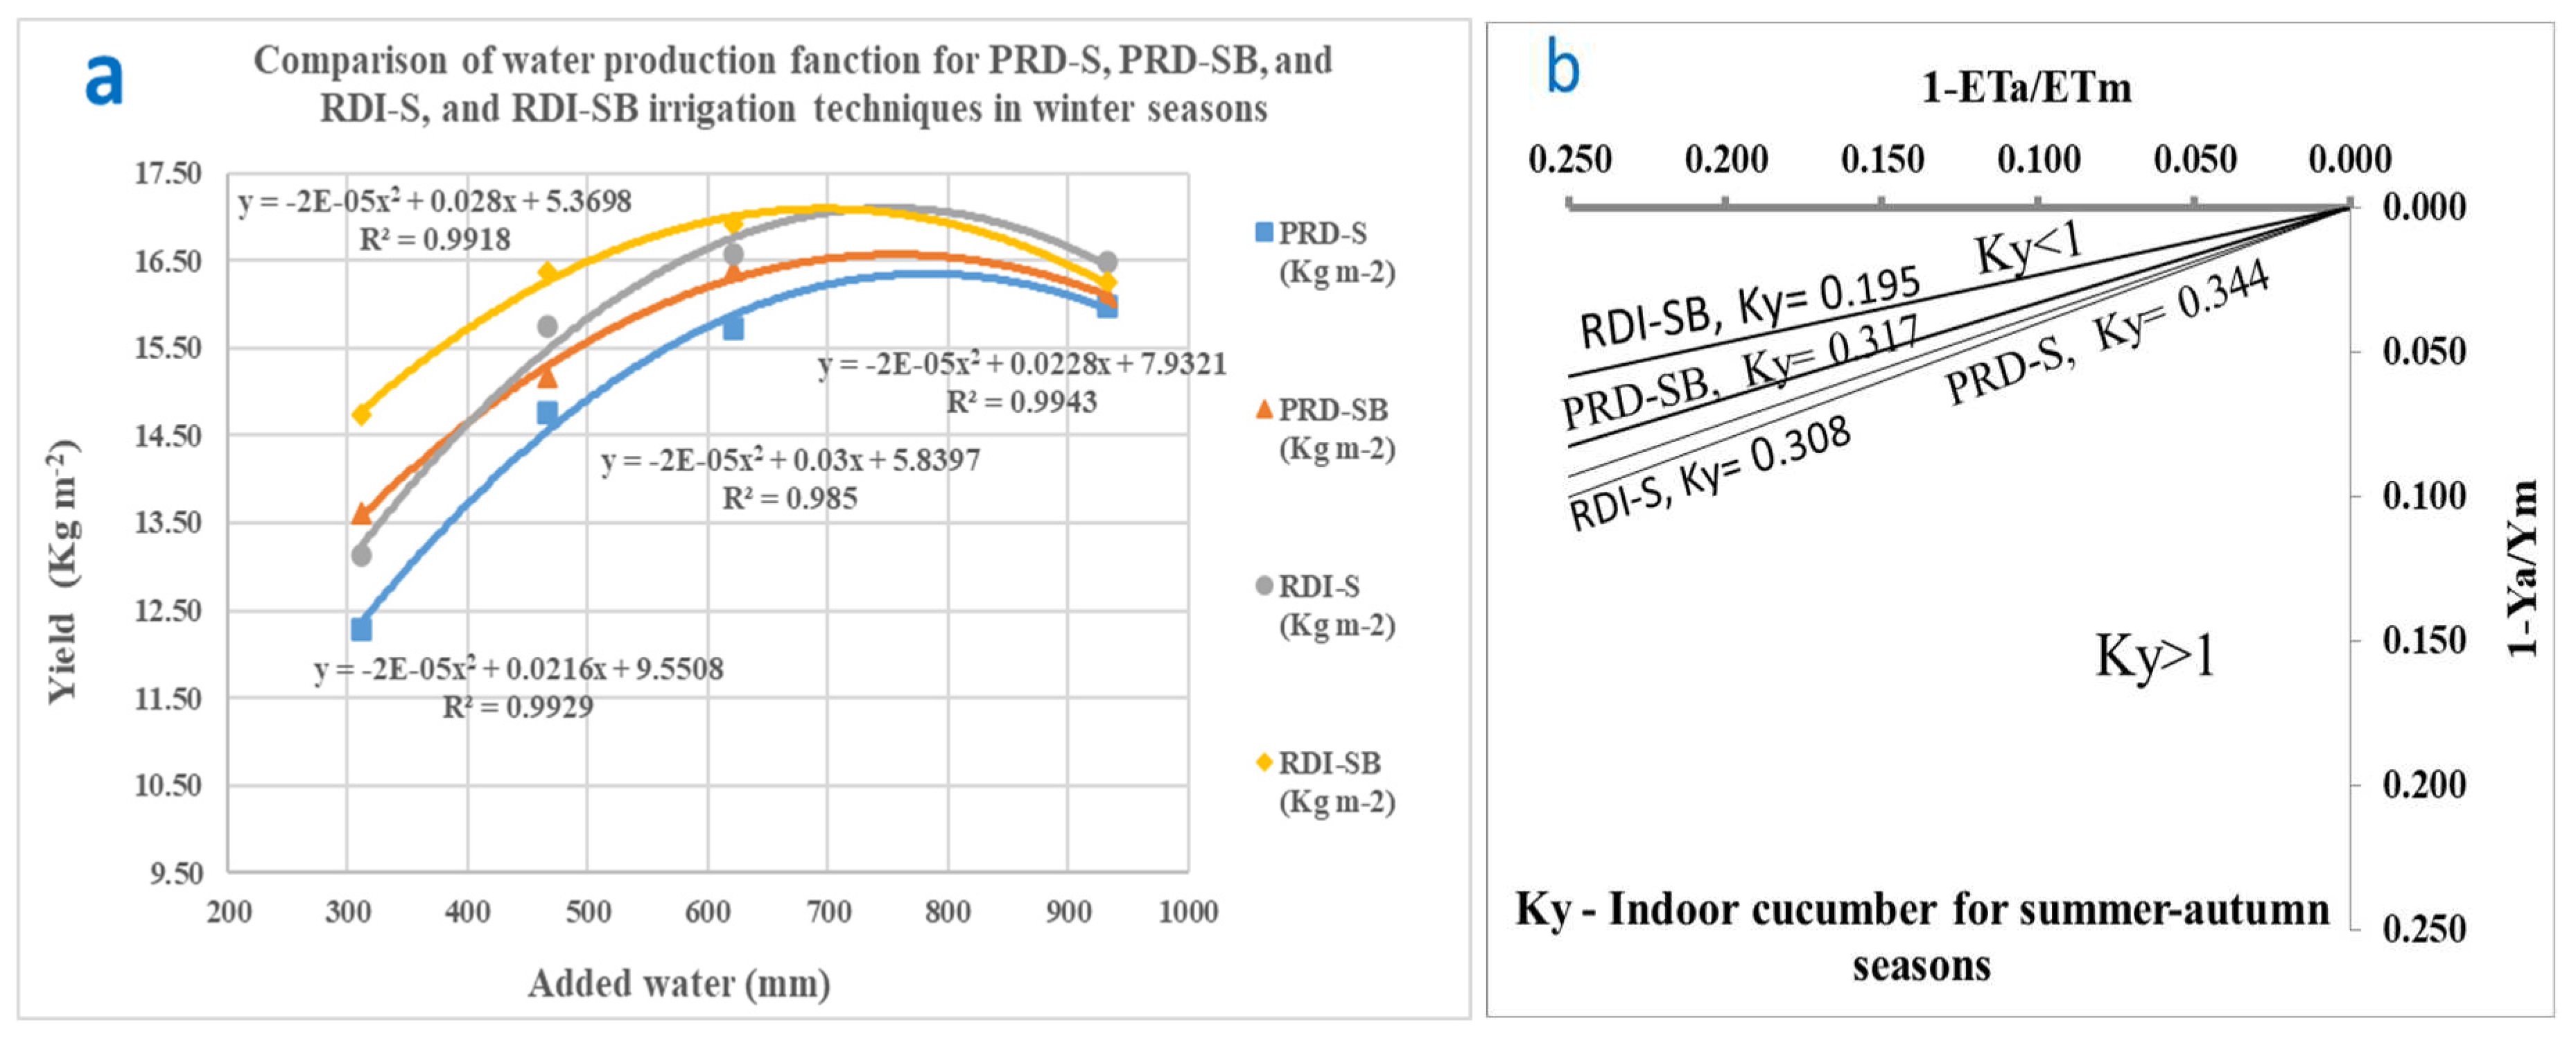
Figure 8.
Showing the effect of applying PRD-S, PRD-SB, RDI-S, and RDI-SB irrigation techniques on water use efficiency (a) and irrigation water use efficiency (b) during the summer-autumn seasons.
Figure 8.
Showing the effect of applying PRD-S, PRD-SB, RDI-S, and RDI-SB irrigation techniques on water use efficiency (a) and irrigation water use efficiency (b) during the summer-autumn seasons.
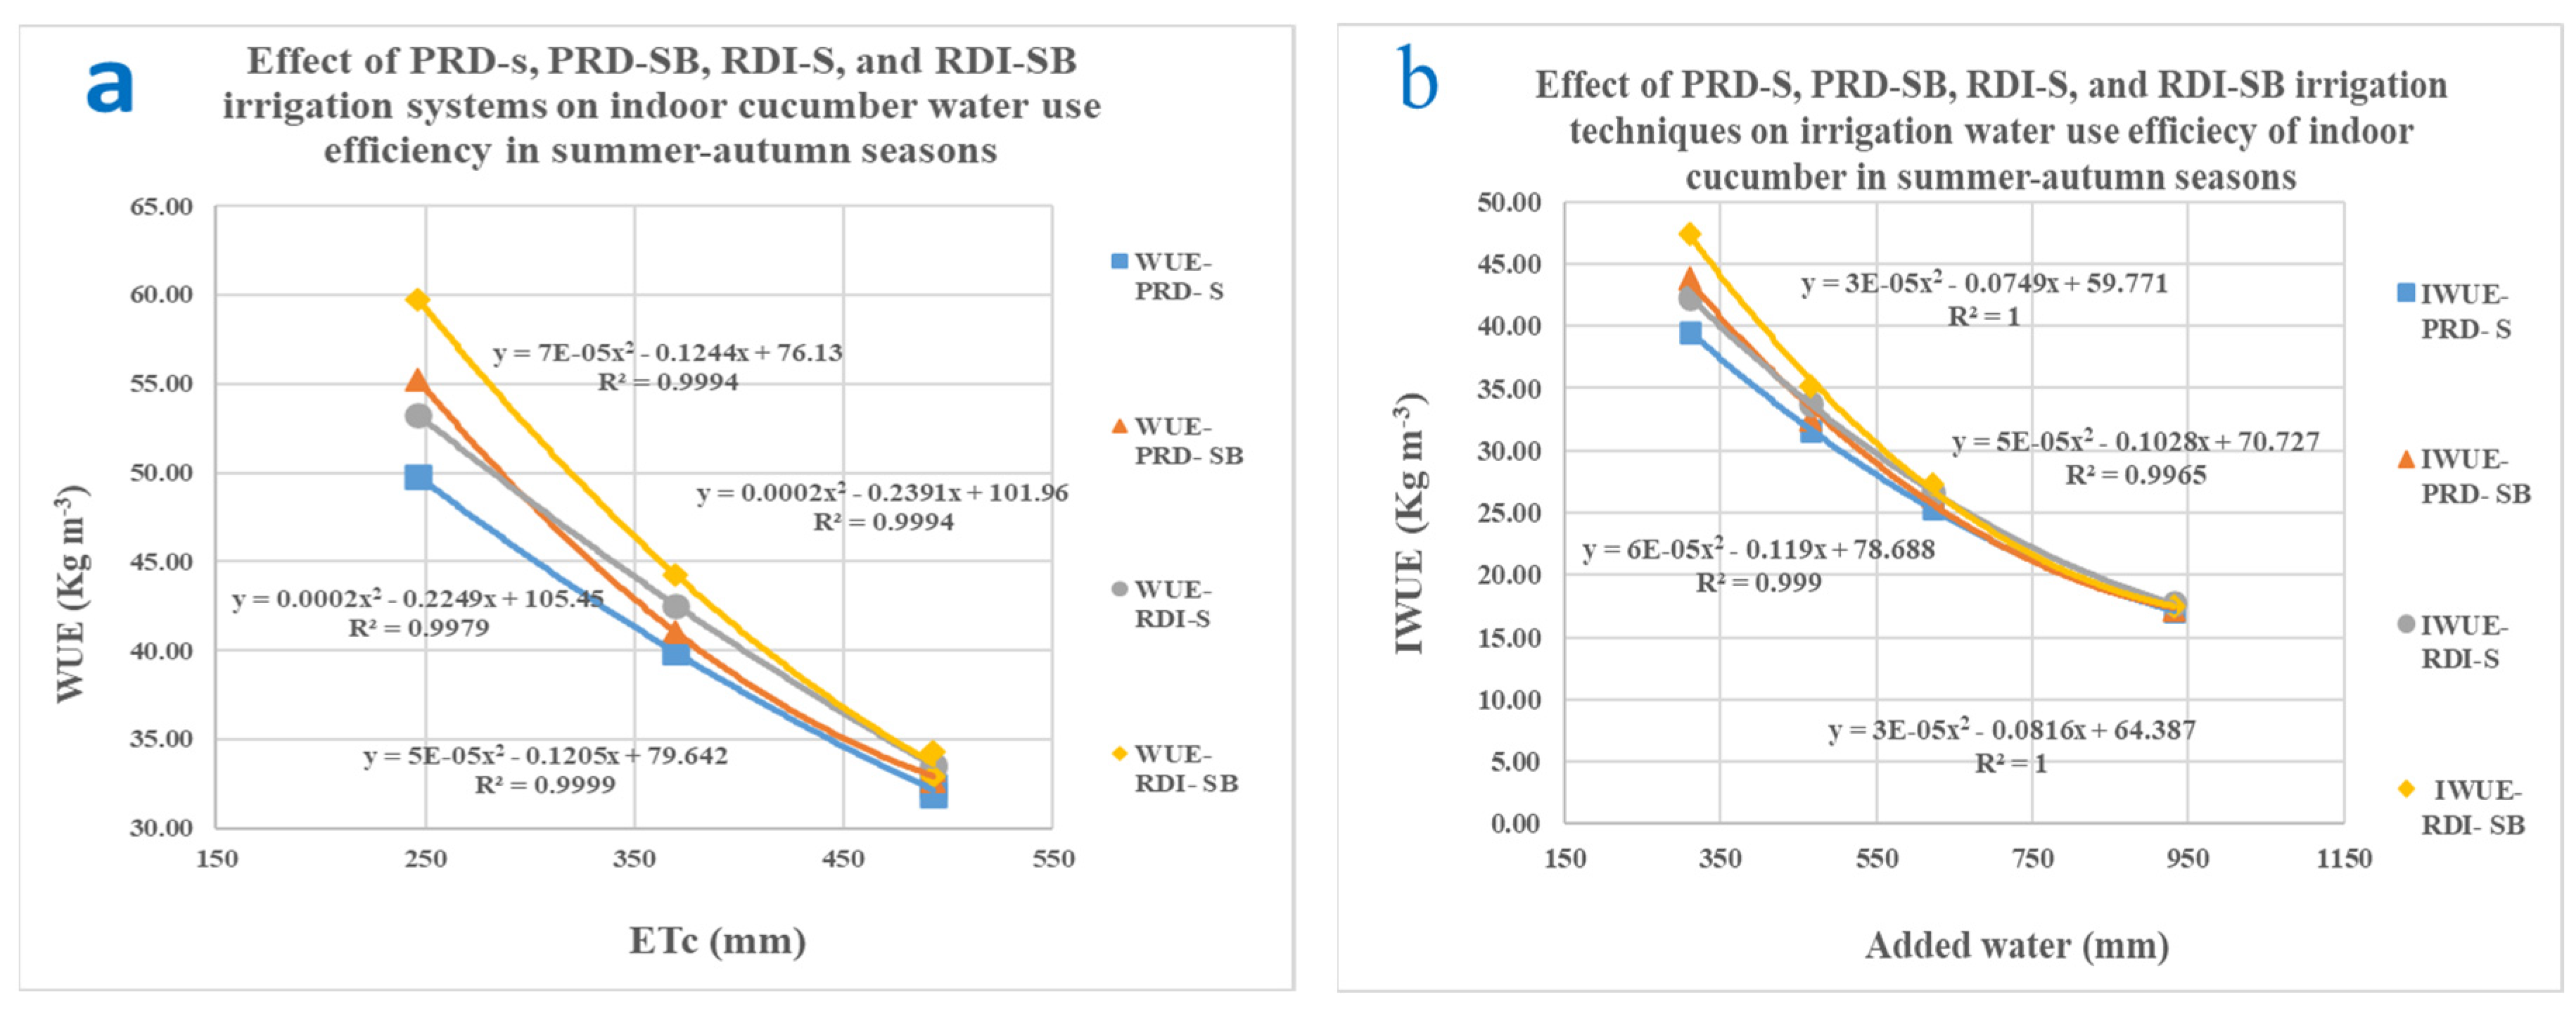
Figure 9.
Effect of an irrigation system with partial root-zone drying, regular deficit irrigation, and excess irrigation by surface and sub-surface drip irrigation methods on the productivity of outdoor cucumber (mean of the spring and autumn seasons).
Figure 9.
Effect of an irrigation system with partial root-zone drying, regular deficit irrigation, and excess irrigation by surface and sub-surface drip irrigation methods on the productivity of outdoor cucumber (mean of the spring and autumn seasons).
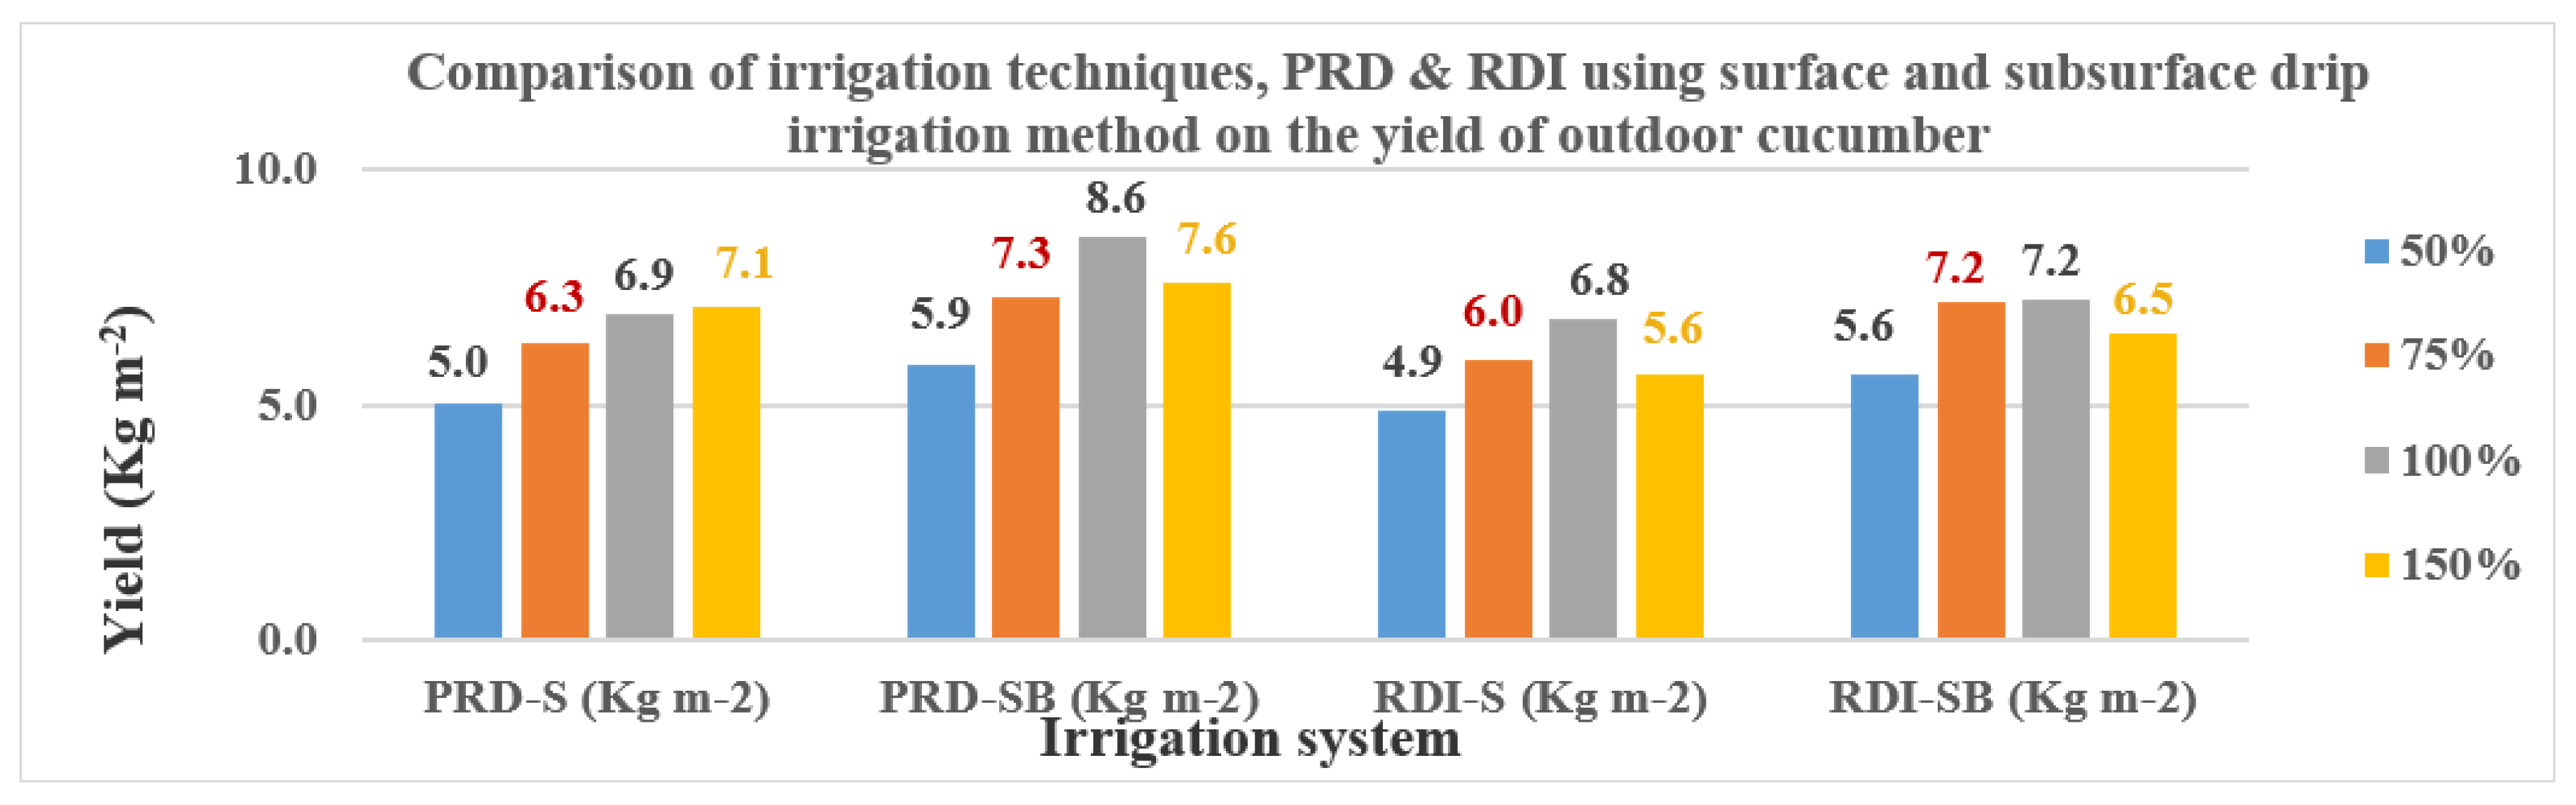
Figure 10.
Comparison of the effect of irrigation systems (PRD-S, PRD-SB, RDI-S, and RDI-SB) on water productivity functions (a) and yield response factor to water stress (b) on indoor cucumber.
Figure 10.
Comparison of the effect of irrigation systems (PRD-S, PRD-SB, RDI-S, and RDI-SB) on water productivity functions (a) and yield response factor to water stress (b) on indoor cucumber.
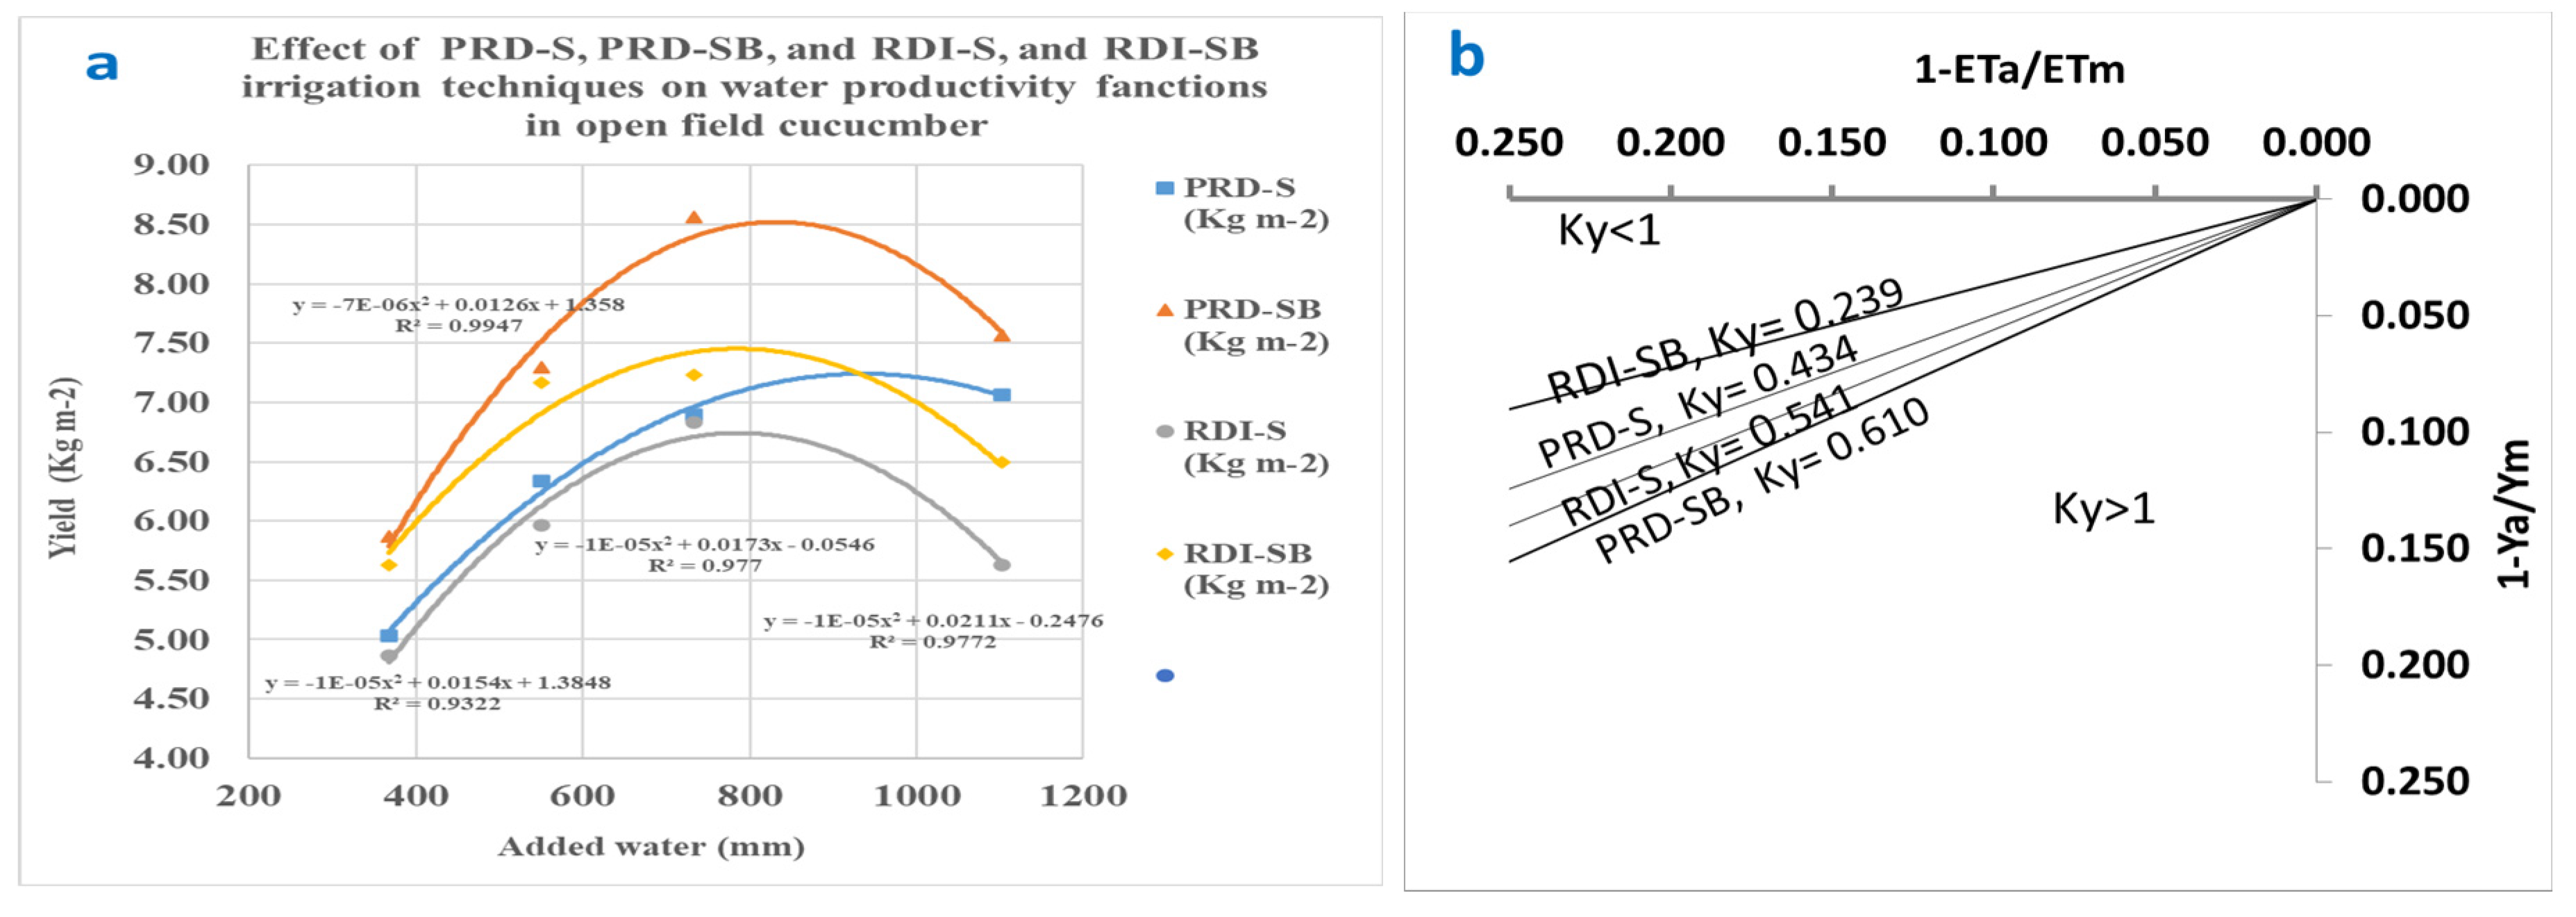
Figure 11.
Showing the effect of applying PRD-S, PRD-SB, RDI-S, and RDI-SB irrigation technique on water use efficiency (a) and irrigation water use efficiency (b) during the summer-autumn seasons.
Figure 11.
Showing the effect of applying PRD-S, PRD-SB, RDI-S, and RDI-SB irrigation technique on water use efficiency (a) and irrigation water use efficiency (b) during the summer-autumn seasons.
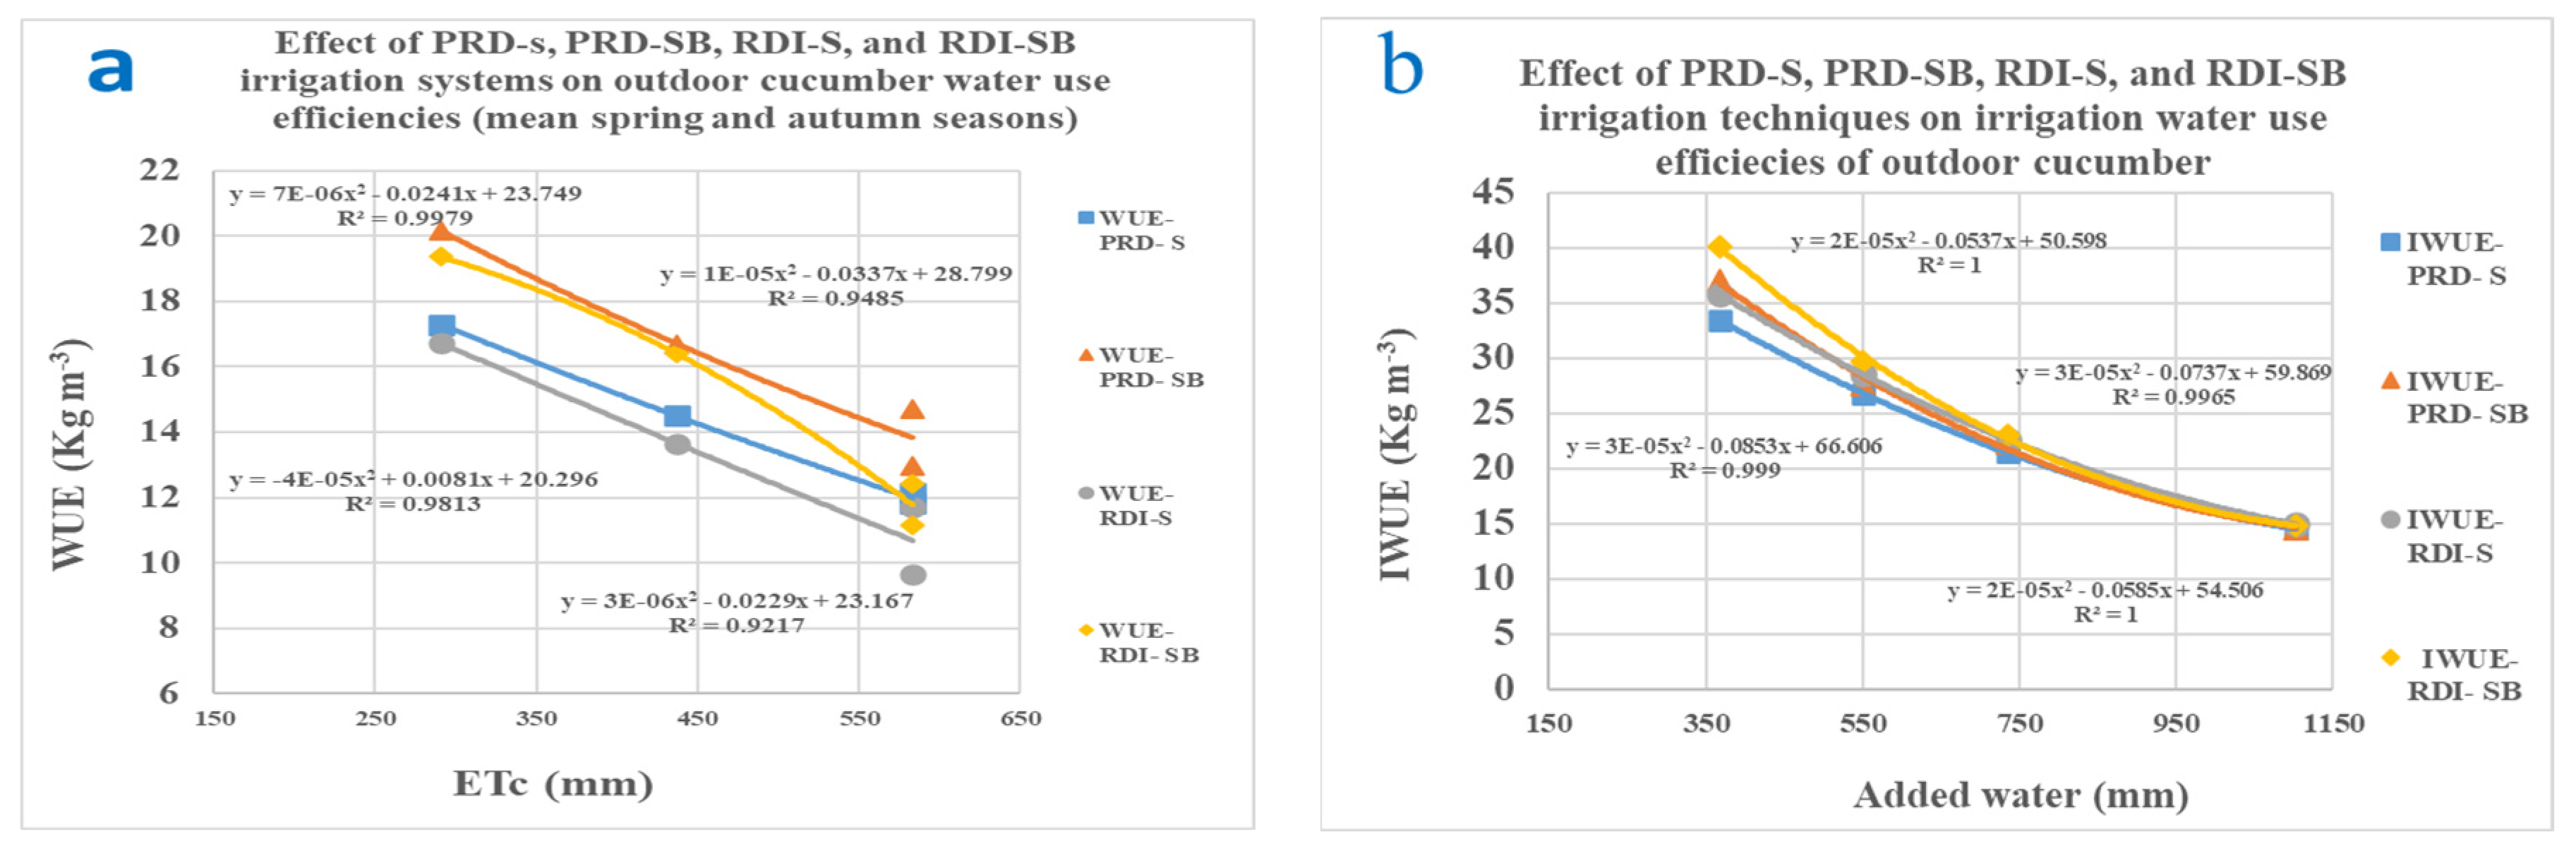

Table 1.
The average climatic conditions prevailing in the experimental region during the years 2005–2018.
Table 1.
The average climatic conditions prevailing in the experimental region during the years 2005–2018.
| № | Months | Temperature °C | Relative Humidity % | Wind speed at 2 m | Evaporation | vapor pressure mean | Soil Temperature | Radiation | Hour of sunshine | Rainfall | ||||
|---|---|---|---|---|---|---|---|---|---|---|---|---|---|---|
| Max. | Min | Mean | Max. | Min | Mean | m s−1 | mm | h.pa | °C | Langley day−1 | h day−1 | mm | ||
| 1 | January | 7.4 | 19.8 | 13.9 | 28 | 67 | 48 | 2.9 | 4.0 | 7.2 | 14.9 | 236 | 6.8 | 6.8 |
| 2 | February | 9.8 | 23.2 | 16.8 | 26 | 57 | 39 | 3.3 | 5.9 | 7.2 | 16.8 | 318 | 7.4 | 13.1 |
| 3 | March | 14.4 | 29.3 | 21.2 | 18 | 46 | 34 | 3.3 | 7.9 | 7.4 | 20.3 | 358 | 7.4 | 6.6 |
| 4 | April | 19.7 | 34.6 | 26.5 | 17 | 46 | 31 | 3.5 | 10.6 | 9.2 | 26.0 | 399 | 7.7 | 12.9 |
| 5 | May | 24.9 | 40.1 | 31.6 | 13 | 31 | 21 | 3.4 | 13.6 | 8.0 | 30.4 | 429 | 8.5 | 2.2 |
| 6 | June | 26.7 | 43.0 | 34.1 | 10 | 22 | 15 | 3.3 | 15.1 | 5.9 | 32.5 | 473 | 10.1 | 0.0 |
| 7 | July | 28.1 | 44.0 | 35.4 | 10 | 21 | 14 | 3.3 | 15.2 | 7.2 | 34.2 | 457 | 9.9 | 0.0 |
| 8 | August | 27.8 | 44.3 | 35.1 | 11 | 25 | 17 | 2.9 | 14.3 | 7.4 | 34.7 | 442 | 10.2 | 0.0 |
| 9 | September | 24.3 | 40.9 | 31.7 | 12 | 28 | 19 | 2.5 | 11.7 | 7.1 | 32.6 | 401 | 9.6 | 0.0 |
| 10 | October | 19.0 | 35.6 | 27.0 | 16 | 38 | 25 | 2.2 | 9.0 | 7.5 | 27.1 | 354 | 8.6 | 0.5 |
| 11 | November | 13.8 | 27.8 | 20.8 | 27 | 61 | 40 | 2.6 | 5.8 | 9.2 | 20.0 | 284 | 6.9 | 11.3 |
| 12 | December | 8.3 | 22.4 | 15.7 | 25 | 64 | 47 | 2.7 | 4.0 | 7.7 | 15.6 | 237 | 6.4 | 7.6 |
Table 2.
(a). Physical and mechanical analysis of experimental soils. (b) Routine analysis of saturated soil paste extract. (c). Some facilitating nutrients in experimental soils. (d) Chemical properties of irrigation water.
Table 2.
(a). Physical and mechanical analysis of experimental soils. (b) Routine analysis of saturated soil paste extract. (c). Some facilitating nutrients in experimental soils. (d) Chemical properties of irrigation water.
| (a) | |||||||||||||||||||||||||||||||||||||
| Sample Site № | Bulk Density g.cm−3 | CaCO3 % | O.M% | Sand% | Silt% | Clay% | Soil Texture | (PS%) Soil Saturation P. | |||||||||||||||||||||||||||||
| 3 | 1.59 | 17.15 | 0.30 | 89.10 | 5.00 | 5.90 | Loamy Sand | 23.5 | |||||||||||||||||||||||||||||
| 4 | 1.55 | 17.65 | 0.65 | 81.40 | 11.25 | 7.35 | Loamy Sand | 25.9 | |||||||||||||||||||||||||||||
| 5 | 1.57 | 19.40 | 0.75 | 83.20 | 8.75 | 8.05 | Loamy Sand | 25.2 | |||||||||||||||||||||||||||||
| (b) | |||||||||||||||||||||||||||||||||||||
| Sample Site № | pH | EC (dS m−1) | Cations (meq L−1) | Anions (meq L−1) | SAR | ||||||||||||||||||||||||||||||||
| Na+1 | K+1 | Ca+2 | Mg+2 | HCO3−1 | Cl−1 | SO4−2 | |||||||||||||||||||||||||||||||
| 3 | 7.9 | 2.9 | 8.8 | 1.2 | 12.7 | 8.3 | 3.1 | 11.5 | 15.5 | 2.9 | |||||||||||||||||||||||||||
| 4 | 8.2 | 1.5 | 3.3 | 0.8 | 5.2 | 6.6 | 2.4 | 3.4 | 10.0 | 1.5 | |||||||||||||||||||||||||||
| 5 | 7.4 | 3.9 | 11.2 | 1.8 | 16.0 | 12.0 | 3.5 | 18.0 | 18.5 | 3.1 | |||||||||||||||||||||||||||
| (c) | |||||||||||||||||||||||||||||||||||||
| Sample Site № | N (mg kg−1) | P (mg kg-1) | K (mg kg−1) | Fe (mg kg−1) | Zn (mg kg−1) | Mn (mg kg−1) | Cu (mg kg−1) | Mo (mg kg−1) | |||||||||||||||||||||||||||||
| 3 | 5.5 | 3.2 | 17.3 | 3.689 | 0.582 | 0.845 | 0.189 | 0.409 | |||||||||||||||||||||||||||||
| 4 | 16.3 | 94.0 | 103.0 | 13.440 | 6.348 | 3.299 | 0.951 | 0.475 | |||||||||||||||||||||||||||||
| 5 | 17.3 | 28.5 | 167.5 | 9.588 | 4.532 | 2.942 | 1.370 | 0.421 | |||||||||||||||||||||||||||||
| (d) | |||||||||||||||||||||||||||||||||||||
| Sample Site № | pH | EC (dS m−1) | TDS (ppm) | Cations (meq L−1) | Anions (meq L−1) | NO3-N (ppm) | SAR | ||||||||||||||||||||||||||||||
| Na+1 | K+1 | Ca+2 | Mg+2 | HCO3−1 | Cl−1 | SO4−2 | SAR | ||||||||||||||||||||||||||||||
| 1 | 7.6 | 1.6 | 1024 | 4.33 | 0.17 | 6.55 | 5 | 3.49 | 5.46 | 6.21 | 19.74 | 1.8 | |||||||||||||||||||||||||
| 2 | 7.67 | 1.5 | 960 | 3.89 | 0.17 | 6.65 | 4.5 | 3.49 | 5.46 | 6.2 | 12.05 | 1.65 | |||||||||||||||||||||||||
Table 3.
Calculated crop water requirement (evaporation pan and Penman-Monteith).
| Calculation method | greenhouse cucumber seasons | open cucumber seasons | |||
|---|---|---|---|---|---|
| Winter seasons | Spring seasons | Summar-Autumn seasons | Spring seasons | Autumn seasons | |
| Calculated by evaporation pan method ETc (mm) | 328 | 369 | 493 | 583 | 360 |
| Calculated by penman-monteith equ. ETc (mm) | 417 | 567 | 409 | 625 | 305 |
Table 4.
Average indoor cucumber crop coefficient for the main growth stages during the winter and autumn seasons, with statistical analysis, taking the alfalfa reference method as the basis for comparison.
Table 4.
Average indoor cucumber crop coefficient for the main growth stages during the winter and autumn seasons, with statistical analysis, taking the alfalfa reference method as the basis for comparison.
| Winter seasons | The reference method of calculating evapotranspiration | Automn seasons | The reference method of calculating evapotranspiration | ||||||
|---|---|---|---|---|---|---|---|---|---|
| Growing Stage | Plant age | Kc (by Epan) | Kc (by PM) | Kc (by Alfalfa R.) | Growing Stage | Plant age | Kc (by Epan) | Kc (by PM) | Kc (by Alfalfa R.) |
| Kc ini. (start) | 1 | 0.72 | 0.74 | 0.74 | Kc ini. (start) | 1 | 0.65 | 0.57 | 0.74 |
| Kc ini. (end) | 20 | 0.72 | 0.74 | 0.74 | Kc ini. (end) | 25 | 0.65 | 0.57 | 0.74 |
| Kc dev. (start) | 20 | 0.72 | 0.74 | 0.74 | Kc dev. (start) | 25 | 0.65 | 0.57 | 0.74 |
| Kc dev. (end) | 50 | 1.67 | 1.65 | 0.98 | Kc dev. (end) | 61 | 1.27 | 1.11 | 1.14 |
| Kc mid. (start) | 50 | 1.67 | 1.65 | 0.98 | Kc mid. (start) | 61 | 1.27 | 1.11 | 1.14 |
| Kc mid. (end) | 80 | 1.67 | 1.65 | 0.98 | Kc mid. (end) | 110 | 1.27 | 1.11 | 1.14 |
| Kc end | 95 | 1.4 | 1.38 | 0.85 | Kc end | 150 | 1.05 | 1.11 | 0.81 |
| RMSE | 0.57 | 0.56 | 0 | RMSE | 0.19 | 0.15 | 0 | ||
| RRMSE | 59 | 59 | 0 | RRMSE | 19 | 14 | 0 | ||
| CRM | -0.54 | -0.55 | 0 | CRM | -0.14 | -0.03 | 0 | ||
Table 5.
Average measurements of vegetative growth of indoor cucumber during the summer and winter seasons.
Table 5.
Average measurements of vegetative growth of indoor cucumber during the summer and winter seasons.
| Season | Irrigation level | Final plant length (m) | Final plant height (m) | Cumulative number of leaves | Total leaves | Leaves area (m2) | LAI (2plt/m2) |
|---|---|---|---|---|---|---|---|
| Summer | 100% | 3.84 | 2.65 | 54 | 54 | 3 | 6 |
| Summer | 75% | 3.77 | 2.65 | 54 | 54 | 2.6 | 5.1 |
| Summer | 50% | 3.19 | 2.65 | 50 | 50 | 1.9 | 3.9 |
| winter | 100% | 4.2 | 2.65 | 59 | 59 | 2.3 | 4.5 |
| winter | 75% | 3.704 | 2.65 | 55 | 55 | 2.1 | 4.2 |
| winter | 50% | 3.704 | 2.65 | 52 | 52 | 1.8 | 3.6 |
Table 6.
Effect of applying partial root-zone drying irrigation system (PRD) with regulated deficit irrigation technique (RDI) on cucumber productivity in winter-spring seasons (kg m−2).
Table 6.
Effect of applying partial root-zone drying irrigation system (PRD) with regulated deficit irrigation technique (RDI) on cucumber productivity in winter-spring seasons (kg m−2).
| Crop evapotranspiration (ETc) | Added Ware (AW) | Irrigation percentage | PRD with Surface drip Irrigation (PRD-S) | PRD with Subsurface drip Irrigation (PRD-SB) | RDI with Surface drip Irrigation (RDI-S) | RDI with Subsurface drip Irrigation (RDI-SB) | CRM PRD-S | CRM PRD-SB | CRM RDI-S | CRM RDI-SB |
|---|---|---|---|---|---|---|---|---|---|---|
| 328 | 413 | 100% | 14 | 15.5 | 15 | 15.1 | 0.07 | -0.03 | 0 | 0 |
| 328 | 413 | 14.1 | 15.5 | 15.6 | 14.8 | 0.06 | -0.03 | -0.04 | 0.02 | |
| 328 | 413 | 15.2 | 16 | 14.3 | 14.3 | -0.01 | -0.06 | 0.05 | 0.04 | |
| Mean | 14.4 | 15.6 | 15 | 14.7 | 0.04 | -0.04* | 0 | 0.02 | ||
| 246 | 310 | 75% | 12.6 | 13.6 | 12.1 | 12.8 | 0.16 | 0.09 | 0.2 | 0.14 |
| 246 | 310 | 12.6 | 13.6 | 12.5 | 13.1 | 0.16 | 0.09 | 0.17 | 0.13 | |
| 246 | 310 | 11.9 | 13.3 | 12.8 | 13.7 | 0.2 | 0.12 | 0.15 | 0.09 | |
| Mean | 12.4 | 13.5 | 12.4 | 13.2 | 0.18 | 0.1 | 0.17 | 0.12 | ||
| 164 | 207 | 50% | 10.8 | 12.5 | 10.7 | 10.9 | 0.28 | 0.17 | 0.29 | 0.27 |
| 164 | 207 | 10.7 | 11.8 | 10.3 | 11 | 0.29 | 0.21 | 0.31 | 0.27 | |
| 164 | 207 | 11.2 | 11.8 | 10.6 | 11.1 | 0.25 | 0.21 | 0.3 | 0.26 | |
| Mean | 10.9 | 12 | 10.5 | 11 | 0.27 | 0.2 | 0.3 | 0.27 | ||
| 328 | 620 | 150% | 13.4 | 13.9 | 14.6 | 14.4 | 0.11 | 0.07 | 0.03 | 0.04 |
| 328 | 620 | 13.7 | 14.2 | 14.7 | 14.5 | 0.09 | 0.06 | 0.02 | 0.04 | |
| 328 | 620 | 13.4 | 14.1 | 15 | 14.5 | 0.11 | 0.06 | 0 | 0.03 | |
| Mean | 13.5 | 14.1 | 14.8 | 14.4 | 0.1 | 0.06 | 0.02 | 0.04 |
* The negative sign: means that the production of the treatment is more than the production of the measured in control (regular surface drip irrigation by 100%), and the positive one is less than it.
Table 7.
Effect of applying a partial root-zone drying irrigation system (PRD) with a regulated deficit irrigation technique (RDI) on cucumber productivity in the summer-autumn seasons (kg m−2).
Table 7.
Effect of applying a partial root-zone drying irrigation system (PRD) with a regulated deficit irrigation technique (RDI) on cucumber productivity in the summer-autumn seasons (kg m−2).
| Crop evapotranspiration (ETc) | Added Ware (AW) | Irrigation percentage | PRD with Surface drip Irrigation (PRD-S) | PRD with Subsurface drip Irrigation (PRD-SB) | RDI with Surface drip Irrigation (RDI-S) | RDI with Subsurface drip Irrigation (RDI-SB) | CRM PRD-S | CRM PRD-SB | CRM RDI-S | CRM RDI-SB |
|---|---|---|---|---|---|---|---|---|---|---|
| 493 | 621 | 100% | 15.8 | 16.2 | 16.94 | 17.2 | 0.07 | 0.04 | 0 | -0.02 |
| 493 | 621 | 15.9 | 16.3 | 16.57 | 16.9 | 0.04 | 0.01 | 0 | -0.02 | |
| 493 | 621 | 15.5 | 16.7 | 16.19 | 16.6 | 0.04 | -0.03 | 0 | -0.03 | |
| Mean | 15.7 | 16.4 | 16.57 | 16.9 | 0.05 | 0.01 | 0 | -0.02* | ||
| 370 | 466 | 75% | 15.4 | 15.2 | 15.7 | 16.7 | 0.09 | 0.1 | 0.07 | 0.02 |
| 370 | 466 | 14.7 | 15.5 | 15.7 | 16.2 | 0.11 | 0.07 | 0.05 | 0.03 | |
| 370 | 466 | 14.1 | 14.8 | 15.8 | 16.3 | 0.13 | 0.08 | 0.02 | -0.01 | |
| Mean | 14.8 | 15.2 | 15.7 | 16.4 | 0.11 | 0.08 | 0.05 | 0.01 | ||
| 247 | 311 | 50% | 13 | 14 | 13.2 | 14.8 | 0.23 | 0.17 | 0.22 | 0.12 |
| 247 | 311 | 12 | 13.7 | 13 | 14.6 | 0.28 | 0.17 | 0.21 | 0.12 | |
| 247 | 311 | 11.9 | 13.2 | 13.2 | 14.7 | 0.27 | 0.19 | 0.18 | 0.09 | |
| Mean | 12.3 | 13.6 | 13.1 | 14.7 | 0.26 | 0.18 | 0.21 | 0.11 | ||
| 493 | 932 | 150% | 15.3 | 16 | 16.5 | 16.2 | 0.1 | 0.06 | 0.02 | 0.04 |
| 493 | 932 | 16.9 | 16.8 | 16.3 | 16.4 | -0.02 | -0.01 | 0.01 | 0.01 | |
| 493 | 932 | 15.7 | 15.5 | 16.6 | 16.1 | 0.03 | 0.04 | -0.03 | 0 | |
| Mean | 16.0 | 16.1 | 16.5 | 16.2 | 0.04 | 0.03 | 0.01 | 0.02 |
* The negative sign: means that the production of the treatment is more than the production of the measured in control (regular surface drip irrigation by 100%), and the positive one is less than it.
Table 8.
Effect of applying a partial root-zone drying irrigation system (PRD) with a regulated deficit irrigation technique (RDI) on open field cucumber (mean of spring and autumn seasons) (kg m−2).
Table 8.
Effect of applying a partial root-zone drying irrigation system (PRD) with a regulated deficit irrigation technique (RDI) on open field cucumber (mean of spring and autumn seasons) (kg m−2).
| Crop evapotranspiration (ETc) | Added Ware (AW) | Irrigation percentage | PRD with Surface drip Irrigation (PRD-S) | PRD with Subsurface drip Irrigation (PRD-SB) | RDI with Surface drip Irrigation (RDI-S) | RDI with Subsurface drip Irrigation (RDI-SB) | CRM PRD-S | CRM PRD-SB | CRM RDI-S | CRM RDI-SB |
|---|---|---|---|---|---|---|---|---|---|---|
| 583 | 734 | 100% | 7.20 | 8.70 | 7.20 | 7.40 | 0.00 | -0.21 | 0.00 | -0.03 |
| 583 | 734 | 6.80 | 8.80 | 6.70 | 7.30 | -0.01 | -0.31 | 0.00 | -0.09 | |
| 583 | 734 | 6.70 | 8.20 | 6.60 | 7.00 | -0.02 | -0.24 | 0.00 | -0.06 | |
| Mean | 6.90 | 8.57 | 6.83 | 7.23 | -0.01 | -0.25 | 0.00 | -0.06 | ||
| 437 | 551 | 75% | 6.50 | 7.40 | 6.30 | 7.20 | 0.10 | -0.03 | 0.13 | 0.00 |
| 437 | 551 | 6.30 | 7.30 | 5.80 | 6.90 | 0.06 | -0.09 | 0.13 | -0.03 | |
| 437 | 551 | 6.20 | 7.20 | 5.80 | 7.40 | 0.06 | -0.09 | 0.12 | -0.12 | |
| Mean | 6.33 | 7.30 | 5.97 | 7.17 | 0.07 | -0.07 | 0.13 | -0.05 | ||
| 291 | 367 | 50% | 5.10 | 5.30 | 5.00 | 5.40 | 0.29 | 0.26 | 0.31 | 0.25 |
| 291 | 367 | 5.30 | 5.80 | 5.00 | 5.50 | 0.21 | 0.13 | 0.25 | 0.18 | |
| 291 | 367 | 4.70 | 6.50 | 4.60 | 6.00 | 0.29 | 0.02 | 0.30 | 0.09 | |
| Mean | 5.03 | 5.87 | 4.87 | 5.63 | 0.26 | 0.14 | 0.29 | 0.18 | ||
| 583 | 1102 | 150% | 7.10 | 6.70 | 5.10 | 6.60 | 0.01 | 0.07 | 0.29 | 0.08 |
| 583 | 1102 | 7.10 | 6.80 | 5.10 | 6.10 | -0.06 | -0.01 | 0.24 | 0.09 | |
| 583 | 1102 | 7.00 | 9.20 | 6.70 | 6.80 | -0.06 | -0.39 | -0.02 | -0.03 | |
| Mean | 7.07 | 7.57 | 5.63 | 6.50 | -0.03 | -0.11 | 0.18 | 0.05 |
Disclaimer/Publisher’s Note: The statements, opinions and data contained in all publications are solely those of the individual author(s) and contributor(s) and not of MDPI and/or the editor(s). MDPI and/or the editor(s) disclaim responsibility for any injury to people or property resulting from any ideas, methods, instructions or products referred to in the content. |
© 2023 by the authors. Licensee MDPI, Basel, Switzerland. This article is an open access article distributed under the terms and conditions of the Creative Commons Attribution (CC BY) license (http://creativecommons.org/licenses/by/4.0/).
Copyright: This open access article is published under a Creative Commons CC BY 4.0 license, which permit the free download, distribution, and reuse, provided that the author and preprint are cited in any reuse.


