
Submitted:
12 June 2024
Posted:
13 June 2024
You are already at the latest version
Abstract
There is a need for alternatives or complements to synthetic fertilizers to enhance agricultural sustainability. Applying organic amendments can play a significant role in this. Insect droppings show high potential, though studies evaluating their agronomic value have only recently begun to emerge. This study compared black soldier fly (Hermetia illucens) and mealworm (Tenebrio molitor) larvae frass with another organic amendment (Nutrimais) derived from composting forestry, agro-industrial, and domestic waste. The experiment also included ammonium nitrate at two rates [the same as the organic amendments, 50 kg ha–1 nitrogen (N) (FullR), and half that rate (HalfR)] and an unfertilized control. The study spanned two growth cycles of lettuce (Lactuca sativa L.) grown in pots, followed by unfertilized oats (Avena sativa L.) to assess the residual effects of the fertilizing treatments. Mealworm larvae frass mineralized rapidly, with an apparent N recovery of 37.4% over the two lettuce growth cycles, indicating its high availability to soil heterotrophic microorganisms. The average dry matter yield (DMY) of lettuce was the highest among all treatments (12.8 and 9.8 g plant–1 in the first and second lettuce cycles), even compared to the FullR treatment (12.2 and 7.8 g plant–1), though without significant differences. Although mealworm larvae frass exhibited a high mineralization rate, the DMY cannot be attributed solely to N supply, as plants in the FullR treatment showed better N nutritional status. Mealworm larvae frass provided strong evidence of a plant biostimulant effect, not explained by the variables measured in this study. Black soldier fly larvae frass exhibited typical behavior of a moderately reactive organic amendment, while Nutrimais showed low reactivity, with a near-neutral mineralization/immobilization balance. The results suggest mealworm larvae frass is recommended for early maturing vegetable crops, whereas Nutrimais appears more suitable for perennial crops with low short-term nutrient requirements.
Keywords:
black soldier fly frass
; Hermetia illucens
; Tenebrio molitor
; insect droppings
; manuring effect
1. Introduction
The global population is projected to continue increasing in the coming decades. According to the latest United Nations report [1], estimates suggest there will be 8.5 billion people by 2030 and 9.8 billion by 2050. This upward trend in world population presents significant challenges in terms of meeting food demand and ensuring sustainable agriculture practices. Achieving a balance between environmentally friendly farming methods and high-quality yields is paramount in the 21st century [2]. While intensive farming may offer improved income, it tends to be unsustainable and detrimental to the environment [3]. Reliance on mineral fertilizers, pesticides, and intensive tillage practices may have adverse effects on soil quality [4,5], exacerbating climate change and rendering traditional agricultural systems susceptible to extreme weather events [6].
Organic amendments have historically supplied essential nutrients to crops, but their usage declined with the mechanization of agricultural practices and the availability of affordable chemical fertilizers [7]. Chemical fertilizers, containing vital NPK nutrients, rapidly enhance soil fertility and support plant growth [8]. However, their long-term impacts can lead to soil pollution, reduced fertility, and imbalances in soil nutrients [9]. Organic matter plays a vital role in soil fertility and overall soil functioning, influencing its physical, chemical, and biological properties [10,11]. Excessive application of chemical fertilizers, in turn, may lead to a reduction in soil organic matter, thereby negatively impacting general soil properties [12,13].
Intensive agricultural practices without organic amendments result in reduced soil carbon (C) content, microbial biomass, enzymatic activities, species diversity, and increased soil salinity [14]. Establishing a soil conservation baseline entails implementing conservation agriculture techniques and enriching soils with organic matter. Common sources of organic matter for soil enrichment may include farmyard manures [13,15,16], municipal solid waste [17,18] and sewage sludge [19,20]. The use of high-quality compost is crucial for its safe and effective utilization in soil [20,21].
Scholars worldwide are currently researching sustainable waste sources and decomposition methods [22]. Insects and their excreta have shown promising potential for use in agriculture, particularly as soil amendments [23]. The byproduct of insect bioconversion, known as "frass", contains significant amounts of nutrients and can be marketed as fertilizing materials, offering additional income for breeding operations [24]. With the expanding insect industry globally, frass production is expected to increase, driven by waste recycling and circular economy policies [25,26]. Furthermore, there is an ongoing debate regarding the effectiveness of organic agriculture in ensuring food security [27]. Farmers have the option to adopt conservation practices, and their decisions are influenced by factors such as community pressure, financial incentives, and information availability [28].
Therefore, additional research is necessary to establish the best conditions for utilizing insect frass and to scale up this industry significantly [29]. This includes studying the effects of insect byproducts on soil properties and plant growth. To address current knowledge gaps, our study began examining the effect of two commercial products resulting from black soldier fly (Hermetia illucens) larvae frass and mealworm (Tenebrio molitor) larvae frass on lettuce (Lactuca sativa L.) growth, plant nutritional status, and soil properties. For comparison, the study included a commercially available organic compost, which has been on the market for a long time resulting from composting forestry, agro-industrial, and domestic waste, sold as a pelletized and dehydrated material and permitted in organic farming in Portugal. Additionally, the study included two treatments with mineral N fertilization at equivalent and half rates of the N provided by organic amendments, as well as a control treatment without fertilization. In this way, through multiple comparisons, we aim to understand how to position these new organic amendments in crop recommendation systems.
2. Materials and Methods
2.1. Experimental Conditions
A pot experiment was conducted at the experimental farm of Instituto Politécnico de Bragança, located in Northeastern Portugal (41.797254°N -6.762279°W). The experiment involved two growing cycles of lettuce (cv. Summer Wonder) and a single growing cycle of oats (Avena sativa L., cv. Boa Fé). Lettuce was cultivated during the first cycle, spanning from May to June, and again in the second cycle, which took place from August to October 2023. Oats were grown from October 2023 to January 2024.
The region's climate falls under the Mediterranean type, classified as Csb according to the Köppen classification, characterized by mild, dry summers [30]. Weather data collected during the experimental period are presented in Figure 1.
The soil used in this study was collected from the surface layer (0-0.20 m) of a fallow plot. It is classified as a Regosol of coluvial origin, presenting a sandy-clay-loam texture (soil separates of 228.7, 241.0, and 530.3 g kg–1 of clay, silt, and sand, respectively). Soil organic C content was 11.0 g kg–1 and the pH (H2O) 6.5. Extractable phosphorus (P) and potassium (K) levels were 133.5 and 191.7 mg kg–1, P2O5 and K2O, respectively. Exchangeable calcium (Ca), magnesium (Mg), and cation exchange capacity (CEC) were 9.6, 4.7, and 15.3 cmolc kg–1, respectively.
2.2. Experimental Design and Fertilizing Materials
The first growing cycle of lettuce experiment followed a completely randomized design, comprising six treatments and six replicates. The treatments consisted of: 1) Nutrimais® (Nutri), an organic amendment derived from composting forestry, agro-industrial, and domestic waste, available in pelletized and dehydrated form, permitted for organic farming in Portugal; 2) Black soldier fly larvae frass (BSFly), a pelletized organic amendment produced from insect droppings by Entogreen®; 3) Mealworm larvae frass (Mealw), also a natural pelletized organic amendment from insect droppings and plant debris, manufactured by ThunderFoods®; 4) Ammonium nitrate (27% N, 50% NH4+, 50% NO3-), applied at the same N rate (FullR) as the three organic amendments; 5) Ammonium nitrate, applied at half the N rate (HalfR) of the organic amendments; and 6) a non-fertilized control (Cont). Table 1 presents the main properties of the three organic amendments used in this study.
The treatments Nutri, BSFly, Mealw, and FullR were applied at a rate of 50 kg N ha–1. To calculate the quantities of amendments and fertilizer for each plot, a standard planting density of 140,000 plants ha–1 was used. Thus, each pot received 1/140,000 of the amendments corresponding to one hectare. Considering the moisture content and N concentration of the organic amendments, they were applied at rates of 19.93, 15.33, and 22.72 g pot–1 for BSFly, Mealw, and Nutri. Ammonium nitrate was applied at rates of 1.59 g pot–1 for FullR and 0.79 g pot–1 for HalfR treatments. The application of ammonium nitrate at full and half rates was split into two applications: at transplanting and in the middle of the growing season. Each pot received 3 kg of dried (40 ºC) and sieved (2 mm) soil, 50 g of perlite to ensure aeration, and the corresponding quantity of amendments and fertilizer. The first growing cycle ran from May 3rd to June 15th.
After completing the first lettuce cycle, the experiment was divided into two, forming two groups of pots with three replicates each. In one group, the fertilization from the first cycle was repeated to assess the continued effect of the fertilizer treatments on lettuce growth and nutrition. In the other group, no fertilizers were applied. Since organic amendments release nutrients gradually through the mineralization process, the aim in this second group of pots was to evaluate the residual effect of fertilization from the first cycle. This second lettuce growth cycle ran from August 25th to October 2nd, 2023.
After completing the second lettuce growth cycle, oats, a species with high N requirements capable of thriving during the autumn-winter period, were sown. Oats were planted in both groups of pots, with 20 seeds per pot, later adjusted to 15 plants per pot after germination. The oats were not fertilized and were intended to evaluate the residual effect of the fertilization applied to the lettuce. The oat cropping cycle began on October 13th, 2023, and concluded on January 18th, 2024, when all plants exhibited chlorosis and stunted growth, at the stem elongation phase (with node 2 at least 2 cm above node 1) [31]. This approach aimed to gather detailed information on the short and long-term effects of organic fertilization. Mineral fertilization was included in the experiment as a positive control to assess the nutrient use efficiency of organic amendments compared to the more standardized use of mineral fertilizers.
2.3. Conducting the Experiment
Seedlings at the phenological growth stage 13, 3rd true leaf unfolded [31] were used, having been previously grown in commercial organic substrate. The pots were placed outdoors on a wooden platform with lateral protection to prevent direct sunlight and minimize pot heating. Regularly, the pots were rotated to ensure equivalent radiation exposure conditions. Weeds were promptly removed after germination.
The pots were watered as needed, ensuring that the lettuce plants remained well hydrated. In this type of experiment, the same amount of water is not applied to all pots because different fertilizations induce varying growth and transpiration rates, necessitating constant adjustment of water quantities per pot. Plates were placed under the pots to prevent nutrient leaching.
2.4. Sampling and Laboratory Analyses
The lettuces and oats were harvested by cutting them at ground level and then divided into several segments to facilitate the drying process. Once cut, the plants were oven-dried at 70 °C until reaching constant weight, after which they were ground through a 1 mm mesh. Subsequently, tissue samples were digested using nitric acid. Elemental tissue analysis was conducted using Kjeldahl method for N, colorimetry for boron (B) and P, flame emission spectrometry for K, and atomic absorption spectrophotometry for Ca, Mg, copper (Cu), iron (Fe), zinc (Zn), and manganese (Mn). For a detailed description of these methodologies, the reader is referred to Temminghoff and Houba [32]. Nitrate concentration in lettuce tissues were determined by UV-vis spectrophotometry in a water extract (dry matter:water, 1:50 m/v) [33].
After the conclusion of the second lettuce growing cycle, soil samples were collected from the pots immediately before they were used for the oat experiment. The soil samples were oven-dried at 40 °C, sieved again through a 2 mm mesh, and analyzed for various parameters including organic C (determined using the wet digestion Walkley-Black method), soil pH (measured in water and KCl solutions at a soil-to-solution ratio of 1:2.5 using potentiometry), exchangeable bases (extracted with ammonium acetate at pH 7.0 and determined by atomic absorption spectrometry), exchangeable acidity (extracted with KCl and quantified through titration with sodium hydroxide), P and K (analyzed using the Egnér–Riehm method), and B (extracted with hot water and determined using the azomethine-H method). For detailed information on these analytical procedures, please refer to Van Reeuwijk [34]. The other micronutrients (Cu, Fe, Zn, and Mn) were extracted using diethylenetriaminepentaacetic acid (DTPA) buffered at pH 7.3 and determined by atomic absorption spectrometry, following the procedures of FAO [35]. The analyses conducted on the initial soil samples (table 1) also followed these same procedures. Additionally, soil separates were determined in these initial soil samples using the Robison pipette method.
2.5. Data Analysis
The data were subjected to analysis of variance (one-way ANOVA) after being tested for normality and variance homogeneity using the Shapiro-Wilk and Levene’s tests, respectively. Whenever the ANOVA revealed significant differences among treatments, means were separated using the Tukey HSD multiple comparison test (α = 0.05).
Apparent N Recovery (ANR) was estimated by the equation: ANR (%) = 100 × (N recovered by plants in fertilized treatments - N recovered by plants in the control)/N applied as fertilizer.
3. Results
3.1. Lettuce Dry Matter Yield
Lettuce dry matter yield (DMY) varied significantly between treatments in the first lettuce growing cycle (Figure 2). Mealw, FullR, and HalfR gave significantly higher values than the other treatments, while Nutri and Cont displayed significantly lower values. It should also be noted that the highest average value was obtained in the Mealw treatment (12.8 g plant–1), even higher than the value recorded in the FullR treatment (12.2 g plant–1). DMY in the BSFly treatment was lower than in the Mealw, FullR, and HalfR treatments, but higher than in the Cont and Nutri treatments. It is also worth noting that the average DMY in the Nutri treatment (5.1 g plant–1) was lower than in the Cont treatment (6.7 g plant–1).
The pots subjected to the second rate of organic amendments and fertilizers (Figure 3a) exhibited results consistent with those observed during the initial growing cycle. However, the mean value of the Mealw treatment (9.8 g plant–1) stood out, being significantly higher than all others except for the FullR treatment (7.8 g plant–1). The BSFly treatment exhibited a lower mean value (5.7 g plant–1), although not significantly different from that of the HalfR treatment (6.9 g plant–1). The Nutri treatment maintained a very low mean value (2.7 g plant–1), comparable to the Cont treatment (3.1 g plant–1), and lower than that of the BSFly treatment.
In the pots that did not receive the second dose of organic amendments and fertilizers, where plant growth depended on the residual fertility from the treatments of the first lettuce cycle, the BSFy treatment stood out (5.8 g plant–1), with no significant differences compared to the FullR treatment (5.7 g plant–1), but significant differences were observed with all other treatments (Figure 3b). Nutri (4.3 g plant–1) and Mealw (4.3 g plant–1) displayed slightly higher mean values, but without significant differences compared to the Cont treatment (3.2 g plant–1).
3.2. Plant Nitrogen Nutritional Status
The N concentration in the tissues of lettuces grown during the first growing cycle followed a slightly different pattern from DMY (Figure 4). The highest values were observed in the FullR treatment (33.0 g plant–1), followed by HalfR (26.5 g kg–1), and Mealw (19.6 g kg–1). The mean values observed in the BSFly (15.2 g kg–1) and Nutri (14.4 g kg–1) treatments did not differ significantly from those observed in the Cont treatment (13.6 g kg–1).
The response pattern observed in the first growing cycle of lettuce was repeated in the second cycle in pots that received the second rate of fertilizers (Figure 5a). Treatments receiving mineral fertilizer resulted in higher N concentrations in the tissues compared to other treatments. In pots not fertilized for the second growing cycle of lettuce (Figure 5b), the significant effect of the FullR treatment over others was maintained, but no significant differences were recorded among the others.
The nitrate concentration in the tissues did not vary as markedly with the fertilizer treatments as the N concentration in the tissues (Figure 6). In the first growth cycle of lettuce, significant differences occurred only between the FullR treatment (10917 mg kg–1) and the Cont treatment (8975 mg kg–1). No significant differences were observed between the other fertilized treatments and the control treatment.
In the second growing cycle of lettuce, in pots that received the second rate of fertilizers, the Mealw and BSFly treatments resulted in nitrate tissue values equivalent to those of treatments with mineral fertilizer and significantly higher than those of the Nutri and Cont treatments (Figure 7a). Once again, Nutri resulted in a value equivalent to that of the control. In the second growing cycle of lettuce, in pots that did not receive a second dose of fertilizers, a greater gradient between treatments was observed in tissue nitrate levels (Figure 7b). The mean values of the FullR and Mealw treatments were significantly higher than those of the control.
The ANR in the first growing cycle of lettuce was very high in the HalfR treatment (96.6%), followed by the FullR treatment (71.9%) (Table 2). Among organic amendments, the mean value of Mealw (37.3%) was higher than that of BSFly (11.1%), being negative in the Nutri treatment (-4.0%). In pots where the second dose of fertilizer was not applied, the values increased comparatively to those of the first growing cycle in all treatments. The mean value exceeded 100% (105.9%) in the HalfR treatment and was slightly above 0% (0.6%) in the Nutri treatment. In pots that received the second dose of fertilizer, organic amendments maintained ANR values similar to those of the first lettuce cycle, while they decreased in treatments with mineral N application. Considering both growing cycles and pots that received both rates of fertilizers, the ANR values followed the decreasing order HalfR (78.3%), FullR (62%), Mealw (37.4%), BSFly (10.9%), and Nutri (-2.5%).
3.3. Concentration of Other Macro and Micronutrients in the Tissues
The concentration of P in lettuce tissues varied significantly between treatments in the first growing cycle, with the highest average value found in the Mealw treatment (3.7 g kg–1), followed by BSFly (3.2 g kg–1) (Table 3). The average values of the other treatments did not vary significantly. The Mealw treatment also exhibited the highest average concentration of K in lettuce tissues (56.4 g kg–1), which was significantly higher than that of the Cont treatment (43.8 g kg–1). The Nutri treatment showed significantly higher Ca levels in tissues (8.3 g kg–1) than those of FullR (6.7 g kg–1). FullR showed the highest values of Mg (2.9 g kg–1), while BSFly (2.3 g kg–1) and Cont (2.3 g kg–1) showed the lowest ones. Tissue B concentration did not vary between treatments. The Fe levels in tissues appeared lower in treatments associated with higher DMY, a trend apparently followed by Cu values. The Mn and Zn values seem to show a tendency to be higher in treatments with mineral fertilization.
The concentration of P in lettuce tissues in the second growth cycle, and in pots that received the second dose of fertilizer, did not vary significantly between treatments (Table 4). K values were lower in the FullR treatment compared to treatments with organic amendments and the control. Ca values in the tissues were again high in the Nutri treatment, this time accompanied by those of the control treatment. Mg, B, Mn, and Zn levels in lettuce tissues did not vary significantly with the treatments. Fe levels in the tissues showed the same trend of being lower in the more productive treatments, and Cu levels did not show consistency with the values observed in the first growing cycle of lettuce.
In the pots that did not receive the second dose of fertilizers, no significant differences occurred in the concentration of macronutrients in lettuce tissues (Table 5). In this group of pots, significant differences in tissue B levels appeared for the first time, with the lowest mean values observed in the FullR treatment. No significant differences were observed among treatments for metallic micronutrients.
3.4. Residual Effect of Treatments on Inorganic Nitrogen in Soil and Oat Crop
The nitrate, ammonia, and total inorganic N levels in the soil at the end of the second growing cycle of lettuce were the highest in the FullR treatment, with significant differences compared to all other treatments in ammonia and total inorganic N levels (Table 6). In pots that did not receive the second dose of fertilizer, elevated values were also observed in some treatments with organic amendments, such as Mealw and Nutri. The control values were typically the lowest.
After the second lettuce cycle, oats were grown in pots without receiving further fertilization. In pots that received the second dose of fertilizer, DMY was highest in the BSFly treatment (3.1 g pot–1), followed by Mealw (2.8 g pot–1) and FullR (2.6 g pot–1) (Table 7). The Cont (1.2 g pot–1) and Nutri (1.4 g pot–1) treatments recorded the lowest values. The trend in DMY results in pots that did not receive the second dose persisted, with higher values in the BSFly treatment (2.0 g pot–1) and significantly different from the Cont (1.3 g pot–1) and Nutri (1.3 g pot–1) treatments. No significant differences were observed in N concentration in the tissues, whether in pots that received or did not receive the second dose of fertilizer. However, the amount of N taken up by the plant followed the trend of DMY, with the highest mean values observed in the BSFly treatment, although no significant differences between treatments were observed in pots that did not receive the second dose of fertilizer.
3.5. Soil Properties
Soil organic C in the pots that received the second rate of fertilizers varied significantly between treatments (Table 8). The higher average values were found in the Mealw treatment (11.5 g kg–1), while the lower ones observed in the Cont treatment (8.8 g kg–1). Soil pH did not vary significantly between treatments. Extractable P was particularly high in the BSFly and Mealw treatments and low in the HalfR and FullR treatments. Soil K levels were also particularly low in the HalfR and FullR treatments. Exchangeable Ca did not vary significantly between treatments, nor did the CEC, although significant differences were observed among treatments for soil Mg levels, which were particularly high in the BSFly treatment and low in the FullR treatment. Cation micronutrients did not vary significantly between treatments.
In pots that did not receive the second dose of fertilizer, soil organic C varied similarly between treatments as in pots that received the second dose, although with generally lower values, even in treatments that did not receive organic amendments (Table 9). Soil pH also did not vary significantly between treatments. P and K values followed the trend observed in pots that received the second dose of fertilizers, although P levels were generally lower now. Exchangeable Ca and Mg, as well as CEC, showed a very similar pattern to what was observed in pots that received the second dose of fertilizer. Among cationic micronutrients, no significant differences occurred between treatments.
4. Discussion
4.1. Mealworm Larvae Frass
Mealworm larvae frass (Mealw) resulted in the highest average DMY among all treatments in the first lettuce growing cycle, significantly surpassing the BSFly, Nutri, and Cont treatments (Figure 2). This trend of high values persisted in the second lettuce cycle upon reapplication of fertilizers, with DMY significantly exceeding that of the other treatments, except for the FullR treatment (Figure 3a). N concentration in the tissues was notably higher in the Mealw treatment compared to treatments with other organic amendments. Often considered the most crucial nutrient in crop fertilization programs, N has an undeniable effect on crop growth [13,36,37], and this study is no exception.
The ANR in the Mealw treatment was very high for an organic amendment, reaching 37.4% over the two growing cycles that received fertilization. This result indicates a high mineralization rate of the organic substrate. Houben et al. [38] reported a significant effect of mealworm larvae frass application on ryegrass grown in pots, also attributing the result to the rapid appearance of nutrients in the soil in readily available forms for plants. The mineralization rate of organic substrates in the soil largely depends on their N content and/or the C/N ratio. The balance between biological immobilization and mineralization is typically found for N values between 15 and 20 g kg–1 and C/N ratios between 20 and 30 [11,39]. The N content and C/N ratio of mealworm larvae frass were 31.3 g kg–1 and 16.5, respectively. Although these values may suggest net mineralization in the short term, they would be unlikely to predict such high mineralization rates, given results reported in previous studies using other organic amendments [16,18,40,41], especially considering the short growing cycle of lettuce.
However, the availability of N alone cannot account for the good performance of lettuces subjected to the Mealw treatment. Lettuces that received ammonium nitrate, particularly those in the FullR treatment, exhibited higher N concentrations in tissues compared to those in the Mealw treatment. Moreover, the N concentration in the tissues of the Mealw treatment is still below the sufficiency range for lettuce [42], indicating that the FullR treatment did not supply excess N. The ANR in treatments with mineral N reached notably high percentages, especially when compared to typical field trial values, which usually fall below 50% [41,43,44]. This also suggests that excess N was not used. The N rate used in the FullR treatment, amounting to 50 kg ha–1, is not excessive when considering the common N requirements for lettuce [45].
Lettuces in the Mealw treatment exhibited high tissue P levels, particularly during the first growing cycle. This result suggests that P might have played a significant role in the DMY of the lettuce, considering the well-documented importance of P in crop fertilization across various regions worldwide [46,47]. Additionally, with organic amendments, the simultaneous availability of multiple nutrients can create positive synergies in root system development, thereby benefiting plant growth [48]. However, some of the more productive treatments, FullR and HalfR, showed lower tissue P concentrations, diminishing the relevance of P in lettuce growth. Given the concentrations of other nutrients in the tissues, there seems to be no justification to assert that the role of any specific nutrient was significant in explaining the high DMY in the Mealw treatment. Therefore, other factors unrelated to tissue nutrient concentrations must be identified to explain the DMY results.
Organic amendments can positively affect plant growth in several ways, particularly by improving the physical, chemical, and biological properties of the soil [18,49,50]. Some studies have demonstrated that the positive effects on plants achieved by applying organic amendments cannot be replicated by using only mineral fertilizers. This beneficial action of organic amendments is sometimes referred to as the "manuring effect", a term used to describe measurable growth benefits that may be difficult to attribute to a specific cause [11,16,51]. By testing various organic materials produced by mealworm larvae, Poveda et al. [52] suggested that some microorganisms present in the excreta act as plant growth promoters, which explains the benefits they observed in the growth of chard (Beta vulgaris var. cicla) and bean (Phaseolus vulgaris) seedlings. The authors also found that each type of excrement had a different potential to promote plant growth and stress resistance, depending on the diets of the insects. In another study, although positive effects on lettuce growth were recorded when using mealworm frass, Fuertes-Mendizábal et al. [53] found that the use of the product at a dose above 2.5% of the peat substrate resulted in a negative effect on lettuce plant growth, particularly on root development, indicating that the applied dose may be relevant in the management of this organic amendment.
In the study presented here, the Mealw treatment appears to have a positive effect on plant growth that extends beyond its nutrient content and its impact on the nutritional status of the plants. The result suggests a clear manuring or biostimulant effect. Considering the use of soil as substrate and a fertilizer rate similar to field cultivation of lettuce, no negative effects were observed.
4.2. Black Soldier Fly Frass
Black soldier fly frass initially presented a composition not very different from that of mealworm larvae frass (Table 1). The composition of the black soldier fly frass used in this study is also comparable to organic materials of the same origin reported in other studies [24]. However, the lettuce DMY was significantly lower than that of the Mealw treatment in the cycles where fertilizers were applied. The N concentration in the tissues was also lower (Figure 4 and Figure 5), as well as the ANR (Table 2), which averaged 10.9% over the two growing cycles where fertilizers were applied. The N content (26.8 g kg⁻¹) and the C/N ratio (18.6) of this material also indicate a high likelihood of short-term net mineralization, since the C/N ratio value that leads to a balance between mineralization and biological immobilization ranges from 20 to 30, as previously mentioned [11,39].
The BSFly treatment increased lettuce DMY compared to the control treatment. Menino et al. [54], using a black soldier fly frass organic amendment, also observed an increase in ryegrass production in a greenhouse experiment compared to the control treatment. Similar results were found by Chavez et al. [55] in a pot experiment with arugula (Eruca sativa L.) and lettuce. However, in practice, the results of the BSFly treatment were not significantly different from those reported worldwide with other organic amendments [16,40,41]. Carroll et al. [56], for instance, using black soldier fly frass, reported cereal seedling growth at a level equivalent to that observed with pelletized chicken manure. The productivity loss in the BSFly treatment compared to the FullR treatments was likely due to the reduced availability of N in the soil, as the nutrient levels in the tissues were much lower in the BSFly treatment and below the lower limit of the sufficiency range for lettuce [42]. N availability in the soil is crucial for cell growth and expansion, particularly for the formation of proteins and other organic molecules [57]. Unlike the Mealw treatment, the BSFly treatment did not appear to have any evident effect beyond what is typically observed with high-quality organic amendments.
4.3. Nutrimais
The lettuce DMY in the Nutri treatment remained consistently at the level of the Cont treatment in both lettuce cycles, regardless of whether fertilization was repeated or not. The N levels in the tissues were always low, and not significantly different from those in the Cont treatment. On the other hand, the nitrate levels in the tissues, another indicator of N availability in the soil [20,58,59], tended to be lower than those in the other fertilized treatments. There did not appear to be significant differences between the Nutri treatment and the other treatments regarding the concentration of nutrients other than N in the tissues. Thus, the lack of available N for the plants was likely the main cause of the low productivity of the lettuces subjected to this treatment, considering that the N concentration in the tissues was well below the lower limit of the sufficiency range as reported by Bryson et al. [42].
The ANR by lettuces subjected to the Nutri treatment was globally negative, including when considering the two cropping cycles that received fertilization (Table 2). This indicates that biological immobilization occurred, meaning that the lettuces in this treatment had less available N than those in the Cont treatment. Biological immobilization resulting from the application of an organic amendment tends to occur when the amendment has a very low N concentration or a very high C/N ratio [11,39]. Under these conditions, energy is available for the heterotrophic communities in the soil (reflected in the C of the substrate), but there is little N (essential for the formation of amino acids and proteins). This leads to competition between heterotrophic microorganisms and plants for the available mineral N in the soil [11,39]. Although this organic substrate initially had a composition not very different from the others (C/N ratio, 16.5), it proved to be unreactive in the soil, not releasing nutrients to the plants. Previous studies using this organic amendment have already indicated its low reactivity [60,61]. Perhaps because it is a highly dehydrated and pelletized material, it becomes biologically inactive when applied to the soil. This aspect, combined with the short duration of the lettuce growing cycle, resulted in a situation where its effect on crop productivity was practically negligible. Objectively, it seems to be an organic amendment unsuitable for early maturing horticultural crops that require a rapid supply of nutrients.
4.4. Residual Effect of Fertilization and Soil Properties
The effect of lettuce fertilization on unfertilized oats highlighted the role of the BSFly treatment, which showed higher average values for DMY and N recovery both when fertilizers were applied in both lettuce growing cycles and when applied in only one of them (Table 7). This may indicate that, although Mealw had a higher short-term effect, over time, BSFly also released its nutrients, increasing consistency in the medium term. This result emphasizes the general knowledge about organic amendments and the care that should be taken in their management. Although N content and the C/N ratio have been used as the main indicators of the balance in the mineralization/immobilization process and nutrient release for crops [11,39], the process is highly unpredictable. Therefore, it is important to have the best information about organic amendments for more effective management in agricultural fields [41,51].
The effect of treatments on soil properties, considering the situations of two or just one application, demonstrated a tendency for an increase in soil organic matter in the Nutri, BSFly, and Mealw treatments compared to the unfertilized control. However, the FullR treatment consistently exhibited higher average values compared to the control, although without significant differences. This study's limited duration prevents providing fully consolidated results on soil organic matter dynamics. Nevertheless, it seemed evident that the application of organic amendments increased soil organic matter content through direct C input, a phenomenon frequently observed following such applications [13,18,49,54]. However, mineral fertilization can also sometimes increase soil organic matter content [61,62]. Increased primary productivity results in more organic substrate being deposited into the soil through roots and associated mycorrhizal fungi [63,64]. In this study, comparing organic amendments is complex because some (e.g., Mealw) may have undergone more mineralization, potentially reducing soil organic C content. On the other hand, the stimulation of lettuce growth was greater, contributing to higher C deposition in the soil through root system development. With the Nutri treatment, for example, the opposite may have occurred, with more original C remaining in the soil and a lesser contribution from the lettuce root system.
Due to the short duration of the experiments, only a few other soil properties varied significantly with the treatments. Extractable P and K values were the most dynamic variables, reflecting higher values in treatments with organic amendments, where significant amounts of nutrients were applied to the soil, and lower values in mineral treatments, where nutrients were not applied and there may have been greater nutrient removal by lettuce. Similar findings were observed in studies by Menino et al. [54] utilizing black soldier fly frass, demonstrating an elevation in soil nutrient levels corresponding to the main components of the organic amendment.
5. Conclusions
Mealworm larvae frass mineralized very rapidly, releasing N to lettuce at a much faster rate than its C/N ratio would predict. This suggests that the action of mealworm larvae produces an organic substrate that is very easily degraded by soil heterotrophic microorganisms. Consequently, it becomes a highly valuable organic amendment for application in early maturing annual crops that require a rapid release of nutrients. However, the high N release does not fully explain its effect on DMY, which tended to be even higher than that of the treatment that received the highest rate of mineral fertilizer (FullR) and resulted in plants with higher tissue N concentrations. A manuring effect was observed that cannot be achieved solely with mineral fertilizer. The results suggest the possibility of compounds within the mealworm larvae frass composition exerting a plant biostimulant effect, capable of enhancing productivity beyond nutrient release and its impact on soil properties. In future research, efforts should be made to assess the persistence of the biostimulant effect and elucidate its underlying mechanisms.
Black soldier fly frass exhibited typical behaviour of a conventional high-quality organic fertilizer, with just over 10% N release during the short lettuce growing cycle. It did not appear as reactive in the soil as mealworm larvae frass, nor did it demonstrate any apparent manuring or plant biostimulant effects.
Despite its low C/N ratio, Nutrimais showed little reactivity, with a nearly negligible N mineralization/immobilization balance during the short lettuce growing cycle. This result suggests that this fertilizer should preferably be used in perennial crops that do not rely on immediate nutrient release following the application of the organic amendment.
Author Contributions
M.F. investigation, writing—review and editing.: M.A.: funding acquisition, methodology, supervision, review and editing. M.Â.R.: conceptualisation, funding acquisition, project administration, data curation, writing—review and editing.
Funding
The authors are grateful to the Foundation for Science and Technology (FCT, Portugal) for financial support from national funds FCT/MCTES, to CIMO (UIDB/AGR/00690/2020) and SusTEC (LA/P/0007/2020).
Data Availability Statement
The data presented in this study are available on request from the corresponding author.
Conflicts of Interest
The authors declare no conflict of interest.
References
- United Nations, Department of Economic and Social Affairs, Population Division. World Population Prospects: The 2017 Revision, Key Findings and Advance Tables (ESA/P/WP/248). New York: United Nations, 2017.
- Terfa, N.G. Role of black soldier fly (Hermetia illucens) larvae frass bio-fertilizer on vegetable growth and sustainable farming in Sub-Saharan Africa. Rev. Agric. Sci. 2021, 9(0), 92–102. [Google Scholar] [CrossRef]
- Pretty, J.; Toulmin, C.; Williams, S. Sustainable intensification in African agriculture. Int. J. Agric. Sustain. 2011, 9, 5–24. [Google Scholar] [CrossRef]
- Scotti, R.; Dascoli, R.; Gonzalez Caceres, M.; Bonanomi, G.; Sultana, S.; Cozzolino, L.; Rao, M.A. Combined use of compost and wood scraps to increase carbon stock and improve soil quality in intensive farming systems. Eur. J. Soil Sci. 2015, 66, 463–475. [Google Scholar] [CrossRef]
- Kopittke, P.M.; Menzies, N.W.; Wang, P.; McKenna, B.A.; Lombi, E. Soil and the intensification of agriculture for global food security. Environ. Int. 2019, 232, 105078. [Google Scholar] [CrossRef]
- Fahad, S.; Ullah, A.; Ali, U.; Ali, E.; Saud, S.; Hakeem, K.R.; Arif, M. Drought tolerance in plants: role of phytohormones and scavenging system of ROS. In Plant Tolerance to Environmental Stress; CRC Press: Boca Raton, FL, USA, 2019; pp. 103–114. [Google Scholar]
- Gong, W.; Yan, X.; Wang, J.; Hu, T.; Gong, Y. Long-term manure and fertilizer effects on soil organic matter fractions and microbes under a wheat–maize cropping system in northern China. Geoderma 2009, 149, 318–324. [Google Scholar] [CrossRef]
- Hakeem, K.R.; Dar, G.H.; Mehmood, M.A.; Bhat, R.A. Microbiota and Biofertilizers: A Sustainable Continuum for Plant and Soil Health; Springer International Publishing: Cham, Switzerland, 2021. [Google Scholar]
- Savci, S. Investigation of effect of chemical fertilizers on environment. Apcbee Procedia 2012, 1, 287–292. [Google Scholar] [CrossRef]
- Huber, G.; Schaub, C. La fertilité des sols: L’importance de la matière organique. Agriculture et Terroir, 2011. [Google Scholar]
- Weil, R.R.; Brady, N.C. The Nature and Properties of Soils; Pearson Education Limited: Edinburgh, UK, 2017. [Google Scholar]
- Azizi, S.; Thomas, T.; Rao, S. Effect of different levels of chemical fertilizers on soil physicochemical properties of inceptisols. Int. J. Multidisc. Res. Dev. 2016, 3, 29–32. [Google Scholar]
- Lopes, J.I.; Gonçalves, A.; Brito, C.; Martins, S.; Pinto, L.; Moutinho-Pereira, J.; Raimundo, S.; Arrobas, M.; Rodrigues, M.A.; Correia, C.M. Inorganic fertilization at high n rate increased olive yield of a rainfed orchard but reduced soil organic matter in comparison to three organic amendments. Agronomy 2021, 11, 2172. [Google Scholar] [CrossRef]
- Bonanomi, G.; Ascoli, R.; Antignani, V.; Capodilupo, M.; Cozzolino, L.; Marzaioli, R.; Puopolo, G.; Rutigliano, F.A.; Scelza, R.; Scotti, R.; Rao, M.A.; Zoina, A. Assessing soil quality under intensive cultivation and tree orchards in Southern Italy. Appl. Soil Ecol. 2011, 47, 187–194. [Google Scholar] [CrossRef]
- Goss, M.J.; Tubeileh, A.; Goorahoo, D. A review of the use of organic amendments and the risk to human health. Adv. Agron. 2013, 120, 275–379. [Google Scholar] [CrossRef]
- Rodrigues, M.A.; Ladeira, L.C.; Arrobas, M. Azotobacter-enriched organic manures to increase nitrogen fixation and crop productivity. Eur. J. Agron. 2018, 93, 88–94. [Google Scholar] [CrossRef]
- Nanda, S.; Berruti, F. Municipal solid waste management and landfilling technologies: A review. Environ. Chem. Lett. 2021, 19, 1433–1456. [Google Scholar] [CrossRef]
- Arrobas, M.; Carvalho, J.T.N.; Raimundo, S.; Poggere, G.; Rodrigues, M.A. The safe use of compost derived from municipal solid waste depends on its composition and conditions of application. Soil Use Manag. 38, 917–928. [CrossRef]
- Dhanker, R.; Chaudhary, S.; Goyal, S.; Garg, V.K. Influence of urban sewage sludge amendment on agricultural soil parameters. Environ. Technol. Innov. 2021, 23, 101642. [Google Scholar] [CrossRef]
- Arrobas, M.; Meneses, R.; Gusmão, A.G.; da Silva, J.M.; Correia, C.M.; Rodrigues, M.Â. Nitrogen-rich sewage sludge mineralized quickly, improving lettuce nutrition and yield, with reduced risk of heavy metal contamination of soil and plant tissues. Agronomy 2024, 14, 924. [Google Scholar] [CrossRef]
- Afonso, S.; Pereira, E.; Arrobas, M.; Rodrigues, M.A. Recycling nutrient-rich hop leaves by composting with wheat straw and farmyard manure in suitable mixtures. J. Environ. Manag. 2021, 284, 112105. [Google Scholar] [CrossRef]
- Policastro, G.; Cesaro, A. Composting of organic solid waste of municipal origin: the role of research in enhancing its sustainability. Int. J. Environ. Res. Public Health 2023, 20, 312. [Google Scholar] [CrossRef]
- Beesigamukama, D.; Mochoge, B.; Korir, N.; Musyoka, M.W.; Fiaboe, K.; Nakimbugwe, D.; Tanga, C.M. Nitrogen fertilizer equivalence of black soldier fly frass fertilizer and synchrony of nitrogen mineralization for maize production. Agronomy 2020, 10, 1395. [Google Scholar] [CrossRef]
- Beesigamukama, D.; Subramanian, S.; Tanga, C.M. Nutrient quality and maturity status of frass fertilizer from nine edible insects. Sci. Rep. 2022, 12, 7182. [Google Scholar] [CrossRef]
- International Platform of Insects for Food and Feed (IPIFF). IPIFF Contribution Paper on the Application of Insect Frass as Fertilising Product in Agriculture; IPIFF: Brussels, Belgium, 2019. [Google Scholar]
- EC (European Commission). Circular Economy Action Plan: The European Green Deal; European Union: Brussels, Belgium, 2020. [Google Scholar]
- Pickett, J.A. Food security: intensification of agriculture is essential, for which current tools must be defended and new sustainable technologies invented. Food Energy Secur. 2013, 2, 167–173. [Google Scholar] [CrossRef]
- Liu, T.; Bruins, R.J.F.; Heberling, M.T. Factors Influencing Farmers’ Adoption of Best Management Practices: A Review and Synthesis. Sustainability 2018, 10, 432. [Google Scholar] [CrossRef]
- Dzepe, D.; Mbenda, T.K.; Ngassa, G.; Mube, H.; Chia, S.Y.; Aoudou, Y.; Djouaka, R. Application of black soldier fly frass, Hermetia illucens (Diptera: Stratiomyidae) as sustainable organic fertilizer for lettuce, Lactuca sativa production. Open J. Appl. Sci. 2022, 12, 1632–1648. [Google Scholar] [CrossRef]
- Instituto Português do Mar e da Atmosfera (IPMA). Normais Climatológicas. 2024. Available online: https://www.ipma.pt/pt/oclima/normais.clima/ (accessed on 15 April 2024).
- Meier, U. Growth Stages of Mono and Dicotyledonous Plants; Federal Biological Research Centre for Agriculture and Forestry: Berlin, Germany, 2018. [Google Scholar]
- Temminghoff, E.E.; Houba, V.J. Plant Analysis Procedures, 2nd ed.; Kluwer Academic Publishers: London, UK, 2004. [Google Scholar] [CrossRef]
- Baird, R.B.; Eaton, A.D.; Rice, E.W. Nitrate by ultraviolet spectrophotometric method. In Standard Methods for the Examination of Water and Wastewater; American Public Health Association, American Water Works Association, Water Environment Federation: Washington, DC, USA, 2017. [Google Scholar]
- Van Reeuwijk, L.P. Procedures for Soil Analysis, 6th ed.; Technical Paper 9. ISRIC; FAO: Rome, Italy, 2002. [Google Scholar]
- FAO. Standard Operating Procedure for Soil Available Micronutrients (Cu, Fe, Mn, Zn) and Heavy Metals (Ni, Pb, Cd), DTPA Extraction Method. Rome, 2022. Available online: https://www.fao.org/3/cc0048en/cc0048en.pdf (accessed on 9 April 2024).
- Yahbi, M.; Nabloussi, A.; Maataoui, A.; El Alami, N.; Boutagayout, A.; Daoui, K. Effects of nitrogen rates on yield, yield components, and other related attributes of different rapeseed (Brassica napus L.) varieties. OCL. [CrossRef]
- Aghabeygi, M.; Dönmez, C. Estimating yield response functions to nitrogen for annual crops in Iran. Agronomy 2024, 14, 436. [Google Scholar] [CrossRef]
- Houben, D.; Daoulas, G.; Faucon, M.P.; Dulaurent, A.M. Potential use of mealworm frass as a fertilizer: impact on crop growth and soil properties. Sci. Rep. 2020, 10, 4659. [Google Scholar] [CrossRef]
- Myrold, D.D.; Bottomley, P.Y. Nitrogen mineralization and immobilization. In Nitrogen in Agricultural Systems; Schepers, J., Raun, W.R., Eds.; Agronomy Monograph No. 49; ASA, CSSA, SSSA: Madison, WI, USA, 2008; pp. 157–172. [Google Scholar]
- Cao, Y.; Zhao, F.; Zhang, Z.; Zhu, T.; Xiao, H. Biotic and abiotic nitrogen immobilization in soil incorporated with crop residue. Soil Till. Res. 2020, 202, 104664. [Google Scholar] [CrossRef]
- Xie, J.; Shi, X.; Zhang, Y.; Wan, Y.; Hu, Q.; Zhang, Y.; Wang, J.; He, X.; Evgenia, B. Improved nitrogen use efficiency, carbon sequestration and reduced environmental contamination under a gradient of manure application. Soil Till. Res. 2022, 220, 105386. [Google Scholar] [CrossRef]
- Bryson, G.M.; Mills, H.A.; Sasseville, D.N.; Jones, J.J., Jr.; Barker, A.V. Plant Analysis Handbook II: A Guide to Sampling, Preparation, Analysis, Interpretation and Use of Results of Agronomic and Horticultural Crop Plant Tissue; Micro-Macro Publishing, Inc.: Athens, GA, USA, 2014. [Google Scholar]
- Havlin, J.L.; Beaton, J.D.; Tisdale, S.L.; Nelson, W.L. Soil Fertility and Fertilizers: An Introduction to Nutrient Management, 8th ed.; Pearson, Inc.: Chennai, India, 2017. [Google Scholar]
- Rodrigues, M.Â.; Torres, L.N.D.; Damo, L.; Raimundo, S.; Sartor, L.; Cassol, L.C.; Arrobas, M. Nitrogen use efficiency and crop yield in four successive crops following application of biochar and zeolites. J. Soil Sci. Plant Nutr. 2021, 21, 1053–1065. [Google Scholar] [CrossRef]
- Almeida, D. Manual de Culturas Hortícolas; 2nd ed.; Editorial Presença: Queluz de Baixo, Portugal, 2006; Volume I. [Google Scholar]
- Li, G.; Huang, G.; Li, H.; van Ittersum, M.K.; Leffelaar, P.A.; Zhang, F. Identifying potential strategies in the key sectors of China’s food chain to implement sustainable phosphorus management: A review. Nutr. Cycl. Agroecosyst. 2016, 104, 341–359. [Google Scholar] [CrossRef]
- Tian, D.; Li, Z.; O'Connor, D.; Shen, Z. The need to prioritize sustainable phosphate-based fertilizers. Soil Use Manage. 2020, 36, 351–354. [Google Scholar] [CrossRef]
- Du, M.; Zhang, W.; Gao, J.; Liu, M.; Zhou, Y.; He, D.; Zhao, Y.; Liu, S. Improvement of root characteristics due to nitrogen, phosphorus, and potassium interactions increases rice (Oryza sativa L.) yield and nitrogen use efficiency. Agronomy 2022, 12, 23. [Google Scholar] [CrossRef]
- Su, L.; Bai, T.; Qin, X.; Yu, H.; Wu, G.; Zhao, Q.; Tan, L. Organic manure induced soil food web of microbes and nematodes drive soil organic matter under jackfruit planting. Appl. Soil Ecol. 2021, 166, 103994. [Google Scholar] [CrossRef]
- Hua, W.; Luo, P.; An, N.; Zhang, F.; Feng, G.; et al. Manure application increased crop yields by promoting nitrogen use efficiency in the soils of 40-year soybean-maize rotation. Sci. Rep. 2020, 10, 14882. [Google Scholar] [CrossRef]
- Dimande, P.; Arrobas, M.; Rodrigues, M.Â. Effect of bat guano and biochar on okra yield and some soil properties. Horticulturae 2023, 9, 728. [Google Scholar] [CrossRef]
- Poveda, J.; Jiménez-Gómez, A.; Saati-Santamaría, Z.; Usategui-Martín, R.; Rivas, R.; García-Fraile, P. Mealworm frass as a potential biofertilizer and abiotic stress tolerance-inductor in plants. Appl. Soil Ecol. 2019, 142, 110–122. [Google Scholar] [CrossRef]
- Fuertes-Mendizábal, T.; Salcedo, I.; Huérfano, X.; Riga, P.; Estavillo, J.M.; Ávila Blanco, D.; Duñabeitia, M.K. Mealworm frass as a potential organic fertilizer in synergy with pgp-based biostimulant for lettuce plants. Agronomy 2023, 13, 1258. [Google Scholar] [CrossRef]
- Menino, R.; Felizes, F.; Castelo-Branco, M.A.; Fareleira, P.; Moreira, O.; Nunes, R.; Murta, D. Agricultural value of black soldier fly larvae frass as organic fertilizer on ryegrass. Heliyon. [CrossRef]
- Chavez, M.Y.; Uchanski, M.; Tomberlin, J.K. Impacts of black soldier fly, Hermetia illucens, larval frass on lettuce and arugula production. Front. Sustain. Food Syst. 2024, 8, 1399932. [Google Scholar] [CrossRef]
- Carroll, A.; Fitzpatrick, M.; Hodge, S. The effects of two organic soil amendments, biochar and insect frass fertilizer, on shoot growth of cereal seedlings. Plants 2023, 12, 1071. [Google Scholar] [CrossRef]
- Hawkesford, M.J.; Cakmak, I.; Coskun, D.; De Kok, L.J.; Lambers, H.; Schjoerring, J.K.; White, P.J. Functions of macronutrients. In Marschner's Mineral Nutrition of Higher Plants, 4th ed.; Rengel, Z., Cakmak, I., White, P.J., Eds.; Academic Press, Elsevier: London, UK, 2023; pp. 201–281. [Google Scholar] [CrossRef]
- Conversa, G.; Bonasia, A.; Lazzizera, C.; La Rotonda, P.; Elia, A. Reduction of nitrate content in baby-leaf lettuce and Cichorium endivia through the soilless cultivation system, electrical conductivity and management of nutrient solution. Front. Plant Sci. 2021, 12, 645671. [Google Scholar] [CrossRef]
- Luetic, S.; Knezovic, Z.; Jurcic, K.; Majic, Z.; Tripkovic, K.; Sutlovic, D. Leafy vegetable nitrite and nitrate content: potential health effects. Foods 2023, 12, 1655. [Google Scholar] [CrossRef]
- Arrobas, M.; de Almeida, S.F.; Raimundo, S.; da Silva Domingues, L.; Rodrigues, M.Â. Leonardites rich in humic and fulvic acids had little effect on tissue elemental composition and dry matter yield in pot-grown olive cuttings. Soil Syst. 6, 7. [CrossRef]
- Arrobas, M.; Andrade, M.; Raimundo, S.; Mazaro, S.M.; Rodrigues, M.A. Lettuce response to the application of two commercial leonardites and their effect on soil properties in a growing medium with nitrogen as the main limiting factor. J. Plant Nutr. 2023, 46, 4280–4294. [Google Scholar] [CrossRef]
- Silva, E.; Arrobas, M.; Gonçalves, A.; Martins, S.; Raimundo, S.; Pinto, L.; Brito, C.; Moutinho-Pereira, J.; Correia, C.M.; Rodrigues, M.A. A controlled-release fertilizer improved soil fertility but not olive tree performance. Nutr. Cycl. Agroecosyst. 2021, 120, 1–15. [Google Scholar] [CrossRef]
- Godbold, D.L.; Hoosbeek, M.R.; Lukac, M.; Cotrufo, M.F.; Janssens, I.A.; Ceulemans, R.; Polle, A.; Velthorst, E.J.; Scarascia-Mugnozza, G.; Angelis, P.; et al. Mycorrhizal hyphal turnover as a dominant process for carbon input into soil organic matter. Plant Soil 2006, 281, 15–24. [Google Scholar] [CrossRef]
- Högberg, M.N.; Skyllberg, U.; Högberg, P.; Knicker, H. Does ectomycorrhiza have a universal key role in the formation of soil organic matter in boreal forests? Soil Biol. Biochem. 2020, 140, 107635. [Google Scholar] [CrossRef]
Figure 1.
Climatological normal data for the region (1981-2010) and monthly average air temperature and precipitation during the experimental period.
Figure 1.
Climatological normal data for the region (1981-2010) and monthly average air temperature and precipitation during the experimental period.
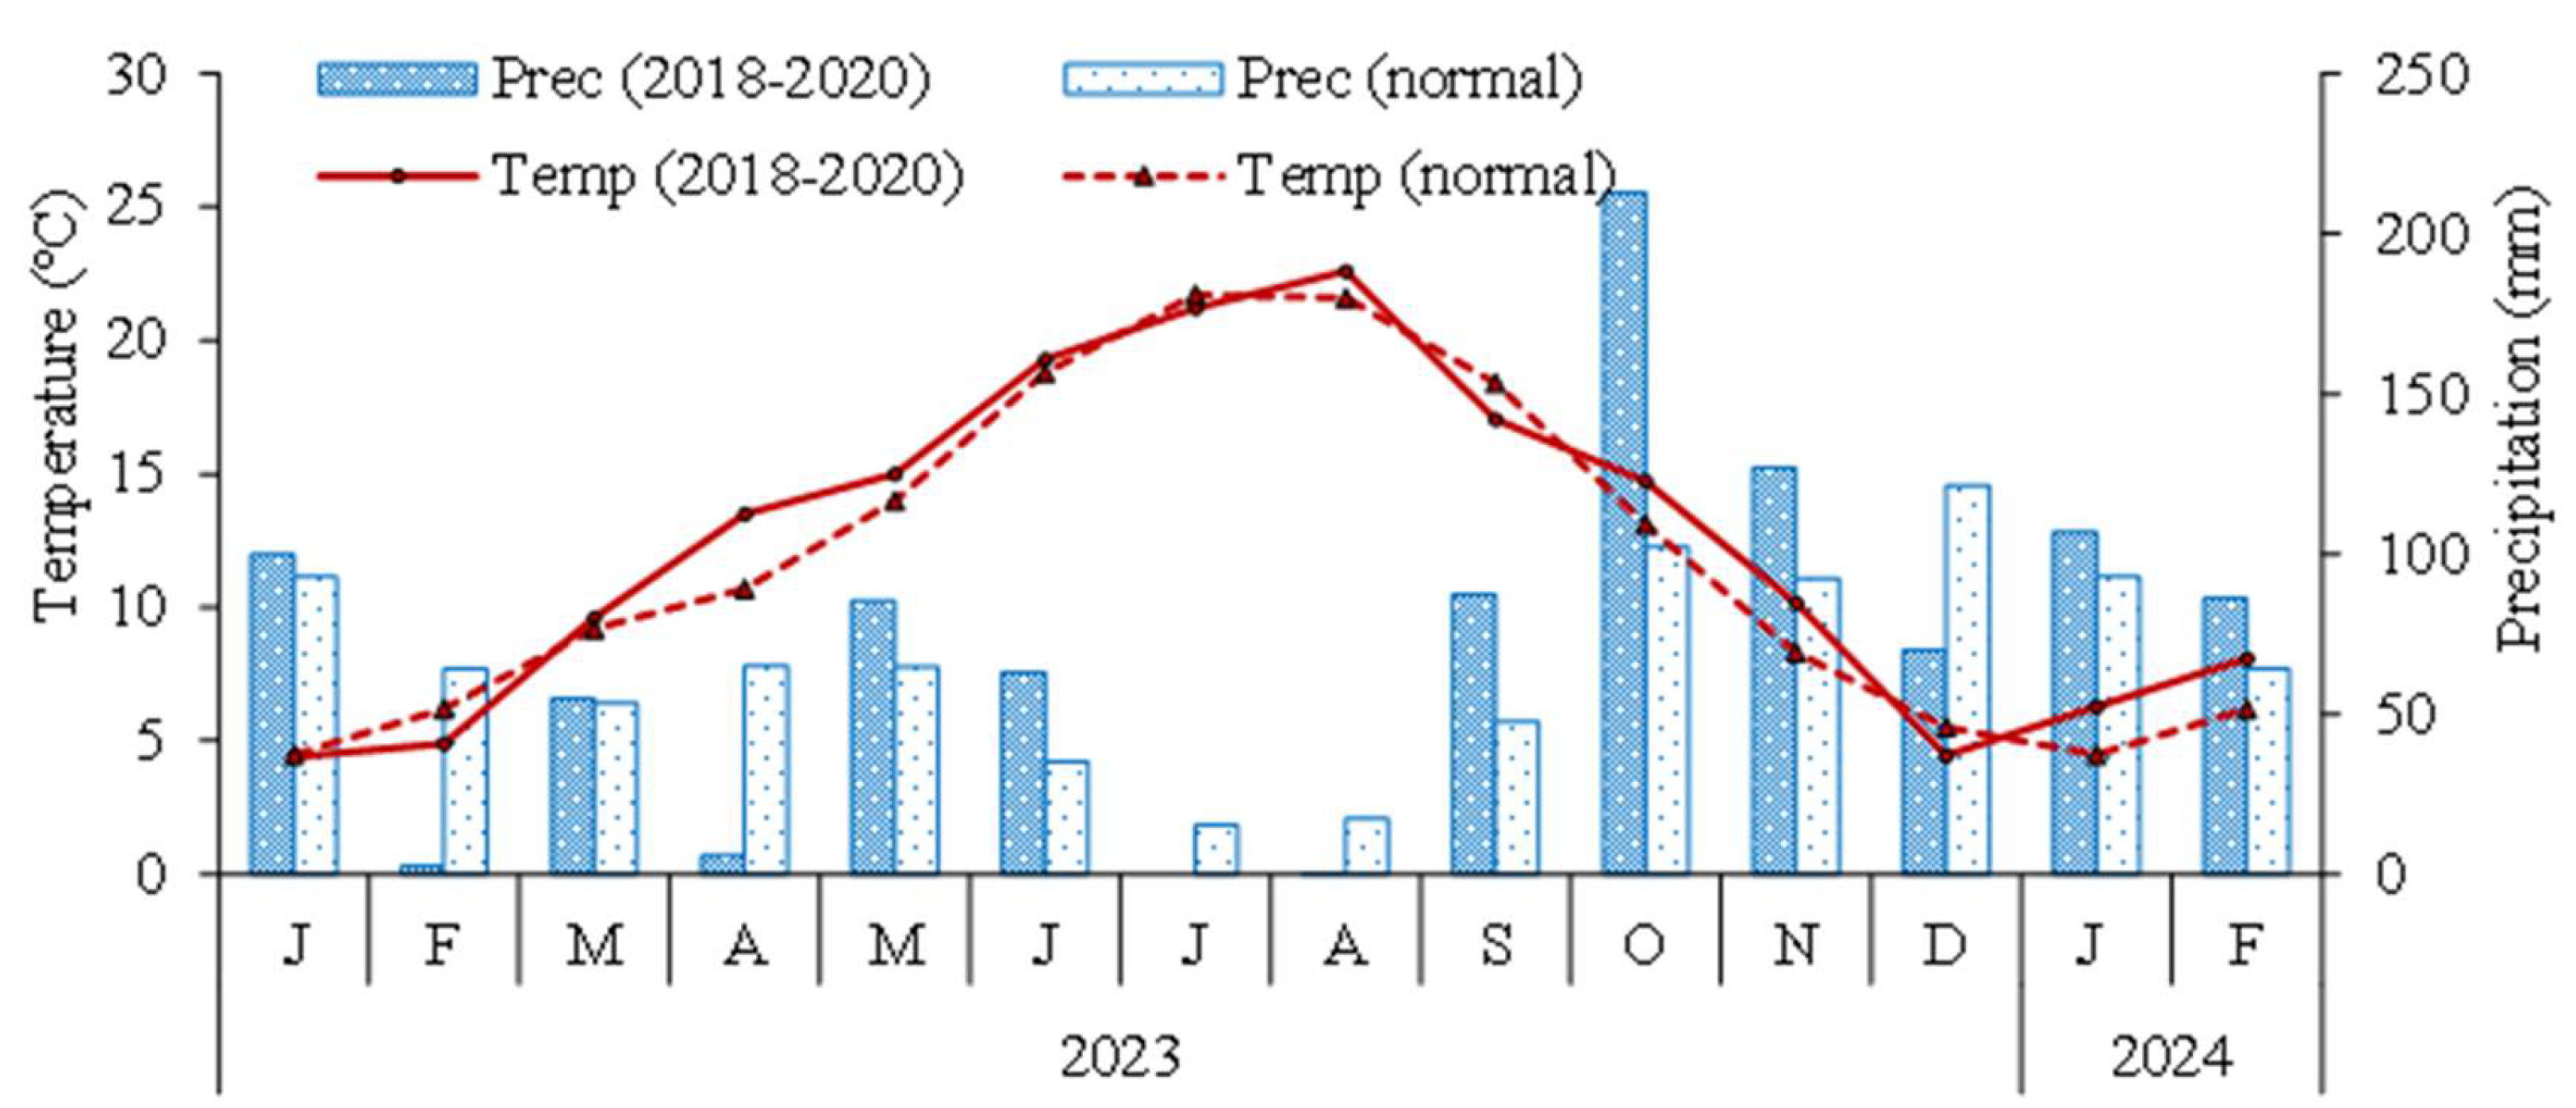
Figure 2.
Dry matter yield of lettuce across fertilization treatments [Control (Cont), Nutrimais (Nutri), black soldier fly larvae frass (BSFly), mealworm larvae frass (Mealw), half the rate ammonium nitrate (HalfR), full rate of ammonium nitrate (FullR)] in the first growing cycle. Means with the same letter are not significantly different (Tukey HSD test, α = 0.05). Vertical bars represent standard errors.
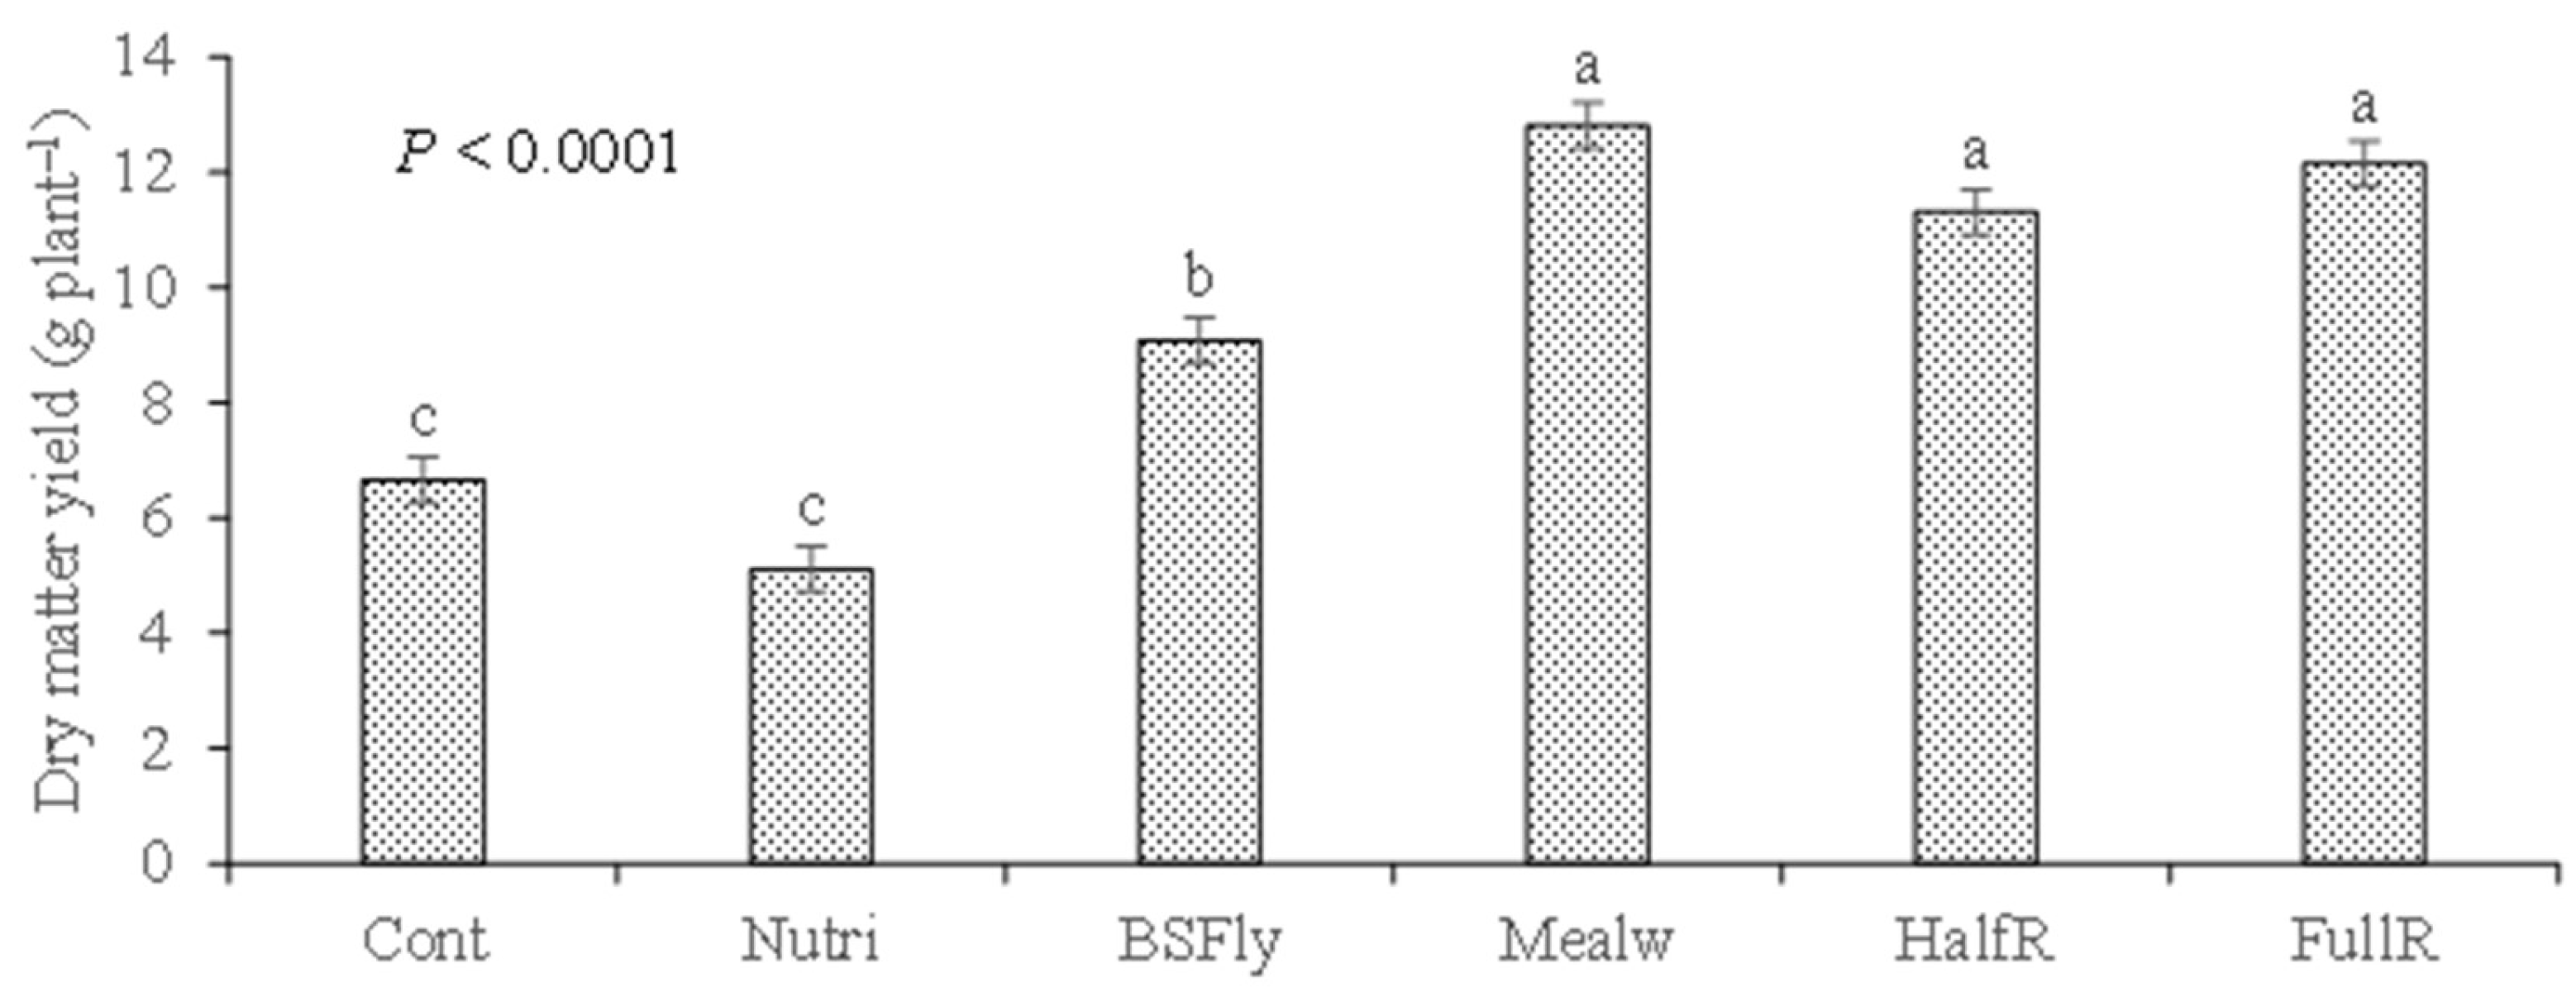
Figure 3.
Dry matter yield of lettuce across fertilization treatments [Control (Cont), Nutrimais (Nutri), black soldier fly larvae frass (BSFly), mealworm larvae frass (Mealw), half the rate ammonium nitrate (HalfR), full rate of ammonium nitrate (FullR)] in the second growing cycle, in pots that received (a) and did not receive (b) the second dose of organic amendments and fertilizers. Means with the same letter are not significantly different (Tukey HSD test, α = 0.05). Vertical bars represent standard errors.
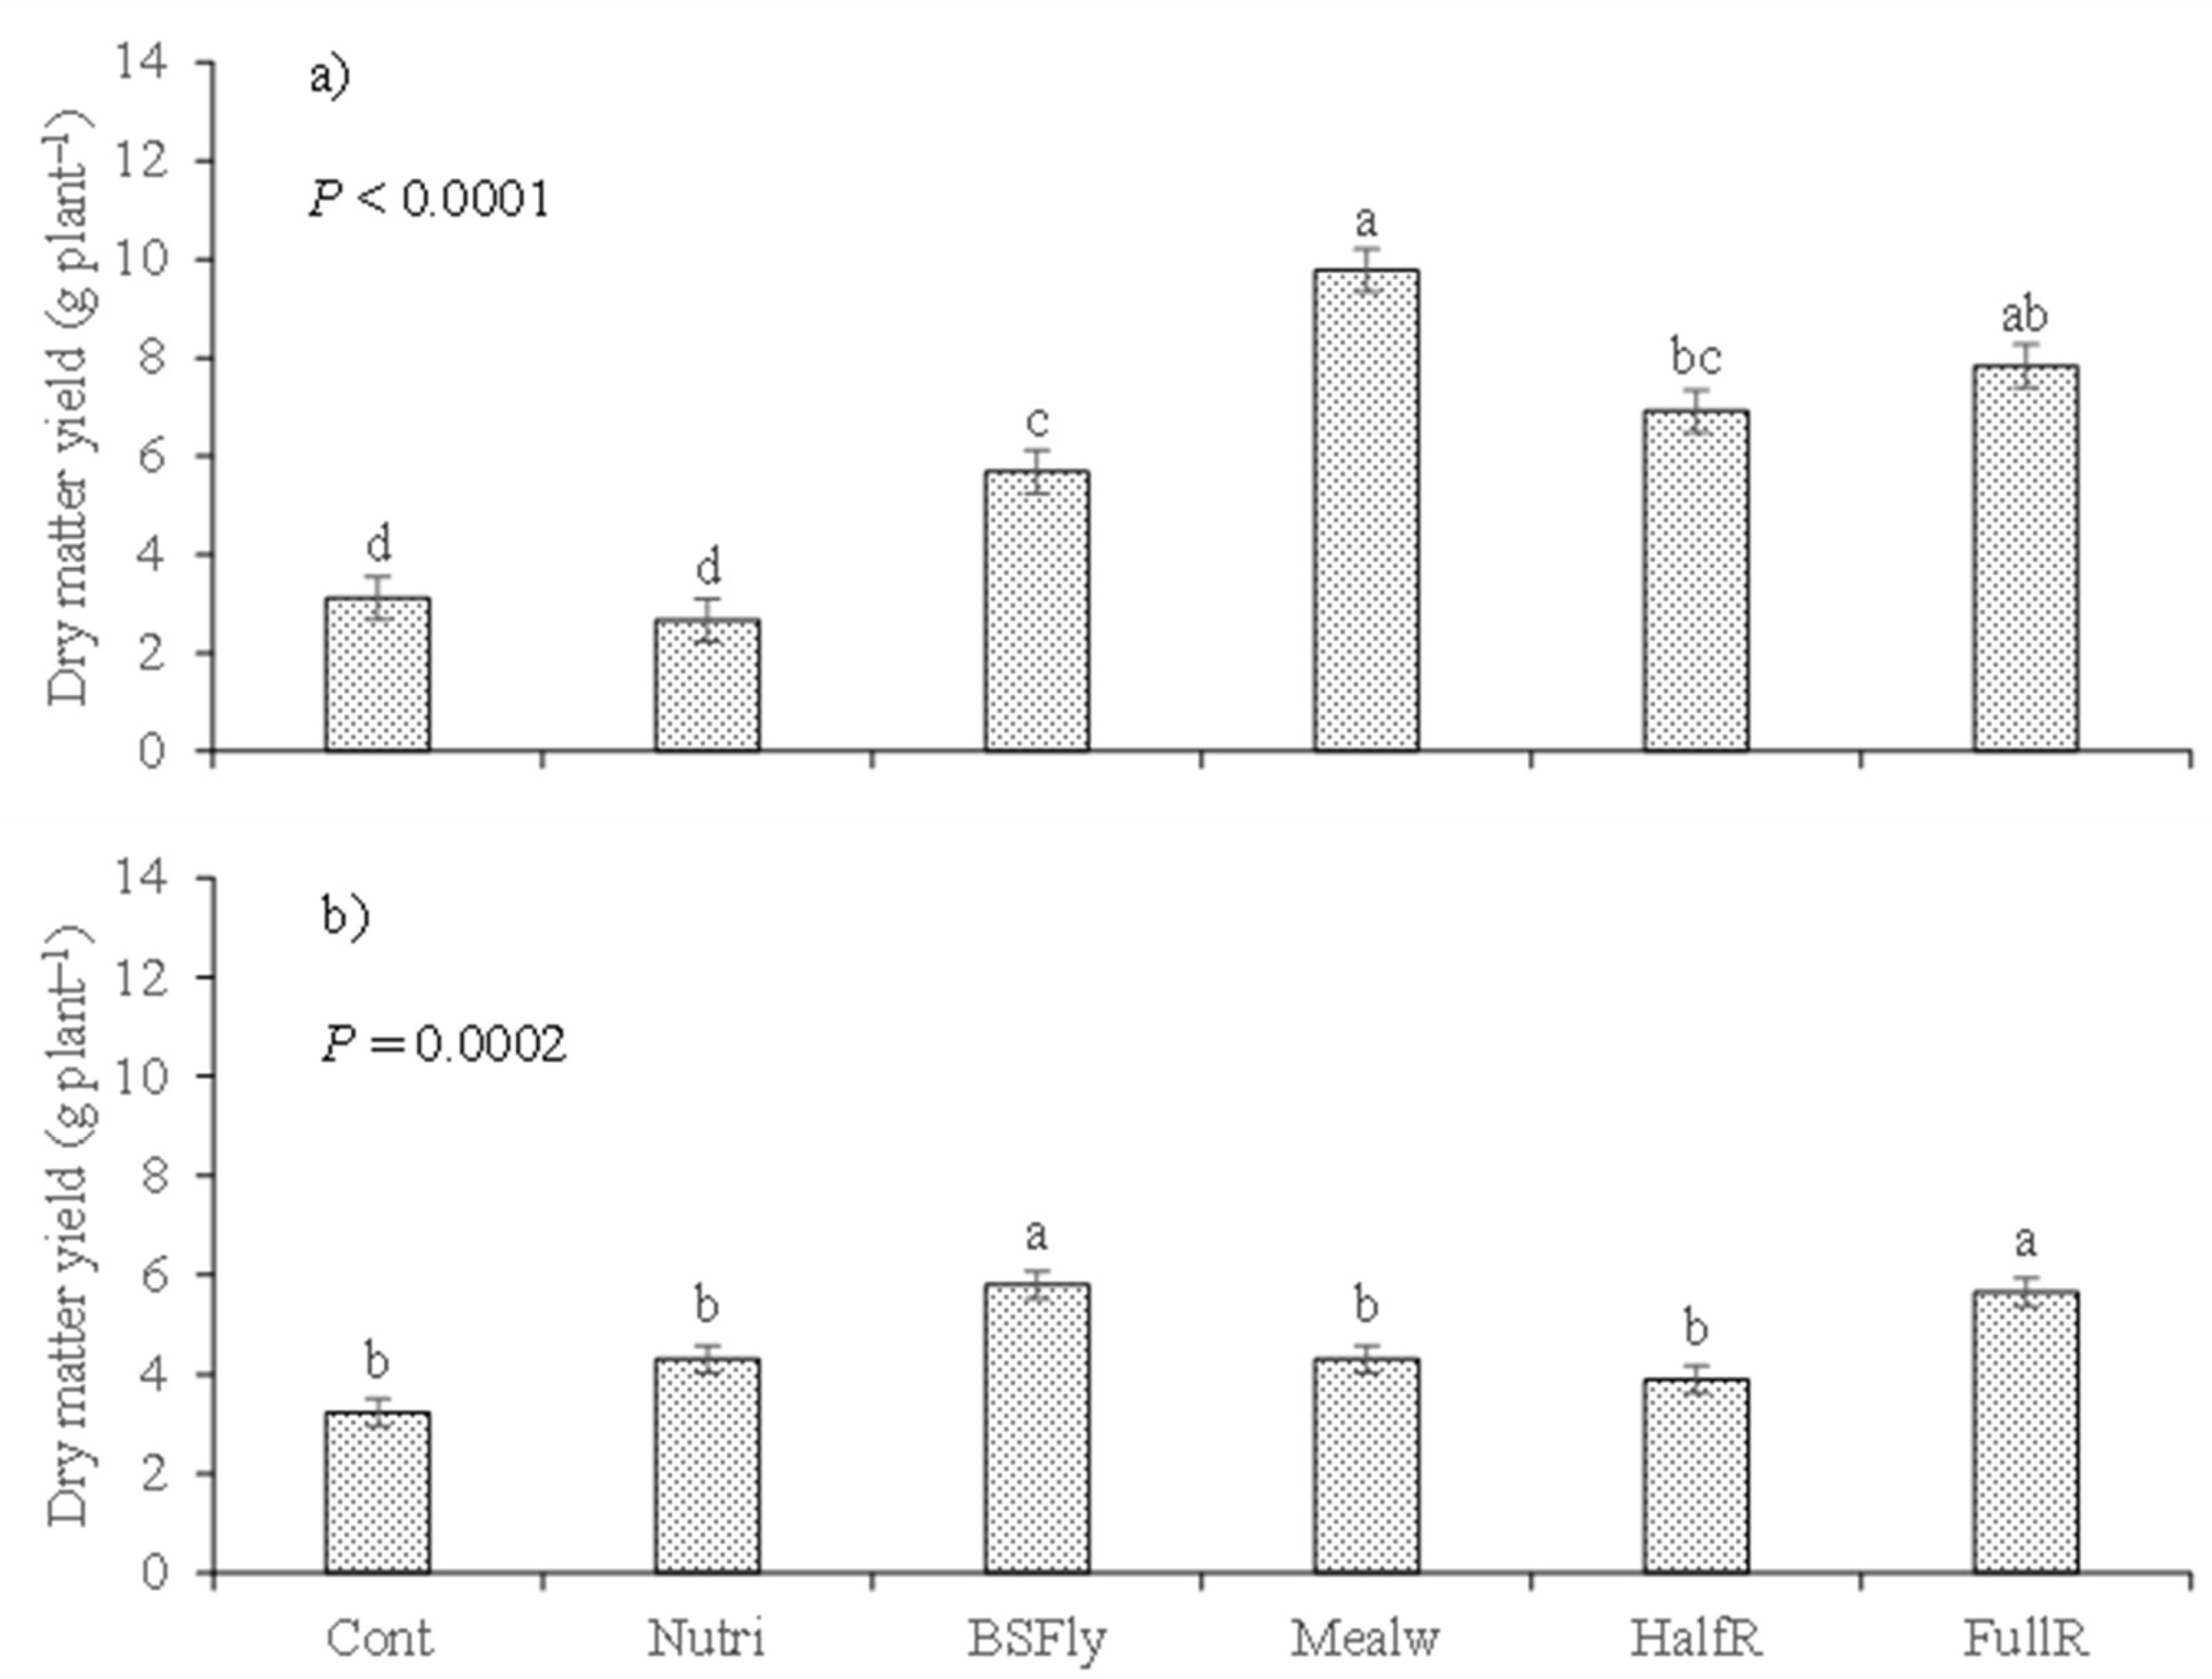
Figure 4.
Nitrogen (N) concentration in lettuce tissues across fertilization treatments [Control (Cont), Nutrimais (Nutri), black soldier fly larvae frass (BSFly), mealworm larvae frass (Mealw), half the rate ammonium nitrate (HalfR), full rate of ammonium nitrate (FullR)] in the first growing cycle. Means with the same letter are not significantly different (Tukey HSD test, α = 0. 05). Vertical bars represent standard errors.
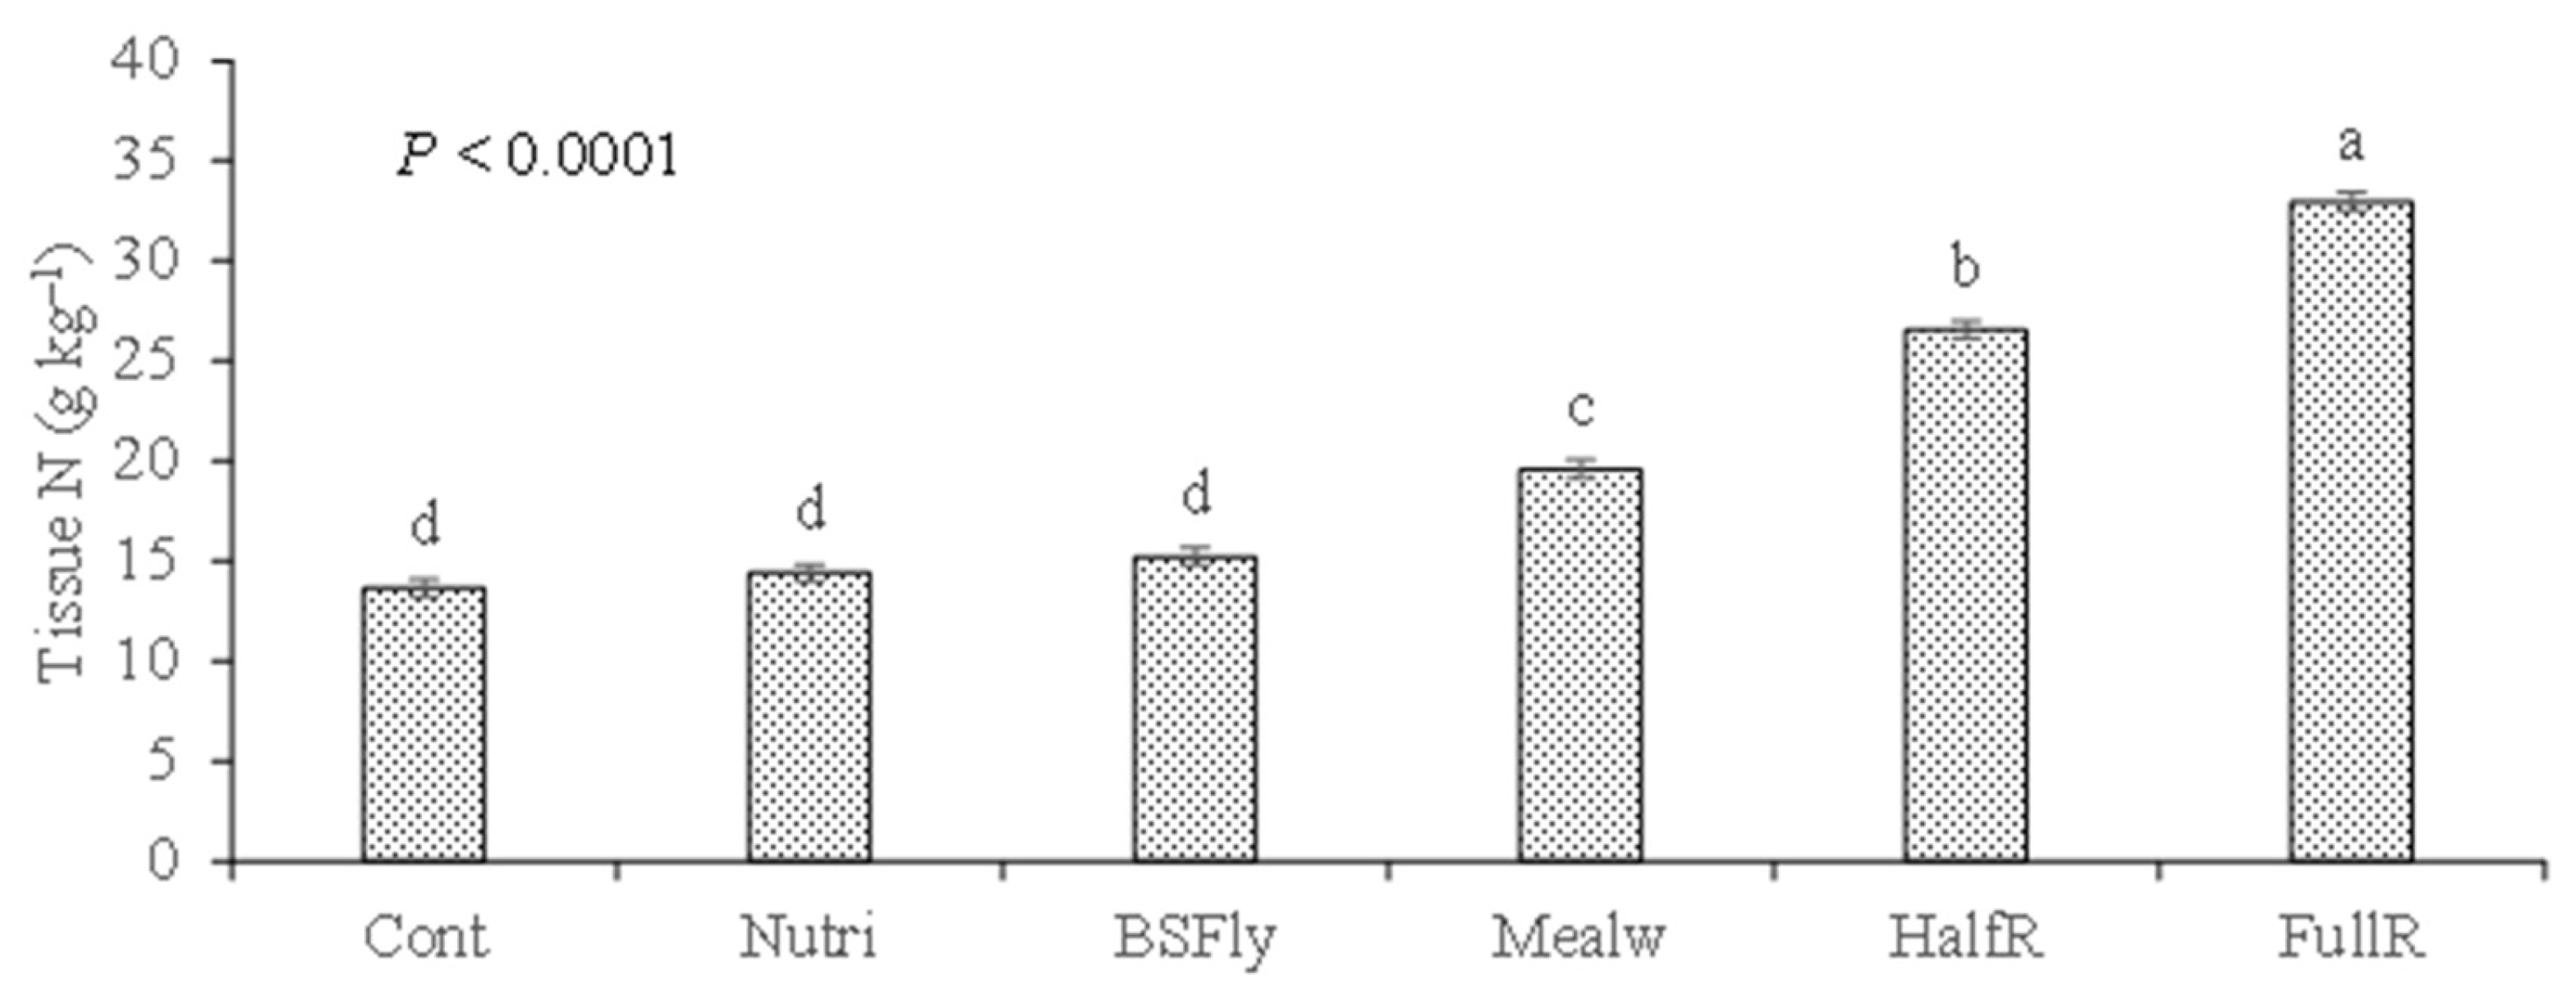
Figure 5.
Nitrogen (N) concentration in lettuce tissues across fertilization treatments [Control (Cont), Nutrimais (Nutri), black soldier fly larvae frass (BSFly), mealworm larvae frass (Mealw), half the rate ammonium nitrate (HalfR), full rate of ammonium nitrate (FullR)] in the second growing cycle, in pots that received (a) and did not receive (b) the second dose of organic amendments and fertilizers. Means with the same letter are not significantly different (Tukey HSD test, α = 0.05). Vertical bars represent standard errors.
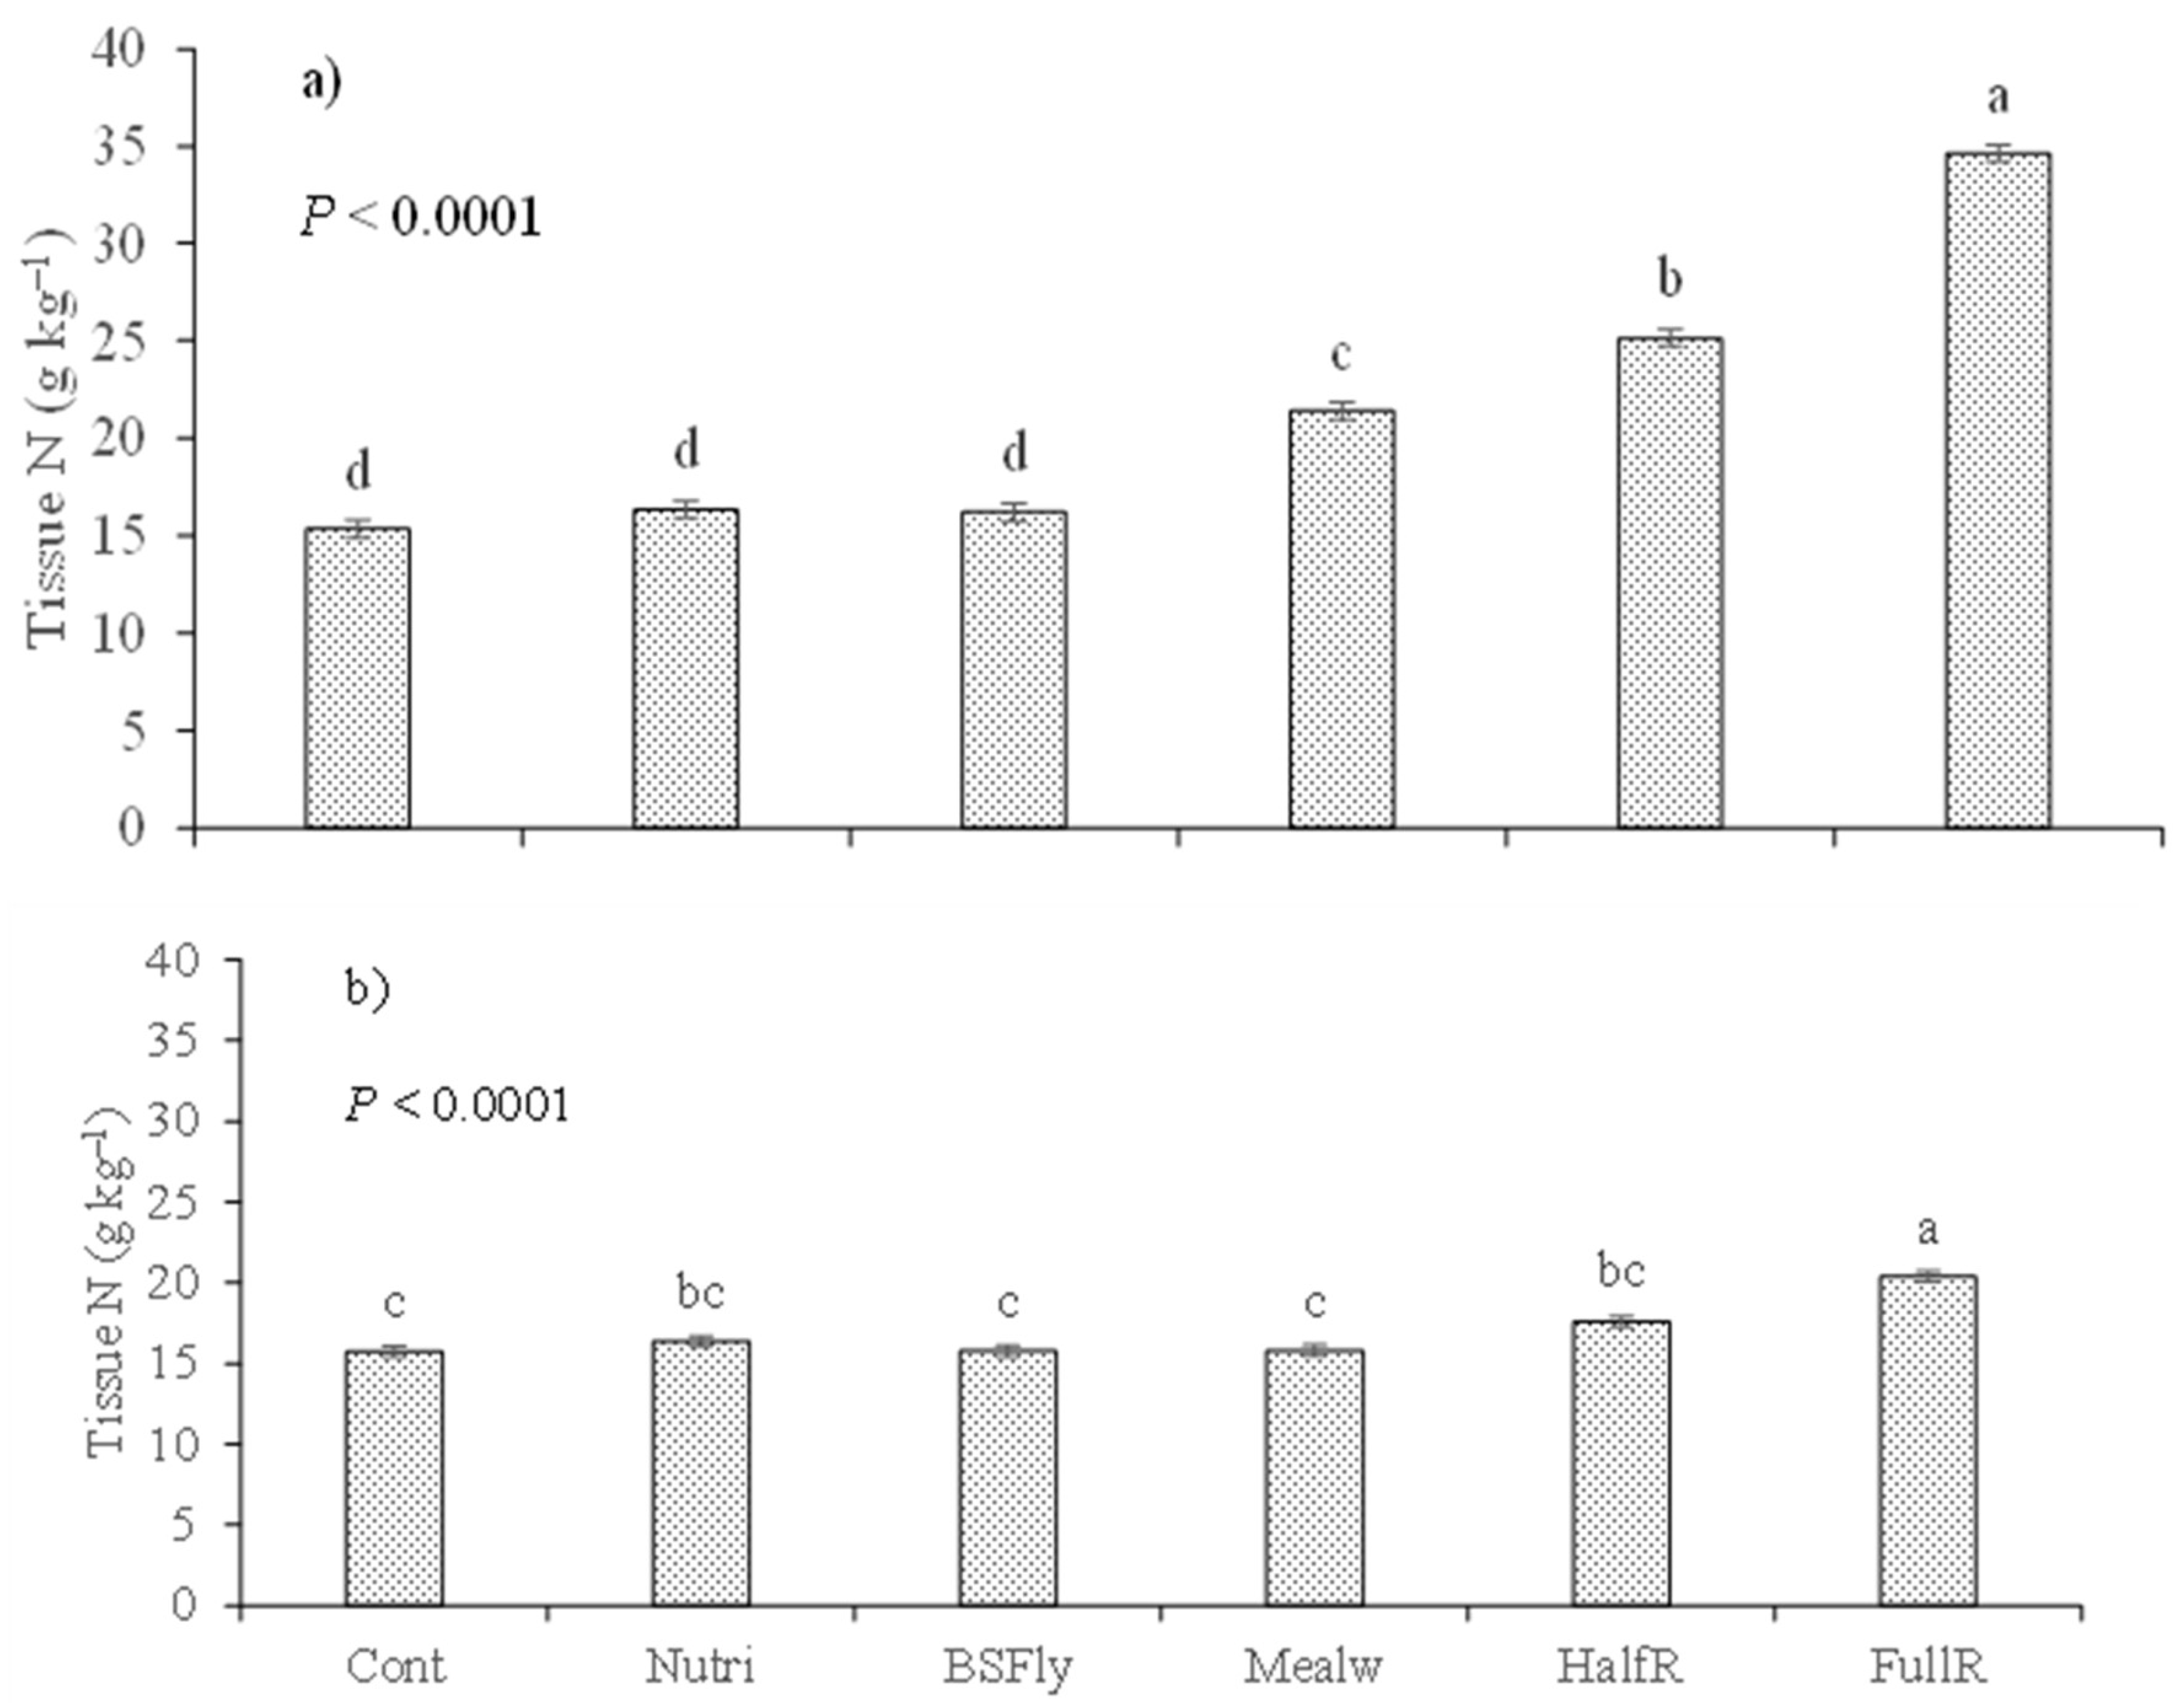
Figure 6.
Nitrate (NO3-) concentration in lettuce tissues across fertilization treatments [Control (Cont), Nutrimais (Nutri), black soldier fly larvae frass (BSFly), mealworm larvae frass (Mealw), half the rate ammonium nitrate (HalfR), full rate of ammonium nitrate (FullR)] in the first growing cycle. Means with the same letter are not significantly different (Tukey HSD test, α = 0.05). Vertical bars represent standard errors.
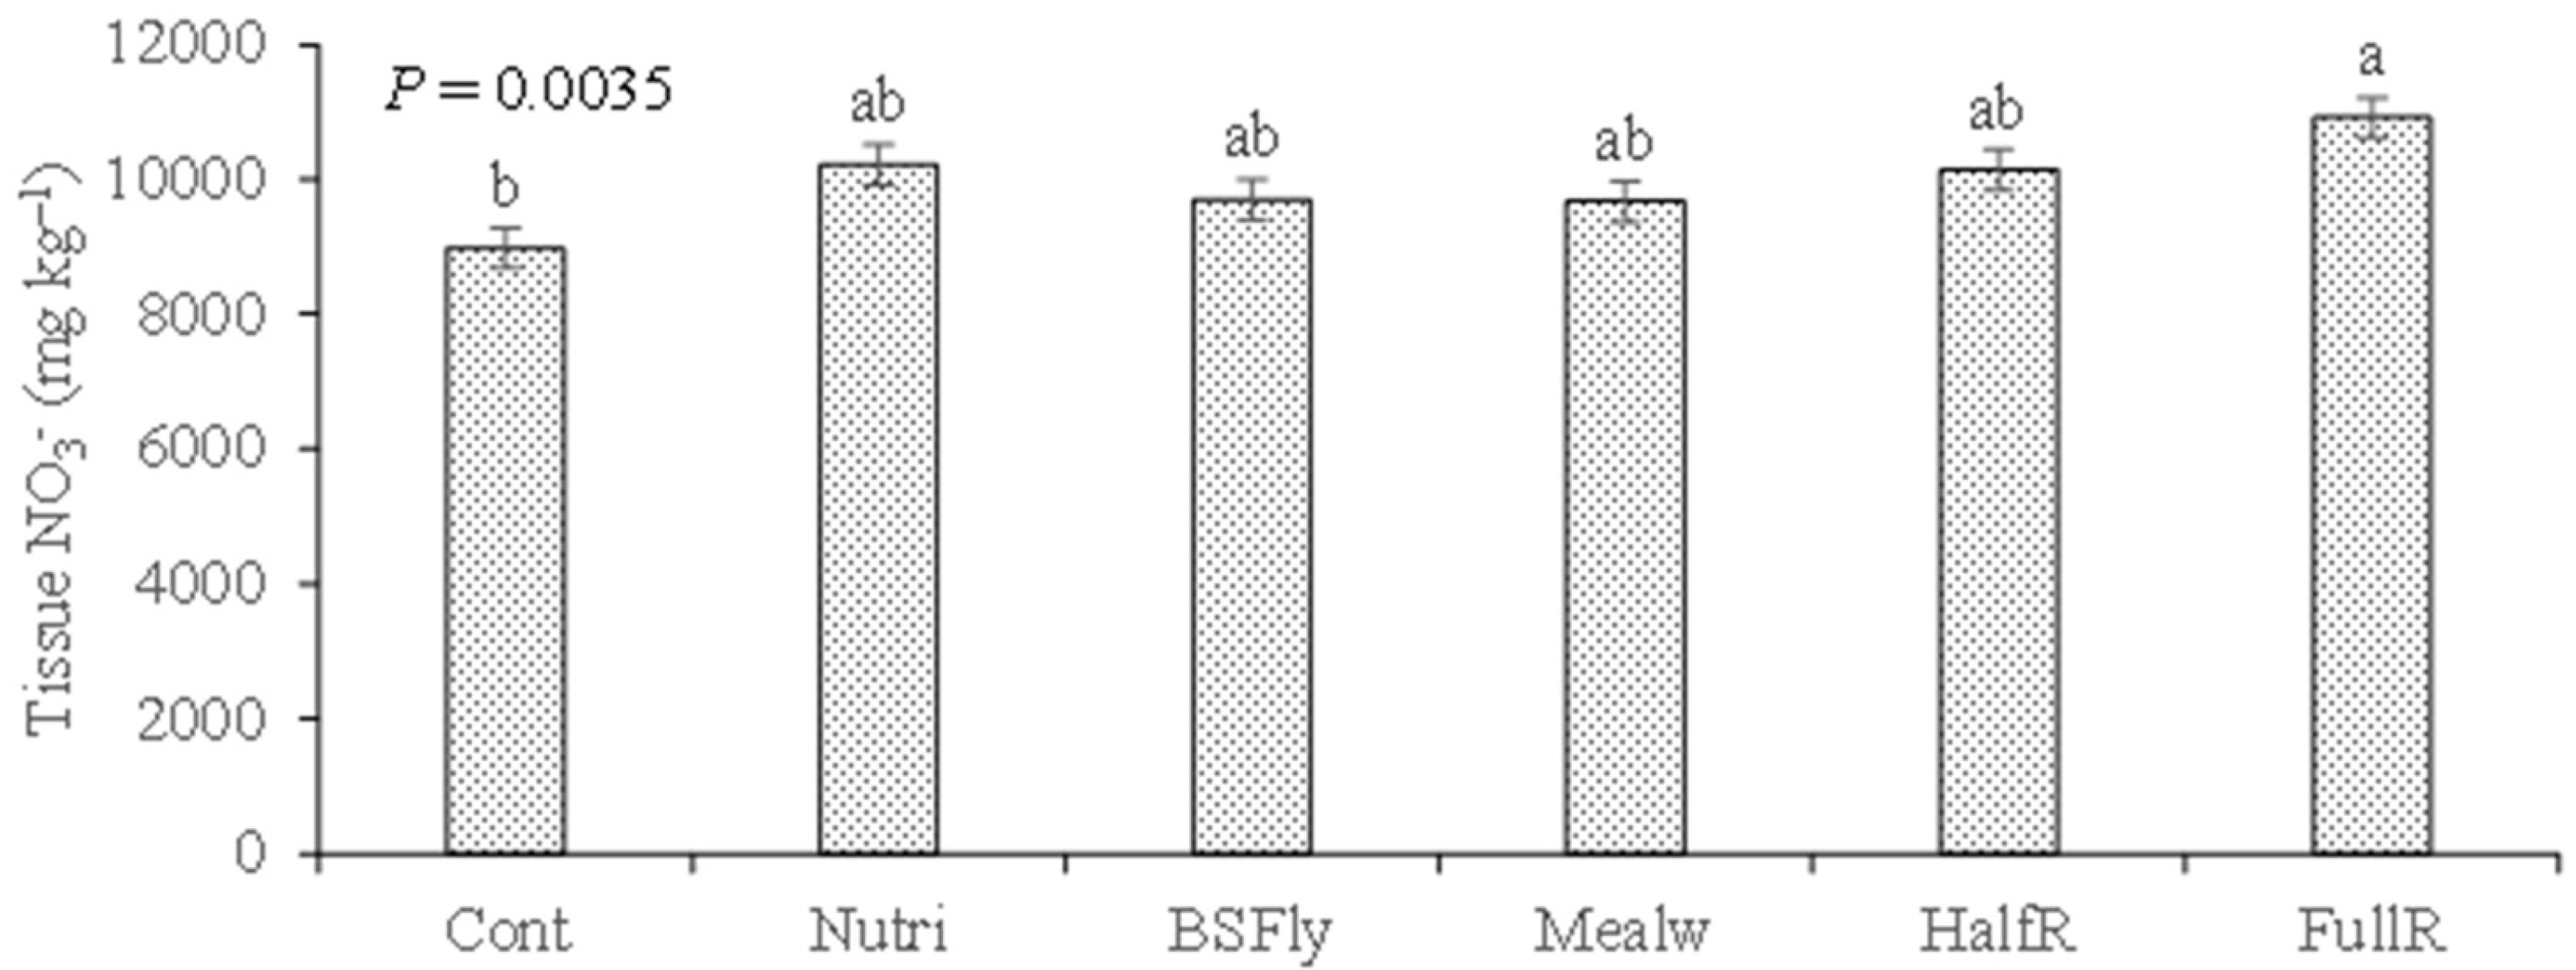
Figure 7.
Nitrate (NO3-) concentration in lettuce tissues across fertilization treatments [Control (Cont), Nutrimais (Nutri), black soldier fly larvae frass (BSFly), mealworm larvae frass (Mealw), half the rate ammonium nitrate (HalfR), full rate of ammonium nitrate (FullR)] in the second growing cycle, in pots that received (a) and did not receive (b) the second dose of organic amendments and fertilizers. Means with the same letter are not significantly different (Tukey HSD test, α = 0.05). Vertical bars represent standard errors.
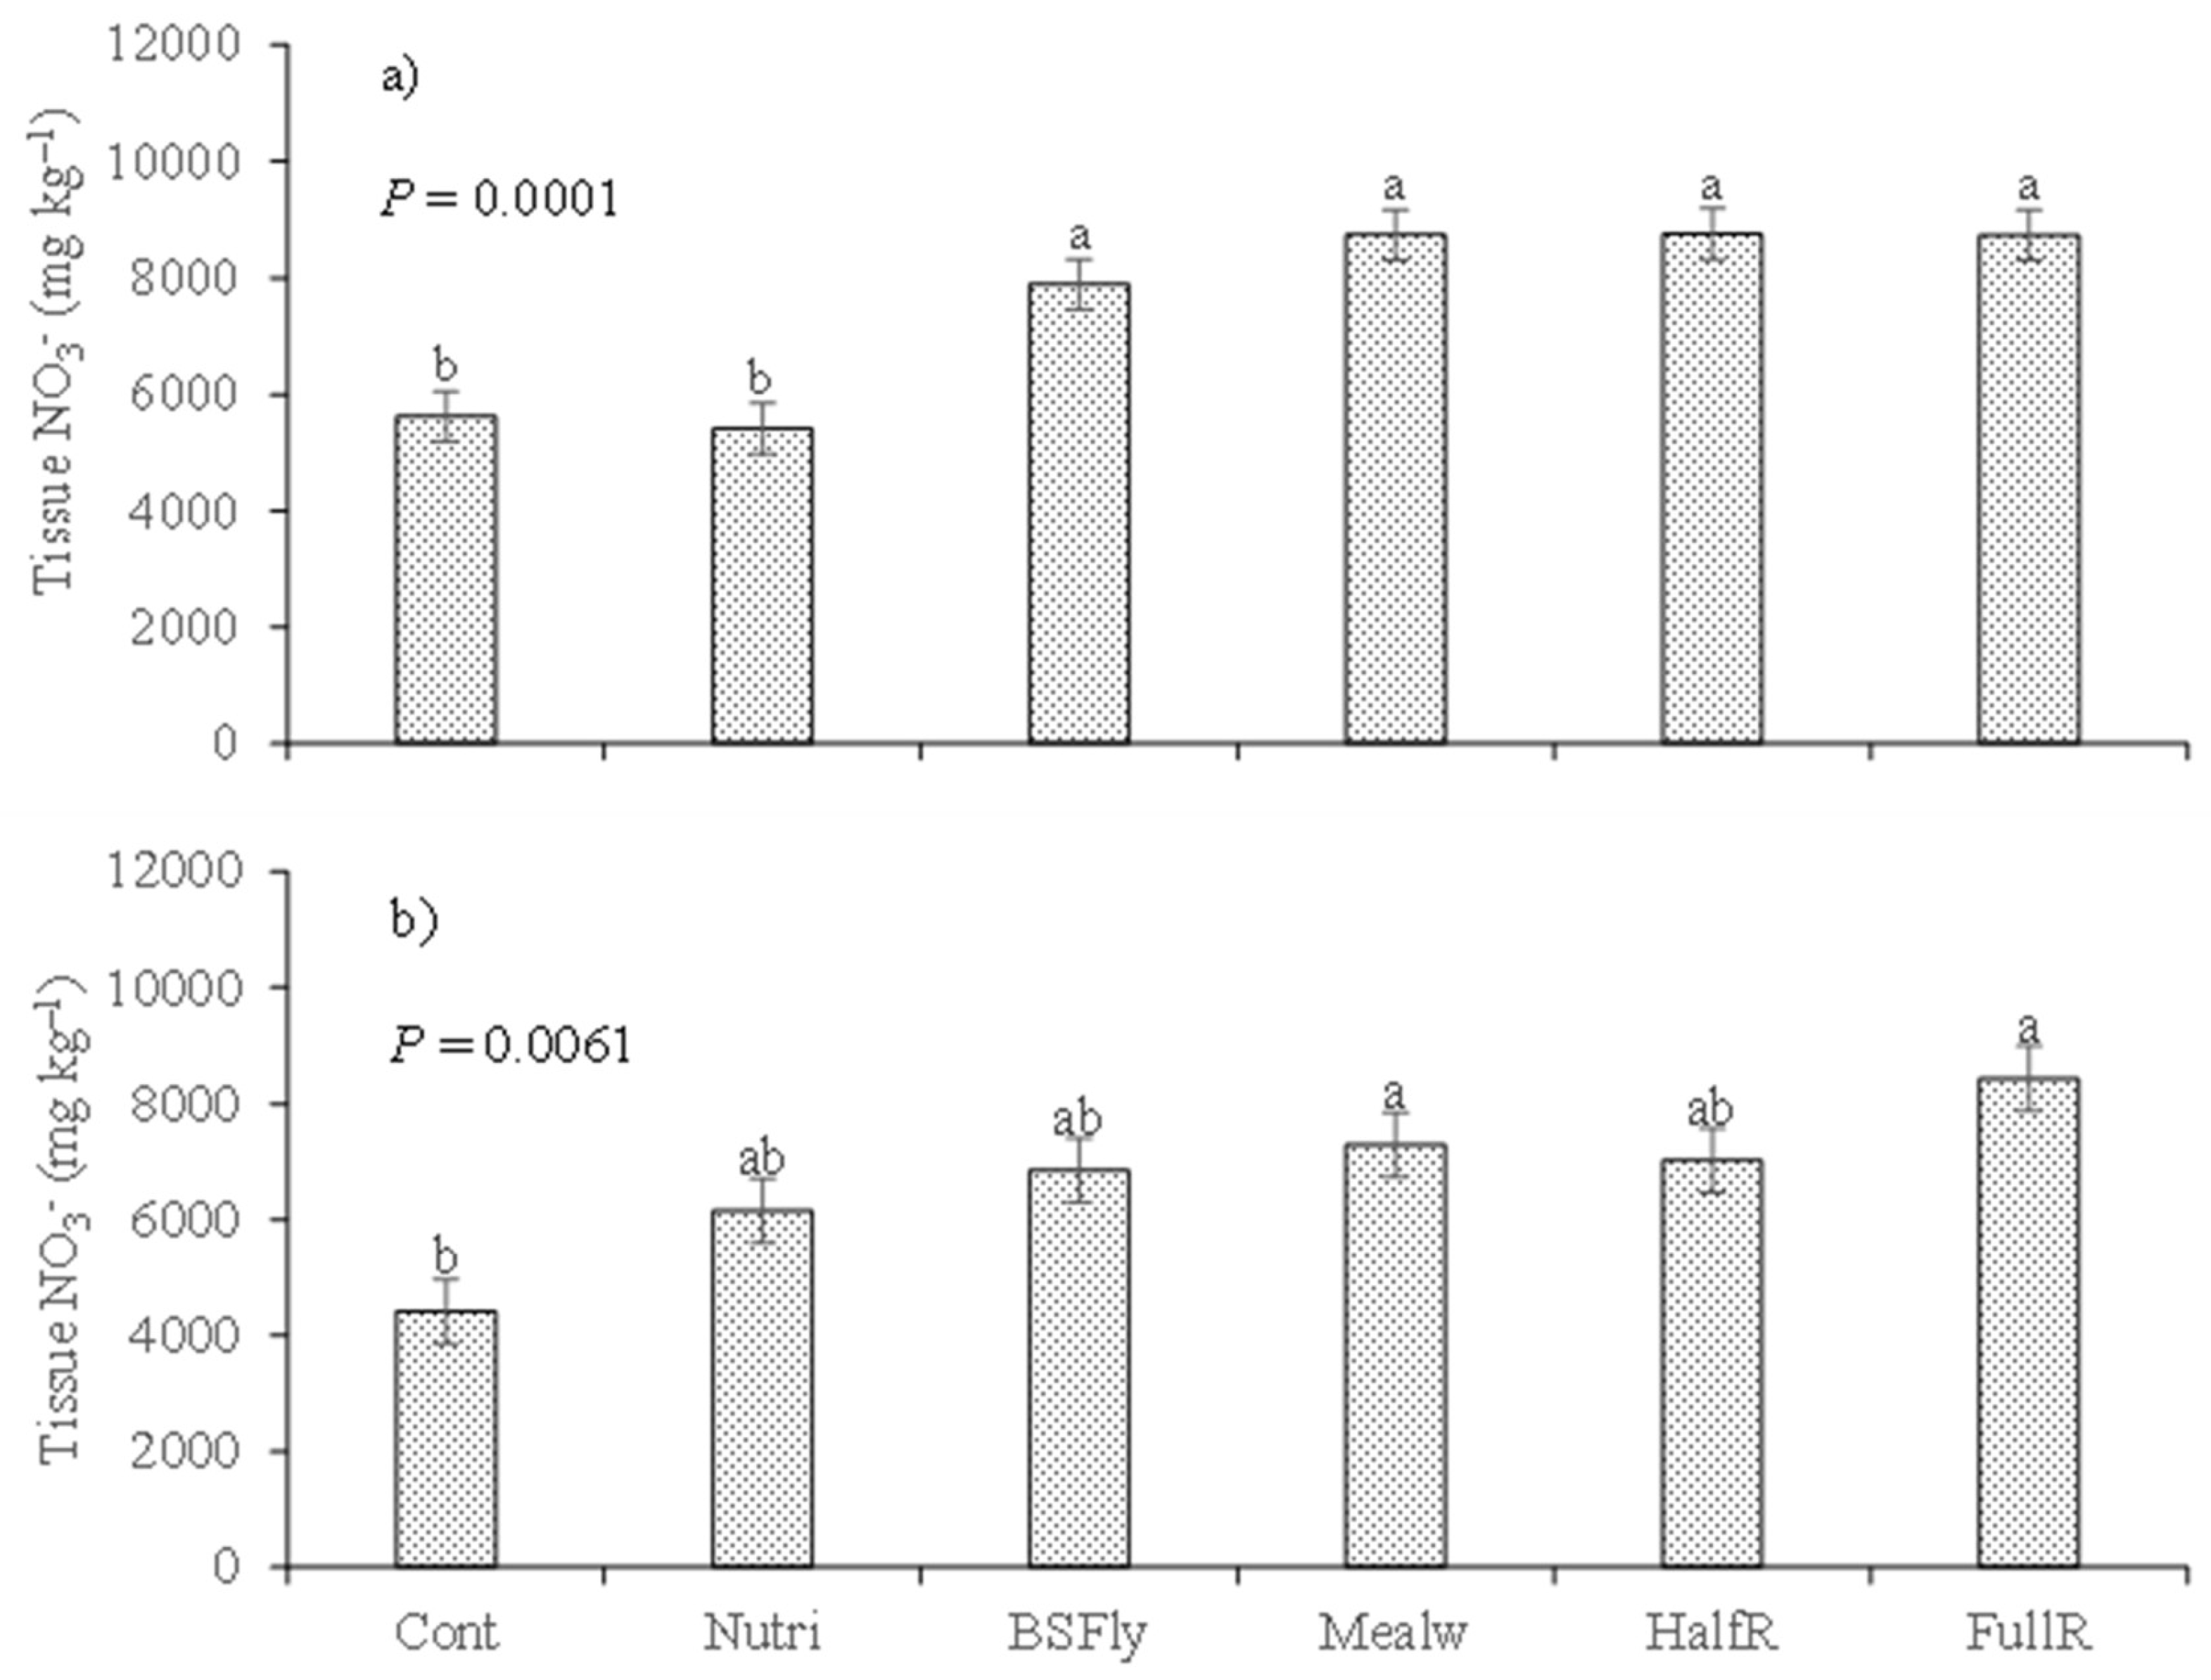

Table 1.
Selected properties (mean ± standard deviation, n=3) of the organic amendments used in this study: black soldier fly larvae frass (BSFly), mealworm larvae frass (Mealw) and Nutrimais (Nutri).
Table 1.
Selected properties (mean ± standard deviation, n=3) of the organic amendments used in this study: black soldier fly larvae frass (BSFly), mealworm larvae frass (Mealw) and Nutrimais (Nutri).
| BSFly | Mealw | Nutri | |
| Moisture content (%) | 25.3 ± 0.72 | 7.4 ± 0.05 | 8.0 ± 0.19 |
| pH (H2O) | 7.6 ± 0.21 | 6.5 ± 0.31 | 8.1 ± 0.15 |
| El. conduct. (mS cm–1) | 9.9 ± 0.46 | 7.3 ± 0.56 | 9.7 ± 0.45 |
| Carbon (g kg–1) | 499.5 ± 2.30 | 517.7 ± 0.64 | 419.0 ± 3.90 |
| Nitrogen (g kg–1) | 26.8 ± 0.06 | 31.3 ± 0.51 | 25.3 ± 1.00 |
| Carbon/nitrogen ratio | 18.6 ± 0.11 | 16.5 ± 0.26 | 16.5 ± 1.14 |
| Phosphorus (g kg–1) | 11.7 ± 0.66 | 10.7 ± 0.18 | 4.8 ± 0.13 |
| Potassium (g kg–1) | 31.2 ± 0.89 | 18.4 ± 2.11 | 17.3 ± 0.16 |
| Calcium (g kg–1) | 3.1 ± 0.02 | 3.8 ± 0.07 | 75.9 ± 3.12 |
| Magnesium (g kg–1) | 4.9 ± 0.06 | 6.5 ± 0.28 | 3.2 ± 0.07 |
| Boron (mg kg–1) | 32.3 ± 0.35 | 26.0 ± 0.61 | 8.3 ± 0.65 |
| Iron (mg kg–1) | 761.9 ±31.11 | 422.9 ± 12.18 | 5230.3 ± 212.42 |
| Manganese (mg kg–1) | 87.4 ± 1.50 | 155.7 ± 5.67 | 133.7 ± 2.96 |
| Zinc (mg kg–1) | 108.8 ± 0.94 | 107.5 ± 1.82 | 103.7 ± 2.60 |
| Copper (mg kg–1) | 19.6 ± 0.36 | 14.0 ± 0.21 | 36.5 ± 0.10 |
Table 2.
Apparent nitrogen (N) recovery by lettuces across fertilization treatments [Nutrimais (Nutri), black soldier fly larvae frass (BSFly), mealworm larvae frass (Mealw), half the rate ammonium nitrate (HalfR), full rate of ammonium nitrate (FullR)] in the first and second growing cycle (GC) in pots that received (with) and did not receive (without) the second dose of organic amendments and fertilizers.
| Apparent N recovery (%) | ||||
| 1st GC | 2nd CG (without) | 2nd GC (with) | Total (1st + 2nd with) | |
| Nutri | -4.0 | 0.6 | -1.0 | -2.5 |
| BSFly | 11.1 | 20.5 | 10.8 | 10.9 |
| Mealw | 37.3 | 41.3 | 37.6 | 37.4 |
| HalfR | 96.6 | 105.9 | 59.0 | 78.3 |
| FullR | 71.9 | 87.2 | 52.0 | 62.0 |
Apparent N recovery (%) = 100 × [(N recovered in the fertilized treatments − N recovered in the control)/N applied as a fertilizer].
Table 3.
Concentration of macro and micronutrients in lettuce tissues across fertilization treatments [Control (Cont), Nutrimais (Nutri), black soldier fly larvae frass (BSFly), mealworm larvae frass (Mealw), half the rate ammonium nitrate (HalfR), full rate of ammonium nitrate (FullR)] in the first growing cycle.
| P | K | Ca | Mg | B | Fe | Mn | Zn | Cu | ||
| g kg–1 | mg kg–1 | |||||||||
| Cont | 2.6 c | 43.8 b | 6.9 ab | 2.3 b | 35.5 a | 2161.9 a | 88.4 bc | 76.1 ab | 32.7 a | |
| Nutri | 2.7 c | 53.5 ab | 8.3 a | 2.7 ab | 32.8 a | 2062.8 a | 73.8 c | 58.4 b | 29.4 ab | |
| BSFly | 3.2 b | 54.2 ab | 7.2 ab | 2.3 b | 34.3 a | 1889.1 a | 86.0 c | 67.7 ab | 33.8 a | |
| Mealw | 3.7 a | 56.4 a | 7.3 ab | 2.4 ab | 34.6 a | 1407.5 b | 82.1 c | 71.9 ab | 28.3 ab | |
| HalfR | 2.6 c | 44.1 ab | 7.2 ab | 2.5 ab | 33.9 a | 1133.2 b | 103.2 ab | 80.0 ab | 25.6 b | |
| FullR | 2.6 c | 45.0 ab | 6.7 b | 2.9 a | 31.3 a | 1115.1 b | 107.0 a | 87.7 a | 23.9 b | |
| Prob | <0.0001 | 0.0077 | 0.0453 | 0.0115 | 0.1314 | <0.0001 | <0.0001 | 0.0118 | 0.0002 | |
In columns, means followed by the same letter are not significantly different by Tukey HSD test (α = 0.05).
Table 4.
Concentration of macro and micronutrients in lettuce tissues across fertilization treatments [Control (Cont), Nutrimais (Nutri), black soldier fly larvae frass (BSFly), mealworm larvae frass (Mealw), half the rate ammonium nitrate (HalfR), full rate of ammonium nitrate (FullR)] in the second growing cycle in pots that received the second dose of organic amendments and fertilizers.
| P | K | Ca | Mg | B | Fe | Mn | Zn | Cu | |||
| g kg–1 | mg kg–1 | ||||||||||
| Cont | 1.3 a | 49.5 a | 8.9 a | 3.8 a | 27.8 a | 1332.5 ab | 70.5 a | 57.2 a | 11.0 ab | ||
| Nutri | 1.0 a | 50.7 a | 9.5 a | 4.1 a | 26.1 a | 1487.8 a | 58.8 a | 70.4 a | 14.8 a | ||
| BSFly | 1.1 a | 49.9 a | 7.5 b | 3.2 a | 27.9 a | 660.2 ab | 62.1 a | 79.1 a | 10.0 b | ||
| Mealw | 1.0 a | 50.2 a | 7.2 b | 3.5 a | 27.7 a | 816.9 ab | 84.1 a | 68.9 a | 11.4 ab | ||
| HalfR | 0.9 a | 41.4 ab | 7.5 b | 4.0 a | 24.2 a | 733.4 ab | 80.6 a | 76.8 a | 12.5 ab | ||
| FullR | 1.3 a | 39.6 b | 6.7 b | 3.8 a | 22.8 a | 570.9 b | 87.6 a | 79.3 a | 12.2 ab | ||
| Prob | 0.3630 | 0.0300 | <0.0001 | 0.2630 | 0.0554 | 0.0171 | 0.1772 | 0.4862 | 0.0476 | ||
In columns, means followed by the same letter are not significantly different by Tukey HSD test (α = 0.05).
Table 5.
Concentration of macro and micronutrients in lettuce tissues across fertilization treatments [Control (Cont), Nutrimais (Nutri), black soldier fly larvae frass (BSFly), mealworm larvae frass (Mealw), half the rate ammonium nitrate (HalfR), full rate of ammonium nitrate (FullR)] in the second growing cycle in pots that did not receive the second dose of organic amendments and fertilizers.
| P | K | Ca | Mg | B | Fe | Mn | Zn | Cu | ||
| g kg–1 | mg kg–1 | |||||||||
| Cont | 1.2 a | 47.8 a | 9.1 a | 3.9 a | 27.2 ab | 1117.0 a | 69.0 a | 63.1 a | 11.6 a | |
| Nutri | 1.1 a | 47.4 a | 7.9 a | 3.3 a | 27.6 a | 1058.4 a | 53.5 a | 58.0 a | 10.8 a | |
| BSFly | 1.2 a | 42.2 a | 7.3 a | 3.3 a | 27.2 a | 691.2 a | 54.5 a | 54.3 a | 10.0 a | |
| Mealw | 0.9 a | 38.9 a | 8.3 a | 3.5 a | 28.3 ab | 983.7 a | 74.3 a | 54.7 a | 13.3 a | |
| HalfR | 1.1 a | 48.2 a | 9.1 a | 4.0 a | 28.7a | 986.0 a | 78.0 a | 75.0 a | 11.4 a | |
| FullR | 1.1 a | 44.2 a | 7.0 a | 3.4 a | 23.8 b | 661.5 a | 87.2 a | 71.9 a | 10.6 a | |
| Prob | 0.8482 | 0.1440 | 0.0686 | 0.0604 | 0.0119 | 0.2245 | 0.0443 | 0.4587 | 0.3428 | |
In columns, means followed by the same letter are not significantly different by Tukey HSD test (α = 0.05).
Table 6.
Nitrogen (N) in the form of nitrate (NO3-) and ammonium (NH4+) in the soil at the end of the second lettuce growing cycle across fertilization treatments [Control (Cont), Nutrimais (Nutri), black soldier fly larvae frass (BSFly), mealworm larvae frass (Mealw), half the rate ammonium nitrate (HalfR), full rate of ammonium nitrate (FullR)] in pots that received and did not receive the second dose of organic amendments and fertilizers.
| Two fertilizer applications | Fertilizers applied once | ||||||
| NO3--N | NH4+-N | Inorg-N | NO3--N | NH4+-N | Inorg-N | ||
| mg kg–1 | mg kg–1 | ||||||
| Cont | 2.2 b | 0.3 b | 2.5 b | 2.3 bc | 0.5 c | 2.8 b | |
| Nutri | 3.9 ab | 1.5 b | 5.4 b | 3.8 ab | 1.6 bc | 5.4 ab | |
| BSFly | 1.7 b | 1.8 b | 3.4 b | 1.4 c | 2.9 ab | 4.3 b | |
| Mealw | 4.1 ab | 3.4 b | 7.4 b | 4.3 a | 3.8 a | 8.1 a | |
| HalfR | 3.4 ab | 3.0 b | 6.4 b | 2.6 abc | 1.2 bc | 3.8 b | |
| FullR | 6.4 a | 10.1 a | 16.5 a | 3.0 abc | 2.7 ab | 5.7 ab | |
| Prob | 0.0039 | 0.0001 | <0.0001 | 0.0035 | 0.0013 | 0.0011 | |
In columns, means followed by the same letter are not significantly different by Tukey HSD test (α = 0.05).
Table 7.
Dry matter yield (DMY), tissue N and N recovery of oats across fertilization treatments [Control (Cont), Nutrimais (Nutri), black soldier fly larvae frass (BSFly), mealworm larvae frass (Mealw), half the rate ammonium nitrate (HalfR), full rate of ammonium nitrate (FullR)] in pots that received and did not receive the second dose of organic amendments and fertilizers.
| Two fertilizer applications | Fertilizers applied once | ||||||
| DMY | Tissue N | N recovery | DMY | Tissue N | N recovery | ||
| g pot–1 | g kg–1 | mg pot–1 | g pot–1 | g kg–1 | mg pot–1 | ||
| Cont | 1.2 c | 17.0 a | 21.4 c | 1.3 b | 18.6 a | 26.0 a | |
| Nutri | 1.4 c | 16.1 a | 22.2 c | 1.3 b | 17.3 a | 22.0 a | |
| BSFly | 3.1 a | 15.7 a | 48.1 a | 2.0 a | 17.2 a | 34.3 a | |
| Mealw | 2.8 ab | 16.5 a | 46.2ab | 1.8 ab | 15.5 a | 28.3 a | |
| HalfR | 2.2 b | 15.9 a | 35.1 b | 1.4 ab | 17.7 a | 25.2 a | |
| FullR | 2.6 ab | 14.2 a | 37.3 ab | 1.5 ab | 16.8 a | 25.0 a | |
| Prob | <0.0001 | 0.0571 | < 0.0001 | 0.0318 | 0.1232 | 0.3163 | |
In columns, means followed by the same letter are not significantly different by Tukey HSD test (α = 0.05).
Table 8.
Soil properties at the end of the second growing cycle of lettuce across fertilization treatments [Control (Cont), Nutrimais (Nutri), black soldier fly larvae frass (BSFly), mealworm larvae frass (Mealw), half the rate ammonium nitrate (HalfR), full rate of ammonium nitrate (FullR)] in pots that received the second dose of organic amendments and fertilizers.
| Cont | Nutr | BSFly | Mealw | HalfR | FullR | Prob | |
| Organic C (g kg–1) | 8.8 b | 9.9 ab | 11.4 a | 11.5 a | 8.4 b | 10.6 ab | 0.0337 |
| pH(H2O) | 6.6 a | 6.7 a | 6.5 a | 6.7 a | 6.7 a | 6.5 a | 0.1076 |
| Extract P (mg kg–1) | 124.5 bc | 148.8 bc | 216.6 a | 193.4 a | 89.8 c | 97.4 c | < 0.0001 |
| Extract K (mg kg–1) | 128.3 ab | 123.7 b | 151.7 a | 110.7 b | 83.3 c | 75.3 c | < 0.0001 |
| Exchang Ca (cmolc kg–1) | 16.0 a | 17.0 a | 16.8 a | 15.9 a | 16.4 a | 14.8 a | 0.2424 |
| Exchang Mg (cmolc kg–1) | 5.3 bc | 5.3 bc | 6.4 a | 5.8 ab | 5.3 bc | 4.8 c | 0.0023 |
| CEC (cmolc kg–1) | 21.9 a | 23.2 a | 24.0 a | 22.4 a | 22.4 a | 20.1 a | 0.0858 |
| Extract Fe (mg kg–1) | 123.0 a | 106.4 a | 107.1 a | 100.3 a | 108.2 a | 107.7 a | 0.1963 |
| Extract Zn (mg kg–1) | 4.1 a | 4.6 a | 5.1 a | 5.3 a | 4.0 a | 4.2 a | 0.2432 |
| Extract Cu (mg kg–1) | 71.0 a | 67.7 a | 69.5 a | 67.0 a | 73.2 a | 75.3 a | 0.8506 |
| Extract Mn (mg kg–1) | 176.3 a | 144.2 a | 153.6 a | 146.0 a | 159.5 a | 154.0 a | 0.0781 |
In rows, means followed by the same letter are not significantly different by the Tukey HSD test (α = 0.05).
Table 9.
Soil properties at the end of second growing cycle of lettuce across fertilization treatments [Control (Cont), Nutrimais (Nutri), black soldier fly larvae frass (BSFly), mealworm larvae frass (Mealw), half the rate ammonium nitrate (HalfR), full rate of ammonium nitrate (FullR)] in pots that did not receive the second dose of organic amendments and fertilizers.
| Cont | Nutri | BSFly | Mealw | HalfR | FullR | Prob | |
| Organic C (g kg–1) | 8.2 c | 11.2 a | 11.3 a | 10.5 ab | 8.6 bc | 9.4 abc | 0.0014 |
| pH(H2O) | 6.5 a | 6.7 a | 6.7 a | 6.7 a | 6.5 a | 6.5 a | 0.0531 |
| Extract P (mg kg–1) | 96.7 b | 153.9 a | 166.2 a | 163.4 a | 90.1 b | 90.3 b | < 0.0001 |
| Extract K (mg kg–1) | 104.0 b | 128.0 a | 115.3 b | 115.3 b | 91.7 c | 82.0 c | < 0.0001 |
| Exchang Ca (cmol+ kg–1) | 15.8 a | 17.1 a | 16.1 a | 15.9 a | 14.8 a | 15.4 a | 0.1119 |
| Exchang Mg (cmol+ kg–1) | 5.3 ab | 5.3 ab | 5.8 a | 5.5 ab | 5.0 b | 4.9 b | 0.0147 |
| CEC (cmolc kg–1) | 21.7 a | 23.2 a | 22.6 a | 22.0 a | 20.5 a | 20.9 a | 0.1178 |
| Extract Fe (mg kg–1) | 117.8 a | 118.0 a | 109.0 a | 94.3 a | 108.7 a | 104.7 a | 0.2596 |
| Extract Zn (mg kg–1) | 5.0 a | 5.1 a | 5.0 a | 4.9 a | 3.9 a | 4.1 a | 0.3151 |
| Extract Cu (mg kg–1) | 71.2 a | 73.0 a | 76.0 a | 69.5 a | 69.0 a | 70.4 a | 0.8828 |
| Extract Mn (mg kg–1) | 175.5 a | 162.0 a | 160.4 a | 137.8 a | 160.6 a | 151.0 a | 0.2789 |
In rows, means followed by the same letter are not significantly different by the Tukey HSD test (α = 0.05).
Disclaimer/Publisher’s Note: The statements, opinions and data contained in all publications are solely those of the individual author(s) and contributor(s) and not of MDPI and/or the editor(s). MDPI and/or the editor(s) disclaim responsibility for any injury to people or property resulting from any ideas, methods, instructions or products referred to in the content. |
© 2024 by the authors. Licensee MDPI, Basel, Switzerland. This article is an open access article distributed under the terms and conditions of the Creative Commons Attribution (CC BY) license (https://creativecommons.org/licenses/by/4.0/).
Copyright: This open access article is published under a Creative Commons CC BY 4.0 license, which permit the free download, distribution, and reuse, provided that the author and preprint are cited in any reuse.


