
Submitted:
10 June 2024
Posted:
12 June 2024
You are already at the latest version
Abstract
Methylmalonic acidemia (MMA), propionic acidemia (PA), and cobalamin C deficiency (cblC) share a defect in propionic acid metabolism. In addition, cblC is also involved in the process of homocysteine remethylation. These three diseases produce various phenotypes and complex downstream metabolic effects. In this study we used an untargeted metabolomics approach to investigate the biochemical differences and the possible connections with the pathophysiology of each disease. Untargeted urine metabolomic profiles of 21 patients (7 MMA, 7 PA, 7 cblC) were identified through statistical analysis (p<0.05; log2FC >|1|) and then used for the annotation. Annotated features were associated with different metabolic pathways potentially involved in the diseases development. Comparative statistic showed markedly different metabolomic profiles between MMA, PA and cblC, highlighting characteristic species for each disease. The most affected pathways were related to the metabolism of organic acids (MMA, PA, cblC), amino acids (MMA, PA, cblC), glycine and its conjugates (PA), transsulfuration pathway (cblC), oxidative processes (cblC) and neurosteroid hormones (cblC). The untargeted metabolomics study highlighted the presence of significant differences between the three diseases, pointing to the most relevant contrast of cblC profile compared to MMA and PA. Some new biomarkers are proposed for PA, while novel data regarding the alterations of steroid hormone profiles and biomarkers of oxidative stress were obtained for cblC disease. The elevation of neurosteroids in cblC may indicate a potential connection with the development of ocular and neuronal deterioration.
Keywords:
methylmalonic acidemia
; propionic acidemia
; cblC deficiency
; untargeted metabolomics
1. Introduction
Propionic academia (PA) and methylmalonic academia (MMA) belong to the category of “classic” organic acidemias, a group of inherited diseases that result from deficient activity of enzymes involved in the metabolism of propionate, whose precursors are the amino acids valine, isoleucine, threonine, methionine, along with odd chain fatty acids, cholesterol side chains, and propionate produced by the gut flora [1]. PA is caused by mutations in PCCA and PCCB genes, coding for the two subunits of propionyl-CoA carboxylase, while MMA is caused by mutations in MUT gene coding for the synthesis of methylmalonyl-CoA mutase [1]. A third disease, Cobalamin C defect (cblC), due to mutations in MMACHC gene, which encodes for a protein involved in intracellular vitamin B12 metabolism, impairs the synthesis of adenosylcobalamin and methylcobalamin, the cofactors of methylmalonyl-CoA mutase and of methionine synthase [2]. These three diseases, sharing a deficient propionate metabolism, produce various phenotypes and complex downstream metabolic effects. Clinically, PA and MMA can present with recurrent attacks of metabolic decompensation, mainly characterized by acidosis, hyperammonemia, ketosis and elevated blood lactate. Acute neurological symptoms are common and can range from mild encephalopathy to metabolic strokes involving the basal ganglia [1]. Chronic complications of both diseases include failure to thrive, developmental delay, movement disorder, deafness, and optic atrophy [1]. PA can additionally present with cardiomyopathy and QT prolongation while MMA is also associated with a chronic kidney disease leading to progressive renal failure [1]. Patients with cblC present a major involvement of central nervous system (CNS) with neurocognitive impairment and develop a multisystem disease with progressive visual dysfunction, atypical hemolytic-uremic syndrome, and pulmonary hypertension [3].
Biochemically, PA, MMA and cblC accumulate in body fluids “primary” metabolites, which derive from the disruptions of metabolic pathways. These include propionyl-carnitine, 3-hydroxypropionic acid, and 2-methylcitric acid, all deriving from the un-metabolized propionyl-CoA [4]. As a consequence of the deficient activity of methylmalonyl-CoA mutase, MMA and cblC share the “primary” accumulation of methylmalonic acid, while the defect of methionine synthase in cblC cause the accumulation of homocysteine and the reduced synthesis of methionine [2]. Changes in in the levels of biomarkers, such as 2-methylcitric acid, propionylcarnitine and methylmalonic acid have demonstrated clinical relevance in patients with PA, MMA [4,5]. Moreover, the elevated homocysteine in cblC causes a diffuse macroangiopathic damage, which is responsible for many of the clinical manifestation [3]. Abnormal circulating levels of ammonia, lactic acid, glycine, glutamine, FGF21, which represent the “secondary” impact of the underlying genetic defect on metabolic and cellular pathways, are detectable in PA and MMA and only very rarely in cblC [3,4,5].
These abnormalities, detectable in patient’s body fluids through targeted metabolomics analyses, represent the biochemical hallmarks which characterize the three disorders and have been validated for diagnosis and to evaluate the response to therapeutic interventions, including liver or liver and kidney transplantation in MMA [2,4,6,7]. However, there is still a need to determine whether the discovery of other metabolites can provide novel insight to understand the mechanisms that underlie the pathophysiology and aberrant processes of diseases in relation to the clinical manifestations. To this purpose, thanks to rapid developments in bio-informatics and analytical technologies, it has been possible to expand metabolomics from targeted to untargeted analyses. The evolution of analytical platforms based on high-resolution mass spectrometry (HR-UHPLC-MS/MS), has allowed the simultaneous measurement of the broadest range of metabolites without a priori knowledge of the metabolome, in contrast with targeted metabolomics, in which metabolites are analyzed on the bases of a priori information [8]. The power of the untargeted metabolomics therefore lies in its potential to broaden our understanding of disease biochemistry, identifying new biomarkers, and providing more precise disease categorization in relation to treatment modalities and responses.
Considering the relatively recent entry of untargeted metabolomics in the area of inborn errors of metabolism [9], only a few studies have so far addressed MMA and PA, showing the impairment of serine, thiol and propionate metabolism [10,11], dysregulation of the tricarboxylic acid cycle [12] and changes of some known biomarkers in relation to patient’s status [13]. As for cblC, untargeted metabolomic was applied as a screening tool with the aim of selecting diagnostic biomarkers and confirm methylmalonic and 2-methylcitric acids, propionylcarnitine, C4DC-carnitine, homocysteine and methionine as the most reliable in discriminating cblC from other metabolic diseases [14,15].
In this work we studied and compared the untargeted urinary metabolomics profiles of MMA, PA and cblC to determine expanded diseases-specific biomarker signatures, aiming at providing novel insights on the biological and pathophysiological differences between the three diseases.
2. Experimental Design
2.1. Patients
Urine samples were obtained from 21 patients attending the Division of Metabolic Diseases at the Bambino Gesù Children’s Hospital in Rome. All patients had confirmed biochemical and molecular diagnosis of MMA, PA or cblC. Each disease group was composed of 7 patients of both sex, the age was matched among groups spanning the following ranges in years: MMA 0.3-22; PA 0.4-20.4; cblC 0.4-17.1. All patients within the same disease group were treated with standard therapy, which included natural protein restriction, supplemented with amino acid mixture free of offending precursors (MMA, PA), oral carnitine (MMA, PA, cblC), parenteral hydroxocobalamin (cblC) and oral betaine (cblC) therapy. Clinically, all patients presented with a severe phenotype, characterized by early onset of the disease and by a multiorgan involvement. Two out of 3 patients identified by newborn screening were already symptomatic. At the time of urine collection for untageted metabolomics analysis, no one of the 21 patients was subjected to organ transplantation or dialysis. During disease course, patients PA 1, PA 3, PA 5, PA 6, MMA 2, MMA 5 were treated with liver transplantation, and patients MMA 1, MMA 4 and MMA 7 with combined liver and kidney transplantation, that further confirms the severity of disease phenotype. Table 1 describes more in detail the clinical phenotypes of each patients.
The research was not a clinical trial and the procedure was in accordance with the Declaration of Helsinki of the World Medical Association. The study has been approved by the Ethical Committee of the Bambino Gesù Children’s Hospital (n. 2119_OPBG_2020) and the informed consent was obtained from all patients/caregivers.
3. Procedure
3.1. Sample Preparation
Urine samples were collected during scheduled follow-up visits and immediately frozen at -80 0C prior to analysis. Sample preparation consisted in mixing 200 µL of urine with 200 µL of organic solvent (acetonitrile and methanol 3:1) for HILIC analysis or with 200 µL of water for reverse phase UHPLC experiment. After 20 sec vortex and 10 min centrifugation at 13.000 rpm the supernatants were transferred into UHPLC vails for injection. A pooled sample was prepared by mixing equal aliquots of all urine samples. This pool underwent the same preparation steps and was used for data dependent MS2 acquisitions and as Quality controls (QC).
3.2. UHPLC and HRMS
Ultra-high-performance chromatographic separation was executed on Ultimate 3000 (Thermo Fisher Scientific, Waltham, MA, USA) system by reverse phase and HILIC conditions. Reverse phase experiment was carried on Luna Omega C18 column (100 x 2.1 mm, 1.6 µm PS, Phenomenex, Torrance, CA, USA) with mobile phases A composed of water with 0.1 % formic acid and B composed of acetonitrile with 0.1 % formic acid. HILIC chromatographic separation was run on Accucore-150-Amide column (100 x 2.1 mm, 2.6 µm, Thermo Fisher Scientific, Waltham, MA, USA) with mobile phase A (95 % acetonitrile, 0.1 % acetic acid, 10 mM ammonium acetate) and B (50 % acetonitrile, 0.1 % acetic acid, 10 mM ammonium acetate). Chromatographic gradients and instrument sets are available in Tables 1,2 in Supplement materials. All samples were injected three times as technical replicates in random order. QC samples for peak area and RT correction were analyzed repetitively during the whole batch after
The UHPLC system was coupled with a mass spectrometer Q Exactive (Thermo Fisher Scientific, Waltham, MA USA) scanning in full MS and dd-MS2 modes. Full scan MS experiment was set to 70-1050 m/z range with 140,000 resolution, 3x10⁶ AGC target and maximum IT 100 ms. dd-MS2 mode, used only for pool sample acquisition, was set at 17,500 resolution, 2x10⁴ AGC target, maximum IT 35 ms, TopN 12, isolation window 1.5 m/z and dynamic exclusion 2.5 sec. The features have been fragmented with three different normalized collision energy set to 20, 35 and 50 V. Source ionization parameters were: spray voltage ± 3.5 kV; capillary temperature 380 °C; sheath gas 60; auxiliary gas 20; S-Lens level 50. The data were acquired in both positive and negative modes independently. Calibration was performed before each analysis using calibration mixes (Piercenet, Thermo Fisher Scientific, Rockford, IL USA) to minimize the ppm error of the intact mass.
3.3. Metabolomic Data Analysis
The raw data were processed on Compound Discoverer 3.3 (Thermo Fisher Scientific, Waltham, MA USA) software for deconvolution, compound identification and statistical analysis. To account for variations in sample dilution factors, the acquired data were normalized by Constant Sum algorithm integrated in Compound Discoverer 3.3. The time-dependent batch effects were corrected with the use of QC samples, implemented to build the linear regression model describing the variability of chromatographic peak area of each m/z at different acquisition time. After alignment and grouping of chromatographic peaks with the same molecular weight and retention time, the background features were removed from result table. Subsequently, the features were statistically analyzed to identify characteristic compound discriminating each disease. Principal component analysis (PCA) and volcano plots were applied to highlight the differences between groups. Data annotation was made searching matching compounds through home-made library (90 metabolites), ChemSpider, Metabolika and mzCloud databases. All proposed metabolite structures were verified by the FISH score, which is assigned by comparing experimental and in silico fragmentation patterns. PCA and box-and-whisker plots were generated by Compound Discoverer 3.3, heatmaps and pathway enrichment analysis were made with MetaboAnalyst 6.0 web platform. Pearson correlation coefficients (r) were calculated by Excel Microsoft 2016.
4. Results
After spectra deconvolution, alignment, QC and background corrections, the data from HILIC, in both polarity modes, and from reverse phase (C18), only in negative mode, were considered for subsequent elaborations. The data from reverse phase C18 positive mode were discarded because did not fulfill the Compound Discoverer 3.3 quality criteria.
Untargeted metabolomic data showed the net differences between the three diseases. The PCA plots obtained from the different chromatographic conditions demonstrated coherent picture pointing to the most characteristic metabolomic profile of cblC group that resulted in the highest separation from other diseases (PC1 > 24.6 %), while the profiles of MMA and PA were more similar between them (PC2 > 9.5 %), Figure 1.
4.1. Significantly Different Metabolites
Volcano plots, set to p < 0.05, log2FC > |1|, revealed 530 characteristic features for MMA, 450 for PA and 1700 for cblC. Only a part of characteristic features was annotated. Additionally, we selected a group of features with molecular formula CxHyNO, likely belonging to the same chemical class, that were significantly increased in PA. The most relevant findings are summarized in Table 2, while the whole list of putative annotations is given in the Supplementary Table 3.
The significantly increased metabolites in each disease were associated with known KEGG metabolic pathways. Figure 2 demonstrates the main pathways involved in three metabolic diseases.
All diseases shared the involvement of valine, leucine and isoleucine biosynthesis and degradation pathways. CblC and PA had a common involvement of glycine, serine and threonine metabolism related-pathway, while PA and MMA shared pathways related to Krebs cycle (TCA), pyruvate metabolism, glyoxylate and dicarboxylate metabolism, arginine biosynthesis, along with alanine, aspartate and glutamate metabolism. The main pathways involved in cblC and not in MMA and PA include cysteine and methionine metabolism, sulfur metabolism, pantothenate and CoA biosynthesis.
4.1.1. Organic Acids and Ketones
The untargeted metabolic study confirmed the presence of known primary disease related biomarkers, revealing a significant increase of methylmalonic acid in MMA and in cblC compared to PA, while methylcitric acid was significantly increased in PA compared to MMA and cblC (Table 2, Figure 3). The most discriminant organic acids and ketones in PA were 3-pentanone, 2-methyl-3-oxo-valeric acid, 2-methyl-3-hydroxy-valeric acid, 2-butanone and 3-oxo-valeric acid (Table 2, Figure 3). Moreover, 3-hydroxypropionic acid was also increased in PA but, due to the low quality of chromatographic peak integration caused by the presence of coeluting isomers, it was not considered for quantitative estimation.
The profiles of organic acids related to Krebs cycle showed significantly reduced levels of citric and isocitric acids (not separated chromatographically) along with increased malic and fumaric acids in MMA and PA compared to cblC, Figure 3. Other organic acids related to TCA cycle did not show differences between the three disease groups.
A feature with m/z and fragmentation pattern putatively corresponding to propionic acid, was highly increased in MMA and in cblC group respect to PA (Table 2, Supplementary Figure 1a). However, its levels were strongly correlated across all samples (r > 0.9) with methylmalonic acids (Supplement Figure 1b), allowing to consider this compound as propionic acid derived from in-source fragmentation of methylmalonic acid.
4.1.2. Amino Acids and Peptides
4.1.3. Glycine and Carnitine Conjugates
Three glycine esters, propionylglycine, butyrylglycine and tiglylglycine were markedly increased in PA compared to MMA and cblC (Table 1, Figure 5).
In particular, propionylglycine was increased up to 100-fold and 60-fold respect to cblC and MMA. Propionylglycine (r > 0.9) and butyrylglycine (r > 0.7) were positively correlated with glycine, and between them (r > 0.7) The levels of other glycine conjugates like N-acetylglycine, glutamylglycine, isovalerylglycine, isocaprolylglycine, hexanoylglycine and hippuric acid had no differences between the three disease groups.
Different from glycine and its esters, free carnitine had similar levels in cblC, PA and MMA, while propionylcarnitine was equally increased in PA and MMA compared to cblC (Table 1, Figure 5e). C4DC-carnitine levels in cblC exceeded those in MMA and PA (Table 1, Figure 5f). Interestingly, a metabolite corresponding to propionylcarnitine conjugated to glycine was selectively elevated only in PA and not in MMA nor cblC (Table 1, Figure 5g). The proposed putative structure of this double carnitine/glycine conjugate produced the in-silico fragmentation pattern corresponding to experimental MS/MS data at 93.7 % (Supplementary Figure 2a,b).
4.1.4. Transsulfuration Pathway Metabolites
Several metabolites belonging to transsulfuration pathway, including homocysteine, cystathionine, cysteine, sulfuric and tyhiosulfuric acids were selectively increased in cblC (Table 1, Figure 6).
Among these metabolites, cystathionine and homocysteine demonstrated the most relevant and significant increase, reaching 78-fold and 39-fold changes compared to the levels in MMA and PA. Moreover, 2-hydroxybutyric acid, putatively derived from alpha-ketobutyric acid, was also elevated in cblC.
4.1.5. Biomarkers of Oxidative Damage
Urine obtained from cblC patients showed a major increase of compounds related to oxidative stress, Figure 7.
These included thioproline, a sulfur-containing non-proteinogenic amino acid, formed by the condensation between cysteine and formaldehyde, increased up to 96-fold and 45-fold compared to MMA and PA, respectively (Table 1, Figure 7a). Other metabolites significantly elevated in cblC group, derive from oxidation of vitamin E by peroxyl radicals. These included α-tocopheronic acid, α-tocopheronolactone hydroquinone (α-TLHQ) glucuronide, α-TLHQ sulfate and α-tocopheronic acid sulfate (Table 1, Figure 7b-e).
4.1.6. Steroid Hormones
CblC group was characterized by the increased level of steroid compounds with androstane or pregnane core. The putative annotations corresponding to derivatives of dehydroepiandrosterone (DHEA), pregnanolone, and others are given in Table 3.
Six out of 10 compounds were in sulfate form and one was a glucuronic acid conjugate. The urinary levels of these hormones in cblC group largely exceeded those in MMA and in PA, Figure 8.
4.1.7. Non-Annotated Metabolites CxHyNO in PA
A group of six non-annotated metabolites, having CxHyNO elemental composition with carbon atoms length C4-C7, were significantly increased in the group of PA. C7H13NO was the most increased one, up to 142-fold change respect to MMA and cblC. Other features were C7H11NO, C6H13NO, C6H11NO, C6H9NO and C4H9NO (Table 1, Figure 9).
4.1.8. The Most Dysregulated Non-Annotated Features
The 25 most up- and down-regulated non-annotated features for each disease (p < 0.001) are listed in Supplementary tables 5-7. Heatmaps with hierarchical clustering of these features are shown in Figure 10.
PA group was characterized by elevated levels of 19 features with molecular weights 116-746 Da, 8 of them coherently increased across all PA samples. Six features with lower molecular weights (110-296 Da) were decreased in all in PA samples respect to cblC and MMA group (Figure 10a). MMA group was characterized by lower levels of 17 species with molecular weights 124-885 Da. A single feature, with molecular weight 288.965 Da, was constantly increased in all MMA samples (Figure 10b). In cblC group 18 out of 25 features were significantly decreased compared to MMA and PA. These features generally had high molecular weights (up to 1123 Da) and demonstrated constantly decreased levels across all cblC samples (Figure 10c).
5. Discussion
In this study we performed a comparison of untargeted metabolic profiles in the urine of three organic acidemias, MMA, PA and cblC, sharing the involvement of propionate pathway. Our results highlighted a clear distinction between the three diseases, showing up the relative differences in the levels of known biomarkers and described new characteristic metabolites allowing a more profound knowledge and understanding of (biochemical) phenotypic disease characteristics and pathophysiology.
Pathway enrichment analysis indicated the involvement of branched chain amino acid metabolism in all diseases, pointing at major perturbations affecting the Krebs cycle in PA and MMA. The specificities of cblC, contributing to the highest separation from other diseases, were related not only to sulfur metabolism, but also to other novel pathways.
The relative quantification in untargeted metabolomics applied to urine requires normalization of data. To this purpose, different normalization strategies were developed to reduce the measurement errors [16,17,18], but no consensus has been so far reached on the most suitable approach for urine standardization [17,19,20]. The normalization to creatinine is the most used way in targeted metabolomic analyses [21,22], however MMA and PA may affect creatine metabolism, leading to a reduced creatinine formation [23,24,25,26]. For this reason, for our study we applied the Constant Sum algorithm as post-acquisition normalization.
By targeted metabolomics analyses, the main shared biomarkers of PA, MMA and cblC are 3-hydroxypropionic and 2-methylcitric acids [2,3,4,5]. Coherently, the results of our untargeted metabolomic study in urine showed a major increase of 2-methylcitric acid in PA compared to MMA and cblC. As for methylmalonic acid, shared by MMA and cblC [27], it was predominantly increased in MMA. Unexpectedly, and similar to a previous report [13], we identified a metabolite with molecular weight and fragmentation pattern corresponding to propionic acid, highly increased in MMA and cblC but not in PA. However, the levels of this compound and methylmalonic acid were strongly correlated across the samples and a more accurate evaluation allowed to demonstrate that the presumed “propionic acid” was an artifact, derived from the in-source fragmentation of methylmalonic acid molecule due to the loss of a CO2 [28,29].
As for other biomarkers, a selective increase of 2-methyl-3-oxo-valeric acid, 2-methyl-3-hydroxy-valeric acid, 3-oxo-valeric acid, 3-pentanone and 2-butanone was detected in PA. Oxo-valeric acid-related metabolites derive from the self-condensation of propionyl-CoA, 3-pentanone may result from the decarboxylation of 2-methyl-3-oxo-valeric acid [30], while 2-butanone is a product of methylacetoacetate decarboxylation in the catabolic pathway of isoleucine [31]. From a clinical perspective, the presence of alpha- and beta-ketoaciduria may explains the frequent observation in PA patients of positive ketones in urine as detected by commercial strips (testing for acetoacetate through a nitroprusside reaction), which does not correspond the presence of ketonemia (elevated beta-hydroxybutyrate levels in blood (personal observation of Carlo Dionisi-Vici).
Focusing on TCA metabolites, the citrate levels in MMA and PA were significantly reduced compared to cblC, likely reflecting the major accumulation of propionyl-CoA that competes with acetyl-CoA as substrate for citrate synthase, generating 2-methylcitrate after condensation with oxaloacetate [32]. The accumulation of 2-methylcitrate and of others “toxic” compounds derived from methylmalonyl-CoA and propionyl-CoA metabolism, may impact on TCA cycle and on urea cycle, leading to a shortage of TCA intermediates, to a mitochondrial dysfunction and to hyperammonemia [32,33]. In accordance, increase of malate, fumarate and lower citrulline levels were found in PA and MMA samples. Perturbations of these metabolites, which are known to be related with mitochondrial dysfunction [34,35,36,37], may therefore reflect and explain a greater mitochondrial involvement in PA and MMA compared to cblC.
MMA and PA are both characterized by an abnormal glycine metabolism [38]. Our study, while confirming this pertubation, showed that the levels of glycine in PA were about 30 times higher than those seen in MMA. This difference highlights that different (patho)mechanisms may lead to increased glycine in the two diseases. In MMA, a widespread posttranslational modification, methylmalonylation, inhibits the glycine cleavage pathway [38]. In PA, as shown by 13C-flux experiments in PCCA-null cells, an increased de novo synthesis of glycine occurs from serine [10]. Remarkably, we found that the increased glycine levels in PA significantly correlated with the increase of its esters, propionylglycine and butyrylglycine, further confirming that PA affects glycine metabolism to a most extent than it occurs in MMA. Taken together, all these findings seem to indicate that the increased glycine synthesis in PA may be considered as a “defense” mechanism, aimed to buffer the toxic accumulation of propionyl-CoA, through the action of glycine-N-acylase, as seen in isovaleric acidemia [39,40,41]. Consistently, we identified a novel glycine conjugate of propionyl-carnitine that was significantly elevated in PA.
The analysis of carnitine derivatives, reflecting the buffering action of carnitine-acetyltransferase on mitochondrial excess of propionyl-CoA, showed less pronounced differences than those seen for glycine esters. Propionylcarnitine was equally increased in PA and MMA in comparison to cblC, while C4DC-carnitine, combining methylmalonyl- and succinyl-carnitines [42], was higher in cblC than in MMA.
The study showed significant differences in the excretion of amino acids and small peptides in cblC in comparison to PA and MMA. The relative elevation in cblC of the majority of these compounds is likely the consequence of the dietary differences between the three diseases. All cblC patients were on a free diet, while PA and MMA patients were treated with a protein restricted diet to limit the intake of propionic acid precursors [6]. Accordingly, the levels of isoleucine, valine, threonine and of related small peptides were significantly reduced in PA and MMA. On the other hand, a significant reduction of methionine was detectd in cblC, reflecting the deficient activity of methionine synthase as a consequence of the reduced availability of its cofactor methylcobalamin [2]. The high increase of dimethylglycine in cblC samples is consistent with the activation of the folate-indipendent homocysteine remethylation pathway through the action of betaine therapy [2].
As expected, increased levels of metabolites linked to transsulfuration pathway were exclusively detected in cblC group, as also reported by previous researches [43,44]. The elevated levels of thiosulfate and sulfate ions indicate that, among the pathways of homocysteine and cysteine degradation, the most active would be the one related to H2S production, which is further oxidized to sulfates [45,46].
A common characteristic of MMA, PA and cblC is an elevated oxidative stress. Previous studies demonstrated the presence of reactive oxygen species and oxidative damage in these diseases [47,48,49,50,51]. In addition, cblC lymphocytes were characterized by an imbalance between reduced/oxidized forms of glutathione [52]. The comparison of metabolomic profiles between the three diseases allowed to distinguish some specific pathways of oxidative stress that were characteristic only for cblC, rather than for MMA and PA. We identified oxidized forms of vitamin E metabolites, such as α-TLHQ, α-tocopheronic acid and their conjugates. These molecules have been associated with multiple diseases characterized by lipid peroxidation and were defined as the urinary biomarkers of oxidative stress [53,54,55]. Another specific indicator of oxidative stress damage uniquely detected in cblC patients was thioproline, which is related to formaldehyde metabolism. Thioproline is generated in oxidant-exposed cells and exerts a protective role through sacrificial oxidation and nitrile ion trapping [56]. Being a product of formaldehyde and cysteine conjugation, thioproline may be therefore considered as a scavenger of free endogenous formaldehyde released during demethylation, protein oxidation, and from the metabolism of methanol, methylamine and adrenaline [56]. The excess of formaldehyde in cblC may also be related to the oxidative breakdown of tetrahydrofolate not employed for the folate-dependent methylation of homocysteine [57,58]. Beside the conjugation with cysteine, other ways for formaldehyde buffering exist in mammals, such as the enzymatic conversion through glutathione, and the adduction with histidine to form spinacine [59]. However, in our study thioproline was the unique formaldehyde adduct increased in cblC, while the levels of spinacine did not differ between the three diseases. Furthemore, we did not find features corresponding to glutathione-related products, such as S-hydroxymethyl-glutathione or S-formyl-glutathione [59]. Therefore, the elevated levels of thioproline in cblC may be explained by a preferential buffering of formaldehyde through its condensation with cysteine. The potential role of formaldehyde and thioproline in the pathophysiology of cblC disease is worthy of further elucidations. Interestingly, both formaldehyde and thioproline accumulation have been associated with neurodegeneration [59,60].
Untargeted metabolomic study revealed the sharp increase of steroid hormones in the urine of cblC patients. The majority of these compounds belongs to the class of “neurosteroids”, which can also have androgenic or estrogenic activity. Neurosteroids, synthetized in brain or in peripheral nervous system, can be transformed in sulfate or glucuronide conjugates and then excreted in urine. The role of neurosteroids is very complex and lies in the ability to act as neuro-hormones, neuromodulators, neurotransmitters and as neurotrophic factors. They regulate arousal, sleep, learning, social and sexual behaviors and are implicated in several (patho)physiological conditions, such as pain, stress, anxiety, depression, but also in autism, neurodegenerative diseases (multiple sclerosis, Alzheimer’s disease, Parkinson’s disease), in Niemann-Pick type C disease, and in traumatic brain injury [61,62,63,64,65,66,67,68,69,70]. The presence of increased levels of neurosteroids in cblC patients may therefore indicate the potential connection with the peculiar neurological manifestations in this disease [2].
Furthermore, involvement of steroid hormones in cblC may also regard the characteristic disease-associated visual deterioration [2]. Specific receptors have been found on the visual system, including lacrimal and meibomian glands, conjunctiva, cornea, lens, retina, and choroid [71]. Numerous studies on ocular disease have revealed the net connection between steroid hormones and retinal, corneal and optic nerve disorders such as cataract, dry eye disease, glaucoma, age-related macular degeneration, retinitis pigmentosa and central serous chorioretinopathy [71,72,73,74,75]. It has also been reported that both estrogens and androgens affect retinal thickness, and their elevated levels were found in patients with chronic central serous chorioretinopathy [72,73,76].
Our study identified a potentially novel class of PA biomarkers characterized by the molecular formula CxHyNO with carbon lengths C4-C7. The similar elemental composition and close elution times may indicate the presence of the same functional group(s) derived from coherent metabolic pathways. These metabolites may belong to the class of amides (from decarboxylation of acylglycines [77]), aminoaldehydes (from oxidative degradation of polyamines [78]), nitroso-compounds, and/or acyl-pyrrolidine/pyrrolines.
It is well known that the annotation of features detected by untargeted metabolomics represents the biggest challenge. In this study, we selected the 25 most significantly increased/decreased non-annotated features for each disease and reported their accurate molecular weights to allow their confirmation and characterization in future metabolomic researches on MMA, PA or cblC.
The most relevant results of our study, demonstrating the different and common aspects in metabolomic profiles of cblC, MMA and PA acidemias, are summarized in Figure 11.
6. Conclusion
Our study allowed the discovery of new disease-related biomarkers, expanding knowledge on novel potential pathophysiological mechanisms, demonstrating the importance of exploring through untargeted metabolomics the biochemical profiles of metabolic disease.
Author Contributions
Anna Sidorina: Conceptualization; Methodology; Investigation; Acquisition of data, Data curation and interpretation, Writing - original draft; Giulio Catesini: Conceptualization; Methodology; Acquisition of data, Data interpretation, Writing - review & editing; Elisa Sacchetti: Visualization; Investigation; Cristiano Rizzo: Conceptualization, Supervision, Writing - review & editing; Carlo Dionisi-Vici: Conceptualization, Funding acquisition, Project administration, Supervision, Writing - review & editing. All authors have read and agreed to the published version of the manuscript.
Funding
This work was supported by funding by not for-profit associations La Vita è un Dono ONLUS and Cbl-C APS and by the Italian Ministry of Health with “Current Research funds”.
Institutional Review Board Statement
The study was conducted in accordance with the Declaration of Helsinki, and approved by the Ethical Committee of the Bambino Gesù Children’s Hospital n. 2119_OPBG_2020.
Informed Consent Statement
Informed consent was obtained from all subjects involved in the study.
Acknowledgments
We thank the associations “Associazione la Vita è un Dono” and “CblC APS” for the support to the Division of Metabolism. We also thank European Reference Network for Rare Hereditary Metabolic Disorders (MetabERN). The Division of Metabolism is affiliated member of the European Reference Network for hereditary Metabolic Disorders (MetabERN) and associated partner of the Unified European Registry for Inherited Metabolic Disorders (UIMD), of the European Registry and network for Intoxication type Metabolic Diseases (E-IMD).
Conflicts of Interest
The authors declare no conflicts of interest. The funders had no role in the design of the study; in the collection, analyses, or interpretation of data; in the writing of the manuscript; or in the decision to publish the results.
References
- Deodato F, Boenzi S, Santorelli FM, Dionisi-Vici C. Methylmalonic and propionic aciduria. Am J Med Genet C Semin Med Genet. 2006 May 15;142C(2):104-12. [CrossRef] [PubMed]
- Huemer M, Diodato D, Schwahn B, Schiff M, Bandeira A, Benoist JF, Burlina A, Cerone R, Couce ML, Garcia-Cazorla A, la Marca G, Pasquini E, Vilarinho L, Weisfeld-Adams JD, Kožich V, Blom H, Baumgartner MR, Dionisi-Vici C. Guidelines for diagnosis and management of the cobalamin-related remethylation disorders cblC, cblD, cblE, cblF, cblG, cblJ and MTHFR deficiency. J Inherit Metab Dis. 2017 Jan;40(1):21-48. Epub 2016 Nov 30. [CrossRef] [PubMed] [PubMed Central]
- Huemer M, Diodato D, Martinelli D, Olivieri G, Blom H, Gleich F, Kölker S, Kožich V, Morris AA, Seifert B, Froese DS, Baumgartner MR, Dionisi-Vici C; EHOD consortium; et al. Phenotype, treatment practice and outcome in the cobalamin-dependent remethylation disorders and MTHFR deficiency: Data from the E-HOD registry. J Inherit Metab Dis. 2019 Mar;42(2):333-352. Epub 2019 Feb 17. [CrossRef] [PubMed]
- Longo N, Sass JO, Jurecka A, Vockley J. Biomarkers for drug development in propionic and methylmalonic acidemias. J Inherit Metab Dis. 2022 Mar;45(2):132-143. Epub 2022 Jan 26. [CrossRef] [PubMed] [PubMed Central]
- Maines E, Catesini G, Boenzi S, Mosca A, Candusso M, Dello Strologo L, Martinelli D, Maiorana A, Liguori A, Olivieri G, Taurisano R, Piemonte F, Rizzo C, Spada M, Dionisi-Vici C. Plasma methylcitric acid and its correlations with other disease biomarkers: The impact in the follow up of patients with propionic and methylmalonic acidemia. J Inherit Metab Dis. 2020 Nov;43(6):1173-1185. Epub 2020 Aug 23. [CrossRef] [PubMed]
- Forny P, Hörster F, Ballhausen D, Chakrapani A, Chapman KA, Dionisi-Vici C, Dixon M, Grünert SC, Grunewald S, Haliloglu G, Hochuli M, Honzik T, Karall D, Martinelli D, Molema F, Sass JO, Scholl-Bürgi S, Tal G, Williams M, Huemer M, Baumgartner MR. Guidelines for the diagnosis and management of methylmalonic acidaemia and propionic acidaemia: First revision. J Inherit Metab Dis. 2021 May;44(3):566-592. Epub 2021 Mar 9. Erratum in: J Inherit Metab Dis. 2022 Jul;45(4):862. [CrossRef] [PubMed] [PubMed Central]
- Manoli I, Gebremariam A, McCoy S, Pass AR, Gagné J, Hall C, Ferry S, Van Ryzin C, Sloan JL, Sacchetti E, Catesini G, Rizzo C, Martinelli D, Spada M, Dionisi-Vici C, Venditti CP. Biomarkers to predict disease progression and therapeutic response in isolated methylmalonic acidemia. J Inherit Metab Dis. 2023 Jul;46(4):554-572. Epub 2023 Jun 6. [CrossRef] [PubMed] [PubMed Central]
- Johnson CH, Ivanisevic J, Siuzdak G. Metabolomics: beyond biomarkers and towards mechanisms. Nat Rev Mol Cell Biol. 2016 Jul;17(7):451-9. Epub 2016 Mar 16. [CrossRef] [PubMed] [PubMed Central]
- Wurth R, Turgeon C, Stander Z, Oglesbee D. An evaluation of untargeted metabolomics methods to characterize inborn errors of metabolism. Mol Genet Metab. 2024 Jan;141(1):108115. Epub 2023 Dec 15. [CrossRef] [PubMed] [PubMed Central]
- Anzmann AF, Pinto S, Busa V, Carlson J, McRitchie S, Sumner S, Pandey A, Vernon HJ. Multi-omics studies in cellular models of methylmalonic acidemia and propionic acidemia reveal dysregulation of serine metabolism. Biochim Biophys Acta Mol Basis Dis. 2019 Dec 1;1865(12):165538. Epub 2019 Aug 23. [CrossRef] [PubMed] [PubMed Central]
- Wikoff WR, Gangoiti JA, Barshop BA, Siuzdak G. Metabolomics identifies perturbations in human disorders of propionate metabolism. Clin Chem. 2007 Dec;53(12):2169-76. Epub 2007 Oct 19. [CrossRef] [PubMed]
- Forny P, Bonilla X, Lamparter D, Shao W, Plessl T, Frei C, Bingisser A, Goetze S, van Drogen A, Harshman K, Pedrioli PGA, Howald C, Poms M, Traversi F, Bürer C, Cherkaoui S, Morscher RJ, Simmons L, Forny M, Xenarios I, Aebersold R, Zamboni N, Rätsch G, Dermitzakis ET, Wollscheid B, Baumgartner MR, Froese DS. Integrated multi-omics reveals anaplerotic rewiring in methylmalonyl-CoA mutase deficiency. Nat Metab. 2023 Jan;5(1):80-95. Epub 2023 Jan 26. [CrossRef] [PubMed] [PubMed Central]
- Haijes HA, Jans JJM, van der Ham M, van Hasselt PM, Verhoeven-Duif NM. Understanding acute metabolic decompensation in propionic and methylmalonic acidemias: a deep metabolic phenotyping approach. Orphanet J Rare Dis. 2020 Mar 6;15(1):68. [CrossRef] [PubMed] [PubMed Central]
- Liu N, Xiao J, Gijavanekar C, Pappan KL, Glinton KE, Shayota BJ, Kennedy AD, Sun Q, Sutton VR, Elsea SH. Comparison of Untargeted Metabolomic Profiling vs Traditional Metabolic Screening to Identify Inborn Errors of Metabolism. JAMA Netw Open. 2021 Jul 1;4(7):e2114155. [CrossRef] [PubMed] [PubMed Central]
- Miller MJ, Kennedy AD, Eckhart AD, Burrage LC, Wulff JE, Miller LA, Milburn MV, Ryals JA, Beaudet AL, Sun Q, Sutton VR, Elsea SH. Untargeted metabolomic analysis for the clinical screening of inborn errors of metabolism. J Inherit Metab Dis. 2015 Nov;38(6):1029-39. Epub 2015 Apr 15. Erratum in: J Inherit Metab Dis. 2016 Sep;39(5):757. [CrossRef] [PubMed] [PubMed Central]
- Warrack BM, Hnatyshyn S, Ott KH, Reily MD, Sanders M, Zhang H, Drexler DM. Normalization strategies for metabonomic analysis of urine samples. J Chromatogr B Analyt Technol Biomed Life Sci. 2009 Feb 15;877(5-6):547-52. Epub 2009 Jan 14. [CrossRef] [PubMed]
- Rosen Vollmar AK, Rattray NJW, Cai Y, Santos-Neto ÁJ, Deziel NC, Jukic AMZ, Johnson CH. Normalizing Untargeted Periconceptional Urinary Metabolomics Data: A Comparison of Approaches. Metabolites. 2019 Sep 21;9(10):198. [CrossRef] [PubMed] [PubMed Central]
- Dieterle F, Ross A, Schlotterbeck G, Senn H. Probabilistic quotient normalization as robust method to account for dilution of complex biological mixtures. Application in 1H NMR metabonomics. Anal Chem. 2006 Jul 1;78(13):4281-90. [CrossRef] [PubMed]
- Sun J, Xia Y. Pretreating and normalizing metabolomics data for statistical analysis. Genes Dis. 2023 Jul 7;11(3):100979. [CrossRef] [PubMed] [PubMed Central]
- Gallagher EM, Rizzo GM, Dorsey R, Dhummakupt ES, Moran TS, Mach PM, Jenkins CC. Normalization of organ-on-a-Chip samples for mass spectrometry based proteomics and metabolomics via Dansylation-based assay. Toxicol In Vitro. 2023 Apr;88:105540. Epub 2022 Dec 20. [CrossRef] [PubMed]
- Barr DB, Wilder LC, Caudill SP, Gonzalez AJ, Needham LL, Pirkle JL. Urinary creatinine concentrations in the U.S. population: implications for urinary biologic monitoring measurements. Environ Health Perspect. 2005 Feb;113(2):192-200. [CrossRef] [PubMed] [PubMed Central]
- Miller RC, Brindle E, Holman DJ, Shofer J, Klein NA, Soules MR, O'Connor KA. Comparison of specific gravity and creatinine for normalizing urinary reproductive hormone concentrations. Clin Chem. 2004 May;50(5):924-32. Epub 2004 Mar 11. [CrossRef] [PubMed]
- Davies SE, Iles RA, Stacey TE, Chalmers RA. Creatine metabolism during metabolic perturbations in patients with organic acidurias. Clin Chim Acta. 1990 Dec 24;194(2-3):203-17. [CrossRef] [PubMed]
- Younessi D, Moseley K, Yano S. Creatine metabolism in combined methylmalonic aciduria and homocystinuria disease revisited. Ann Neurol. 2009 Apr;65(4):481-2; author reply 482-3. [CrossRef] [PubMed]
- Schuck PF, Rosa RB, Pettenuzzo LF, Sitta A, Wannmacher CM, Wyse AT, Wajner M. Inhibition of mitochondrial creatine kinase activity from rat cerebral cortex by methylmalonic acid. Neurochem Int. 2004 Oct;45(5):661-7. [CrossRef] [PubMed]
- Shchelochkov OA, Manoli I, Sloan JL, Ferry S, Pass A, Van Ryzin C, Myles J, Schoenfeld M, McGuire P, Rosing DR, Levin MD, Kopp JB, Venditti CP. Chronic kidney disease in propionic acidemia. Genet Med. 2019 Dec;21(12):2830-2835. Epub 2019 Jun 28. [CrossRef] [PubMed] [PubMed Central]
- Fowler B, Leonard JV, Baumgartner MR. Causes of and diagnostic approach to methylmalonic acidurias. J Inherit Metab Dis. 2008 Jun;31(3):350-60. Epub 2008 Jun 19. [CrossRef] [PubMed]
- Frenkel EP, Kitchens RL. A simplified and rapid quantitative assay for propionic and methylmalonic acids in urine. J Lab Clin Med. 1975 Mar;85(3):487-96. [PubMed]
- Frenkel EP, Kitchens RL. Applicability of an enzymatic quantitation of methylmalonic, propionic, and acetic acids in normal and megaloblastic states. Blood. 1977 Jan;49(1):125-37. [PubMed]
- Truscott RJ, Pullin CJ, Halpern B, Hammond J, Haan E, Danks DM. The identification of 3-keto-2-methylvaleric acid and 3-hydroxy-2-methylvaleric acid in a patient with propionic acidemia. Biomed Mass Spectrom. 1979 Jul;6(7):294-300. [CrossRef] [PubMed]
- Chalmers R. A., Lawson A. M. (1982) Organic Acids in Man. The Analytical Chemistry, Biochemistry and Diagnosis of the Organic Acidurias, London: Chapman & Hall.
- Wongkittichote P, Cunningham G, Summar ML, Pumbo E, Forny P, Baumgartner MR, Chapman KA. Tricarboxylic acid cycle enzyme activities in a mouse model of methylmalonic aciduria. Mol Genet Metab. 2019 Dec;128(4):444-451. Epub 2019 Oct 17. [CrossRef] [PubMed] [PubMed Central]
- Longo N, Price LB, Gappmaier E, Cantor NL, Ernst SL, Bailey C, Pasquali M. Anaplerotic therapy in propionic acidemia. Mol Genet Metab. 2017 Sep;122(1-2):51-59. Epub 2017 Jul 12. [CrossRef] [PubMed] [PubMed Central]
- Parfait B, de Lonlay P, von Kleist-Retzow JC, Cormier-Daire V, Chrétien D, Rötig A, Rabier D, Saudubray JM, Rustin P, Munnich A. The neurogenic weakness, ataxia and retinitis pigmentosa (NARP) syndrome mtDNA mutation (T8993G) triggers muscle ATPase deficiency and hypocitrullinaemia. Eur J Pediatr. 1999 Jan;158(1):55-8. [CrossRef] [PubMed]
- Subramanian C, Frank MW, Tangallapally R, Yun MK, Edwards A, White SW, Lee RE, Rock CO, Jackowski S. Pantothenate kinase activation relieves coenzyme A sequestration and improves mitochondrial function in mice with propionic acidemia. Sci Transl Med. 2021 Sep 15;13(611):eabf5965. Epub 2021 Sep 15. [CrossRef] [PubMed] [PubMed Central]
- Almannai M, El-Hattab AW. Nitric Oxide Deficiency in Mitochondrial Disorders: The Utility of Arginine and Citrulline. Front Mol Neurosci. 2021 Aug 5;14:682780. [CrossRef] [PubMed] [PubMed Central]
- Zecchini V, Paupe V, Herranz-Montoya I, Janssen J, Wortel IMN, Morris JL, Ferguson A, Chowdury SR, Segarra-Mondejar M, Costa ASH, Pereira GC, Tronci L, Young T, Nikitopoulou E, Yang M, Bihary D, Caicci F, Nagashima S, Speed A, Bokea K, Baig Z, Samarajiwa S, Tran M, Mitchell T, Johnson M, Prudent J, Frezza C. Fumarate induces vesicular release of mtDNA to drive innate immunity. Nature. 2023 Mar;615(7952):499-506. Epub 2023 Mar 8. [CrossRef] [PubMed] [PubMed Central]
- Head PE, Myung S, Chen Y, Schneller JL, Wang C, Duncan N, Hoffman P, Chang D, Gebremariam A, Gucek M, Manoli I, Venditti CP. Aberrant methylmalonylation underlies methylmalonic acidemia and is attenuated by an engineered sirtuin. Sci Transl Med. 2022 May 25;14(646):eabn4772. Epub 2022 May 25. [CrossRef] [PubMed] [PubMed Central]
- Haijes HA, van Hasselt PM, Jans JJM, Verhoeven-Duif NM. Pathophysiology of propionic and methylmalonic acidemias. Part 2: Treatment strategies. J Inherit Metab Dis. 2019 Sep;42(5):745-761. Epub 2019 Jul 9. [CrossRef] [PubMed]
- Roe CR, Bohan TP. L-carnitine therapy in propionicacidaemia. Lancet. 1982 Jun 19;1(8286):1411-2. [CrossRef] [PubMed]
- Krieger I, Tanaka K. Therapeutic effects of glycine in isovaleric acidemia. Pediatr Res. 1976 Jan;10(1):25-9. [CrossRef] [PubMed]
- Rizzo C, Boenzi S, Inglese R, la Marca G, Muraca M, Martinez TB, Johnson DW, Zelli E, Dionisi-Vici C. Measurement of succinyl-carnitine and methylmalonyl-carnitine on dried blood spot by liquid chromatography-tandem mass spectrometry. Clin Chim Acta. 2014 Feb 15;429:30-3. Epub 2013 Nov 22. [CrossRef] [PubMed]
- Sloan JL, Achilly NP, Arnold ML, Catlett JL, Blake T, Bishop K, Jones M, Harper U, English MA, Anderson S, Trivedi NS, Elkahloun A, Hoffmann V, Brooks BP, Sood R, Venditti CP. The vitamin B12 processing enzyme, mmachc, is essential for zebrafish survival, growth and retinal morphology. Hum Mol Genet. 2020 Aug 3;29(13):2109-2123. [CrossRef] [PubMed] [PubMed Central]
- Hoss, G. R. W., Poloni, S., Blom, H. J., & Schwartz, I. V. D. (2019). Three main causes of homocystinuria: CBS, cblC and MTHFR deficiency. What do they have in common? Journal of Inborn Errors of Metabolism and Screening, 7, e20190007.
- Sbodio JI, Snyder SH, Paul BD. Regulators of the transsulfuration pathway. Br J Pharmacol. 2019 Feb;176(4):583-593. Epub 2018 Aug 23. [CrossRef] [PubMed] [PubMed Central]
- Stipanuk MH, Ueki I. Dealing with methionine/homocysteine sulfur: cysteine metabolism to taurine and inorganic sulfur. J Inherit Metab Dis. 2011 Feb;34(1):17-32. Epub 2010 Feb 17. [CrossRef] [PubMed] [PubMed Central]
- Mc Guire PJ, Parikh A, Diaz GA. Profiling of oxidative stress in patients with inborn errors of metabolism. Mol Genet Metab. 2009 Sep-Oct;98(1-2):173-80. Epub 2009 Jun 14. [CrossRef] [PubMed] [PubMed Central]
- Rivera-Barahona A, Alonso-Barroso E, Pérez B, Murphy MP, Richard E, Desviat LR. Treatment with antioxidants ameliorates oxidative damage in a mouse model of propionic acidemia. Mol Genet Metab. 2017 Sep;122(1-2):43-50. Epub 2017 Jul 25. [CrossRef] [PubMed]
- Gallego-Villar L, Rivera-Barahona A, Cuevas-Martín C, Guenzel A, Pérez B, Barry MA, Murphy MP, Logan A, Gonzalez-Quintana A, Martín MA, Medina S, Gil-Izquierdo A, Cuezva JM, Richard E, Desviat LR. In vivo evidence of mitochondrial dysfunction and altered redox homeostasis in a genetic mouse model of propionic acidemia: Implications for the pathophysiology of this disorder. Free Radic Biol Med. 2016 Jul;96:1-12. Epub 2016 Apr 12. [CrossRef] [PubMed]
- Liu Y, Wang S, Zhang X, Cai H, Liu J, Fang S, Yu B. The Regulation and Characterization of Mitochondrial-Derived Methylmalonic Acid in Mitochondrial Dysfunction and Oxidative Stress: From Basic Research to Clinical Practice. Oxid Med Cell Longev. 2022 May 24;2022:7043883. [CrossRef] [PubMed] [PubMed Central]
- Richard E, Jorge-Finnigan A, Garcia-Villoria J, Merinero B, Desviat LR, Gort L, Briones P, Leal F, Pérez-Cerdá C, Ribes A, Ugarte M, Pérez B; MMACHC Working Group. Genetic and cellular studies of oxidative stress in methylmalonic aciduria (MMA) cobalamin deficiency type C (cblC) with homocystinuria (MMACHC). Hum Mutat. 2009 Nov;30(11):1558-66. [CrossRef] [PubMed]
- Pastore A, Martinelli D, Piemonte F, Tozzi G, Boenzi S, Di Giovamberardino G, Petrillo S, Bertini E, Dionisi-Vici C. Glutathione metabolism in cobalamin deficiency type C (cblC). J Inherit Metab Dis. 2014 Jan;37(1):125-9. Epub 2013 Apr 9. [CrossRef] [PubMed]
- Luo J, Hashimoto Y, Martens LG, Meulmeester FL, Ashrafi N, Mook-Kanamori DO, Rosendaal FR, Jukema JW, van Dijk KW, Mills K, le Cessie S, Noordam R, van Heemst D. Associations of metabolomic profiles with circulating vitamin E and urinary vitamin E metabolites in middle-aged individuals. Nutrition. 2022 Jan;93:111440. Epub 2021 Jul 29. [CrossRef] [PubMed]
- Wallert M, Schmölz L, Galli F, Birringer M, Lorkowski S. Regulatory metabolites of vitamin E and their putative relevance for atherogenesis. Redox Biol. 2014 Feb 19;2:495-503. [CrossRef] [PubMed] [PubMed Central]
- Sharma G, Muller DP, O'Riordan SM, Bryan S, Dattani MT, Hindmarsh PC, Mills K. Urinary conjugated α-tocopheronolactone--a biomarker of oxidative stress in children with type 1 diabetes. Free Radic Biol Med. 2013 Feb;55:54-62. Epub 2012 Oct 27. [CrossRef] [PubMed] [PubMed Central]
- Ham YH, Jason Chan KK, Chan W. Thioproline Serves as an Efficient Antioxidant Protecting Human Cells from Oxidative Stress and Improves Cell Viability. Chem Res Toxicol. 2020 Jul 20;33(7):1815-1821. Epub 2020 Apr 30. [CrossRef] [PubMed]
- Morellato AE, Umansky C, Pontel LB. The toxic side of one-carbon metabolism and epigenetics. Redox Biol. 2021 Apr;40:101850. Epub 2020 Dec 28. [CrossRef] [PubMed] [PubMed Central]
- Barroso, M., Handy, D. E., & Castro, R. (2019). The link between hyperhomocysteinemia and hypomethylation: Implications for cardiovascular disease. Journal of Inborn Errors of Metabolism and Screening, 5, e160024.
- Pietzke M, Burgos-Barragan G, Wit N, Tait-Mulder J, Sumpton D, Mackay GM, Patel KJ, Vazquez A. Amino acid dependent formaldehyde metabolism in mammals. Commun Chem. 2020 Jun 16;3(1):78. [CrossRef] [PubMed] [PubMed Central]
- Tulpule K, Dringen R. Formaldehyde in brain: an overlooked player in neurodegeneration? J Neurochem. 2013 Oct;127(1):7-21. Epub 2013 Jul 15. [CrossRef] [PubMed]
- Vaudry H, Ubuka T, Soma KK, Tsutsui K. Editorial: Recent Progress and Perspectives in Neurosteroid Research. Front Endocrinol (Lausanne). 2022 Jul 27;13:951990. [CrossRef] [PubMed] [PubMed Central]
- Strac DS, Konjevod M, Perkovic MN, Tudor L, Erjavec GN, Pivac N. Dehydroepiandrosterone (DHEA) and its Sulphate (DHEAS) in Alzheimer's Disease. Curr Alzheimer Res. 2020;17(2):141-157. [CrossRef] [PubMed]
- Yilmaz C, Karali K, Fodelianaki G, Gravanis A, Chavakis T, Charalampopoulos I, Alexaki VI. Neurosteroids as regulators of neuroinflammation. Front Neuroendocrinol. 2019 Oct;55:100788. Epub 2019 Sep 9. [CrossRef] [PubMed]
- Chik MW, Hazalin NAMN, Singh GKS. Regulation of phase I and phase II neurosteroid enzymes in the hippocampus of an Alzheimer's disease rat model: A focus on sulphotransferases and UDP-glucuronosyltransferases. Steroids. 2022 Aug;184:109035. Epub 2022 Apr 8. [CrossRef] [PubMed]
- Lloyd-Evans E, Waller-Evans H. Biosynthesis and signalling functions of central and peripheral nervous system neurosteroids in health and disease. Essays Biochem. 2020 Sep 23;64(3):591-606. [CrossRef] [PubMed] [PubMed Central]
- Bianchi VE, Rizzi L, Bresciani E, Omeljaniuk RJ, Torsello A. Androgen Therapy in Neurodegenerative Diseases. J Endocr Soc. 2020 Aug 21;4(11):bvaa120. [CrossRef] [PubMed] [PubMed Central]
- Naylor JC, Hulette CM, Steffens DC, Shampine LJ, Ervin JF, Payne VM, Massing MW, Kilts JD, Strauss JL, Calhoun PS, Calnaido RP, Blazer DG, Lieberman JA, Madison RD, Marx CE. Cerebrospinal fluid dehydroepiandrosterone levels are correlated with brain dehydroepiandrosterone levels, elevated in Alzheimer's disease, and related to neuropathological disease stage. J Clin Endocrinol Metab. 2008 Aug;93(8):3173-8. Epub 2008 May 13. [CrossRef] [PubMed] [PubMed Central]
- Marx CE, Trost WT, Shampine LJ, Stevens RD, Hulette CM, Steffens DC, Ervin JF, Butterfield MI, Blazer DG, Massing MW, Lieberman JA. The neurosteroid allopregnanolone is reduced in prefrontal cortex in Alzheimer's disease. Biol Psychiatry. 2006 Dec 15;60(12):1287-94. Epub 2006 Sep 25. [CrossRef] [PubMed]
- Troisi J, Landolfi A, Vitale C, Longo K, Cozzolino A, Squillante M, Savanelli MC, Barone P, Amboni M. A metabolomic signature of treated and drug-naïve patients with Parkinson's disease: a pilot study. Metabolomics. 2019 Jun 10;15(6):90. [CrossRef] [PubMed]
- Shao Y, Li T, Liu Z, Wang X, Xu X, Li S, Xu G, Le W. Comprehensive metabolic profiling of Parkinson's disease by liquid chromatography-mass spectrometry. Mol Neurodegener. 2021 Jan 23;16(1):4. [CrossRef] [PubMed] [PubMed Central]
- Nuzzi R, Caselgrandi P. Sex Hormones and Their Effects on Ocular Disorders and Pathophysiology: Current Aspects and Our Experience. Int J Mol Sci. 2022 Mar 17;23(6):3269. [CrossRef] [PubMed] [PubMed Central]
- Nishikawa Y, Morishita S, Horie T, Fukumoto M, Sato T, Kida T, Oku H, Sugasawa J, Ikeda T, Nakamura K. A comparison of sex steroid concentration levels in the vitreous and serum of patients with vitreoretinal diseases. PLoS One. 2017 Jul 13;12(7):e0180933. [CrossRef] [PubMed] [PubMed Central]
- Schellevis RL, Altay L, Kalisingh A, Mulders TWF, Sitnilska V, Hoyng CB, Boon CJF, Groenewoud JMM, de Jong EK, den Hollander AI. Elevated Steroid Hormone Levels in Active Chronic Central Serous Chorioretinopathy. Invest Ophthalmol Vis Sci. 2019 Aug 1;60(10):3407-3413. [CrossRef] [PubMed]
- Kim, Jin Ju, Hyeong Gon Yu, and Seung Yup Ku. "Sex Steroid Hormone and Ophthalmic Disease." Korean Journal of Reproductive Medicine 37.2 (2010): 89-98.
- Nuzzi R, Scalabrin S, Becco A, Panzica G. Gonadal Hormones and Retinal Disorders: A Review. Front Endocrinol (Lausanne). 2018 Mar 2;9:66. [CrossRef] [PubMed] [PubMed Central]
- Onal H, Kutlu E, Aydın B, Ersen A, Topal N, Adal E, Güneş H, Doktur H, Tanıdır C, Pirhan D, Sayın N. Assessment of retinal thickness as a marker of brain masculinization in children with congenital adrenal hyperplasia: a pilot study. J Pediatr Endocrinol Metab. 2019 Jul 26;32(7):683-687. [CrossRef] [PubMed]
- Farrell EK, Chen Y, Barazanji M, Jeffries KA, Cameroamortegui F, Merkler DJ. Primary fatty acid amide metabolism: conversion of fatty acids and an ethanolamine in N18TG2 and SCP cells. J Lipid Res. 2012 Feb;53(2):247-56. Epub 2011 Nov 16. [CrossRef] [PubMed] [PubMed Central]
- Šebela M, Rašková M. Polyamine-Derived Aminoaldehydes and Acrolein: Cytotoxicity, Reactivity and Analysis of the Induced Protein Modifications. Molecules. 2023 Nov 4;28(21):7429. [CrossRef] [PubMed] [PubMed Central]
Figure 1.
PCA obtained from untargeted metabolomic data acquired by C18 and HILIC columns in negative ionization mode.
Figure 1.
PCA obtained from untargeted metabolomic data acquired by C18 and HILIC columns in negative ionization mode.
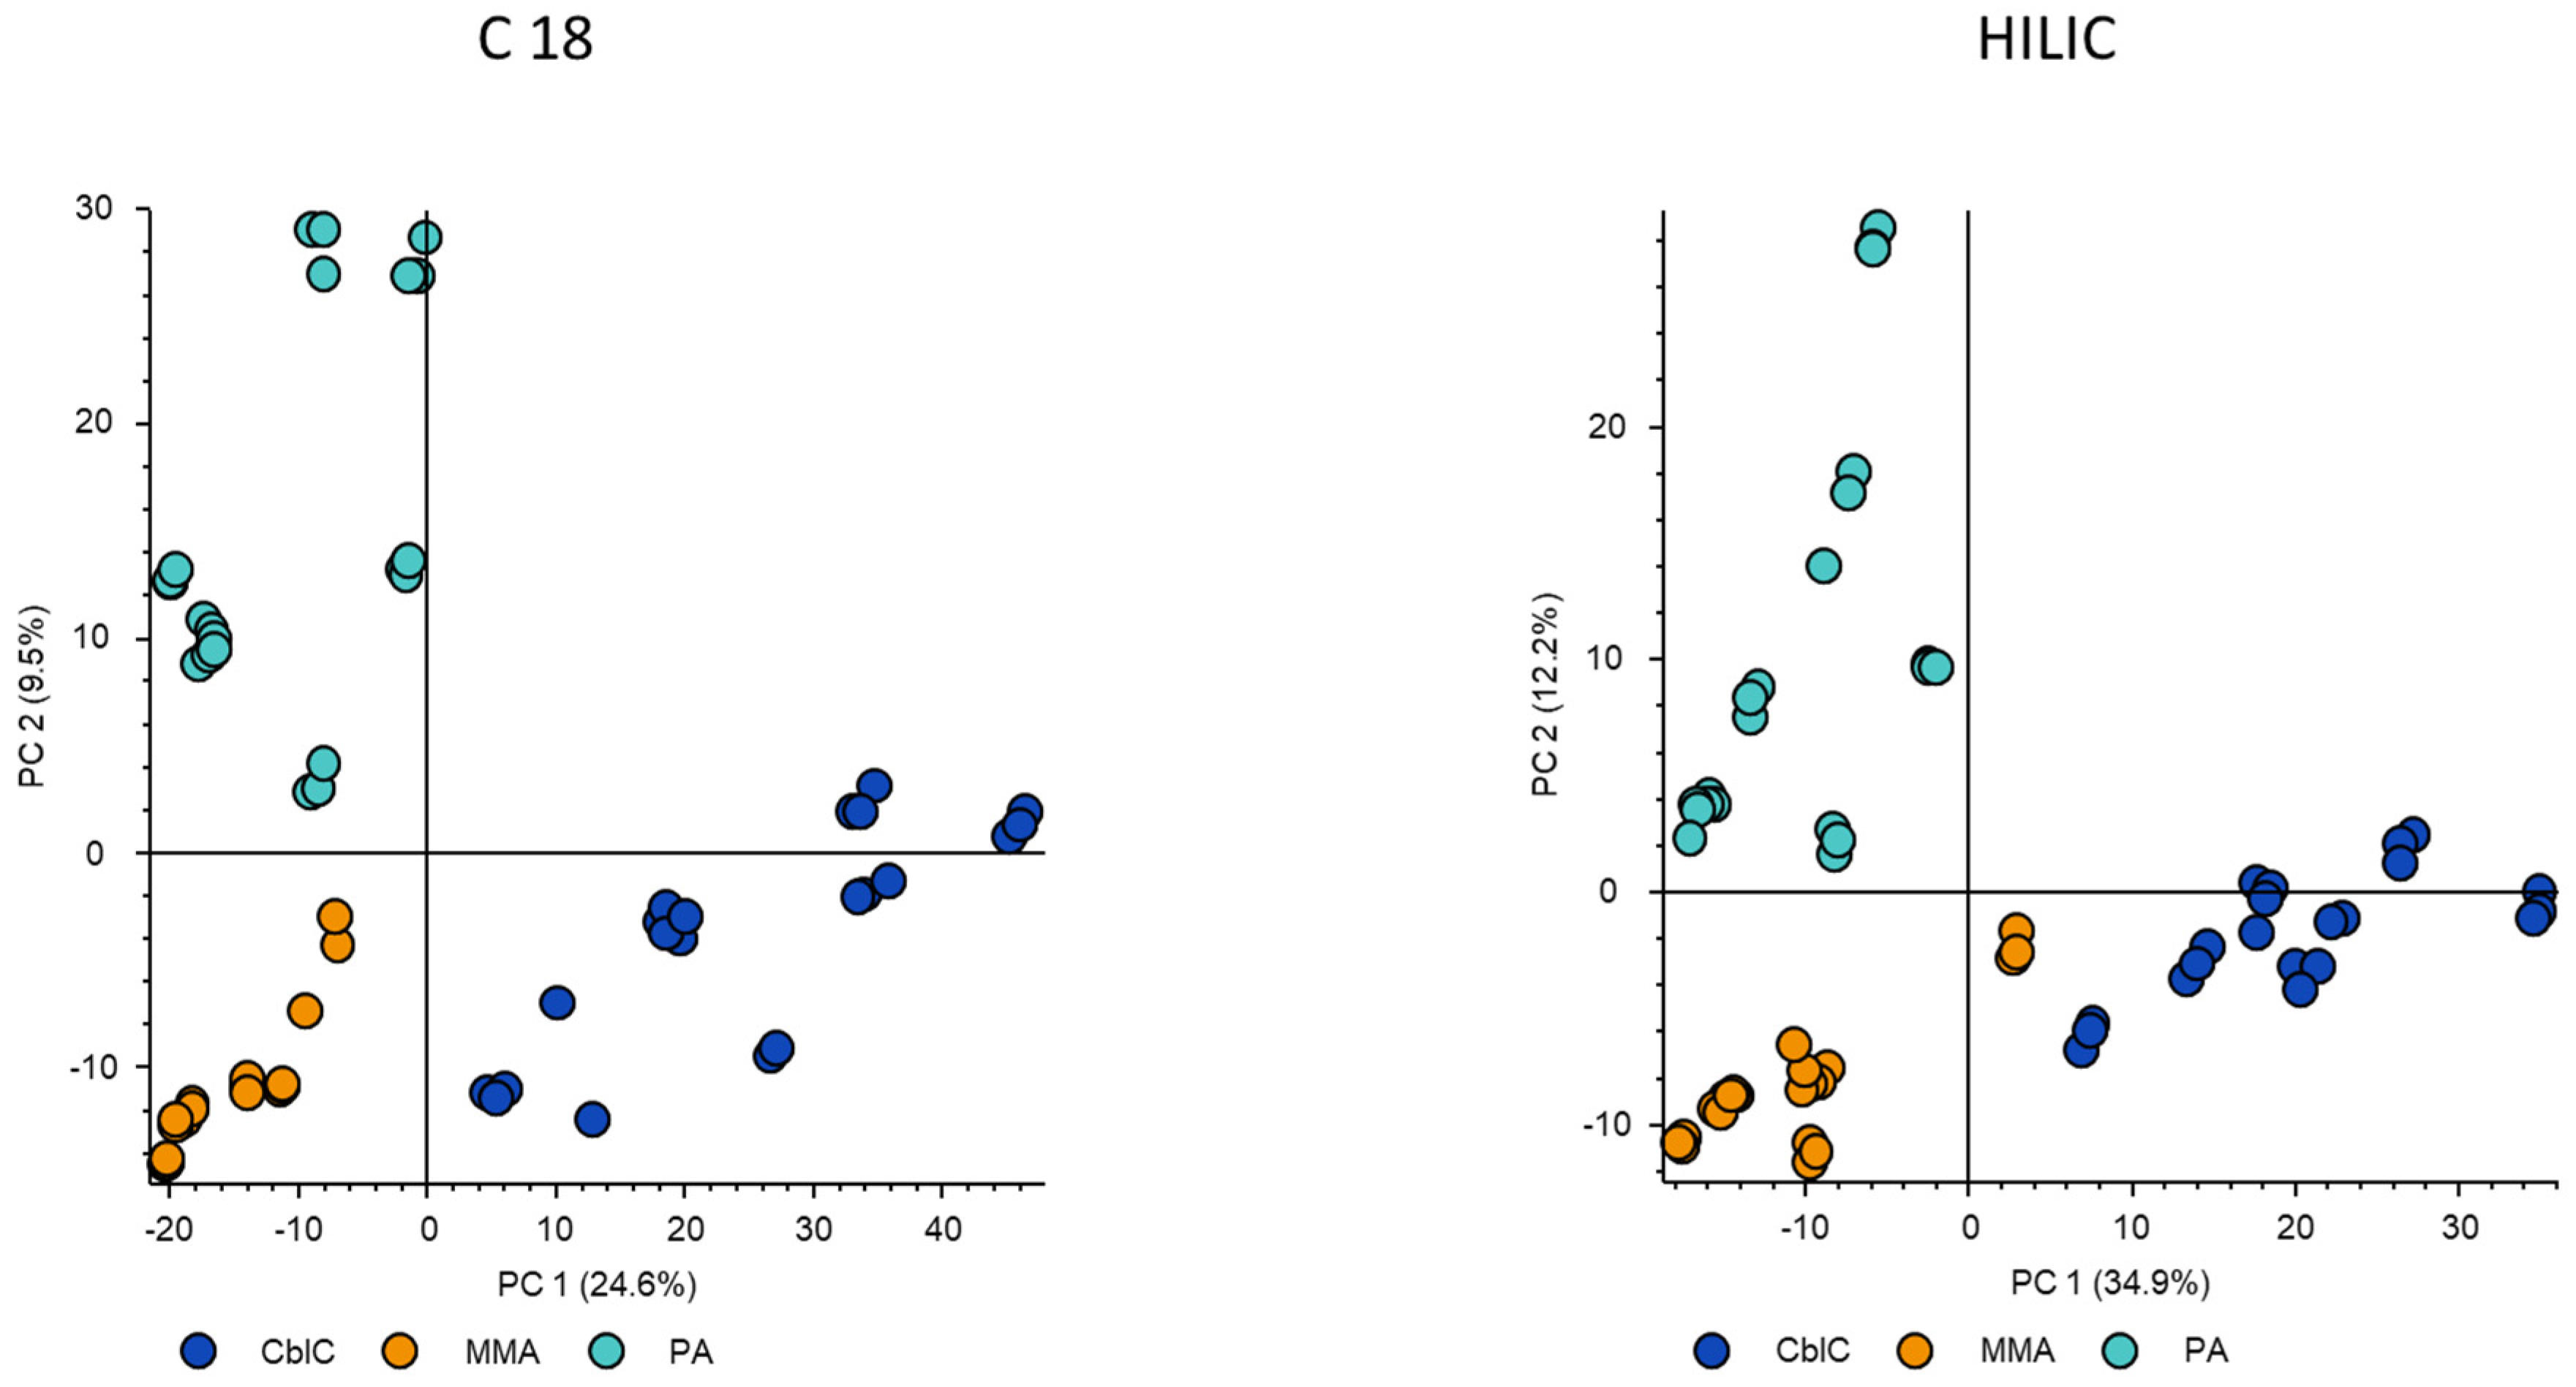
Figure 2.
Pathway enrichment analysis. Node size (pathway impact) corresponds to the relative number and position of matched metabolites in the selected pathway, colours varying from yellow to red mean the different levels of significance. The named pathways include only those with p<0.05.
Figure 2.
Pathway enrichment analysis. Node size (pathway impact) corresponds to the relative number and position of matched metabolites in the selected pathway, colours varying from yellow to red mean the different levels of significance. The named pathways include only those with p<0.05.
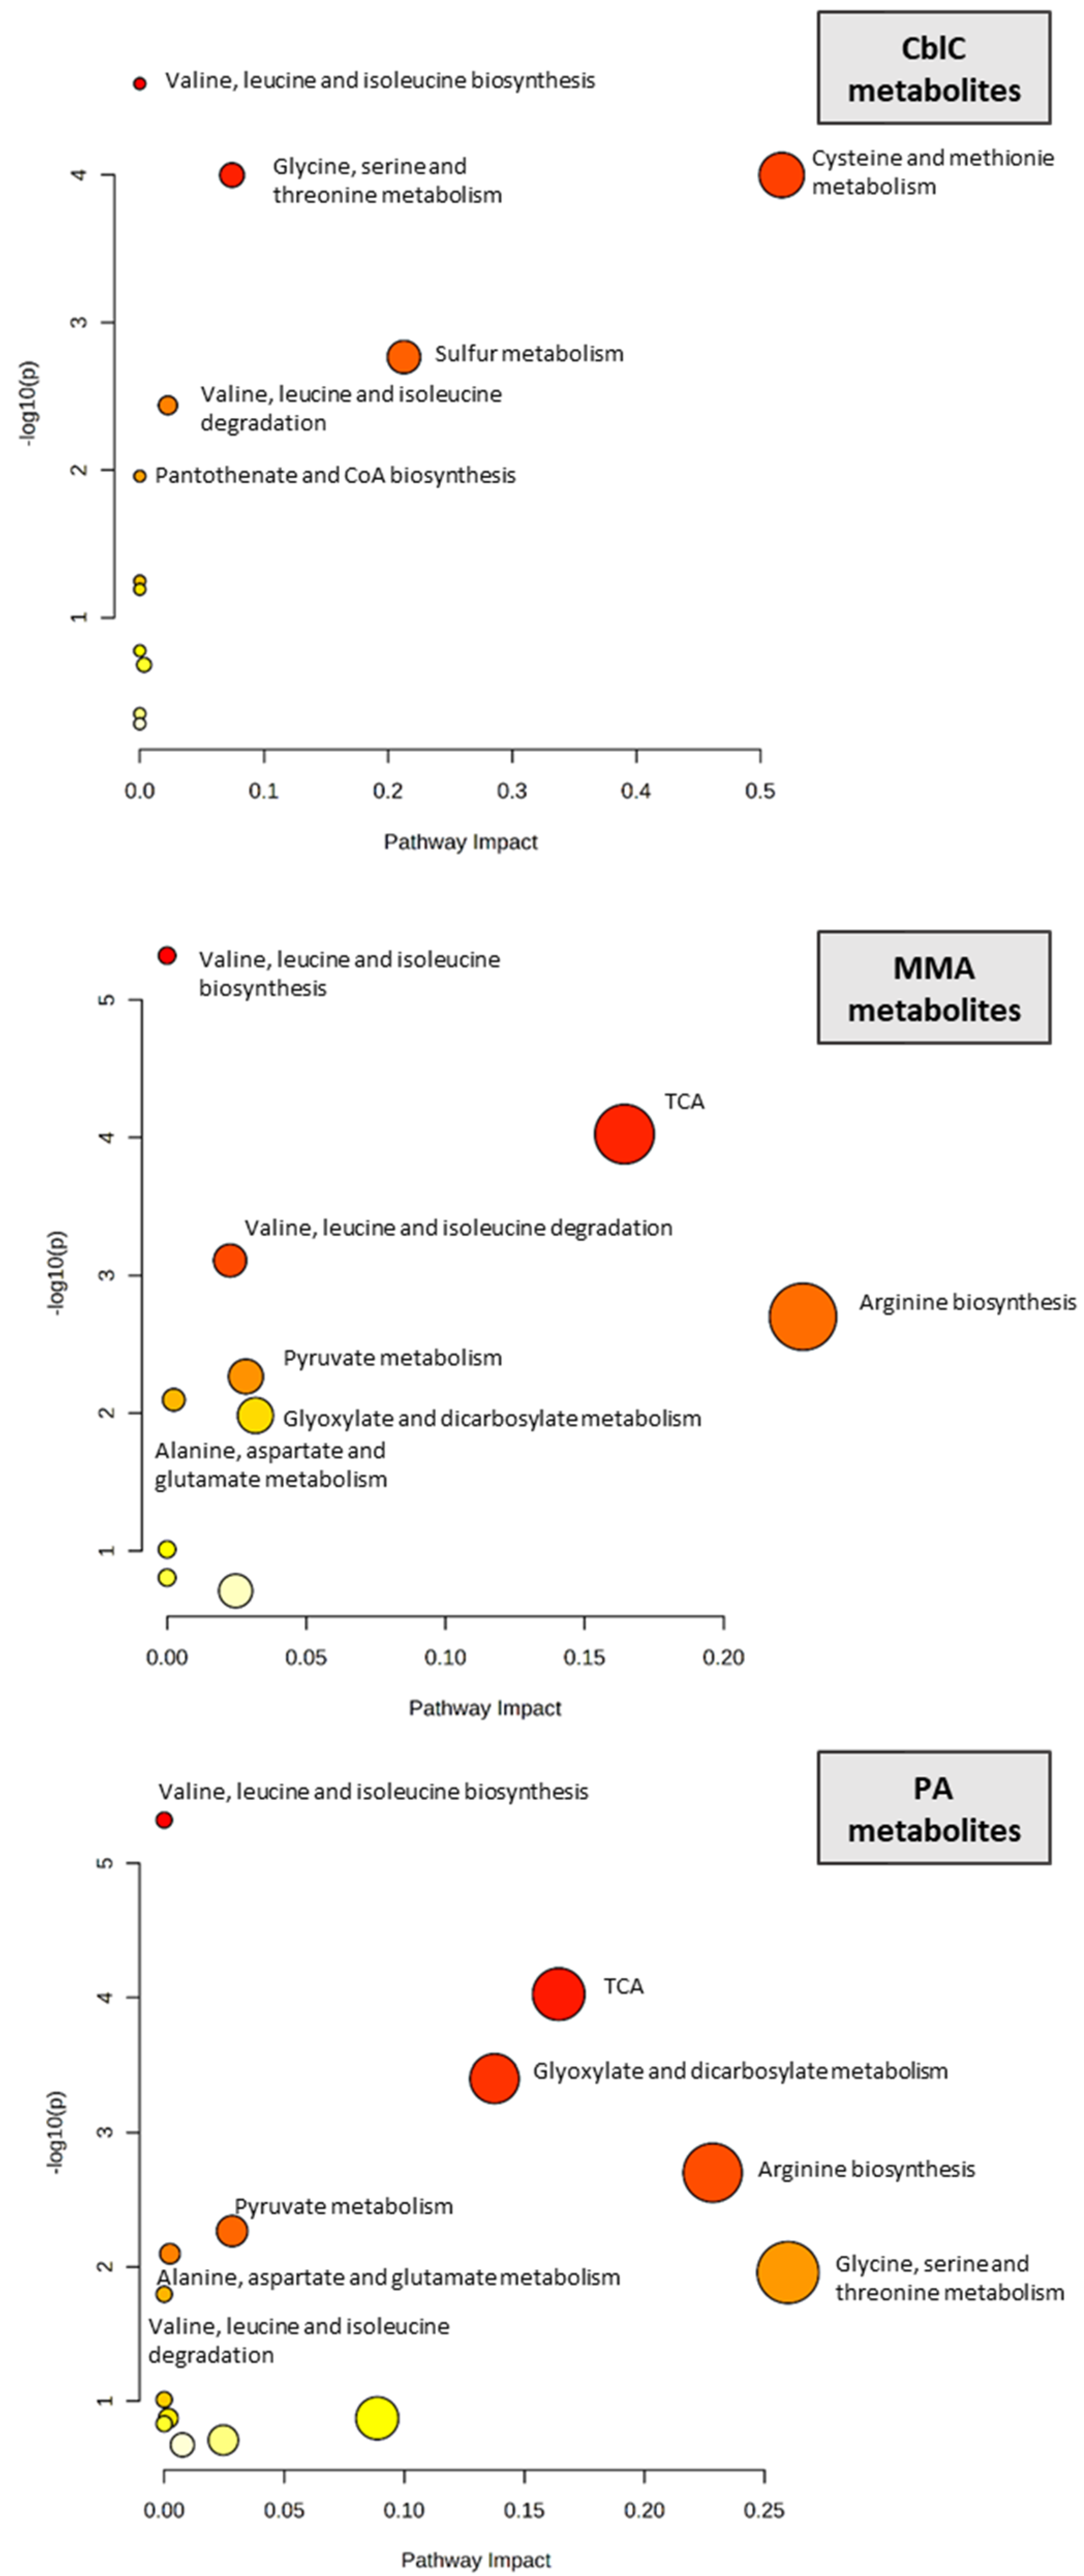
Figure 3.
Organic acids and ketones significantly changed between three acidemias. * – p-value < 0.05; ** – p-value < 0.01; *** – p-value < 0.001; N.S. – non-significant.
Figure 3.
Organic acids and ketones significantly changed between three acidemias. * – p-value < 0.05; ** – p-value < 0.01; *** – p-value < 0.001; N.S. – non-significant.
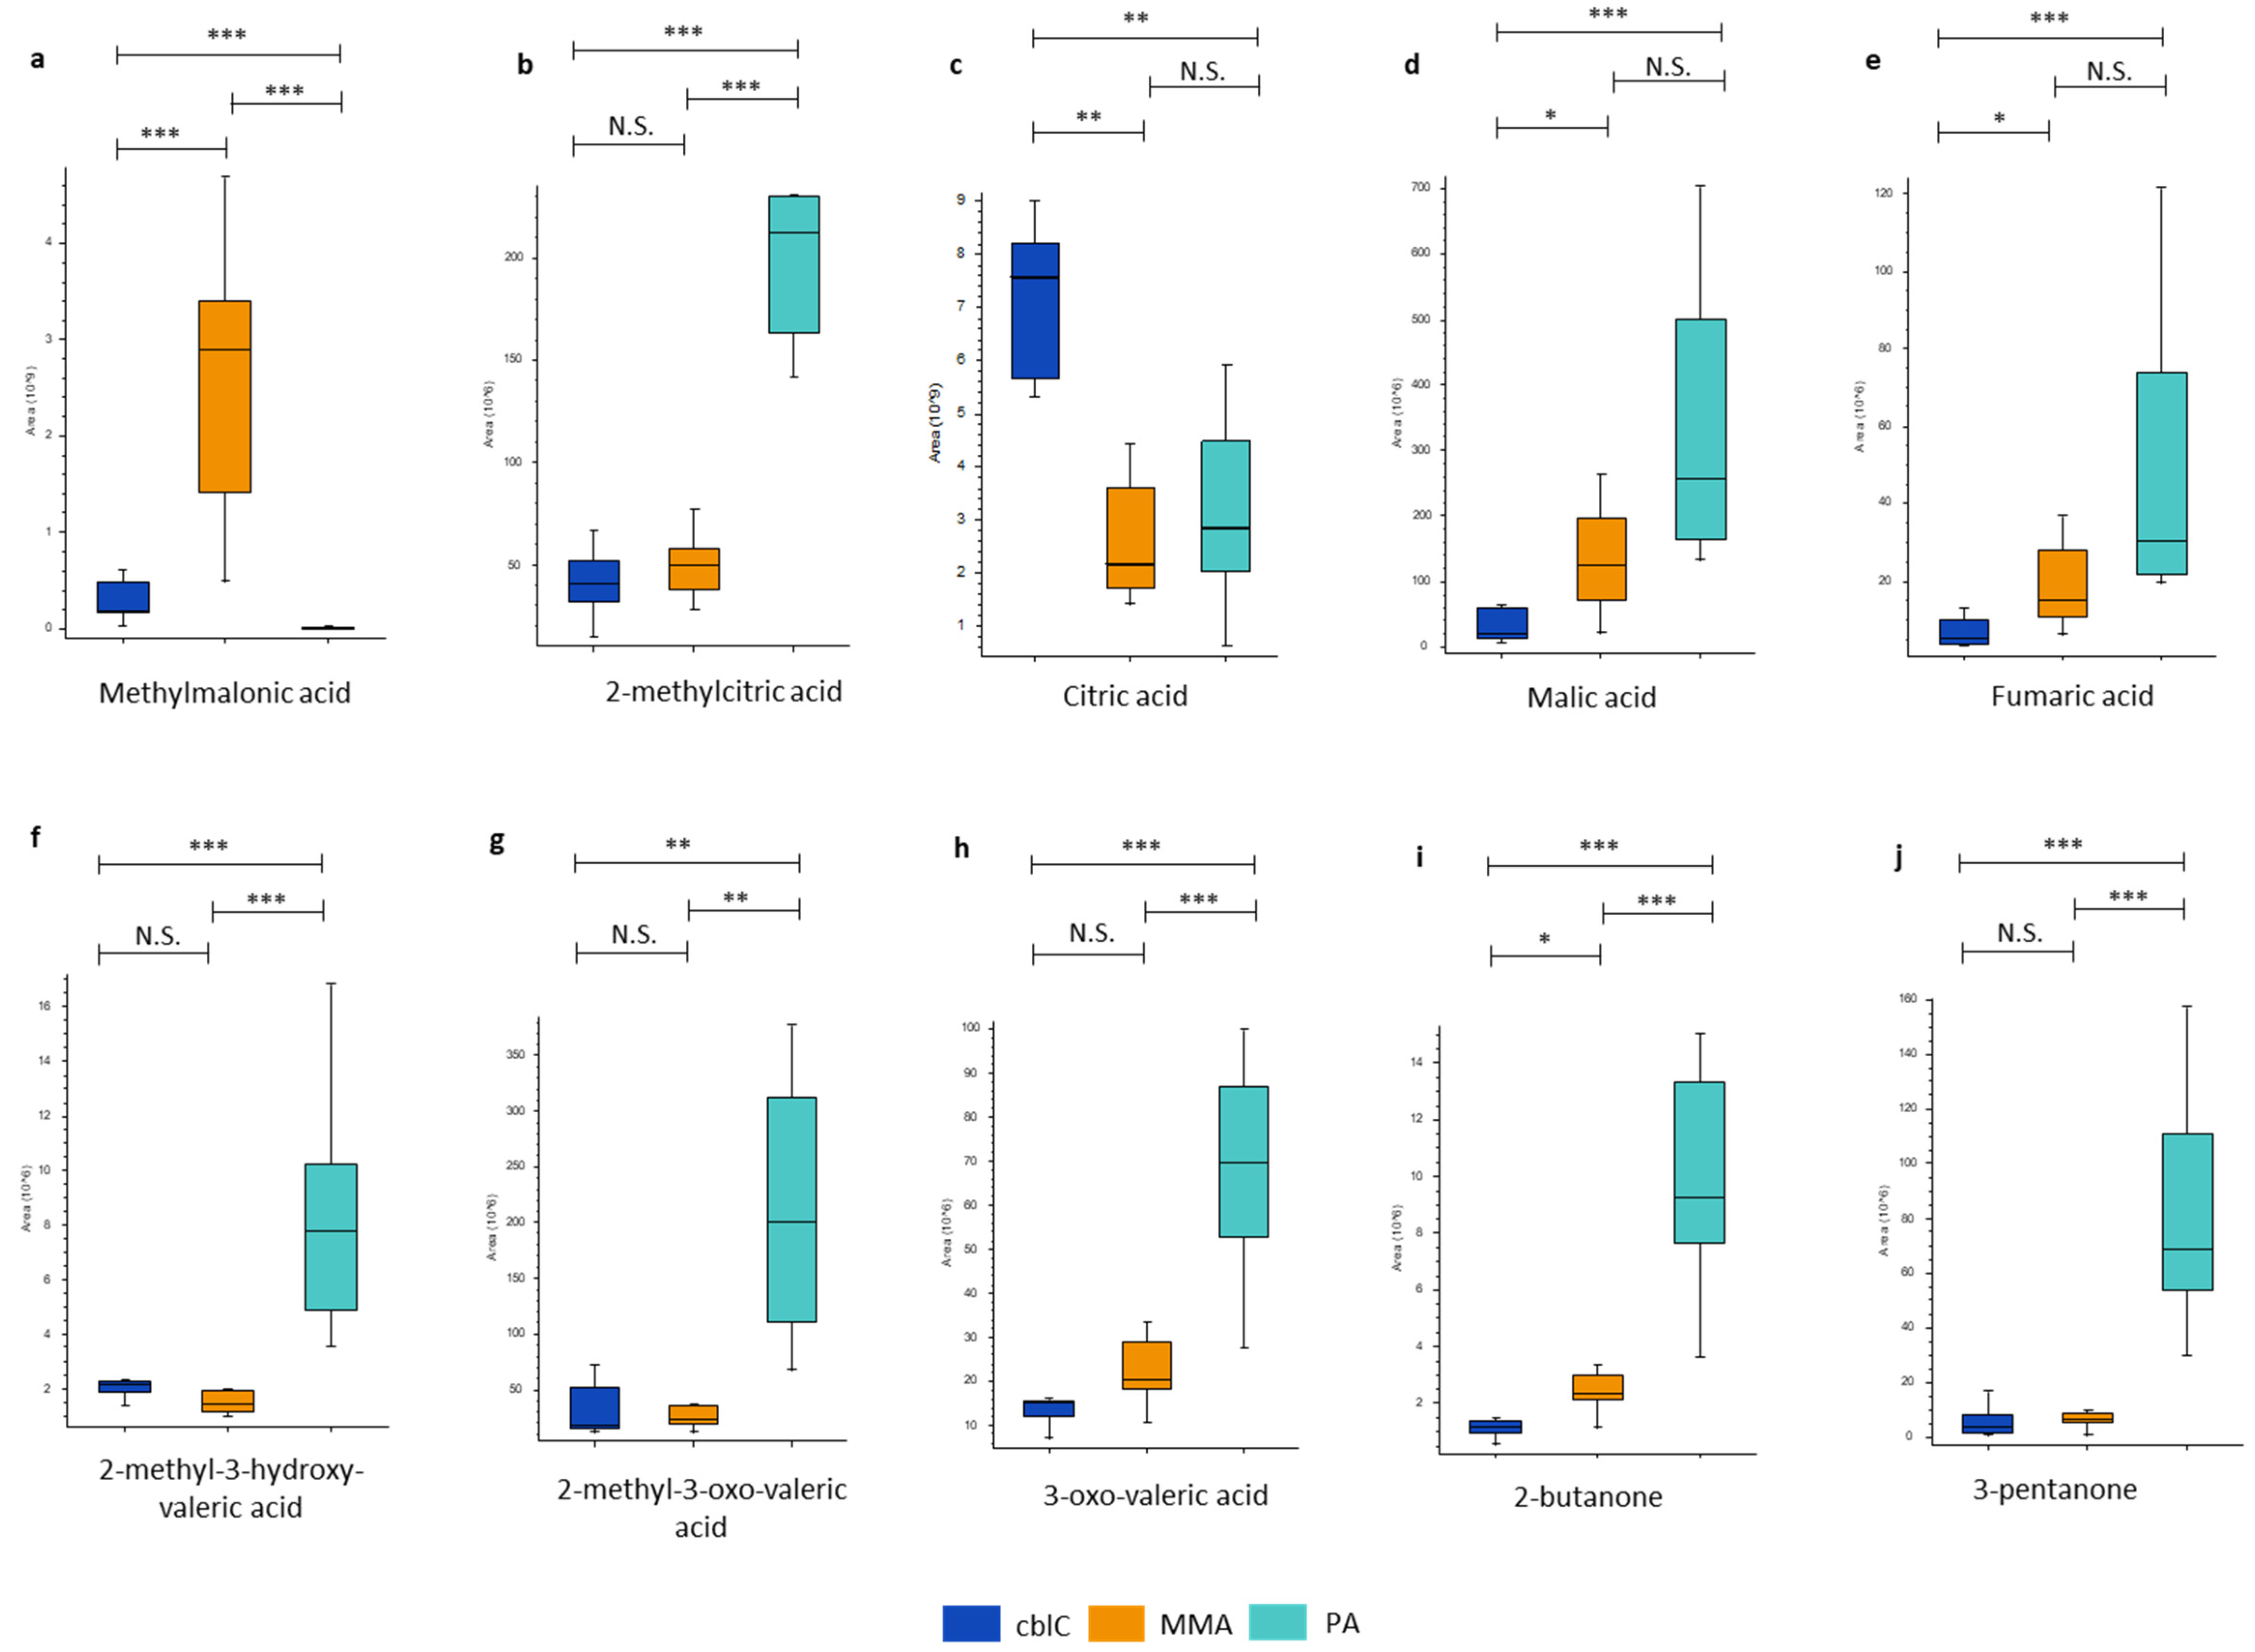
Figure 4.
Significantly changed amino acids and small peptides. * – p-value < 0.05; ** – p-value < 0.01; *** – p-value < 0.001; N.S. – non-significantCoherently with dietary restrictions, MMA and PA showed reduced levels of valine, isoleucine and threonine, and of di- and tri-peptides composed of branched-chain amino acids and/or threonine (i.e. isoleucylalanine, glutamylisoleucine, valylvaline, isoleucylvaline, butyl-alpha-aspartyl-allothreoninate). In addition, other amino acids and peptides (i.e. dimethylglycine, aspartylphenylalanine, prolylproline, glycylglycyl-alanyl-2-methylalanine, lysine and citrulline) were relatively higher in cblC compared to MMA and PA.
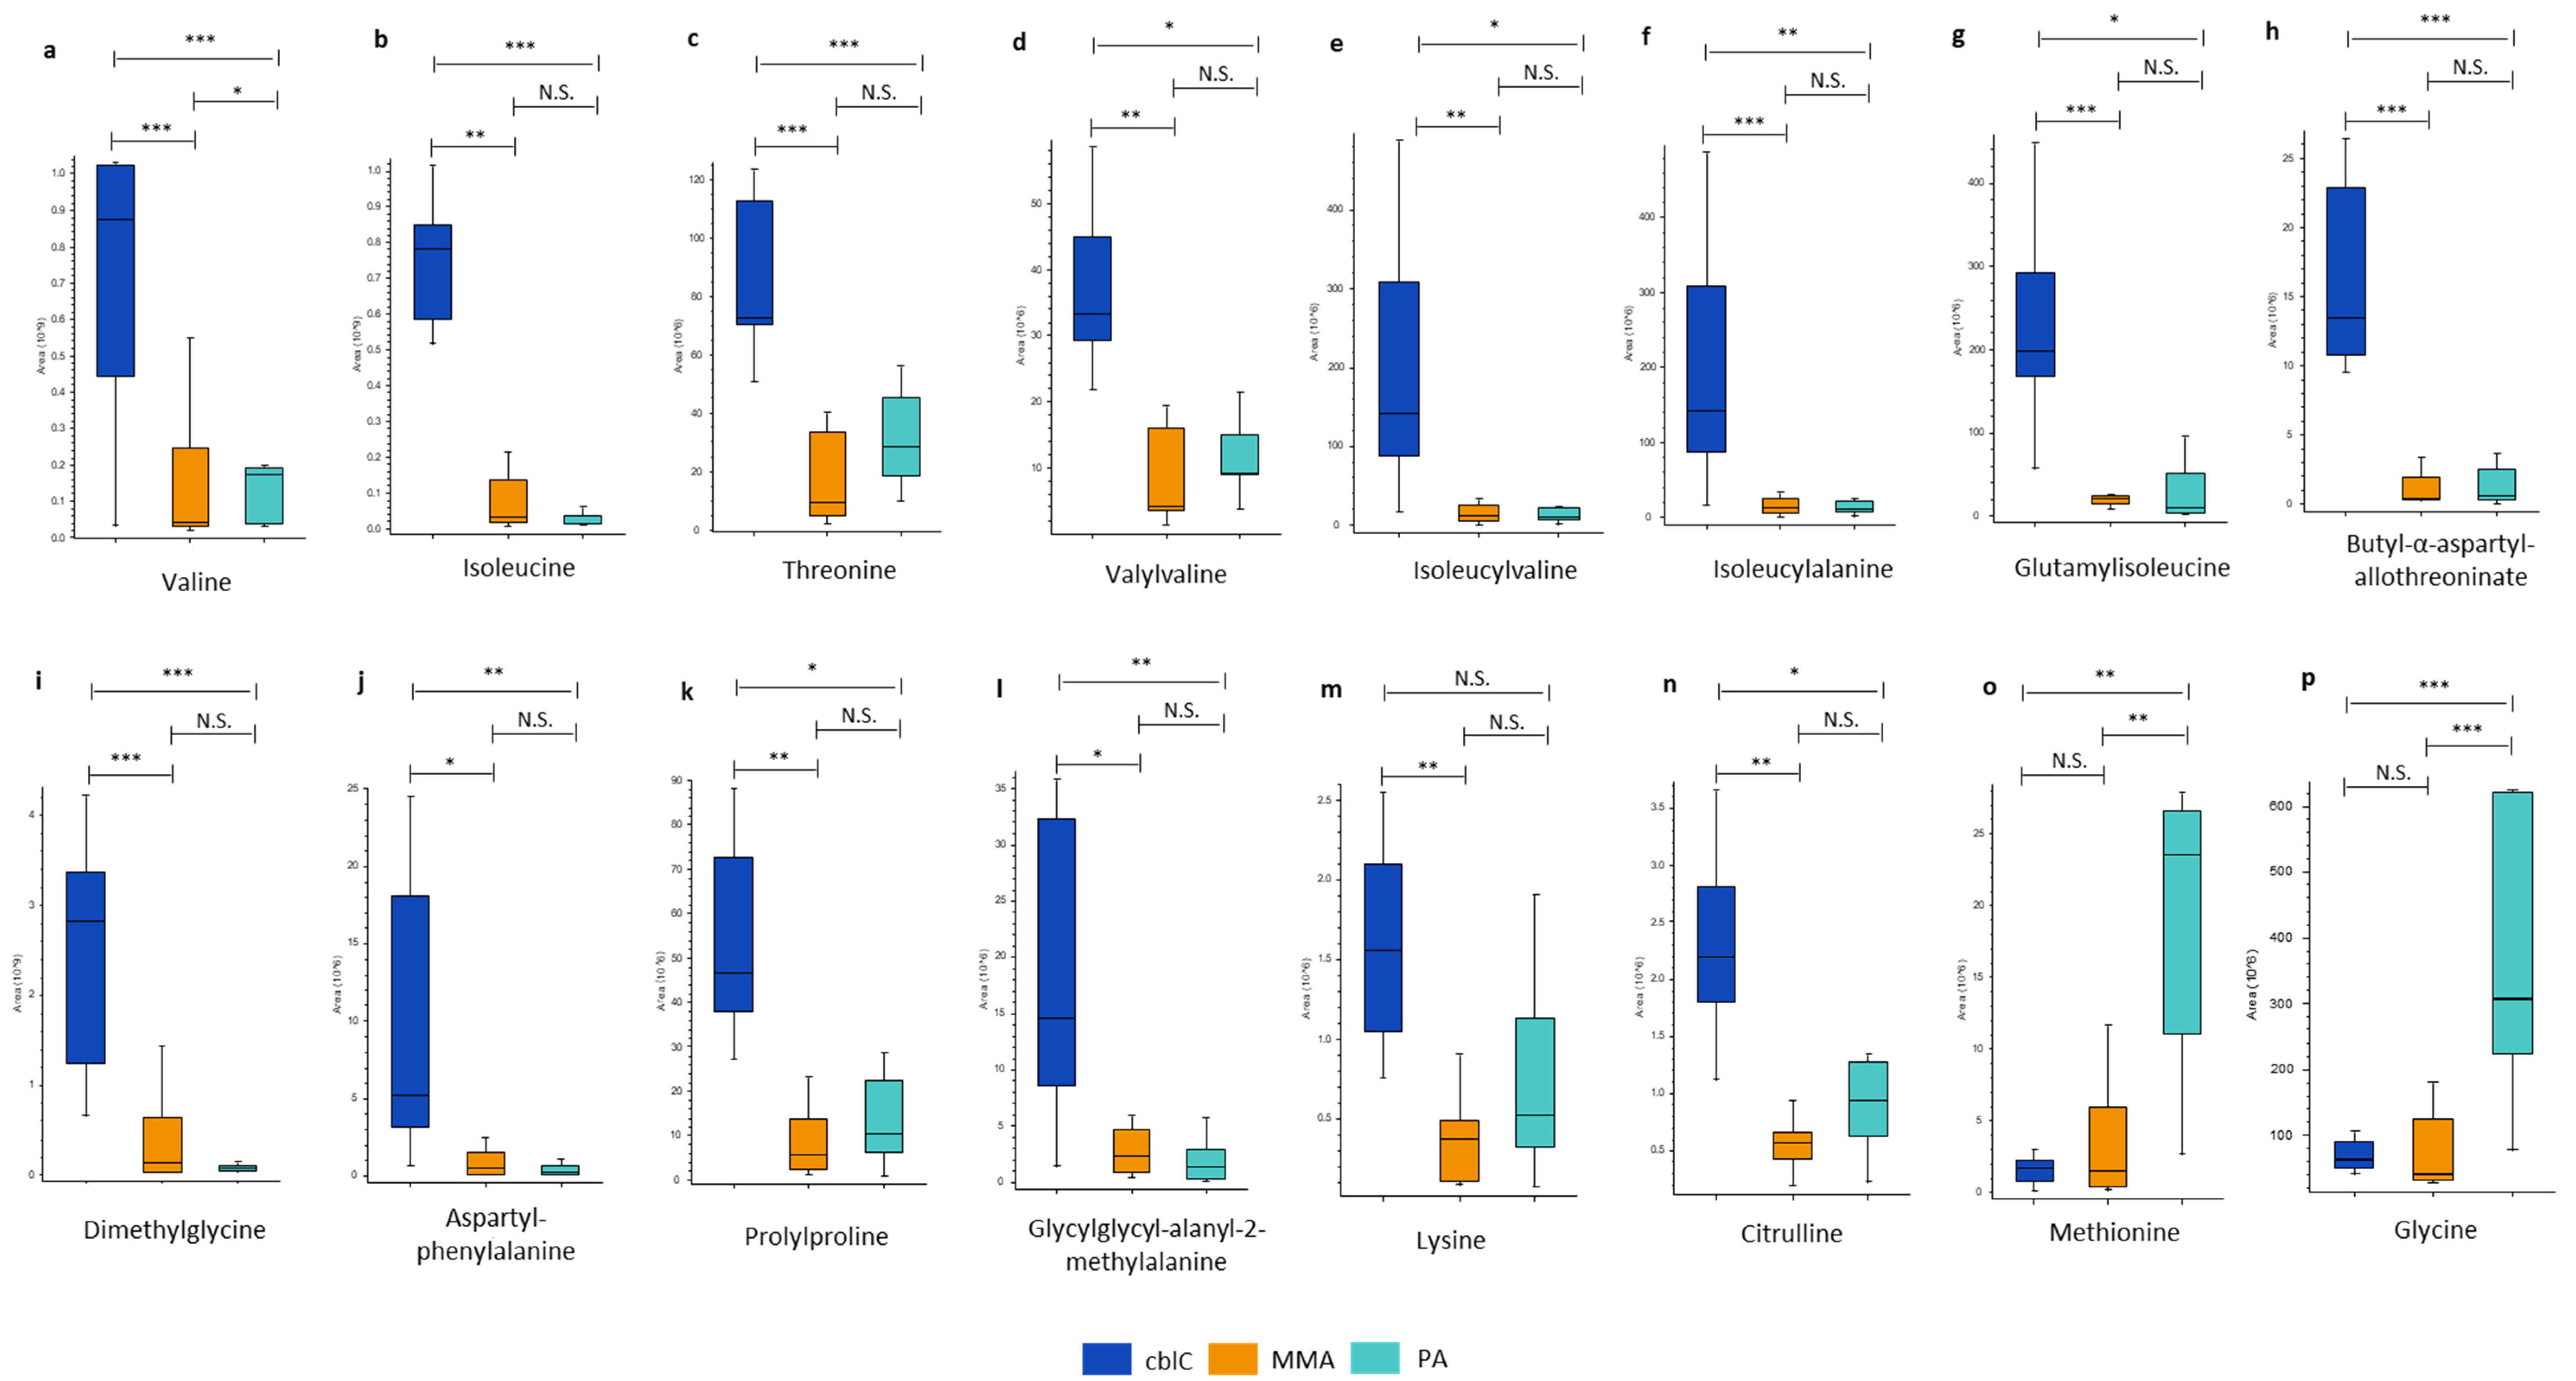
Figure 5.
Glycine and carnitine conjugates. * – p-value < 0.05; ** – p-value < 0.01; *** – p-value < 0.001; N.S. – non-significant.
Figure 5.
Glycine and carnitine conjugates. * – p-value < 0.05; ** – p-value < 0.01; *** – p-value < 0.001; N.S. – non-significant.
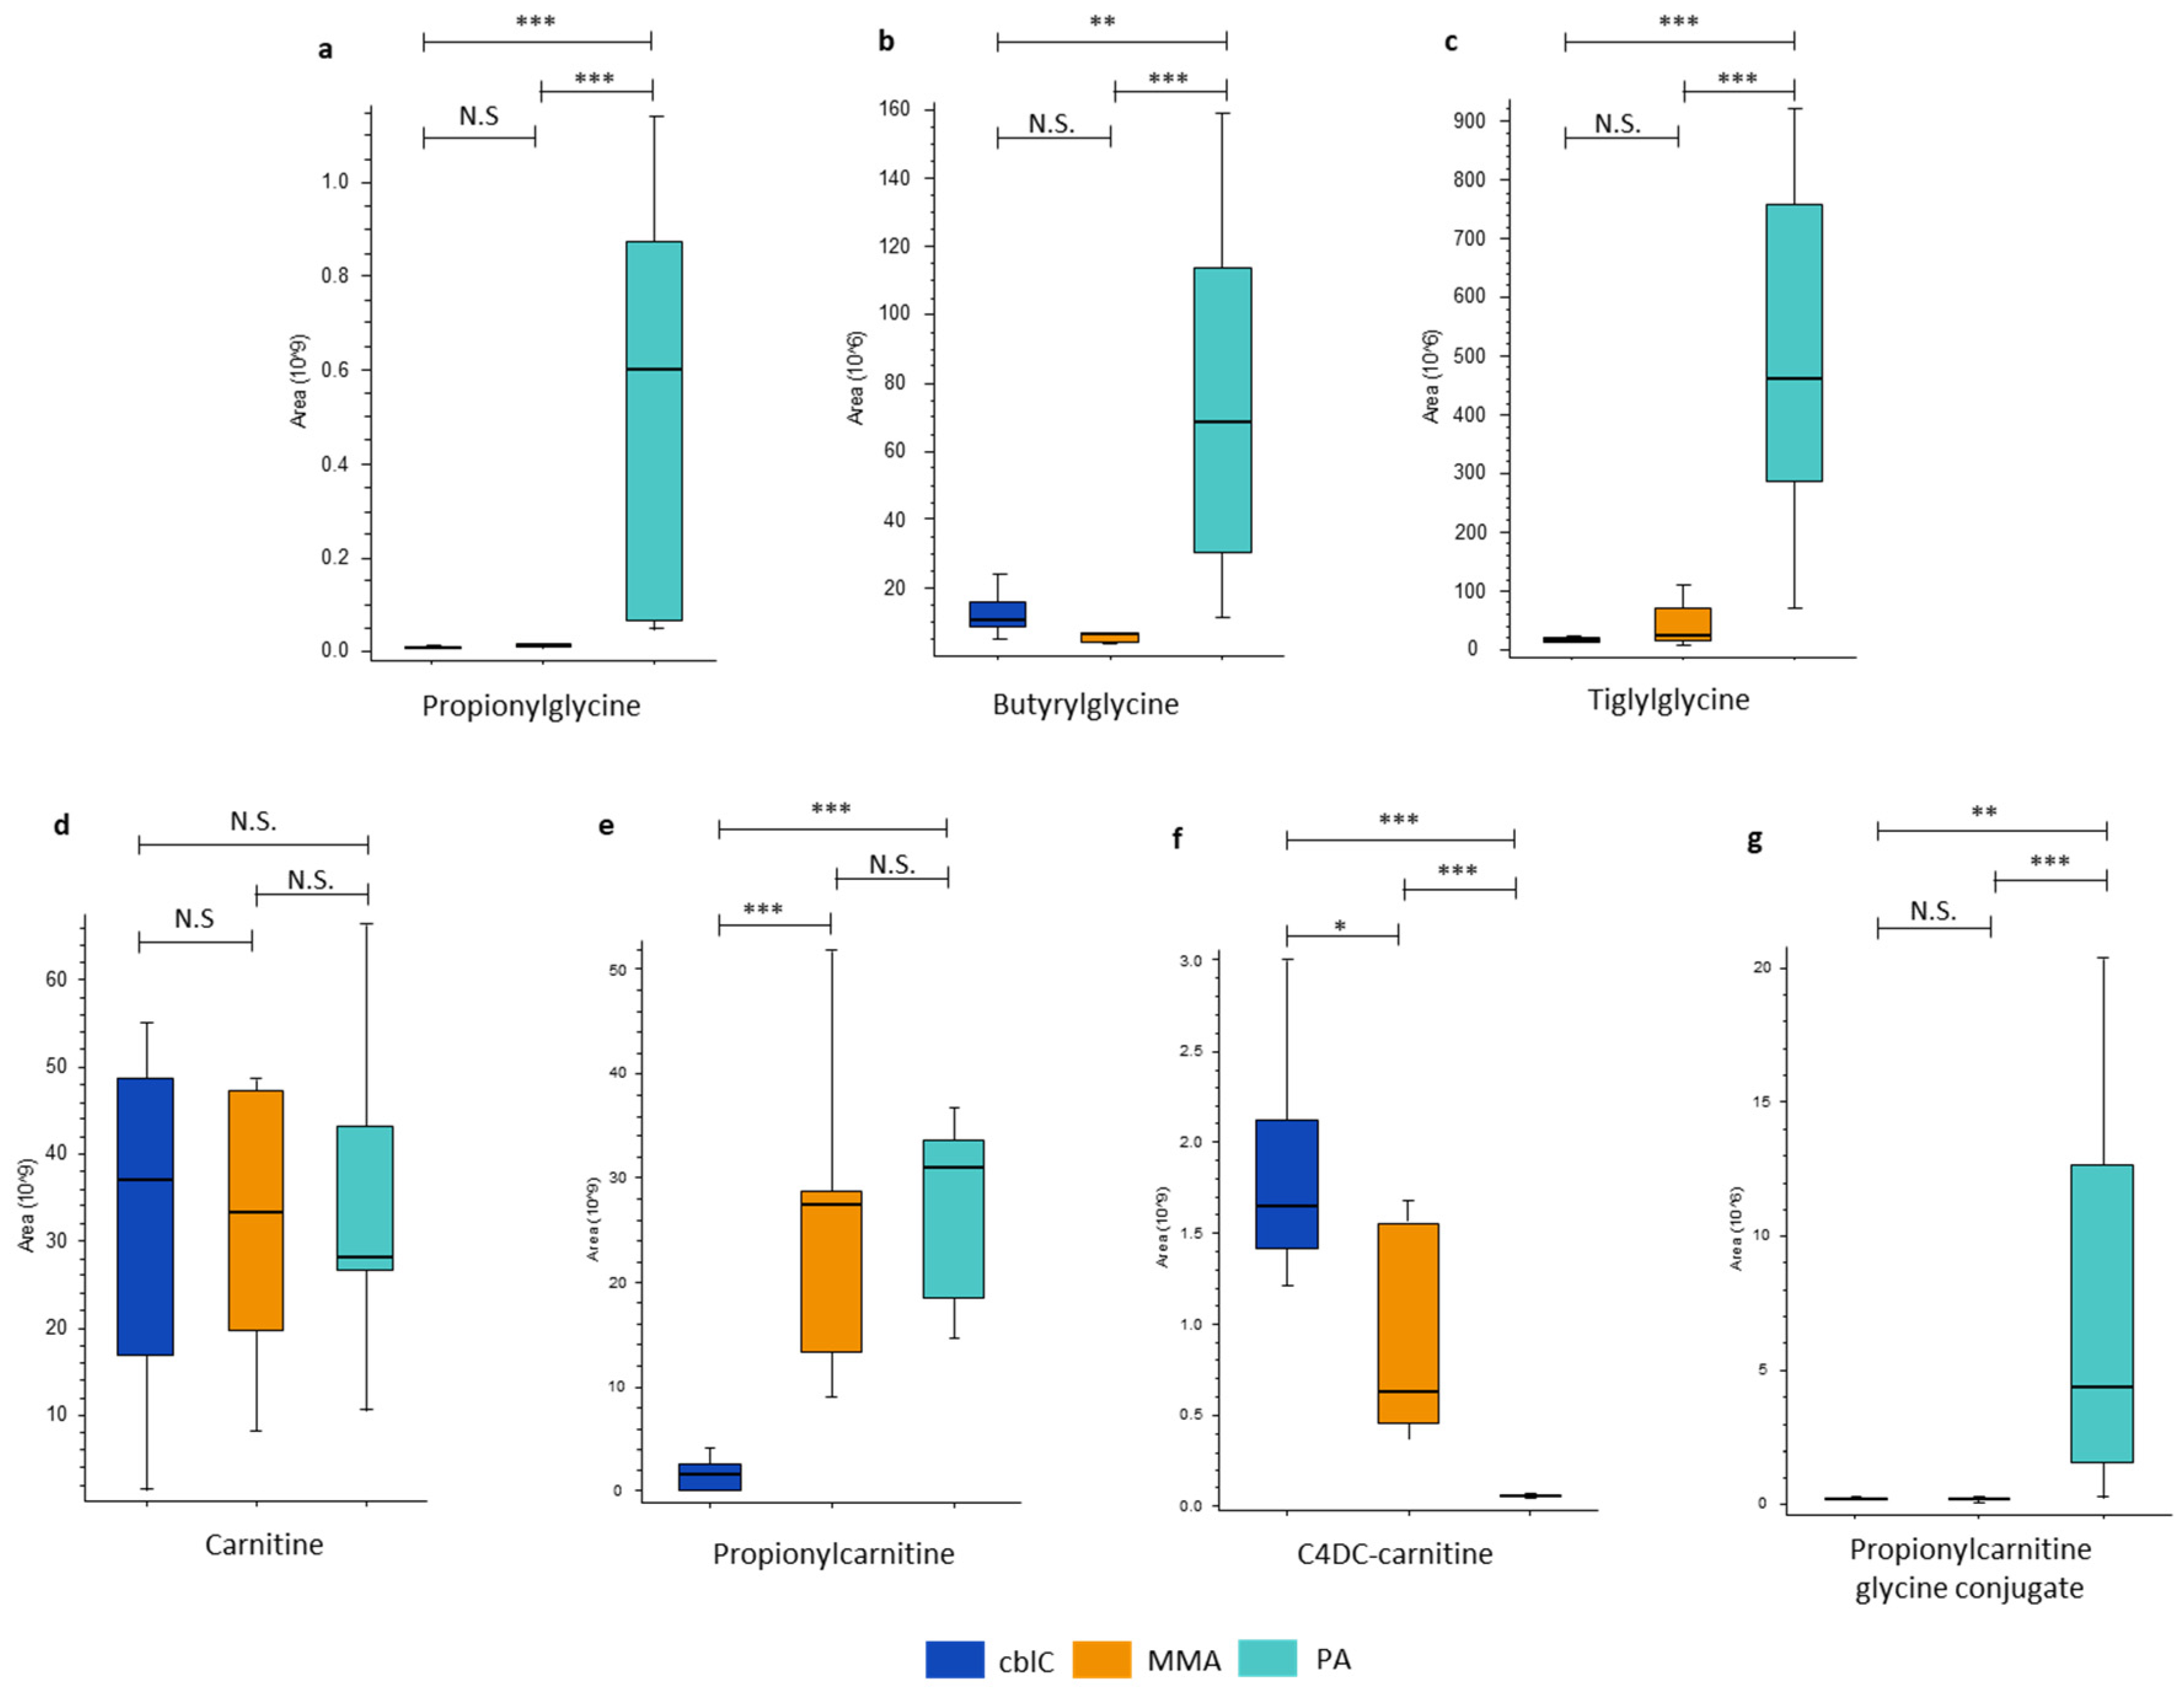
Figure 6.
Transsulfuration pathway metabolites increased in cblC. * – p-value < 0.05; ** – p-value < 0.01; *** – p-value < 0.001; N.S. – non-significant.
Figure 6.
Transsulfuration pathway metabolites increased in cblC. * – p-value < 0.05; ** – p-value < 0.01; *** – p-value < 0.001; N.S. – non-significant.
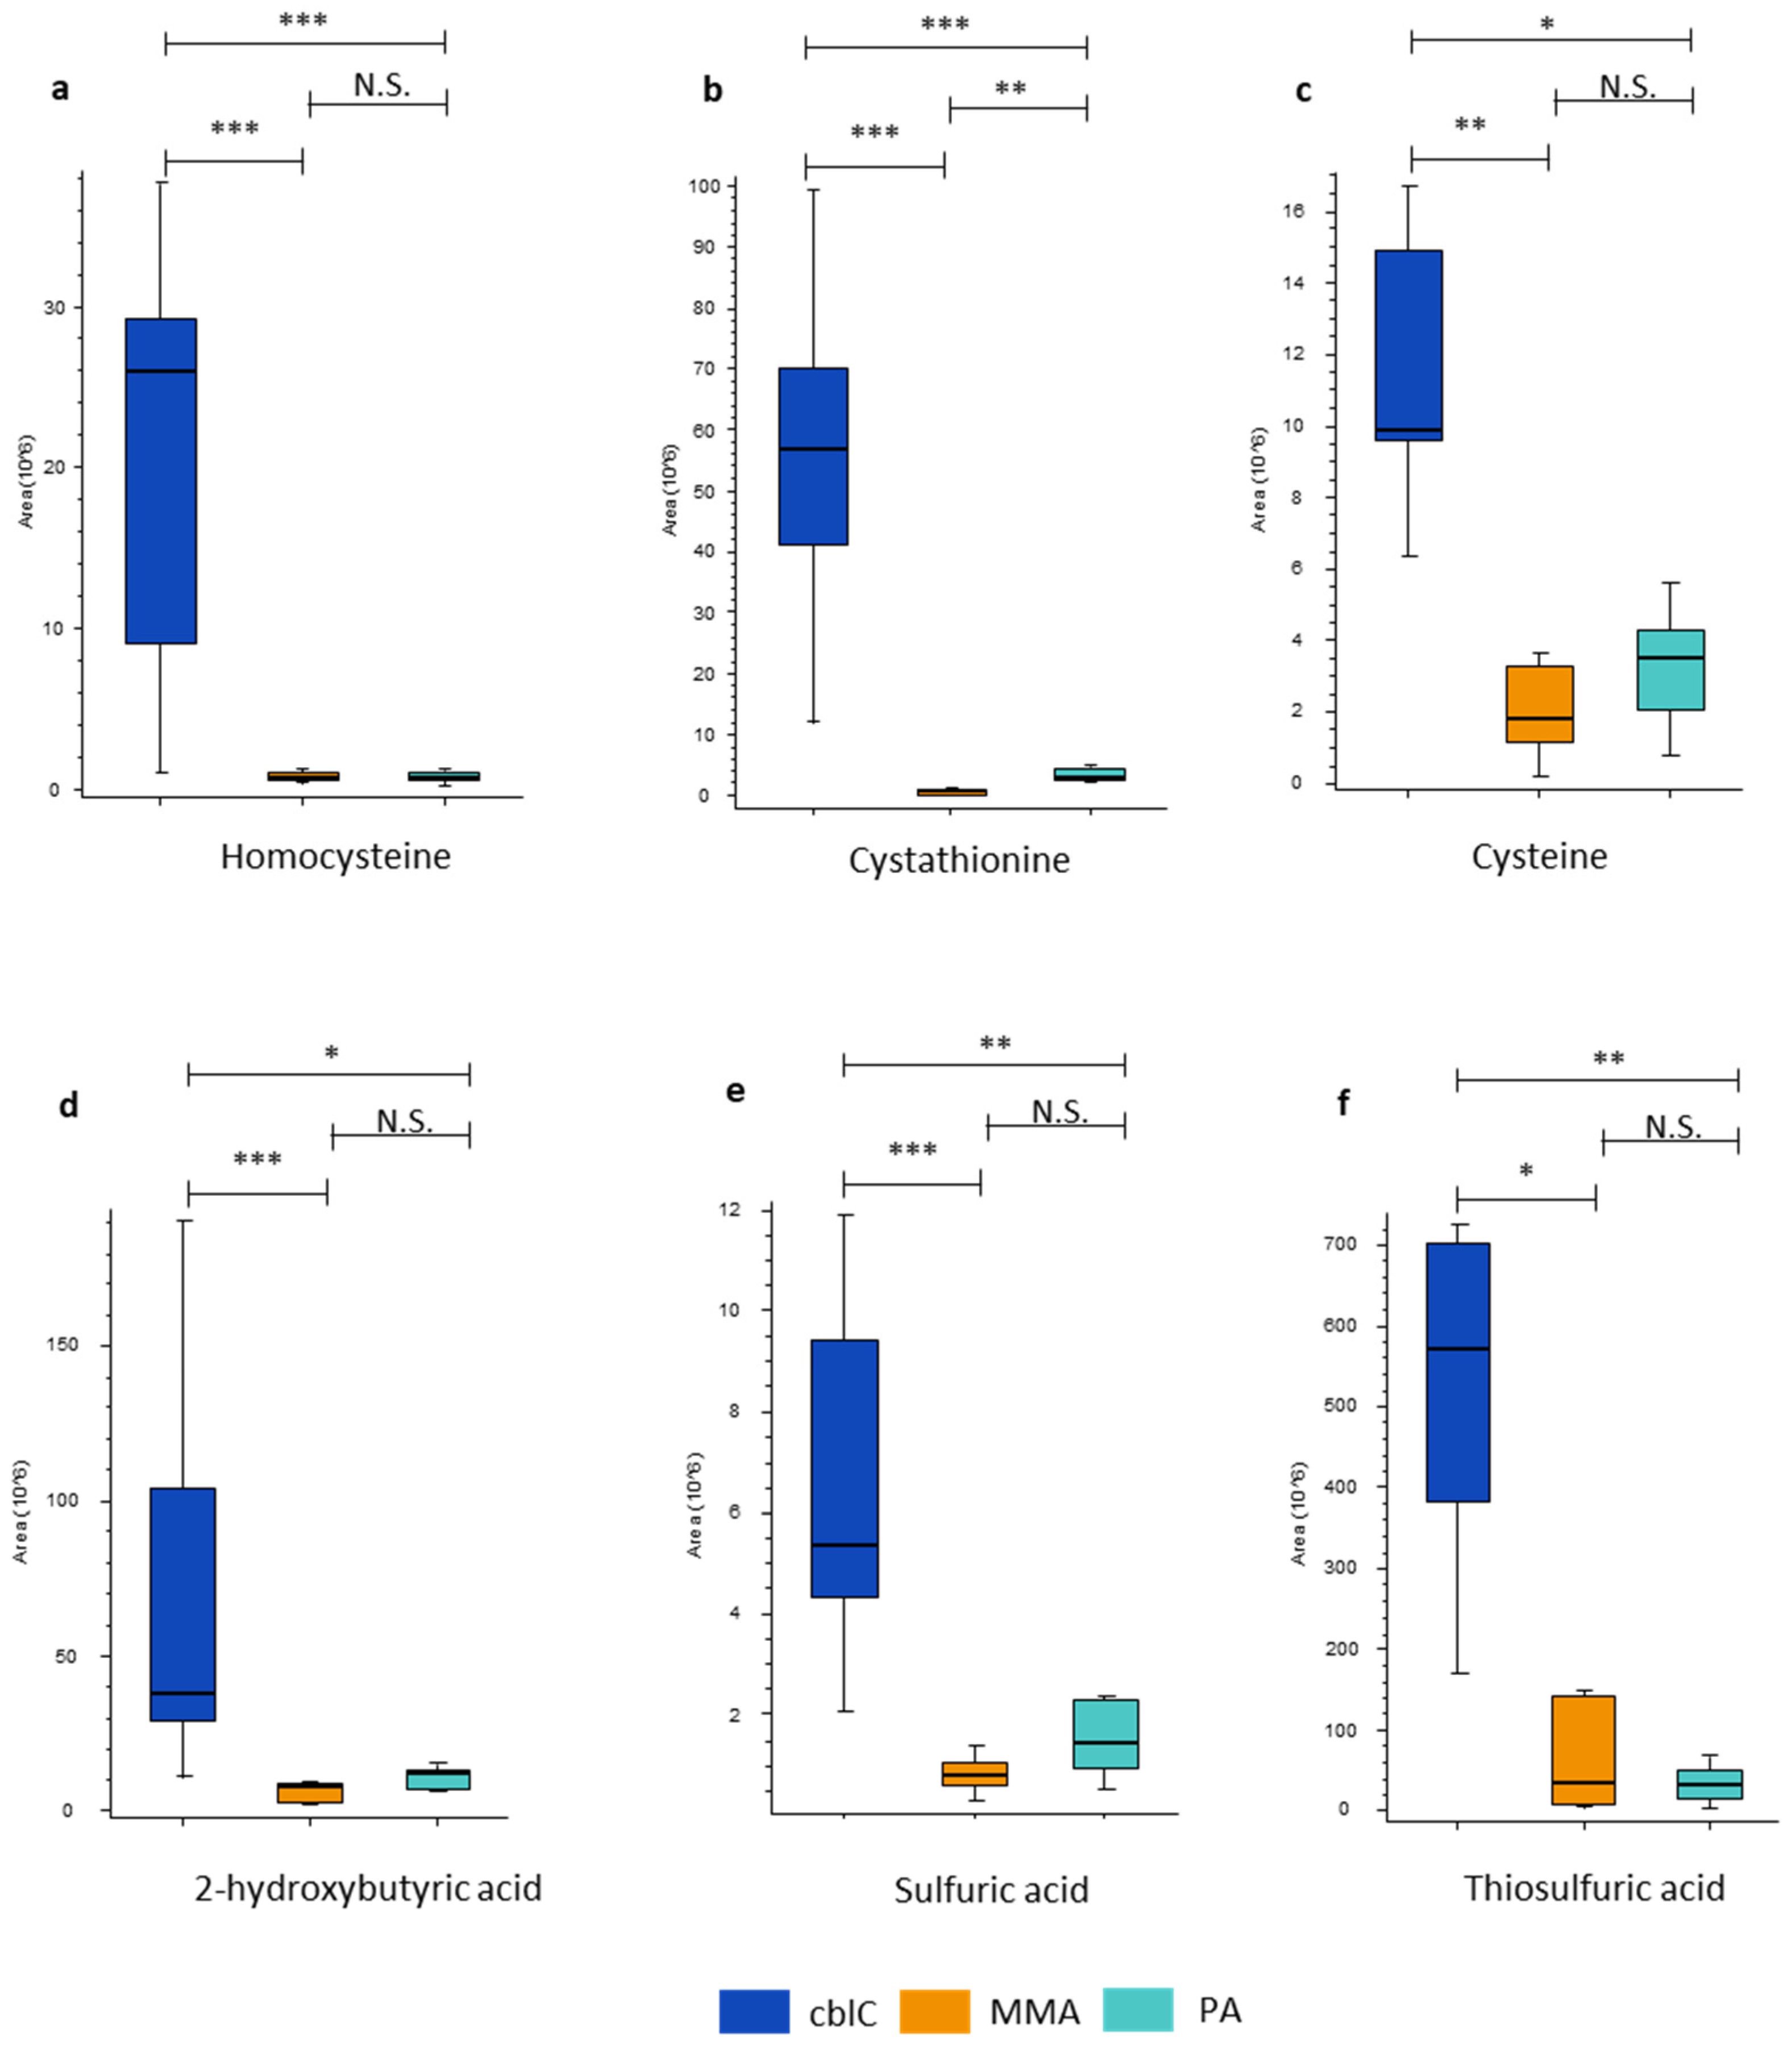
Figure 7.
Oxidative stress biomarkers characteristic of cblC disease. * – p-value < 0.05; ** – p-value < 0.01; *** – p-value < 0.001; N.S. – non-significant.
Figure 7.
Oxidative stress biomarkers characteristic of cblC disease. * – p-value < 0.05; ** – p-value < 0.01; *** – p-value < 0.001; N.S. – non-significant.
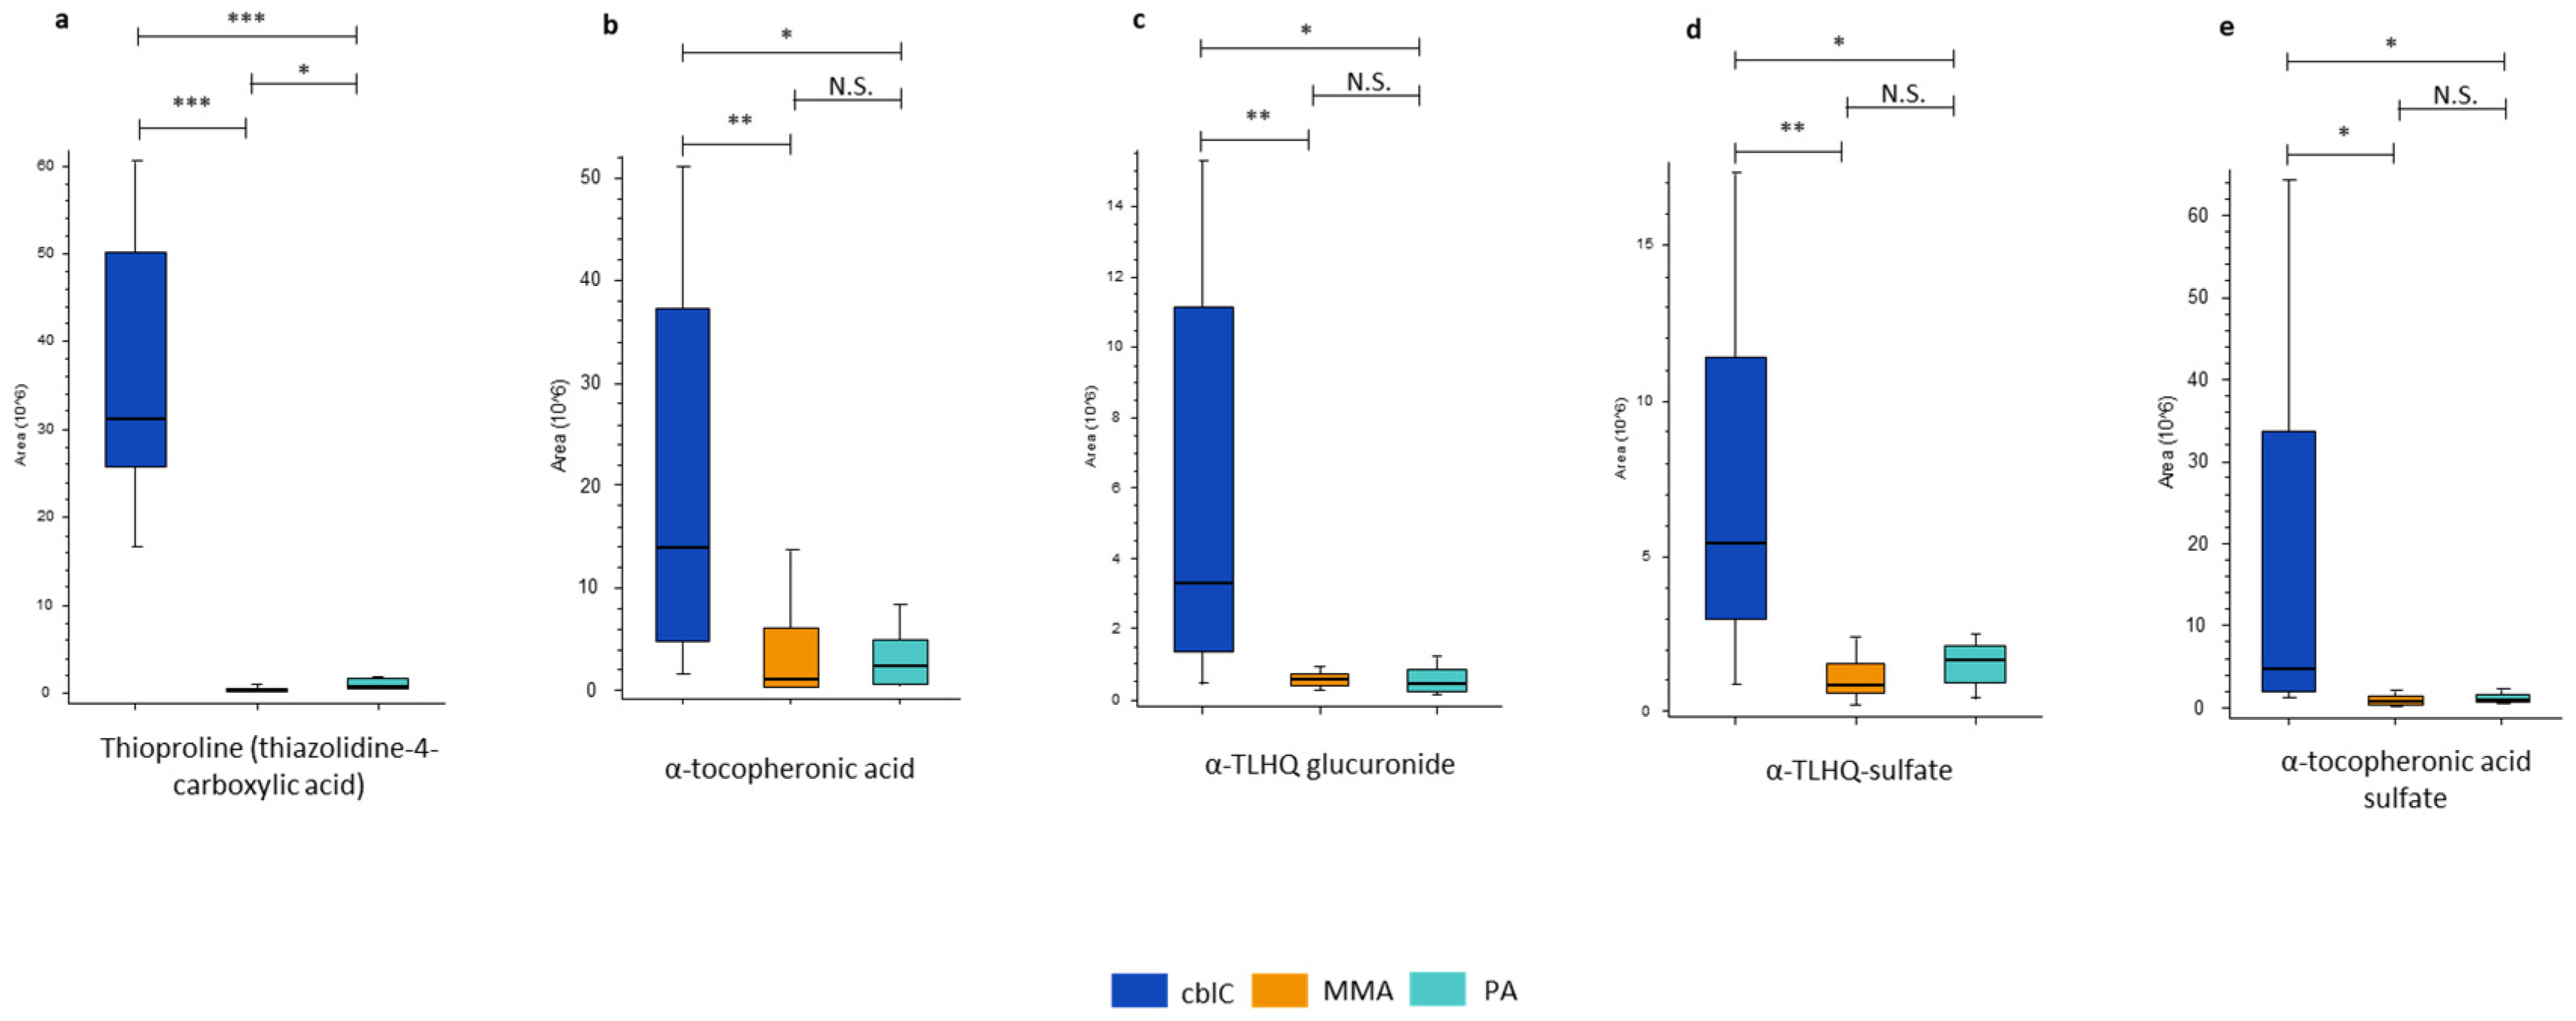
Figure 8.
The levels of steroid class hormones with putative annotations significantly increased in cblC. * – p-value < 0.05; ** – p-value < 0.01; *** – p-value < 0.001; N.S. – non-significant.
Figure 8.
The levels of steroid class hormones with putative annotations significantly increased in cblC. * – p-value < 0.05; ** – p-value < 0.01; *** – p-value < 0.001; N.S. – non-significant.
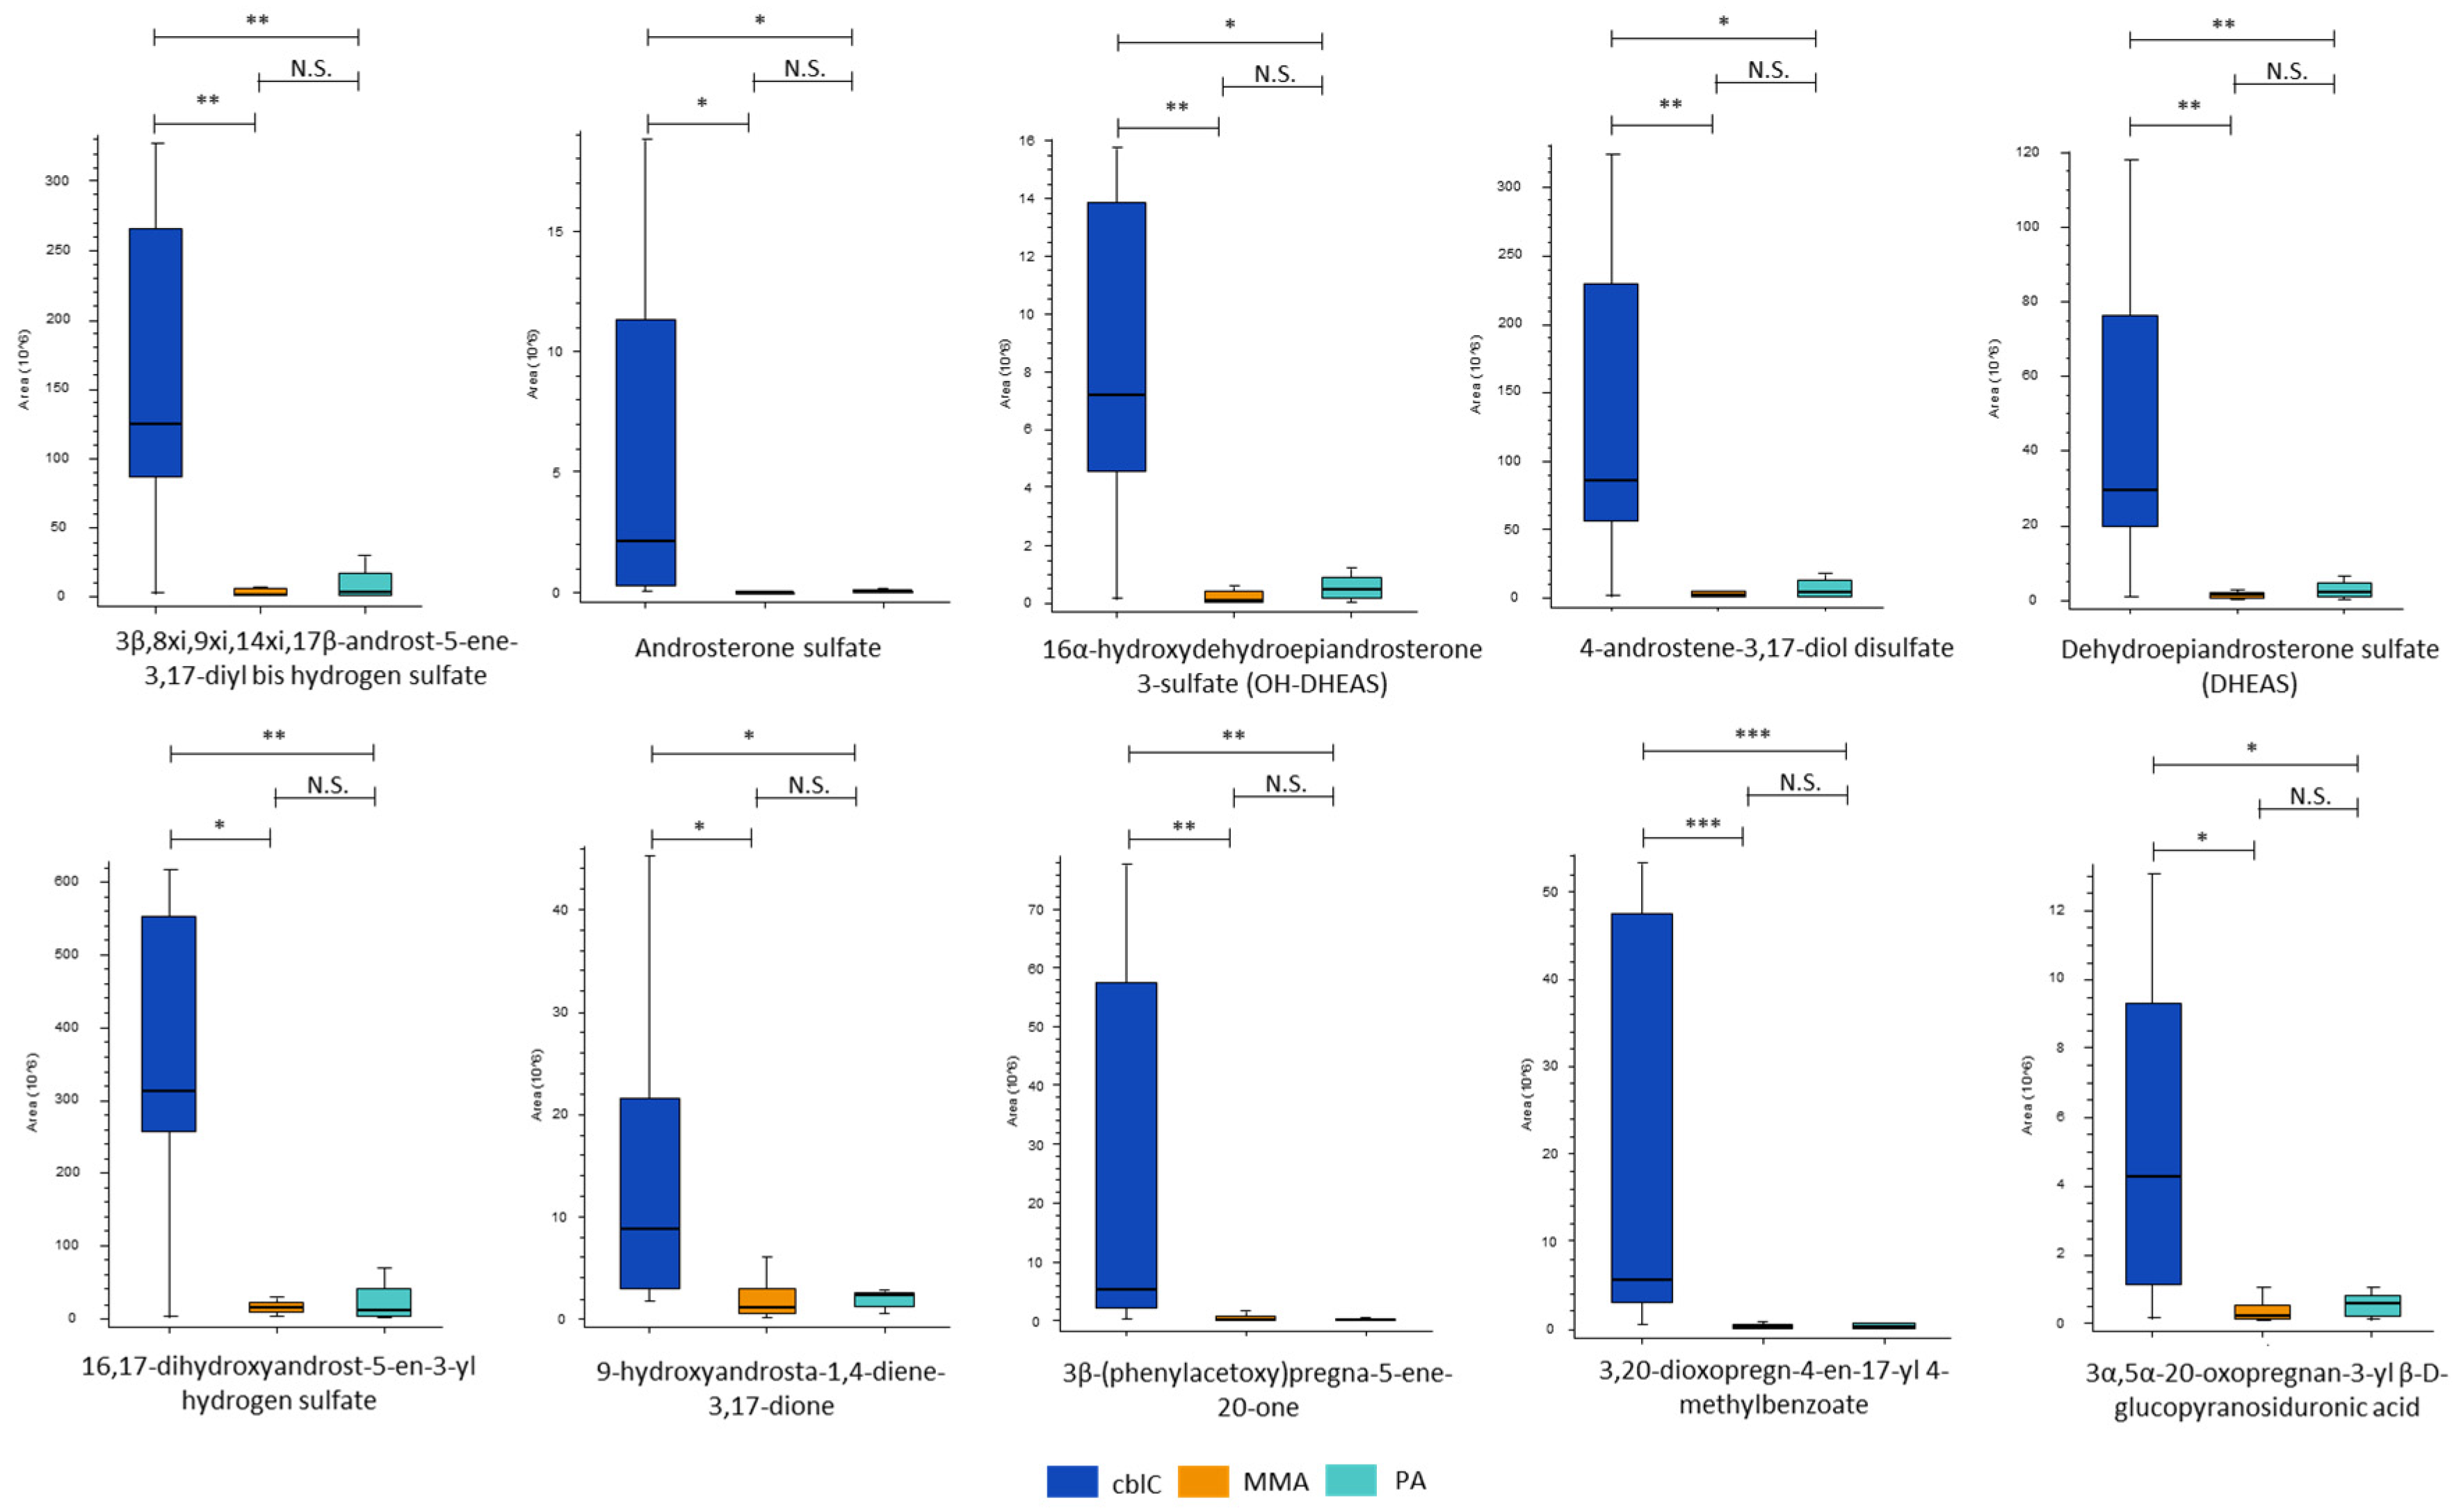
Figure 9.
The CxHyNO features significantly increased in PA. * – p-value < 0.05; ** – p-value < 0.01; *** – p-value < 0.001; N.S. – non-significant.
Figure 9.
The CxHyNO features significantly increased in PA. * – p-value < 0.05; ** – p-value < 0.01; *** – p-value < 0.001; N.S. – non-significant.
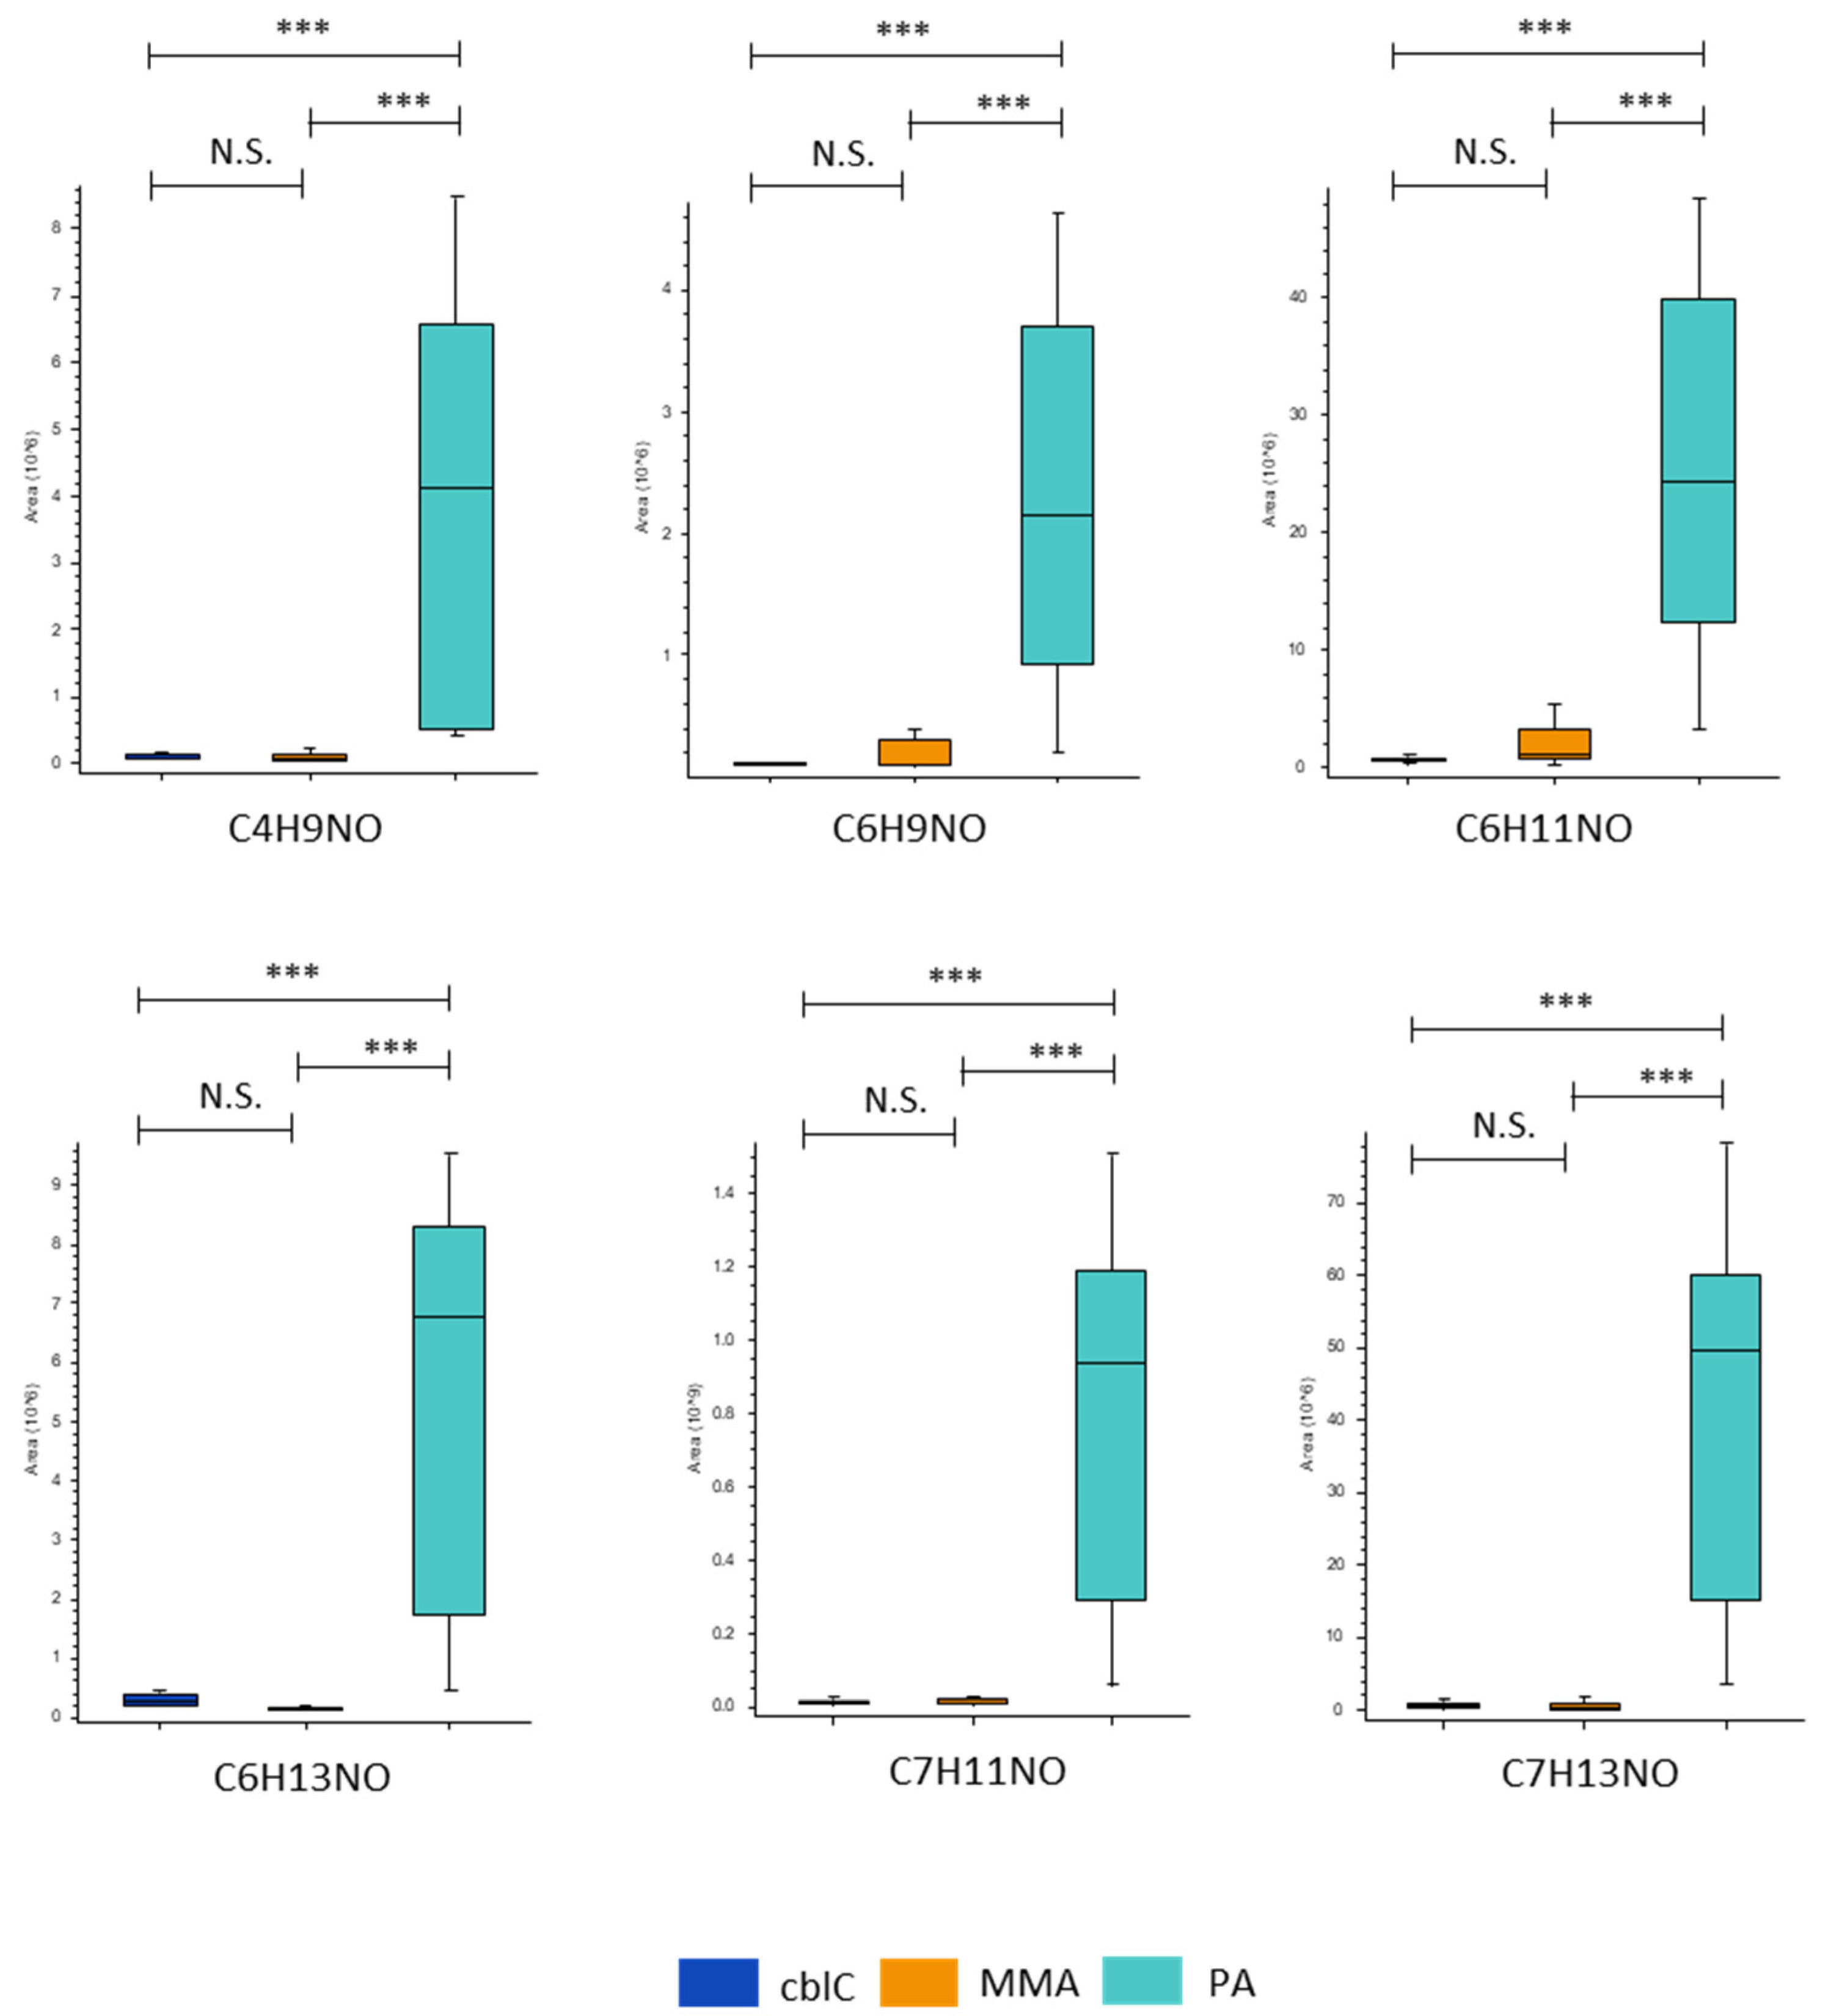
Figure 10.
(a) The heatmap based on the 25 most up-/down-regulated features in PA (p < 0.001); (b) the heatmap based on the 25 most up-/down-regulated features in MMA (p < 0.001); (c) the heatmap based on the 25 most up-/down-regulated features in cblC (p < 0.001).
Figure 10.
(a) The heatmap based on the 25 most up-/down-regulated features in PA (p < 0.001); (b) the heatmap based on the 25 most up-/down-regulated features in MMA (p < 0.001); (c) the heatmap based on the 25 most up-/down-regulated features in cblC (p < 0.001).
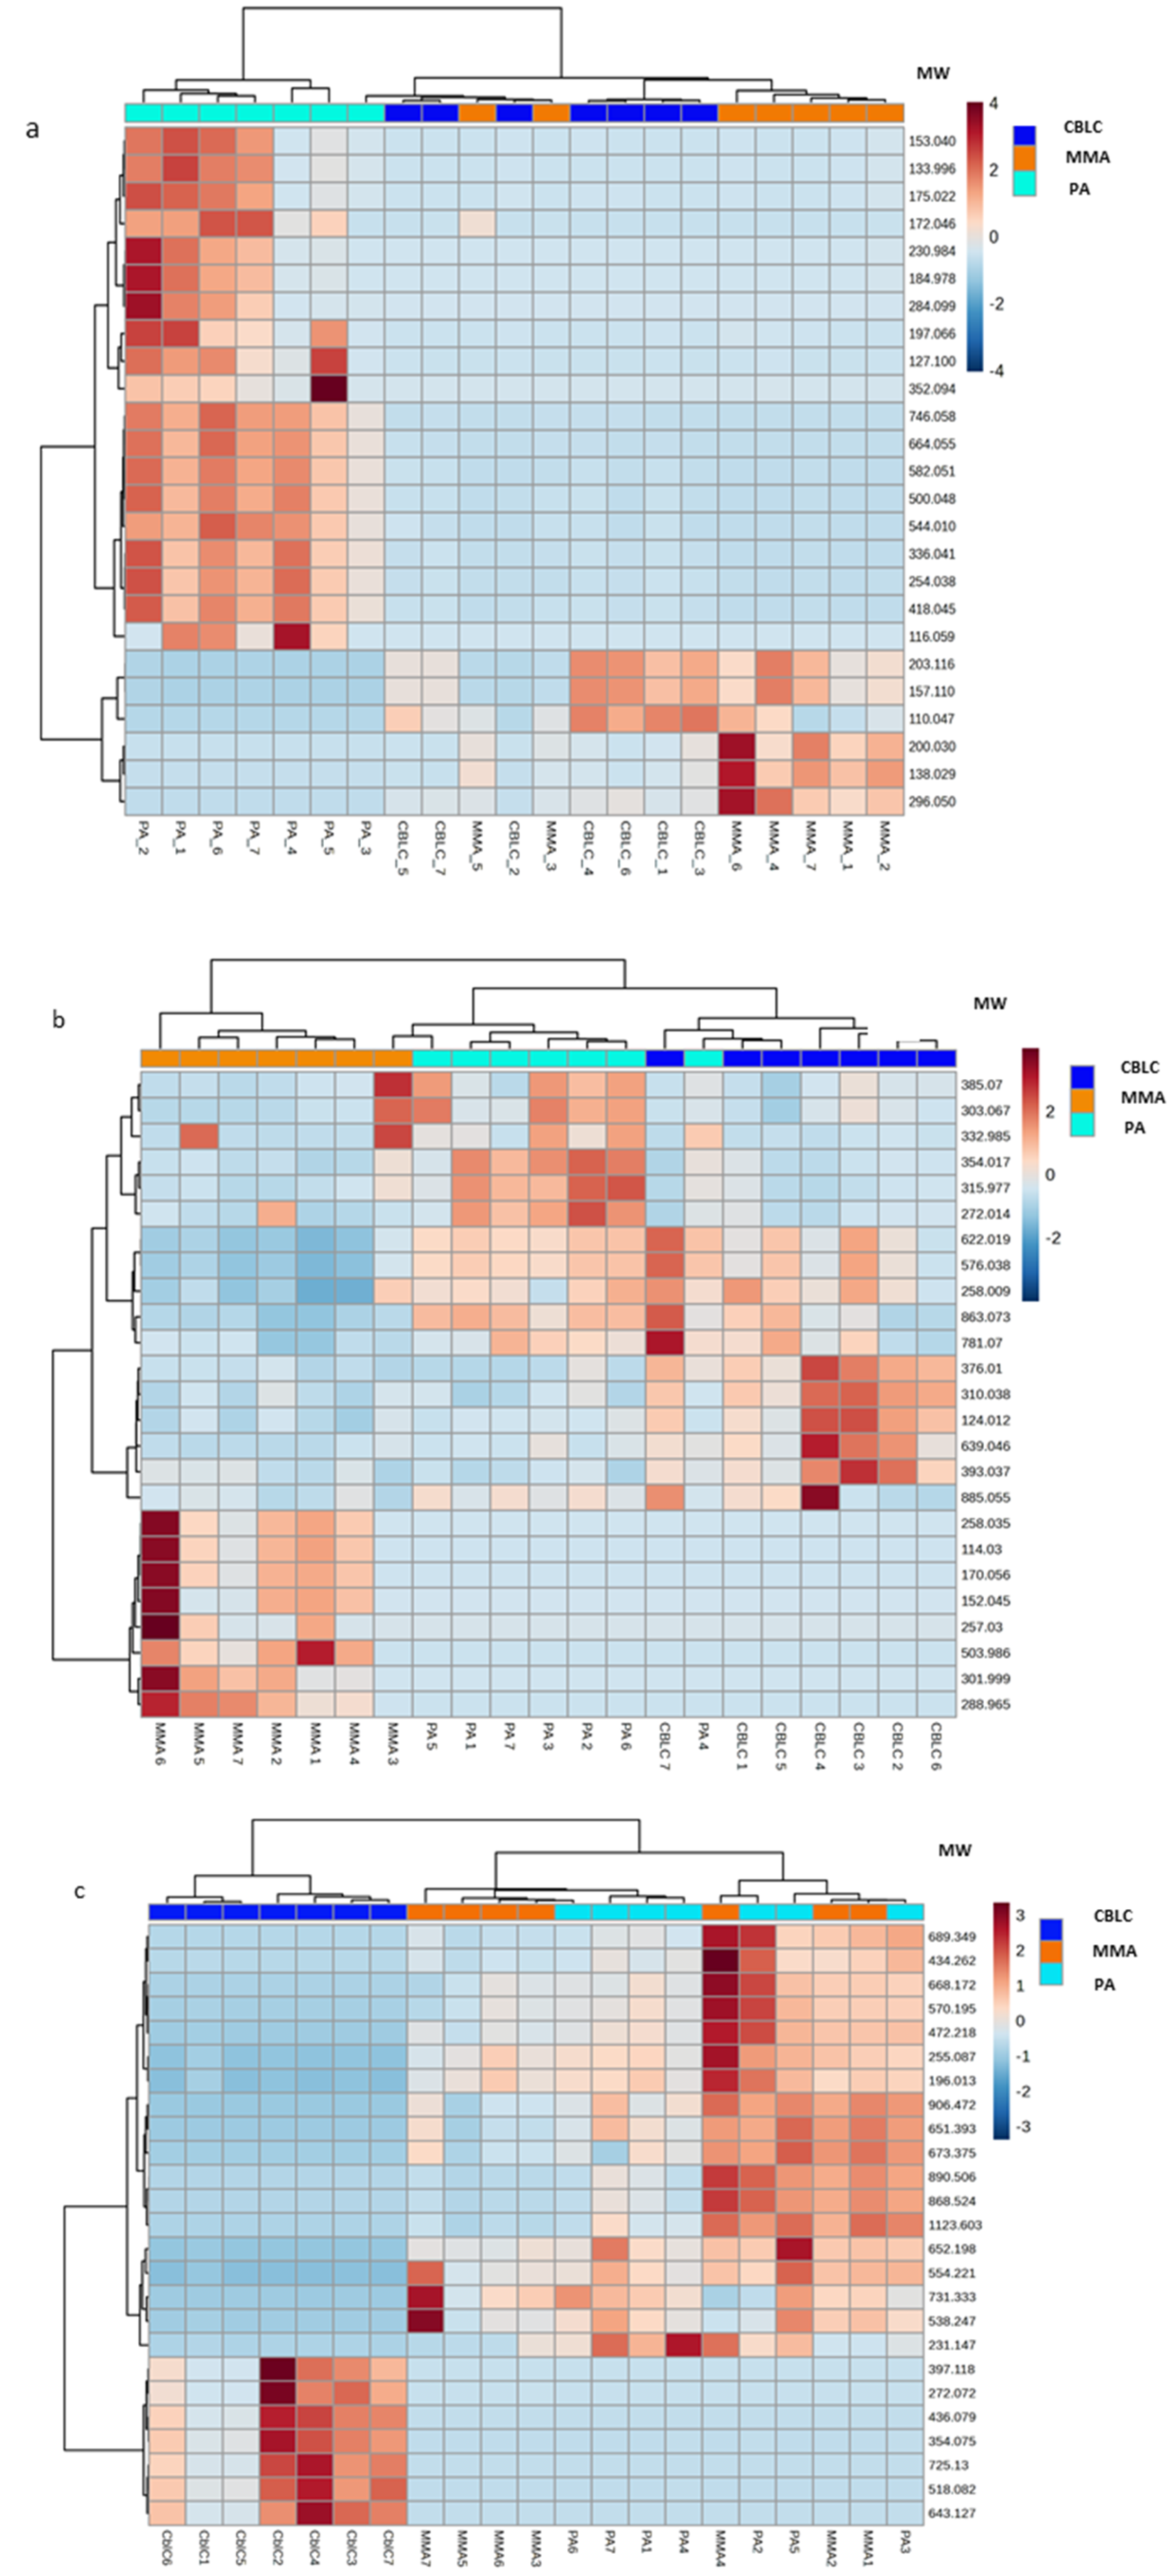
Figure 11.
The most relevant findings from relative comparison of metabolomic profiles in PA, MMA and cblC. ↑ (↓) – metabolites significantly increased (decreased) respect to other two acidemias. Dashed boxes – physiological processes involving significantly changed metabolites.
Figure 11.
The most relevant findings from relative comparison of metabolomic profiles in PA, MMA and cblC. ↑ (↓) – metabolites significantly increased (decreased) respect to other two acidemias. Dashed boxes – physiological processes involving significantly changed metabolites.
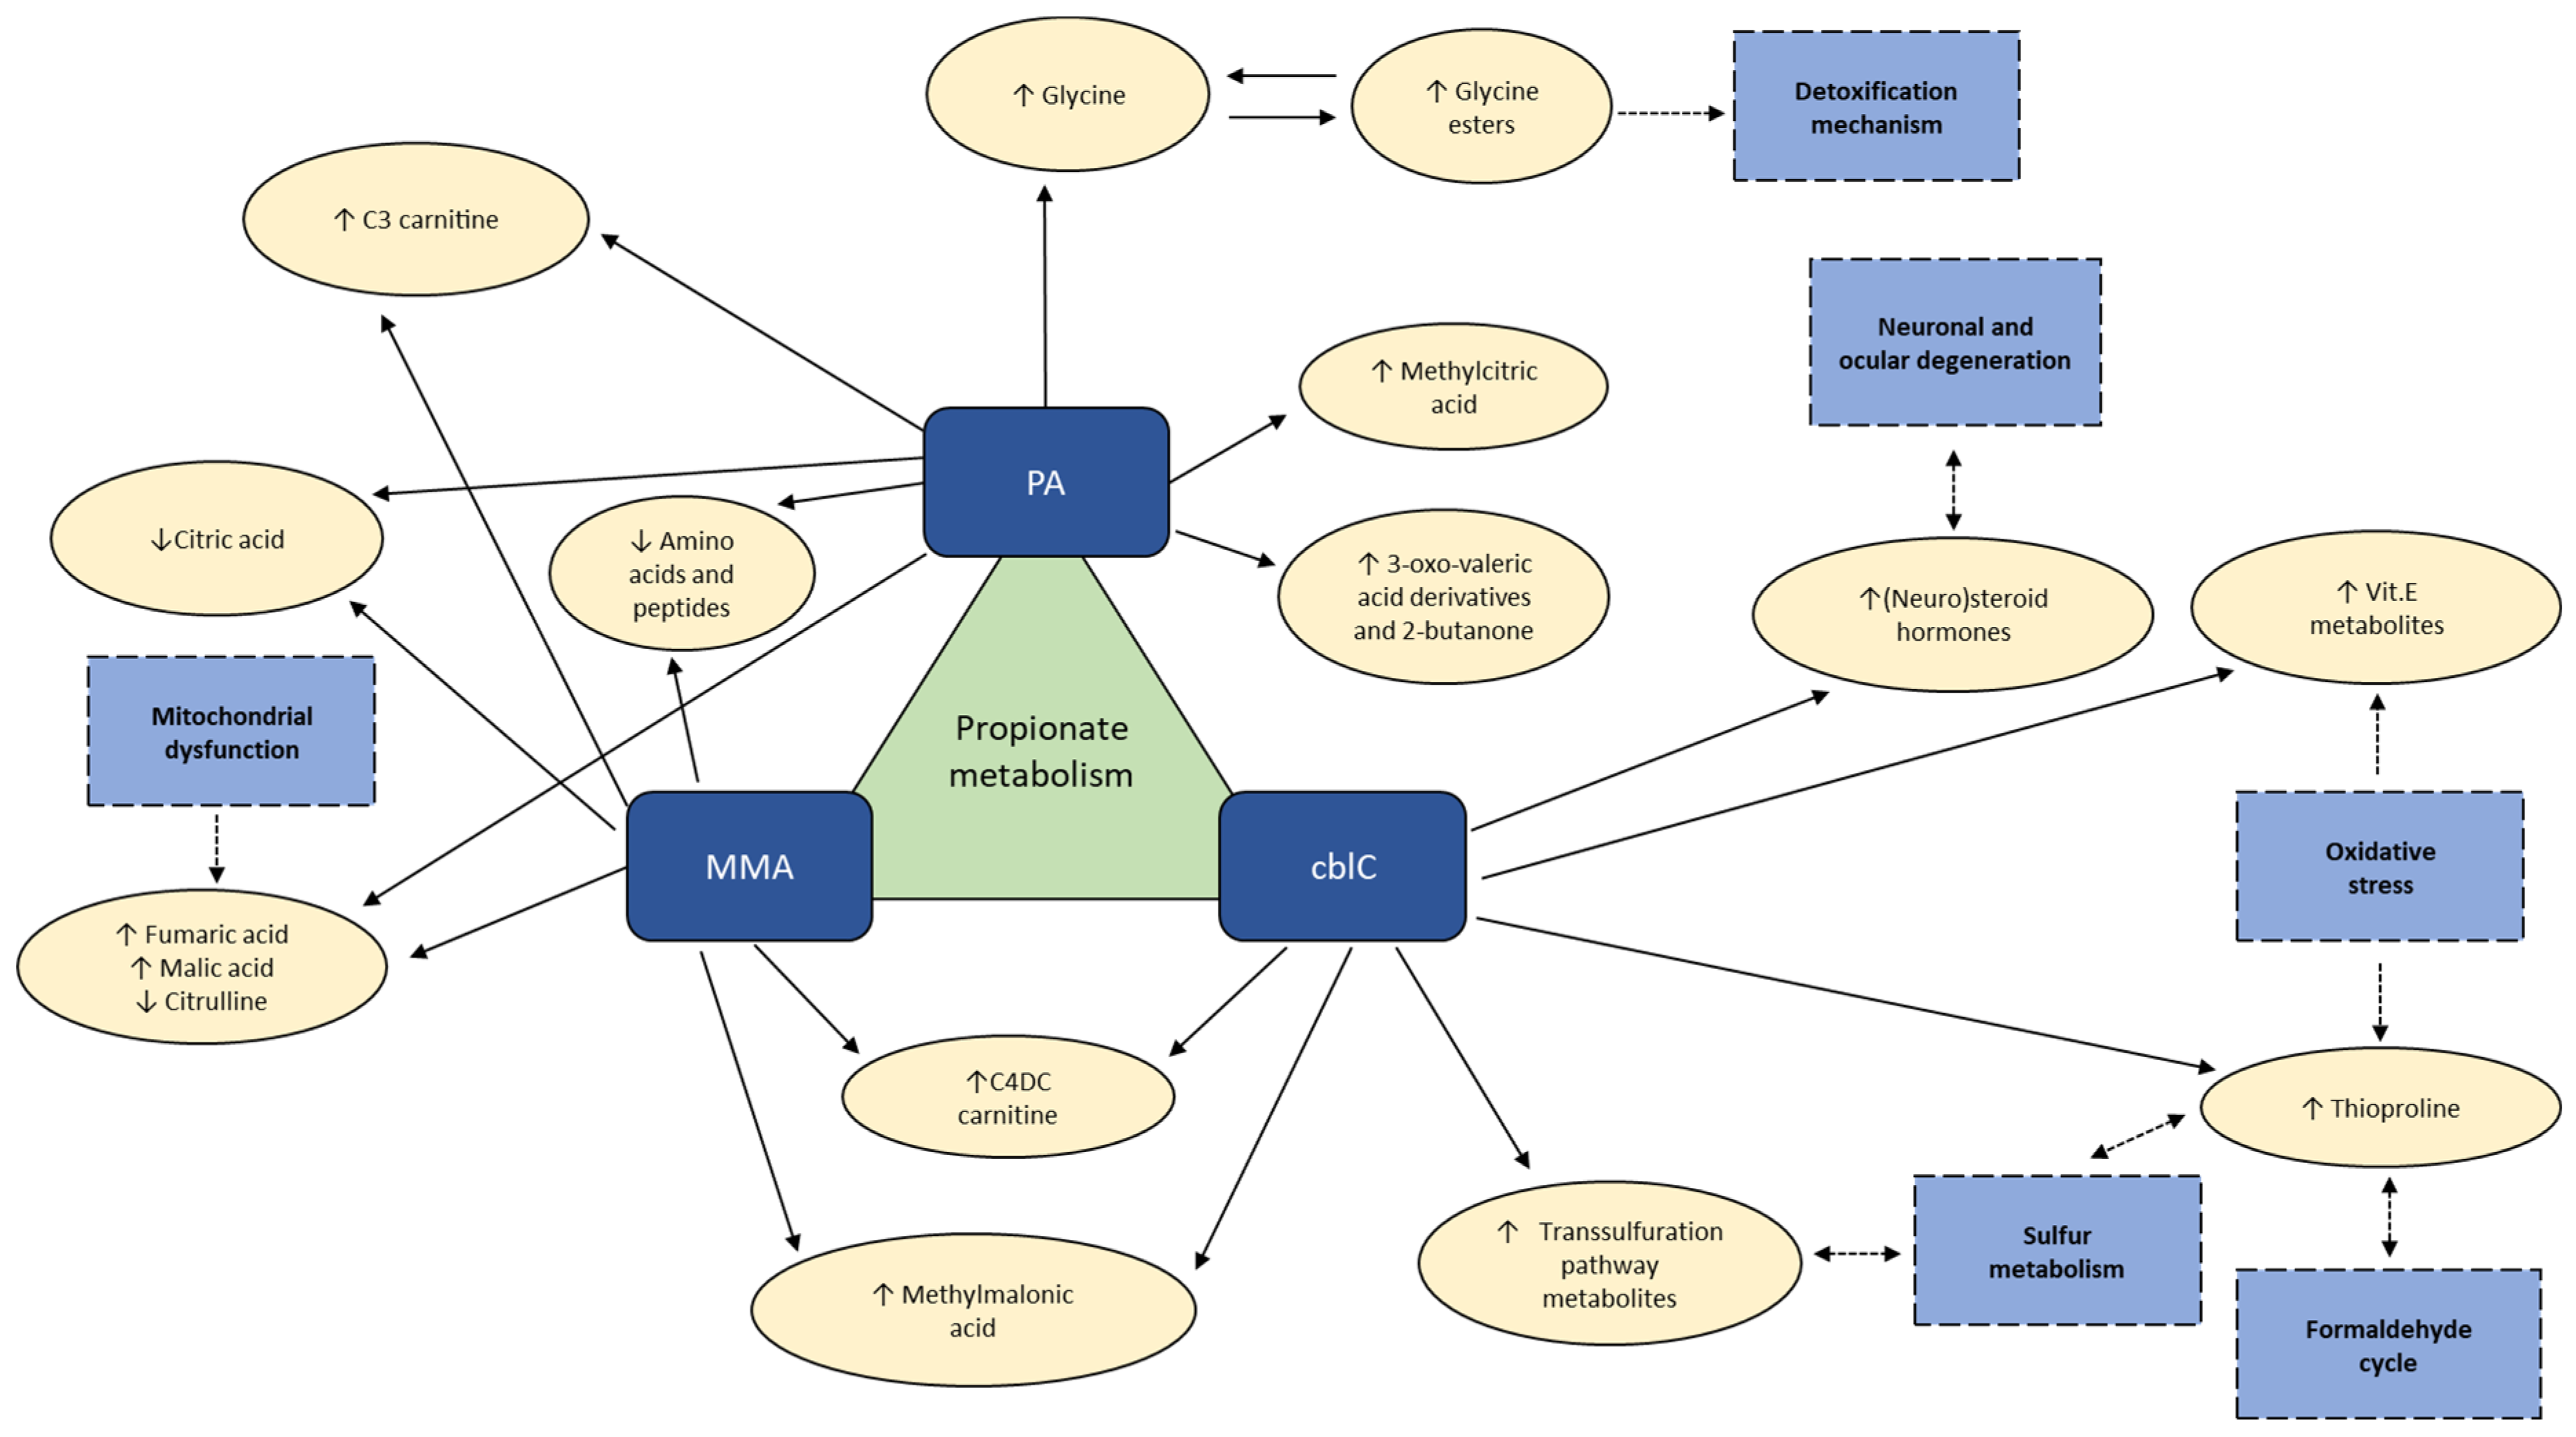

Table 1.
Clinical data and symptomatic of the patients.
| Patient | Onset | Cardiac involvement |
Pancreatitis | Renal disease | Visual dysfunction | Epilepsy | Abnormal MRI |
Developmental delay/ intellectual disablity |
Deafness | Age at urine sampling (years) |
|---|---|---|---|---|---|---|---|---|---|---|
| PA 1 | Neonatal | - | - | - | - | - | + | + | + | 2.1 |
| PA 2 | 7 months | + | - | - | - | - | + | + | - | 9.9 |
| PA 3 | 3 months | + | - | - | - | - | - | - | - | 20.4 |
| PA 4 | Neonatal | + | - | - | - | - | - | +/- | + | 15.2 |
| PA 5 | Neonatal (NBS symptomatic) | - | - | - | - | - | - | +/- | - | 0.4 |
| PA 6 | Neonatal (NBS symptomatic) | - | - | - | - | - | + | + | - | 0.8 |
| PA 7 | Neonatal | + | - | - | - | - | - | - | - | 7.0 |
| MMA 1 | Neonatal | - | - | ++ | - | - | +/- | - | - | 0.6 |
| MMA 2 | Neonatal | - | + | +/- | - | - | +/- | + | + | 1.2 |
| MMA 3 | Neonatal | - | - | - | - | - | ++ | + | NA | 10.6 |
| MMA 4 | 17 months | - | - | ++ | + | - | - | - | - | 20.6 |
| MMA 5 | NBS (asymptomatic) | - | - | - | - | - | - | - | - | 0.3 |
| MMA 6 | Neonatal (NBS symptomatic) | - | - | - | - | - | - | - | NA | 3.7 |
| MMA 7 | 6 months | - | + | ++ | + | - | ++ | - | - | 22.2 |
| cblC 1 | Neonatal (NBS symptomatic) | + | - | - | + | - | - | +/- | - | 0.4 |
| cblC 2 | Neonatal | - | - | + | + | + | + | + | - | 3.7 |
| cblC 3 | 2 months | + | - | + | + | + | ++ | ++ | - | 2.8 |
| cblC 4 | Neonatal | - | - | - | + | + | + | + | - | 3.3 |
| cblC 5 | 5 months | - | - | - | + | ++ | + | ++ | - | 13.7 |
| cblC 6 | Neonatal | - | - | -/+ | + | - | + | +/- | - | 13.2 |
| cblC 7 | 3 months | ++ | - | + | - | + | +/- | +/- | - | 17.1 |
++ severe; + present; +/- mild; - absent; NA – non avaliable; *long-term follow-up, urine samples for metabolomics analysis were collected before transplantation.
Table 2.
Significantly different metabolites in cblC, MMA and PA and their relative fold-change values.
Table 2.
Significantly different metabolites in cblC, MMA and PA and their relative fold-change values.
| Metabolite | cblC/MMA | cblC/PA | PA/MMA | KEGG Pathway |
|---|---|---|---|---|
| Organic acids and ketones | ||||
| Citric and isocitric acids | 3.3** | 2.5** | ns | • Tricarboxylic acid cycle (TCA) • Glyoxylate and dicarboxylate metabolsim • Alanine, aspartate and glutamate metabolism |
| 2-butanone | 0.5* | 0.13*** | 3.9*** | |
| Fumaric acid | 0.3* | 0.2*** | ns | • TCA • Arginine biosynthesis • Pyruvate metabolism • Alanine, aspartate and glutamate metabolism |
| Malic acid | 0.2* | 0.08*** | ns | • TCA • Glyoxylate and dicarboxylate metabolism • Pyruvate metabolism |
| Methylmalonic acid | 0.06*** | 19*** | 0.003*** | • Valine, leucine and isoleucine degradation • Propanoate metabolism • Pyrimidine metabolism |
| MW 74.036 (propionic acid isobar) | 0.05*** | 12*** | 0.004*** | |
| 2-methylcitric acid | ns | 0.2*** | 4.3*** | • Propanoate metabolism |
| 2-methyl-3-hydroxy-valeric acid | ns | 0.3*** | 5.4*** | |
| 3-oxo-valeric acid | ns | 0.21*** | 3.4*** | |
| 2-methyl-3-oxo-valeric acid | ns | 0.09** | 8.3** | |
| 3-pentanone | ns | 0.06*** | 10*** | |
| Glycine and carnitine conjugates | ||||
| C4DC-carnitine | 2.1* | 348*** | 0.006*** | |
| Propionylcarnitine | 0.06*** | 0.05*** | ns | |
| Propionylglycine | ns | 0.01*** | 60*** | |
| Propionylcarinitine glycine conjugate | ns | 0.05** | 23*** | |
| Tiglylglycine | ns | 0.07*** | 21*** | |
| Butyrylglycine | ns | 0.2** | 11*** | |
| Amino acids and peptides | ||||
| Threonine | 83*** | 36*** | ns | • Glycine, serine and threonine metabolism • Valine, leucine and isoleucine biosynthesis |
| Butyl-α-aspartyl-allothreoninate | 28*** | 20*** | ns | |
| Isoleucine | 24** | 50*** | ns | • Valine, leucine and isoleucine biosynthesis • Valine, leucine and isoleucine degradation |
| Dimethylglycine | 21*** | 36*** | ns | • Glycine, serine and threonine metabolism |
| Isoleucylalanine | 15*** | 3.4** | ns | |
| Aspartylphenylalanine | 9.6* | 23.4** | ns | |
| Glutamylisoleucine | 9.4*** | 19* | ns | |
| Prolylproline | 8.0** | 4.4* | ns | |
| Valylvaline | 7.7** | 3.6* | ns | |
| Glycylglycyl-alanyl-2-methylalanine | 6.7* | 11** | ns | |
| Isoleucylvaline | 5.0** | 4.9** | ns | |
| Lysine | 4.1** | ns | ns | • Biotin metabolism |
| Citrulline | 3.9** | 2.3* | ns | • Arginine biosynthesis |
| Valine | 3.8*** | 2.4*** | 1.6* | • Valine, leucine and isoleucine biosynthesis • Valine, leucine and isoleucine degradation • Pantothenate and CoA biosynthesis |
| Methionine | ns | 0.07** | 16** | • Cysteine and methionine metabolism • 2-oxocarboxylic acid |
| Glycine | ns | 0.04*** | 33*** | • Glycine, serine and threonine metabolism • Glyoxylate and dicarboxylate metabolism • Glutathione metabolism • Lipoic acid metabolism • Porphyrine metabolism |
| Transsulfuration pathway metabolites | ||||
| Cystathionine | 78*** | 20*** | 3.8** | • Glycine, serine and threonine metabolism • Cysteine and methionine metabolism |
| Homocysteine | 37*** | 39*** | ns | • Cysteine and methionine metabolism |
| Thiosulfuric acid | 17* | 18** | ns | • Sulfur metabolism |
| Cysteine | 5.7** | 3.5* | ns | • Glycine, serine and threonine metabolism • Pantothenate and CoA biosynthesis • Glutathione metabolism • Thiamine metabolism |
| 2-hydroxybutyric acid | 5.0*** | 3.2* | ns | • Propanate metabolism |
| Sulfuric acid | 4.2*** | 2.5** | ns | • Sulfur metabolism |
| Biomarkers of oxidative damage | ||||
| Thioproline | 96*** | 45*** | 2.1* | |
| α-tocopheronic acid | 14** | 5.9* | ns | |
| α-TLHQ glucuronide | 8.0** | 4.7* | ns | |
| α-TLHQ sulfate | 6.8** | 3.3* | ns | |
| α-tocopheronic acid sulfate | 5.9* | 4.9* | ns | |
| CxHyNO features | ||||
| C4 H9 N O | ns | 0.02*** | 48*** | |
| C6 H9 N O | ns | 0.05*** | 21*** | |
| C6 H11 N O | ns | 0.06*** | 30*** | |
| C6 H13 N O | ns | 0.04*** | 44*** | |
| C7 H11 N O | ns | 0.01*** | 72*** | |
| C7 H13 N O | ns | 0.01*** | 142*** | |
* – p-value < 0.05; ** – p-value < 0.01; *** – p-value < 0.001; ns – non-significant.
Table 3.
Steroid hormones increased in cblC group.
| IUPAC or common names of putatively annotated structures | ChemSpider ID | Hierarchical class | Ratio (CblC)/(MMA) | Ratio (CblC)/(PA) |
|---|---|---|---|---|
| 3β,8xi,9xi,14xi,17β -Androst-5-ene-3,17-diyl bis hydrogen sulfate (androstendiol disulfate) | 21403154 | androstane | 114.5 | 32.9 |
| Androsterone sulfate | 140383 | androstane | 97.4 | 37.1 |
| 16α- hydroxydehydroepiandrosterone-3-sulfate (OH-DHEAS) | 24850136 | androstane | 53.4 | 15.9 |
| 4-androstene-3β,17β -diol disulfate (androstendiol disulfate) | 58163615 | androstane | 34.3 | 20.0 |
| Dehydroepiandrosterone sulfate (DHEAS) | 12074 | androstane | 24.7 | 15.4 |
| 16,17-Dihydroxyandrost-5-en-3-yl hydrogen sulfate | 133127 | androstane | 20.1 | 29.4 |
| 9-Hydroxyandrosta-1,4-diene-3,17-dione | 211114 | androstane | 8.2 | 3.8 |
| 3β -(Phenylacetoxy)pregna-5-ene-20-one | 58539760 | pregnane | 40.4 | 33.7 |
| 3,20-Dioxopregn-4-en-17-yl 4-methylbenzoate | 9180030 | pregnane | 34.9 | 28.5 |
| 3α,5α-20-Oxopregnan-3-yl beta-D-glucopyranosiduronic acid (3α-allopregnanolone 3β-D-glucuronide) | 68025990 | pregnane | 19.2 | 7.5 |
Disclaimer/Publisher’s Note: The statements, opinions and data contained in all publications are solely those of the individual author(s) and contributor(s) and not of MDPI and/or the editor(s). MDPI and/or the editor(s) disclaim responsibility for any injury to people or property resulting from any ideas, methods, instructions or products referred to in the content. |
© 2024 by the authors. Licensee MDPI, Basel, Switzerland. This article is an open access article distributed under the terms and conditions of the Creative Commons Attribution (CC BY) license (http://creativecommons.org/licenses/by/4.0/).
Copyright: This open access article is published under a Creative Commons CC BY 4.0 license, which permit the free download, distribution, and reuse, provided that the author and preprint are cited in any reuse.


