
Submitted:
26 August 2025
Posted:
27 August 2025
You are already at the latest version
Abstract
Background/Objectives: Endometriosis is a chronic gynecological condition associated with infertility, oxidative stress and altered metabolic regulation. Follicular fluid reflects the microenvironment of the developing oocyte and changes in its amino acid composition may affect reproductive outcomes. This study aimed to characterize alterations in the amino acid composition of the follicular fluid in endometriosis and to identify potential reproductive outcomes. Methods: Targeted metabolomic analysis of 20 amino acids was performed on follicular fluid samples from 56 women undergoing in vitro fertilization (17 with endometriosis, 39 controls). Amino acid concentrations were quantified and compared between groups, adjusting for age and body mass index. Pathway, biomarker and multivariate analyses were conducted to explore metabolic alterations and potential diagnostic markers. Results: Asparagine, histidine and glycine concentrations were significantly higher in the endometriosis group, independent of age and BMI. Pathway analysis indicated perturbations in glycine/serine metabolism, glutathione metabolism and porphyrin metabolism, consistent with oxidative stress and mitochondrial dysfunction. Multivariate modeling demonstrated partial separation between groups while biomarker analysis identified asparagine (AUC=0.76), along with glycine and histidine, as potential discriminators. Additional enrichment of bile acid and methylation-related pathways suggested broader systemic metabolic changes in endometriosis. Conclusions: Endometriosis is associated with distinct amino acid alterations in the follicular fluid, particularly elevated asparagine, histidine, and glycine, which may reflect oxidative stress and impaired mitochondrial function in the follicular environment. These metabolites seem to be potential biomarkers for endometriosis-related oocyte quality changes and may help individualized in vitro fertilization approaches.
Keywords:
Assisted reproduction technology
; follicular fluid
; amino acid profile
; endometriosis
; pathway analysis
; oxidative stress
1. Introduction
Endometriosis (EM) is a chronic inflammatory condition characterized by the presence of endometrium-like epithelial tissue outside the uterine cavity. [1] It is associated with symptoms such as pelvic pain, dysmenorrhea, infertility, dyspareunia and dyschesia. The prevalence of EM is estimated to be between 2% and 10% in the general female population [2] and between 25% and 40% among infertile women. [3]
EM contributes to infertility through a combination of anatomical, hormonal, immunological, and metabolic mechanisms. [4,5] Anatomical distortion caused by pelvic adhesions and fibrosis can interfere with oocyte release, sperm transport, and fertilization. [6] Additionally, chronic inflammation may damage ovarian tissue, reduce ovarian reserve and compromising oocyte quality. [7] Hormonal imbalances, including disrupted secretion of gonadotropins and steroid hormones, can impair ovulation and endometrial receptivity. [8] The pelvic environment in EM is often characterized by immune dysfunction and chronic inflammation, leading to elevated cytokines and autoantibodies that hinder gamete function and embryo implantation. [9] Increased oxidative stress further exacerbates reproductive impairment by damaging oocytes, sperm, and embryos. Finally, alterations in the eutopic endometrium may compromise implantation, even in the absence of overt anatomical abnormalities, underscoring the multifactorial nature of infertility in women with EM. [5]
Follicular fluid (FF), which fills the follicular antrum, plays a key role as a dynamic microenvironment that supports communication between germ cells and somatic cells. [10] It contains a complex mixture of components—hormones, proteins, antioxidants, reactive oxygen species, immune cells, and various metabolites—essential for oocyte development. [11] FF is derived from serum transudate and substances produced within the follicle wall, further influenced by theca and granulosa cell activity. It also reflects local metabolic processes occurring during oocyte maturation. [12] Maintaining a balanced intra- and extraovarian environment is crucial for healthy folliculogenesis and oocyte quality. [13] Disruptions in this balance, as seen in conditions like EM, can negatively impact fertility. [14] Given its reflective nature and accessibility during assisted reproductive techniques (ART), FF has emerged as a valuable matrix for investigating fertility-related conditions. Its molecular profile holds potential for identifying biomarkers linked to impaired oocyte development and infertility.[15]
Metabolomics is an emerging discipline within the broader "omics" sciences that focuses on analyzing small-molecule metabolites in biological systems. [16] Recent advancements in analytical technologies, including mass spectrometry and nuclear magnetic resonance, have greatly expanded the use of metabolomics in reproductive research. In the context of FF, metabolomic profiling enables the assessment of oocyte metabolic status, the investigation of disease-related alterations in the follicular environment, and the identification of potential biomarkers associated with fertility and assisted reproductive technology (ART) outcomes. [17] Importantly, recent studies have demonstrated that the metabolomic profile of FF is distinct from that of serum, highlighting FF as a localized biochemical microenvironment that more directly reflects the metabolic and functional state of the oocyte and surrounding granulosa cells. These differences underscore the value of FF as a unique source of fertility-related biomarkers that may not be detectable in peripheral blood. Furthermore, FF metabolomics provides information on the interplay between systemic metabolic disorders—such as EM and insulin resistance —and local ovarian physiology, which may ultimately influence oocyte competence, embryo development, and pregnancy success. [18] As such, metabolomic analysis of FF holds promise not only for advancing our understanding of the molecular mechanisms underlying infertility but also for supporting personalized approaches in ART by identifying metabolic signatures predictive of treatment outcomes.
In this study, we conducted a targeted metabolomics analysis of 20 amino acids in FF samples from IVF patients with and without EM. Using a broad range of statistical and multivariate tools available, we aimed to identify disease-specific metabolic signatures and explore their associations with clinical parameters such as age and BMI. By characterizing the altered metabolic landscape of FF in EM, our goal was to uncover potential mechanisms underlying impaired fertility and to identify candidate biomarkers or therapeutic targets that may inform clinical management and improve IVF outcomes.
2. Materials and Methods
2.1. Patient Enrollment
This study was conducted between October 2024 and March 2025 at the Department of Obstetrics and Gynecology, Medical School, University of Pécs, Hungary. All patients, or their next-of-kin, received detailed information about the study protocol, and written informed consent was obtained prior to participation. Patients under 18 years of age, as well as those who were unable to provide or withdrew the consent, were excluded from the study. The study protocol was approved by the Regional Research Ethics Committee of the University of Pécs (No. 4327.316-2900/KK15/2011) in accordance with the 7th revision of the Declaration of Helsinki (2013). A total of 56 patients undergoing assisted reproductive treatment (ART) were enrolled in the study, of whom 17 achieved pregnancy. Pregnancy was defined as a biochemical pregnancy. Biochemical pregnancy was based on a positive serum beta-hCG test performed 14 days post-embryo transfer and subsequently verified by the presence of a gestational sac observed via ultrasound approximately 21 days after the transfer. The EM group (n=17) included patients diagnosed via ultrasound. The control group (n=39) consisted of patients undergoing ART due to male infertility, tubal-factor infertility, or a combination of male and female infertility factors. Patient data were collected from medical records within the hospital’s information system.
2.2. Collection of the Follicular Fluid Samples
Ovarian stimulation was performed using either a long or short protocol with the GnRH agonist triptorelin, or an antagonist protocol with cetrorelix. Recombinant follicle-stimulating hormone (rFSH) was administered at individualized doses ranging from 150 to 250 IU per day, based on follicular maturity. The initial dose was determined according to the patient’s BMI and age, with a maximum daily dose of 300 IU given to those identified as low responders. Depending on the patient’s age and ovarian response, stimulation was further supplemented with recombinant luteinizing hormone (rLH) or human menopausal gonadotropin (hMG). Starting from day 6 of the cycle, follicular development was monitored daily via ultrasound, and gonadotropin doses were adjusted accordingly based on follicle size. Final oocyte maturation was triggered when at least two follicles reached ≥17 mm in diameter, by administering 250 μg (6500 IU) of recombinant human chorionic gonadotropin (hCG). Oocyte retrieval was performed 36 hours later using an ultrasound-guided transvaginal aspiration under routine intravenous sedation. During oocyte retrieval, follicular fluid was collected from individual follicles and pooled. Immediately after collection, the samples were centrifuged at 6700× g for 10 minutes at room temperature to remove erythrocytes, white blood cells, and granulosa cells. The supernatant was then collected and stored at −80°C for further analysis.
2.3. Sample Processing and Measurement of Amino Acids
2.3.1. Reagents
The following chemicals were used for amino acid analysis: 3-mercaptopropionic acid (≥99.0%, HPLC grade), ortho-phthalaldehyde (≥99%, HPLC grade), and 9-fluorenylmethyloxycarbonyl chloride (FMOC chloride) (≥99.0%, HPLC grade), all obtained from Merck KGaA, Darmstadt, Germany. Additional reagents included acetonitrile (≥99.9%, HPLC gradient grade), methanol (≥99.8%, HPLC grade), and HPLC gradient-grade water, all supplied by Fisher Chemical, Pittsburgh, Pennsylvania, USA. A 20 mM phosphate buffer (pH 6.2, KH2PO4: Fisher Chemical, KOH: Lach-Ner Ltd., Czech Republic) was used for sample preparation. The mobile phase for UHPLC elution consisted of a mixture of 400 mL acetonitrile, 450 mL methanol, and 150 mL water. L-Norvaline (Merck KGaA, Darmstadt, Germany) was used as an internal standard.
2.3.2. Sample Preparation for UHPLC Measurement
Quantitative amino acid analysis of follicular fluid samples was conducted after protein precipitation, fluorescence derivatization, and UHPLC chromatography. The analyses were performed using a Shimadzu Nexera X2 UHPLC System equipped with a fluorescence detector (RF-20A XS, Shimadzu Europa GmbH, Duisburg, Germany) and an internal standard (250 µmol/L L-Norvaline). For sample preparation, 300 µL of ice-cold acetonitrile was added to 200 µL of follicular fluid sample, followed by vortex mixing and centrifugation at 6100 × g for 4 minutes (ScanSpeed Mini, Labogene, Allerød, Denmark). After centrifugation, 300 µL of the supernatant was mixed with 600 µL of phosphate buffer. The mixture was filtered using a Millex® GV 4 mm Durapore PVDF 0.22 µm filter (Merck KGaA, Darmstadt, Germany) and placed into the autosampler module (SIL-30AC Autosampler) for analysis.
2.3.3. Derivatization
Amino acid derivatization was performed using 3-mercaptopropionic acid (MPA) and ortho-phthalaldehyde (OPA). For proline, 9-fluorenylmethyloxycarbonyl chloride (FMOC) was used instead. The derivatization process involved mixing 7.5 µL of sample, 45 µL of MPA, 22 µL of OPA and 3 µL of 250 µmol/L L-Norvaline. The mixture was incubated for 1 minute, followed by the addition of 10 µL of FMOC reagent and further incubation for 2 minutes. Finally, 5 µL of the derivatized sample was injected into the UHPLC system.
2.3.4. UHPLC Method Parameters
Each 5 µL sample aliquot was injected into the UHPLC system. Separation was achieved using a reverse-phase Kinetex 2.6 μm EVO C18 100Å column (100 × 3.0 mm, Phenomenex, Torrance, CA, USA). The mobile phase consisted of 20 mM phosphate buffer (A) and 40:45:15 acetonitrile:methanol:water solution (B). The flow rate was set at 1.3 mL/min, with the column temperature maintained at 27°C. The total running time for each sample was 15.1 minutes. Amino acids (except proline) were detected using a fluorescence detector (RF-20A XS, Shimadzu) with an excitation wavelength of 350 nm and an emission wavelength of 450 nm. Proline was detected separately at an excitation wavelength of 266 nm and an emission wavelength of 305 nm. Data acquisition and analysis were performed using Shimadzu LabSolutions 5.97 SP1 software. Each amino acid was identified based on its retention time (RT), and concentrations were calculated using the area under the curve (AUC) of the internal standard. All samples were measured in duplicate, with the final concentration determined as the average of both measurements.
2.4. Data Analysis
Statistical analyses were conducted using SPSS for Windows (version 28.0.0.0, IBM SPSS Statistics, USA). Data distribution was initially assessed for normality. Since most amino acids did not follow a normal distribution, non-parametric statistical tests were applied. Group differences were evaluated using the Mann-Whitney U-test, with a significance threshold of p < 0.05. Amino acid concentrations were analyzed using MetaboAnalyst 5.0 (RRID:SCR_015539, Alberta, Canada). Multivariate analysis was performed using Partial Least Squares Discriminant Analysis (PLS-DA) to evaluate group separation and identify key discriminative features between the EM and control groups. In addition, a heatmap with hierarchical clustering was used for unsupervised pattern recognition and to visualize relative abundance differences across samples. Biomarker analysis was conducted by generating Receiver Operating Characteristic (ROC) curves, where metabolites with an Area Under the Curve (AUC) > 0.7 were considered to have acceptable discriminatory power between groups. For functional interpretation, Metabolic Pathway Analysis was carried out using pathway enrichment and topology analysis. Pathways with a topological impact score greater than 0.10 were considered biologically relevant. To further explore biological significance, Metabolite Set Enrichment Analysis (MSEA) was applied to identify enriched metabolite sets based on known biological functions and disease associations. Relevant pathways associated with EM were visualized using metabolic network diagrams.
3. Results
3.1. Patients’ Demographics and Clinical Characteristics
Table 1 presents the demographic and clinical characteristics of the patients included in this study.
3.2. Amino Acid Analysis of the FF Samples
A total of 20 amino acids, the fundamental building blocks of proteins, were measured in all FF samples. As shown in Table 2, glutamine, alanine, and glycine were the most abundant amino acids. This observation is consistent with previous studies [19], which highlight the physiological importance of these amino acids in oocyte development. [20,21]
3.3. Comparison of Amino Acid Profiles Between EM and Control Groups
The results of the statistical comparison of the two groups are shown as p values and are presented in Table 3. The patients were separated into two groups based on EM disease (EM, n= 17) and patients without this condition (CG, n= 39). Three amino acids were found to be significantly altered in the EM group. These were asparagine (p=0.002), histidine (p=0.049) and glycine (p=0.025). The concentration of all three amino acids was higher in the EM group.
3.4. Comparison of Amino Acid Concentration Based on Body Mass Index (BMI)
Patients were categorized into two groups according to their BMI, which was calculated as weight in kilograms divided by height in meters squared (BMI = kg/m²). Those with a BMI between 18.5 and 24.9 were classified as normal group (n = 35), while patients with a BMI above 25 were placed in the overweight group (n = 19). In the EM group only 3 patients had higher BMI and 14 patients were in the normal BMI group. This result corresponds to previous studies where it was concluded that patients with EM tend to have lower BMI. [22] When comparing the normal and high BMI groups, among the amino acids measured, only asparagine (p=0.018) showed significant difference. The asparagine concentration was higher in the normal group.
3.5. Comparison of Amino Acid Concentration Based on the Age of the Patients
For this analysis, the patients were divided into two age groups: the younger group (aged 34 and below, n = 30) and the older group (aged 35 and above, n = 26). One amino acid, glycine (p=0.033) was significantly altered, and the concentration of this amino acid was higher in the older group.
3.6. Heatmap and PLS-DA Analysis
Heatmaps provide a detailed view of individual metabolite patterns in complex omics data such as amino acid profile in FF. Heatmaps reveal relative abundance differences across samples. In this study, a heatmap of scaled concentrations of 20 amino acids in FF was used to compare EM and control IVF patients. Rows represent amino acids; columns represent individual samples and color gradients (blue to red) indicating low to high concentrations. Hierarchical clustering applied to both samples and metabolites helps uncover similarity patterns, suggesting potential biological subgroups or co-regulated metabolic pathways. Notably, altered levels of glycine, histidine, and glutamate suggest EM-related metabolic changes (Figure 1).
To enhance group separation and identify discriminative metabolic features between patients with EM and controls, Partial Least Squares Discriminant Analysis (PLS-DA) was applied to the amino acid concentration data obtained from FF. The PLS-DA scores plot displays the projection of individual samples along the first two latent variables: Component 1 accounts for 45.6% of the variance related to group separation and Component 2 explains 16.1% of the remaining discriminative variance. Each point represents an individual sample, colored by group (pink=control, green=EM) and shaded ellipses depict 95% confidence intervals for each class. The two groups show partial separation which indicates differences in amino acid profiles that are relevant to group classification. The overlap of confidence intervals suggests metabolic heterogeneity with both groups, while the group displacement along Component 1 supports the presence of systematic metabolic differences associated with EM. This analysis suggests that specific amino acids contribute to the discrimination between the two groups. As biological significance the PLS-DA findings support the hypothesis that metabolic alterations in the follicular environment are associated with EM (Figure 2).
3.7. Metabolite Set Enrichment Analysis (MSEA)
The dot plot presents the results of MSEA performed on amino acid concentration data obtained from FF samples (Figure 3). The analysis shows the top 25 metabolic pathways enriched in the dataset providing information into biological processes potentially altered in the follicular environment of patients with EM compared to controls. The x-axis represents the statistical significance of each pathway, expressed as the negative logarithm of the p-value (−log₁₀(p-value)). Pathways farther to the right are more statistically significant. The y-axis lists the names of the metabolic pathways. Each dot represents one enriched pathway. The size of the dot corresponds to the enrichment ratio, which reflects the degree of overrepresentation of metabolites from the experimental dataset within a given pathway. A higher enrichment ratio indicates a stronger overrepresentation. The color gradient of the dots—from yellow to red—indicates the raw p-value with deeper red representing more significant pathways. The most significantly enriched pathways include Porphyrin metabolism, Bile acid biosynthesis, Methionine and methylhistidine metabolism, Carnitine synthesis, Alanine metabolism, Glutathione metabolism and Glycine and serine metabolism.
3.8. Biomarker Analysis
To identify potential biomarkers that distinguish FF profiles between EM and control groups, a biomarker analysis was performed using ROC-based metrics. Among the 20 amino acids examined, asparagine (AUC = 0.76, p = 0.016), glycine (AUC = 0.69, p = 0.038), and histidine (AUC = 0.67, p = 0.042) emerged as the most promising discriminating features as their differences were statistically significant and the AUC values were above 0.65. These findings suggest that these metabolites may serve as potential biomarkers of altered follicular microenvironments in EM. In Figure 4 the ROC curve of asparagine is demonstrated together with the results of Mann-Whitney probe.
3.9. Pathway Analysis
Pathway enrichment analysis demonstrated several metabolic pathways that were altered between EM and control groups (Figure 5). Among these, Glycine, serine and threonine metabolism emerged as the most significantly affected pathway, showing both high statistical significance (p=0.047) and substantial pathway impact (PI=0.47). One carbon pool by folate and Lipoic acid metabolism also showed high significance and but moderate impact. Other notably enriched pathways were Porphyrin metabolism, Glutathione metabolism, Beta-alanine metabolism, Sphingolipid metabolism and Cysteine and methionine metabolism. Pathways with high impact but lower significance were Phenylalanine, tyrosine and tryptophan biosynthesis and Alanine, aspartate and glutamate metabolism.
4. Discussion
This study identified distinct metabolic alterations in the FF of ART patients with EM compared to controls, emphasizing specific amino acids that reflect the disrupted follicular environment associated with the condition. Among the 20 amino acids examined, asparagine, histidine, and glycine exhibited statistically significant differences between the EM and control groups. While these metabolic differences were largely independent of age and BMI, certain associations—such as BMI with asparagine and valine, and age with glycine—suggest that individual patient characteristics may influence specific aspects of the follicular metabolome.
In FF samples, the concentration of asparagine was significantly altered. Asparagine, a non-essential amino acid synthetized from aspartate via asparagine synthetase, was significantly elevated in the EM group. The available literature does not directly explain the elevation of asparagine in the FF of EM patients, one study found that asparagine levels significantly increased in the eutopic endometrial tissue of EM patients compared to controls. This rise is believed to reflect altered cellular metabolism and heightened protein synthesis demands, which are characteristic of endometriotic tissue. [23] Interestingly, asparagine concentration was found to be lower in FF samples from patients with higher BMI. Obesity is associated with systemic metabolic changes that can affect the composition of FF, which plays a crucial role in oocyte development. A study demonstrated that in individuals with high body fat asparagine levels were reduced compared to those with normal body fat. [24] Contrarily, previous reports have shown elevated asparagine concentrations in the serum of obese patients, highlighting a possible discordance between systemic and local (follicular) amino acid levels. [25]
Histidine was also found at significantly higher concentration in the FF of the EM group. A previous untargeted study of FF samples from EM patients reported aromatic amino acids and related metabolites were upregulated, suggesting increased biosynthesis in EM, possibly in response to chronic inflammation and oxidative stress characteristic to this condition. [26] Furthermore, a systematic review found that while histidine levels did not significantly differ in plasma, they were consistently elevated in FF from women with EM. This suggests a localized, rather than systemic alteration in amino acid metabolism within the ovarian microenvironment. [27]
Glycine levels were also significantly elevated in the EM group. In another metabolomics study, glycine was reported at higher concentration in the FF of EM patients. Glycine is a key component in the formation of the antioxidant glutathione and in increased oxidative stress may promote its utilization in GSH synthesis in EM. This is supported by studies demonstrating that glycine supplementation reduces ROS and improves mitochondrial function in oocytes, implying that elevated glycine in FF could reflect increased antioxidant demand in the disease context. [13,21] Additionally, glycine concentrations were significantly higher in the older patients. Although direct glycine measurements in FF across age groups are limited, numerous studies have documented age-related changes in the FF metabolome. Advancing maternal age is linked to elevated oxidative stress and altered amino acid metabolism within the follicular environment, including metabolic pathways involving glycine. As antioxidant capacity declines with age, the FF environment undergoes compensatory metabolic shift, increasing glycine production or accumulation to support GSH synthesis and to counteract oxidative damage. [28]
When amino acid profiles were compared based on BMI, valine concentrations were higher in patients with higher BMI. Research investigating the impact of obesity and BMI on FF composition has shown that women with higher BMI tend to exhibit increased levels of branched-chain amino acids (BCAAs), such as valine, in their FF. This pattern is consistent regardless of polycystic ovary syndrome (PCOS) status, indicating that the metabolic changes – such as insulin resistance, dysregulated lipid metabolism and elevated oxidative stress – are likely driven by obesity itself rather than PCOS. Elevated BCAA concentrations in FF have been linked to impaired oocyte quality, with reduced pregnancy rates and a higher risk of miscarriage in women with obesity or insulin resistance. [29]
The metabolic landscape of FF in patients with EM is profoundly altered, reflecting the complex pathophysiology of the disease. Our metabolite set enrichment analysis MSEA and pathway analysis revealed significant disruptions in several key metabolic pathways, including Porphyrin metabolism, Primary bile acid biosynthesis, Methionine and methyl histidine metabolism, Carnitine synthesis, Glutathione metabolism, Glycine, serine, threonine metabolism pathway, and others related to oxidative stress, hormonal regulation and mitochondrial function. One of the most significantly altered pathways was the Porphyrin metabolism. EM is characterized by increased oxidative stress and dysregulated iron metabolism in the pelvic cavity. Porphyrin metabolism (especially heme metabolism) is increasingly recognized as disrupted in EM because in endometriotic lesions, heme is released from hemoglobin as a result of retrograde menstruation and tissue degradation. It is broken down by heme oxygenase-1, producing metabolites that influence inflammation, oxidative stress, autophagy, pain and may contribute to malignant transformation and tissue invasion. [30,31] It was also reported that macrophages in EM lesions accumulate iron and hemosiderin, this iron overload can generate ROS and lead to oxidative injury. [32] Moreover, in another research it is reported that hemin, which is an iron-containing porphyrin released from the breakdown of cell-free hemoglobin in endometriotic lesions, contributes to local iron accumulation and oxidative stress, potentially driving persistent inflammation and lesion survival. [33] Our data also indicated significant alterations in Primary bile acid biosynthesis. Metabolomic studies have identified this pathway as one of the most significantly enriched and altered pathways in both the FF and gut microbiota of EM patients. [34] Gut microbiota plays a central role in the metabolism and transformation of primary bile acids. In EM, shifts in gut microbiota composition can disrupt bile acid conversion and impair their signaling functions. Such alterations in bile acid profiles are believed to contribute to disease progression by modulating immune cell populations and activating pro-inflammatory pathways. [35] Additionally, bile acid biosynthesis is linked to estrogen signaling, another feature of EM. Bile acids can modulate estrogen levels via receptor-mediated pathways and altered bile acid profiles have been shown to modulate estrogen bioavailability and inflammatory responses, both of which are central to EM pathogenesis. [36] Pathways related to methylation and epigenetic regulation were also significantly affected. Specifically, Methionine metabolism, methyl histidine metabolism, and the One-carbon pool by folate were enriched. Altered Methionine metabolism in EM patients may reflect imbalances in cellular methylation processes. Methionine serves as a key methyl donor involved in DNA and histone methylation. Overexpression of nicotinamide N-methyltransferase - an enzyme involved in methylation and methionine metabolism- has been reported in both eutopic and ectopic endometrial tissues in EM and is associated with increased cell proliferation, migration and invasion. [37] Furthermore, methionine influences maternal-fetal immune tolerance and endometrial receptivity, processes relevant to fertility outcomes in EM. [38] As observed in our study, Methyl histidine metabolism was also elevated in EM patients. This is consistent with other metabolomic analyses that reported increased methyl histidine and related amino acid pathways in the serum of women with EM. [39] Our findings also highlight disruptions in Carnitine synthesis and metabolism. Previous targeted metabolomic analysis have shown that carnitine levels are significantly reduced in the EM tissue compared to the normal endometrium. This reduction is associated with impaired mitochondrial respiration and a shift away from oxidative phosphorylation, suggesting disturbances in cellular energy metabolism in EM-affected tissues. [40] Such mitochondrial dysfunctions are well-recognized in EM and are supported by our concurrent observation of altered lipoic acid metabolism. Although direct investigations into lipoic acid metabolism in EM are limited, considerable evidence indicates impaired mitochondrial function and oxidative metabolism in endometriotic tissues—processes that rely on lipoic acid as an essential cofactor. These impairments likely reflect disturbances in the lipoic acid metabolism pathway, contributing to the characteristic metabolic and oxidative stress profile of EM. [40] Our analysis showed that Glutathione metabolism was also altered in EM. Numerous studies reported that it is disrupted in EM, contributing to oxidative stress and impaired cellular redox balance. Although levels of glutathione may be elevated—potentially as a compensatory response to increased oxidative burden—this is accompanied by reduced activity of key glutathione-dependent enzymes, including glutathione peroxidase, glutathione reductase, and glutathione S-transferase. These enzymes play critical roles in detoxifying ROS and maintaining cellular homeostasis. Their diminished activity in endometriotic tissues and follicular fluid creates a pro-oxidant environment that can damage oocytes and impair fertility. [41,42] Among the pathways examined, Glycine, serine, and threonine metabolism emerged as having the highest pathway impact, despite lower statistical significance, suggesting its central role in EM-associated metabolic remodeling. Studies integrating transcriptomic and metabolomic data have reported the glycine, serine, and threonine metabolism pathway as a key player in EM. This pathway is upregulated in EM, especially under chronic stress conditions, and is associated with immune dysregulation, reduced T cell activity, and enhanced lesion migration and invasion. [43] Additionally, metabolomic profiling of endometrial tissue from affected women reveals significant changes in glycine and threonine levels across disease stages, linked to altered energy metabolism, cell proliferation, and apoptosis. [44]
Our findings support the concept that EM is associated with a reprogrammed FF metabolomic profile characterized by enhanced oxidative stress, iron overload, disrupted hormonal signaling and impaired energy and methylation metabolism. These metabolic perturbations may contribute to the subfertile phenotype observed in EM and offer potential targets for therapeutic intervention or biomarker development. Integrating metabolomic findings with transcriptomic and proteomic data in the future studies will be essential to further elucidate the mechanistic underpinnings of these altered pathways and their relevance to reproductive outcomes.
5. Conclusion
Our findings demonstrated that endometriosis is associated with significant metabolic alterations in the amino acid profiles in the follicular fluid of IVF patients. Elevated levels of asparagine, histidine, and glycine, along with disruptions in pathways related to oxidative stress, mitochondrial function, and hormonal regulation, suggest a compromised follicular environment that may negatively influence oocyte quality and reproductive potential. These results enhance our understanding of the metabolic underpinnings of endometriosis-related infertility and highlight potential biomarkers and therapeutic targets to support individualized treatment strategies and improve IVF outcomes in this patient population.
Author Contributions
Conceptualization, T.K., C.K. and G.L.K.; methodology, T.K. and C.K.; software, C.K; validation, T.K., C.K. and G.L.K.; formal analysis, C.K.; investigation, C.K.; resources, D.H., D.C., A.L, Á. L., R.J-C., Á.V., P.M., K.G. and T.K; data curation, C.K.; writing—original draft preparation, C.K.; writing—review and editing, C.K, T.K.; visualization, C.K.; supervision, T.K. and G.L.K.; project administration, T.K. and G.L.K.; funding acquisition, T.K. and G.L.K. All authors have read and agreed to the published version of the manuscript.
Funding
National Laboratory on Human Reproduction, University of Pécs; Project no. RRF-2.3.1-21-2022-00012, titled National Laboratory on Human Reproduction has been implemented with the support provided by the Recovery and Resilience Facility of the European Union within the framework of Program Széchenyi Plan Plus.
Institutional Review Board Statement
5273-2/2012/EHR.
Informed Consent Statement
Detailed information was given to all patients or their next-of-kin regarding our study protocol while written consent was obtained from all.
Data Availability Statement
The data that support the findings of this study are available from the corresponding author upon reasonable request.
Conflicts of Interest
The authors declare no conflicts of interest.
Abbreviations
The following abbreviations are used in this manuscript:
| EM | Endometriosis |
| FF | Follicular fluid |
| ART | Artificial reproductive treatment |
| rFSH | Recombinant follicle stimulating hormone |
| rLH | Recombinant luteinizing hormone |
| hMG | Human menopausal gonadotropin |
| hCG | Human chorionic gonadotropin |
| MPA | 3-mercaptopropionic acid |
| FMOC | 9-fluorenylmethyloxycarbonyl chloride |
| OPA | Ortho-phthalaldehyde |
| RT | Retention time |
| AUC | Area under curve |
| PLS-DA | Partial Least Squares Discriminant Analysis |
| ROC | Receiver Operating Characteristic |
| MSEA | Metabolite Set Enrichment Analysis |
| PCOS | Polycystic ovary syndrome |
| BCAAs | Branched-chain amino acids |
References
- Fan, Y.; Yang, Q.; Lin, Y.; Fu, X.; Shu, J. The effect of endometriosis on oocyte quality: mechanisms, diagnosis and treatment. Arch Gynecol Obstet 2025. [Google Scholar] [CrossRef]
- Saunders, P.T.K.; Whitaker, L.H.R.; Horne, A.W. Endometriosis: Improvements and challenges in diagnosis and symptom management. Cell Press. 2024. [Google Scholar] [CrossRef]
- Ozkan, S.; Murk, W.; Arici, A. Endometriosis and infertility: Epidemiology and evidence-based treatments. in Annals of the New York Academy of Sciences, Blackwell Publishing Inc., 2008, pp. 92–100. [CrossRef]
- Bulletti, C.; Coccia, M.E.; Battistoni, S.; Borini, A. Endometriosis and infertility. 2010. [CrossRef]
- Qi, Q.; et al. Update on the pathogenesis of endometriosis-related infertility based on contemporary evidence. Frontiers Media SA. 2025. [Google Scholar] [CrossRef]
- La Marca, A.; et al. Fertility preservation in women with endometriosis. Hum Reprod Open 2025, 2025. [Google Scholar] [CrossRef] [PubMed]
- Bonavina, G.; Taylor, H.S. Endometriosis-associated infertility: From pathophysiology to tailored treatment. Frontiers Media S.A. 2022, 26. [Google Scholar] [CrossRef]
- Bulletti, C.; Coccia, M.E.; Battistoni, S.; Borini, A. Endometriosis and infertility. 2010. [CrossRef]
- Guo, J.; Wang, Y.; Chen, G. Causal Relationship Between Endometriosis, Female Infertility, and Primary Ovarian Failure Through Bidirectional Mendelian Randomization. Int J Womens Health 2024, 16, 2143–2155. [Google Scholar] [CrossRef] [PubMed]
- Ban, Y.; Ran, H.; Chen, Y.; Ma, L. Lipidomics analysis of human follicular fluid form normal-weight patients with polycystic ovary syndrome: a pilot study. J Ovarian Res 2021, 14. [Google Scholar] [CrossRef]
- Alrabiah, N.A.; Simintiras, C.A.; Evans, A.C.O.; Lonergan, P.; Fair, T. Biochemical alterations in the follicular fluid of bovine peri-ovulatory follicles and their association with final oocyte maturation. Reproduction and Fertility 2023, 4. [Google Scholar] [CrossRef]
- Sun, Z.; et al. Human Follicular Fluid Metabolomics Study of Follicular Development and Oocyte Quality. Chromatographia 2017, 80, 901–909. [Google Scholar] [CrossRef]
- Guo, H.; et al. Metabolomics analysis of follicular fluid in ovarian endometriosis women receiving progestin-primed ovary stimulation protocol for in vitro fertilization. Sci Rep 2023, 13. [Google Scholar] [CrossRef] [PubMed]
- Da Broi, M.G.; Giorgi, V.S.I.; Wang, F.; Keefe, D.L.; Albertini, D.; Navarro, P.A. Influence of follicular fluid and cumulus cells on oocyte quality: Clinical implications. J Assist Reprod Genet 2018, 35, 735–751. [Google Scholar] [CrossRef]
- Brinca, A.T.; et al. Follicular Fluid and Blood Monitorization of Infertility Biomarkers in Women with Endometriosis. Multidisciplinary Digital Publishing Institute (MDPI). 2024. [Google Scholar] [CrossRef]
- Nicholson, J.K.; Lindon, J.C.; Holmes, E. understanding the metabolic responses of living systems to pathophysiological stimuli via multivariate statistical analysis of biological NMR spectroscopic data.” [Online]. Available: www.taylorandfrancis.com}.
- Li, J.; Zhang, Z.; Wei, Y.; Zhu, P.; Yin, T.; Wan, Q. Metabonomic analysis of follicular fluid in patients with diminished ovarian reserve. Front Endocrinol (Lausanne) 2023, 14. [Google Scholar] [CrossRef] [PubMed]
- Hood, R.B.; et al. Characterizing the follicular fluid metabolome: quantifying the correlation across follicles and differences with the serum metabolome. Fertil Steril 2022, 118, 970–979. [Google Scholar] [CrossRef] [PubMed]
- Józwik, M.; Józwik, M.; Teng, C.; Battaglia, F.C. Amino acid, ammonia and urea concentrations in human pre-ovulatory ovarian follicular fluid. Human Reproduction 2006, 21, 2776–2782. [Google Scholar] [CrossRef]
- Kirsipuu, T.; Laks, K.; Velthut-Meikas, A.; Levkov, L.; Salumets, A.; Palumaa, P. Comprehensive elucidation of amino acid profile in human follicular fluid and plasma of in vitro fertilization patients. Gynecological Endocrinology 2015, 31, 9–17. [Google Scholar] [CrossRef]
- Kurdi, C.; et al. Amino Acid Profiling of Follicular Fluid in Assisted Reproduction Reveals Important Roles of Several Amino Acids in Patients with Insulin Resistance. Int J Mol Sci 2023, 24. [Google Scholar] [CrossRef] [PubMed]
- Hong, J.; Yi, K.W. What is the link between endometriosis and adiposity? Obstet Gynecol Sci 2022, 65, 227–233. [Google Scholar] [CrossRef]
- Li, J.; et al. Endometrium metabolomic profiling reveals potential biomarkers for diagnosis of endometriosis at minimal-mild stages. Reproductive Biology and Endocrinology 2018, 16. [Google Scholar] [CrossRef]
- Ruebel, M.L.; et al. Obesity leads to distinct metabolomic signatures in follicular fluid of women undergoing in vitro fertilization. J Physiol Endocrinol Metab 2019, 316, 383–396. [Google Scholar] [CrossRef]
- Newgard, C.B.; et al. A Branched-Chain Amino Acid-Related Metabolic Signature that Differentiates Obese and Lean Humans and Contributes to Insulin Resistance. Cell Metab 2009, 9, 311–326. [Google Scholar] [CrossRef]
- Wei, Y.; et al. Nontargeted metabolomics analysis of follicular fluid in patients with endometriosis provides a new direction for the study of oocyte quality. MedComm (Beijing) 2023, 4. [Google Scholar] [CrossRef]
- Adamyan, L.; et al. Metabolomic biomarkers of endometriosis: A systematic review. Journal of Endometriosis and Uterine Disorders 2024, 7, 100077. [Google Scholar] [CrossRef]
- Chen, Y.; Yang, J.; Zhang, L. The Impact of Follicular Fluid Oxidative Stress Levels on the Outcomes of Assisted Reproductive Therapy. Multidisciplinary Digital Publishing Institute (MDPI). 2023. [Google Scholar] [CrossRef]
- Zhang, C.-M.; et al. Metabolic heterogeneity of follicular amino acids in polycystic ovary syndrome is affected by obesity and related to pregnancy outcome. 2014. [Online]. Available: http://www.biomedcentral.com/1471-2393/14/11.
- Chiang, S.K.; Chen, S.E.; Chang, L.C. The role of HO-1 and its crosstalk with oxidative stress in cancer cell survival. MDPI. 2021. [Google Scholar] [CrossRef] [PubMed]
- Izumi, Y.; et al. Hepcidin as a key regulator of iron homeostasis triggers inflammatory features in the normal endometrium. Free Radic Biol Med 2023, 209, 191–201. [Google Scholar] [CrossRef] [PubMed]
- Scutiero, G.; et al. Oxidative Stress and Endometriosis: A Systematic Review of the Literature. Hindawi Limited. 2017. [Google Scholar] [CrossRef]
- Dai, Y.; et al. Integrative analysis of transcriptomic and metabolomic profiles reveals abnormal phosphatidylinositol metabolism in follicles from endometriosis-associated infertility patients. Journal of Pathology 2023, 260, 248–260. [Google Scholar] [CrossRef] [PubMed]
- Qin, R.; Tian, G.; Liu, J.; Cao, L. The gut microbiota and endometriosis: From pathogenesis to diagnosis and treatment. Frontiers Media S.A. 2022. [Google Scholar] [CrossRef]
- Li, Y.; Wang, K.; Ding, J.; Sun, S.; Ni, Z.; Yu, C. Influence of the gut microbiota on endometriosis: Potential role of chenodeoxycholic acid and its derivatives. Frontiers Media S.A. 2022. [Google Scholar] [CrossRef]
- Li, Y.; Wang, K.; Ding, J.; Sun, S.; Ni, Z.; Yu, C. Influence of the gut microbiota on endometriosis: Potential role of chenodeoxycholic acid and its derivatives. Frontiers Media S.A. 2022. [Google Scholar] [CrossRef] [PubMed]
- Hou, S.; Xu, H.; Lei, S.; Zhao, D. Overexpressed nicotinamide N-methyltransferase in endometrial stromal cells induced by macrophages and estradiol contributes to cell proliferation in endometriosis. Cell Death Discov 2024, 10. [Google Scholar] [CrossRef] [PubMed]
- Newgard, C.B.; et al. A Branched-Chain Amino Acid-Related Metabolic Signature that Differentiates Obese and Lean Humans and Contributes to Insulin Resistance. Cell Metab 2009, 9, 311–326. [Google Scholar] [CrossRef] [PubMed]
- Murgia, F.; et al. Metabolic Profile of Patients with Severe Endometriosis: a Prospective Experimental Study”. [CrossRef]
- Atkins, H.M.; Bharadwaj, M.S.; Cox, A.O.; Furdui, C.M.; Appt, S.E.; Caudell, D.L. Endometrium and endometriosis tissue mitochondrial energy metabolism in a nonhuman primate model. Reproductive Biology and Endocrinology 2019, 17. [Google Scholar] [CrossRef]
- Clower, L.; Fleshman, T.; Geldenhuys, W.J.; Santanam, N. Targeting Oxidative Stress Involved in Endometriosis and Its Pain. MDPI. 2022. [Google Scholar] [CrossRef]
- Máté, G.; Bernstein, L.R.; Török, A.L. Endometriosis Is a Cause of Infertility. Does Reactive Oxygen Damage to Gametes and Embryos Play a Key Role in the Pathogenesis of Infertility Caused by Endometriosis? Frontiers Media S.A. 2018. [Google Scholar] [CrossRef]
- Lu, C.; et al. Chronic Stress Blocks the Endometriosis Immune Response by Metabolic Reprogramming. Int J Mol Sci 2024, 25. [Google Scholar] [CrossRef]
- Li, X.; et al. Identification of Potential Molecular Mechanism Related to Infertile Endometriosis. Front Vet Sci 2022, 9. [Google Scholar] [CrossRef]
Figure 1.
Heatmap visualization of the 20 main amino acids measured in follicular fluid samples from control (pink) and EM (green) patients. Each column represents an individual patient, and each row corresponds to a specific amino acid.
Figure 1.
Heatmap visualization of the 20 main amino acids measured in follicular fluid samples from control (pink) and EM (green) patients. Each column represents an individual patient, and each row corresponds to a specific amino acid.
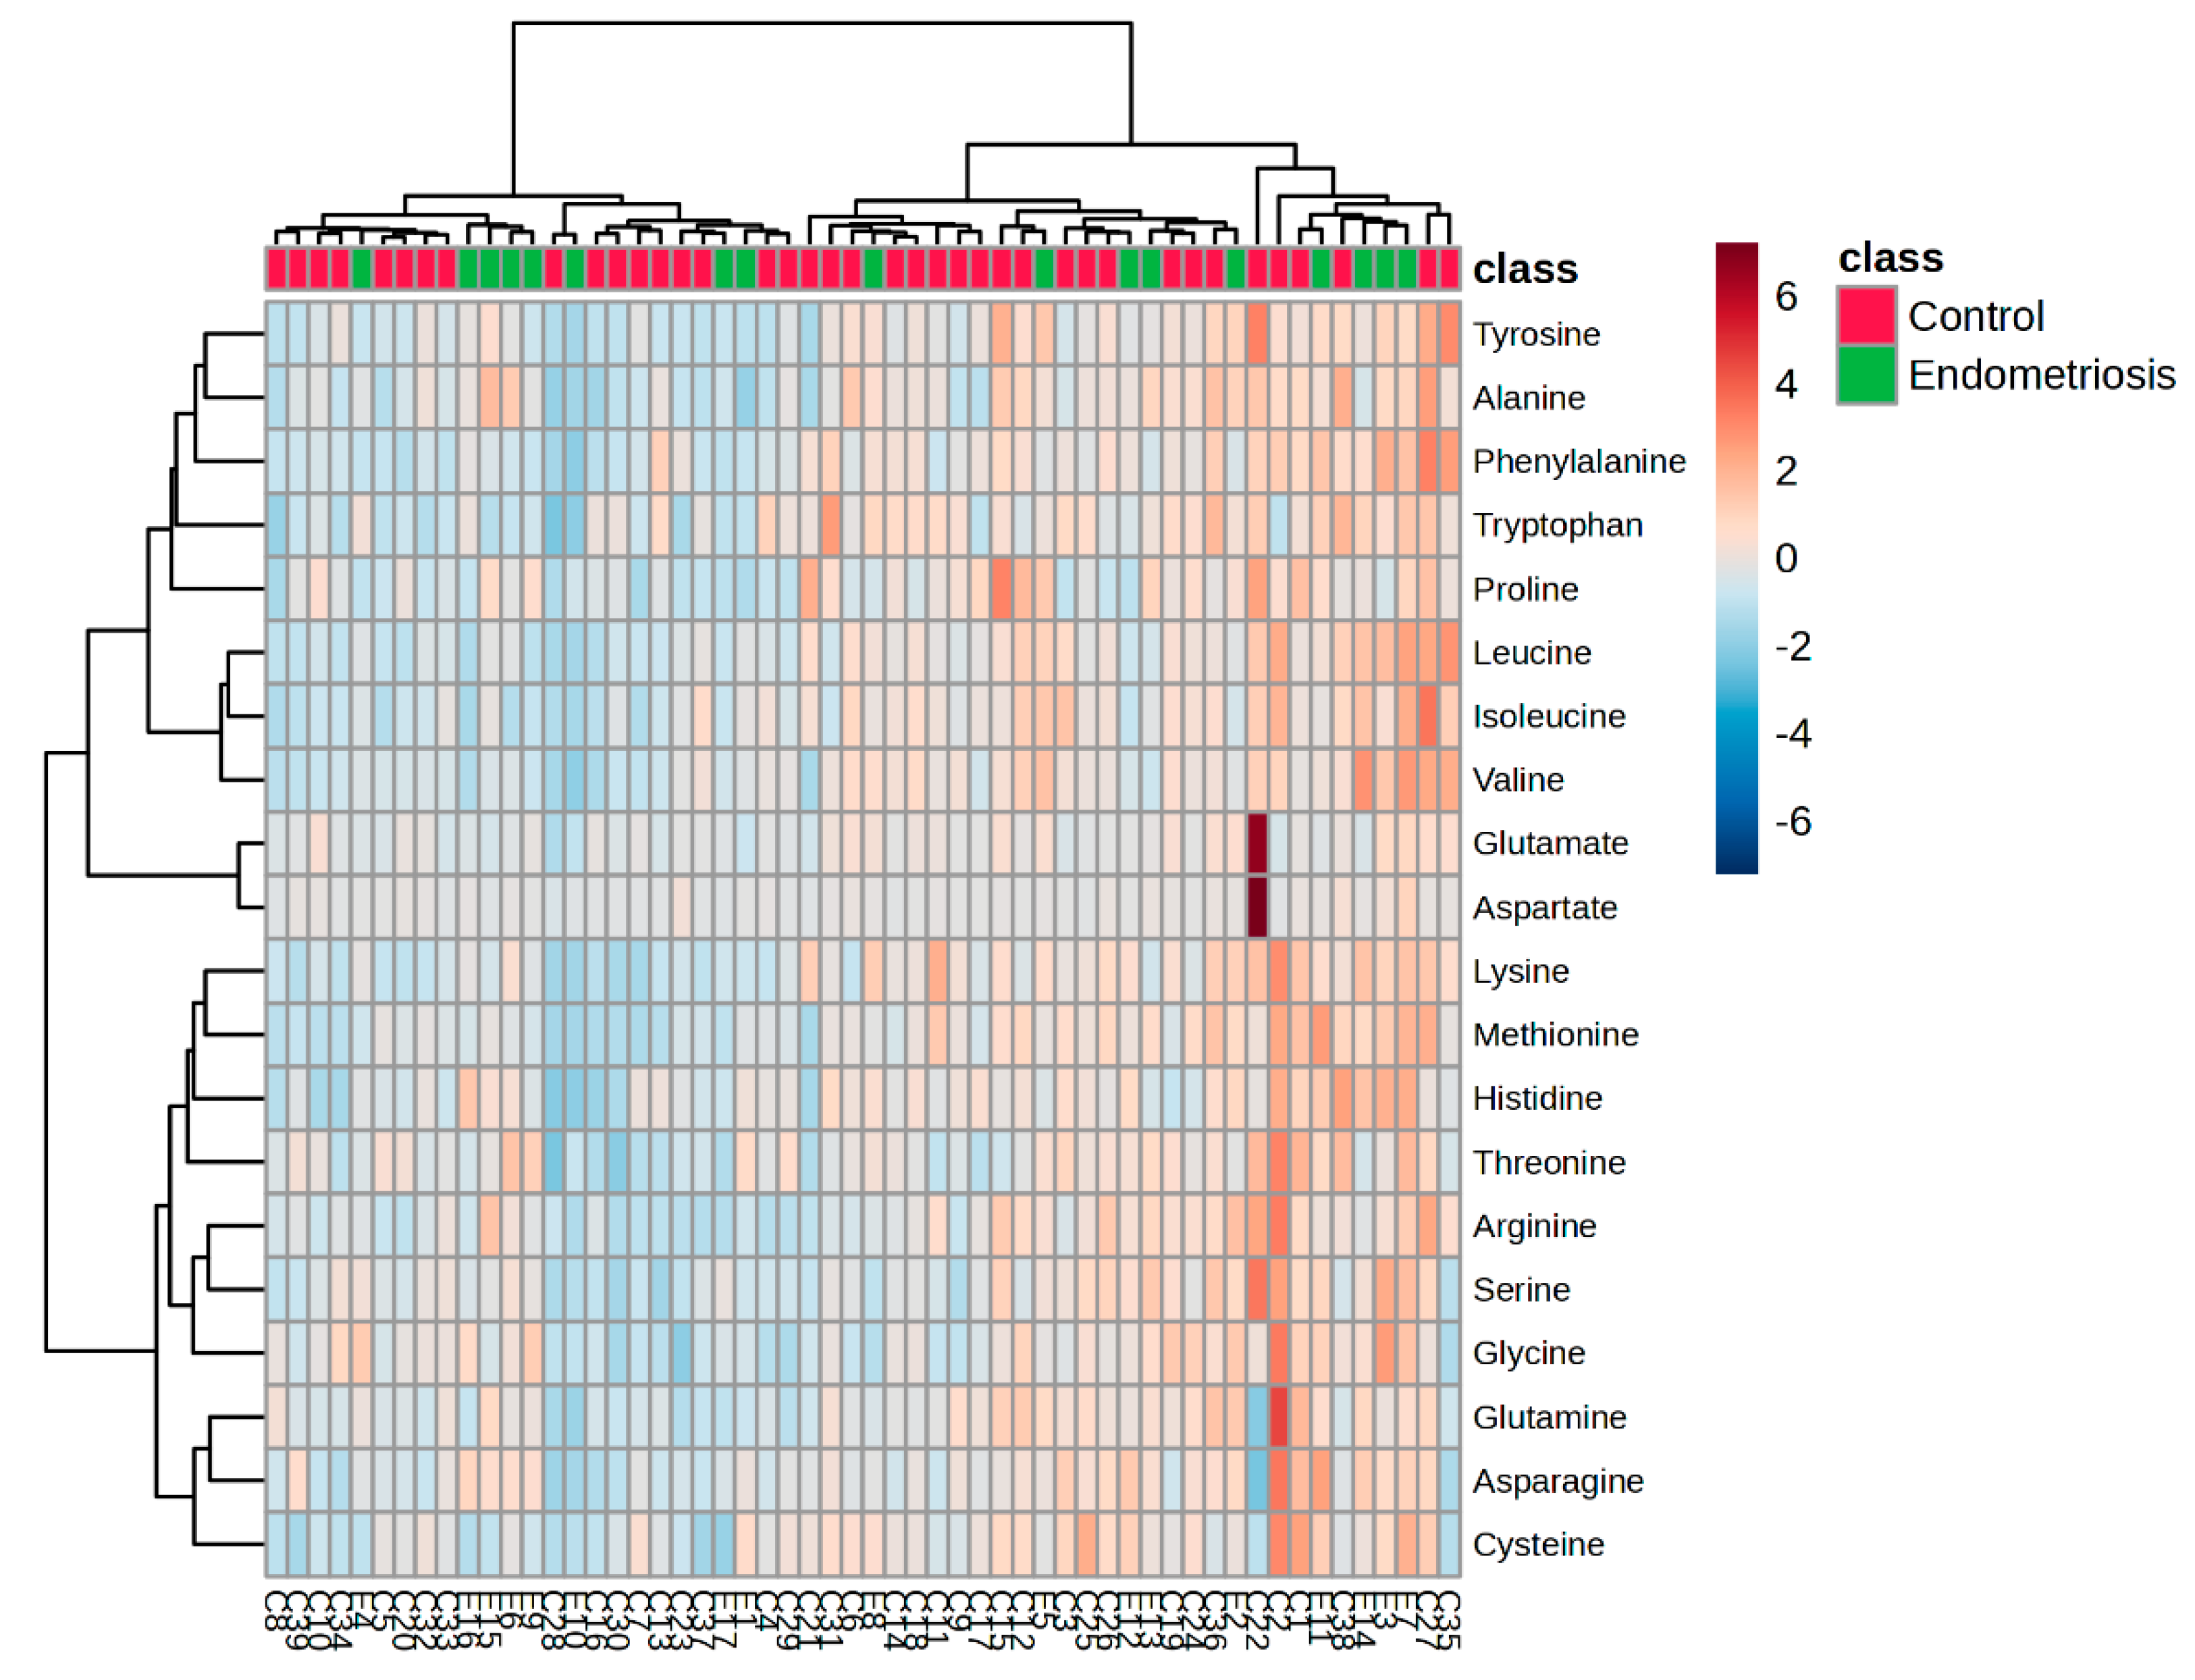
Figure 2.
PLS-DA scores plot based on FF amino acid profiles.
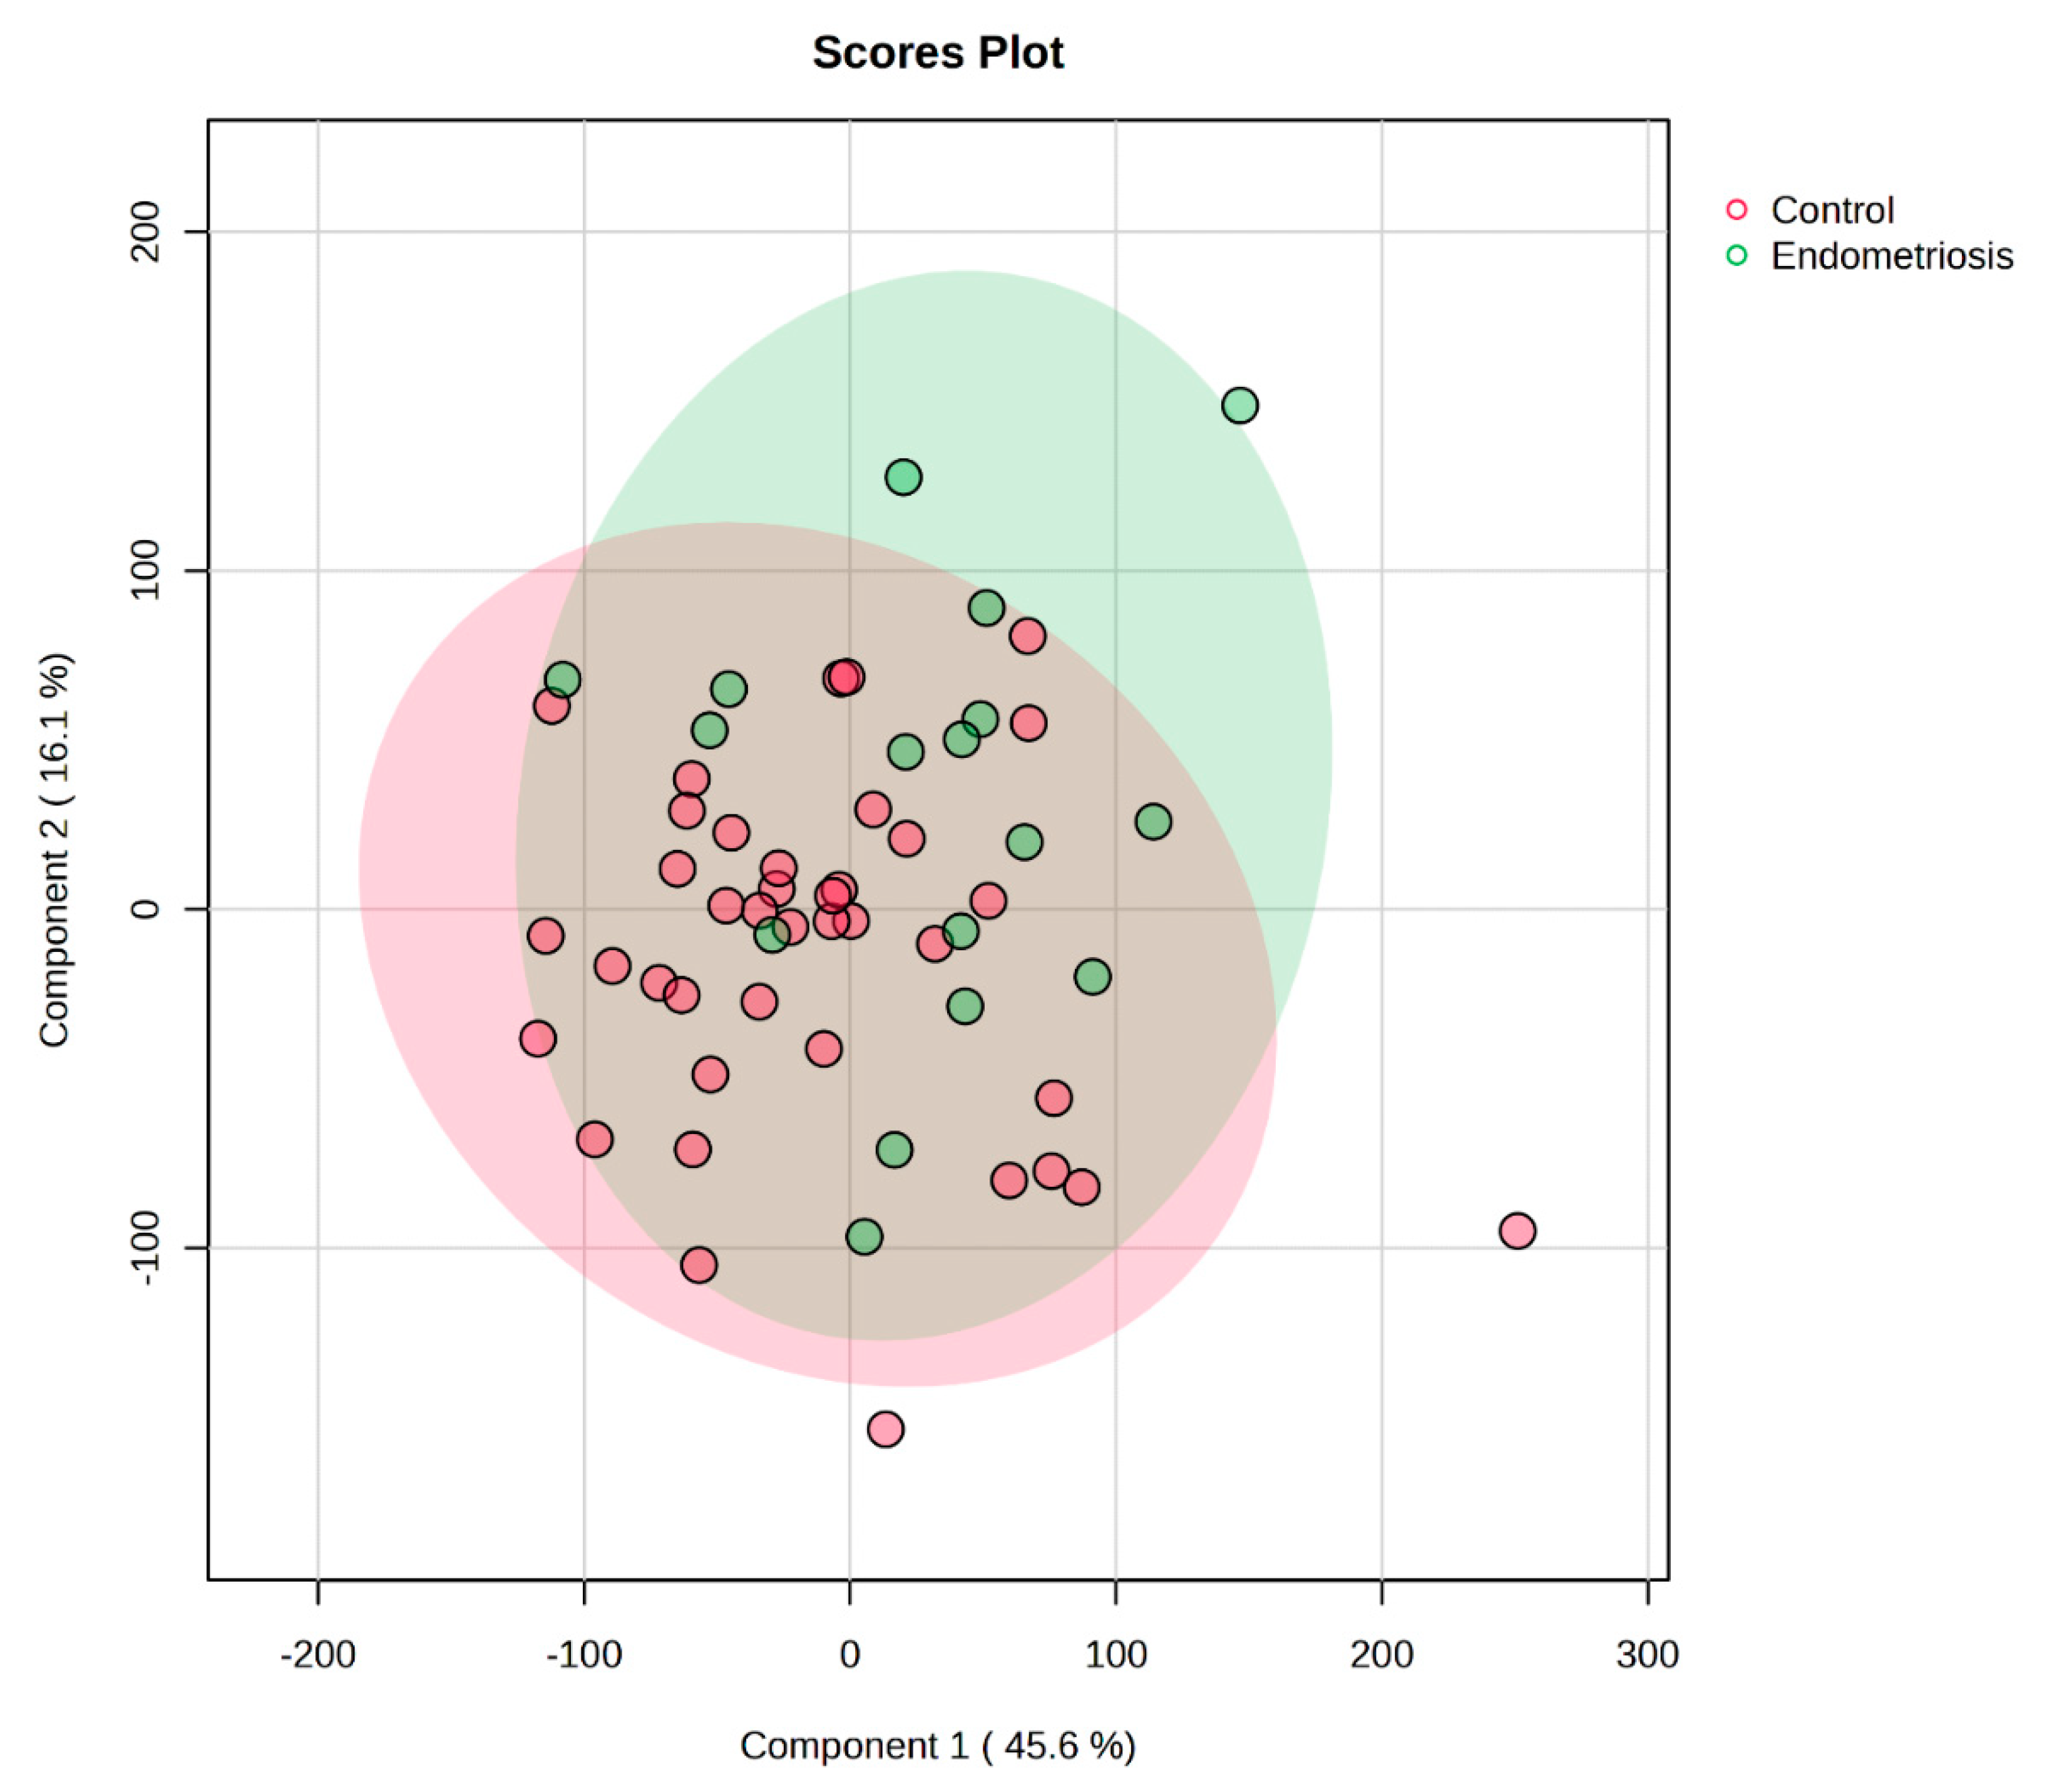
Figure 3.
Dot plot illustrates the top 25 significantly enriched metabolic pathways identified by MSEA.
Figure 3.
Dot plot illustrates the top 25 significantly enriched metabolic pathways identified by MSEA.
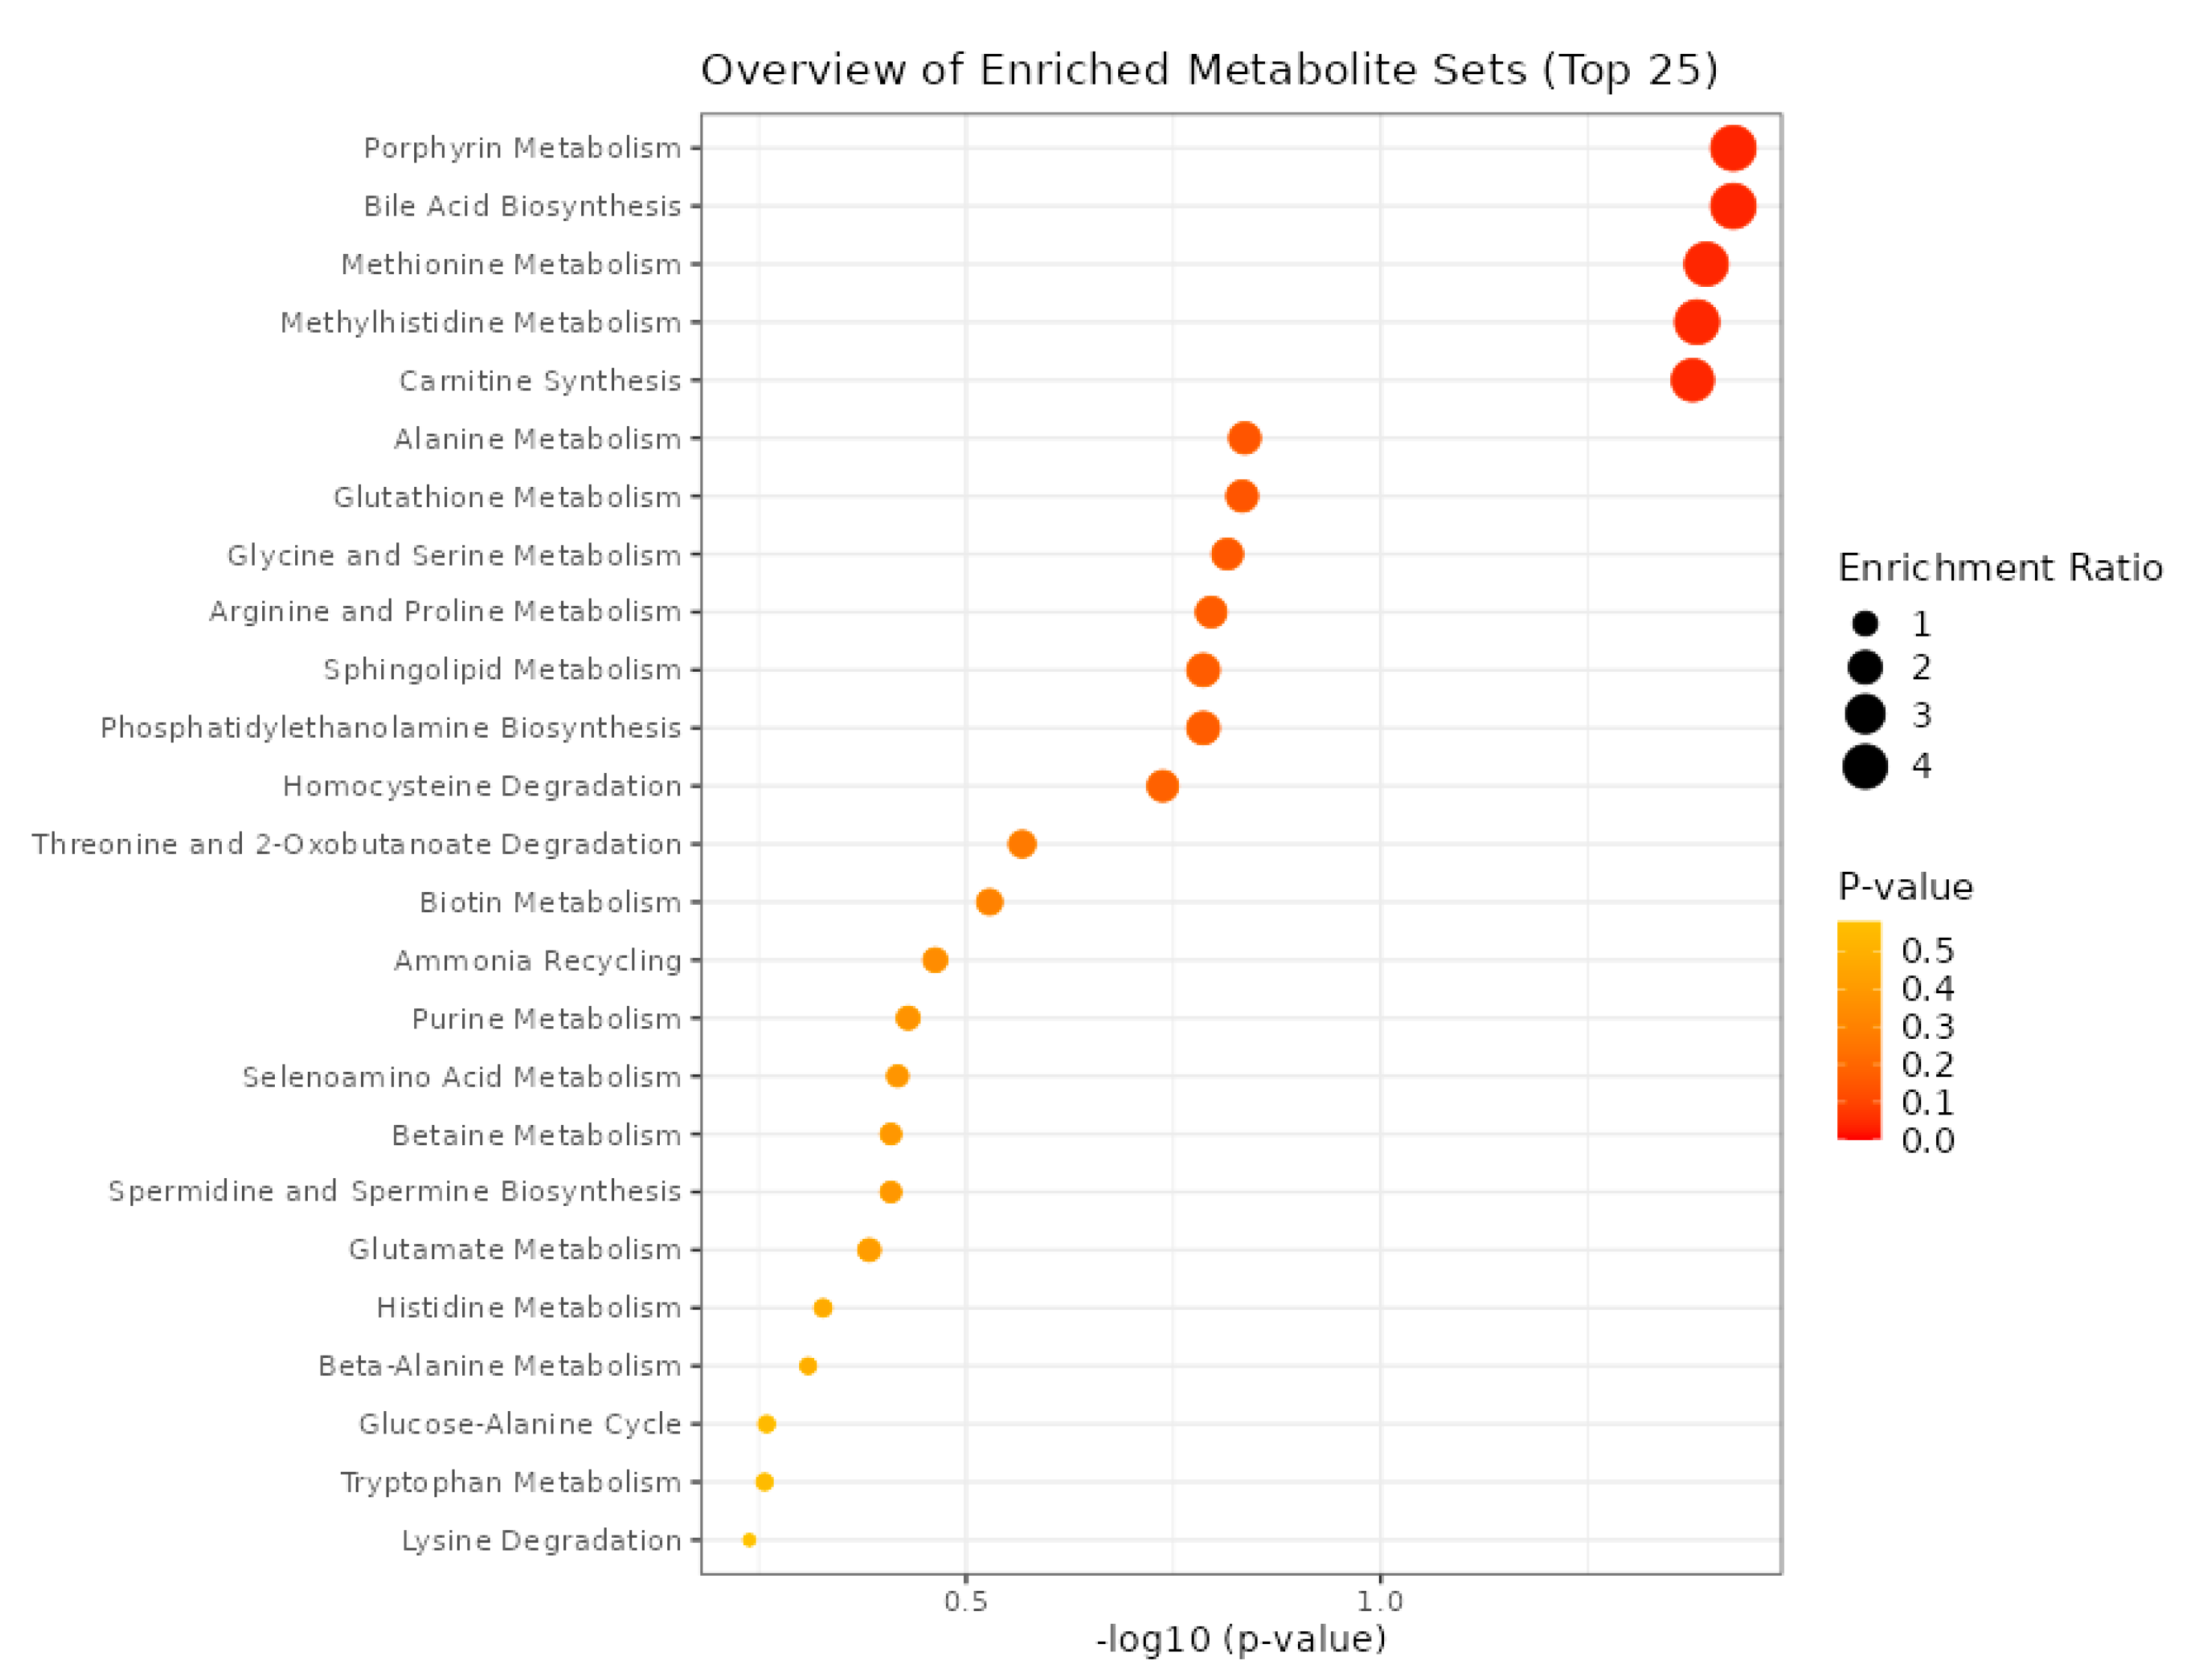
Figure 4.
ROC Curve and Boxplot for Asparagine
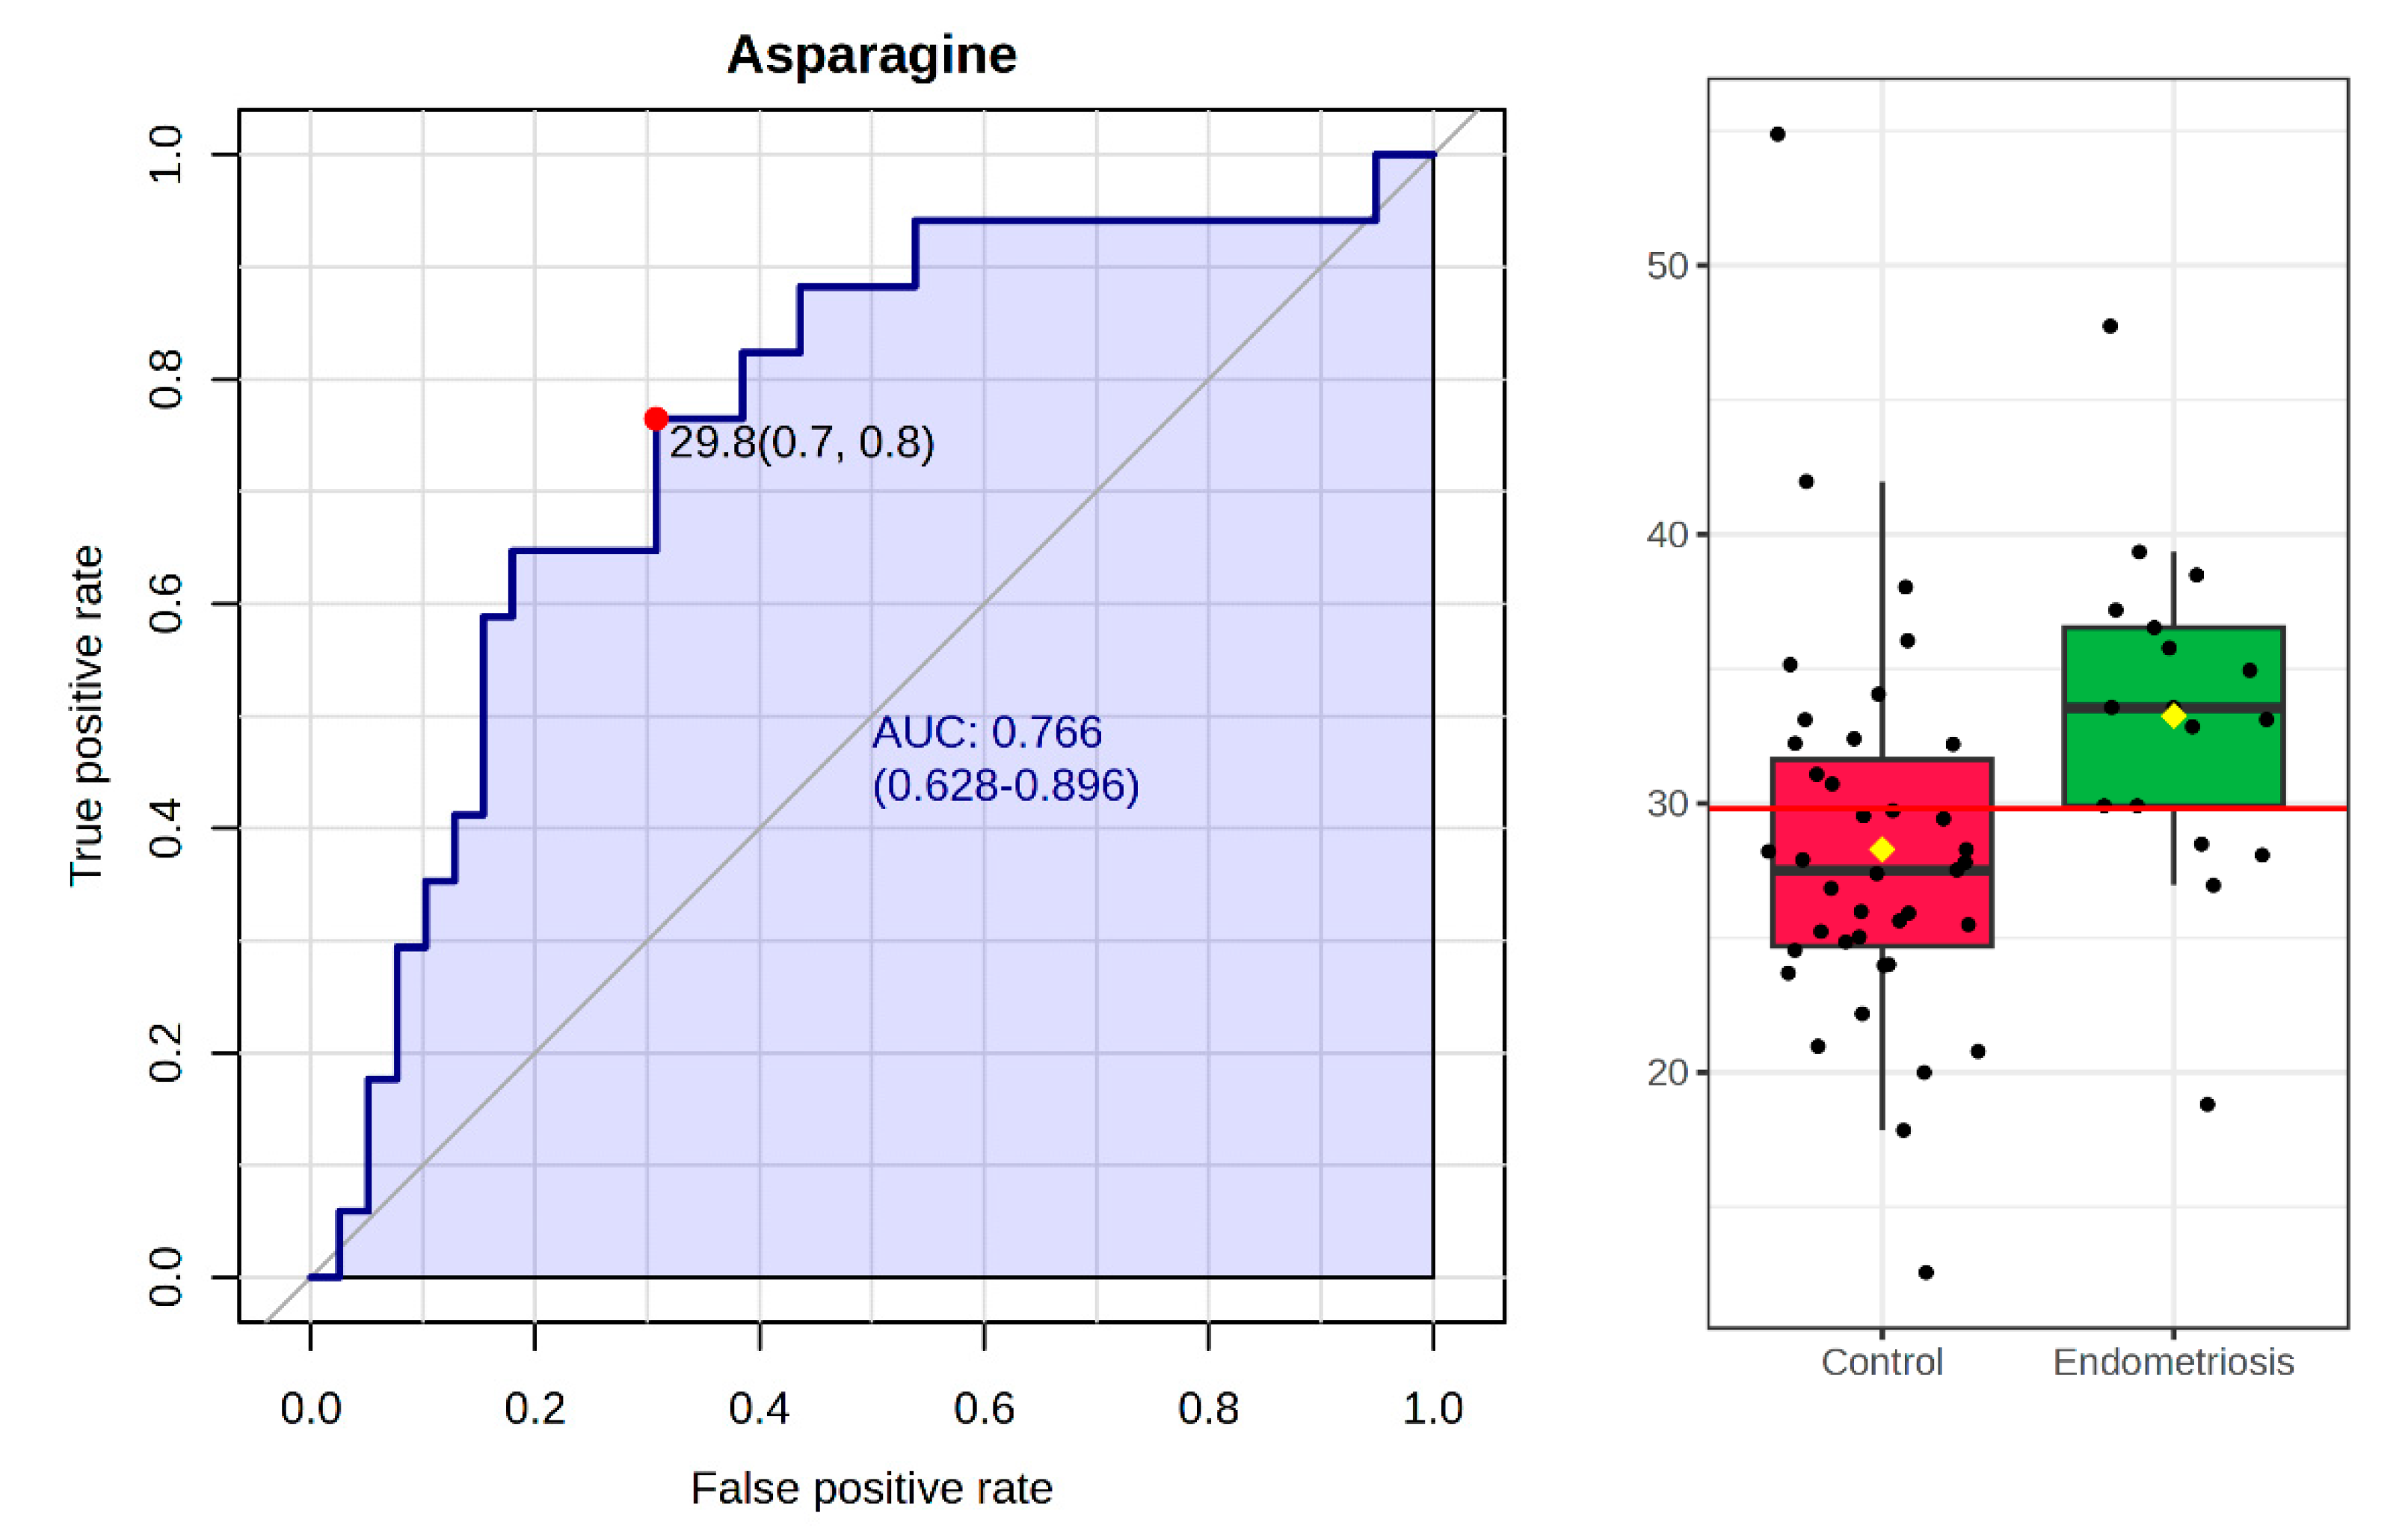
Figure 5.
Pathway analysis of amino acid profiles in follicular fluid from EM and control patients.
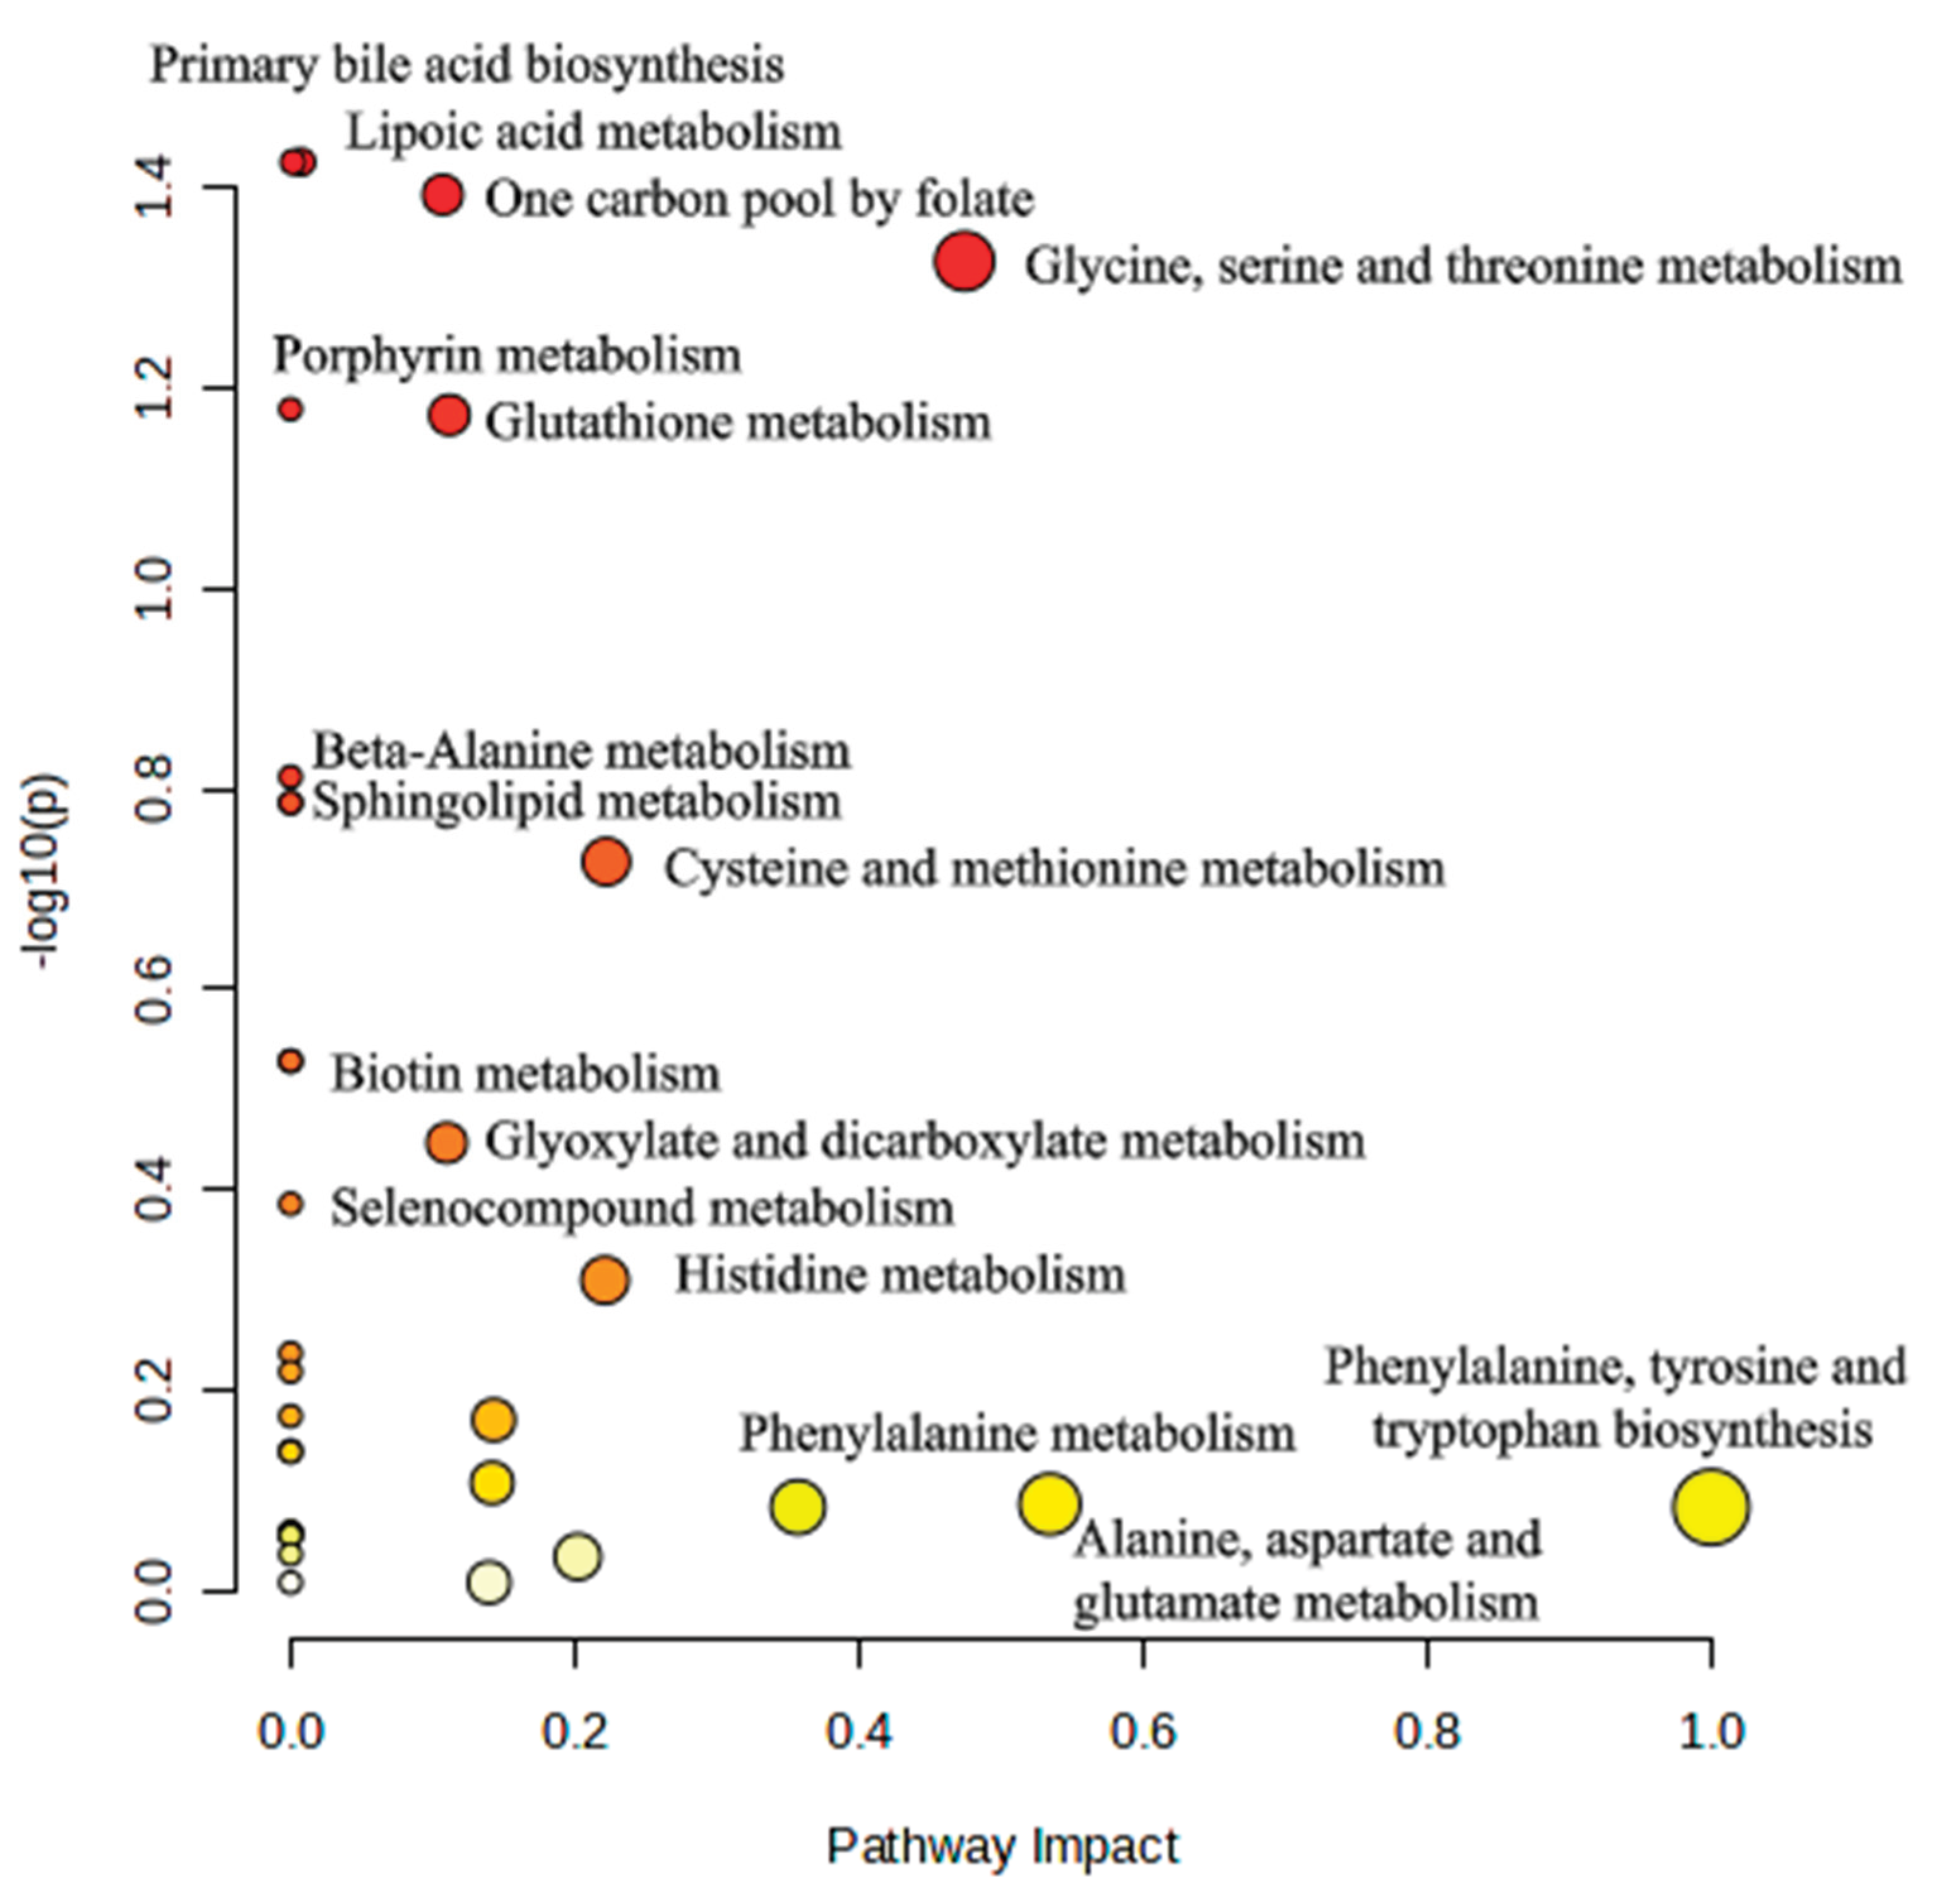

Table 1.
Clinical characteristics of the patients in the EM and in control groups.
| Endometriosis [Mean ± SD] (n=17) |
Control [Mean ± SD] (n=39) |
|
| Age | 35.14 ± 4.34 | 33.26 ± 4.18 |
| BMI | 22.87 ± 5.71 | 25.29 ± 5.66 |
| Number of oocytes retrieved | 8.13 ± 4.49 | 10.49 ± 6.66 |
| Number of fertilized oocytes | 3.18 ± 2.00 | 3.89 ± 3.91 |
| Number of IVF cycles | 1.94 ± 0.93 | 1.86 ± 1.38 |
| Baseline estradiol | 2954.44 ± 749.75 | 2426.51 ± 912.06 |
| FSH dose during stimulation | 1083.94 ± 1430.84 | 1417.31 ± 1382.14 |
| Cause of infertility | ||
| Male factor | - | 26 (66.66 %) |
| Female factor | 15 (88.23%) | 8 (20.51 %) |
| Combined male-female | 2 (11.76%) | 5 (12.82 %) |
Table 2.
Mean concentrations (± standard deviation) of 20 amino acids in FF samples.
| Endometriosis [Mean ± SD] µmol/L |
Control [Mean ± SD] µmol/L |
|
| Aspartate | 7.01± 4.28 | 8.45 ± 16.49 |
| Glutamate | 63.35 ± 20.85 | 69.67 ± 47.92 |
| Asparagine | 33.25 ± 6.28 | 28.29 ± 7.12 |
| Serine | 57.31 ± 15.84 | 50.09 ± 18.28 |
| Glutamine | 350.41 ± 72.65 | 346.30 ± 101.53 |
| Histidine | 58.95 ± 13.26 | 51.71 ± 11.33 |
| Glycine | 178.58 ± 51.28 | 147.43 ± 49.84 |
| Threonine | 109.51 ± 23.00 | 100.46 ± 29.82 |
| Arginine | 34.85 ± 11.00 | 33.16 ± 13.65 |
| Alanine | 240.32 ± 56.45 | 226.05 ± 60.46 |
| Tyrosine | 30.82 ± 8.45 | 30.75 ± 11.26 |
| Cysteine | 20.09 ± 6.56 | 20.40 ± 6.66 |
| Valine | 134.37 ± 53.51 | 128.41 ± 34.81 |
| Methionine | 16.81 ± 4.39 | 15.75 ± 4.10 |
| Tryptophan | 47.65 ± 5.92 | 48.44 ± 6.70 |
| Phenylalanine | 38.52 ± 9.65 | 40.04 ± 9.21 |
| Isoleucine | 27.22 ± 9.19 | 29.42 ± 8.82 |
| Leucine | 54.74 ± 20.94 | 54.74 ± 18.48 |
| Lysine | 89.35 ± 21.57 | 81.89 ± 25.42 |
| Proline | 143.05 ± 42.37 | 150.10 ± 54.00 |
Table 3.
Results of the comparison across various parameters. Each number represents the corresponding p value. Statistically significant values (p < 0.05) are marked with asterisk.
Table 3.
Results of the comparison across various parameters. Each number represents the corresponding p value. Statistically significant values (p < 0.05) are marked with asterisk.
| Significance (p) values | ||||
| EM/CG | BMI | Age | Outcome | |
| Aspartate | 0.515 | 0.177 | 0.967 | 0.314 |
| Glutamate | 0.599 | 0.069 | 0.755 | 0.142 |
| Asparagine | 0.002* | 0.018* | 0.651 | 0.212 |
| Serine | 0.06 | 0.921 | 1 | 0.755 |
| Glutamine | 0.493 | 0.208 | 0.384 | 0.755 |
| Histidine | 0.049* | 0.431 | 0.332 | 0.076 |
| Glycine | 0.025* | 0.42 | 0.033* | 0.350 |
| Threonine | 0.173 | 0.48 | 0.56 | 0.612 |
| Arginine | 0.368 | 0.651 | 0.48 | 0.810 |
| Alanine | 0.25 | 0.273 | 0.393 | 0.838 |
| Tyrosine | 0.493 | 0.135 | 0.663 | 0.482 |
| Cysteine | 0.908 | 0.474 | 0.954 | 0.702 |
| Valine | 0.922 | 0.042* | 0.576 | 0.386 |
| Methionine | 0.465 | 0.758 | 0.712 | 0.402 |
| Tryptophane | 0.782 | 0.556 | 0.576 | 0.281 |
| Phenylalanine | 0.605 | 0.436 | 0.495 | 0.412 |
| Isoleucine | 0.222 | 0.13 | 0.332 | 0.515 |
| Leucine | 0.88 | 0.265 | 0.657 | 0.769 |
| Lysine | 0.151 | 0.863 | 0.818 | 0.587 |
| Proline | 0.838 | 0.25 | 0.44 | 0.551 |
Disclaimer/Publisher’s Note: The statements, opinions and data contained in all publications are solely those of the individual author(s) and contributor(s) and not of MDPI and/or the editor(s). MDPI and/or the editor(s) disclaim responsibility for any injury to people or property resulting from any ideas, methods, instructions or products referred to in the content. |
© 2025 by the authors. Licensee MDPI, Basel, Switzerland. This article is an open access article distributed under the terms and conditions of the Creative Commons Attribution (CC BY) license (http://creativecommons.org/licenses/by/4.0/).
Copyright: This open access article is published under a Creative Commons CC BY 4.0 license, which permit the free download, distribution, and reuse, provided that the author and preprint are cited in any reuse.


