
Submitted:
09 June 2024
Posted:
11 June 2024
You are already at the latest version
Abstract
Shared e-scooters are gaining popularity as a solution for first and last-mile connectivity in urban areas. This study conducted in Doha, Qatar, aimed to understand how weather and land use patterns affect e-scooter usage, utilizing various datasets. Given the novelty of micromobility systems in Qatar and their sensitivity to the local hot and humid climate, the study employed a comprehensive analytical approach. Analysis revealed that e-scooter demand spikes on weekends, particularly in the afternoon. Influential land use factors include proximity to universities and employment centers, while a higher presence of Qatari females in an area correlates with reduced usage, pointing to cultural influences. Weather conditions, especially humidity and extreme temperatures, significantly impact e-scooter demand. The study employed the Density-Based Spatial Clustering of Applications with Noise (DBSCAN) algorithm for trip clustering and the Random Forest (RF) algorithm to model trip counts, considering temperature and humidity. Insights showed humidity as a critical predictor of hourly e-scooter trip counts. These findings underscore the importance of considering weather, land use, the relationship between land use characteristics and weather variations, and finally cultural factors in optimizing e-scooter services. By integrating data analysis and machine learning, the study offers valuable insights for enhancing urban mobility and transportation planning in GCC countries, promoting sustainable urban mobility.
Keywords:
first-/last-mile transport
; shared e-scooters
; urban mobility planning
; policy development
; weather impact
1. Introduction
Despite the lack of a formal definition, ‘micro-mobility’ often refers to light, environmentally friendly, and slow-moving individual transit modes suitable for short trips of fewer than five kilometres. According to [1] study, e-scooters are a micro-mobility mode that could attract users for short-distance trips and replace private vehicles, which contribute to traffic and environmental issues. Therefore, e-scooters can bridge the gap by providing first and last-mile solutions for public transport users [2,3,4,5,6,7]. Moreover, a combination of e-scooters and bicycles, along with public transportation, and walking can contribute to a car-free mobility mix [8].
Shared e-scooters represent a relatively new concept where individuals can utilize e-scooters by joining a group that manages a fleet of these vehicles at various locations. Due to its minimal capital investment requirements, practicality, competitive prices, eco-friendliness, and ease of access, this mode of transportation has gained popularity, and demand increasing significantly over the past years. For instance, approximately 40 million e-scooter rides were reported in the United States in 2018 [9,10], a figure 3.6 times higher than that of bike-sharing programs. The number of rides in 2019 surged to 86 million, doubling the previous year’s total [11]. According to a study [12], in the absence of e-scooters, 39% of riders would have opted for cabs or ride-hailing services, 33% would have chosen to walk, and 7% would have used public transportation. In Portland, a survey revealed that 36.3% of individuals would have walked and 8.7% would have taken public transport for their last-mile journey; this suggests that e-scooters are likely to replace both walking and public transportation rides [13]. The number of e-scooter-sharing services is expected to grow from 774,000 to 4.6 million [14].
Qatar is characterized by its extreme environmental conditions and its Islamic and Arabic culture. Therefore, studying the Qatar case is important to understand the impact of climate and cultural factors on e-scooter use and demand patterns in such countries. The rising popularity of shared e-scooters in urban mobility prompts a closer examination of their usage patterns. This study examines how weather, land, and cultural factors affect e-scooter demand. The impact of spatial and temporal dynamics of e-scooters on the urban environment is influenced by various factors, such as climatic conditions and urban design, including intersection and multimodal network density. These play a significant role in integrating e-scooters with public transportation systems [5]. Population density is an important feature positively associated with e-scooter usage, while the population owning motor vehicles is negatively associated with shared e-scooter trips [15]. Additionally, the effect of humidity is more important than precipitation in predicting the hourly e-scooter trip count [16]. The presence of e-scooters also contributes to altering the visual landscape of urban transportation and land use, especially in city centres [17]. A deep understanding of these spatial and temporal usage patterns of e-scooters is crucial for urban planners, city authorities, and micromobility companies.
Islamic and Arabic culture may have a significant influence on the usage of micro-mobility modes due to Islamic values and beliefs in shaping attitudes and behaviours related to micro-mobility use. Additionally, emphasized the importance of residential contexts in shaping high-mobility behaviors [18].
This burgeoning phenomenon raises critical questions that remain largely unexplored. While existing studies have delved into various facets of e-scooter sharing, significant gaps persist in our understanding, particularly regarding the spatial and temporal dynamics of e-scooter trips in Middle Eastern countries such as Qatar. This study aims to bridge these gaps by rigorously analyzing the distinct usage patterns and their features across various localities of Qatar.
By utilizing diverse datasets across different spatial and temporal levels, this study conducts an in-depth analysis of e-scooter trip count, distance, and duration, examining how these variables fluctuate throughout the day and across different days of the week. The findings of this study highlight an understanding of how weather, land use, and cultural norms specifically affect e-scooter usage. Integrating comprehensive data analysis with insights into cultural and environmental factors, this study enhances our understanding of e-scooter usage patterns in Qatar. Additionally, findings from this study hold the potential to offer valuable insights for other Gulf Cooperation Council (GCC) countries that share similar climatic and cultural contexts akin to those found in Qatar, thereby aiding in the formulation of informed policies and strategies tailored to such environments.
Significance of E-Scooters Usage
Early investigations into the global utilization of e-scooters consistently demonstrate their positive impact on enhancing transportation networks, particularly for short-distance travel [8,17,20]. However, several concerns have emerged in connection with e-scooter usage, including issues pertaining to safety, inadequate infrastructure and urban planning, environmental impacts, user behaviour, and attitudes, as well as governmental oversight. Moreover, comprehensive research conducted in various urban settings, encompassing a range of weather conditions, has unveiled the heightened susceptibility of e-scooter usage to temperatures below freezing and instances of snowfall, highlighting their sensitivity in adverse weather conditions compared to rainy environments [15]. Conversely, in nations characterized by elevated temperatures and high humidity levels, market penetration studies have highlighted the critical role of climatic factors. Such conditions can hinder outdoor activities, consequently diminishing the appeal of e-scooters as a preferred mode of transportation for individuals [19]. The impact of humidity on e-scooter usage outweighs the influence of precipitation when predicting the hourly e-scooter trip count, indicating that heightened levels of humidity may deter individuals from opting for e-scooters [5]. Therefore, the adoption and utilization of shared e-scooters as a mode of urban transportation are influenced by complex environmental, technological, and socio-economic dynamics. Studies have shown that the environmental impacts of shared e-scooters are influenced by factors such as the life span of the scooters, the number of kilometres travelled per day, and the frequency of collection and distribution processes [20]. Additionally, the pricing strategy for e-scooter rentals plays a pivotal role in shaping user preferences towards this mode of transport, potentially encouraging a reduction in car dependency [16]. The research emphasizes the importance of further investigations comparing the effects of e-scooters with alternative transportation methods, including public transit, walking, and biking. This comparative analysis would provide a comprehensive perspective on the role of e-scooters in shaping urban mobility patterns and influencing land use decisions. Such studies are crucial for understanding the broader impact of e-scooters in the context of urban transportation ecosystems.
The successful integration of e-scooters with public transportation is dependent on various aspects such as climatic conditions, design elements, the density of multimodal networks, and safety considerations [21]. The study suggests that future research would benefit from more detailed individual-level data, like survey responses or tracking data, to enhance the analysis. This approach would enable a more in-depth examination of personal attributes and their specific impact on e-scooter usage, thereby offering a deeper insight into the underlying dynamics and improving the reliability of the research findings.
A study highlights the influence of various factors on the adoption and use of shared e-scooters, including user demographics, perceptions of safety, risk tolerance, and openness to technological innovations [22]. It underscores the need for employing more objective methodologies, such as gathering direct data on e-scooter usage or conducting observational studies on riding behaviour, to gain more accurate and reliable insights. Additionally, the research points to the necessity of exploring the impact of different regulatory frameworks and cultural attitudes towards e-scooter use in diverse urban settings. This exploration is crucial for understanding how these elements shape e-scooter adoption and utilization patterns. This study aims to address gaps identified in the aforementioned studies.
A key recommendation from the study is segmenting e-scooter users and non-users into distinct groups based on their riding frequency, such as weekly users, occasional riders, or non-users. This detailed categorization promises to unveil a more nuanced understanding of various user profiles and their specific motivations for using or abstaining from e-scooters.
These findings emphasize the importance of considering a comprehensive array of factors in the promotion and management of shared e-scooter systems. By doing so, these systems can be more effectively integrated as a sustainable option in urban transportation networks, catering to diverse user needs and preferences.
Drawing on theories from environmental psychology, urban planning, and technology adoption, this study hypothesizes that both weather conditions and land use characteristics implicitly influence e-scooter usage patterns. The Theory of Planned Behavior (TPB) suggests that individual mobility decisions result from behavioural intentions, which are shaped by attitudes, subjective norms, and perceived control [23]. Within this framework, weather conditions and land use are considered external factors that can affect the perceived ease of use and utility of e-scooters, thereby influencing adoption and usage rates [24,25].
Based on the theoretical background mentioned above, the following hypotheses are proposed:
- Weather variations, including temperature, humidity, and precipitation, have a significant impact on the daily count of e-scooter trips. Specifically, more favourable weather conditions will correlate with higher usage rates [26]. As shared e-scooter services are rapidly gaining global adoption, conducting comprehensive research becomes imperative. This is particularly true in regions characterized by high temperatures and humidity where studies are currently lacking. Extensive research must be performed to analyze the spatial and temporal elements influencing shared e-scooter services [21,22].
- Land use characteristics, such as proximity to commercial centres, residential areas, and public transport hubs, significantly influence the spatial distribution of e-scooter trips. Areas with higher accessibility and mixed-use development are expected to impact e-scooter trip density and usage distance/length [27]. The influence of land use on e-scooter utilization is significant, particularly in urban centres [16]. The patterns of e-scooter usage, both spatially and temporally, are closely linked to the built environment and social factors. For example, areas near universities and downtown locales typically see a surge in e-scooter trips, whereas usage tends to be more spread out during early morning and night hours, becoming more concentrated during midday and evening [28]. Key factors boosting e-scooter usage include population density, a mix of different land uses, and the availability of bike-share stations and bicycle lanes. These insights underscore the importance of land use characteristics, in shaping the accessibility and patterns of e-scooter use.
- The relationship between weather variations and land use characteristics moderates the relationship between these variables and e-scooter usage patterns. For instance, the negative impact of adverse weather conditions on e-scooter usage might be less pronounced in areas with high accessibility to public transport or commercial centres [29]. Existing research in urban areas with varying weather conditions indicated that countries with high temperatures or humidity could critically influence market penetration. For example, such conditions can inhibit outdoor activities, making e-scooters a less desirable mode of transportation. The effect of humidity is more significant than precipitation in predicting the hourly e-scooter trip count, suggesting that high humidity levels may discourage e-scooter use [5].
Considering Qatar, an Islamic and Arab country, the introduction of e-scooters warrants investigation. Such an investigation aims to comprehend the intricate interplay between climate and cultural factors and their influence on e-scooter utilization and the underlying demand dynamics in countries with similar climatic and environmental contexts.
To test the hypotheses given above, the study employs a mixed-methods approach that combines quantitative analysis of trip data, weather records, and land use mapping with qualitative insights from user surveys. Generalized Linear Mixed Models (GLMMs) are utilized to analyze the influence of weather conditions and land use characteristics on e-scooter trip counts, controlling for temporal variations and random effects associated with different urban zones [30]. Additionally, a machine learning algorithm, specifically Random Forest, is applied to identify the relative importance of various predictors and to model complex interactions between them [31].
The findings of this study are expected to contribute to the theoretical understanding of shared micro-mobility usage patterns, integrating perspectives from urban mobility, environmental psychology, and technology adoption frameworks. By elucidating the roles of weather and land use in shaping e-scooter mobility, this research extends the TPB by incorporating the effects of environmental and urban planning factors on behavioural intentions related to micro-mobility [25,29]. Furthermore, the developed models from this study would assist the operators in optimizing fleet utilization/distribution by considering weather conditions over the year and land use characteristics. Moreover, considering its characteristics, policymakers would benefit from this study for regulating shared e-scooter services and authorizing licenses to operate for various regions. In addition, gaining insight into the variables that influence e-scooter utilization and usage is essential for properly implementing this new technology and will also be helpful for the future planning and strategic deployment of last-mile connectivity.
The paper is divided into five sections: the introduction is followed by a literature review which includes a section detailing earlier research on the impact of weather conditions on e-scooter rides, global trends and GCC insights of e-scooters, and demand prediction studies of e-scooters. The third section represents the methodology, data collection, and proposed model. The fourth section briefly explains the data analysis and research questions. Finally, the paper summarizes the main conclusions, implications, limitations, and suggestions for future research.
2. Literature Review
Research studies have investigated e-scooter utilization across various cities, providing valuable insights into the significance of local contextual factors [32,33]. A study [32] explored the perception of e-scooter systems in Riyadh, Saudi Arabia, finding that there is a willingness to use e-scooters among respondents, particularly among ride-hailing users who show a higher willingness. Another study [16] indicated that the rental fees of e-scooters play an important role in influencing user willingness to use this mode of transportation. Some studies also highlight the influence of socio-economic factors and attributes of e-scooter adoption. For instance, research [34] showed a direct correlation between density and increased e-scooter utilization in highly populated areas.
In the Gulf countries, certain obstacles such as cultural norms, weather conditions, and socio-economic positions play an important role in mobility choices. Additionally, factors such as geography, energy supply mix, transportation infrastructure, and the travel habits of the population all affect transportation [35]. Furthermore, Qatar relies more on private cars than on public transit, with Qataris vastly preferring private cars due to convenience, privacy, and accessibility. The use of public transit throughout the country is relatively low [36]. [37] pointed out that individual dependency on automobiles, lifestyle, and cultural factors are major setbacks to using Qatar’s metro system. Ride-hailing services are in high demand, especially in urban areas, as they offer convenient and affordable commuting options, particularly for people who do not have access to a private vehicle. Active modes, such as walking and cycling, are not common in Arab countries due to the extreme heat at least six months of the year. In other words, travel mode choice in Arab countries is influenced by weather, availability of infrastructure, cultural preference, and financial resources.
Nevertheless, Qatar and the UAE have invested in e-scooter-sharing programs to promote an active lifestyle. For instance, the UAE has built dedicated cycling infrastructures to encourage active modes of transport, and Qatar has made investments to some extent.
2.1. E-Scooters in Urban Mobility: Global Trends and GCC Insights
E-scooters have become a familiar sight in cities worldwide in recent years. [38] indicated that e-scooters could help European cities ease their increasing problems with traffic, emissions, and parking shortages. Shared e-scooters are one of the fast-growing mobility options in Mediterranean cities [39]. Nevertheless, it is crucial to take into account the specific contextual factors in each locality that might influence the adoption of e-scooters. Understanding how local variables influence the utilization of e-scooters is essential for policymakers and urban planners to successfully incorporate e-scooters into transportation networks.
E-scooters have received favourable feedback from users and offered a reliable substitute for private vehicles for short trips over the past decade [1,17,41]. For example, e-scooters in Germany were widely accepted as leisure or fun moving objects [40]. In the United States, a model developed by [41] estimated that 32% of carpool trips in Manhattan, New York can be replaced by e-scooters. In Thessaloniki, Greece [6], the analysis of e-scooter usage revealed that e-scooters substituted walking and public transit rides. Likewise, a survey on e-scooter use conducted in Vienna, Austria found a similar trend [13]. In GCC countries such as Riyadh, and Saudi Arabia, [31] researched the preference for e-scooter usage and found that 75% of the respondents were interested. Still, some obstacles to deploying micro-mobility in the country were lack of sufficient infrastructure, weather (63%), and safety (49%) concerns. As mentioned earlier, culture is another obstacle to e-scooter use when it comes to Arabian countries. Notwithstanding, e-scooters were widely accepted, with a satisfaction rating of 76% in 2022 and 79% in 2021 in the UAE [42]. It was initiated in Dubai to ease the congestion and revolutionize the transport sector in UAE [43,44]. UAE has several shared micro-mobility programs; most of the country’s bike and scooter-sharing programs are located in Abu Dhabi and Dubai.
Over 557,000 riders used the micro-mobility service in Dubai in 2022. In 2023, additional e-scooter lanes and authorized riding places are expected to be added [42]. The Roads and Transport Authority (RTA) of Dubai announced that the e-scooters in Dubai made about one (1) million trips in 2022. The RTA added 11 new residential areas allowing the operation of e-scooters, which increases the number of districts in Dubai where e-scooters are permitted to 21. This expansion increases the overall distance of bike-only tracks from 185 km to 390 km, including internal routes in Dubai that are safe and shared for both bikes and e-scooters.
The RTA has converted more than 200 km of internal roads in Dubai into safe roads with several traffic safety features, including a speed limit reduction from 40 to 30 km/h and the installation of directional and cautionary signs to protect the safety of all road users.
[42] indicated that future studies need to understand the impact of e-scooters on urban transport systems, specifically in terms of trip purposes. Studies should also incorporate quantitative variables that influence e-scooter usage, such as weather conditions, trip purposes, etc., and use spatial correlation analysis [41]. Similar studies must be conducted in other GCC countries regarding e-scooters to understand the acceptance and satisfaction level among potential users.
2.2. The Impact of Weather Conditions on E-Scooter Usage
Recent research examined how certain weather conditions and days of the week affected particular micro-mobility services [43]. The demand for shared bicycles decreases in uncomfortable hot, cold, or rainy conditions, referring to the findings of the shared bicycle and e-bike networks in Beijing, China [1]. Similar research on the bike-share program in Washington, D.C., demonstrates that bad Weather, e.g., cold snap, precipitation, and high levels of humidity, brings about a detrimental impact on e-scooter usage [44]. Additionally, studies have discovered that the average temperature and time of the day are strong indicators of the number of bikes [45,46,47]. Table 1 indicates how sensitive e-scooter usage is to weather conditions in regions in the Middle East, Europe, North America, and Australia.
Weather impacts the attractiveness and distance of travel made by an e-scooter but not the apparent purpose of the trip [56]. According to [57], temperature has a minimal impact, while wind and rain lower the number of journeys. Higher rides per hour are associated with warmer temperatures and better visibility. On the other hand, the number of trips per hour is negatively impacted by humidity, wind speed, and precipitation [10]. Nonetheless, to gain insight into how weather may impact e-scooter riding, more case studies are to be conducted [5,39], particularly for countries with hot weather conditions. Understanding the effects of weather on e-scooter usage and demand patterns would benefit e-scooter providers and transportation regulators in setting up and adopting efficient strategies for smooth operation and resource allocation of micro-mobility, particularly in different seasons. For example, Qatar experiences long, sweltering, muggy, arid and partly cloudy summers, with generally comfortable, windy, dry, and clear winters. Temperatures usually range from 58°F to 106°F and are unlikely to fall below 51°F or rise above 112°F [58]. Therefore, such studies could be a first step toward establishing a baseline for comprehending the seasonal variance in e-scooter usage and utilization.
Gaining insights into how weather and time influence different types of trips could offer valuable guidance for policymakers and transport planners. This knowledge can assist in integrating alternative transportation options and adapting existing modes to provide protection against weather conditions [51]. [56] also highlighted that the current lack of detailed user data prevents a comprehensive analysis of how different types of users, such as women, older adults, commuters, and tourists, are affected by weather conditions. Prior research indicates that user characteristics significantly influence usage behaviour, suggesting a promising avenue for studies with access to detailed user data to explore variations within these user groups. Therefore, this paper seeks to investigate these areas, contributing to a more nuanced understanding of e-scooter usage in the GCC context.
2.3. Influence of Land Use on Transport Mode Choice
Land use has a significant influence on the utilization and success of shared e-scooters in urban areas. Shared e-scooters are often most successful in densely urban areas where there is a higher demand for short-distance transportation. Urban transport planners have welcomed e-scooters as an alternative to urban transport [42]. Especially in densely crowded urban areas, these small, eco-friendly transport modes can provide a practical and effective method of transportation.
Shared e-scooters may be more alluring if local land use regulations support mixed-use developments where residential, business, and recreational spaces are placed close together. E-scooters may be considered a daily alternative to driving for short-distance commuters in large cities [59]. By offering practical first- and last-mile options, shared e-scooters can complement existing public transportation networks and increase ridership [3,60,61]. The use of e-scooters can increase in areas close to bus stops, metro stations, and other transport hubs since commuters can easily include them in their trips. Additionally, e-scooters can enhance the suite of options available in cities to promote active transportation [62]. This mode of transport is a good strategy to reduce car dependence in many locations [63], thereby contributing to the sustainability of cities and their transport systems by providing solutions to traffic, parking issues, and emissions [38,64]. E-scooters must have access to dedicated parking spaces and charging facilities in order to be successful [65].
E-scooter use can be promoted by land use regulations that reduce traffic and give priority to alternate means of transportation. For instance, e-scooters cannot be legally ridden on the roads or in cycle lanes in the UK [66]. Therefore, dedicated e-scooter paths and bike lanes can increase safety and promote e-scooter use. The introduction of parking spaces with integrated charging facilitates can enhance the safety concerns of e-scooters, as deduced in a study by [40].
The viability and effectiveness of shared e-scooter programs are significantly influenced by land use planning. Shared e-scooters are more likely to thrive as a sustainable and practical means of transportation in urban settings that take into account variables including density, mixed-use development, accessibility, parking infrastructure, traffic management, and destination accessibility. Land use, age distribution, gender distribution, walk score, and park score impact the density of e-scooter trips in Traffic Analysis Zones (TAZs) [3,67].
Studies need to incorporate quantitative variables that influence e-scooter usage such as traffic flow, and road quality. Moreover, examining various trip attributes, including the purpose of the trip, the presence of bike/e-scooter lanes, and safety policies, could provide deeper insights. Employing spatial correlation analysis represents a promising direction for future research in this area [41]. Nonetheless, the characteristics of e-scooter trips, user patterns, and behaviours need to be further researched.
2.4. Demand Prediction Studies of E-Scooters
Better living conditions, health, education, and employment opportunities are the key contributors to urbanization. Academics and those involved in future design have introduced the smart city idea in relation to all of this [72]. Infrastructure efficiency, operations and services, utilities, energy, governance, lifestyle, business, and mobility in cities can all be improved with the idea of smart cities. Micromobility could enhance the mobility of cities by providing convenient first and last-mile connectivity to public transit [68].
Previous research on shared e-scooter use identified several factors that increase e-scooter demand, including the presence of businesses and industries, transit accessibility, mix of land uses, locations in central business districts, population density, bike scores, student-populated areas, and weather conditions—increased e-scooter demand [3,43,69,70,71].
The use of shared e-scooters [70], biking [72], and other modes of transportation is influenced by land-use and mixed land-use indices [67]. In urban contexts, e-scooter use can strengthen the role of micro-mobility services. For example, the availability of e-scooters in densely populated, walkable regions and their proximity to public transportation hubs may positively impact the increase in public transport ridership.
Tremendous research, including studies [73,74,75] has focused on using machine learning to forecast demand in bike-sharing programs. Specifically, Zhou et al. (6) employed a Markov chain model to predict daily demand for bike-sharing programs [75]. Their findings suggested that the Markov chain model outperformed other models, such as regression, neural network, and support vector machine models.
A graph convolutional network (GCN) model was developed to estimate hourly demand at specific stations within the New York City bike-sharing program [74]. Additionally, multilayer GCN, introduced by [76], was used to capture the spatiotemporal characteristics of bike demand patterns. While the GCN framework shows high predictive performance, it faces limitations due to high processing costs and the inability to incorporate data from newly introduced stations into its predefined graph structure.
This limitation impedes the GCN’s capacity to adapt to real-time changes, especially when new stations are added to the network.
[73] developed an efficient approach to estimate high-resolution e-scooter demand. The newly introduced neural recurrent neural network–decoder ERD framework significantly enhances prediction performance by reducing the mean squared error loss. This model forecasts both the identified and unfulfilled demand effectively.
[7] proposed a fully convolutional network (FCN) model, combined with a masking method and a weighted loss function, termed masked FCN (or MFCN), for predicting dockless e-scooter demand. The model effectively predicted peak time demands and off-peak needs by employing the exponential linear unit (ELU) and the hyperbolic tangent (tanh) activation functions, respectively [77]. This approach was advantageous for examining the larger spatial region of e-scooters. Table 2 provides a summary of demand prediction studies.
[78] utilized the Random Forest method to predict the usage effectiveness of shared electric scooters, employing GPS-based vehicle availability data. The study’s findings highlighted the model’s superior predictive ability, with factors like time of day and the density of Points of Interest (POIs) being highly significant. [79] conducted a study focusing on the use of e-scooters among students and staff on campus. They also employed the Random Forest model, achieving high accuracy in predicting e-scooter usage frequency. These studies, employing various machine learning and deep learning algorithms, effectively incorporate factors such as weather, time, location, and day of the week to accurately predict e-scooter demand in specific areas.
Demand prediction studies for e-scooters significantly enhance service quality and operational planning. These studies primarily focus on predicting spatiotemporal e-scooter demand, facilitating efficient relocation strategies, and informed operational decisions. Various proposed models and techniques, as discussed above, adeptly handle the sparse and fluctuating nature of e-scooter demand data. They enable precise predictions of pick-up and drop-off demands, either hourly or on a daily basis. Such accurate forecasts are crucial for optimizing e-scooter availability and distribution, thus improving user experience and solving first- and last-mile transportation issues. Moreover, identified research gaps in previous studies underscore the importance of integrating regional spatial characteristics and additional variables like weather and social events to further refine prediction accuracy [73,74]. Advanced techniques, including partial dependence plots and feature interactions, are recommended for better interpretability of machine learning models [78]. This paper contributes to the field by addressing these previously noted limitations in e-scooter demand prediction.
Micro-mobility, particularly beneficial for quick urban travel, offers a more environmentally friendly transportation alternative. However, its effectiveness is weather-dependent, suggesting a need for evolution in these modes to provide weather protection. Balancing the need for lightweight, energy-efficient mobility with the challenges of weather adaptability remains a key consideration in the ongoing development of micro-mobility solutions.

Table 2.
Overview of Studies on Demand Prediction.
| Reference | Study location | micromobility type | Demand Modelling Methods | Land Use Characteristics Considered (Yes/No) | Weather Conditions Impact Considered (Yes/No) | Days/times of the week/day |
|---|---|---|---|---|---|---|
| [80] | Netherlands | E-bike sharing | Activity Based Travel Demand Model (ABM) | No | No | Yes |
| [81] | New York City | Bike sharing | Gradient Boosting Models (GBM) | No | Yes | No |
| [69] | Austin | Shared E-Scooter | Joint Panel Linear Regression (JPLR) Model | Yes | Yes | Yes |
| [82] | Austin | E-scooter | Gradient Boosting Regression (GBM), Negative Binomial (N.B.) and A Zero-Inflated Negative Binomial Count Model (ZINB) | No | Yes | Yes |
| [50] | Kelowna, Canada | Shared E-Scooter | Zero-Inflated Negative Binomial (ZINB) | Yes | Yes | Yes |
| [83] | Istanbul, Turkey | E-Scooters | Artificial Neural Network (ANN) | No | No | No |
| [51] | Munich, Germany | Shared E-Scooter | Negative Binomial (N.B.) and Consul’sGeneralized Poisson (GP-1) RegressionRandom Forest model | No | Yes | Yes |
| [52] | Chicago | Shared E-Scooter | Random-Effects Negative Binomial (RENB) Model | Yes | Yes | Yes |
| [84] | Austin, Texas, | Shared E-Scooters/E-Bikes | Agent-Based Model (ABM) | No | No | No |
| [85] | China | Bike-Sharing | Generalized Structural Equation Model (GSEM) | Yes | No | Yes |
| [73] | South Korea | Shared E-Scooter | Encoder–Recurrent Neural Network–Decoder (ERD) | Yes | No | Yes |
| [86] | New York City | Shared-Bike | Co-Evolving Spatio-TemporalNeural Network (CEST) | Yes | No | Yes |
| [87] | Shanghai | Shared Bicycles | Integrated Nested Laplace Approximation (INLA) | Yes | No | Yes |
| [88] | Minneapolis &Louisville, U.S. | Shared E-Scooter | Kernel Density Estimation (KDE) | No | No | Yes |
| [89] | Taipei | Shared Bike | Spatial Regression Model | Yes | No | Yes |
| [90] | New York City | Shared Bikes | Zero-Inflated Negative Binomial (ZINB) Model | Yes | Yes | Yes |
| [91] | Chengdu, China | Shared Bikes | Two-StageRebalancing Model | No | Yes | Yes |
| [92] | Zu ̈rich, Switzerland | E-bike Sharing | Spatial Regression Model | No | Yes | Yes |
Table 2 reveals a significant research gap in e-scooter demand prediction within the Gulf Cooperation Council (GCC) region. Despite the introduction of e-scooters in countries like Qatar, the United Arab Emirates, Saudi Arabia, Kuwait, and Oman, there’s a noticeable lack of focused studies on their usage in these regions.
The challenging hot desert climate of the GCC presents unique obstacles to the use of electric vehicles (EVs), including e-scooters, especially during the hotter months, impacting both usage and performance. This issue is compounded by the limited charging infrastructure [93]. Understanding how e-scooter demand fluctuates during extreme weather and high humidity periods is crucial. Additionally, it’s essential to explore the influence of cultural factors in Arab countries such as Qatar on e-scooter demand and usage. This exploration should encompass societal norms, perceptions of micro-mobility, and potential barriers to adoption. Challenges also arise from the need for dedicated lanes, parking spaces, and city design conducive to e-scooter adoption.
While there is existing research on e-scooter usage globally, the unique environmental and cultural landscape of the GCC necessitates a region-specific analysis. Technological features of e-scooters and user behaviour patterns, such as trip frequency and usage regularity, are likely to exhibit significant differences in the GCC compared to other regions Thus, addressing these underexplored aspects is crucial for a comprehensive understanding of the e-scooter market in the GCC. It also has broader implications for shaping urban mobility policies, informing environmental strategies, and guiding the development of micro-mobility solutions tailored to the specific needs of the GCC region.
3. Methods
The data analysis conducted in this paper aims to address the following research questions:
- Is the average ride distance consistent across different days of the week?
- Does the average ride duration vary across different days of the week?
- Is there consistency in the daily ride count across different days of the week?
- Does the average ride distance differ across various hours of the day?
- How does the average ride duration vary throughout different hours of the day?
- Is there consistency in the daily ride count across different hours of the day?
- What are the estimated proportions of first and last-mile trips?
- How does the land use impact shared e-scooter usage or the number of rides?
- How do weather conditions impact shared e-scooter usage?
By answering the above-mentioned questions, the study aims to offer a comprehensive analysis of e-scooter ride patterns that can contribute to optimizing shared micro-mobility services and inform urban transportation policy decisions.
3.1. Data Sources for the Study
To answer the research questions, we used several datasets as follows:
- A.
- Shared E-scooter Rides in Qatar:
The shared e-scooter rides data used in this study covers the period from January 2021 to July 2022. It encompasses various attributes, including the start and end dates of each trip, the origin and destination locations, trip distance in kilometres, and trip duration in hours. The data were collected from the e-scooter-sharing service operating in Qatar.
- B.
- Weather Data:
Monthly and daily weather datasets were obtained from the weather station located at Hamad International Airport in Qatar. The data was downloaded from Weather Underground (https://www.wunderground.com/), a reliable online weather information provider.
- C.
- Traffic Analysis Zones Polygons (TAZs) and Land Use Dataset:
The study utilizes Traffic Analysis Zones Polygons (TAZs) along with their associated population and land use information. These data sets provide spatial boundaries and demographic details of different zones within the study area. The TAZs and land use dataset were sourced from the relevant local authorities and transportation agencies.
- D.
- Bus Stops Dataset:
The dataset includes the precise locations of bus stops in the public transportation network. It enables the analysis and incorporation of bus stop proximity in the study. The bus stop dataset was obtained from the respective transportation authorities responsible for managing the public transportation system.
The combination of these diverse data sources allows for a comprehensive analysis and evaluation of various factors influencing the shared e-scooter system in Qatar. Dataset A serves as the primary data source, with the additional datasets supplementing the analysis. The goal of comparing dataset A against datasets B and C is to identify the impacts of specific weather and traffic conditions influencing people’s decisions to use e-scooters. Additionally, the aim of comparing dataset A against dataset D is to determine when and how often e-scooters are utilised for first and last-mile travel by linking the locations of bus stops to e-scooter movement patterns.
3.2. Analysis Methodology
The flowchart in Figure 1 illustrates the comprehensive methodology used to provide insight into the research questions presented in this study. It outlines the key steps and processes to achieve the research objectives and obtain meaningful results. This diagram demonstrates the systematic integration of diverse datasets for a thorough e-scooter usage analysis. The colour-coded arrows represent specific datasets utilized in each phase of analysis, facilitating a clear comprehension of the data interconnections and analytical procedures. The methodology begins with raw data inputs, including weather conditions, bus stops, e-scooter usage, and TAZs with associated land use data. The diagram then demonstrates the essential steps of e-scooter data pre-processing, which precede specific analyses such as temporal data scrutiny and addressing the first and last mile problem. These datasets undergo processes like daily and hourly aggregation and are merged and clustered using DBSCAN.
Following this, Random Forest and Generalized Linear Mixed Effects (GLME) models are applied to analyse specific aspects, such as the impact of weather conditions on the trip count and land use. The analysis is further enriched by marking the importance of features and using partial dependence plots to better understand the relationship between the response under study and the individual features.
3.2.1. Trip Data Pre-Processing
The e-scooter raw dataset includes 141,411 trips. To ensure the accuracy of the data for the predetermined analysis, a validation check was conducted by inspecting the trip distance, speed, position, and date. We excluded trips that met one or more of the following conditions:
- The trip distance is shorter than 100m
- The average trip speed is less than or equal to 4 km/h
- The origin or destination position information is inaccurate
- The date of the trip is incorrect
Furthermore, we inspected the total number of daily trips and removed days with fewer than ten trips per day. This process reduced the dataset to 71,953 trips out of the original 141,411 trips. Having undergone thorough processing to minimize errors, the dataset is now primed for analysis, ensuring the delivery of precise and reliable results.
3.2.2. Algorithms and Purpose for Analysis
Temporal data analysis is performed on the e-scooter dataset to answer the first six research questions and provide insights into e-scooter usage based on the time of day and day of the week. This analysis involves evaluating the number of trips, average trip distance, average trip duration, and the specific times and days when the trips occur.
The first and last-mile problem plays a pivotal role in influencing an individual’s decision to opt for public transportation. If the walking distance to and from public transport during the initial and final stages is too extensive, it significantly deters potential users from choosing public transportation [94]. The purpose of analyzing this problem is to determine whether people predominantly use e-scooters as an extension of public transport or for recreation, and under what circumstances they might be using e-scooters as an extension of public transport.
The primary method of analysis for research questions 8 and 9 involves using a Random Forest algorithm to model e-scooter usage under various conditions, identifying and ranking features based on their statistical significance to e-scooter usage. Random forest is chosen for its ability to produce models with high accuracy and fast computational speed, as presented in [95], where the authors used Random forest to model travel mode choice behaviour. The analysis determining the factors affecting e-scooter usage under specific weather conditions or traffic conditions is conducted by comparing the e-scooter dataset against either the weather dataset or the TAZs & land use dataset. One challenge in combining weather and e-scooter data is that large portions of data are disconnected, as e-scooter trips tend to stay within a specific area, rarely extending to farther locations. This limitation suggests that a comprehensive analysis of all weather conditions in Qatar on e-scooter usage may not be as accurate or precise as desired. To address this issue, DBSCAN is used to cluster the e-scooter data based on trips aggregated by the day and hour. This approach allows for specific insights into how weather affects e-scooter usage at different times for each cluster of e-scooters. DBSCAN was chosen for its effectiveness in clustering data points by density and its high computational performance, capable of handling large datasets, as demonstrated in [96], where it was employed to mine travel patterns of smart card users.
The GLME model offers a comparable analysis to the Random Forest algorithm, aiming to identify statistically significant factors affecting e-scooter usage. More specifically, we employ this model comparison with the Random Forest algorithm to validate the accuracy of our findings, particularly when both algorithms identify the same features as statistically significant. Generalized Linear Mixed Models (GLMM) are commonly used in literature as demonstrated in [97], where it was used to model commuting mode choice in a high-density city. Therefore, we chose a variant of the GLMM that emphasizes random effects to supplement our analysis. The GLME model may also offer further and different insights into how these factors affect e-scooter usage. From these analytical methods, it is possible to determine how land use and weather conditions impact shared e-scooter usage.
The following subsections will elaborate on the details of the primary analytical methods employed in the study.
3.3. Generalized Linear Mixed Effect Models (GLME)
GLME Models are developed to enable an analysis of dependent data drawn from different distributions other than Gaussian by:
- Introducing random variables (i.e., random effects) at the lower levels of the model. In the context of our study, there are repeated measurements from the same TAZ. To capture the correlation between these repeated measurements, random effects were introduced at the TAZ level.
- Modeling the response indirectly by applying the link function . For example, if the response data is count data, then one of the possible link functions is the logarithm.
The formula of the GLME is shown in Equation (1-3):
And
where
is the response vector
is the link function
is the inverse of the link function
is the design matrix for fixed factors
is the coefficient of fixed effect regression
is the random effects design matrix for random factors
is the vector of random effects
is the residuals
In the GLME, the null hypothesis for the fixed factor is that does not significantly explain some of the variability of the response (i.e., ).
For the purposes of this study, the significance level, α, was set at 0.05. To determine if a particular fixed factor significantly affected the logarithm of the number of e-scooter rides, the p-value corresponding to this fixed factor in the estimation table was compared with the 0.05 significance level. For example, if the p-value of the GDA is 0.04 (i.e., estimated GDA p-value ≤ 0.05), it is concluded that the GDA significantly affects the logarithm of the number of e-scooter rides.
When the p-value of a regressor is below or equal to 0.05, the coefficient value is considered significant as it indicates the magnitude of impact on the expected logarithm of the number of e-scooter rides.
3.4. Density-Based Spatial Clustering of Applications with Noise (DBSCAN)
The DBSCAN algorithm operates on the principle that a point belongs to cluster if is close to many points from the cluster . The DBSCAN algorithm requires the setting of two hyperparameters, namely the neighbourhood radius () and the density threshold ().
: This parameter defines the neighbourhood relationship between any two points and W and are neighbours if , where d is the distance between the two points.
: This parameter defines a cluster, where a group of points forms a cluster if their count is equal to or greater than .
should be at least equal to the number of dimensions in the dataset, plus one. Thus, when working with a 2-D dataset, is set to 3. Furthermore, can be estimated by plotting the kNN distances of the points (i.e., the distance of each point to its k-th nearest neighbour) in decreasing order. A ‘knee’ in the plot indicates an appropriate value for .
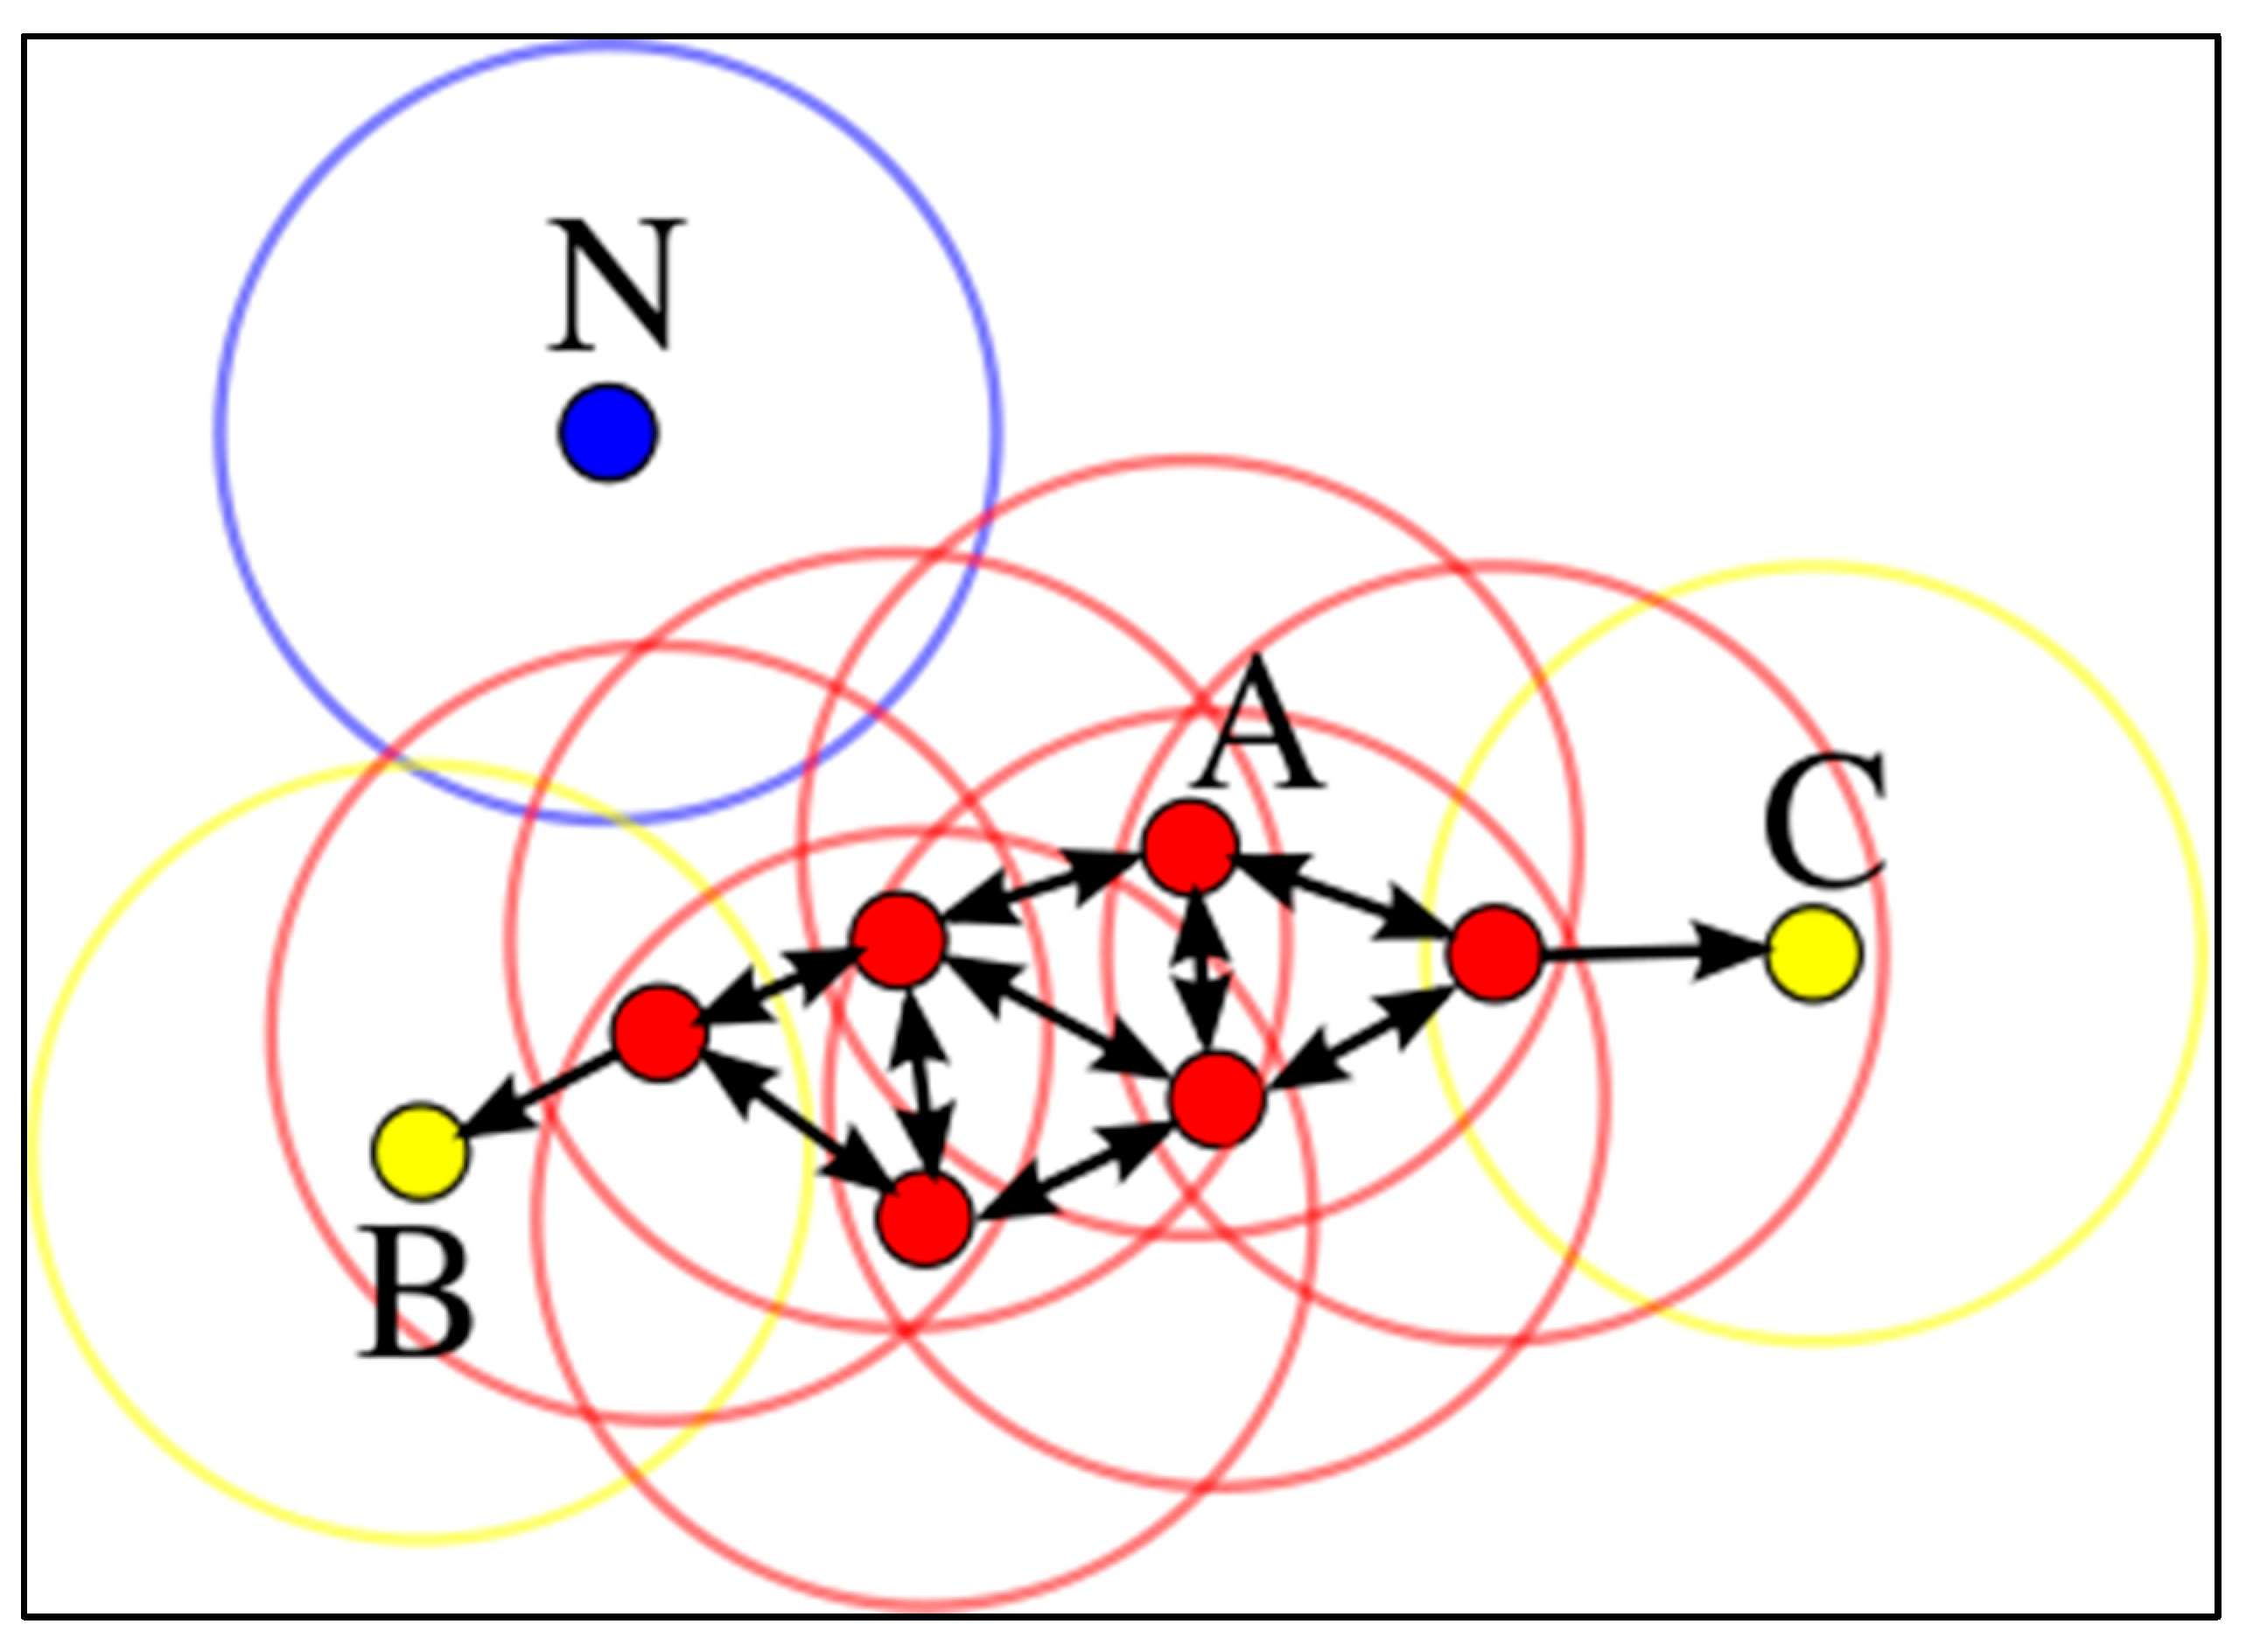
Consequently, using these two parameters DBSCAN classifies data points into one of the following three types as shown in Figure 2:
- Core point: A point is a core point if it has at least neighbour.
- Border point: A point is a border point if it has fewer neighbours than minPts, and at least one of these neighbours is a core point.
- Outlier: A point is an outlier if it has fewer neighbours than minPts and none of these neighbours is a core point.
In Figure 2, the parameter minPts is set to 4. Core points, border points, and outlier points are depicted in red, yellow, and blue, respectively
Figure 2.
The DBSCAN Classifier. (Source: https://en.wikipedia.org/wiki/DBSCAN).
Figure 2.
The DBSCAN Classifier. (Source: https://en.wikipedia.org/wiki/DBSCAN).
DBSCAN steps of solution
- 1
- Set the values of minPts and eps.
- 2
-
Randomly select a point and classify it.
- If is classified as a core, then its neighbours become members of the new cluster. If neighbours are labelled as core points, then their neighbours become members as well.
- If is not a core point, label it as a noise and select another random point.
- 3
- Once the cluster cannot be grown further, randomly choose another point that does not belong to any cluster so far and repeat the process.
- 4
- Stop if all points are labelled.
3.5. Random Forest
The Random Forest [98] is an ensemble technique known for its efficiency in handling continuous response variables and labels. One of the key advantages of the Random Forest approach is its ability to mitigate overfitting issues through the Law of Large Numbers. By employing a divide-and-conquer strategy, the Random Forest constructs a collection of weak models that collectively form a strong model. This collection comprises numerous unpruned decision trees, each selecting a randomly chosen subset of predictors at every split. Among the decision trees commonly used in Random Forests is the Classification And Regression Tree (CART) [99], a well-known machine-learning technique. CART utilizes a greedy and recursive top-down binary partitioning method to divide the feature space into disjoint regions that should be pure in terms of the response variable. For classification tasks, the Random Forest algorithm operates as follows: Given a training dataset with H cases, P predictors, and a desired number of trees N, the training and testing process can be described as follows.
- Random Sampling: H cases are randomly sampled with replacement from the original dataset to create a bootstrap sample.
- Predictor Variable Selection: P/3 predictor variables are randomly selected from all the predictor variables at each node.
- Best Split: Among the P/3 selected predictors, the one that provides the best split (minimum classification error) is chosen. A binary split is then performed on that node using this predictor variable.
- Next Node: At the next node, another set of P/3 predictors is randomly chosen from the total P predictors, and the same process of finding the best split is repeated.
- Tree Building: The trees are built without performing cost complexity pruning, and they are saved as-is, along with the other built trees in previous iterations.
- Testing Phase: During the testing phase, when a new case (data vector) arrives, it is propagated down all of the trees. The trees collectively predict the label of the new case based on its traversal path through each tree.
3.6. Features Importance
The Random Forest (RF) algorithm enables ranking features based on their importance [98]. To determine the importance of predictors, the RF employs a series of steps as follows:
- Find the out-of-bag samples that are not used in training for each tree.
- Find the misclassification rate of the RF using out-of-bag samples and denote it as .
- For each predictor randomly permute its values among the out-of-bag samples and calculate the misclassification rate of the RF, denoting it as .
- Then, rank the predictors in descending order based on the difference .
Based on the above approach, the higher the value of the predictor’s importance, the more important this predictor is.
3.7. The Kruskal-Wallis Test
The Kruskal-Wallis test is a robust non-parametric method used to test whether statistically significant differences exist among the medians of two or more data groups. This test is particularly advantageous for analysing data sets with non-homogeneous variances and does not assume a normal distribution, making it a versatile tool for statistical comparison across diverse data sets.
3.8. The Tukey-Kramer Method
After rejection of the null hypothesis in the Kruskal-Wallis test, the Tukey-Kramer method is used as a post-hoc analysis to identify which specific group means differ from each other, while controlling for the possibility of Type I errors arising from multiple comparisons. This method is particularly useful because it accommodates diversity in sample sizes among groups while maintaining control over the family-wise error rate.
4. Experimental Work
4.1. Temporal Analysis
Understanding the temporal distribution of e-scooter trips as a function of the time of the day and day of the week is essential for optimizing the recharging and redistribution of the vehicles. Moreover, it may provide insights into how shared e-scooters complement and substitute existing travel modes. Therefore, we examine the heat map of the total number of trips, average trip duration, and distance versus the day of the week.
Figure 3 shows that most of the trips occur during peak hours (i.e., 2 pm to 6 pm) characterized by many short trips, such as employees eating out during lunch breaks or conducting business trips to the bank or meetings. Furthermore, there is a remarkable increase in the number of trips on Thursdays and Fridays from 7 pm to midnight compared to the other days of the week, where many rides possibly occur as leisure or fun rides, especially around parks. An examination of the temporal distribution of the average trip distance and duration, as shown in Figure 4 and Figure 5, reveals that many trips are made late at night and early in the morning, with a relatively long distance and travel time pattern. This suggests that some trips are made for leisure purposes. We used the Kruskal-Wallis test to determine if the data from different groups, such as the day of the week, have statistically significant differences in their medians.
4.2. Day of the week
We analyzed the e-scooter trip data to answer the first three research questions concerning trip count, average trip distance, and duration versus the day of the week. To conduct this analysis, the following steps were taken:
- 1.
- Pre-process the trip data as described in Section 4.1.
- 2.
- Group the trip data by date, meaning we separate trips into chunks of daily trips.
- 3.
-
For each chunk:
- a
- Calculate the number of trips.
- b
- Estimate the average trip distance.
- c
- Estimate the average trip duration.
- d
- Identify the day of the week name
- 4.
- Use the Kruskal-Wallis test to test the null hypothesis that the data (i.e., the number of trips, average trip distance, or average trip duration) for each day of the week comes from the same distribution.
The Kruskal-Wallis test returned a p-value of 0.0395, <0.0001 and <0.0001 for the number of trips, average trip distance, and average trip duration grouped by the day of the week, respectively. These p-values are less than 0.05; hence we reject the null hypothesis and conclude that the days of the week have different trip counts, average trip distances, and durations. Consequently, the Tukey-Kramer method was utilized to conduct pairwise comparisons among all unique pairs of days of the week, ensuring protection in these comparisons. The pairwise comparison analysis did not reveal any significant differences in the number of trips on the different days, possibly due to the conservative nature of the Tukey-Kramer method. However, when examining the average trip distance and duration, the pairwise comparison indicated a statistically significant difference for Fridays compared to other weekdays. Specifically, Fridays exhibited notably higher average trip distances and durations compared to the rest of the weekdays.
4.3. Time of the Day
In this subsection, the e-scooter trip data were analysed to answer the fourth, fifth and sixth research questions in terms of trip count, average trip distance, and duration versus the time of the day. The pseudocode describes the steps for the time-of-day analysis is shown in Table 3.
The Kruskal-Wallis test returned p-values <0.0001 for the number of trips, average trip distance, and average trip duration, all grouped by the time of the day, respectively. These p-values are less than 0.05; hence we reject the null hypothesis and conclude that the hours of the day have different trip counts, average trip distances, and durations.
4.4. The First and Last-Mile Problems
In this analysis, we estimate the percentage of trips that could complement existing travel modes. Specifically, these are trips generated due to first and last-mile problems. By definition, a last-mile trip starts in the vicinity of a bus stop and ends at any location, whereas a first-mile trip begins at any location and ends in the vicinity of a bus stop. To estimate this percentage, we calculate the linear distance between the start and end locations of each trip and the nearest bus stop. Figure 6 demonstrates the empirical cumulative distribution function (CDF) of the linear distance between the start and end locations to the nearest bus stop for each trip.
It should be highlighted that for tackling the first-mile and last-mile difficulties connected to bus stops, 50 and 100 meters were chosen as the distances due to practical considerations and normal usage patterns. In order to allow for a convenient and comfortable walk to the bus stop, riders are assumed to exit their e-scooters for the first-mile problem 50 or 100 meters before getting to the stop. E-scooters are placed 50 or 100 metres from bus stops in order to solve the last mile problem by making it simple for passengers to use them. These separations achieve a balance between passengers’ ability to use e-scooters conveniently and proximity to bus stops, allowing for easy switching between them and public transportation. Consequently, we clustered the line distance using the 50m and 100m thresholds and found the following;
- 5.09% of the trips have a distance <=50 meters between the e-scooter trip destination and the nearest bus stop (i.e., potential first mile)
- 17.38% of the trips have a distance <=100 meters between the e-scooter trip destination and the nearest bus stop
- 6.02% of the trips have a distance <=50 meters between the e-scooter trip origin and the nearest bus stop (i.e., potential last mile)
- 20.80% of the trips have a distance <=100 meters between the e-scooter trip origin and the nearest bus stop (i.e., potential last mile)
For the sake of completeness, we compare the total trip distance of the potential last/first mile and the rest of the trips. As shown in Figure 7 and Figure 8, there is no difference between the histograms, which is against our expectation where we expect the first and last-mile trips histogram to have most of its trips less than 2 km
4.5. Trip Counts and Land Use STATISTICAL modelling
In this subsection, we explain the variability of the daily trip counts within each TAZ as a function of the day of the week, the month of the year, and the land use variables indicated in Table 4. We assumed the data is distributed according to Poisson distribution; hence, a log link is used. Moreover, TAZ is used as the random factor in the model to account for the repeated observations from the same TAZ. The estimated coefficient of the different fixed-effect factors and their p-values are shown in Table 5
As shown in Table 5, this GLME model reveals the following
- It confirms our previous analysis, suggesting that the trip counts are statistically significantly different across days of the week and months of the year.
- Regarding the land use variables, four are statistically significant: GDA (Greater Doha Area), Number of Jobs, Number of Students, and a variable that combines Qatari, Pupil, and Female demographics.
- The log of the count of trips increases by 2.03 when in the Greater Doha Area, with all other factors remaining unchanged.
- The log of the count of trips increases by 7.44E-05 for each unit increase in the Number of Jobs, with all other factors remaining unchanged.
- The log of the count of trips increases by 8.64E-05 for each unit increase in the Number of Students, with all other factors remaining unchanged.
- The log of the count of trips decreases by 0.491295233 for each unit increase in the combined Qatari, Pupil, and Female variable, with all other factors remaining unchanged.
4.6. Trips and Land Use Machine Learning Modelling
In this study, we applied the Random Forest technique to model the land use dataset described in the subsection above, since machine learning models are highly flexible and capable of modelling highly nonlinear relationships. Consequently, we used the trained model to rank the independent variables/predictors based on their importance. Furthermore, we utilized the partial dependence plot to gain a better understanding of the relationship between the four statistically significant land use variables and the trip counts. To visually inspect the trained Random Forest’s performance, we plotted the ground truth trip counts versus the predicted trip counts, as illustrated in Figure 9. A linear relationship between the prediction and the ground truth confirmed that the model follows the data pattern. Moreover, we calculated the mean absolute error (MAE=3.22) and the symmetric mean absolute percentage error (SMAPE=54.8%) to demonstrate the model’s good performance. It can be concluded that the partial dependency plot generated using this model can be safely taken into consideration.
As illustrated in Figure 10, all the significant predictors are ranked within the top 50%. This implies that removing any of these predictors from the model would lead to an increase in prediction errors. In other words, the trip counts strongly depend on these predictors. Figure 11 shows the partial dependence of the trip counts on the six statistically significant predictors. We can observe that the trip counts are different across the month of the year and the day of the week, which validates the statistical analysis done in the previous section.
Moreover, the Partial Dependency Plot (PDP) for the number of students and the number of jobs shows an increase in the trip counts as these predictors increase. On the other hand, the PDP of the Qatari, Pupil, Female reveals a complex relationship with the trip counts. This relationship fluctuates between decrease and increase as the value of this independent variable rises.
It is important to note that identifying key factors influencing trip counts requires a non-parametric perspective on predictor influence, which is provided by the feature importance derived from Random Forest analysis. Concurrently, partial dependency plots offer stakeholders and policymakers a clear visual explanation of how these predictors impact the outcome, facilitating easier comprehension. While relationships between predictors and trip counts are also identified by the GLME approach, our findings are more robust because the Random Forest methodology accommodates non-linear dynamics without the need for the strict assumptions inherent in GLME models. When combined, these analytical methods yield synergistic insights, simplifying the formulation of evidence-based policy recommendations.
4.7. The Impact of Weather Conditions on E-Scooter Trips
The remainder of the article reports on the results of studying the impact of weather variables on trip counts. However, as Figure 12 illustrates, the presence of many zero-inflated TAZ makes the modelling more challenging. To overcome this problem, two approaches, differentiated by the duration of data aggregation, were applied. The first approach (daily aggregated data) aggregates the data by date, calculating a single number to represent all trips generated across the TAZs. In other words, the trip dataset is condensed into a smaller dataset where each row represents the count of the trips observed on a specific day. As a result, the new dataset lacks location information. Moreover, with a resolution of one day, this data can be integrated with the monthly weather data.
The second approach (hourly aggregated data) fine-tunes the time and location resolution. We used the DBSCAN algorithm to cluster trips, as depicted in Figure 13. Following the DBSCAN solution, the e-scooter dataset is divided into five smaller datasets. For each sub-dataset, an hourly trip counts dataset variant was created; then, the daily weather dataset was integrated with the one-hour aggregated dataset.
4.8. Daily Aggregated Trip Data Analysis
Due to the fact that there is one data point per day in the daily aggregated dataset, we used the average temperature and humidity of the day as two weather predictors. Other weather predictors include the minimum and maximum temperatures and humidity observed on that day. Moreover, the day and month were included as predictors to account for possible seasonality. Finally, because this daily aggregated data represents a time series of the total number of trips per day, we used the observed trip counts per day , to explain the variability in the observed trips per day .
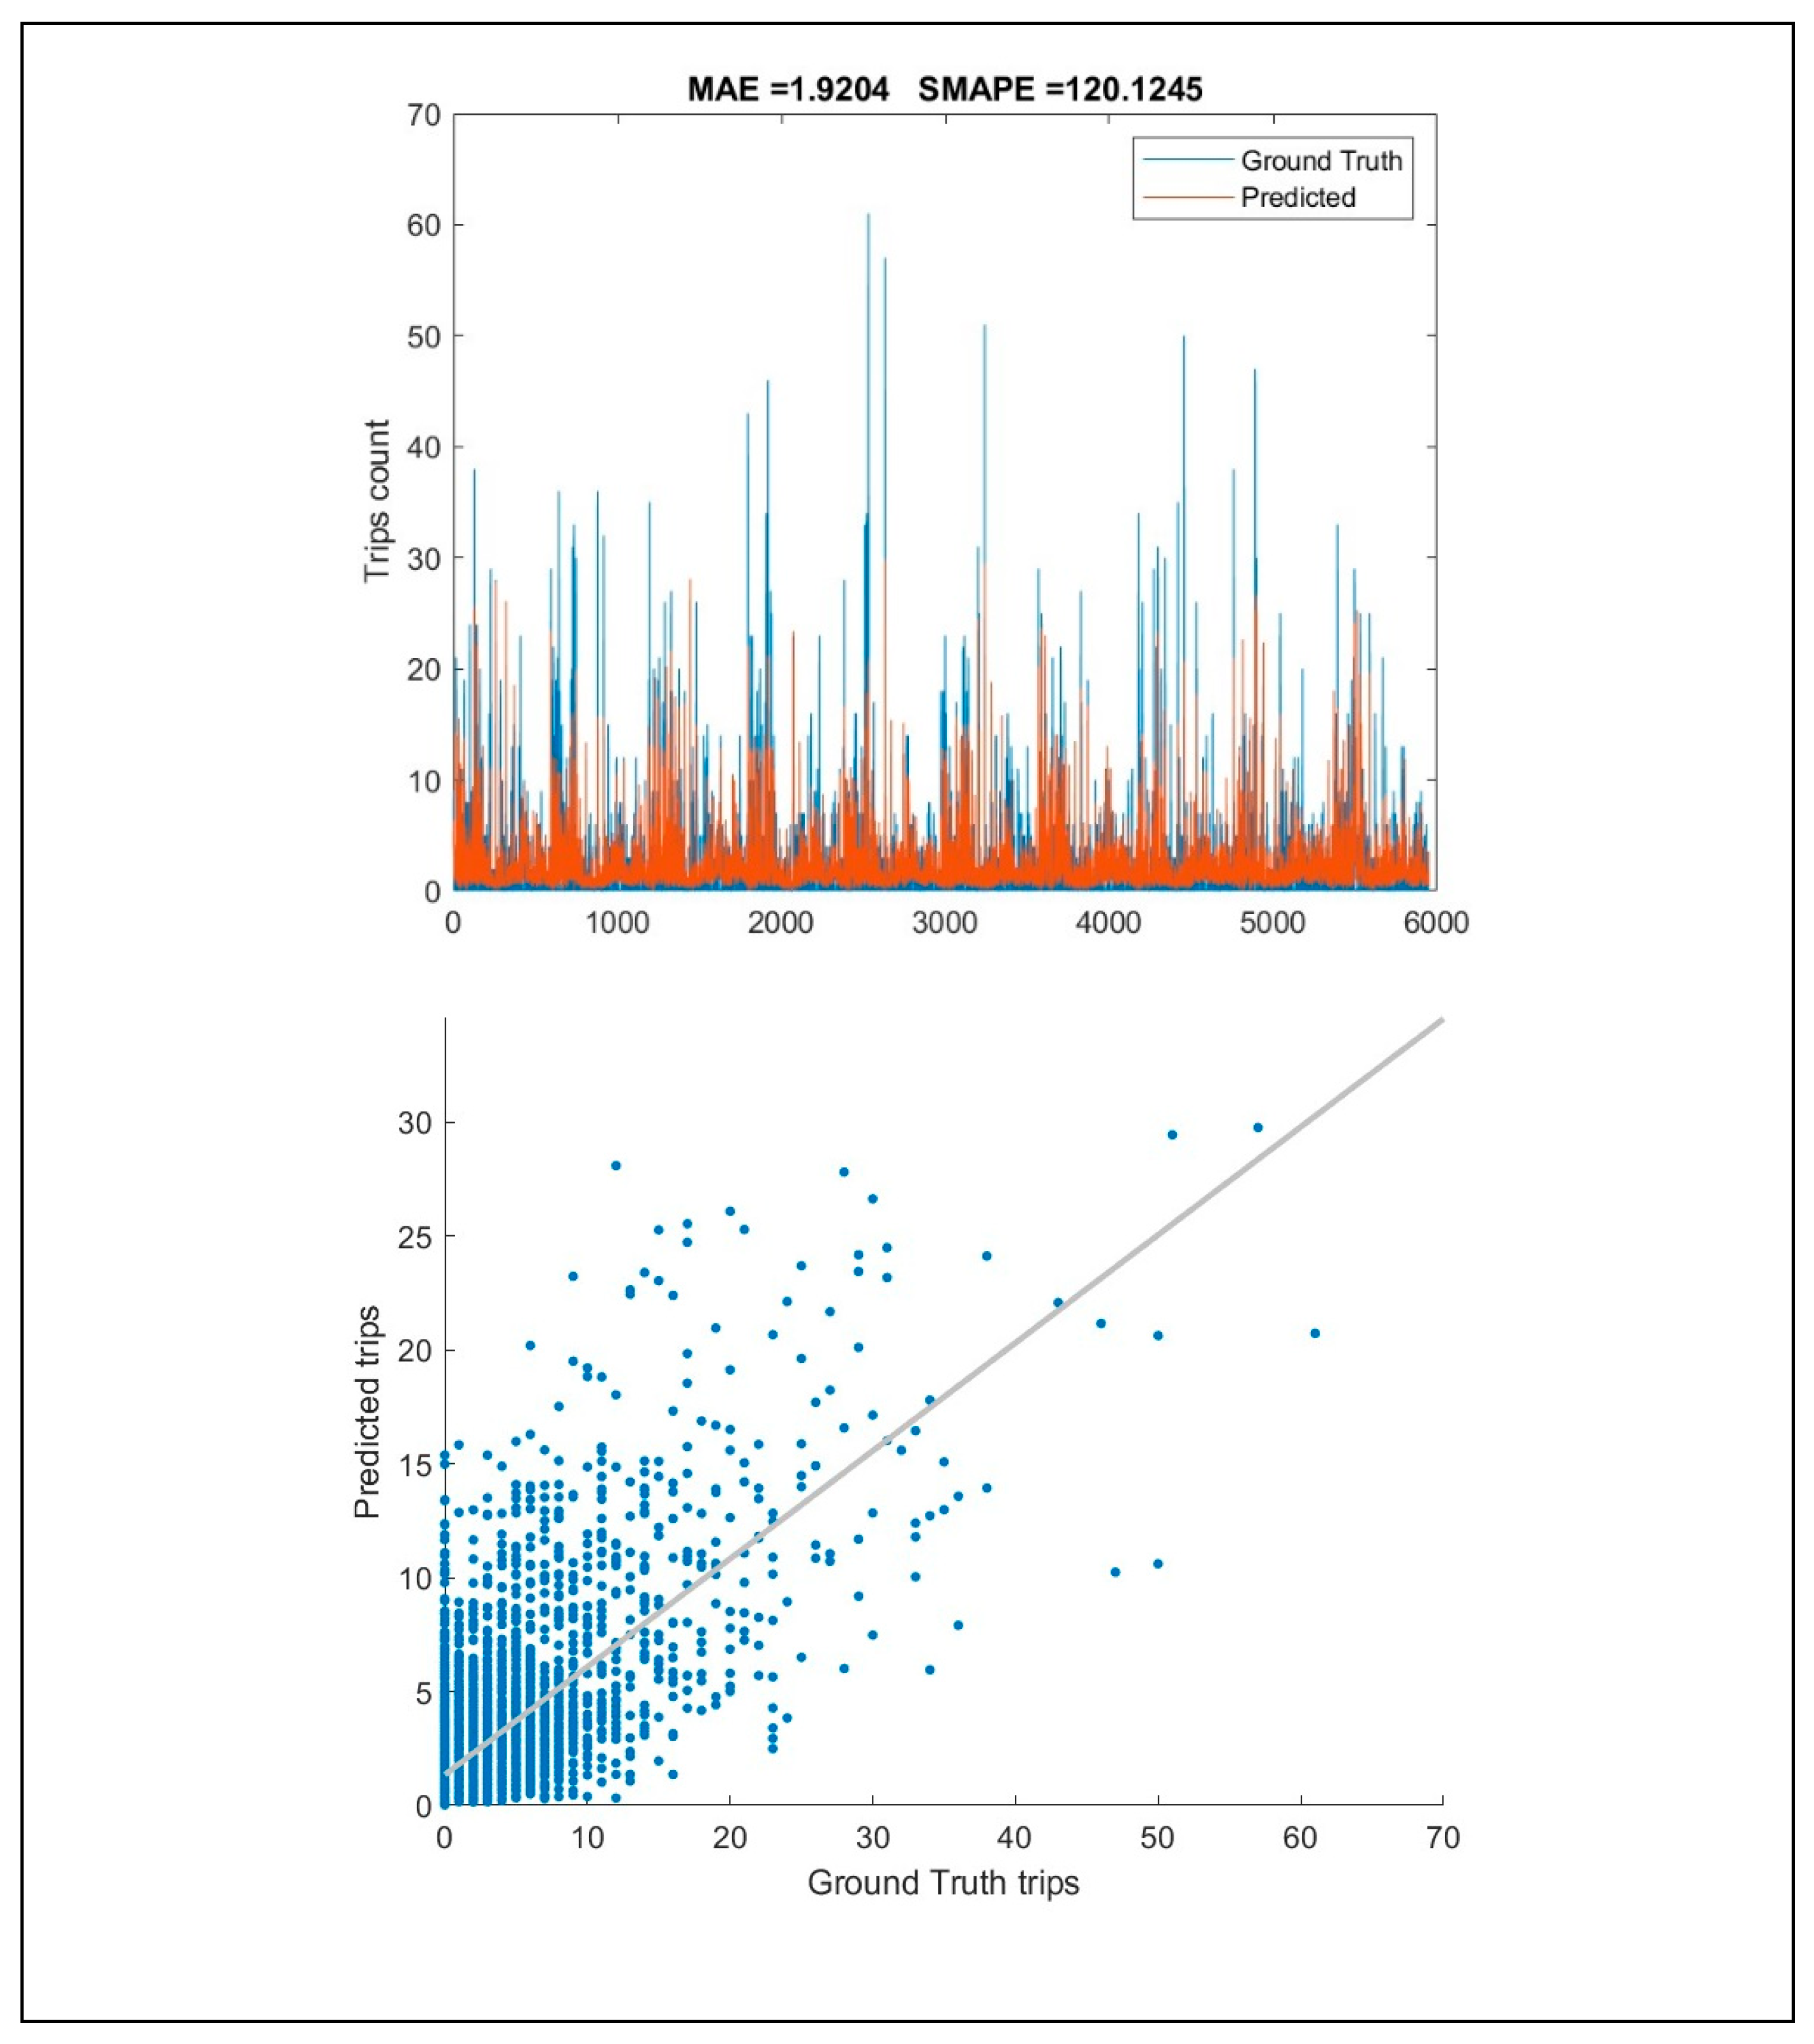
The daily aggregated data was used to train a Random Forest model. Consequently, the trained model was applied to sort the independent variables/predictors based on their importance. Moreover, we utilized the partial dependence plot to better understand the relationship between the weather variables and the trip counts. To visually inspect the trained Random Forest model’s performance, we plotted the ground truth trip counts versus the predicted trip counts, as illustrated in Figure 14. A linear relationship between the prediction and the ground truth confirmed that the model learned from the data and was valid.
As shown in Figure 15, the previously observed trip counts are ranked at the top among the predictors, which is expectable due to the time dependency between successive trip counts. Additionally, it is observed that the average temperature is the most influential weather predictor, while in general, temperature-related predictors are deemed more important than those related to humidity.
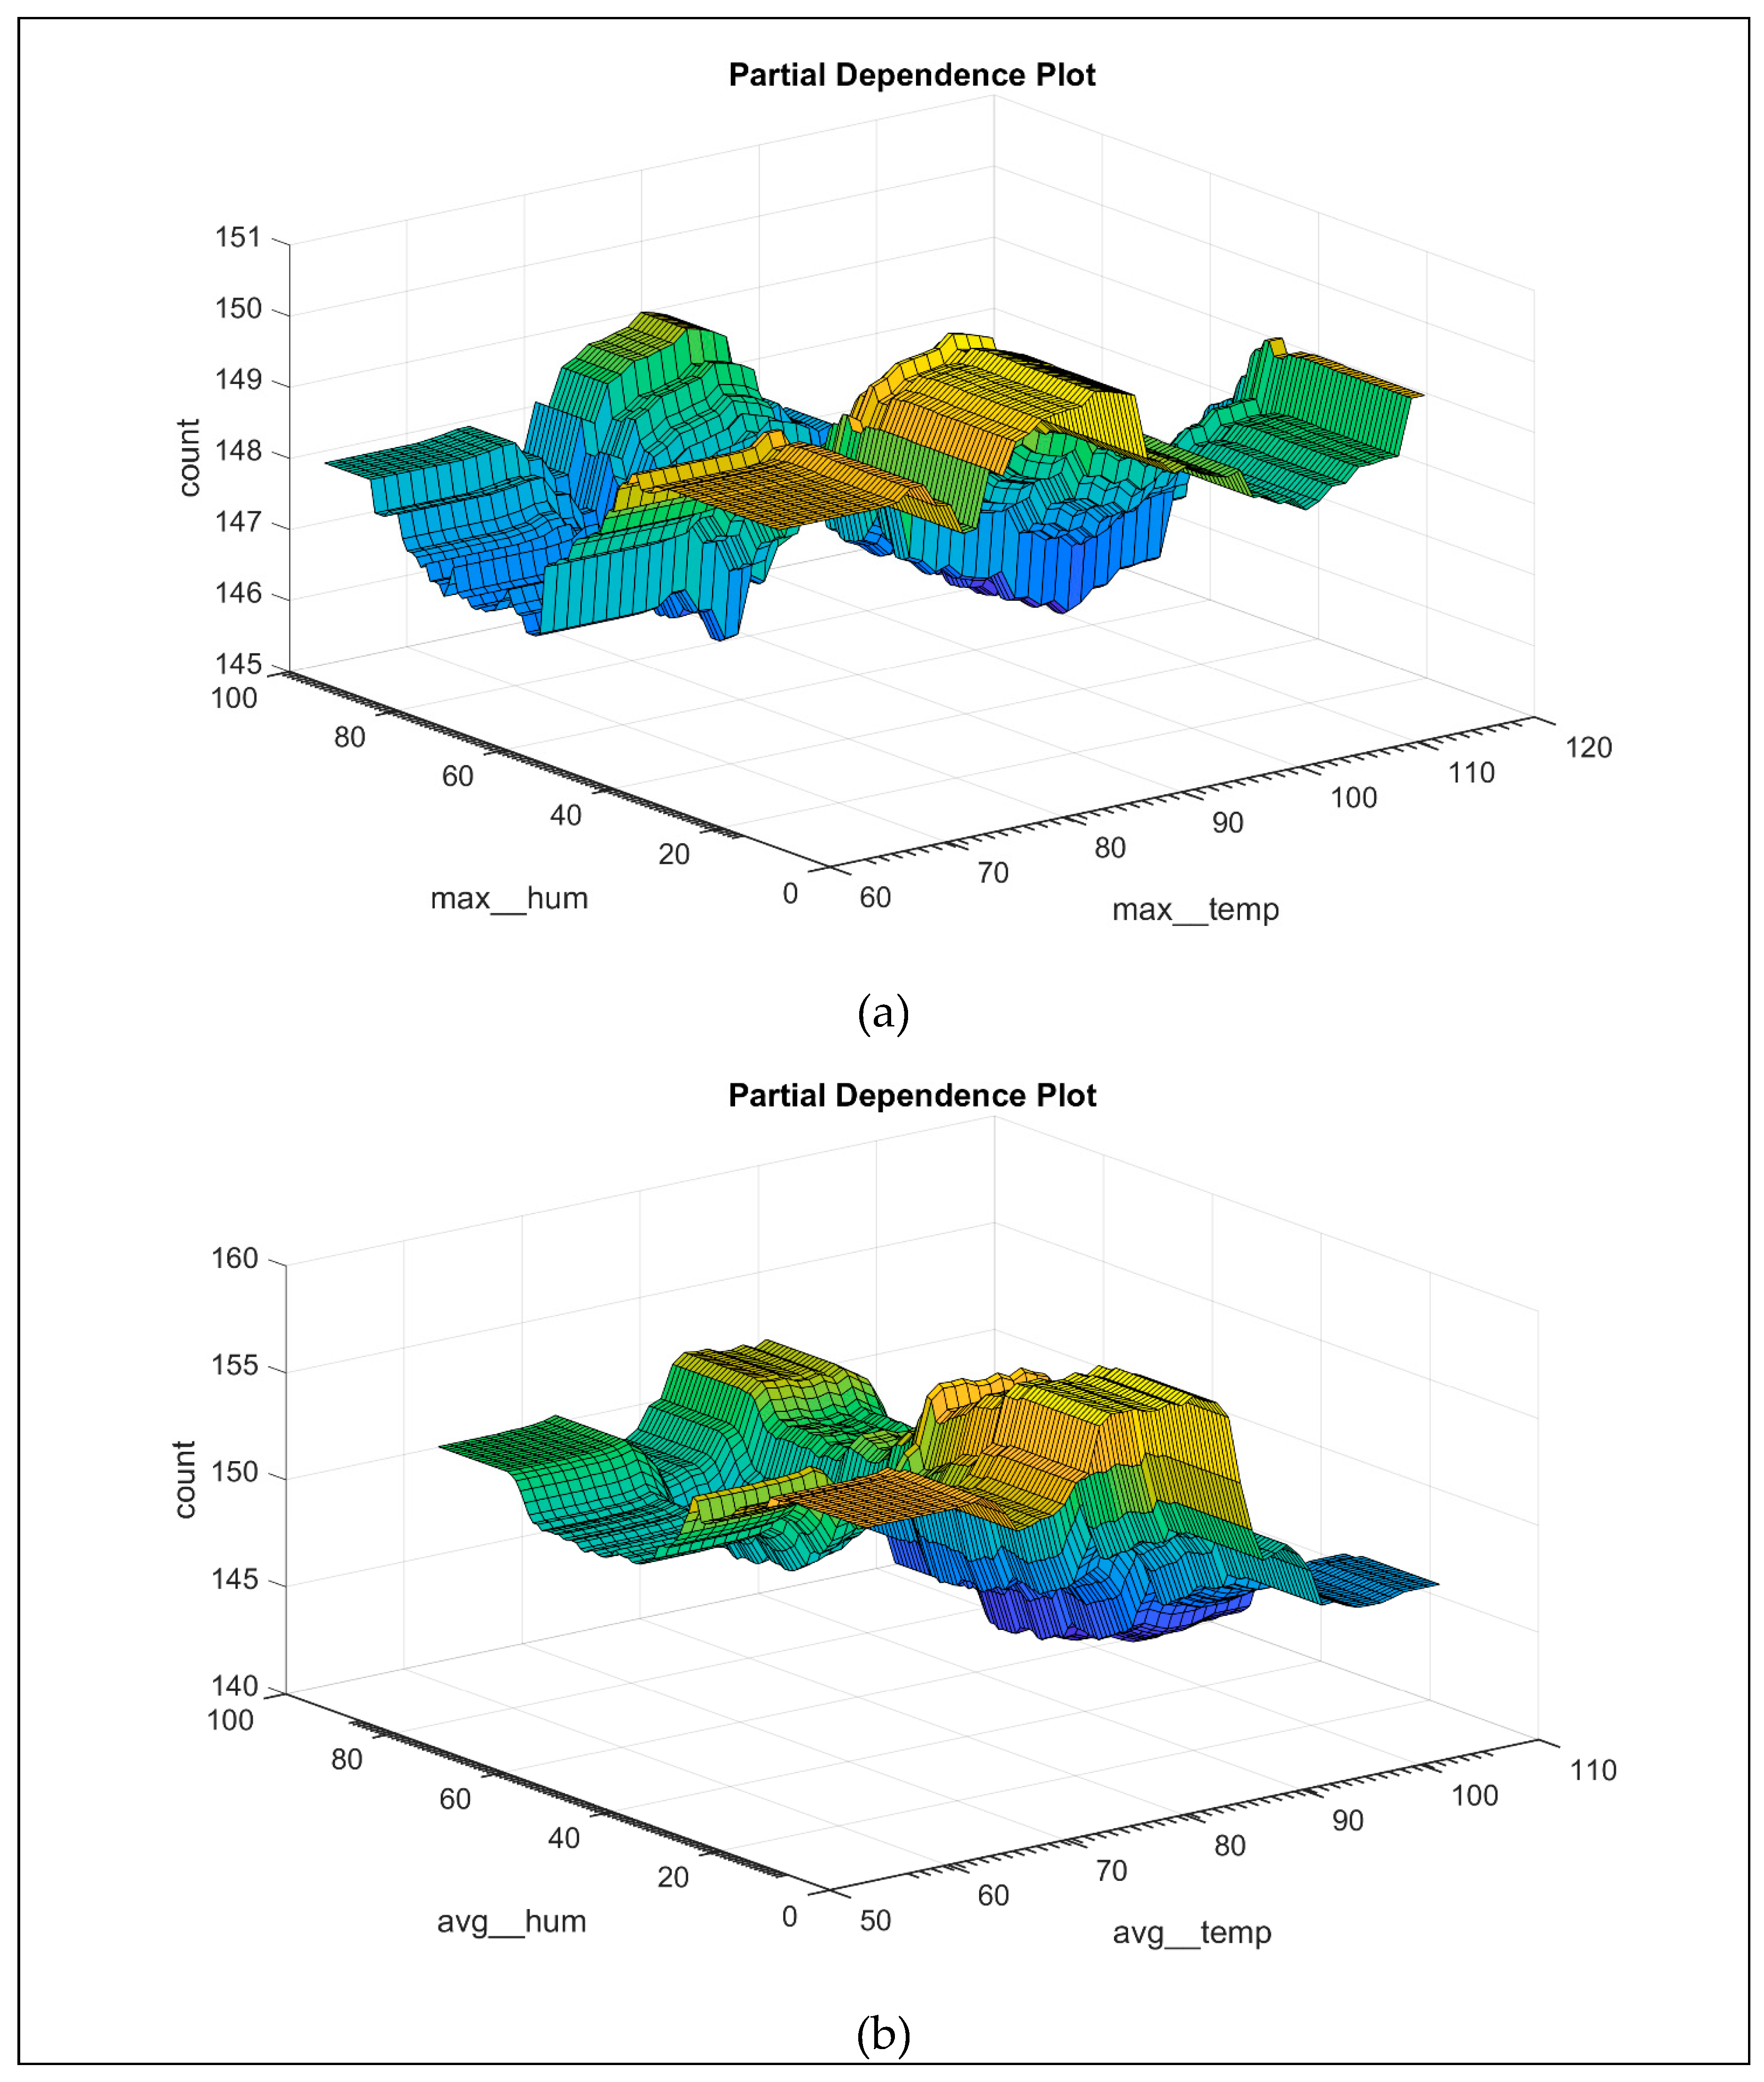
Figure 16 shows the 2-D partial dependence of trip counts on maximum temperature and humidity as well as average temperature and humidity. From the figure, the following findings can be observed:
- The variation in the daily trip count is slight with respect to maximum temperature and humidity.
- The variation in the daily trip count is relatively considerable with respect to average temperature and humidity.
- The topology of the surface of the PDP is almost identical in panels (a) and (b) of Figure 16.
- At a given average temperature, the change in trip counts is small; for example, at high humidity, there is a slight drop in trip counts.
- The trip count increases as the average temperature rises, reaching its peak at around 80 F, after which it decreases with further temperature increases.
Figure 16.
The 2-D Partial Dependence Plot of (a) Max Temperature and Humidity and (b) Average Temperature and Humidity.
Figure 16.
The 2-D Partial Dependence Plot of (a) Max Temperature and Humidity and (b) Average Temperature and Humidity.
4.9. Hourly Aggregated Trip Data Analysis
In this variation of the trips’ dataset, we have one data point per hour for each of the five clusters. Hence, we utilized detailed weather datasets (i.e., the daily weather dataset) to obtain the weather information every hour. We employed three weather predictors; temperature, humidity and wind speed. To account for any possible seasonality, we included the time of the day, the day of the week and the month as predictors. Moreover, to incorporate time dependency into our model, we used the observed trip counts at hour , to explain the variability in the observed trips at that hour .
The hourly aggregated data for each cluster was used to train a separate Random Forest model. Consequently, we used the trained model to rank the independent variables/predictors based on their importance. Moreover, we employed the partial dependence plot to gain insight into the relationship between the temperature, humidity, wind speed and trip counts
Figure 17.
Visual Inspection of Model Quality for Trained Hourly Aggregated Data.
As shown in Figure 18, the previously observed trip counts are ranked as top predictors, a defendable finding due to the time dependency between the successive hourly trip counts. Moreover, temperature is observed to be the most influential weather predictor, followed by humidity as the second most influential, and wind speed as the least influential predictor.
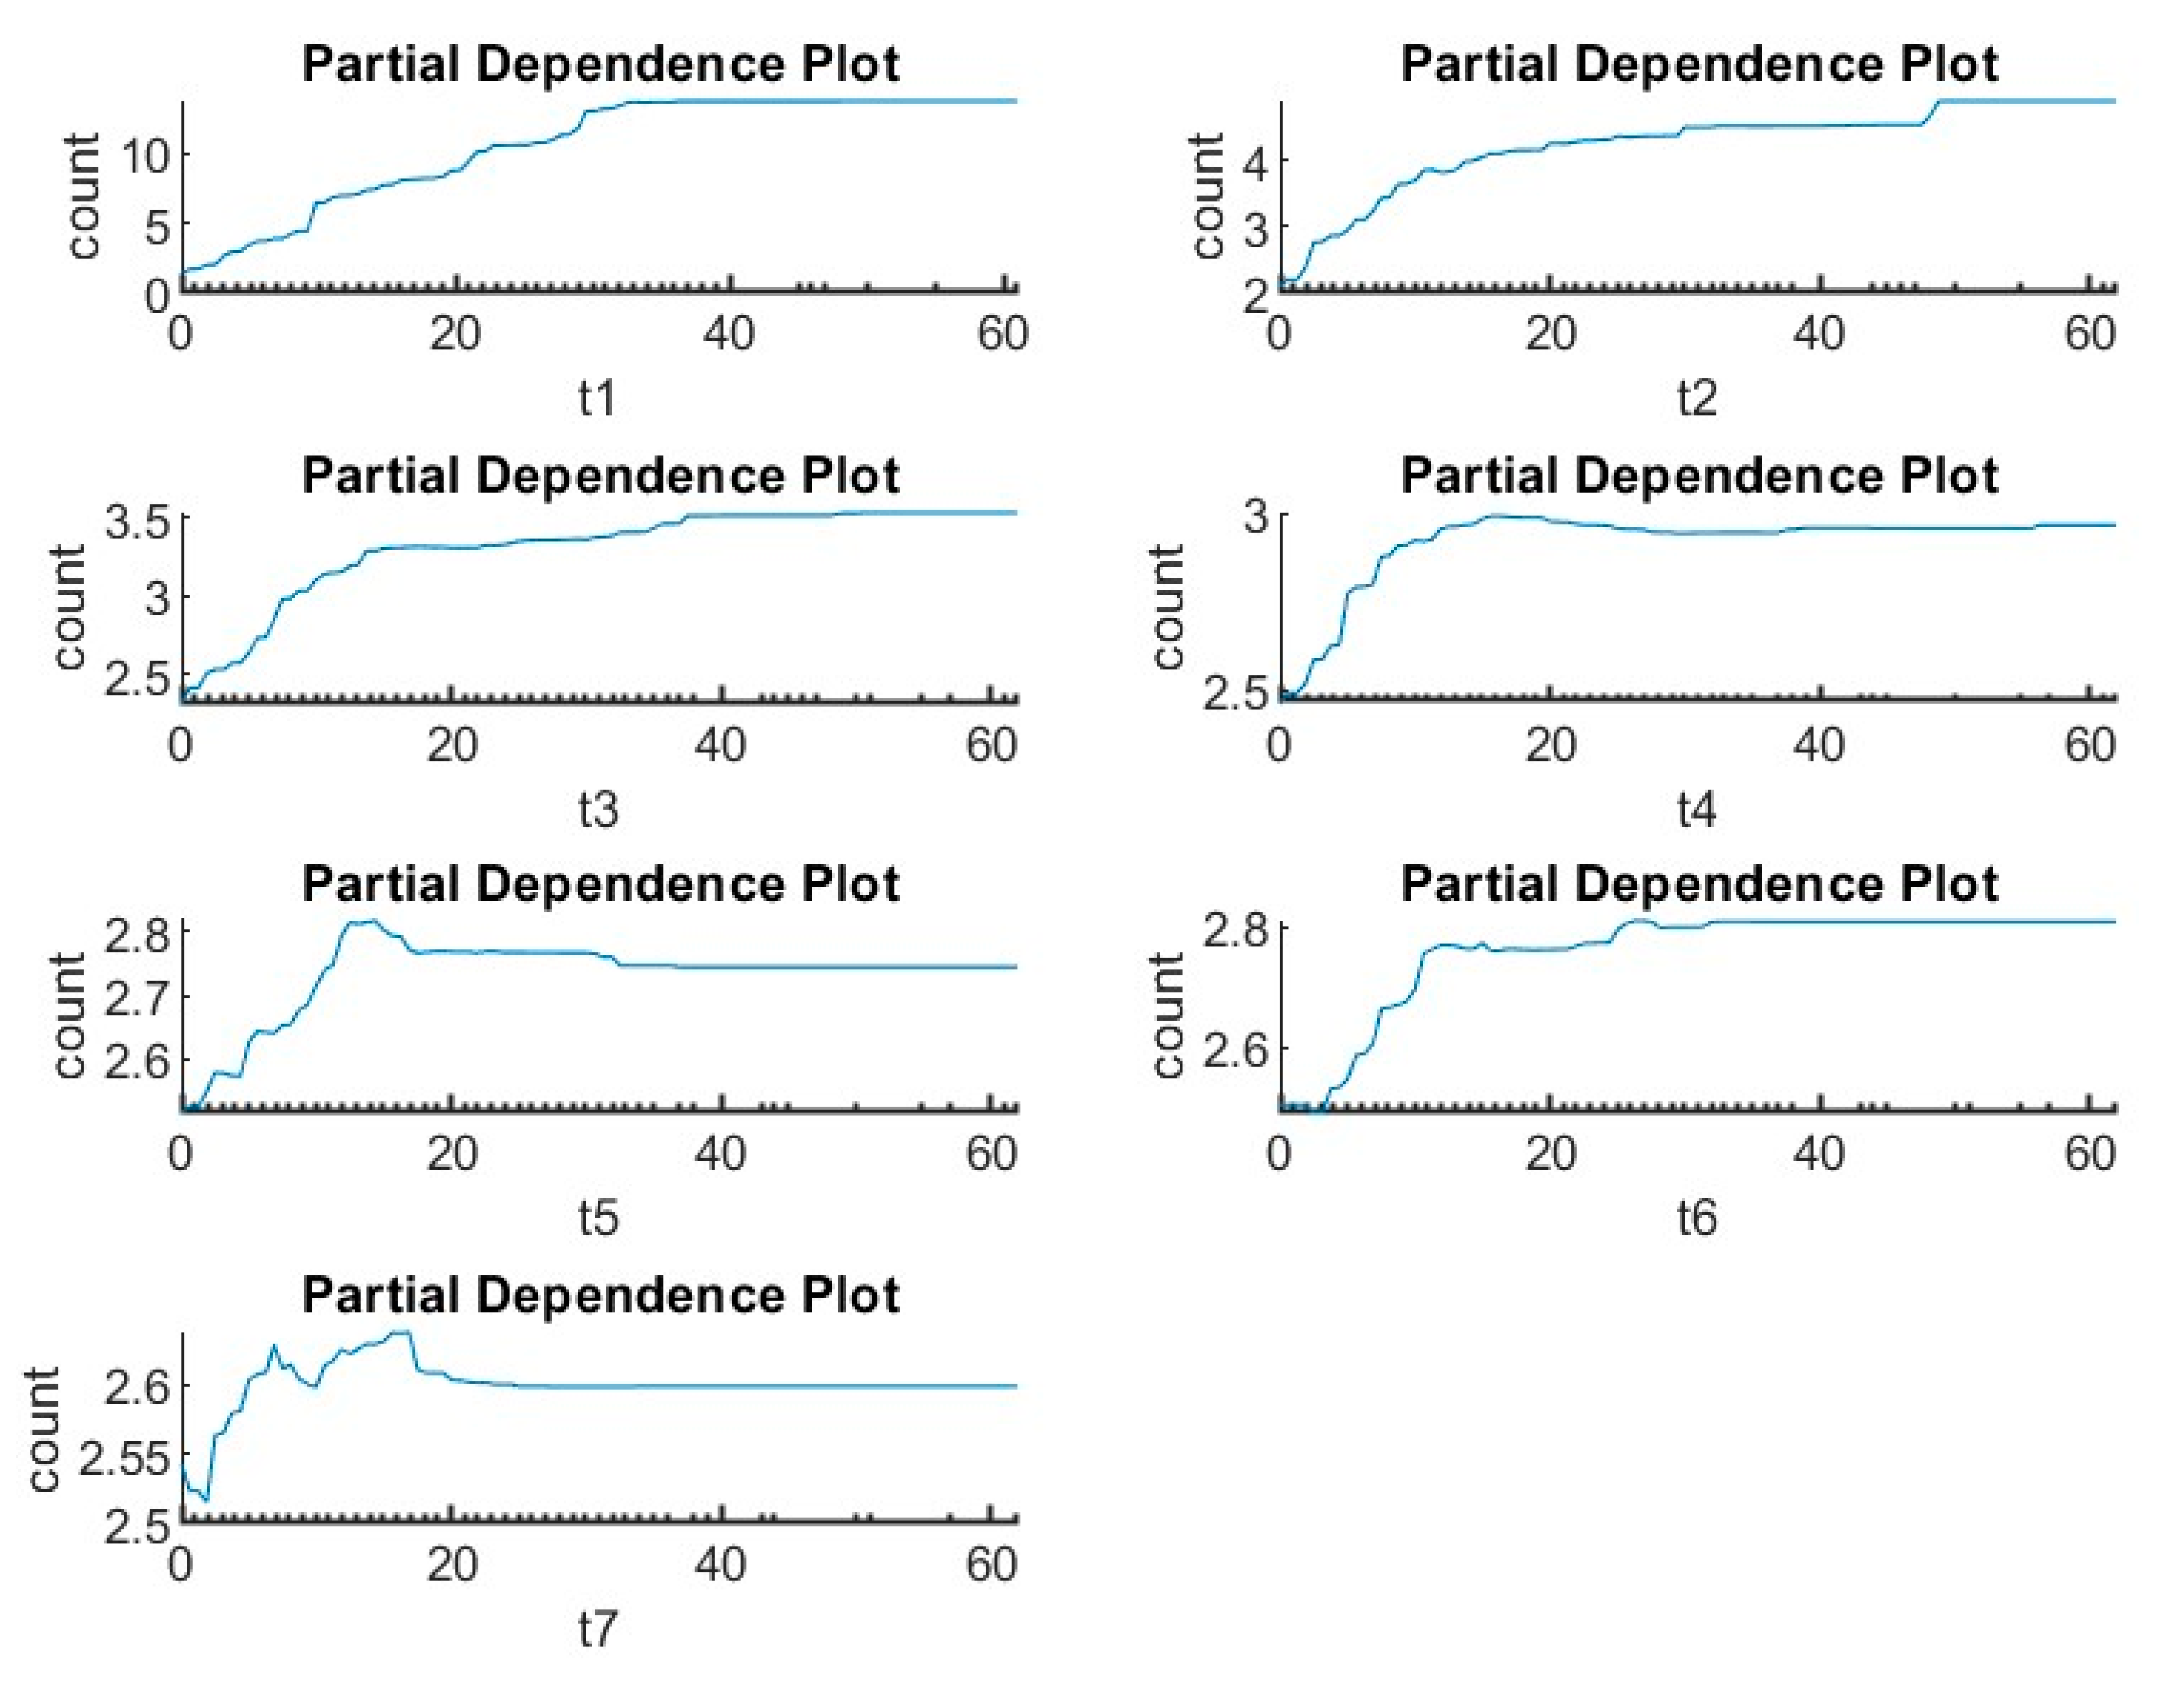
The next step in the analysis is to understand the dependency of the trip counts on the previously observed trip counts. Consequently, the 1-D PDP shown in Figure 19. reveals the following findings,
- There is a linear relationship between the trip count and the observed trip counts of the previous hours.
- The linear relationship reaches saturation (i.e., flattens out) early when the PDP-dependent variable belongs to .
- The variation of the daily trip count is the largest with respect to the observed trip count at .
- The variation of the daily trip count gets smaller as the lag increases.
Figure 19.
Partial Dependence Plot of the Six Statistically Significant Predictors.
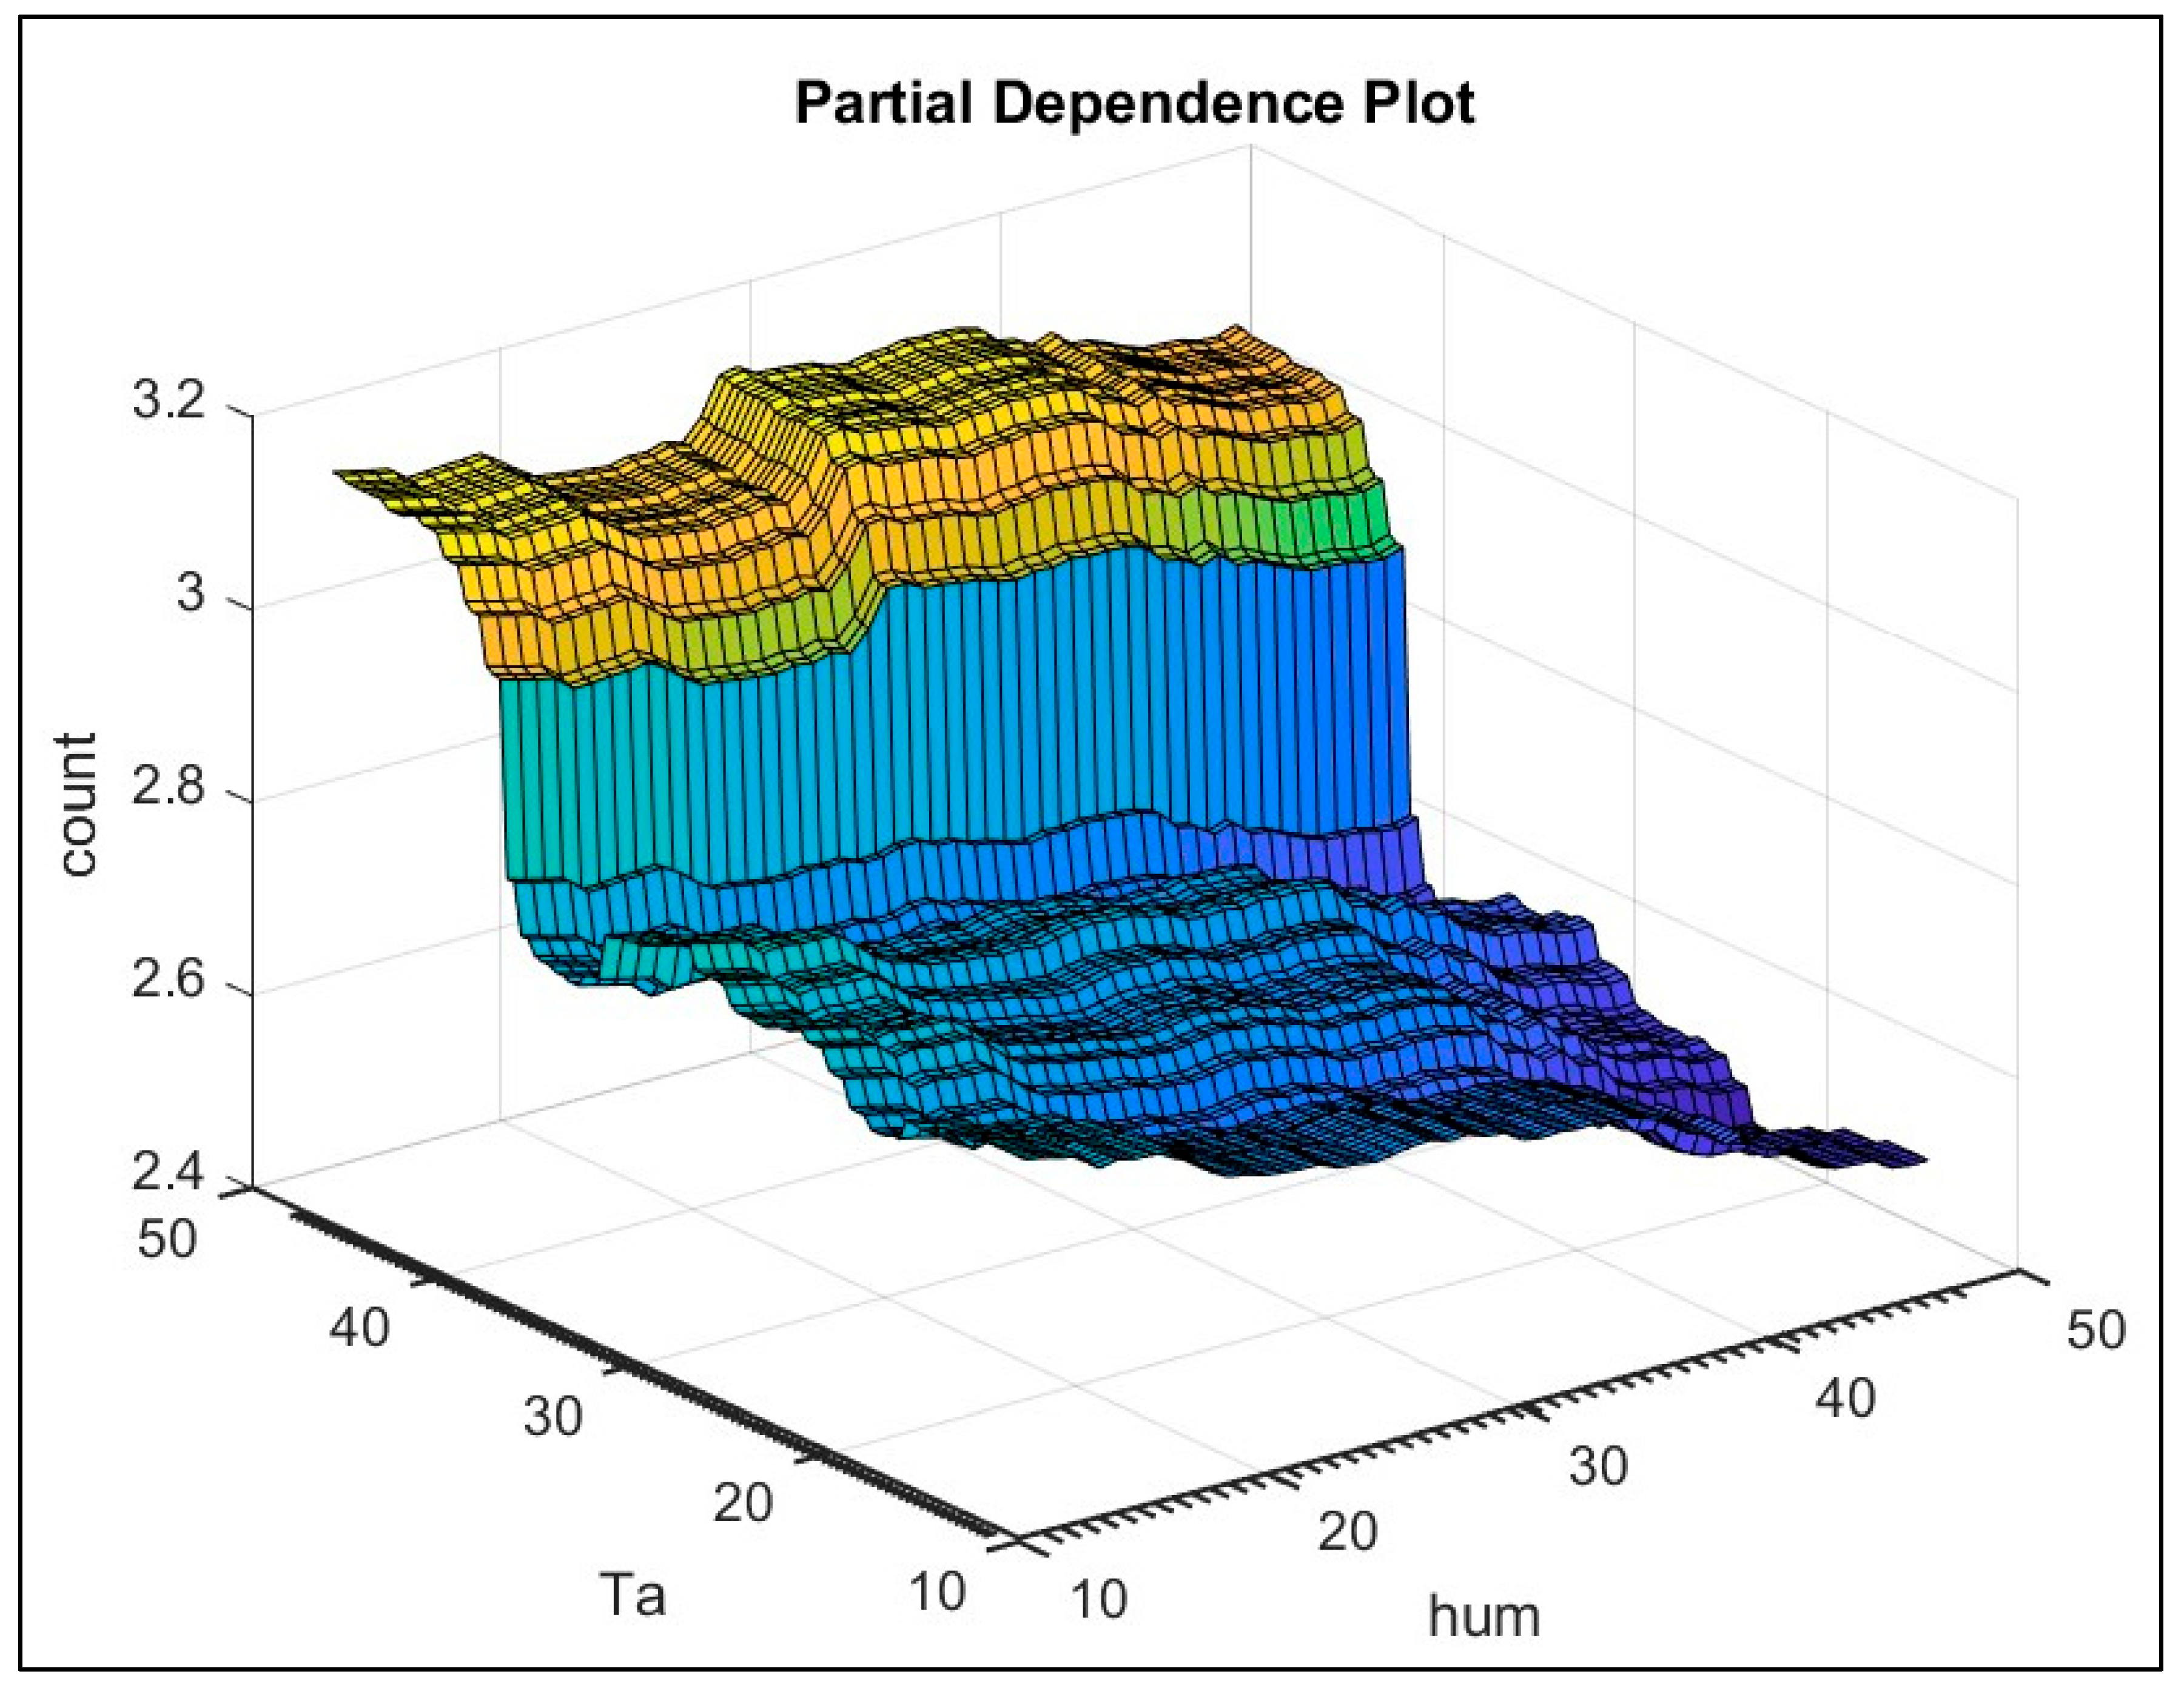
Finally, we estimated the 2-D PDP of the temperature and humidity. The visual inspection of Figure 20. shows the following,
- The hourly trip count increases as the temperature rises.
- The hourly trip count decreases as the humidity increases.
Figure 20.
The 2-D Partial Dependence Plot of Temperature and Humidity.
5. Conclusions
Our investigation into the determinants of shared e-scooter utilization in Qatar, with particular emphasis on weather conditions, land use patterns, and their temporal distribution, has yielded comprehensive insights. The analysis results revealed that the number of trips, distance, and duration on weekends i.e., Fridays and Saturdays, are larger than on the other days of the week. Also, we found that most of the trips were made during the peak hours (i.e., 2 pm to 6 pm); however, the trips that occurred late at night and early in the morning had a relatively long distance and time. Hence, it is anticipated that riders predominantly use e-scooters for fun during the weekend or when other modes of transportation are rather expensive. Furthermore, the analysis of the linear distance between the bus station/stops and the origins and destinations of the e-scooter trips points out a small fraction of the trips as potential first or last-mile journeys. This finding suggests the necessity of conducting a survey focusing on the economic, cultural and safety aspects to identify the factors impacting e-scooter uptake. The study meticulously tested a series of hypotheses through the application of advanced statistical analyses and machine learning techniques, leading to significant findings that have implications for urban mobility planning and policy development.
Revisiting the Hypotheses
- Weather Variations’ Impact on E-scooter Usage (H1): The hypothesis that weather variations, including temperature and humidity, would significantly influence e-scooter trip frequency was strongly supported. The data revealed a clear preference for e-scooter usage during warmer temperatures and lower humidity levels, aligning with the theoretical framework that posits environmental conditions as critical determinants of transportation mode choice. This finding suggests that e-scooter services need to adapt their operational strategies to weather patterns, potentially adjusting availability and marketing strategies according to seasonal variations.
- Influence of Land Use Characteristics on E-scooter Trips (H2): Our analysis confirmed the hypothesis that land use characteristics significantly affect e-scooter trip distributions. High-density areas with abundant employment, educational opportunities, and mixed-use development were associated with increased e-scooter activity. Conversely, the presence of Qatari female students as a demographic factor led to reduced e-scooter usage, indicating cultural and societal norms as critical factors in mobility choices. These insights highlight the importance of considering local demographic and cultural nuances in the planning and deployment of shared mobility solutions.
- Interaction Between Weather Conditions and Land Use on E-scooter Usage (H3): The study explored the moderating effect of land use characteristics on the relationship between weather conditions and e-scooter usage. While the data provided some evidence for this hypothesis, the findings underscore the complexity of interactions between these variables. It suggests that future research should further investigate how specific land use types can mitigate or amplify the effects of adverse weather conditions on shared mobility usage.
Due to some safety concerns and a lack of sufficient infrastructure to accommodate e-scooters without mixing with pedestrians and vehicles in all places, many countries have allowed the operation of shared e-scooters in limited locations to study the demand and user behaviour. The shared e-scooter utilization would be highly dependent on the population’s activities and urban context within these selected areas, i.e., the population and land use type and densities, availability of public transport, and their proximity.
Evidence indicates that e-scooters can offer quicker access to employment opportunities and services compared to traditional mobility solutions [100]. On the other side, the increase in e-scooters throughout urban areas is associated with significant problems. Firstly, considering conflicts between pedestrians and e-scooters, safety concerns can arise from sharing the sidewalk with pedestrians and potential e-scooter speeding. The efficient operation of e-scooters requires urban planning and suitable infrastructure. This entails providing dedicated lanes for scooters, appropriate parking places, and charging facilities. Secondly, the use of e-scooters is connected with adherence to traffic laws. Given Qatar’s high accident rate, it might be important to examine how e-scooters might affect traffic safety. Additionally, e-scooters disrupt the homogeneity of the traffic flow and hinder motorized vehicles because of their lower speed [83].
As the way forward, examining the current infrastructure and any future changes is necessary to facilitate the use of e-scooters. Furthermore, using e-scooters raises concerns about battery disposal and impacts on the environment. Hence, more studies on the possibility of mitigating any negative consequences as well as the environmental effects of e-scooters, need to be conducted.
Analyses of the societal benefits and costs of these systems can be carried out once the negative effects of micro mobility on the flow of traffic on the roads have been thoroughly examined. For this reason, it will be helpful for this reason to simulate urban traffic using different microsimulation software and to analyze the variations that will occur when different degrees of micro mobility vehicle demand is introduced.
User behaviour and attitudes can impact the uptake of e-scooters and their social implications. Research could explore user behaviour and attitudes toward e-scooters in Qatar, utilizing data on user demographics, frequency of usage, reasons for using them, and user satisfaction. The use of e-scooters raises significant governance and regulatory challenges, such as those related to liability, insurance, and licensing. Hence, studies are needed within the context of governance and regulatory frameworks to assess how effectively they address the specific challenges posed by e-scooters.
6. Broader Implications and Future Directions:
The study’s findings provide critical insights for policymakers, urban planners, and e-scooter operators. They emphasize the necessity of integrating shared e-scooters into urban transportation networks with a keen understanding of local contexts, including weather, land use, and cultural factors. Moreover, the patterns of recreational usage observed during weekends and the potential for e-scooters to enhance first and last-mile connectivity to public transport highlight opportunities for strategic interventions to improve urban mobility.
Looking ahead, this research unveils several avenues for further investigation. It is imperative to explore the socio-cultural barriers to e-scooter adoption, particularly among women, and to assess the long-term sustainability and environmental impacts of the proliferation of e-scooters in urban settings. Additionally, the relationship between e-scooter usage patterns and changes in urban infrastructure warrants deeper examination to inform more resilient and adaptive transportation ecosystems.
In conclusion, this study provides valuable empirical evidence to the discourse on shared micro-mobility, offering a nuanced understanding of the factors influencing e-scooter usage. By addressing the initial hypotheses with robust analytical methods, we have laid the groundwork for future research and policy-making aimed at harnessing the potential of e-scooters to contribute positively to urban mobility solutions.
Acknowledgments
This study was made possible by an NPRP award from the Qatar National Research Fund (a member of the Qatar Foundation). The statements made herein are solely the responsibility of the author(s).
References
- Smith, C.S. and J.P. Schwieterman, E-scooter scenarios: evaluating the potential mobility benefits of shared dockless scooters in Chicago. 2018.
- Brown, A., et al., Impeding access: The frequency and characteristics of improper scooter, bike, and car parking. Transportation research interdisciplinary perspectives, 2020. 4: p. 100099.
- Hosseinzadeh, A., et al., E-scooters and sustainability: Investigating the relationship between the density of E-scooter trips and characteristics of sustainable urban development. Sustainable cities and society, 2021. 66: p. 102624.
- Hosseinzadeh, A., A. Karimpour, and R. Kluger, Factors influencing shared micromobility services: An analysis of e-scooters and bikeshare. Transportation Research Part D: Transport and Environment, 2021. 100: p. 103047.
- Mathew, J.K., M. Liu, and D.M. Bullock. Impact of weather on shared electric scooter utilization. in 2019 IEEE Intelligent Transportation Systems Conference (ITSC). 2019. IEEE.
- Nikiforiadis, A., et al., Analysis of attitudes and engagement of shared e-scooter users. Transportation research part D: transport and environment, 2021. 94: p. 102790.
- Phithakkitnukooon, S., K. Patanukhom, and M.G. Demissie, Predicting spatiotemporal demand of dockless E-scooter sharing services with a masked fully convolutional network. ISPRS International Journal of Geo-Information, 2021. 10(11): p. 773.
- James, O., et al., Pedestrians and e-scooters: An initial look at e-scooter parking and perceptions by riders and non-riders. Sustainability, 2019. 11(20): p. 5591.
- Sanders, R.L., M. Branion-Calles, and T.A. Nelson, To scoot or not to scoot: Findings from a recent survey about the benefits and barriers of using E-scooters for riders and non-riders. Transportation Research Part A: Policy and Practice, 2020. 139: p. 217-227. [CrossRef]
- Younes, H., et al., Comparing the temporal determinants of dockless scooter-share and station-based bike-share in Washington, DC. Transportation Research Part A: Policy and Practice, 2020. 134: p. 308-320. [CrossRef]
- NACTO, Shared Micromobility in the U.S.: 2018. 2018, National Association of City Transportation Officials: United States.
- Chowdhury, A., et al., Shared mobility devices in Arlington. Retrieved from Arlington: https://ralphbu. files. wordpress. com/2019/05/working-draft-report_051419-1. pdf, 2019.
- Laa, B. and U. Leth, Survey of E-scooter users in Vienna: Who they are and how they ride. Journal of transport geography, 2020. 89: p. 102874.
- Insights, C., e micromobility revolution: How bikes and scooters are shaking up urban transport worldwide. 2019, Technical report, CB Insights.
- Kegalle, H., et al., Are footpaths encroached by shared e-scooters? Spatio-temporal Analysis of Micro-mobility Services. arXiv preprint arXiv:2304.08721, 2023.
- Glavić, D., et al., Influence of Dockless Shared E-Scooters on Urban Mobility: WTP and Modal Shift. Sustainability, 2023. 15(12): p. 9570.
- Shah, N.R., et al., Why do people take e-scooter trips? Insights on temporal and spatial usage patterns of detailed trip data. Transportation Research Part A: Policy and Practice, 2023. 173: p. 103705.
- Ravalet, E., Y. Dubois, and V. Kaufmann, Territories of High Mobility: Micro and Macro Analysis, in High Mobility in Europe: Work and Personal Life. 2015, Springer. p. 129-152.
- Putra, I.M., A. Prakoso, and E.A. Setiawan. The utilization of e-scooter on green transit oriented development concept in tropical countries. in AIP Conference Proceedings. 2020. AIP Publishing.
- Reis, A.F., P. Baptista, and F. Moura, How to promote the environmental sustainability of shared e-scooters: A life-cycle analysis based on a case study from Lisbon, Portugal. Journal of Urban Mobility, 2023. 3: p. 100044.
- Javadiansr, M., et al., Coupling shared E-scooters and public transit: a spatial and temporal analysis. Transportation Letters, 2023: p. 1-18.
- Pourfalatoun, S., J. Ahmed, and E.E. Miller, Shared Electric Scooter Users and Non-Users: Perceptions on Safety, Adoption and Risk. Sustainability, 2023. 15(11): p. 9045.
- Ajzen, I., The theory of planned behavior. Organizational behavior and human decision processes, 1991. 50(2): p. 179-211.
- Brown, S.A. and V. Venkatesh, Model of adoption of technology in households: A baseline model test and extension incorporating household life cycle. MIS quarterly, 2005: p. 399-426.
- Handy, S., X. Cao, and P.L. Mokhtarian, Self-selection in the relationship between the built environment and walking: Empirical evidence from Northern California. Journal of the American planning association, 2006. 72(1): p. 55-74.
- Broach, J., J. Dill, and J. Gliebe, Where do cyclists ride? A route choice model developed with revealed preference GPS data. Transportation Research Part A: Policy and Practice, 2012. 46(10): p. 1730-1740. [CrossRef]
- Ewing, R. and R. Cervero, Travel and the built environment: A meta-analysis. Journal of the American planning association, 2010. 76(3): p. 265-294.
- Tokey, A.I., S.A. Shioma, and S. Jamal, Analysis of spatiotemporal dynamics of e-scooter usage in Minneapolis: Effects of the built and social environment. Multimodal Transportation, 2022. 1(4): p. 100037.
- McKenzie, G., Spatiotemporal comparative analysis of scooter-share and bike-share usage patterns in Washington, DC. Journal of transport geography, 2019. 78: p. 19-28.
- Gelman, A. and J. Hill, Data analysis using regression and multilevel/hierarchical models. 2006: Cambridge university press.
- Breiman, L., Random forests. Machine learning, 2001. 45: p. 5-32.
- Almannaa, M.H., et al., Perception analysis of E-scooter riders and non-riders in Riyadh, Saudi Arabia: Survey outputs. Sustainability, 2021. 13(2): p. 863.
- Button, K., H. Frye, and D. Reaves, Economic regulation and E-scooter networks in the USA. Research in transportation economics, 2020. 84: p. 100973.
- Bai, S., et al., The relationship between E-scooter travels and daily leisure activities in Austin, Texas. Transportation research part D: transport and environment, 2021. 95: p. 102844.
- Al-Thawadi, F.E. and S.G. Al-Ghamdi, Evaluation of sustainable urban mobility using comparative environmental life cycle assessment: A case study of Qatar. Transportation research interdisciplinary perspectives, 2019. 1: p. 100003.
- Al-Mohannadi, M., et al., Sustainable Status Assessment of the Transit-Oriented Development in Doha’s Education City. Sustainability, 2023. 15(3): p. 1913.
- Al-Thawadi, F.E., A.-A.A. Banawi, and S.G. Al-Ghamdi, Social impact assessment towards sustainable urban mobility in Qatar: Understanding behavioral change triggers. Transportation research interdisciplinary perspectives, 2021. 9: p. 100295.
- Hardt, C. and K. Bogenberger, Usage of e-scooters in urban environments. Transportation research procedia, 2019. 37: p. 155-162.
- Palantzas, G. and D. Nalmpantis, Data and perspectives on e-scooters use in Greece. Ekistics and The New Habitat, 2021. 81(1): p. 28-36.
- Sellaouti, A., O. Arslan, and S. Hoffmann. Analysis of the use or non-use of e-scooters, their integration in the city of Munich (Germany) and their potential as an additional mobility system. in 2020 IEEE 23rd International Conference on Intelligent Transportation Systems (ITSC). 2020. IEEE.
- Lee, M., et al., Forecasting e-scooter substitution of direct and access trips by mode and distance. Transportation research part D: transport and environment, 2021. 96: p. 102892.
- Gössling, S., Integrating e-scooters in urban transportation: Problems, policies, and the prospect of system change. Transportation Research Part D: Transport and Environment, 2020. 79: p. 102230.
- Bai, S. and J. Jiao, Dockless E-scooter usage patterns and urban built Environments: A comparison study of Austin, TX, and Minneapolis, MN. Travel behaviour and society, 2020. 20: p. 264-272.
- Gebhart, K. and R.B. Noland, The impact of weather conditions on capital bikeshare trips. 2013.
- Ashqar, H.I., M. Elhenawy, and H.A. Rakha, Modeling bike counts in a bike-sharing system considering the effect of weather conditions. Case studies on transport policy, 2019. 7(2): p. 261-268.
- Scott, D.M. and C. Ciuro, What factors influence bike share ridership? An investigation of Hamilton, Ontario’s bike share hubs. Travel behaviour and society, 2019. 16: p. 50-58.
- El-Assi, W., M. Salah Mahmoud, and K. Nurul Habib, Effects of built environment and weather on bike sharing demand: a station level analysis of commercial bike sharing in Toronto. Transportation, 2017. 44(3): p. 589-613.
- Rejali, S., et al., Assessing a priori acceptance of shared dockless e-scooters in Iran. Transportation Research Part D: Transport and Environment, 2021. 100: p. 103042.
- Abouelela, M., E. Chaniotakis, and C. Antoniou, Understanding the landscape of shared-e-scooters in North America; Spatiotemporal analysis and policy insights. Transportation research part A: policy and practice, 2023. 169: p. 103602.
- Orvin, M.M., J.K. Bachhal, and M.R. Fatmi, Modeling the demand for shared e-scooter services. Transportation research record, 2022. 2676(3): p. 429-442.
- Pobudzei, M., et al. Riders on the Storm: Exploring Meteorological and Temporal Impacts on Shared E-Scooters (SES) in Munich, Germany. in 2022 IEEE International Smart Cities Conference (ISC2). 2022. IEEE.
- Tuli, F.M., S. Mitra, and M.B. Crews, Factors influencing the usage of shared E-scooters in Chicago. Transportation research part A: policy and practice, 2021. 154: p. 164-185.
- Noland, R.B., Scootin’in the rain: Does weather affect micromobility? Transportation research part A: policy and practice, 2021. 149: p. 114-123.
- Noland, R.B., Trip patterns and revenue of shared e-scooters in Louisville, Kentucky. Findings, 2019.
- Kimpton, A., et al., E-scooters are becoming wildly popular–but we have to factor in the weather. 2022.
- Kimpton, A., et al., Weather to scoot? How weather shapes shared e-scooter ridership patterns. Journal of Transport Geography, 2022. 104: p. 10343.
- Corcoran, J., et al., Spatio-temporal patterns of a Public Bicycle Sharing Program: the effect of weather and calendar events. Journal of Transport Geography, 2014. 41: p. 292-305.
- WeatherSpark. 2023.
- Feng, Y., et al. Micromobility in smart cities: A closer look at shared dockless e-scooters via big social data. in ICC 2021-IEEE International Conference on Communications. 2021. IEEE.
- Fearnley, N., E. Johnsson, and S.H. Berge, Patterns of e-scooter use in combination with public transport. Findings, 2020.
- Oehme, R., et al., Data-based Usage Analysis of Shared e-scooters in the Context of Public Transport. 2022.
- Mohammadian, A., et al., Analyzing the Impacts of a Successful Diffusion of Shared E-Scooters and Other Micromobility Devices and Efficient Management Strategies for Successful Operations in Illinois. FHWA-ICT-22-006, 2022.
- Wang, K., et al., What travel modes do shared e-scooters displace? A review of recent research findings. Transport Reviews, 2023. 43(1): p. 5-31.
- Kraussa, K., C. Dolla, and C. Thigpenb, The Net Sustainability Impact of Shared Micromobility in Six Global Cities. submitted to Case Studies on Transport Policy, 2022.
- Mclean, R., C. Williamson, and L. Kattan. Simulation Modeling of Urban E-Scooter Mobility. in 2021 29th International Symposium on Modeling, Analysis, and Simulation of Computer and Telecommunication Systems (MASCOTS). 2021. IEEE.
- Guiton, G. and F. Finlay, G174 (P) Electric scooters, their safety and the law around their use in the UK. 2020, BMJ Publishing Group Ltd.
- Hosseinzadeh, A., et al., Spatial analysis of shared e-scooter trips. Journal of transport geography, 2021. 92: p. 103016.
- Fil, M.M., Examining the Factors Leading to The use of E-Scooters in the Context of Micromobility. 2022, Marmara Universitesi (Turkey).
- Alsulami, N., et al., Modeling Dockless Shared E-Scooter Demand by Time of Day: A Case Study of Austin. Journal of Advanced Transportation, 2023. 2023.
- Caspi, O., M.J. Smart, and R.B. Noland, Spatial associations of dockless shared e-scooter usage. Transportation Research Part D: Transport and Environment, 2020. 86: p. 102396.
- Jiao, J. and S. Bai, Understanding the shared e-scooter travels in Austin, TX. ISPRS International Journal of Geo-Information, 2020. 9(2): p. 135.
- Cervero, R. and M. Duncan, Walking, bicycling, and urban landscapes: evidence from the San Francisco Bay Area. American journal of public health, 2003. 93(9): p. 1478-1483.
- Ham, S.W., et al., Spatiotemporal demand prediction model for e-scooter sharing services with latent feature and deep learning. Transportation research record, 2021. 2675(11): p. 34-43.
- Lin, L., Z. He, and S. Peeta, Predicting station-level hourly demand in a large-scale bike-sharing network: A graph convolutional neural network approach. Transportation Research Part C: Emerging Technologies, 2018. 97: p. 258-276.
- Zhou, Y., et al., A Markov chain based demand prediction model for stations in bike sharing systems. Mathematical problems in engineering, 2018. 2018.
- Kim, T.S., W.K. Lee, and S.Y. Sohn, Graph convolutional network approach applied to predict hourly bike-sharing demands considering spatial, temporal, and global effects. PloS one, 2019. 14(9): p. e0220782.
- Kim, S., et al., Predicting Demand for Shared E-Scooter Using Community Structure and Deep Learning Method. Sustainability, 2022. 14(5): p. 2564.
- Zhao, P., et al., A machine learning based approach for predicting usage efficiency of shared e-scooters using vehicle availability data. AGILE: GIScience Series, 2022. 3: p. 1-10.
- Moosavi, S.M.H., et al., Understanding and Predicting the Usage of Shared Electric Scooter Services on University Campuses. Applied Sciences, 2022. 12(18): p. 9392.
- Zhou, H., et al., Sustainable mobility strategies and their impact: a case study using a multimodal activity based model. Case Studies on Transport Policy, 2023. 11: p. 100945.
- Uddin, M., H.-L. Hwang, and M.S. Hasnine, An interpretable machine learning framework to understand bikeshare demand before and during the COVID-19 pandemic in New York City. Transportation Planning and Technology, 2023: p. 1-17.
- Zuniga-Garcia, N., et al., Evaluation of e-scooters as transit last-mile solution. Transportation research part C: emerging technologies, 2022. 139: p. 103660.
- Dündar, S., E.Ş. Berktas, and M.C. Höke. Modelling the Effects of E-Scooters in Urban Traffic Using Artificial Neural Networks. in 2022 Innovations in Intelligent Systems and Applications Conference (ASYU). 2022. IEEE.
- Elhenawy, M., et al., A novel crowdsourcing model for micro-mobility ride-sharing systems. Sensors, 2021. 21(14): p. 4636.
- Yu, J., et al., Optimization model for the supply volume of bike-sharing: Case study in nanjing, china. Information, 2021. 12(5): p. 182.
- Deng, J., et al., The pulse of urban transport: exploring the co-evolving pattern for spatio-temporal forecasting. ACM Transactions on Knowledge Discovery from Data (TKDD), 2021. 15(6): p. 1-25.
- Yu, Z., et al., A Spatiotemporal Prediction Model for Regional Scheduling of Shared Bicycles Based on the INLA Method. Journal of Advanced Transportation, 2021. 2021: p. 1-10.
- Ciociola, A., et al. E-scooter sharing: Leveraging open data for system design. in 2020 IEEE/ACM 24th International Symposium on Distributed Simulation and Real Time Applications (DS-RT). 2020. IEEE.
- Wu, C.Y., C.S. Chiu, and P.F. Kuo. Defining the spatial impacts of changing the youbike fees: A Case Study of Taipei’s Elimination of the “first 30 minutes is free” Policy. in 40th Asian Conference on Remote Sensing: Progress of Remote Sensing Technology for Smart Future, ACRS 2019. 2020.
- Wang, K. and Y.-J. Chen, Joint analysis of the impacts of built environment on bikeshare station capacity and trip attractions. Journal of Transport Geography, 2020. 82: p. 102603.
- Zhang, X., et al. A dynamic shared bikes rebalancing method based on demand prediction. in 2019 IEEE Intelligent Transportation Systems Conference (ITSC). 2019. IEEE.
- Guidon, S., et al., Electric bicycle-sharing: A new competitor in the urban transportation market? An empirical analysis of transaction data. Transportation research record, 2019. 2673(4): p. 15-26.
- Zafar, U., et al. Analysis of GPS-based high resolution vehicle mobility data towards the electrification of transportation in Qatar. in IECON 2022–48th Annual Conference of the IEEE Industrial Electronics Society. 2022. IEEE.
- Kåresdotter, E., et al., First mile/last mile problems in smart and sustainable cities: A case study in Stockholm County. Journal of Urban Technology, 2022. 29(2): p. 115-137.
- Cheng, L., et al., Applying a random forest method approach to model travel mode choice behavior. Travel behaviour and society, 2019. 14: p. 1-10.
- Bhaskar, A. and E. Chung, Passenger segmentation using smart card data. IEEE Transactions on intelligent transportation systems, 2014. 16(3): p. 1537-1548.
- Lu, Y., et al., Commuting mode choice in a high-density city: Do land-use density and diversity matter in Hong Kong? International journal of environmental research and public health, 2018. 15(5): p. 920.
- Breiman, L., Random forests. Machine learning, 2001. 45(1): p. 5-32.
- Breiman, L., et al., Classification and regression trees. 1984.
- Milakis, D., et al., Is micro-mobility sustainable? An overview of implications for accessibility, air pollution, safety, physical activity and subjective wellbeing. Handbook of sustainable transport, 2020: p. 180-189.
Figure 1.
Methodology Flowchart.
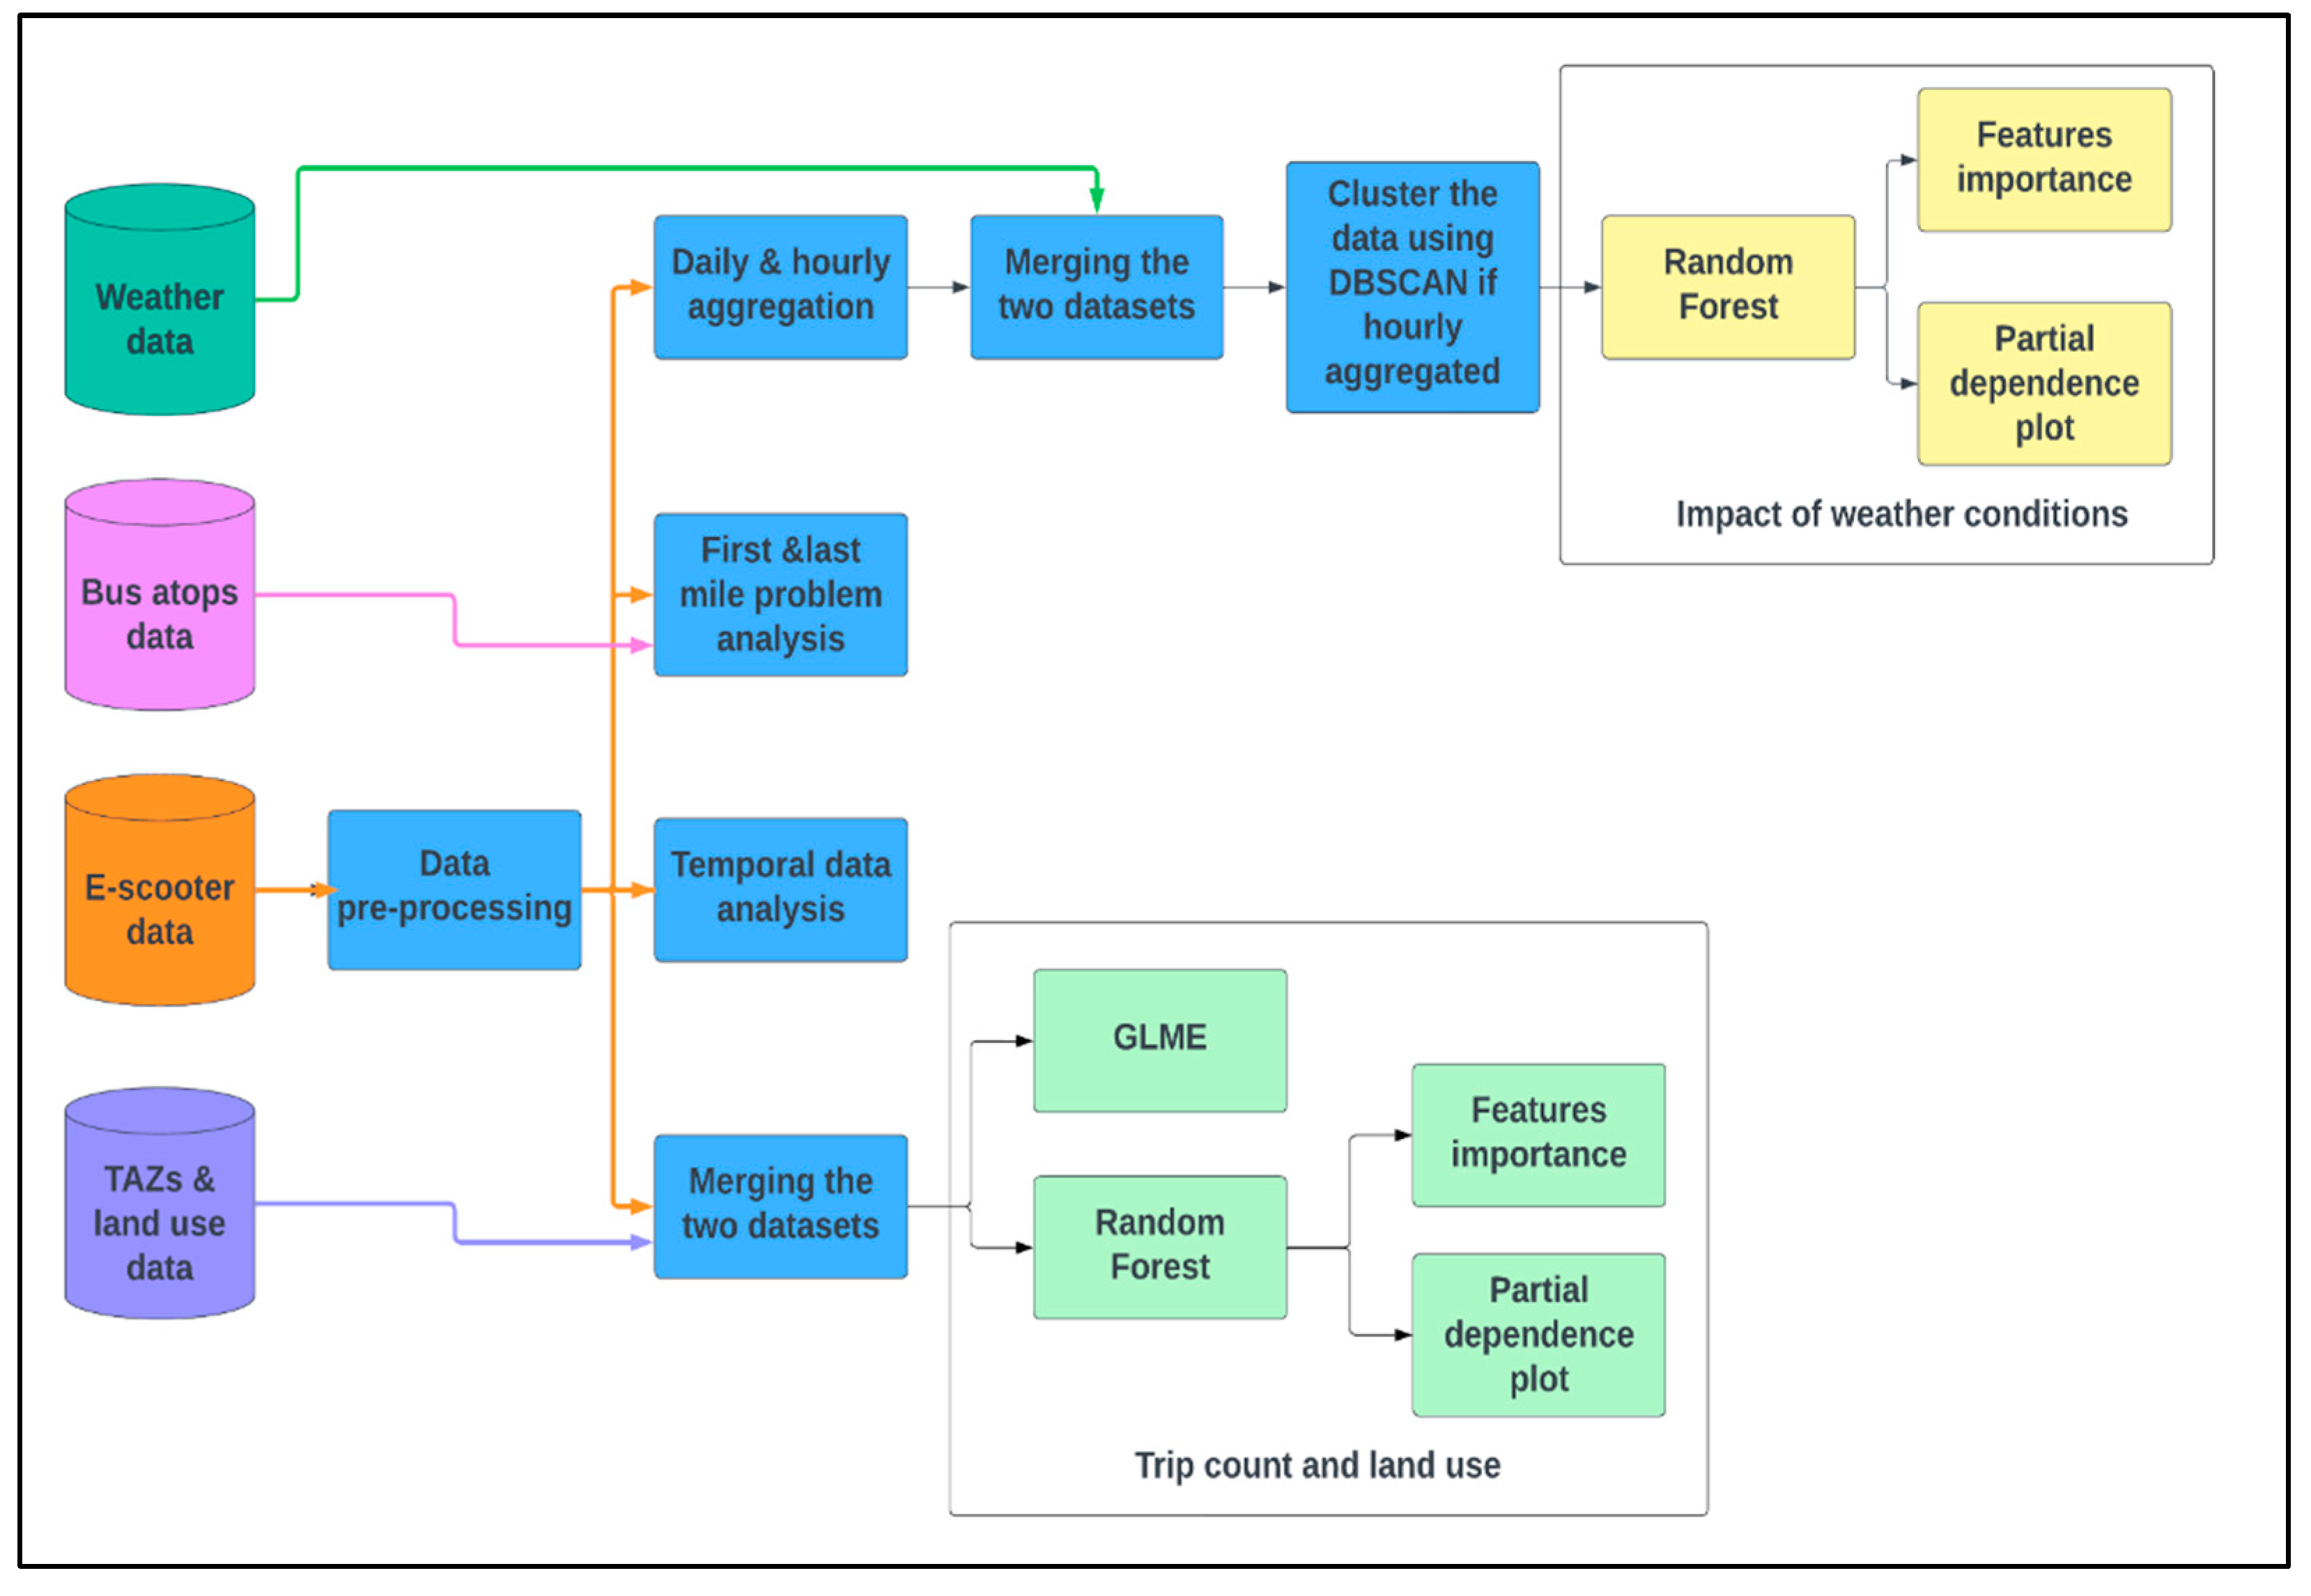
Figure 3.
Distribution of Trip FREQUENCY by Time of the day and Day of the week.
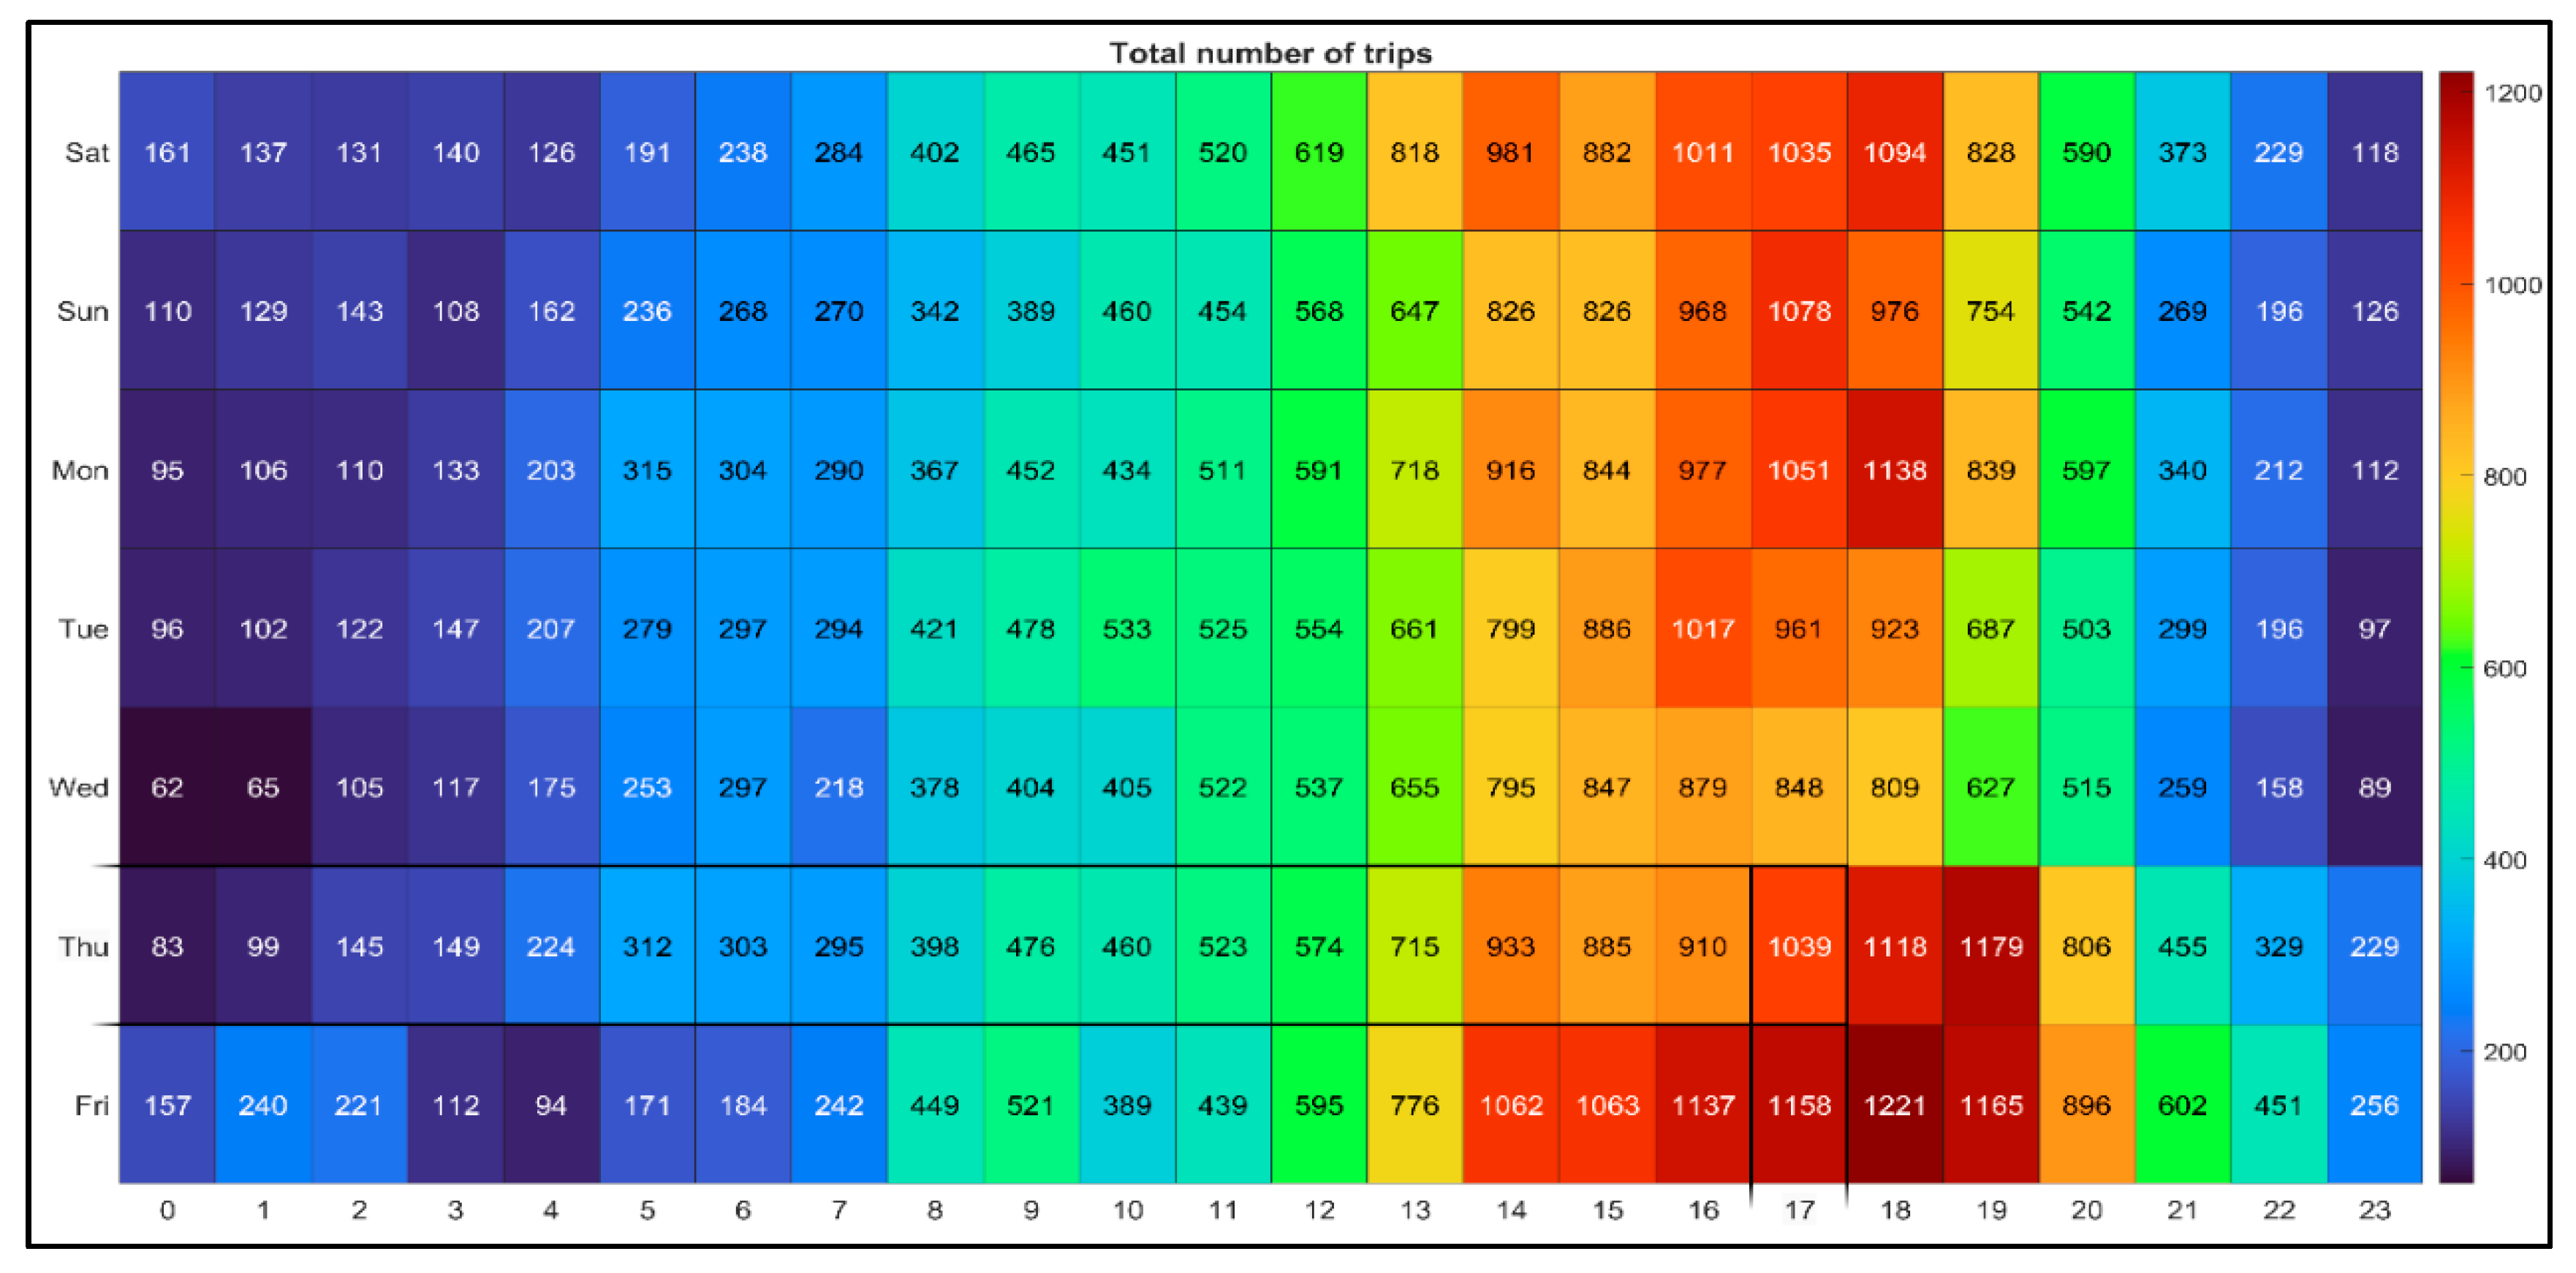
Figure 4.
Distribution of Average Trip DURATION by Time of the day and Day of the week.
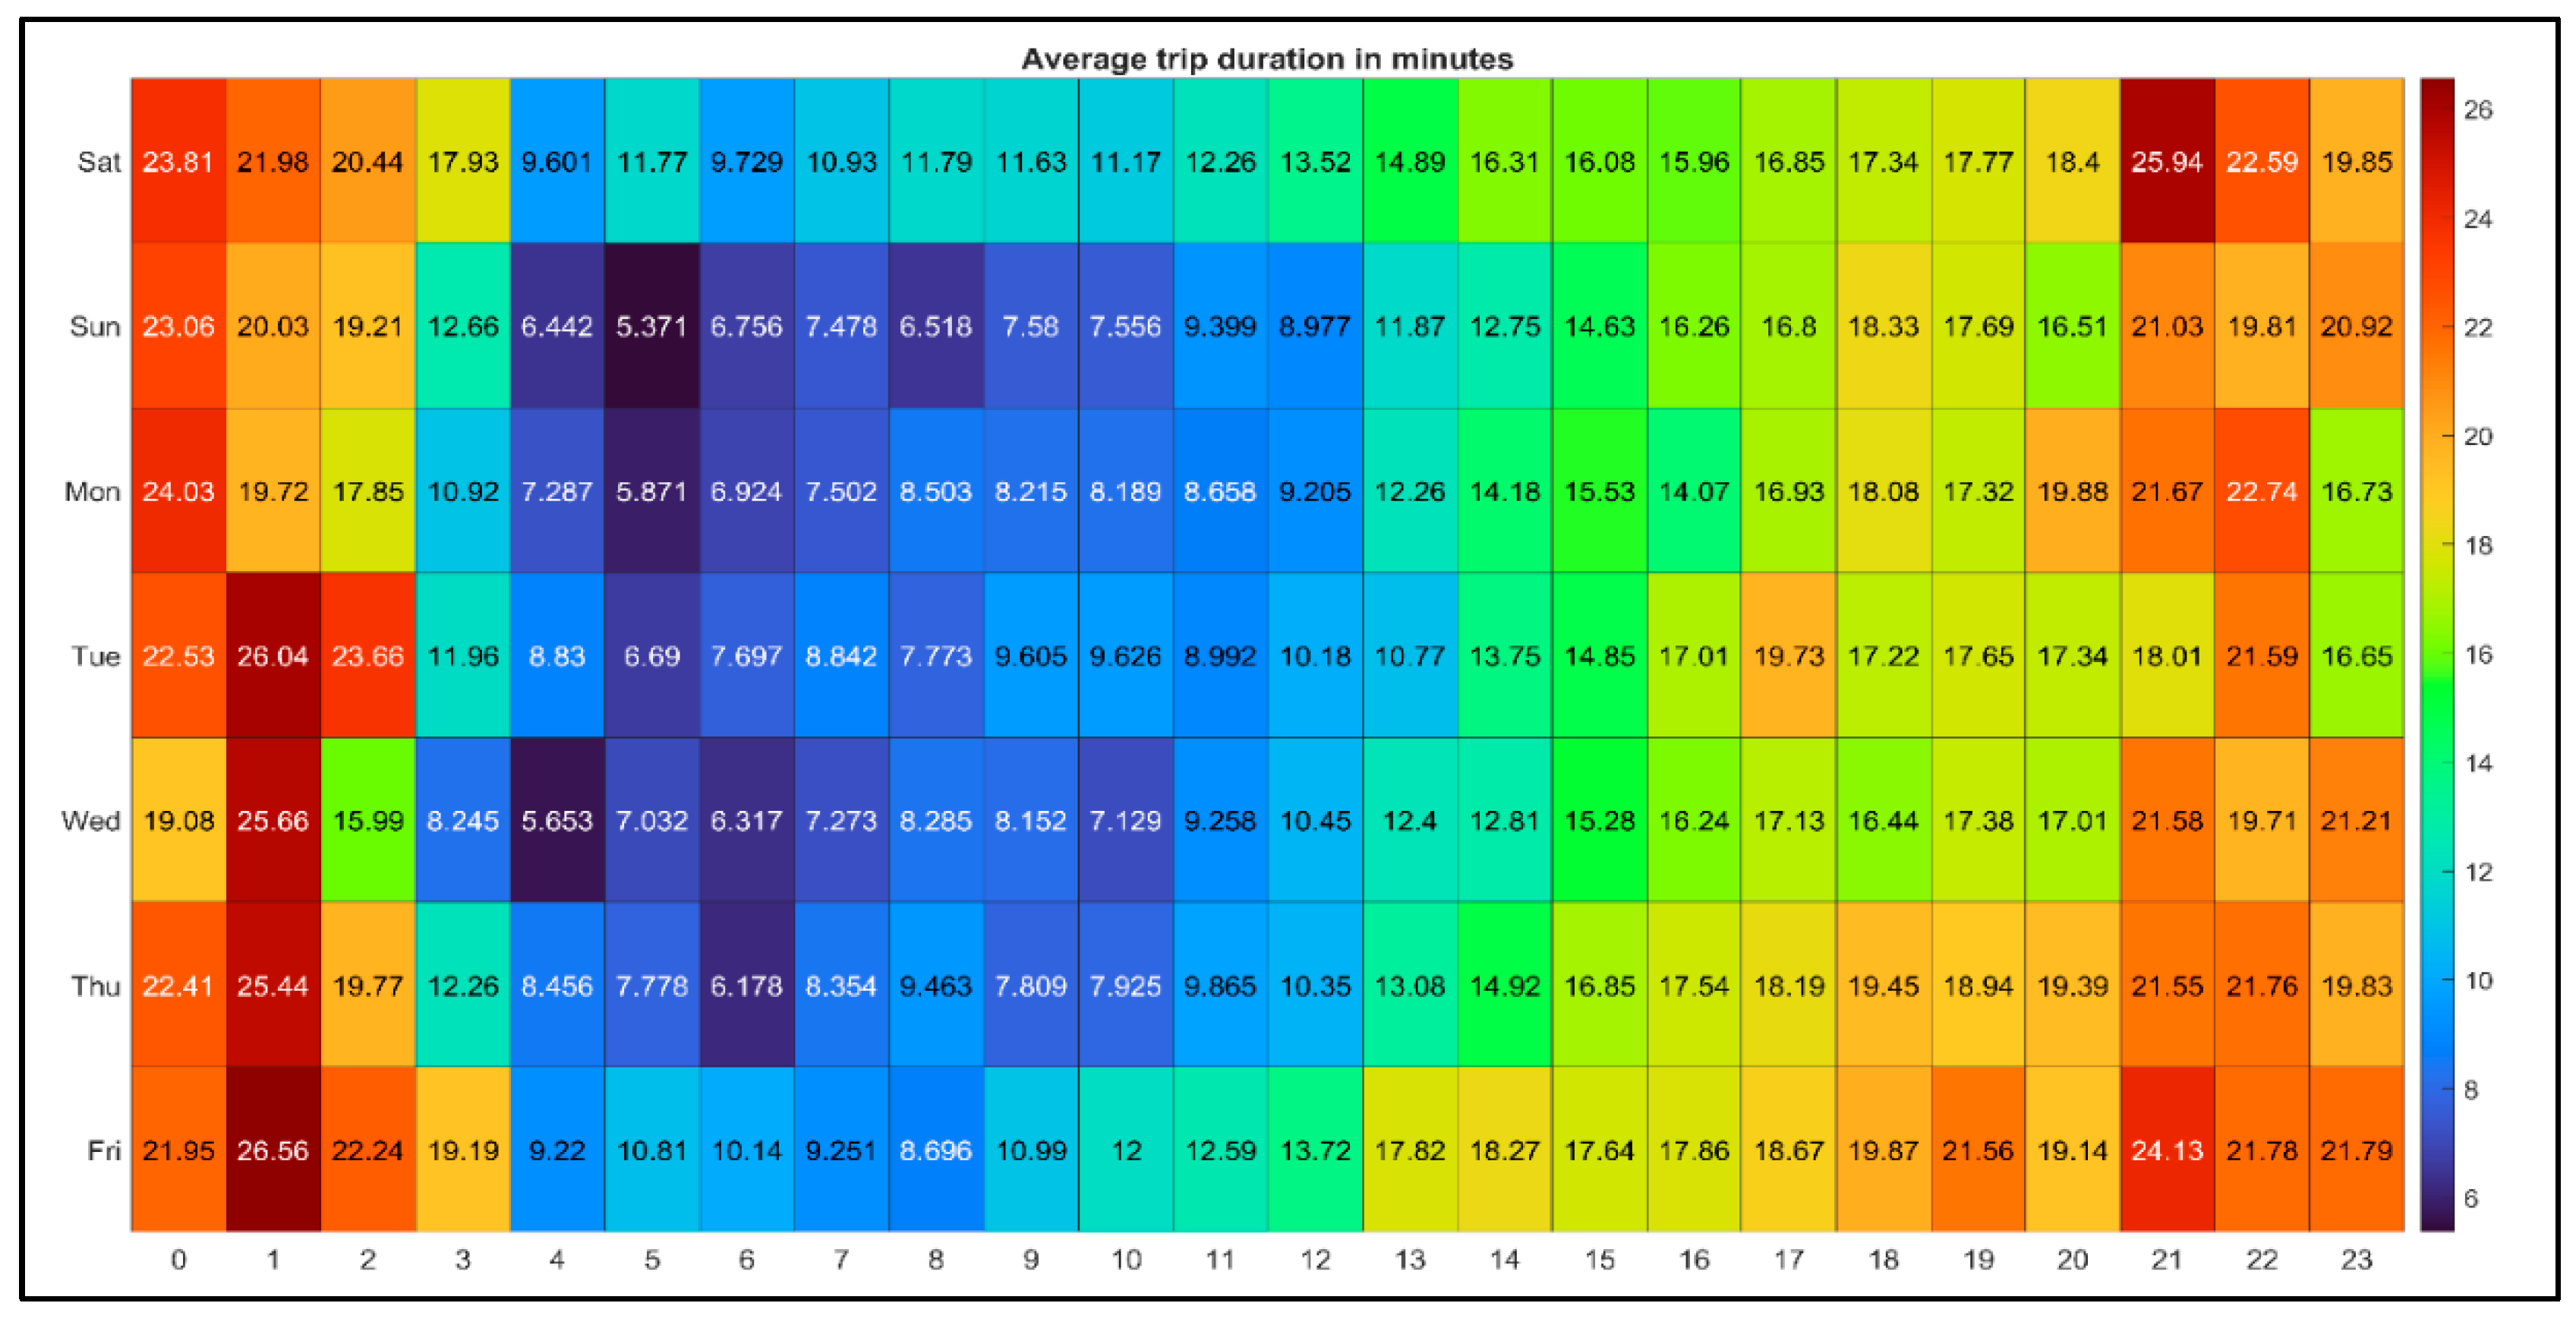
Figure 5.
Distribution of Average Trips DISTANCE by Time of the day and Day of the week.
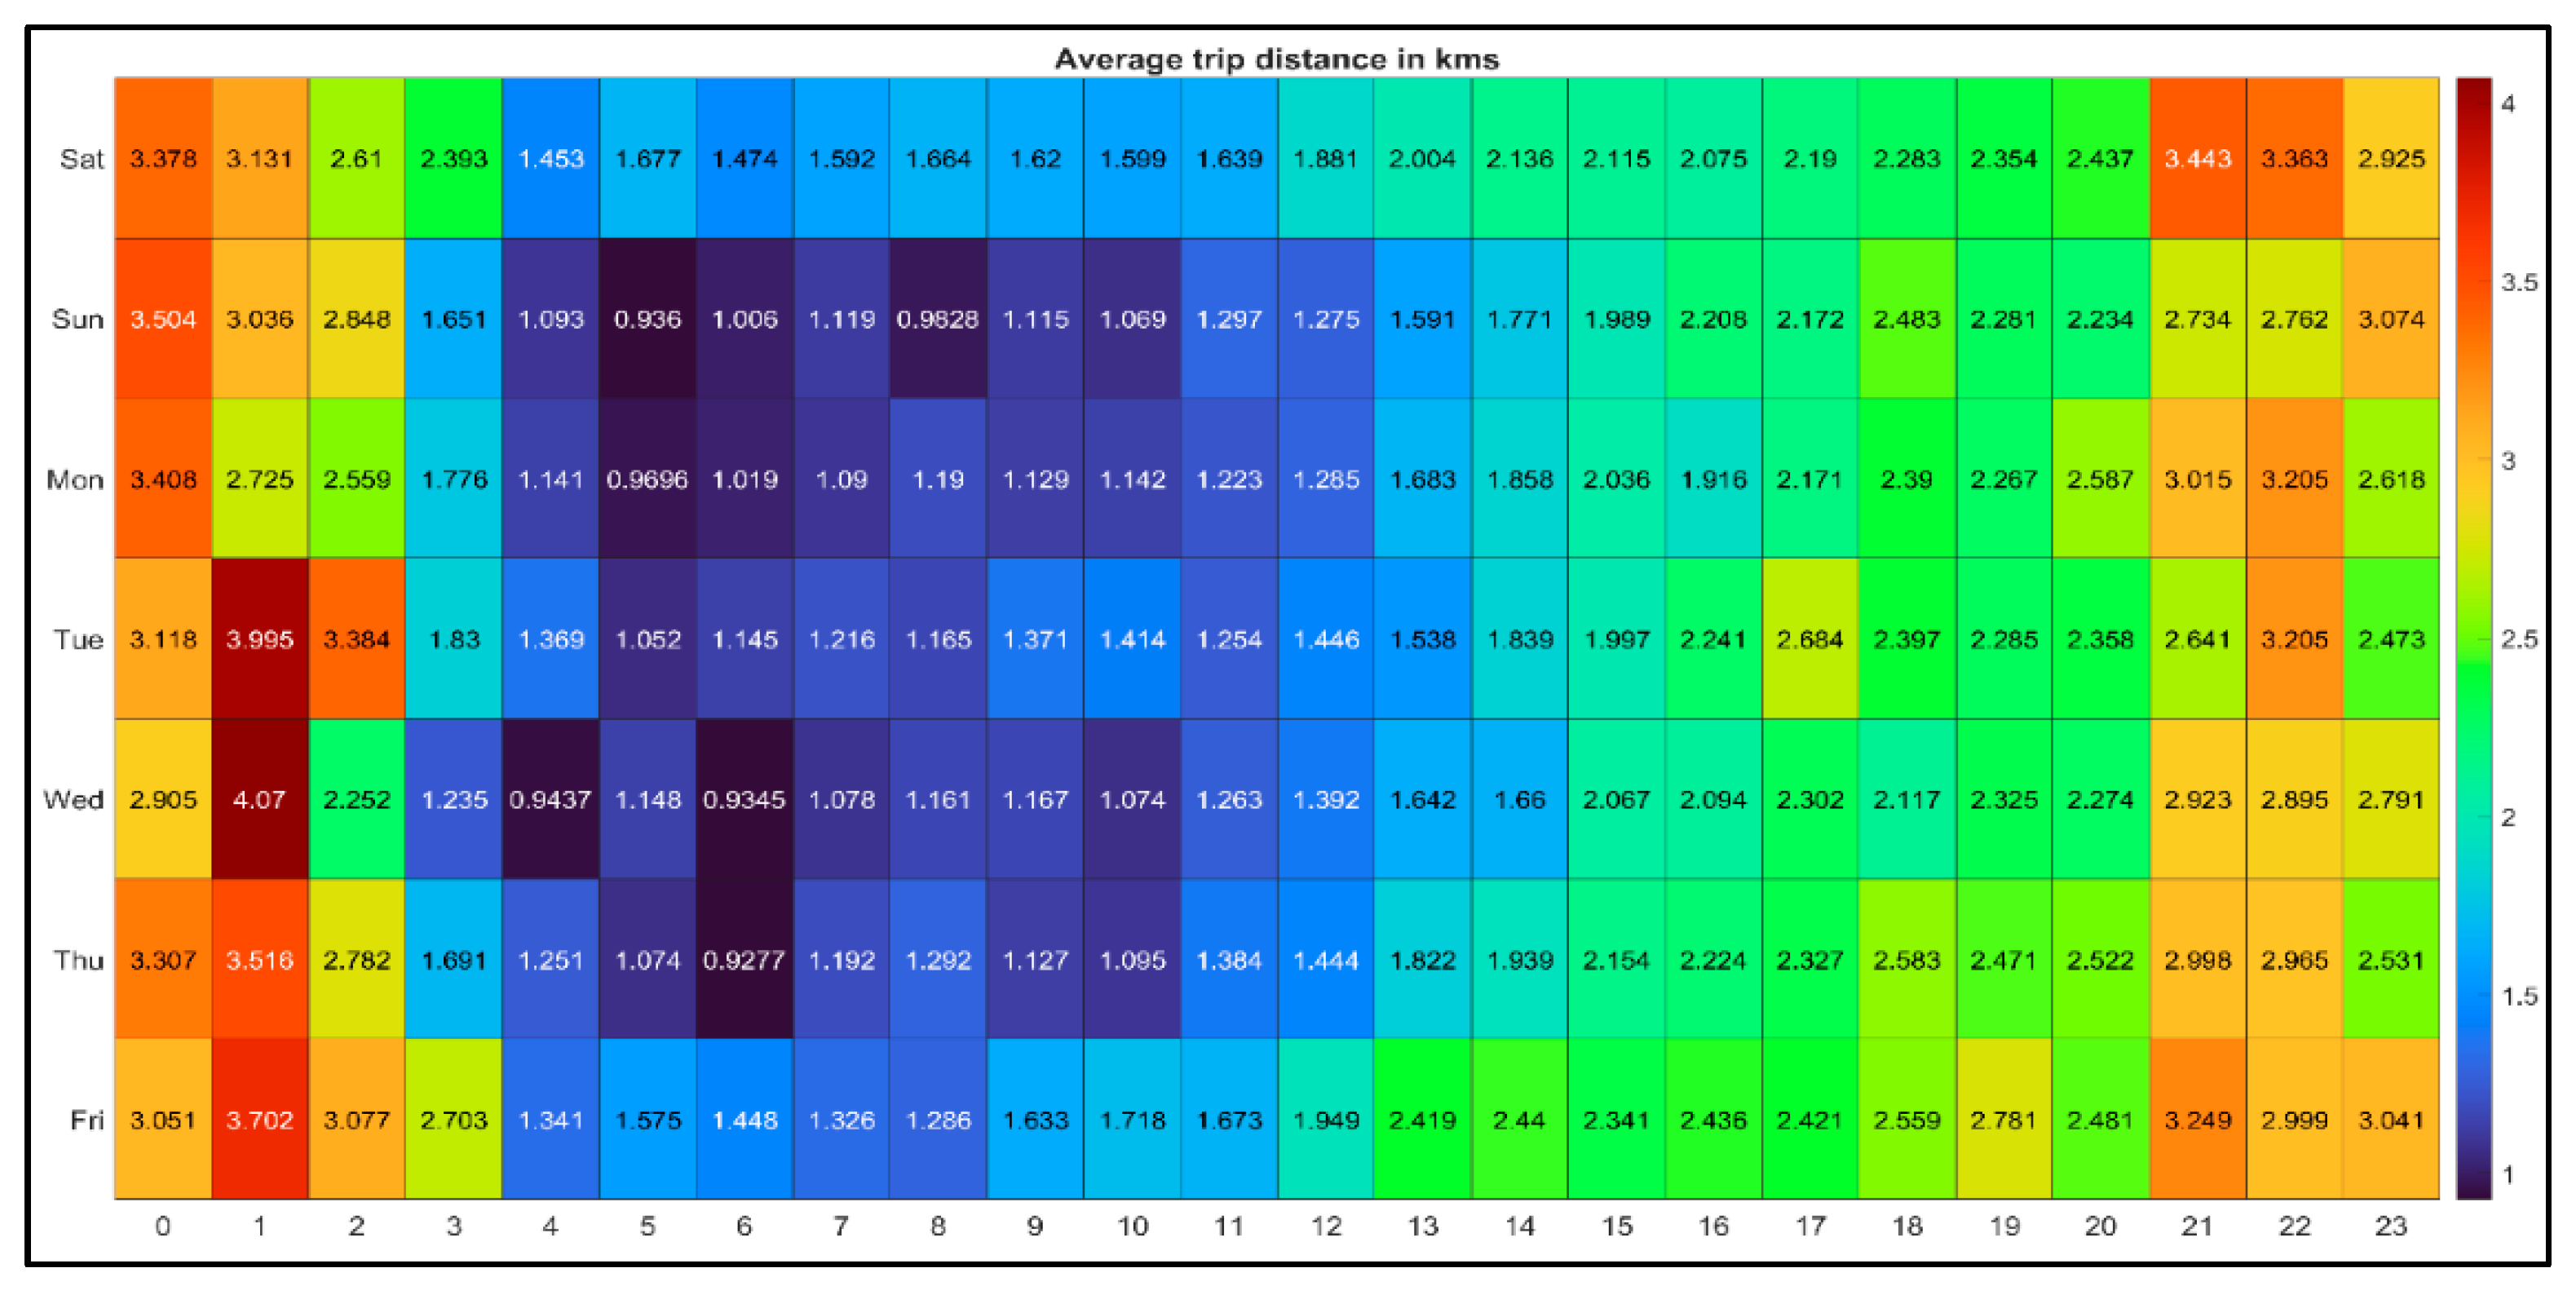
Figure 6.
Empirical Cumulative Distribution Function (CDF) of Line Distance Between Trip Start and End Locations and Nearest Bus Stop.
Figure 6.
Empirical Cumulative Distribution Function (CDF) of Line Distance Between Trip Start and End Locations and Nearest Bus Stop.
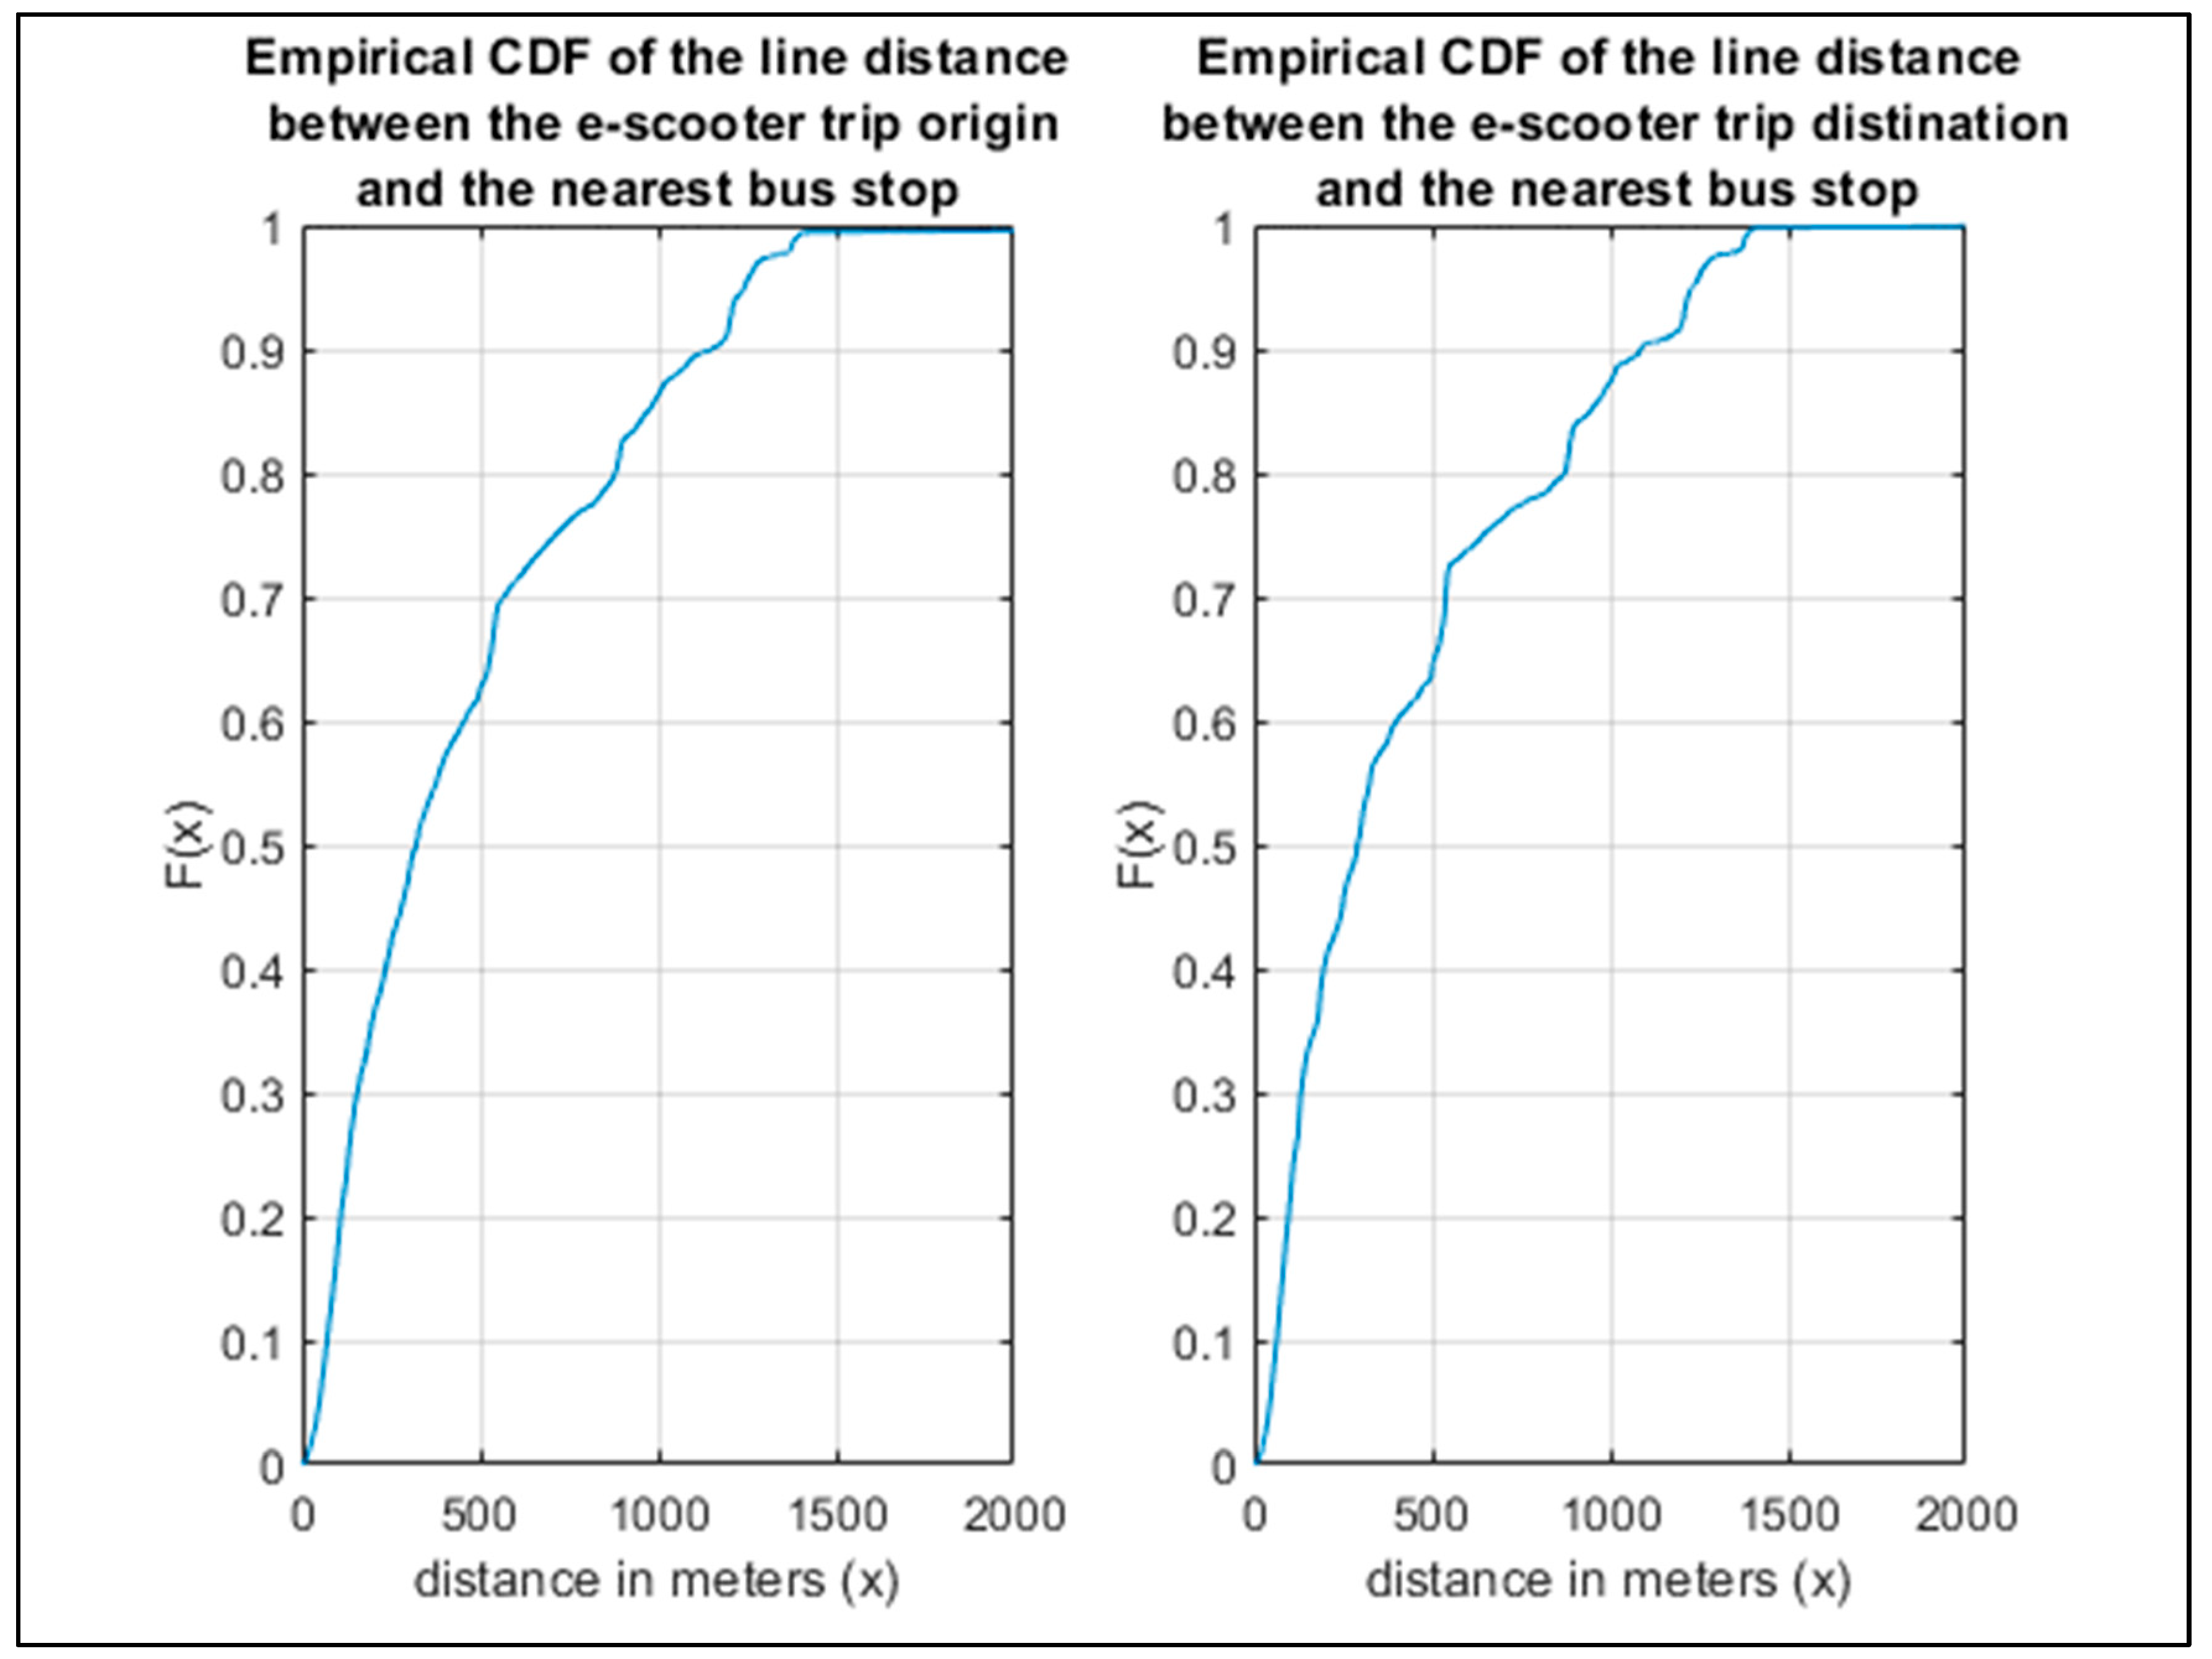
Figure 7.
Comparison of Histograms of Total Trip Distance of Potential First Mile and Other Trip Legs.
Figure 7.
Comparison of Histograms of Total Trip Distance of Potential First Mile and Other Trip Legs.
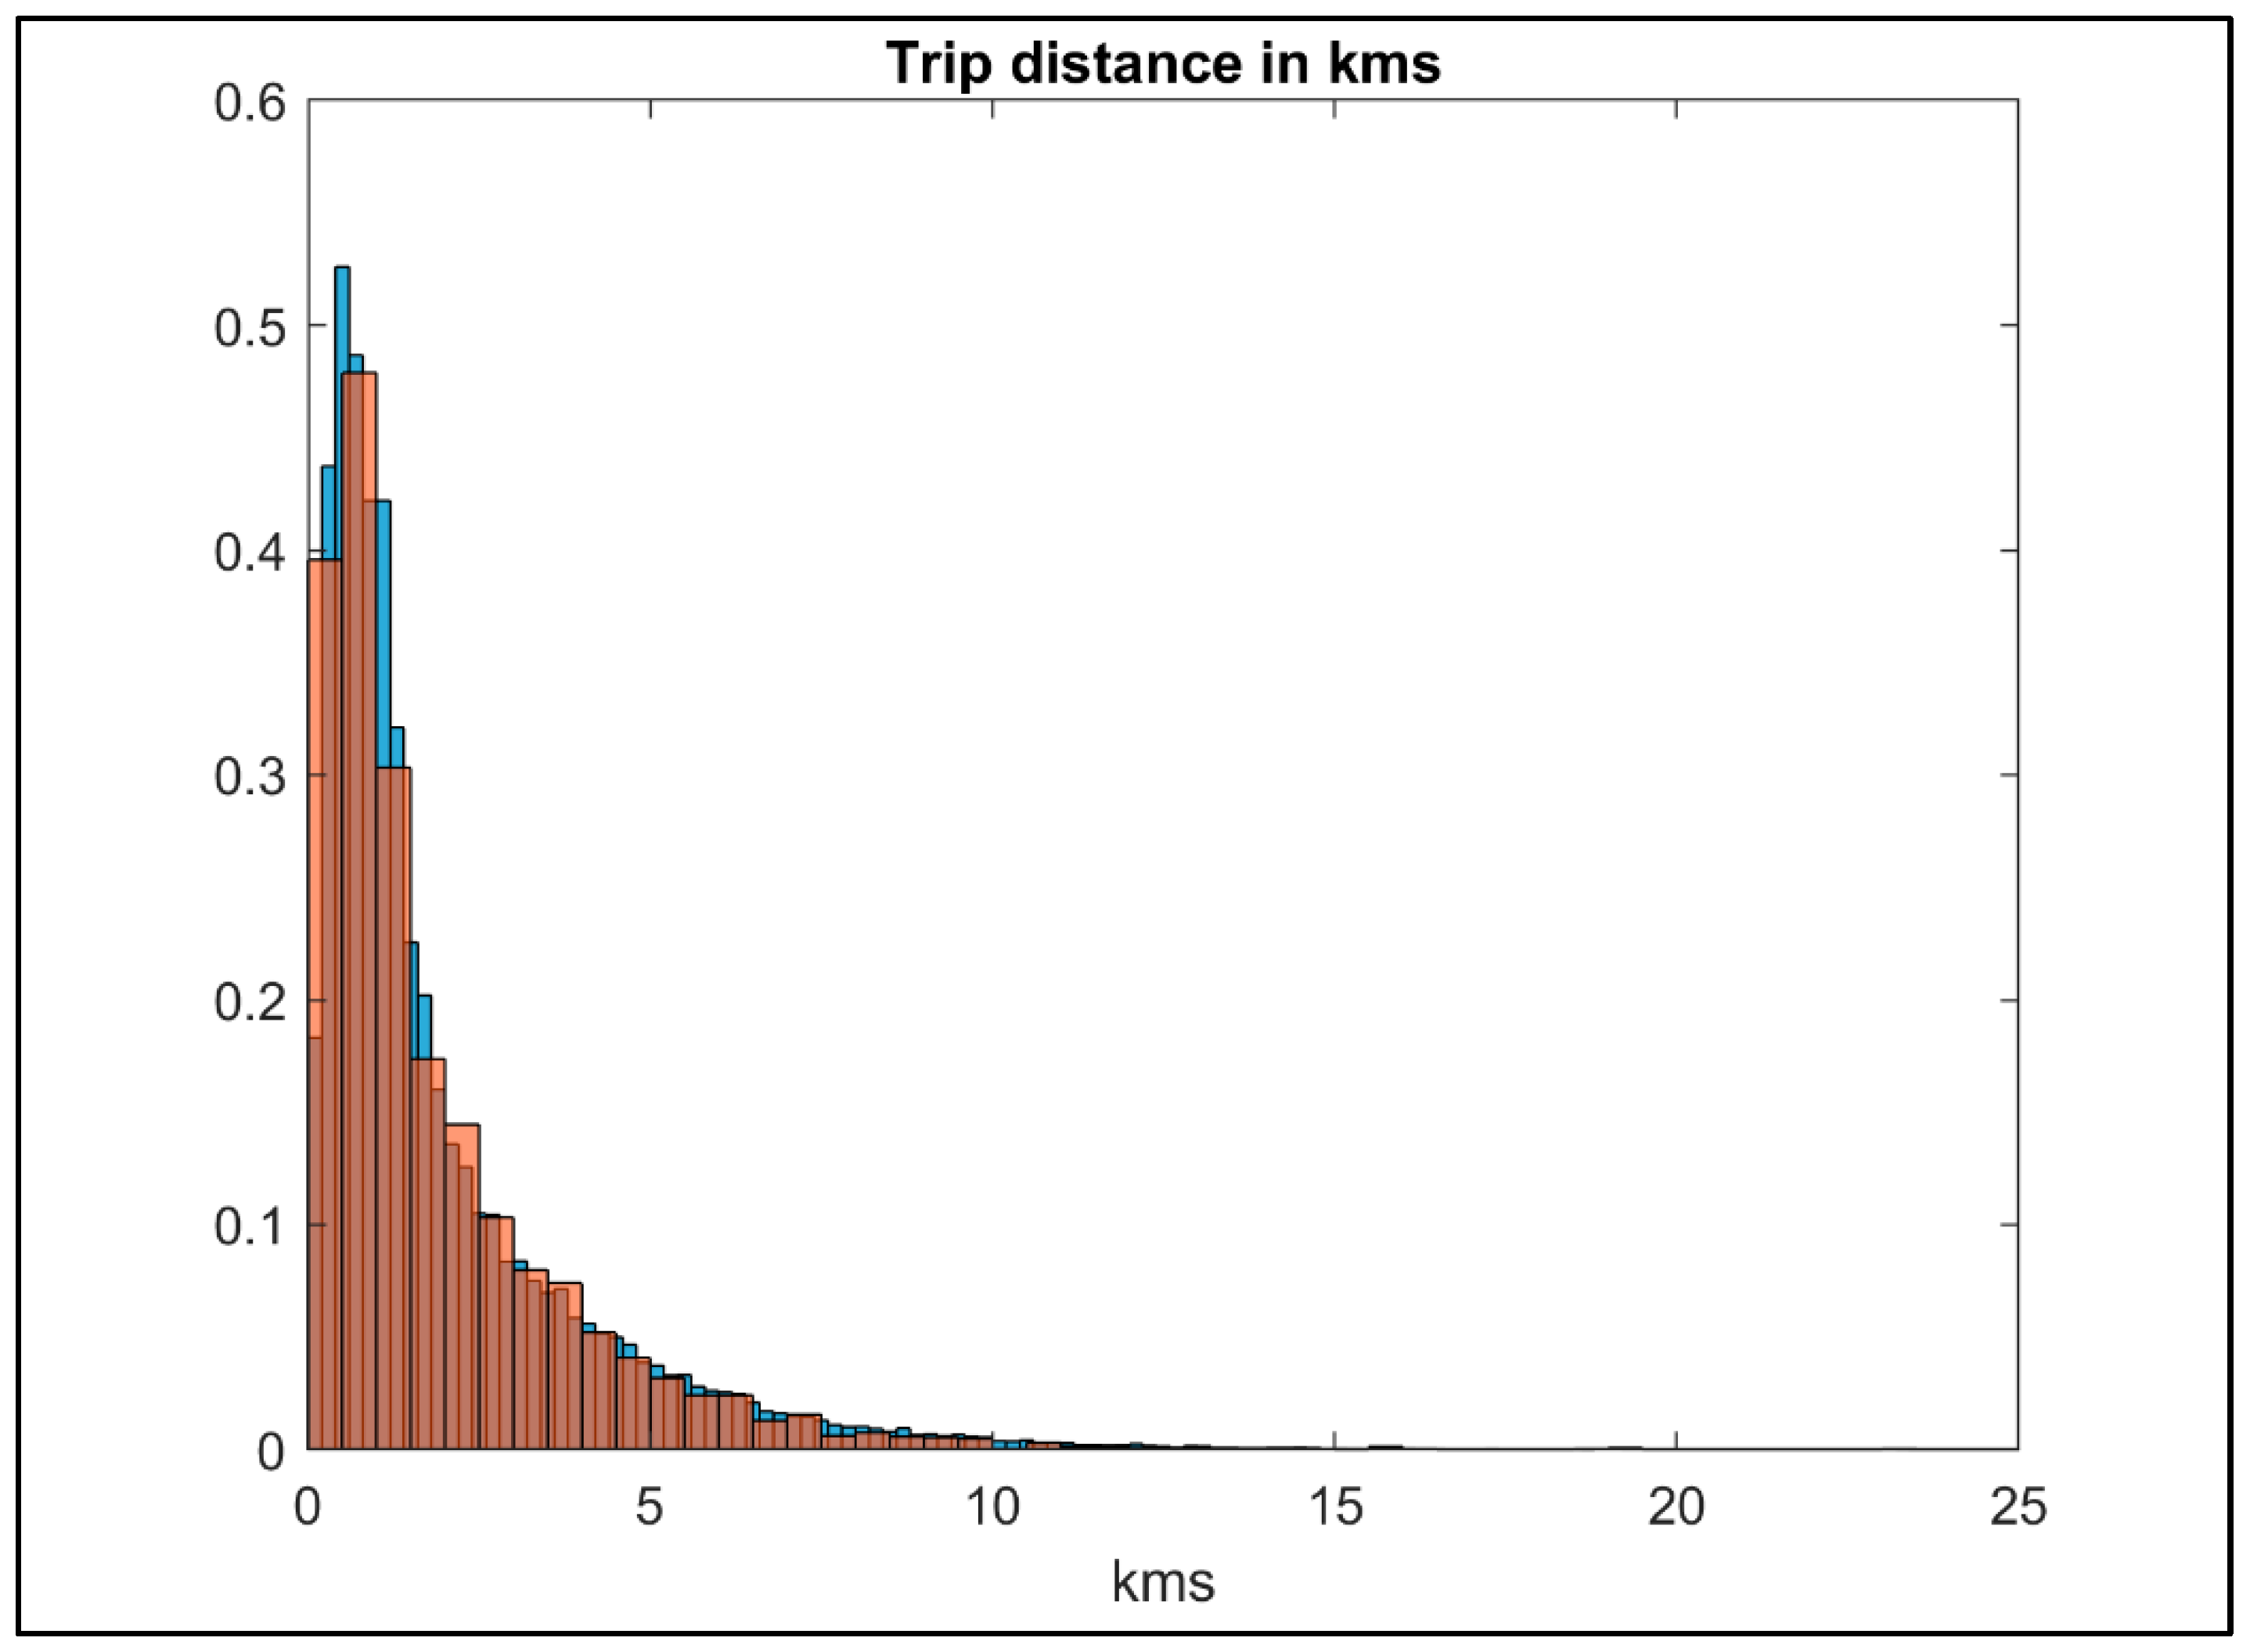
Figure 8.
Comparison of Histograms of Total Trip Distance of Potential Last Mile and Other Trip Legs.
Figure 8.
Comparison of Histograms of Total Trip Distance of Potential Last Mile and Other Trip Legs.
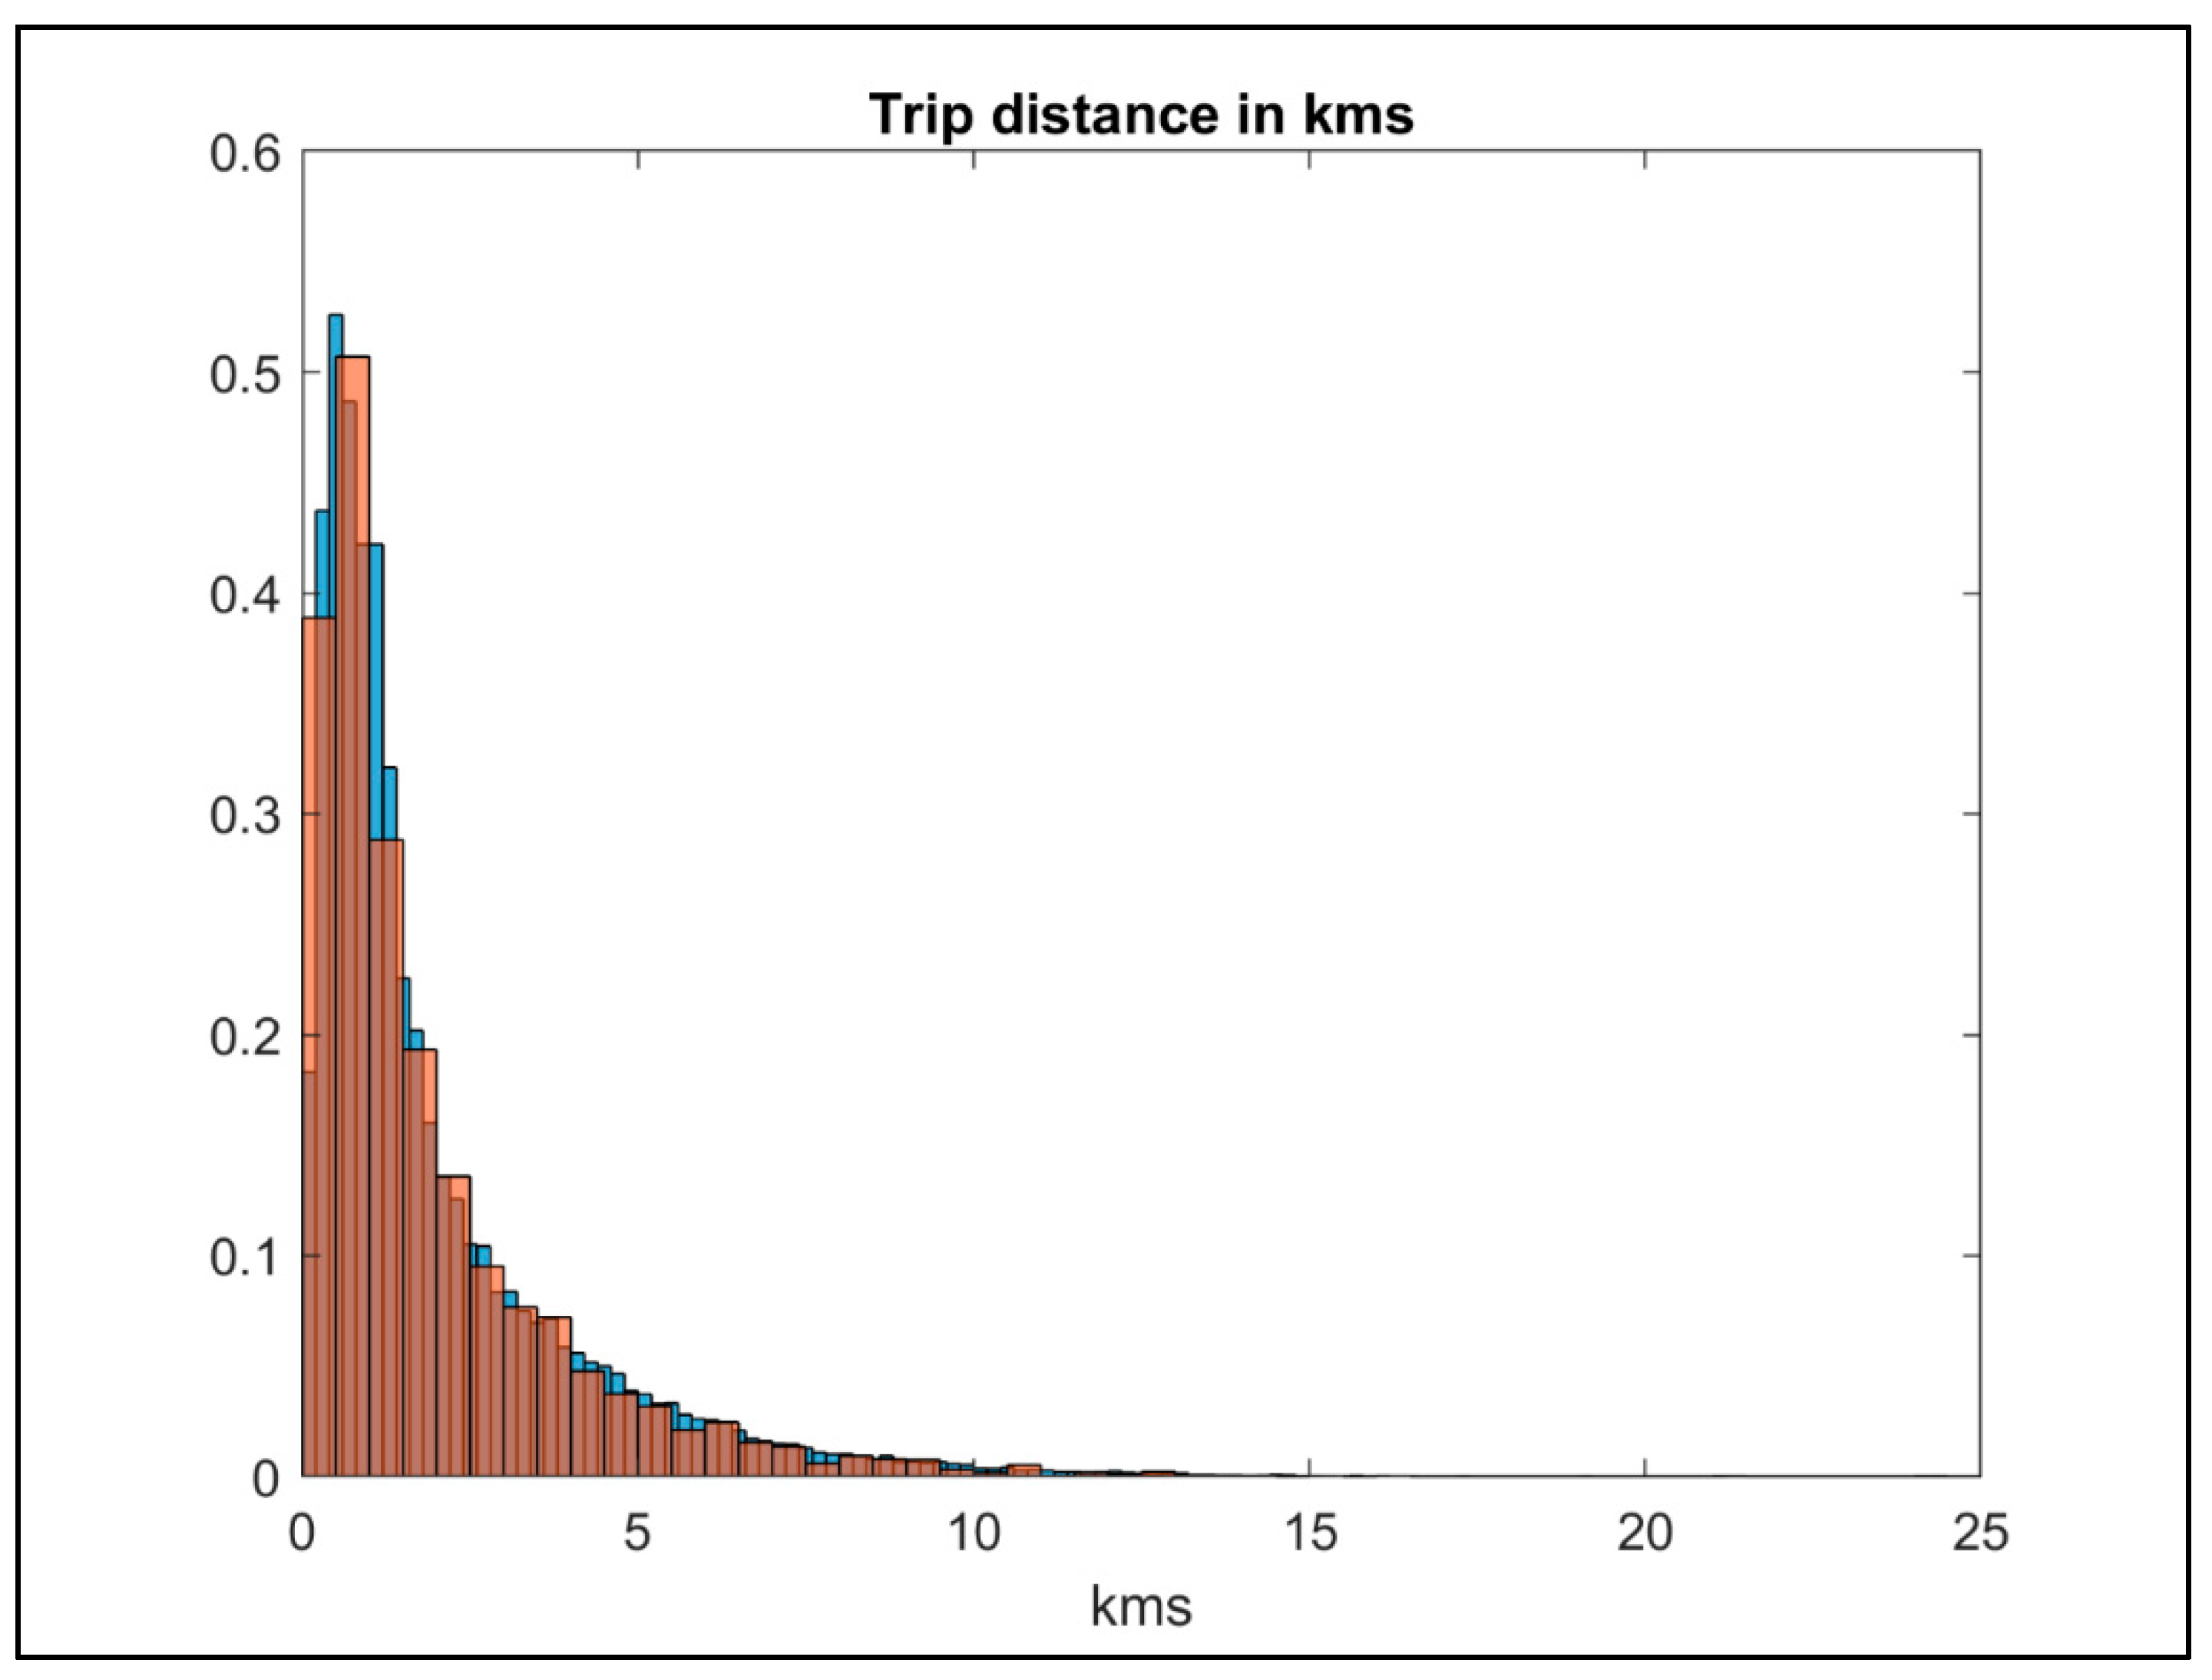
Figure 9.
Visual Inspection of the Trained Model Quality.
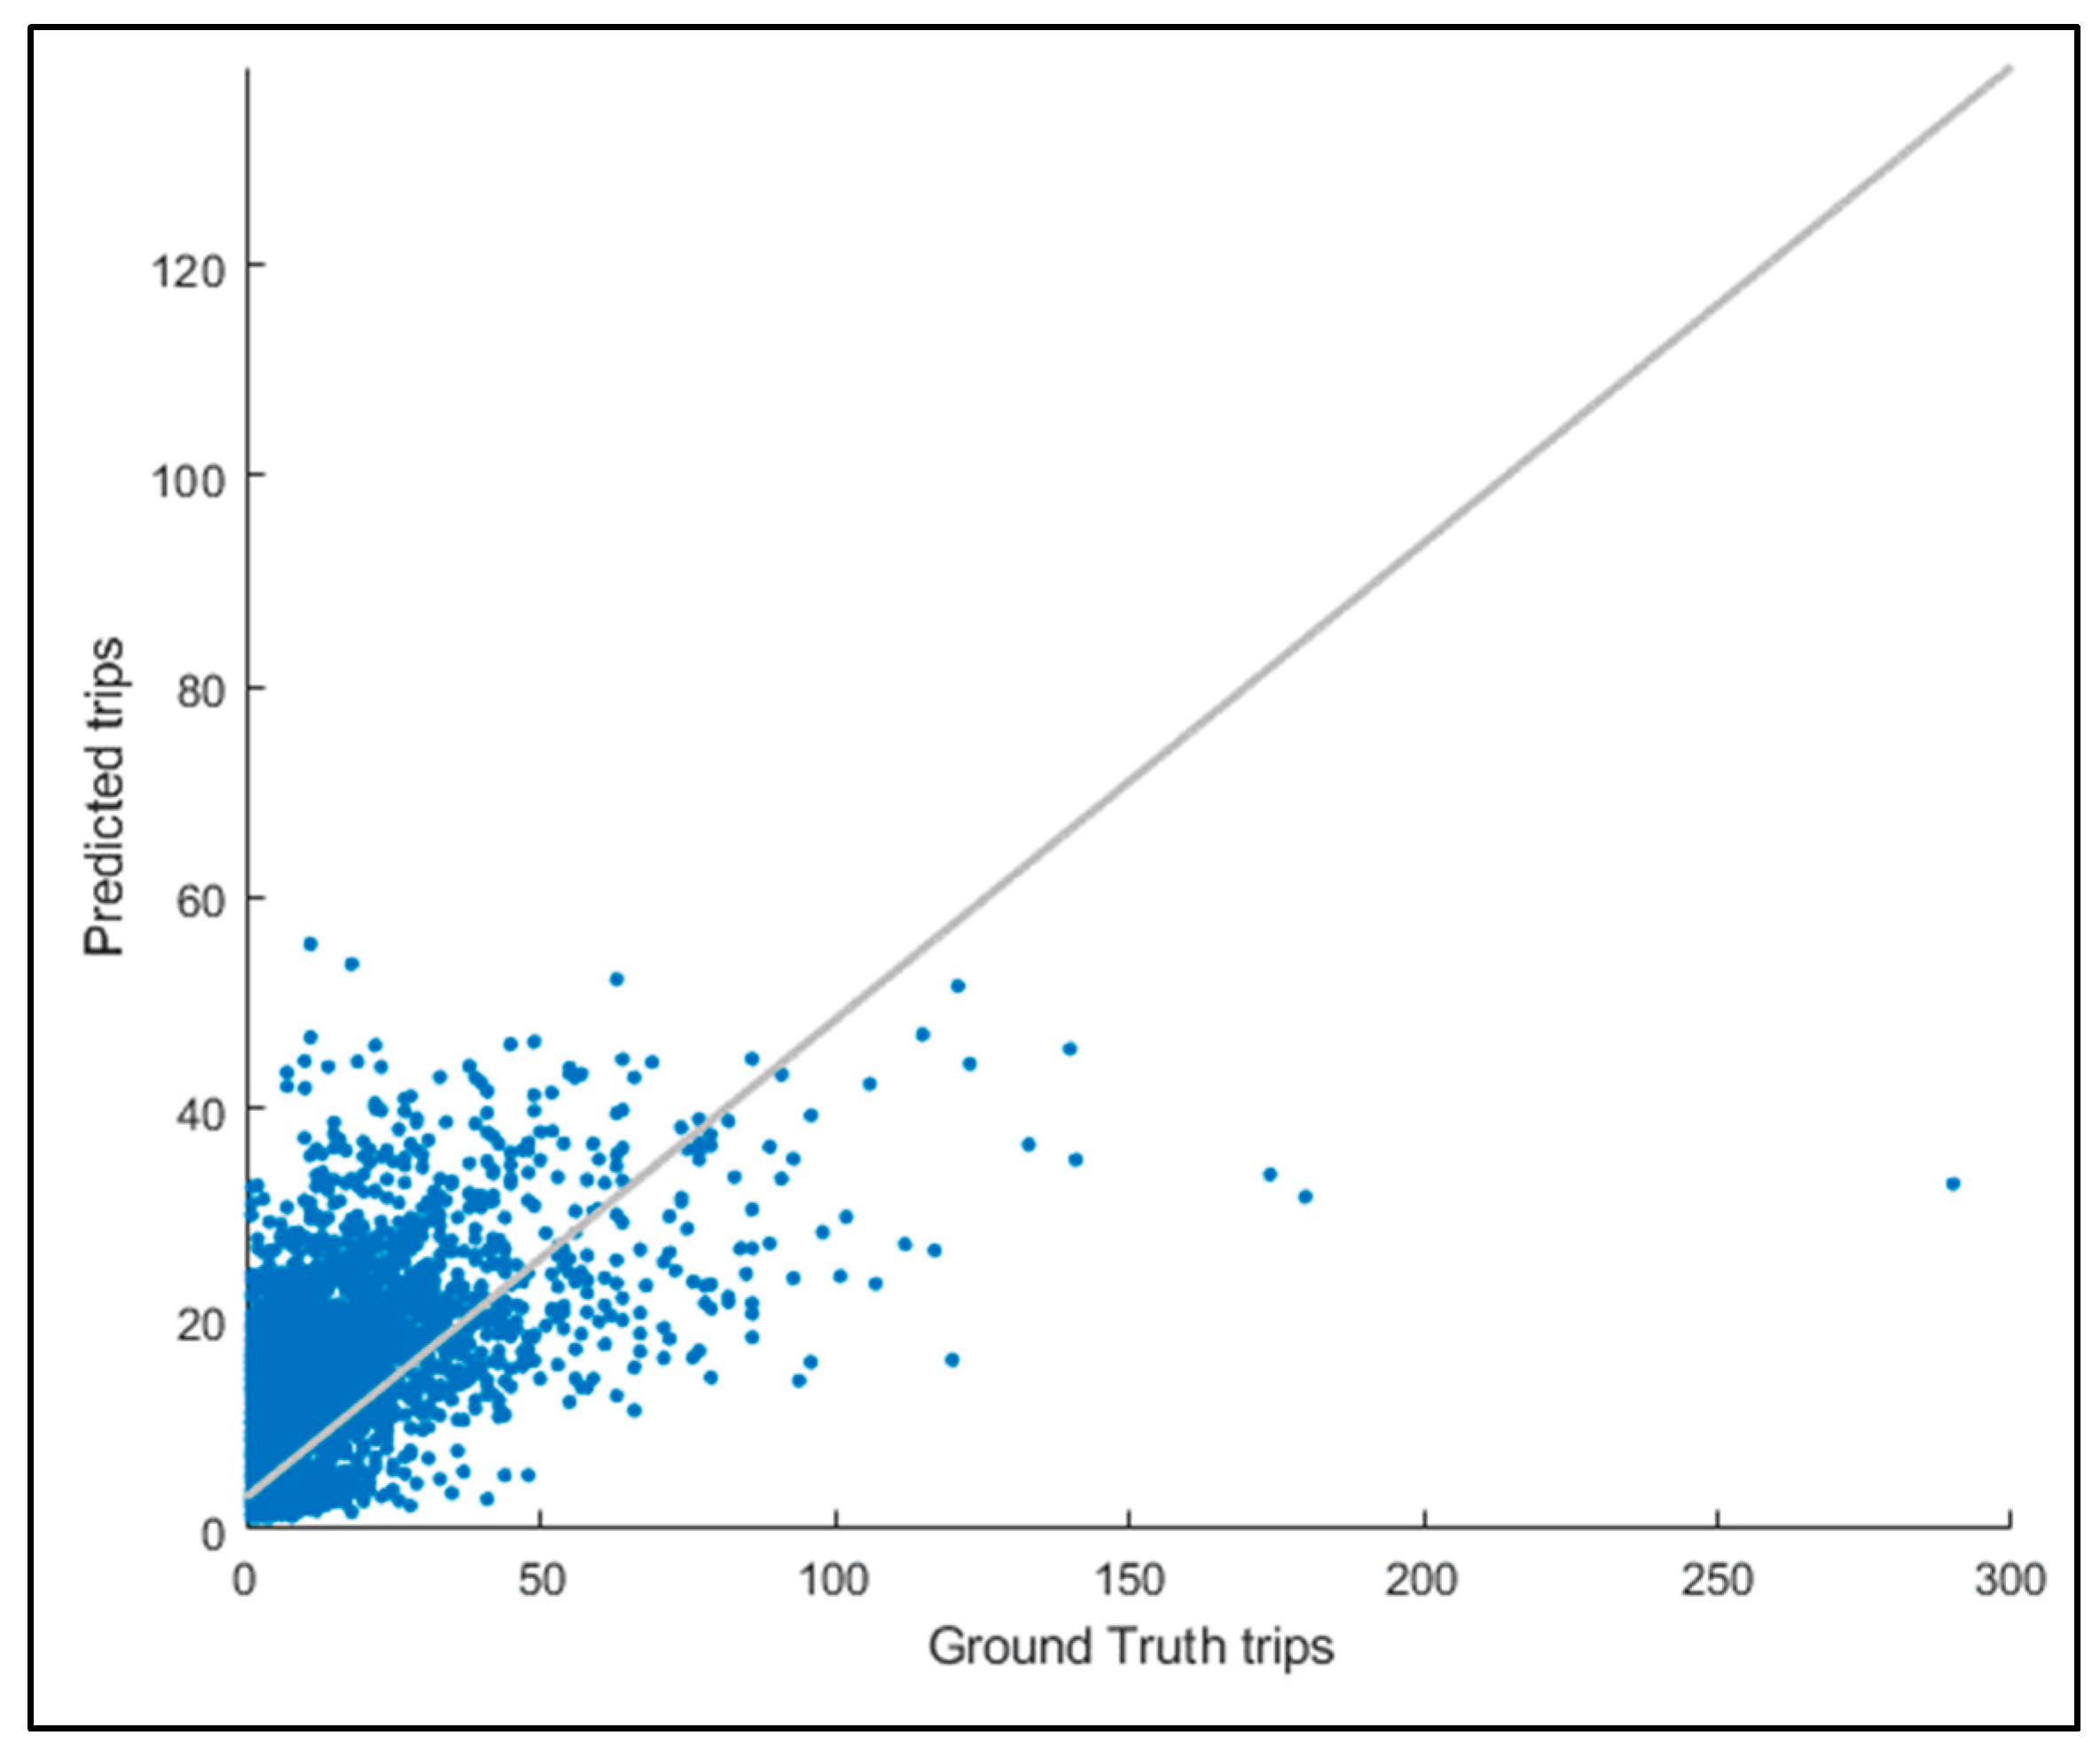
Figure 10.
Feature Importance Analysis of the Land Use and Trip Counts Model.
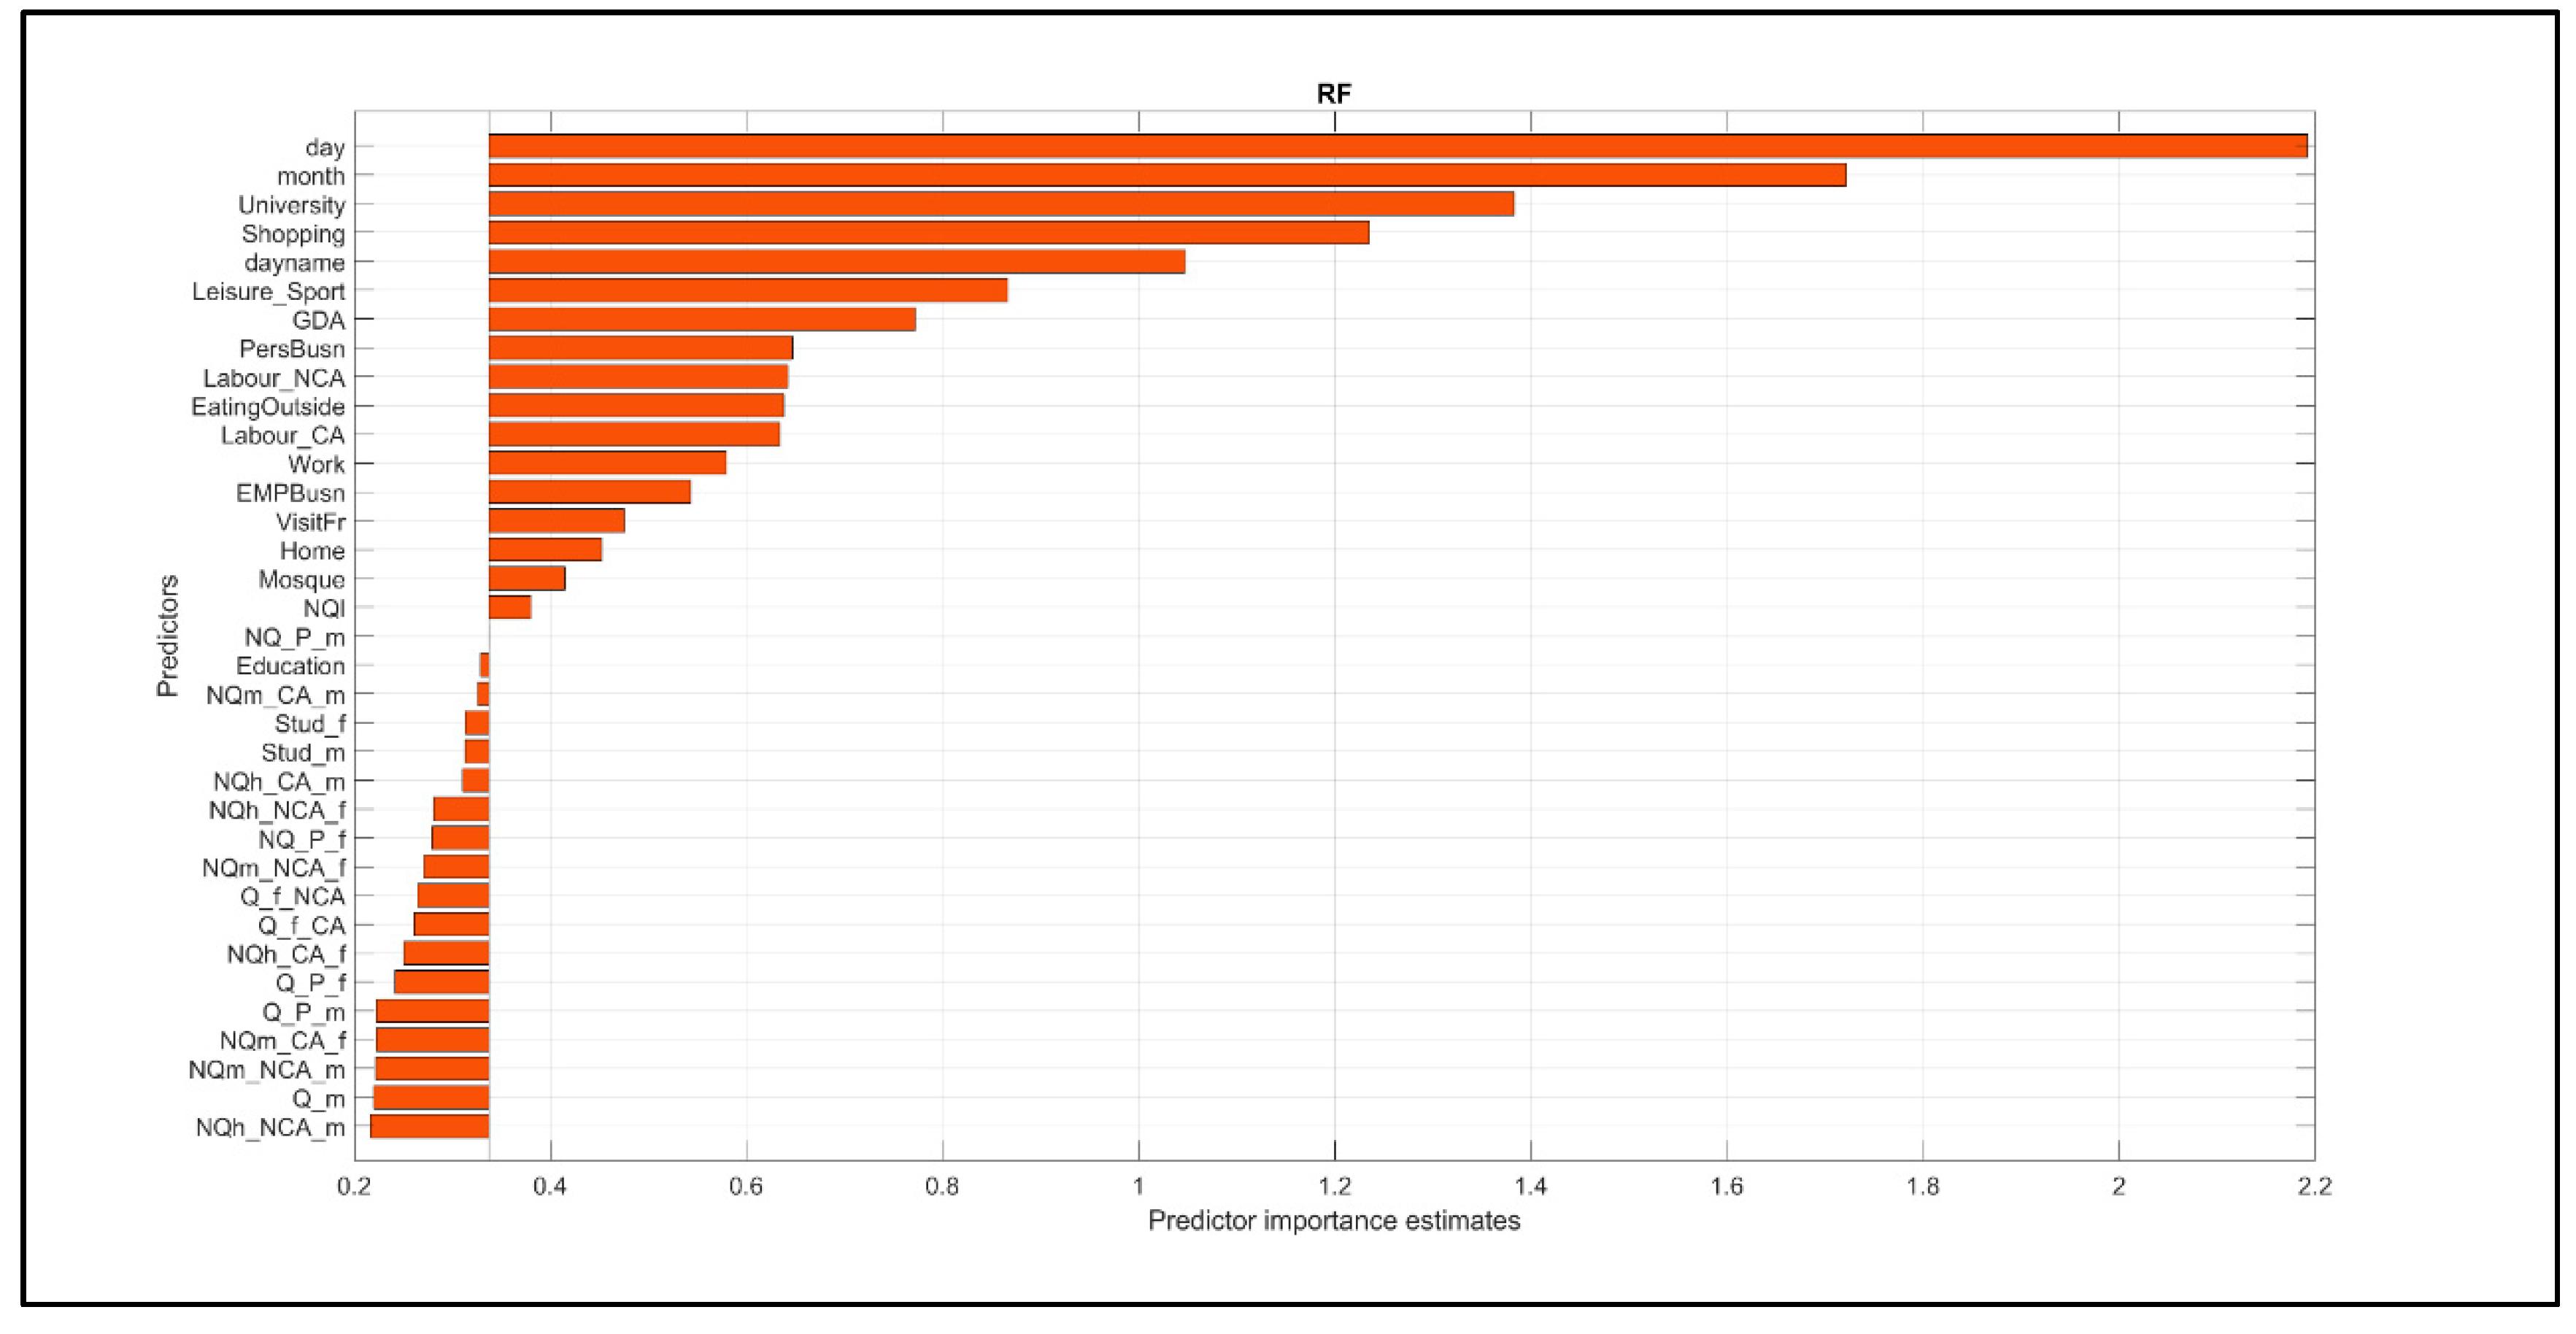
Figure 11.
Partial Dependence Plot of the Six Statistically Significant Predictors.
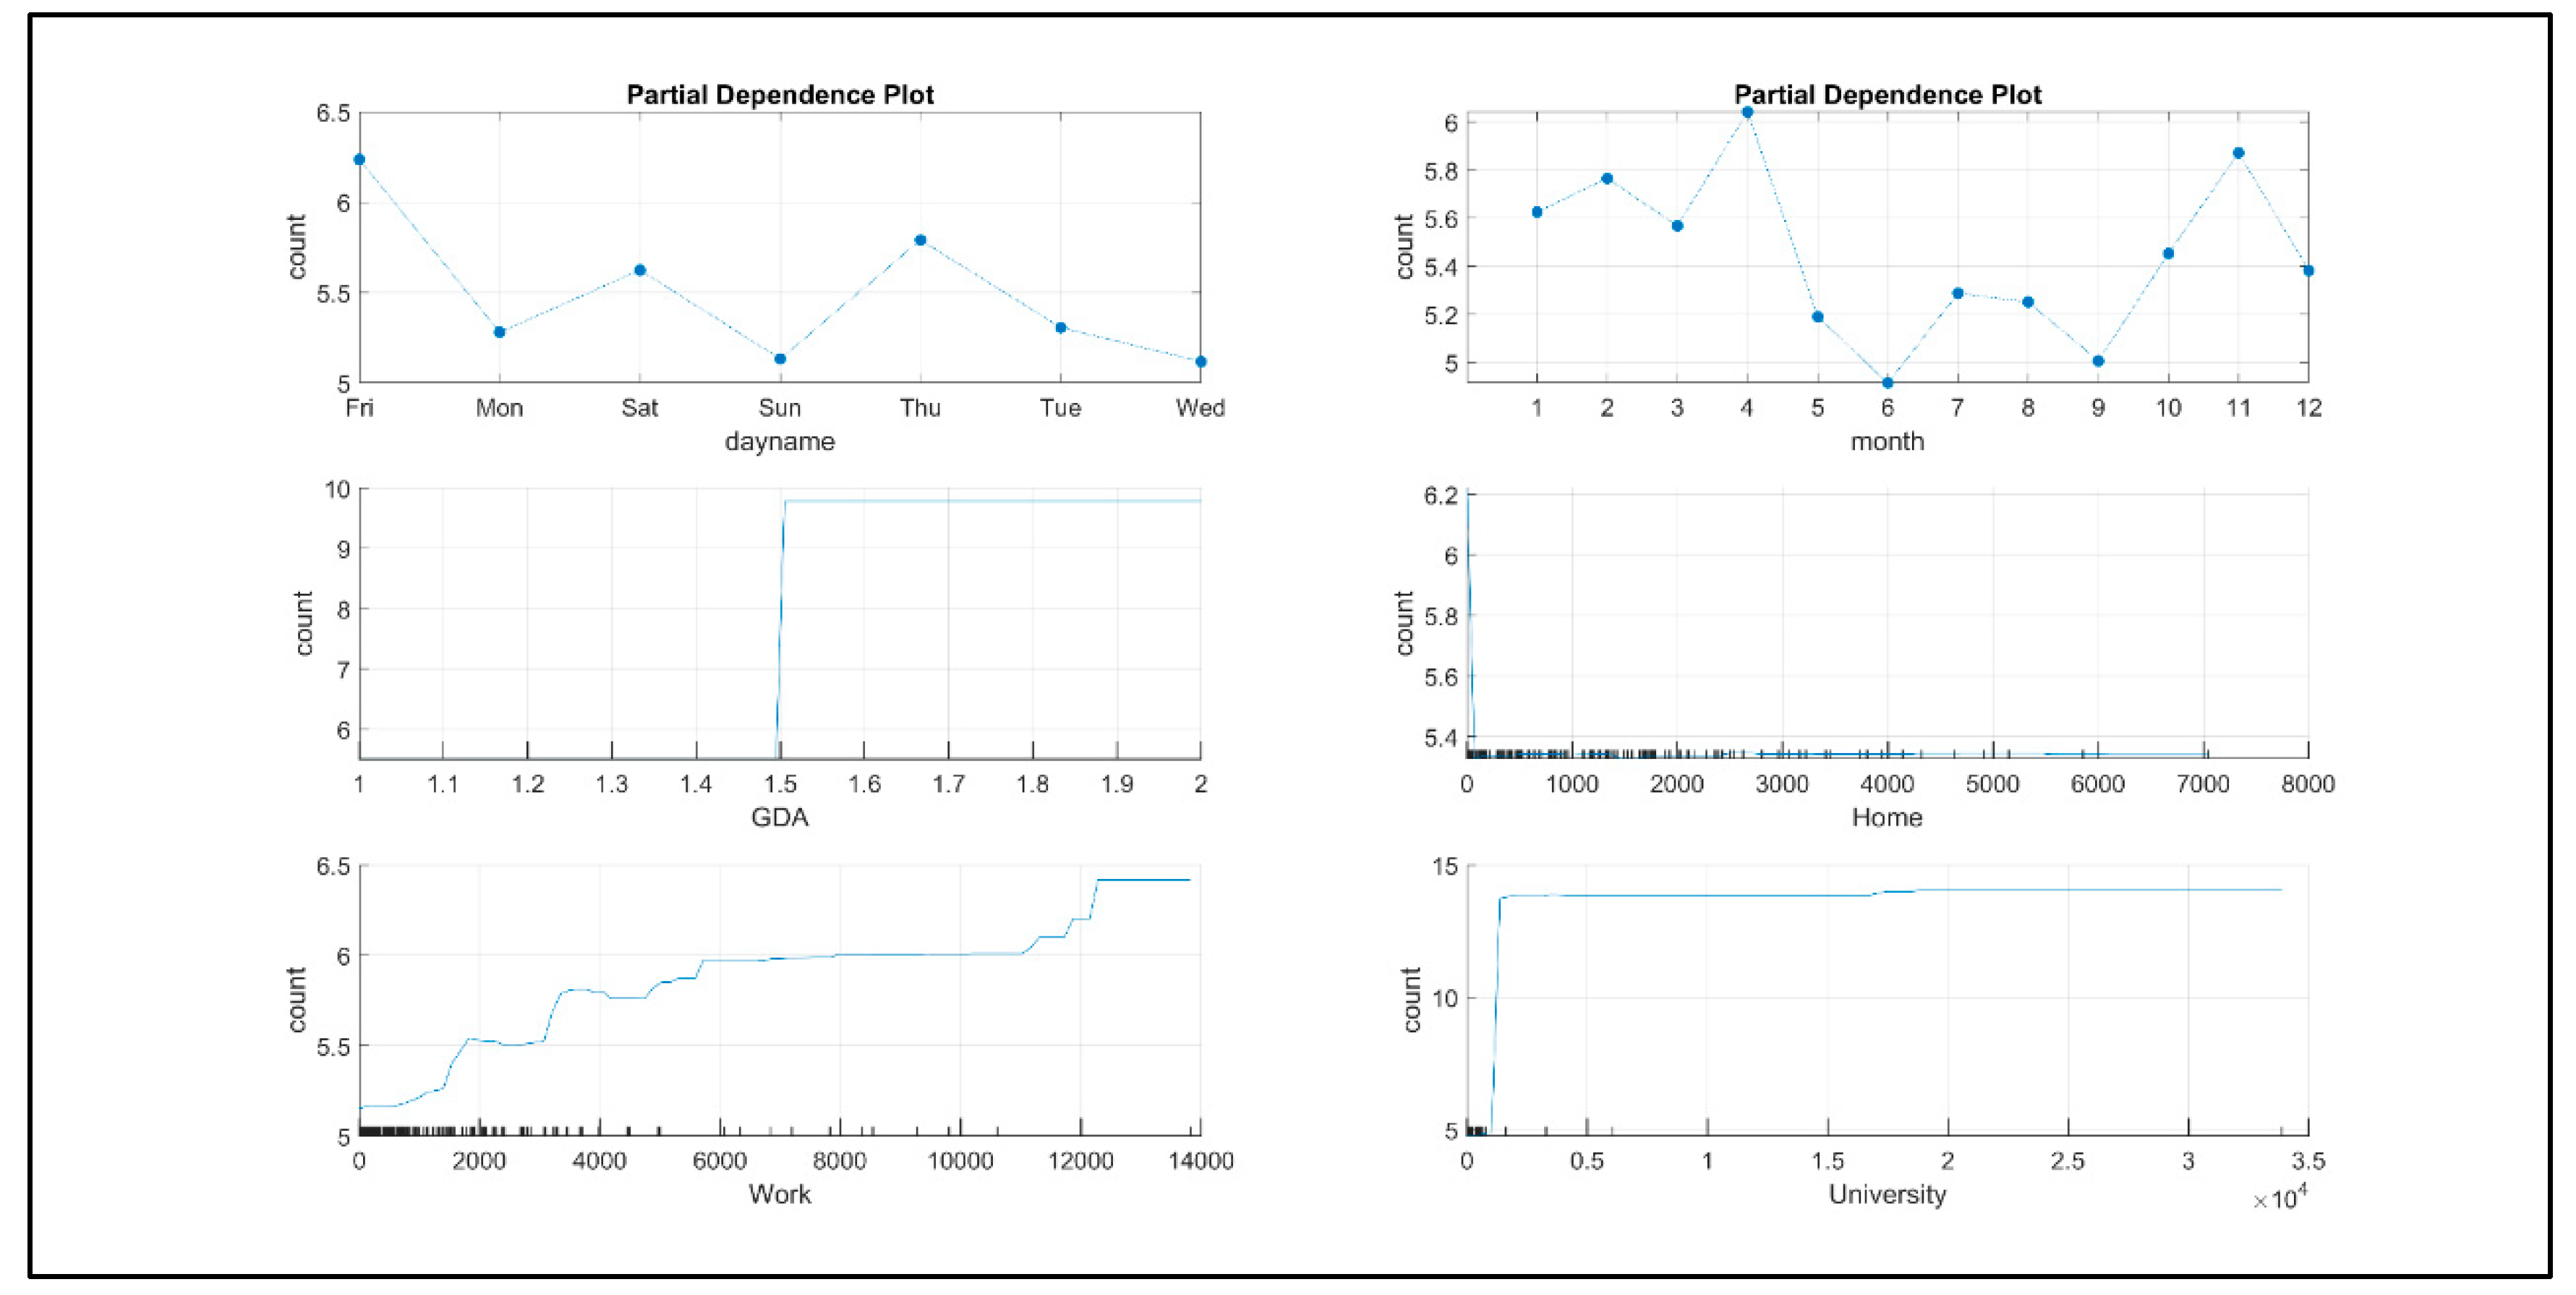
Figure 12.
The Traffic Analysis Zone Origin-Destination Matrix.
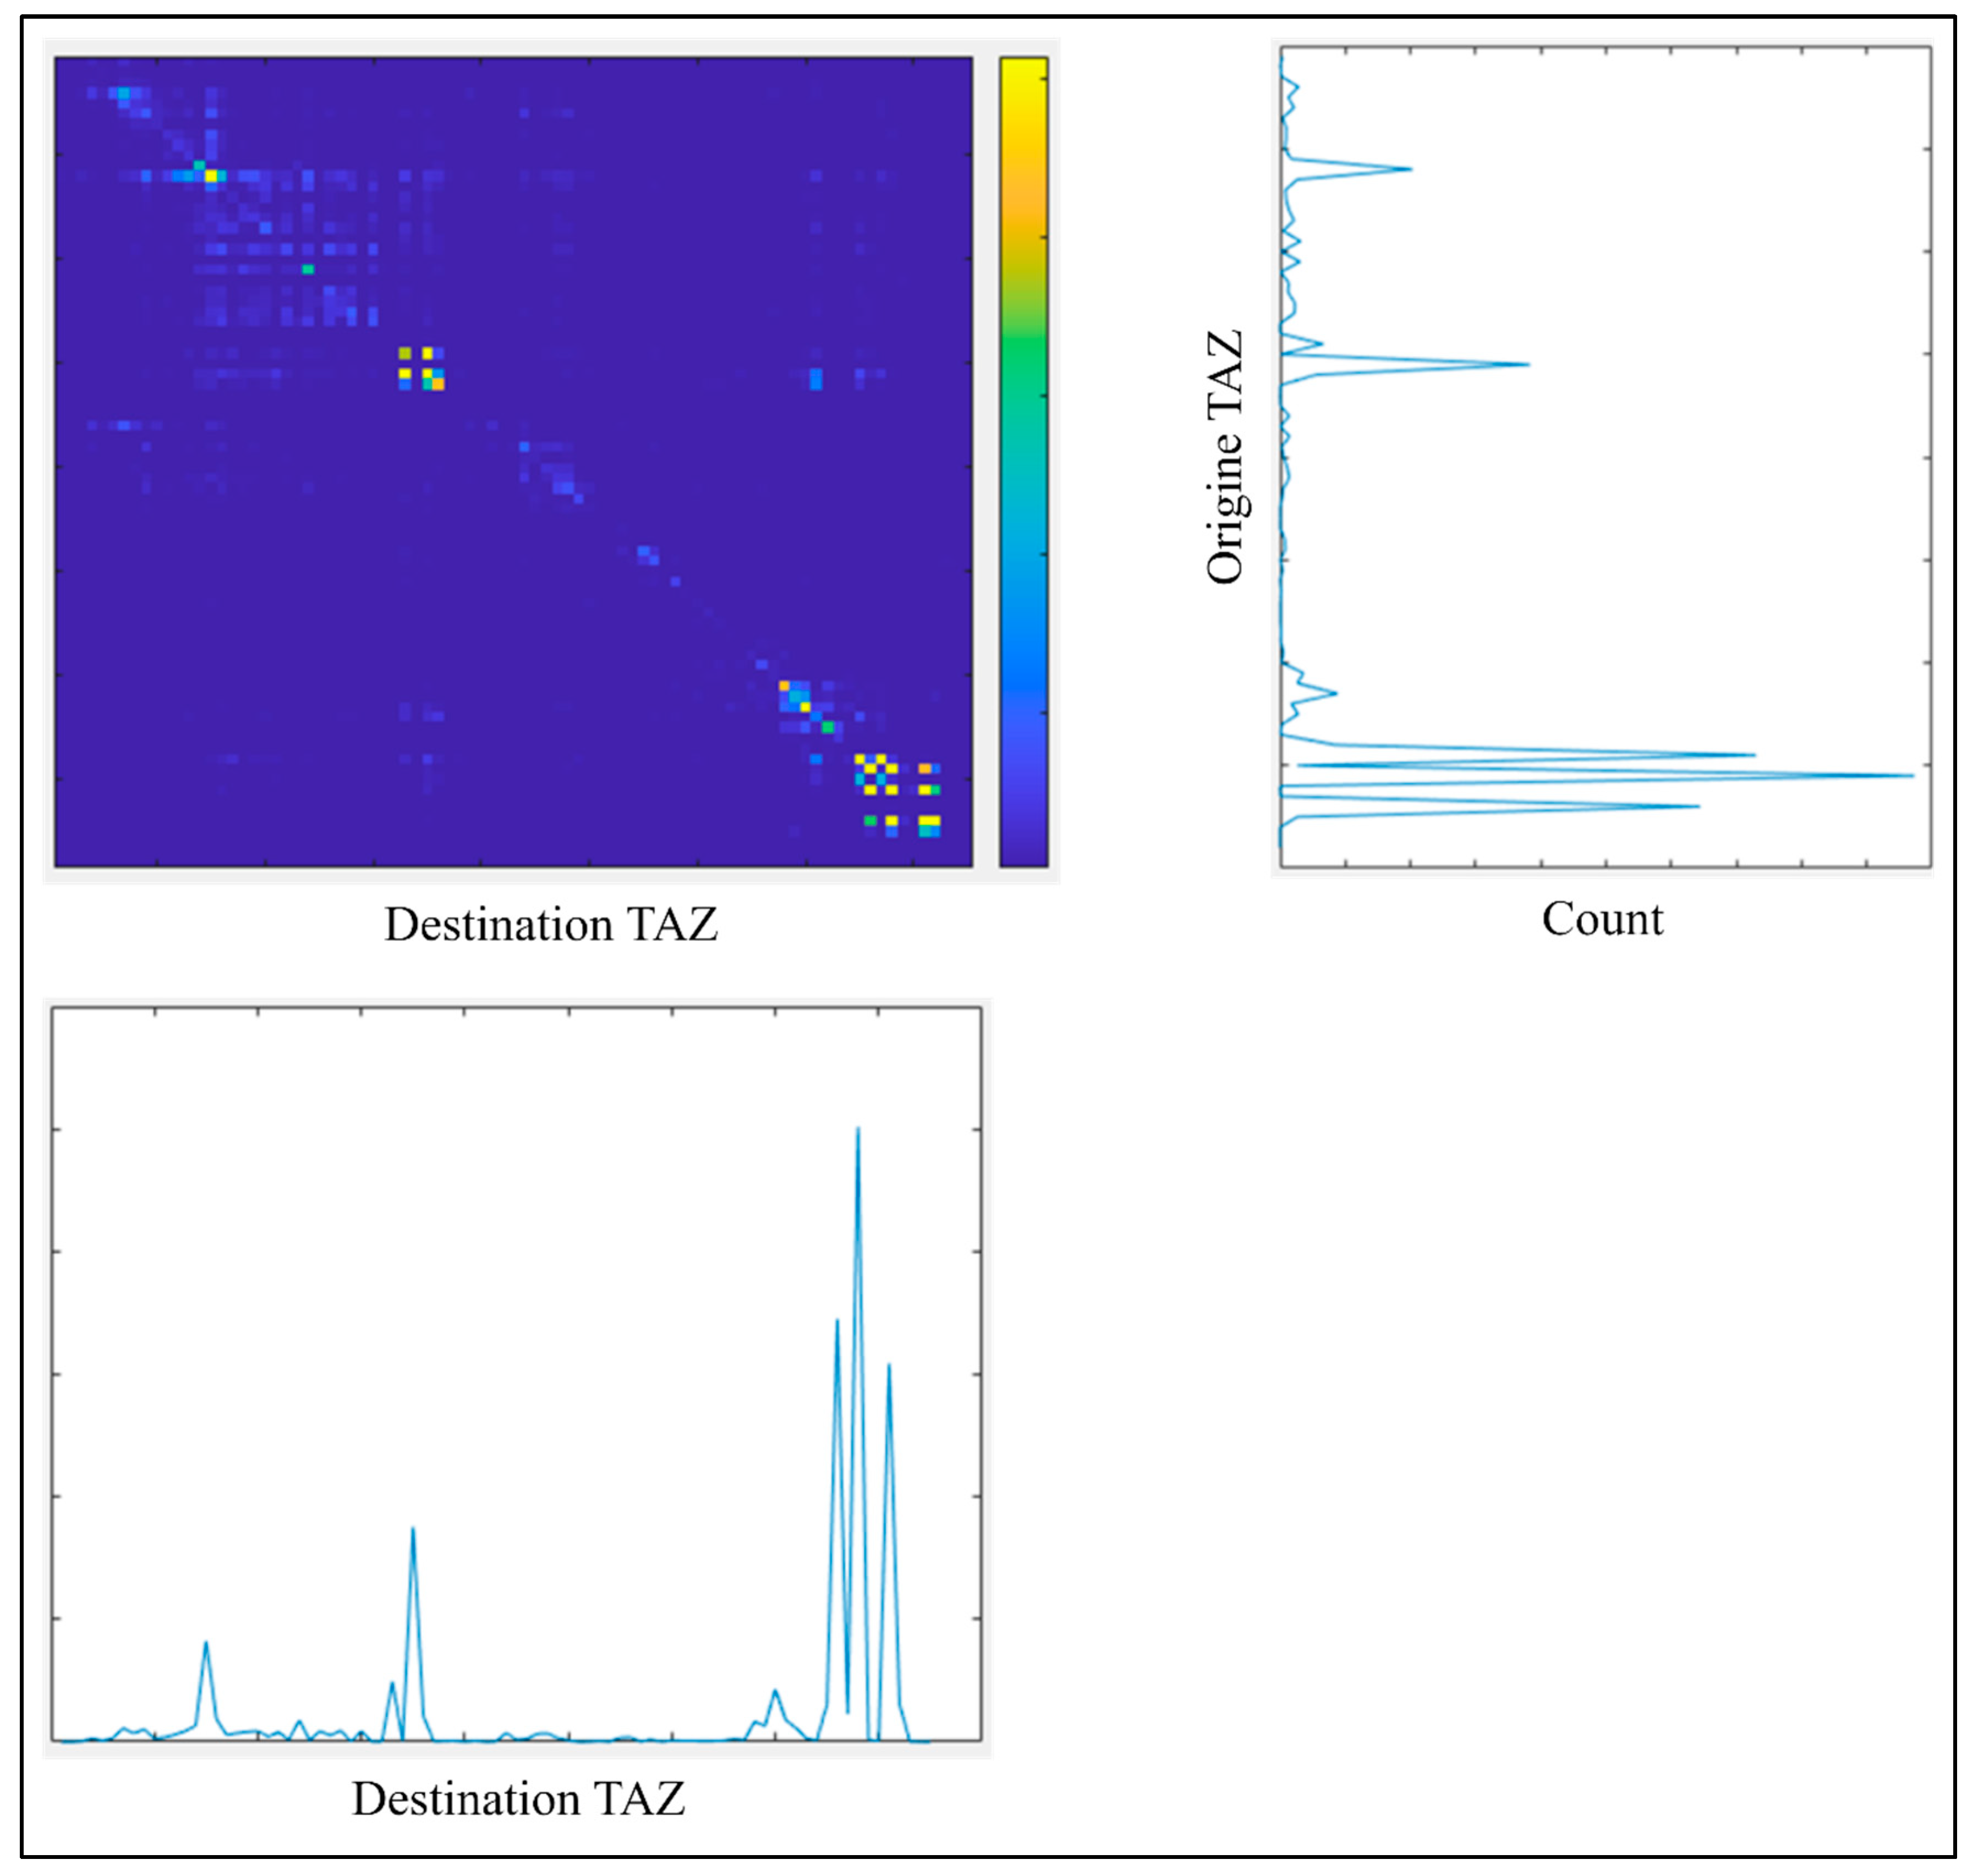
Figure 13.
DBSCAN Clustering Solution.
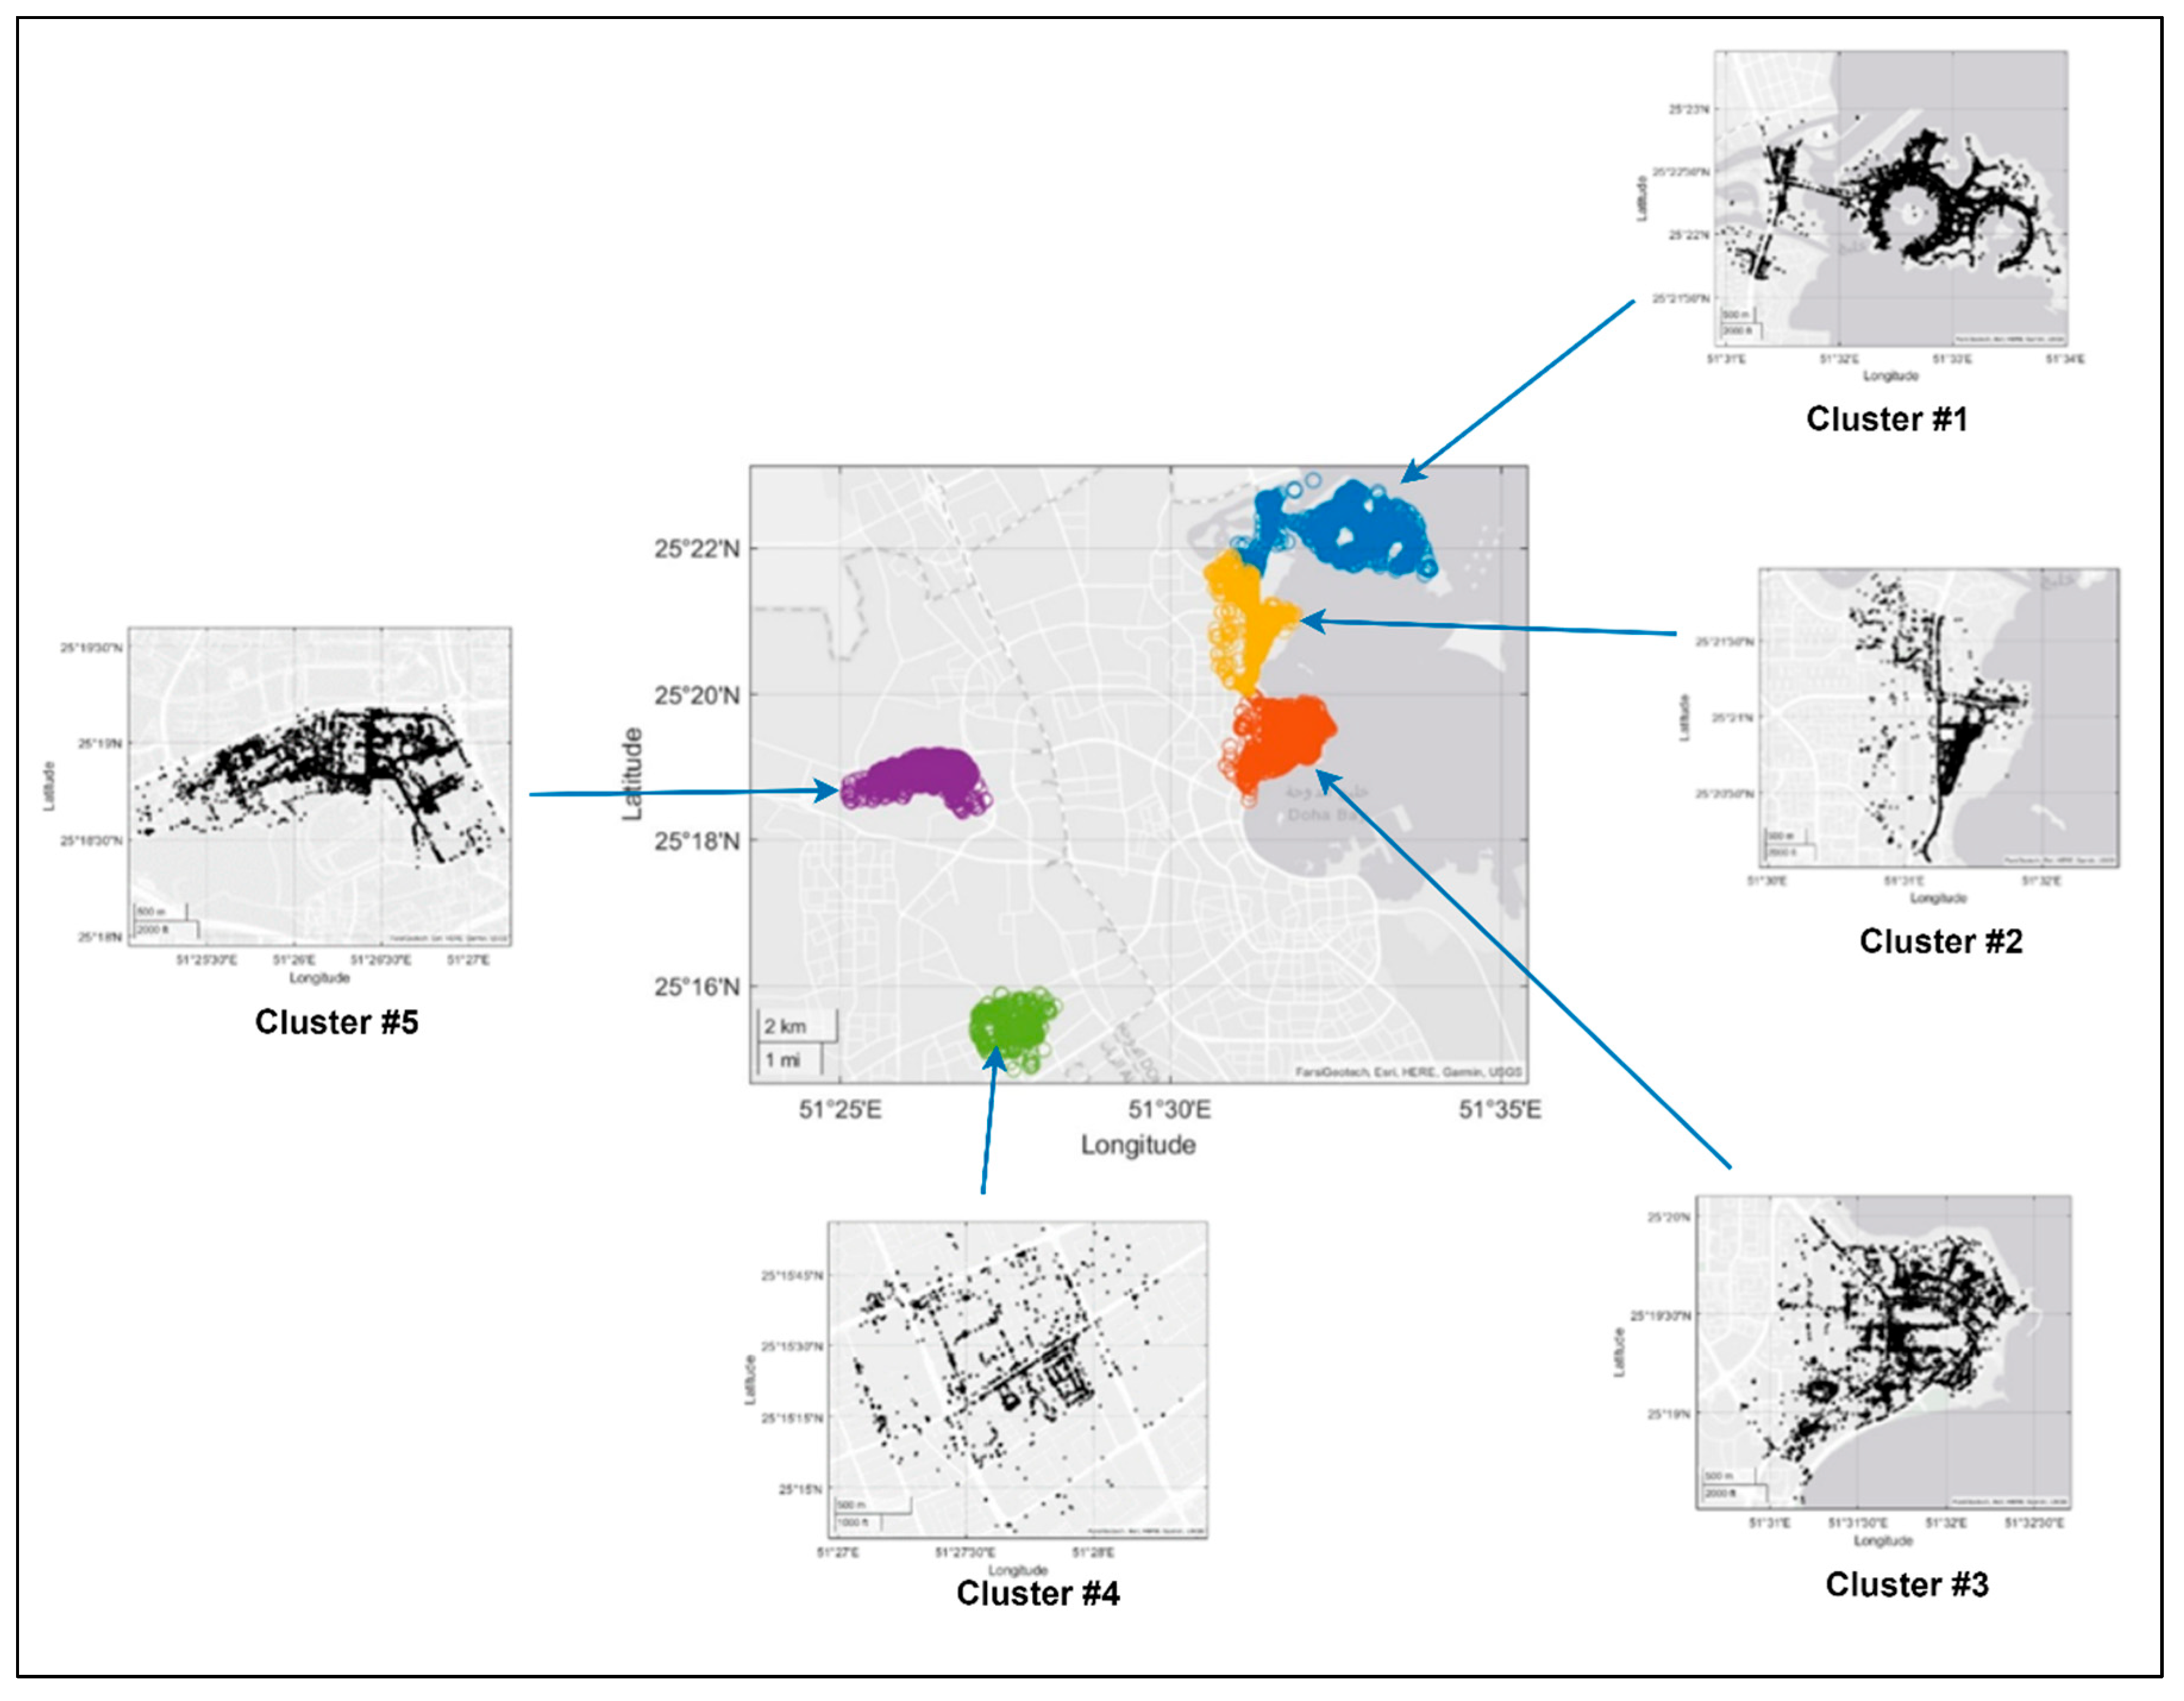
Figure 14.
The Visual Inspection of the Model Quality for Trained Daily Aggregated Data.
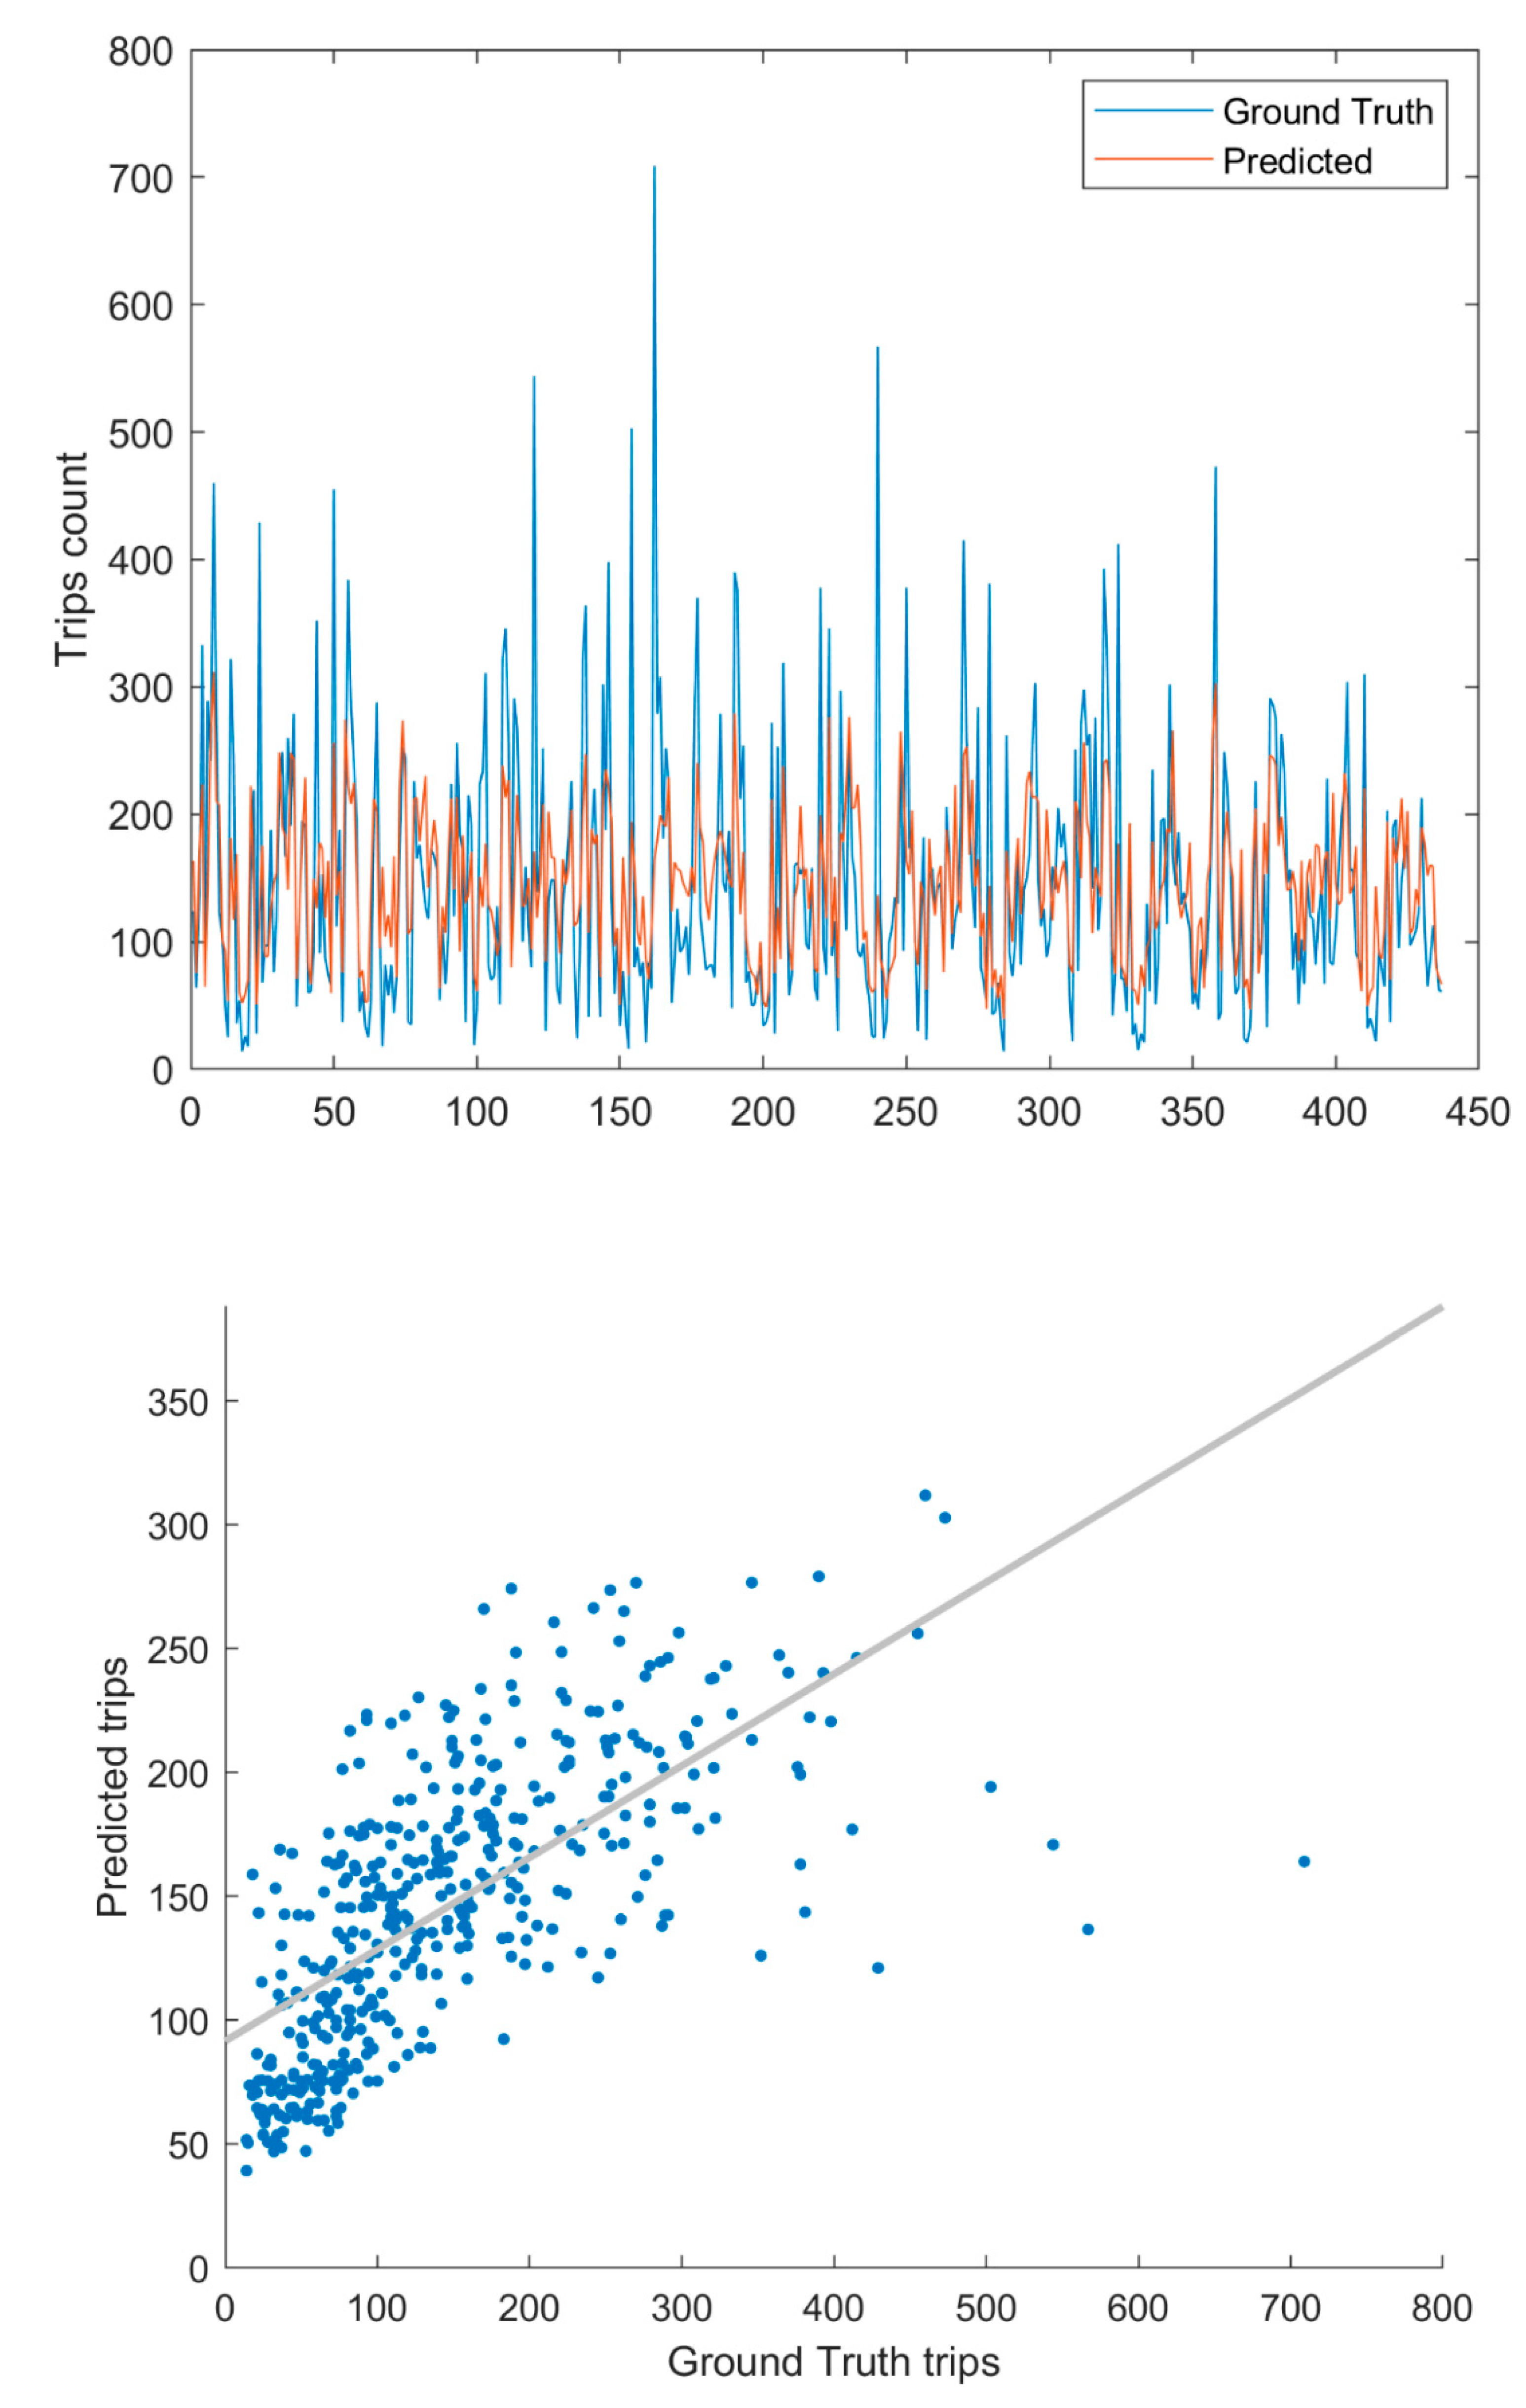
Figure 15.
The Feature Importance of the Daily Aggregated Trip Counts Model.
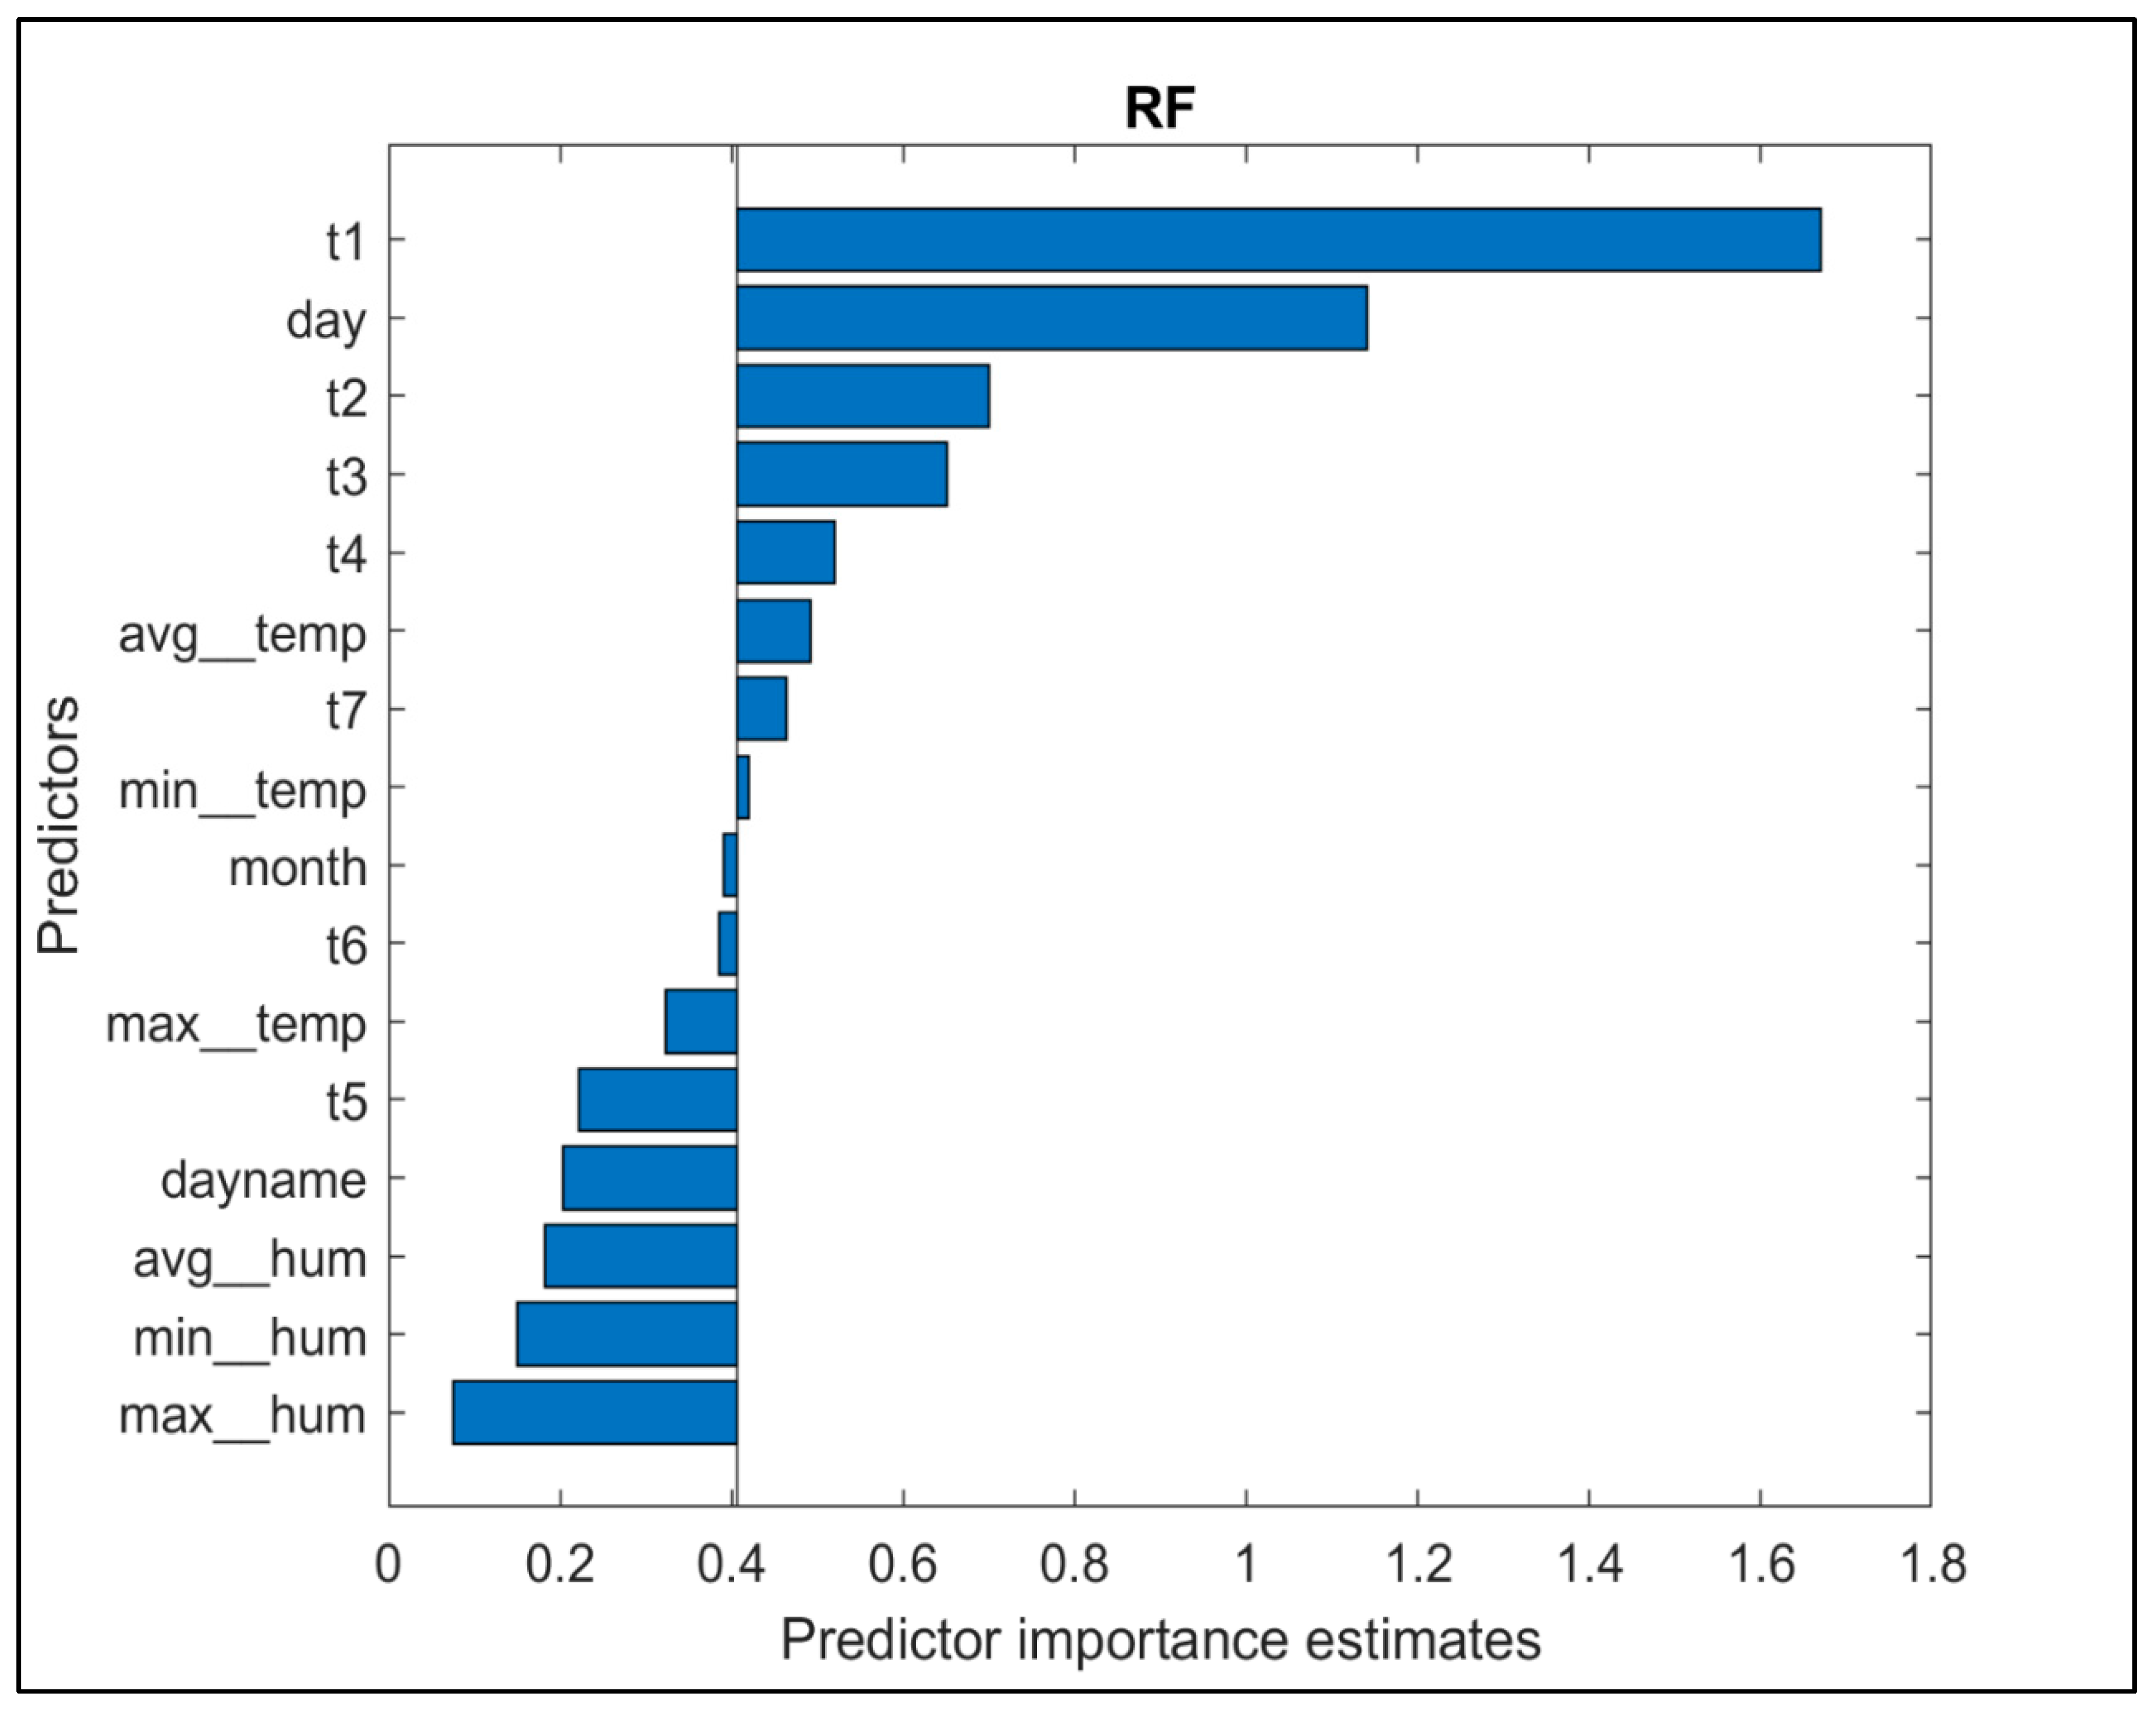
Figure 18.
The Feature Importance of the Hourly Aggregated Trip Counts Model.
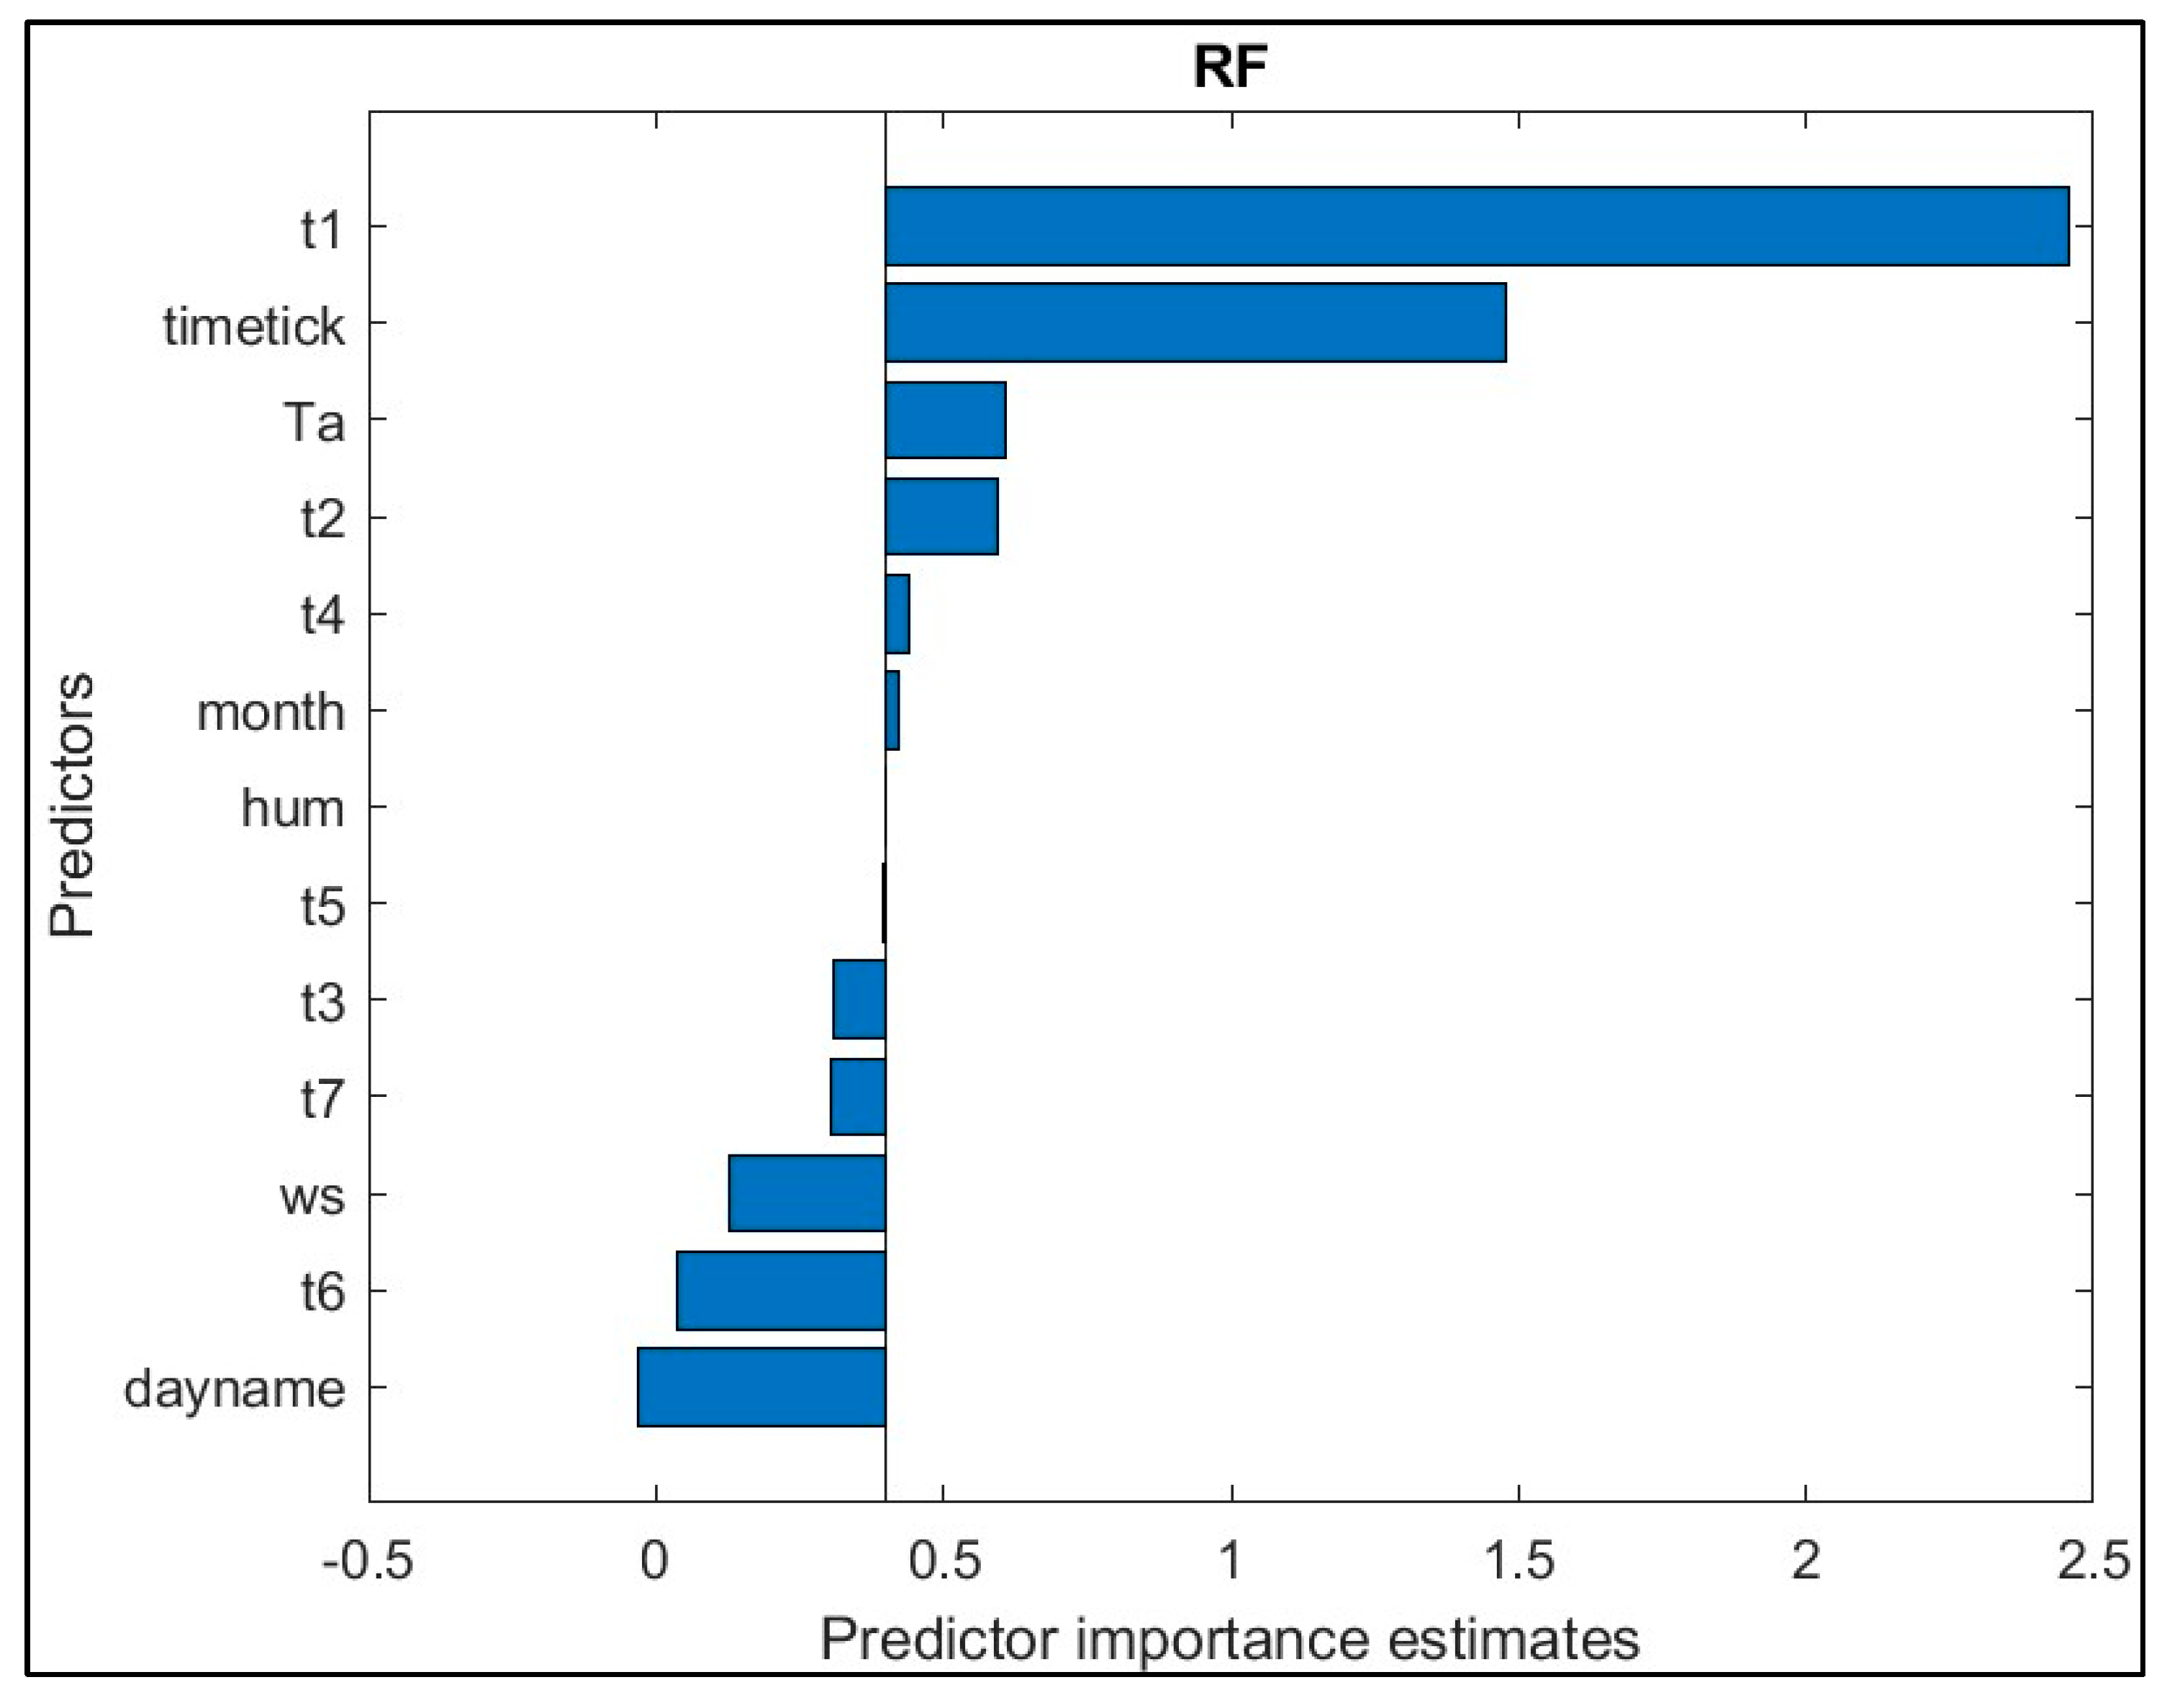
Table 1.
Overview of E-scooter Studies Across Various Weather Conditions.
| Reference | Study location(s) | Study Type | Key finding(s) | Other impacts |
|---|---|---|---|---|
| [32] | Riyadh, Saudi Arabia | Stated preference Survey | The extreme weather condition was perceived as an obstacle to e-scooter deployment. | Other obstacles to e-scooters were a lack of infrastructure, safety perceptions, and cultural issues. |
| [48] | Iran | Online Survey | Very few participants thought that it was not convenient to ride an e-scooter in the summer. | According to 28% of the survey’s participants, short-distance walking journeys can be replaced by e-scooters. |
| [49] | Austin, Calgary, Chicago, Louisville, Minneapolis | Live data | Less usage of e-scooters was reported on days with snow and rain, whereas, warmer days increased the use of scooters in all four countries except for Chicago. | Not recorded |
| [50] | Kelowna, Canada | Live data | With regard to weather attributes, the variable corresponding to summertime relative humidity is positively correlated with the likelihood of zero demand. | Not recorded |
| [51] | Munich, Germany | Live data | The number of Trips is reduced during the rainy and humid climates. Warmer Weather had more trips. | Not recorded |
| [52] | Chicago | Live data | E-scooter demands were higher on days with high average temperatures, lower wind speed, and less precipitation (rain), and at weekends. | Not recorded |
| [4] | Louisville, Kentucky | Live data | The number of Trips reduced by 16% due to the rain | Not recorded |
| [53] | City of Austin | Live data | High temperatures increased the use of e-scooters, while rain, humidity, and wind speed reduced the use. | Prais-Winsten and Negative Binomial regressions, as well as a Random Forest model, were used to examine the full suite of weather variables. |
| [5] | Indianapolis | Live data | The number of Trips was reduced by 80% during winter. | Not recorded |
| [54] | Louisville, Kentucky | Live data | Rain and snow reduced the daily trips, and high wind speed lowered the e-scooter trip distances. | Not recorded |
| [55] | Brisbane, Australia | Live data | It was found that 32% of e-scooter trips took place in wet Weather and 68% in dry conditions. | Not recorded |
Table 3.
Pseudocode of Time-of-Day Analysis.
|
Table 4.
Land Use Variables Utilized in the Trip Count Model.
| Land use variables | Description | |
| 1 | GDA | Greater Doha Area |
| Planning Variables | ||
| 2 | Home | Inhabitants (Population) |
| 3 | Work | Attractiveness for Employment (No. of Jobs) |
| 4 | EatingOutside | Attractiveness for eating outside (No. of Customers) |
| 5 | EMPBusn | Attractiveness for Employer’s Business (No. of wholesale & trading Jobs) |
| 6 | Education | Schools Capacity (No. of students) |
| 7 | Leisure_Sport | Attractiveness for Leisure activity (No. of Visitors) |
| 8 | Mosque | Mosque (Number) |
| 9 | PersBusn | Attractiveness for personal business trips (sum of no. visitors for health and education facilities) |
| 10 | Shopping | Attractiveness for Shopping Trips (No. of Visitors) |
| 11 | University | University Capacity (No. of Students) |
| 12 | VisitFr | Attractiveness for visiting friends (Population) |
| Population Groups | ||
| 13 | Q_m | Qatari Male |
| 14 | Q_f_CA | Qatari Female, Car Available |
| 15 | Q_f_NCA | Qatari Female, Car Not Available |
| 16 | NQh_CA_m | Non-Qatari, high income, Car Available, Male |
| 17 | NQh_CA_f | Non-Qatari, high income, Car Available, Female |
| 18 | NQm_CA_m | Non-Qatari, medium income, Car Available, Male |
| 19 | NQm_CA_f | Non-Qatari, medium income, Car Available, Female |
| 20 | NQh_NCA_m | Non-Qatari, high income, Car Not Available, Male |
| 21 | NQh_NCA_f | Non-Qatari, high income, Car Not Available, Female |
| 22 | NQm_NCA_m | Non-Qatari, medium income, Car Not Available, Male |
| 23 | NQm_NCA_f | Non-Qatari, medium income, Car Not Available, Female |
| 24 | NQl | Non-Qatari, low income |
| 25 | Q_P_m | Qatari, Pupil, Male |
| 26 | Q_P_f | Qatari, Pupil, Female |
| 27 | NQ_P_m | Non-Qatari, Pupil, Male |
| 28 | NQ_P_f | Non-Qatari, Pupil, Female |
| 29 | Stud_m | Student Male |
| 30 | Stud_f | Student Female |
| 31 | Labour_CA | Labourers, Car Available |
| 32 | Labour_NCA | Labourers, Car Not Available |
Table 5.
Coefficients of Fixed Effects.
| Name | Estimate | S.E. | tStat | D.F. | pValue |
| (Intercept) | -1.161247107 | 0.637374276 | -1.8219234 | 12976 | 0.068489618 |
| dayname_Sat | -0.176788924 | 0.01320125 | -13.39183184 | 12976 | 1.26E-40 |
| dayname_Sun | -0.316918248 | 0.013653284 | -23.2118691 | 12976 | 8.15E-117 |
| dayname_Mon | -0.267114015 | 0.01339521 | -19.94101057 | 12976 | 3.61E-87 |
| dayname_Tue | -0.279275863 | 0.013600572 | -20.53412678 | 12976 | 3.10E-92 |
| dayname_Wed | -0.339012676 | 0.013909611 | -24.37254902 | 12976 | 2.51E-128 |
| dayname_Thu | -0.110903122 | 0.012806449 | -8.659943312 | 12976 | 5.27E-18 |
| month_2 | 0.024991027 | 0.015662276 | 1.595619078 | 12976 | 0.110598218 |
| month_3 | -0.061767205 | 0.015395898 | -4.011926101 | 12976 | 6.06E-05 |
| month_4 | 0.096112157 | 0.014770442 | 6.507060384 | 12976 | 7.95E-11 |
| month_5 | -0.141204905 | 0.016028037 | -8.809869023 | 12976 | 1.41E-18 |
| month_6 | -0.292967796 | 0.020369678 | -14.38254408 | 12976 | 1.52E-46 |
| month_7 | -0.323278267 | 0.023388397 | -13.82216406 | 12976 | 3.79E-43 |
| month_8 | -0.165553368 | 0.022728408 | -7.283984351 | 12976 | 3.43E-13 |
| month_9 | -0.187249781 | 0.019202029 | -9.751562195 | 12976 | 2.17E-22 |
| month_10 | -0.010719761 | 0.017776927 | -0.603015393 | 12976 | 0.546508988 |
| month_11 | 0.111773559 | 0.016946758 | 6.595571957 | 12976 | 4.40E-11 |
| month_12 | -0.078094385 | 0.017791842 | -4.389336731 | 12976 | 1.15E-05 |
| GDA | 2.03331968 | 0.631771762 | 3.21844027 | 12976 | 0.001292066 |
| Home | -0.102959103 | 0.141574282 | -0.727244395 | 12976 | 0.467089375 |
| Work | 7.44E-05 | 2.85E-05 | 2.609195292 | 12976 | 0.009085956 |
| EatingOutside | -3.98E-05 | 3.99E-05 | -0.997394387 | 12976 | 0.318591713 |
| EMPBusn | -0.000122429 | 0.0001932 | -0.63368906 | 12976 | 0.526294935 |
| Education | -4.40E-06 | 4.29E-05 | -0.102727045 | 12976 | 0.918181196 |
| Leisure_Sport | 6.17E-06 | 5.12E-06 | 1.204342737 | 12976 | 0.228479102 |
| Mosque | 0.039418191 | 0.055711382 | 0.707542871 | 12976 | 0.479241888 |
| PersBusn | -2.94E-05 | 2.32E-05 | -1.268696836 | 12976 | 0.20457197 |
| Shopping | 1.87E-05 | 9.72E-06 | 1.924807359 | 12976 | 0.054275299 |
| University | 8.64E-05 | 2.13E-05 | 4.063059017 | 12976 | 4.87E-05 |
| VisitFr | 0.143616187 | 0.141654932 | 1.013845302 | 12976 | 0.310675478 |
| Q_m | -0.187140846 | 0.157058358 | -1.191537008 | 12976 | 0.23346463 |
| Q_f_CA | 0.257761404 | 0.202626625 | 1.272100364 | 12976 | 0.203360258 |
| Q_f_NCA | 0.246837312 | 0.199831587 | 1.235226706 | 12976 | 0.216768507 |
| NQh_CA_m | 0.088206135 | 0.183754703 | 0.480021098 | 12976 | 0.631220482 |
| NQh_CA_f | 0.500404341 | 0.374676745 | 1.335562848 | 12976 | 0.181715626 |
| NQm_CA_m | -0.214550624 | 0.135649512 | -1.581654226 | 12976 | 0.1137529 |
| NQm_CA_f | 0.345648946 | 0.202728159 | 1.704987345 | 12976 | 0.088220721 |
| NQh_NCA_m | 0.187087599 | 0.184440095 | 1.014354278 | 12976 | 0.310432646 |
| NQh_NCA_f | -0.47436776 | 0.336396018 | -1.410146778 | 12976 | 0.158520316 |
| NQm_NCA_m | 0.124559417 | 0.201573016 | 0.617936962 | 12976 | 0.536627738 |
| NQm_NCA_f | -0.320123273 | 0.175484868 | -1.824221517 | 12976 | 0.068141576 |
| NQl | -0.04766532 | 0.054607352 | -0.872873668 | 12976 | 0.382748092 |
| Q_P_m | 0.270106965 | 0.209791342 | 1.287502921 | 12976 | 0.197942015 |
| Q_P_f | -0.491295233 | 0.193377964 | -2.540595751 | 12976 | 0.011077929 |
| NQ_P_m | 0.227765263 | 0.222150735 | 1.025273505 | 12976 | 0.305253266 |
| NQ_P_f | 0.093183679 | 0.213124402 | 0.437226699 | 12976 | 0.661954225 |
| Stud_m | -0.143547894 | 0.197449646 | -0.727010138 | 12976 | 0.46723286 |
| Stud_f | -0.258224781 | 0.208201959 | -1.240261059 | 12976 | 0.214901277 |
| Labour_CA | -0.095078546 | 0.212272054 | -0.447908916 | 12976 | 0.654226411 |
| Labour_NCA | -0.041179042 | 0.073639841 | -0.55919515 | 12976 | 0.576038194 |
Disclaimer/Publisher’s Note: The statements, opinions and data contained in all publications are solely those of the individual author(s) and contributor(s) and not of MDPI and/or the editor(s). MDPI and/or the editor(s) disclaim responsibility for any injury to people or property resulting from any ideas, methods, instructions or products referred to in the content. |
© 2024 by the authors. Licensee MDPI, Basel, Switzerland. This article is an open access article distributed under the terms and conditions of the Creative Commons Attribution (CC BY) license (http://creativecommons.org/licenses/by/4.0/).
Copyright: This open access article is published under a Creative Commons CC BY 4.0 license, which permit the free download, distribution, and reuse, provided that the author and preprint are cited in any reuse.


