
Submitted:
08 November 2023
Posted:
08 November 2023
You are already at the latest version
Abstract
Shared micromobility has gained significant attention in the field of transportation engineering in recent years as an environmentally friendly, convenient, and easily accessible transportation mode. Like other medium-sized cities, Birmingham, Alabama implemented a shared micromobility pilot program in 2021 that captured the attention of local travelers. This study examined shared e-scooter usage and associated travel patterns in Birmingham using 2021-2022 field data. From these data, ArcGIS maps were used to showcase trip origins and destinations. To gain a further understanding of e-scooter travel patterns in the study area, zip code and block group densities were calculated. Additionally, a negative binomial regression model was constructed to identify determinants of shared e-scooter trips. The analysis results showed that the usage of shared e-scooters was the highest during the nighttime, on weekends, and in the fall season. Furthermore, the research findings indicated that shared e-scooters experienced their highest utilization rates in areas with a higher proportion of educated and higher-income individuals. These findings suggest that travelers’ mode choice related to the use of micromobility modes is influenced by environmental and demographic factors. Overall, this case study offers valuable contributions to the understanding of the role of shared e-scooters in Birmingham's transportation landscape and can guide transportation authorities in other medium-sized cities in their efforts to plan for micromobility options.
Keywords:
shared micromobility
; e-scooters
; spatiotemporal analysis
; negative binomial regression analysis
1. Introduction
The Birmingham metro is the largest urban area in the state of Alabama serving 1,142,500 residents [1]. The largest employer in the State is the University of Alabama at Birmingham (UAB), a major destination for commuters and residents located just south of downtown Birmingham [2]. Studies show that the Birmingham metropolitan region is a highly automobile-dependent area. An analysis of survey responses from 5,977 UAB employees indicated that 88.4% of commuters drove alone and only 4.8% used non-motorized modes for their commuting needs [3]. Even though alternative transportation modes exist in the area including bus transit and ride sharing, the limited availability and consistency of such modes make the private automobile the mode of preference for day-to-day transportation for most people. Another concern is that the City of Birmingham has a poverty rate of approximately 25.9%, which implies that over a quarter of its population lives below the poverty line and is in need of affordable transportation options.
In order to address existing transportation issues, the City of Birmingham has considered a variety of ride-sharing options including shared micromobility. In 2021, a pilot micromobility program was officially launched and shared e-scooters were first seen on the streets of Birmingham on April 16, 2021 [4]. The micromobility service area in Birmingham, Alabama provided over 90 designated corral locations and covered portions of seven zip code areas [5]. As with every pilot program, it becomes important to obtain and analyze field data in order to understand the impact of the intervention and the lessons learned. In doing so, the Birmingham case study examined one-year worth of origin-destination (O-D) e-scooter data (July 2021 to June 2022) to understand trip characteristics and usage patterns, identify high-demand locations for e-scooter service around the study area and understand the impact of environmental and demographic factors on e-scooter ridership.
2. Literature Review
Shared micromobility refers to transportation modes that involve small, single-passenger modes rented for short-term use, such as e-scooters, docked bikes, and dockless bikes [6]. E-scooters are a recent addition to shared transportation options as shared e-scooter use did not start until 2017 [7]. It was then that micromobility providers including Bird, Lime, and Spin launched their own programs in different cities and the popularity of these e-scooters started to grow quickly [8]. The growth of e-scooter trips reached 3.6% within just one year (a rate comparable to Uber and Lyft), and 84 million trips were generated through shared micromobility in the USA [9]. In 2019, an estimated 136 million trips were made on shared bikes, e-bikes, and e-scooters in the USA, which is 60% more than in 2018 [10]. By the year 2021, the shared e-scooter operation had reached 110 cities, and 248 different e-scooter systems were in service [11].
The shared e-scooter system has wireless connectivity using GPS trackers and the devices can be rented through mobile apps [8]. A user can take the e-scooter anywhere within the zone and can park it in a parking zone or on the sidewalk [12]. E-scooters are easy to use, relatively expensive, readily available, and allow users to reach their destination faster than walking [12]. They also contribute to environmental sustainability because they use far less energy than private vehicles and other motorized modes and help to decrease CO2 emissions to the environment [13,14,15] in urban settings, as e-scooters produce zero CO2 emissions over their lifetime [16]. Studies report that a city with 10,000 scooters would then reduce emissions by 35,000,000 grams, or 35 metric tons daily [17].
Recent studies also cite positive impacts of e-scooter use on traffic operations. They suggest that shared e-scooter operations have the potential to decrease the number of cars and other motor vehicles on the road and thus reduce traffic jams and air pollution [14]. The use of e-scooters increase the road capacity because of their smaller size, compared to automobiles [18]. McKenzie (2020) found that, even though ride-hailing services are faster than e-scooter services in theory, micromobility services resulted in faster trips than ride-hailing services during the peak hours on weekdays [19].
With the increasing popularity of shared micromobility services in urban areas, it has become crucial to analyze the spatiotemporal patterns of these services to gain a better understanding of usage patterns. Table 1 provides a summary of representative research works that performed a spatiotemporal analysis of e-scooter usage along with their main findings.
3. Methodology
The purpose of this study was to look into the usage patterns of shared e-scooter trips in the Birmingham area over a one-year period and analyze the impact of environmental and demographic factors on shared e-scooter mode choice. Initially, descriptive analysis was employed to translate the one-year data obtained by the VEO e-scooter operating company during the pilot micromobility program into tangible visual representations. Maps were generated for both the origin and destination points of e-scooter trips using ArcGIS. Kernel density distribution and spatial distribution were employed to identify areas that had the highest shared micromobility trips, either as an origin or as a destination. Finally, a negative binomial regression model was fitted to the data to determine variables that contribute to shared e-scooter use and to be used for future e-scooter trip prediction.

Table 1.
A Summary of the Literature on Spatiotemporal Analysis of Shared E-scooters.
| Researchers | Study Approaches | Location | Main Findings |
|---|---|---|---|
| Mathew et al., 2019 [20] | Temporal Analysis | Indianapolis | E-scooter usage peaked were between 4 to 9 p.m. on weekdays and 2 to 7 p.m. on weekends. |
| Noland, 2019 [21] | Ordinary Linear Squares (OLS) | Louisville, KY | The average e-scooter speed, trip duration, and trip distance were 5 mph, 15 minutes, and 1.25 miles, respectively. |
| McKenzie, 2019; McKenzie, 2020 [19,22] | Cosine Similarity Analysis, Global Moran's I | Washington D.C | University and commercial areas generated more e-scooter trips than suburban areas. |
| The average trip distance was 0.4 miles with an average travel time of 5 minutes. | |||
| Bai and Jiao, 2020; Jiao and Bai, 2020 [23,24] | Negative Binomial Regression Model, GIS Hotspot Analysis | Austin, TX | E-scooters were mostly used for access to transit stations. |
| Demand was positively related to the racial diversity of people and negatively related to the land use mix. | |||
| Caspi et al., 2020 [25] | Geographical Weighted Regression | Austin, TX | Higher income, mixed land use, more parking spaces, more open spaces, bike lanes, and lower crime rates are associated with higher demand for e-scooters. |
| Reck et al., 2021 [26] | Negative Binomial Regression Model | Zurich, Switzerland | Bus stops and school areas had a high demand for shared e-scooters. |
| Tuli et al., 2021 [27] | Random Effects Negative Binomial (RENB) | Chicago, IL | E-scooter demand is positively affected by temperature and negatively affected by wind speed and precipitation rate. |
| Demand is higher during weekends and when the gasoline price increases. | |||
| Abouelela et al., 2023 [28] | Zero-Inflated Negative Binomial Regression Model (ZINB) | Austin, TX and Louisville, KY | Most e-scooter trips were made for leisure or for shopping purposes. |
| The summer season has the highest micromobility demand, and winter has the lowest. |
3.1. Data Collection
This study analyzed shared e-scooter trip data from the pilot program in Birminham, Alabama, from July 1, 2021, to July 1, 2022. The data were provided by VEO, one of the leading providers of shared micromobility, in support of the Southeastern Transportation Research, Innovation, Development and Education Center’s (STRIDE) "Mobility-on-Demand Transit for Smart, Sustainable Cities" project [29]. Additionally, Census.gov was scoured thoroughly for data regarding zip code and block area coverage, as well as demographic and socioeconomic information [2]. A picture of a VEO e-scooter similar to those deployed in Birmingham is displayed in Figure 1.
3.1.1. Pilot Area
The study area is the area where VEO e-scooters operated during the Birmingham pilot deployment (Figure 2). Covering the downtown Birmingham area and the campus of the University of Alabama at Birmingham (UAB), the pilot area serves a diverse set of racial and socioeconomic groups. The study area consists of either an entire or a portion of seven zip codes inside Jefferson County in Birmingham, Alabama. For the purposes of detailed data analysis, the area was also further divided into 2979 blocks, defined according to census.gov.
3.1.2. Data Cleaning
The e-scooter trips dataset contained information on trip ID, vehicle ID, vehicle type, starting and ending longitudes and latitudes, trip starting and ending time, date, total distance traveled, and trip duration. To guarantee the precision and consistency of the analysis, duplicative rows within the dataset were identified and subsequently eliminated from further examination. During the pilot deployment, e-scooter operating hours span from 6 AM to 11 PM daily, so trips recorded between 11 PM and 6 AM were excluded as they primarily represented trips for rebalancing. Furthermore, trips with a trip distance of less than 0.01 miles were disregarded as they were deemed to represent false starts or data collected during maintenance periods. Similarly, trips with a trip distance of zero were removed from the dataset as they likely corresponded to erroneous or incomplete data entries. Additionally, trips exhibiting an average speed exceeding 15 mph were eliminated from the dataset, aligning with safety regulations that restrict shared e-scooters from exceeding this speed limit. Thus, the dataset underwent a process of careful inspection and refinement, ultimately resulting in the retention of roughly 97,997 data entries that exclusively related to trips taken on shared e-scooters during the study period.
3.2. Data Analysis
The study involved a comprehensive data analysis process consisting of three steps, namely Descriptive Analysis; Kernel Density Distribution and Spatial Correlation Distribution Analysis; and Negative Binomial Regression Modeling. Details are discussed next.
3.2.1. Descriptive Analysis
A descriptive analysis was performed on the data as the very first phase in the process. This requires taking a close look at the dataset in order to identify the most important patterns and traits within it, and then summarize those features. After categorizing the data, a variety of histograms and graphs were constructed that shed light on the hourly, daily, weekly, monthly, and seasonal variation of shared e-scooter trips. In addition, the usage rate of each vehicle was computed so that an accurate picture of the overall efficiency could be painted.
3.2.2. Spatial Autocorrelation Analysis and Kernel Density Distribution
Spatial Autocorrelation Analysis and Kernel Density Distribution assessments were carried out with the help of the ArcGIS Pro software [30]. First, the origin and destination of each e-scooter trip were linked to corresponding zip codes and blocks. This was done by spatial autocorrelation which is also known as Global Moran’s I [30]. The method shows geographical dependency and space patterns, and helps one understand the underlying mechanisms that affect the distribution of the variable. Moreover, origin and destination location points were identified on the map, and trip frequencies were calculated.
Next, Kernel Density Distribution analysis was performed to identify the locations with high utilization/demand for e-scooters trips as well as the spatial density of their activity. The distribution equation for kernel density is given in Equation 1.
Where,
i = 1,…,n are the input points;
= the population field value of point i;
= the distance between point i and the (x, y) location.
3.2.3. Negative Binomial Regression Modeling
The final stage of the analysis consisted of employing negative binomial regression modeling, a statistical technique that allowed the investigation of the factors influencing the utilization of shared e-scooters in the Birmingham study. According to the literature, the utilization of a negative-binomial model is considered more suitable, as compared to a general Poisson model, due to the presence of statistically significant over-dispersion in the dataset [31,32]. The negative binomial distribution equation is given by Equation 2.
Where,
= parameter that measures the degree of overdispersion in the variable ;
P(yi) = probability of the dependent variable being equivalent to the trip number on a given street segment;
= number of e-scooter trips on street segments;
= gamma function, which is a generalization of the factorial function to real and complex numbers;
= expected value (mean) of dependent variable .
The model treated the hourly shared e-scooter trip count as the dependent variable and considered multiple independent variables to identify significant predictors and their effects on the e-scooter usage patterns. Independent variables included median distance, median duration, time of the day, day of the week, month, and season. Time of the day was divided into 3-hour periods and dummy variables were used to identify each of them. For indicating day, month, and season, different dummy variables were used as well. Initially, a search operation was used to identify any absent data in the dataset for the negative binomial regression model. The dataset was also assessed for over-dispersion to ensure the model's validity. Subsequently, the dataset's outliers were identified and removed from the analysis. Additionally, a command for train-test splitting was executed to partition the dataset into a training set and a testing set. Thus, the model’s validity was determined through calculation. The coefficient of determination, R square (R2), and Mean Squared Error (MSE) values were evaluated for the testing dataset to assess the precision of the model. These values helped to determine how well the model predicted the count outcomes in the testing set. The output generated the coefficients for various independent variables, which further facilitated the identification of variables with significant or insignificant relationships. The model was generated utilizing the Statesmodels API from Python programming language [33].
Using these methods of analysis, the study sought to provide comprehensive insights into the characteristics, spatial patterns, and determinants of shared e-scooter utilization in the study area. The findings from the above-mentioned analyses are summarized next.
4. Results
This section of the study serves as a thorough review of the research findings, including the results attained through the application of a number of meticulous analytical methodologies discussed in the Methodology section. The descriptive analysis findings give a complete summary of the study data. Additionally, the density analysis highlights the distributional properties of shared e-scooter trips, while the regression analysis looks at the determinants of shared e-scooter usage. The results are illustrated in a number of ways, including tabular presentations for clear and orderly data representation, graphical representations to show trends and patterns, and numerical values for precise measurements. These formats support various methods of data analysis and enable a thorough comprehension of the study findings and their implications.
4.1. Descriptive Analysis Results
After conducting a comprehensive data cleaning process, the dataset encompassed a total of 97,997 VEO shared e-scooter trips completed over 366 operating days, or an average of 268 shared e-scooter trips per day. The collected data provided information related to trip distance, duration, origin and destination points, date, start time, end time, vehicle ID, trip ID, and vehicle type of each trip performed using VEO e-scooters during the study period in Birmingham. The average e-scooter trip speed was calculated as the ratio of the total distance traveled to the total time spent traveling. Basic descriptive analysis findings are displayed in Table 2.
A more in-depth analysis was conducted next using the Birmingham shared e-scooter data, to study the distribution of the e-scooter trips by hour, day of the week, month, and season. The outcomes of this analysis were then documented in Figure 3, Figure 4, Figure 5 and Figure 6 below. These charts provide a comprehensive overview of fluctuations in e-scooter trip usage observed during the course of a year, shedding light on usage patterns and trends for e-scooter trips in Birmingham.
An examination of Figure 3 reveals that the busiest time of day for shared e-scooter trips in Birmingham was between the hours of 9 PM and 10 PM, with 9,109 trips reported during this time period. It was interesting to see that the e-scooter trips showed a progressive increase over time and that they reached their peak between 7 PM and 11 PM. This indicates that the level of user activity gradually increased during the afternoon and evening hours, with the demand peaking during the late evening hours. It is also worth noting that the use of e-scooters between 10 PM and 11 PM was much higher than in the early morning hours, thus suggesting that a possible extension of operating hours of e-scooter service beyond 11 PM could further increase ridership, and thus is worth considering in the future.
The distribution of Birmingham e-scooter trips by day of the week (Figure 4) shows that weekend days had much higher shared e-scooter trips than weekdays. The highest e-scooter use was observed on Saturdays and accounted for an estimated 20% of all e-scooter trips (20,077 trips total). Friday stands out among the weekdays as the day with the most trips made on shared e-scooters (15,442 trips total). These results point to a stronger demand for the use of shared e-scooters during leisure time or for recreational purposes on Fridays and weekends and should be taken into account when deciding when to make shared micromobility services available.
Consideration of the monthly distribution of Birmingham shared e-scooter trips (Figure 5) revealed that the maximum number of shared e-scooter trips occurred in September 2021 (13,508 trips), whereas the lowest e-scooter ridership was observed during the winter months (December 2021 through February 2022). This is consistent with the seasonal distribution of shared e-scooter trips depicted in Figure 6 which shows that demand for shared e-scooter trips peaked during the fall season (29,024 trips) and dropped off during winter and summer. This is likely due to the impact of extreme weather conditions that made riding e-scooters less comfortable and thus less attractive as an alternative to other modes.
Figure 7 displays the number of shared e-scooter trips based on distance traveled (in miles) and Figure 8 depicts the proportion of Birmingham e-scooter trips classified by trip duration (in minutes).
Figure 7 shows that a noteworthy proportion of shared e-scooter rides in Birmingham (77.47%) was characterized by brief distances that did not exceed 3 miles. It was also observed that less than 7% of all shared VEO e-scooter trips in Birmingham were longer than 6 miles. The aforementioned observation suggests a widespread inclination towards traveling over short distances among individuals utilizing this mode of transportation. In addition, over 55% of all shared VEO e-scooter trips had a duration of less than 10 minutes, as shown in Figure 8. The fact that the majority of shared e-scooter riders in Birmingham choose trips of short distances and duration may be due to the cost associated with the use of the devices and/or the trip purposes. On the other hand, a small number of trips (1617 trips/year) exceeded the threshold of one hour of travel duration, suggesting that there were occasions in which users required prolonged travel times.
Table 3 displays the utilization rate of shared VEO e-scooter devices available during the Birmingham pilot program, along with relevant descriptive statistics. It is clear that shared e-scooters were used for just 3.65% of the daily time of operation, thus remaining idle for the vast majority of the available operational hours (6 AM to 11 PM). Additionally, it was determined that shared e-scooters in Birmingham were underutilized during the pilot program as they made an average of only 2.32 trips per day per device.
These results confirm that the shared e-scooters did not materialize their full potential during the pilot deployment and initiatives should be implemented to help increase the utilization rate of available micromobility devices in Birmingham in the future. Such initiatives include marketing and education campaigns targeting potential users, membership fee incentives and discounts, and strategic placement of corals close to land uses that may generate customer demand for service.
4.2. Spatial Density Distribution Analysis Results
For each shared e-scooter trip considered in this study, the precise x and y coordinates of the origin and destination were determined in the analysis using ArcGIS by comparing the longitude and latitude data with the spatial coordinates of the map. The survey area map was then delineated and separated into 7 zip codes and 2979 block sections. The trip frequency information for each zip code and block area was derived using a spatial correlation analysis in ArcGIS. With a thorough grasp of the geographical distribution, this method provided insightful information on the precise e-scooter trip generation and termination locations. Figure 9 displays the Origin-Destination connecting lines of shared e-scooter trips generated from this process and shows the distance of the e-scooter trips across the VEO service area in Birmingham. Some connecting lines had an origin or destination outside this area. Even though those trips were excluded from the final analysis, they were shown in Figure 9 to gain an overall idea about the trip characteristics of all shared VEO e-scooter trips that took place in Birmingham during the study period. As expected, the highest concentration of shared e-scooter trips was in the vicinity of coral locations. Some shared e-scooter trips served locations north-east of the downtown area, thus hinting of a potential need and opportunity for expansion of the availability of corals in this geographical area in the future.
An ArcGIS kernel density distribution analysis was carried out in order to display the distribution of trip demand throughout the study region. The final product of this analysis was maps with a gradual color scheme, where the deeper the color, the higher the concentration of trips at a certain location. This color representation does an outstanding job of highlighting areas within the study site that have a stronger concentration of shared e-scooter trips. Figure 10 and Figure 11 display the kernel density distribution of VEO shared e-scooter trips’ origin and destination points, respectively, based on zip codes. To provide additional detail, similar maps were produced based on a block analysis and are displayed in Figure 12 and Figure 13.
Table 4 summarizes the spatial density distribution analysis findings. From Table 4, it is clear that zip code 35233 generated and attracted the highest number of shared VEO e-scooter trips during the study period. This area houses the University of Alabama at Birmingham (UAB) academic buildings, and many students and employees live and/or work inside or near this area. This zip code has also the highest median zonal household income of all zip codes ($53,411) within the study area [2]. Therefore, it can be concluded from this analysis that the most common users of shared VEO e-scooters in Birmingham are people associated with the university and also those in a higher income range.
The more refined block-level analysis further revealed that block 3001 (numbered as in census.gov) has the highest number of shared VEO e-scooter start- or endpoints. It should be noted that block 3001 is located inside zip code area 35233. Other blocks near the UAB campus also had higher density distribution for shared e-scooters trips compared with blocks further away. Blocks with the top five shared e-scooter trip frequencies are summarized in Table 5 along with relevant demographic information obtained from [34].
4.3. Regression Analysis Results
The Negative Binomial (NB) regression analysis was used to fit an e-scooter trip prediction model using the study dataset. For this model, the dependent variable was the shared e-scooter trip count. Independent variables considered included the time of the day (divided into six individual variables), day of the week (divided into seven individual variables), month (divided into twelve individual variables), season (divided into four individual variables), median trip duration, and median trip distance. The dataset was first checked, and outliers were identified and removed. The R square (R2) and mean square error (MSE) values were calculated to check the accuracy of the model. A summary of the NB model output for predicting shared e-scooter trips is displayed in Table 6.
As shown in Table 6, a number of predictor variables demonstrate statistically significant effects on the count of shared e-scooter trips. The time interval variables exhibit favorable coefficients, indicating a correlation with increased trip counts, with t(12-15), t(15-18), and t(18-21) having the highest effects. Furthermore, the days of the week (Monday through Sunday) display diverse coefficients, indicating that distinct days exert distinct influences on the number of e-scooter trips. Thursday, Friday, and Saturday showed higher effects on the shared e-scooter trip production. Additionally, the twelve months of the year exhibit diverse coefficients, suggesting that each month has a distinct impact on the number of e-scooter trips taken. The coefficients of spring, summer, winter, and fall seasons also exhibit significant differences, indicating diverse effects on the number of trips. The results indicate that the month of September and the fall season show the highest effects on the shared e-scooter trip production, while the lowest effects were associated with the month of November and the winter season. Furthermore, the median distance and median trip duration, with values of 8.635e-06 miles and 0.0620 minutes, respectively, show less influence on the shared e-scooter trip count than the other variables.
The present analysis reveals that the predictor variables exhibit p-values that are low (<0.001), thereby indicating strong correlation with the e-scooter trip count. The z values of this model are also large, suggesting that the independent values have more significant effects on the dependent variable. In this model, t(12-15), t(15-18), spring, summer, and fall variables are projecting comparatively higher z values.
Finally, the statistical model exhibits a strong fit, as evidenced by an R square value (R2=0.81), which suggests that a significant portion of the variability in the data can be accounted for by the fitted model. Moreover, the calculated mean squared error (MSE) of 2245.75 represents the measure of the average squared difference between the predicted and observed values. The aforementioned results indicate that the NB model for shared e-scooter trips proposed in this study has effectively captured the fundamental patterns inherent in the data, and thus is expected to yield accurate predictions overall. This conclusion is further confirmed by the scatter plot of observed versus predicted shared e-scooter trip values as shown in Figure 14.
The plot (Figure 14) effectively demonstrates that a substantial portion of the predicted values align closely with the original values and are either clustered directly on the 45-degree regression line, or in close proximity to it. Moreover, the presence of a uniformly scattered pattern among the data points further strengthens the assertion that the model is indeed an excellent fit for the data.
5. Conclusions
This study analyzed one-year worth shared VEO e-scooter trip data from the shared micromobility pilot program in Birmingham, Alabama that took place in 2021-2022. The data analysis yielded various insights regarding the utilization of shared e-scooters, revealing discernible patterns and trends.
From the analysis, the mean duration, mean distance, and mean speed of the shared e-scooter trips were found to be 15.29 min, 2.13 miles, and 8.69 mph respectively. The peak period for shared e-scooter use was between 8 PM and 10 PM. Weekends had more trips than weekdays, with Saturdays having the highest trip rates. For the monthly distribution of trips, September saw more e-scooters trips than the other months of the study. Moreover, fall and spring had the leading number of shared e-scooter trips, suggesting a link between comfortable weather conditions and e-scooter ridership. The analysis further revealed that around 77.47% of trips were short-distance trips (trips distance less than 3 miles) and around 55.56% of trips were short-duration trips (duration less than 10 minutes). The results are consistent with findings with earlier studies, which confirmed that users typically choose shared e-scooters for short trips [21].
During the Birmingham pilot micromobility study, the operational utilization rate for shared VEO e-scooters was just 3.65%, and each e-scooter device averaged only 2.32 trips/day, thus indicating a reluctance of users to embrace this new transportation mode when it was first introduced. In order to increase future ridership, marketing and educational campaigns are needed to promote shared micromobility modes among target groups and inform potential users of the advantages and benefits from choosing shared e-scooters over other modes of transportation, especially for short trips. Moreover, membership discounts, expanded hours of operation, and investment in infrastructure improvements are recommended to further improve the convenience, access, and overall appeal of shared e-scooter use in the future.
The shared e-scooter trip analysis based on zip codes and blocks performed in this study revealed that most of the e-scooter trips took place inside and around the UAB campus. These locations also serve more educated and higher-income individuals, compared with others in and around the City of Birmingham. These study findings are consistent with earlier studies that reported that the presence of university campuses and higher income individuals were associated with higher rates of e-scooter use [19,22]. Additionally, the negative binomial regression model fitted to the Birmingham shared VEO e-scooter dataset suggested that time periods from 12 PM to 6 PM, spring, summer, and fall variables were positively associated with shared e-scooter use. This finding confirms that favorable weather conditions have a positive influence on the adoption of micromobility options.
Overall, the analysis of the Birmingham pilot shared VEO e-scooter data revealed valuable information on user preferences and behaviors related to e-scooter use in the Birmingham area. The findings and recommendations provided herein are expected to support future planning efforts as local transportation agencies and micromobility providers continue their efforts to enhance shared mobility services in the region and serve current and future customers. The research methods used in this study can be replicated at other medium-sized cities that are in the process of introducing shared e-scooter services or evaluating micromobility usage patterns and their impact on local traffic operations. In future research, a comparative analysis of shared e-scooter usage patterns in other medium-sized cities could be conducted to provide a more comprehensive understanding of the prevailing state of e-scooter users' preferences and identify location-specific similarities and differences. It is also recommended that user surveys be conducted to document users' perceptions and attitudes toward shared e-scooter use before- and after they have been exposed to this mode.
Author Contributions
The authors confirm their contribution to the paper as follows: study conception and design: Virginia Sisiopiku, Mithila Hasan; data analysis and interpretation of results: Mithila Hasan; draft manuscript preparation: Mithila Hasan, Virginia Sisiopiku; funding acquisition: Virginia Sisiopiku . All authors reviewed the results and approved the final version of the manuscript. All authors have read and agreed to the published version of the manuscript.
Acknowledgments
The authors acknowledge the sponsorship of this work by the United States Department of Transportation Office of the Assistant Secretary for Research and Technology (OST-R) through the Southeastern Transportation Research, Innovation, Development, and Education Center (Project D4). The authors also wish to express their sincere gratitude to the VEO operator for providing anonymized e-scooter trip data for this study and the City of Birmingham for facilitating the data-sharing process.
Conflicts of Interest
The authors declare no conflict of interest. The funders had no role in the design of the study; in the collection, analyses, or interpretation of data; in the writing of the manuscript; or in the decision to publish the results.
References
- Birmingham Population (2023) - Total Population. Available online: https://www.totalpopulation.co.uk/authority/birmingham (accessed on 3 November 2023).
- U.S. Census Bureau QuickFacts: Birmingham City, Alabama. Available online: https://www.census.gov/quickfacts/fact/table/birminghamcityalabama/PST045222 (accessed on 3 November 2023).
- Sisiopiku, V.; Ramadan, O. Understanding Travel Behavior and Mode Choice of Urban University Campus Employees; 2017.
- Bikes Are Back for Birmingham - al.Com. Available online: https://www.al.com/news/2021/04/bikes-are-back-for-birmingham.html (accessed on 3 November 2023).
- Birmingham. Veo Micromobility.
- Xu, Y.; Yan, X.; Sisiopiku, V.P.; Merlin, L.A.; Xing, F.; Zhao, X. Micromobility Trip Origin and Destination Inference Using General Bikeshare Feed Specification Data. Transportation Research Record 2022, 2676, 223–238. [Google Scholar] [CrossRef]
- University, S.; University, S.F.S. The Best E-Scooters for a Zero-Emissions Commute. Available online: https://www.treehugger.com/best-e-scooters-5216388 (accessed on 3 November 2023).
- Picaro, E.B. E-Scooters in the US: Everything You Need to Know about the Electric Scooters from Bird, Lime, and Spin. Available online: https://www.pocket-lint.com/apps/news/144782-e-scooter-invasion-everything-you-need-to-know-about-electric-scooters-from-bird-lime-and-spin/ (accessed on 3 November 2023).
- Micro-Mobility, E-Scooters and Implications for Higher Education. Available online: https://docslib.org/doc/10504096/micro-mobility-e-scooters-and-implications-for-higher-education (accessed on 3 November 2023).
- Shared Micromobility in the U.S.: 2019. Available online: https://nacto.org/shared-micromobility-2018 (accessed on 3 November 2023).
- Transportation Statistics Annual Report 2022 | Bureau of Transportation Statistics. Available online: https://www.bts.gov/newsroom/transportation-statistics-annual-report-2022 (accessed on 3 November 2023).
- Injuries Associated With Standing Electric Scooter Use - PubMed. Available online: https://pubmed.ncbi.nlm.nih.gov/30681711/ (accessed on 3 November 2023).
- Nocerino, R.; Colorni, A.; Lia, F.; Lué, A. E-Bikes and e-Scooters for Smart Logistics: Environmental and Economic Sustainability in pro-e-Bike Italian Pilots. Transportation research procedia 2016. [CrossRef]
- Electric Scooters And The Environment (How They Save Our Planet + Their Real Downsides) - EScooterNerds. Available online: https://escooternerds.com/electric-scooters-environment/ (accessed on 3 November 2023).
- Abduljabbar, R.L.; Liyanage, S.; Dia, H. The Role of Micro-Mobility in Shaping Sustainable Cities: A Systematic Literature Review. Transportation Research Part D: Transport and Environment 2021, 92, 102734. [Google Scholar] [CrossRef]
- How Micromobility Is Moving Cities into a Sustainable Future | EY - Global. Available online: https://www.ey.com/en_gl/automotive-transportation/how-micromobility-is-moving-cities-into-a-sustainable-future (accessed on 3 November 2023).
- Davar, Z. The Environmental Impact of Electric Scooters. Cleantech Rising 2019.
- Are E-Scooters Sustainable? Advantages & Disadvantages - CareElite. Available online: https://www.careelite.de/en/e-scooter-sustainable/ (accessed on 3 November 2023).
- McKenzie, G. Urban Mobility in the Sharing Economy: A Spatiotemporal Comparison of Shared Mobility Services. Computers, Environment and Urban Systems 2020, 79, 101418. [Google Scholar] [CrossRef]
- Mathew, J.; Liu, M.; Li, H.; Seeder, S.; Bullock, D. Analysis of E-Scooter Trips and Their Temporal Usage Patterns. Ite Journal 2019, 89, 44–49. [Google Scholar]
- Noland, R. Trip Patterns and Revenue of Shared E-Scooters in Louisville, Kentucky. Transport Findings 2019. [CrossRef] [PubMed]
- McKenzie, G. Spatiotemporal Comparative Analysis of Scooter-Share and Bike-Share Usage Patterns in Washington, D. C. Journal of Transport Geography 2019, 78, 19–28. [Google Scholar] [CrossRef]
- Bai, S.; Jiao, J. Dockless E-Scooter Usage Patterns and Urban Built Environments: A Comparison Study of Austin, TX, and Minneapolis, MN. Travel Behaviour and Society 2020, 20, 264–272. [Google Scholar] [CrossRef]
- Jiao, J.; Bai, S. Understanding the Shared E-Scooter Travels in Austin, TX. ISPRS International Journal of Geo-Information 2020, 9, 135. [Google Scholar] [CrossRef]
- Caspi, O.; Smart, M.J.; Noland, R.B. Spatial Associations of Dockless Shared E-Scooter Usage. Transportation Research Part D: Transport and Environment 2020, 86, 102396. [Google Scholar] [CrossRef] [PubMed]
- Reck, D.J.; Haitao, H.; Guidon, S.; Axhausen, K.W. Explaining Shared Micromobility Usage, Competition and Mode Choice by Modelling Empirical Data from Zurich, Switzerland. Transportation Research Part C: Emerging Technologies 2021, 124, 102947. [Google Scholar] [CrossRef]
- Mehzabin Tuli, F.; Mitra, S.; Crews, M.B. Factors Influencing the Usage of Shared E-Scooters in Chicago. Transportation Research Part A: Policy and Practice 2021, 154, 164–185. [Google Scholar] [CrossRef]
- Abouelela, M.; Chaniotakis, E.; Antoniou, C. Understanding the Landscape of Shared-e-Scooters in North America; Spatiotemporal Analysis and Policy Insights. Transportation Research Part A: Policy and Practice 2023, 169, 103602. [Google Scholar] [CrossRef]
- Zhao, X.; Yan, X.; Sisiopiku, V.P.; et al. Mobility-on-Demand Transit for Smart and Sustainable Cities (Project D4) 2023.
- ESRI (2011) ArcGIS Desktop Release 10. Environmental Systems Research Institute, Redlands. - References - Scientific Research Publishing 2011.
- Hewson, P. Statistical and Econometric Methods for Transportation Data Analysis. Journal of the Royal Statistical Society Series A: Statistics in Society 2022, 185, 731. [Google Scholar] [CrossRef]
- Gebhart, K.; Noland, R.B. The Impact of Weather Conditions on Bikeshare Trips in Washington, DC. Transportation 2014, 41, 1205–1225. [Google Scholar] [CrossRef]
- Seabold, S.; Perktold, J. Statsmodels: Econometric and Statistical Modeling with Python.; Austin, Texas, 2010; pp. 92–96.
- World, A.L.A. of the ArcGIS Living Atlas of the World. Available online: https://livingatlas.arcgis.com/ (accessed on 3 November 2023).
Figure 1.
VEO E-scooter (Astro).
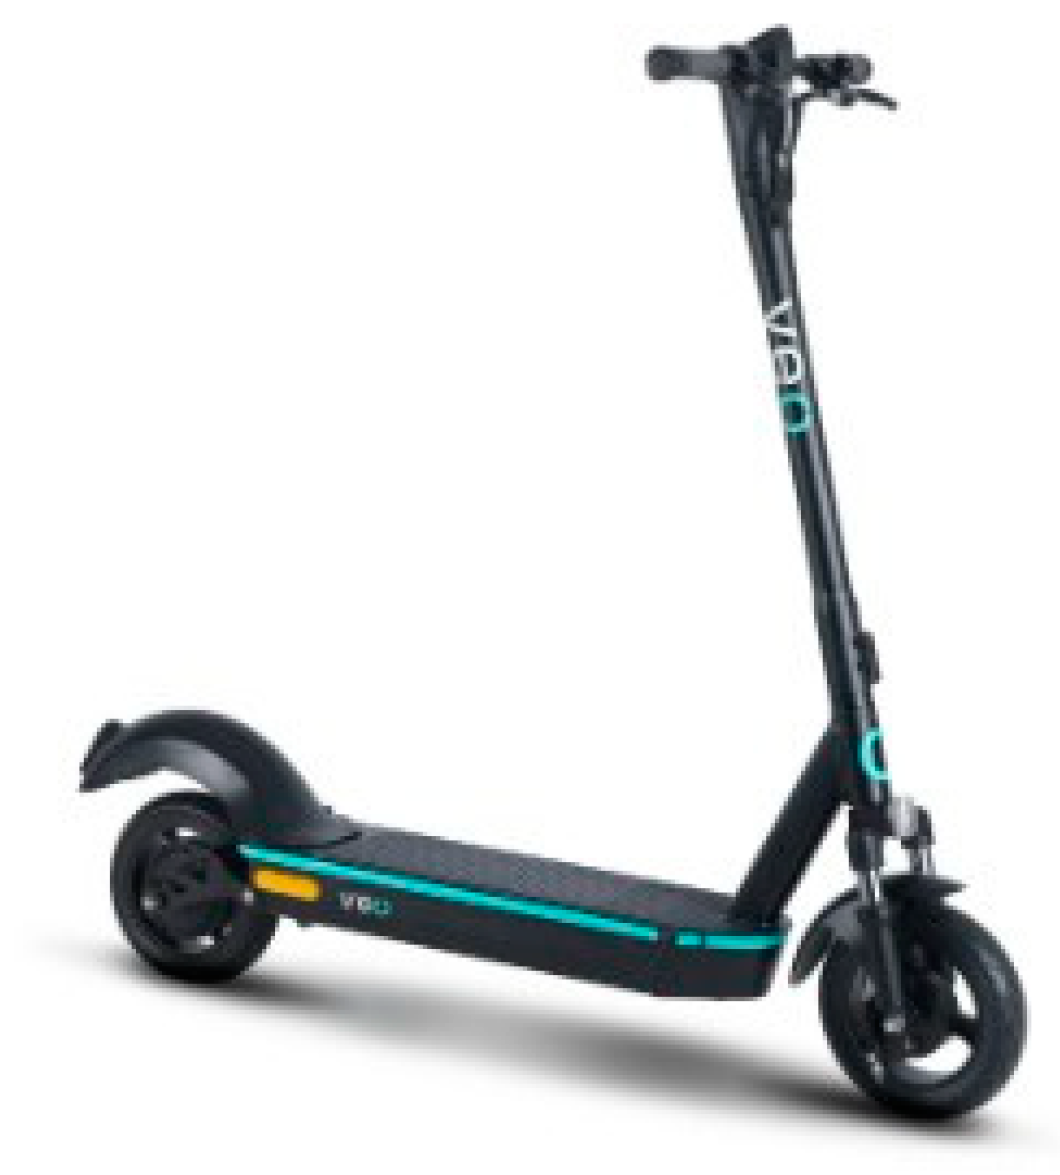
Figure 2.
The Service Area of VEO in Birmingham, Alabama (Source: veoride.com) [5].
Figure 2.
The Service Area of VEO in Birmingham, Alabama (Source: veoride.com) [5].
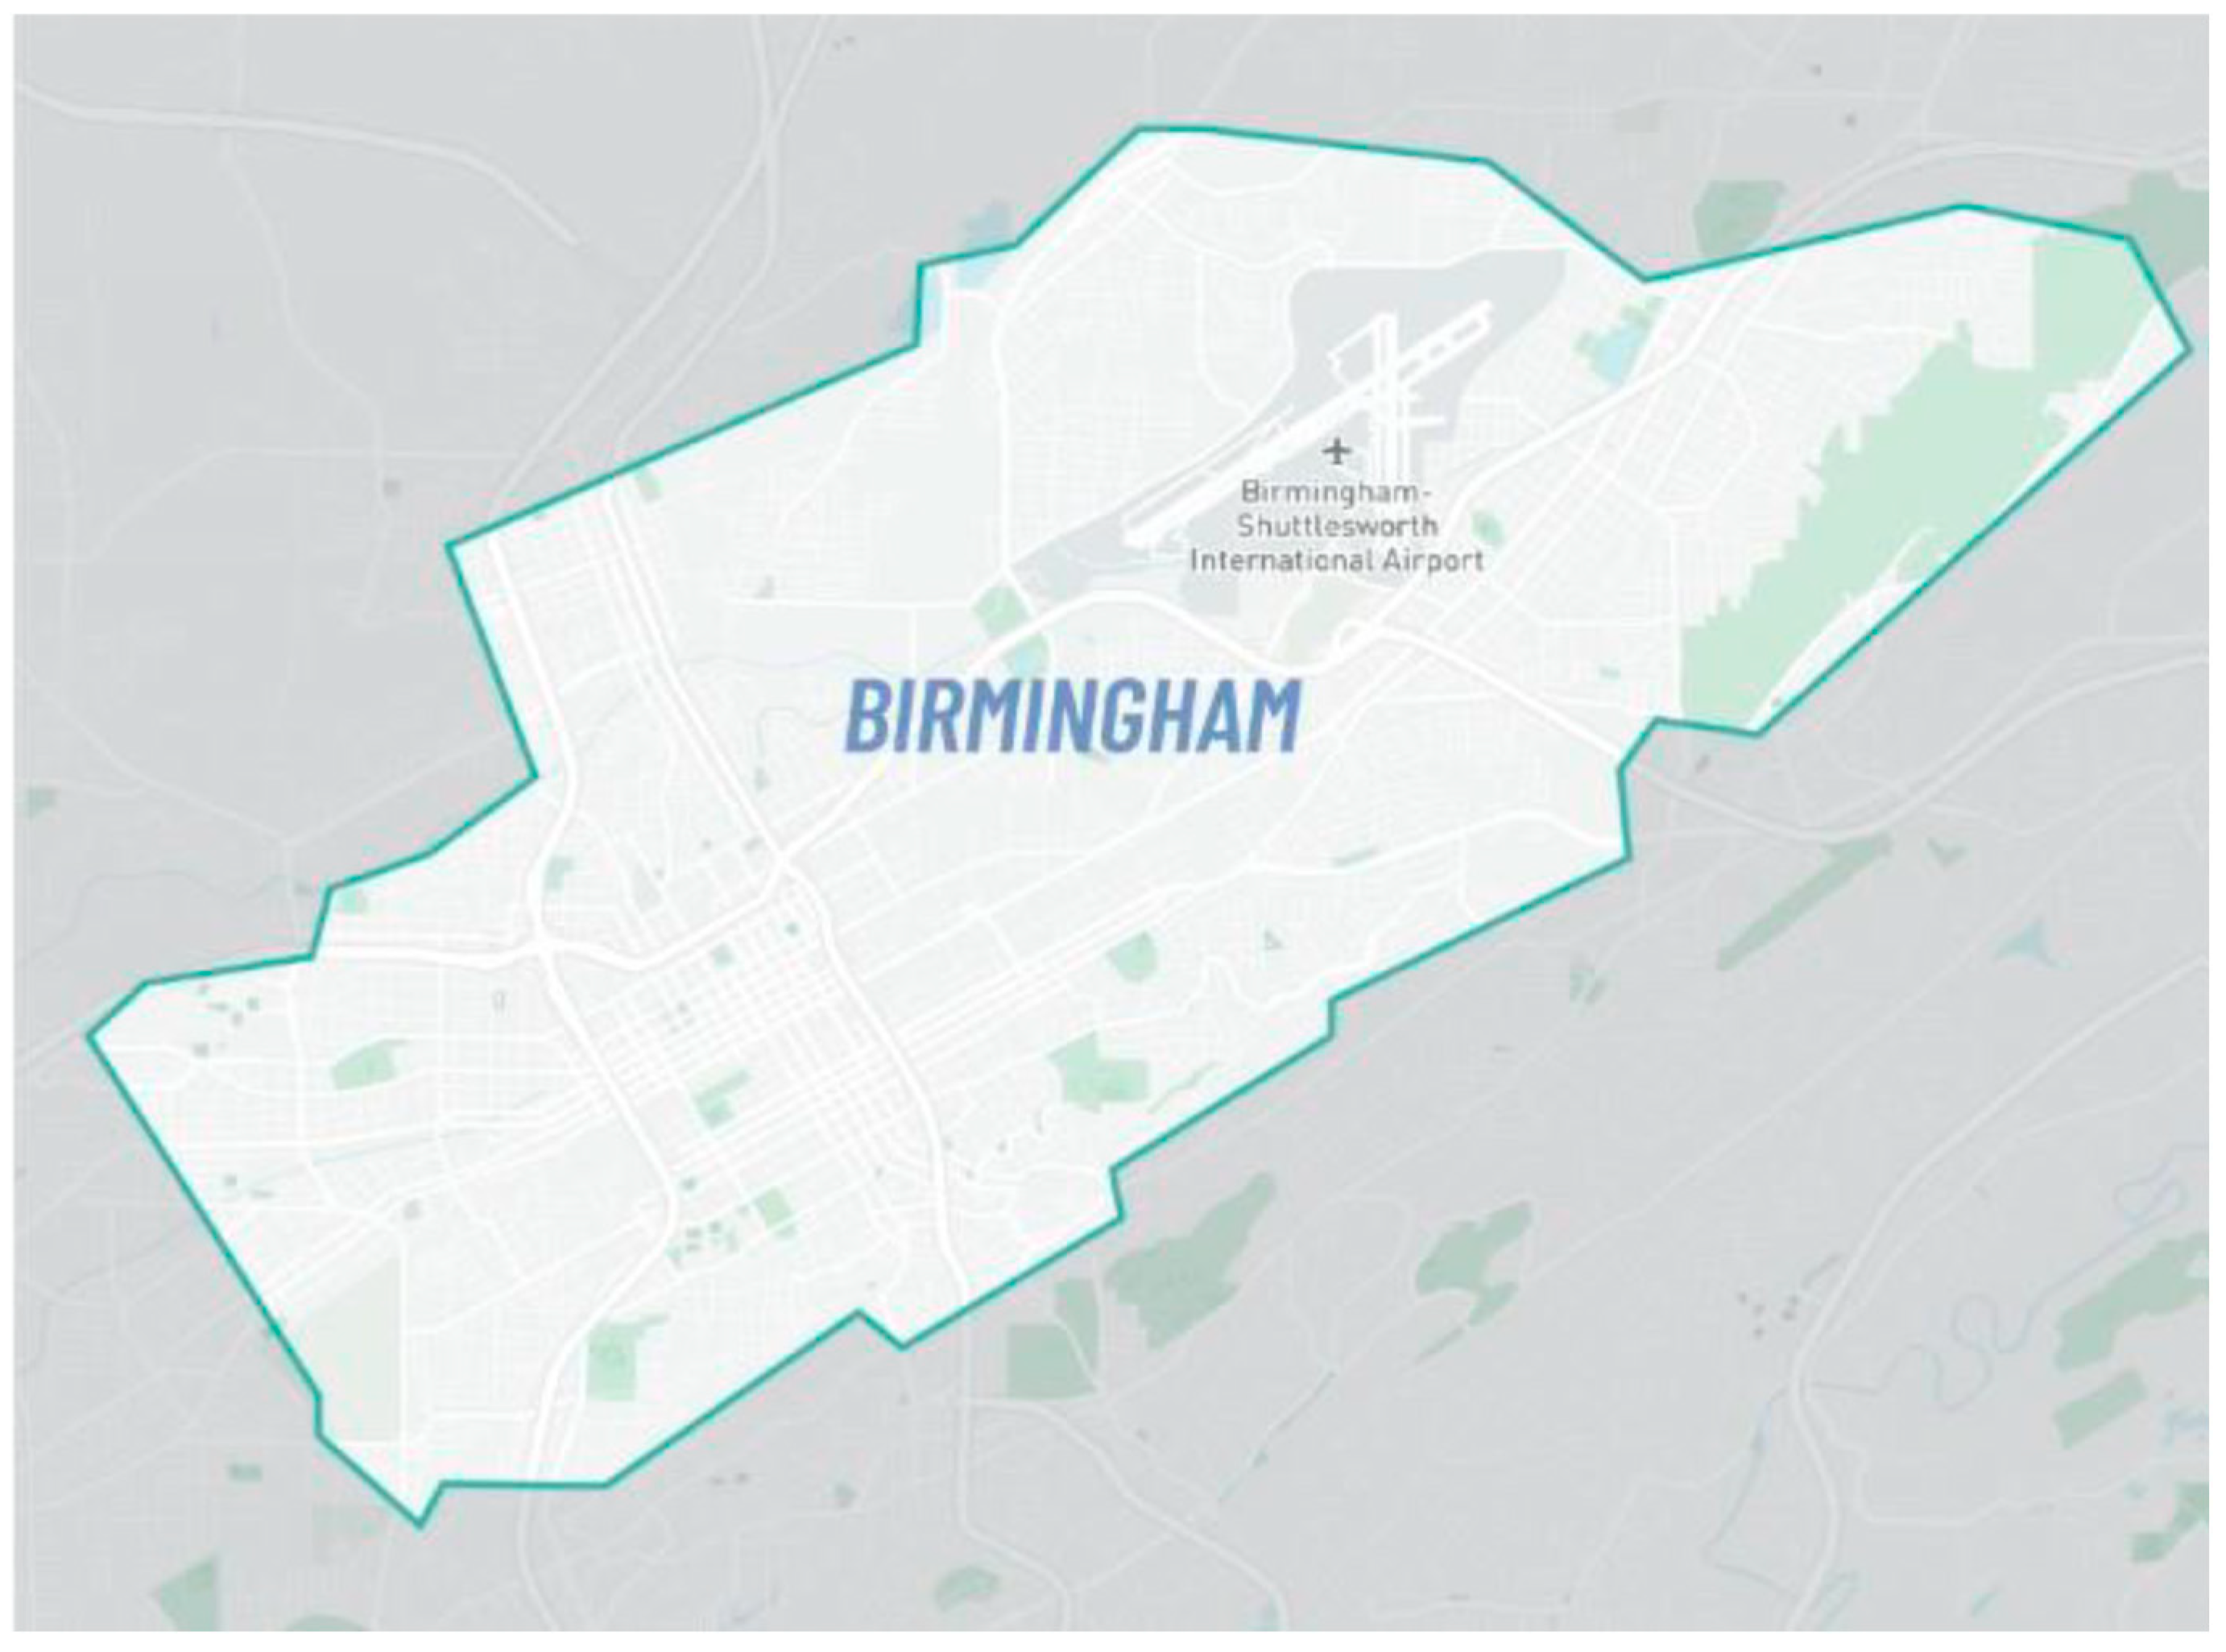
Figure 3.
Hourly Distribution of Shared VEO E-Scooter Trips During Hours of Operation (6 AM-11 PM); Birmingham, AL Pilot Case Study.
Figure 3.
Hourly Distribution of Shared VEO E-Scooter Trips During Hours of Operation (6 AM-11 PM); Birmingham, AL Pilot Case Study.
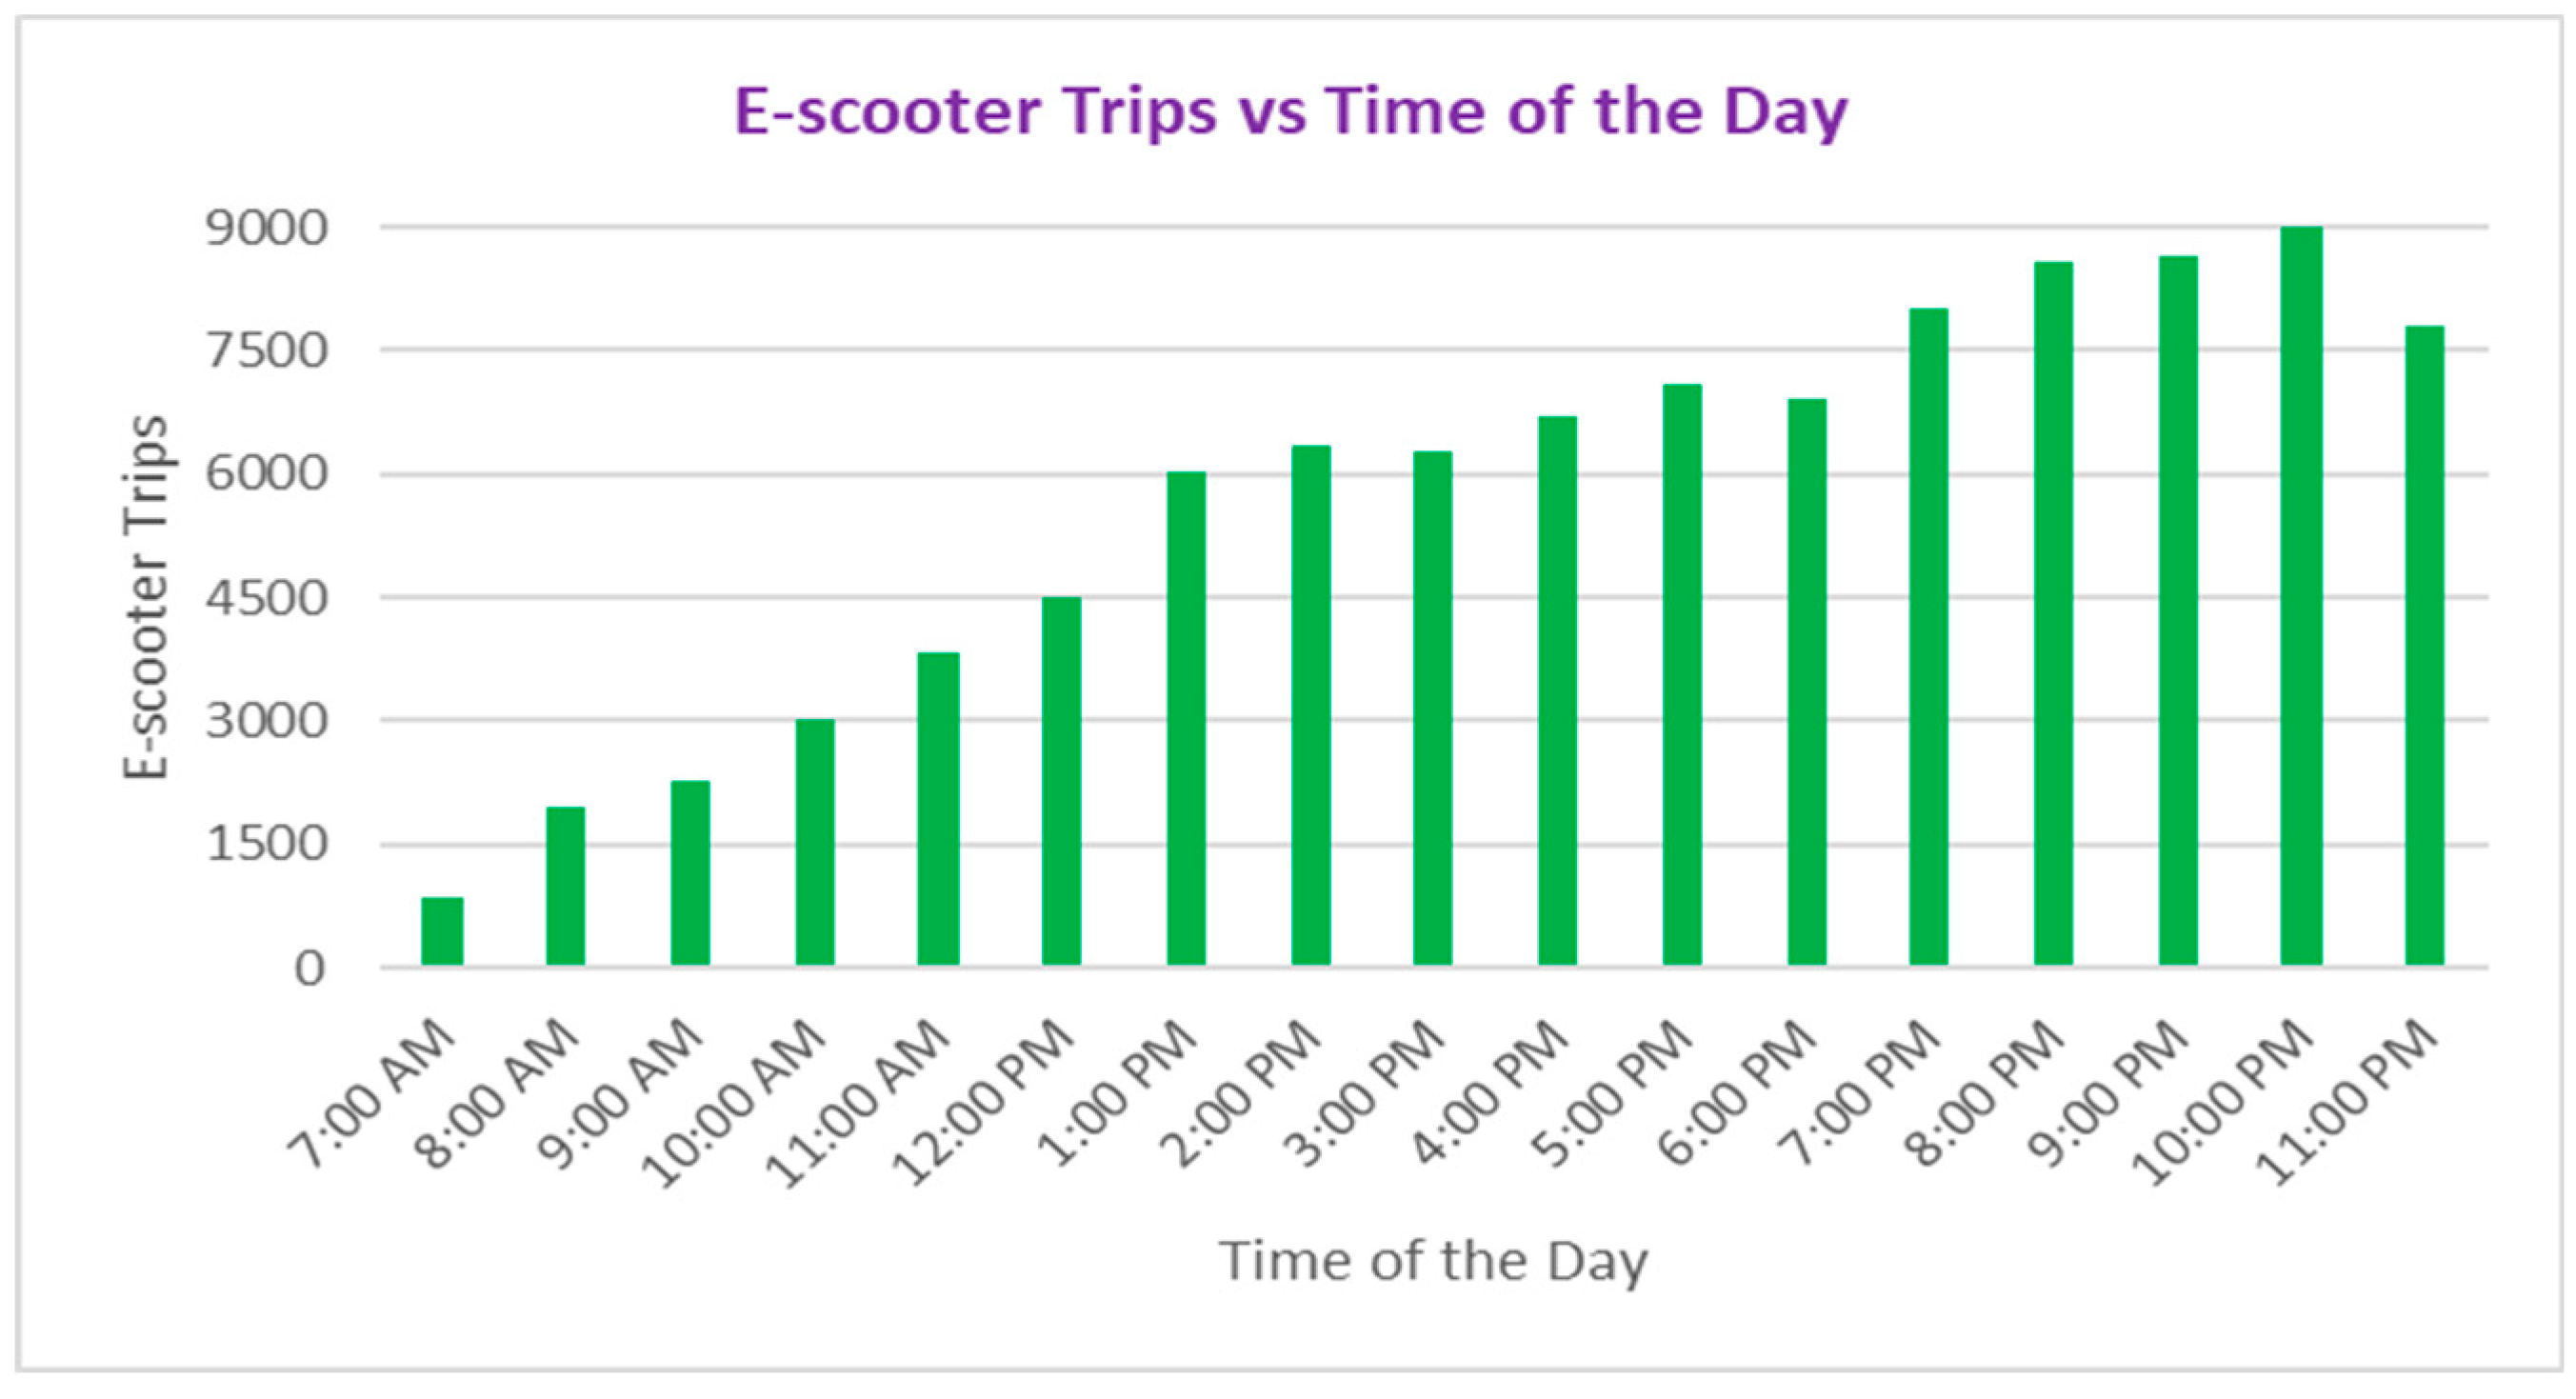
Figure 4.
Daily Distribution of Shared VEO E-scooter Trips; Birmingham, AL Pilot Case Study.
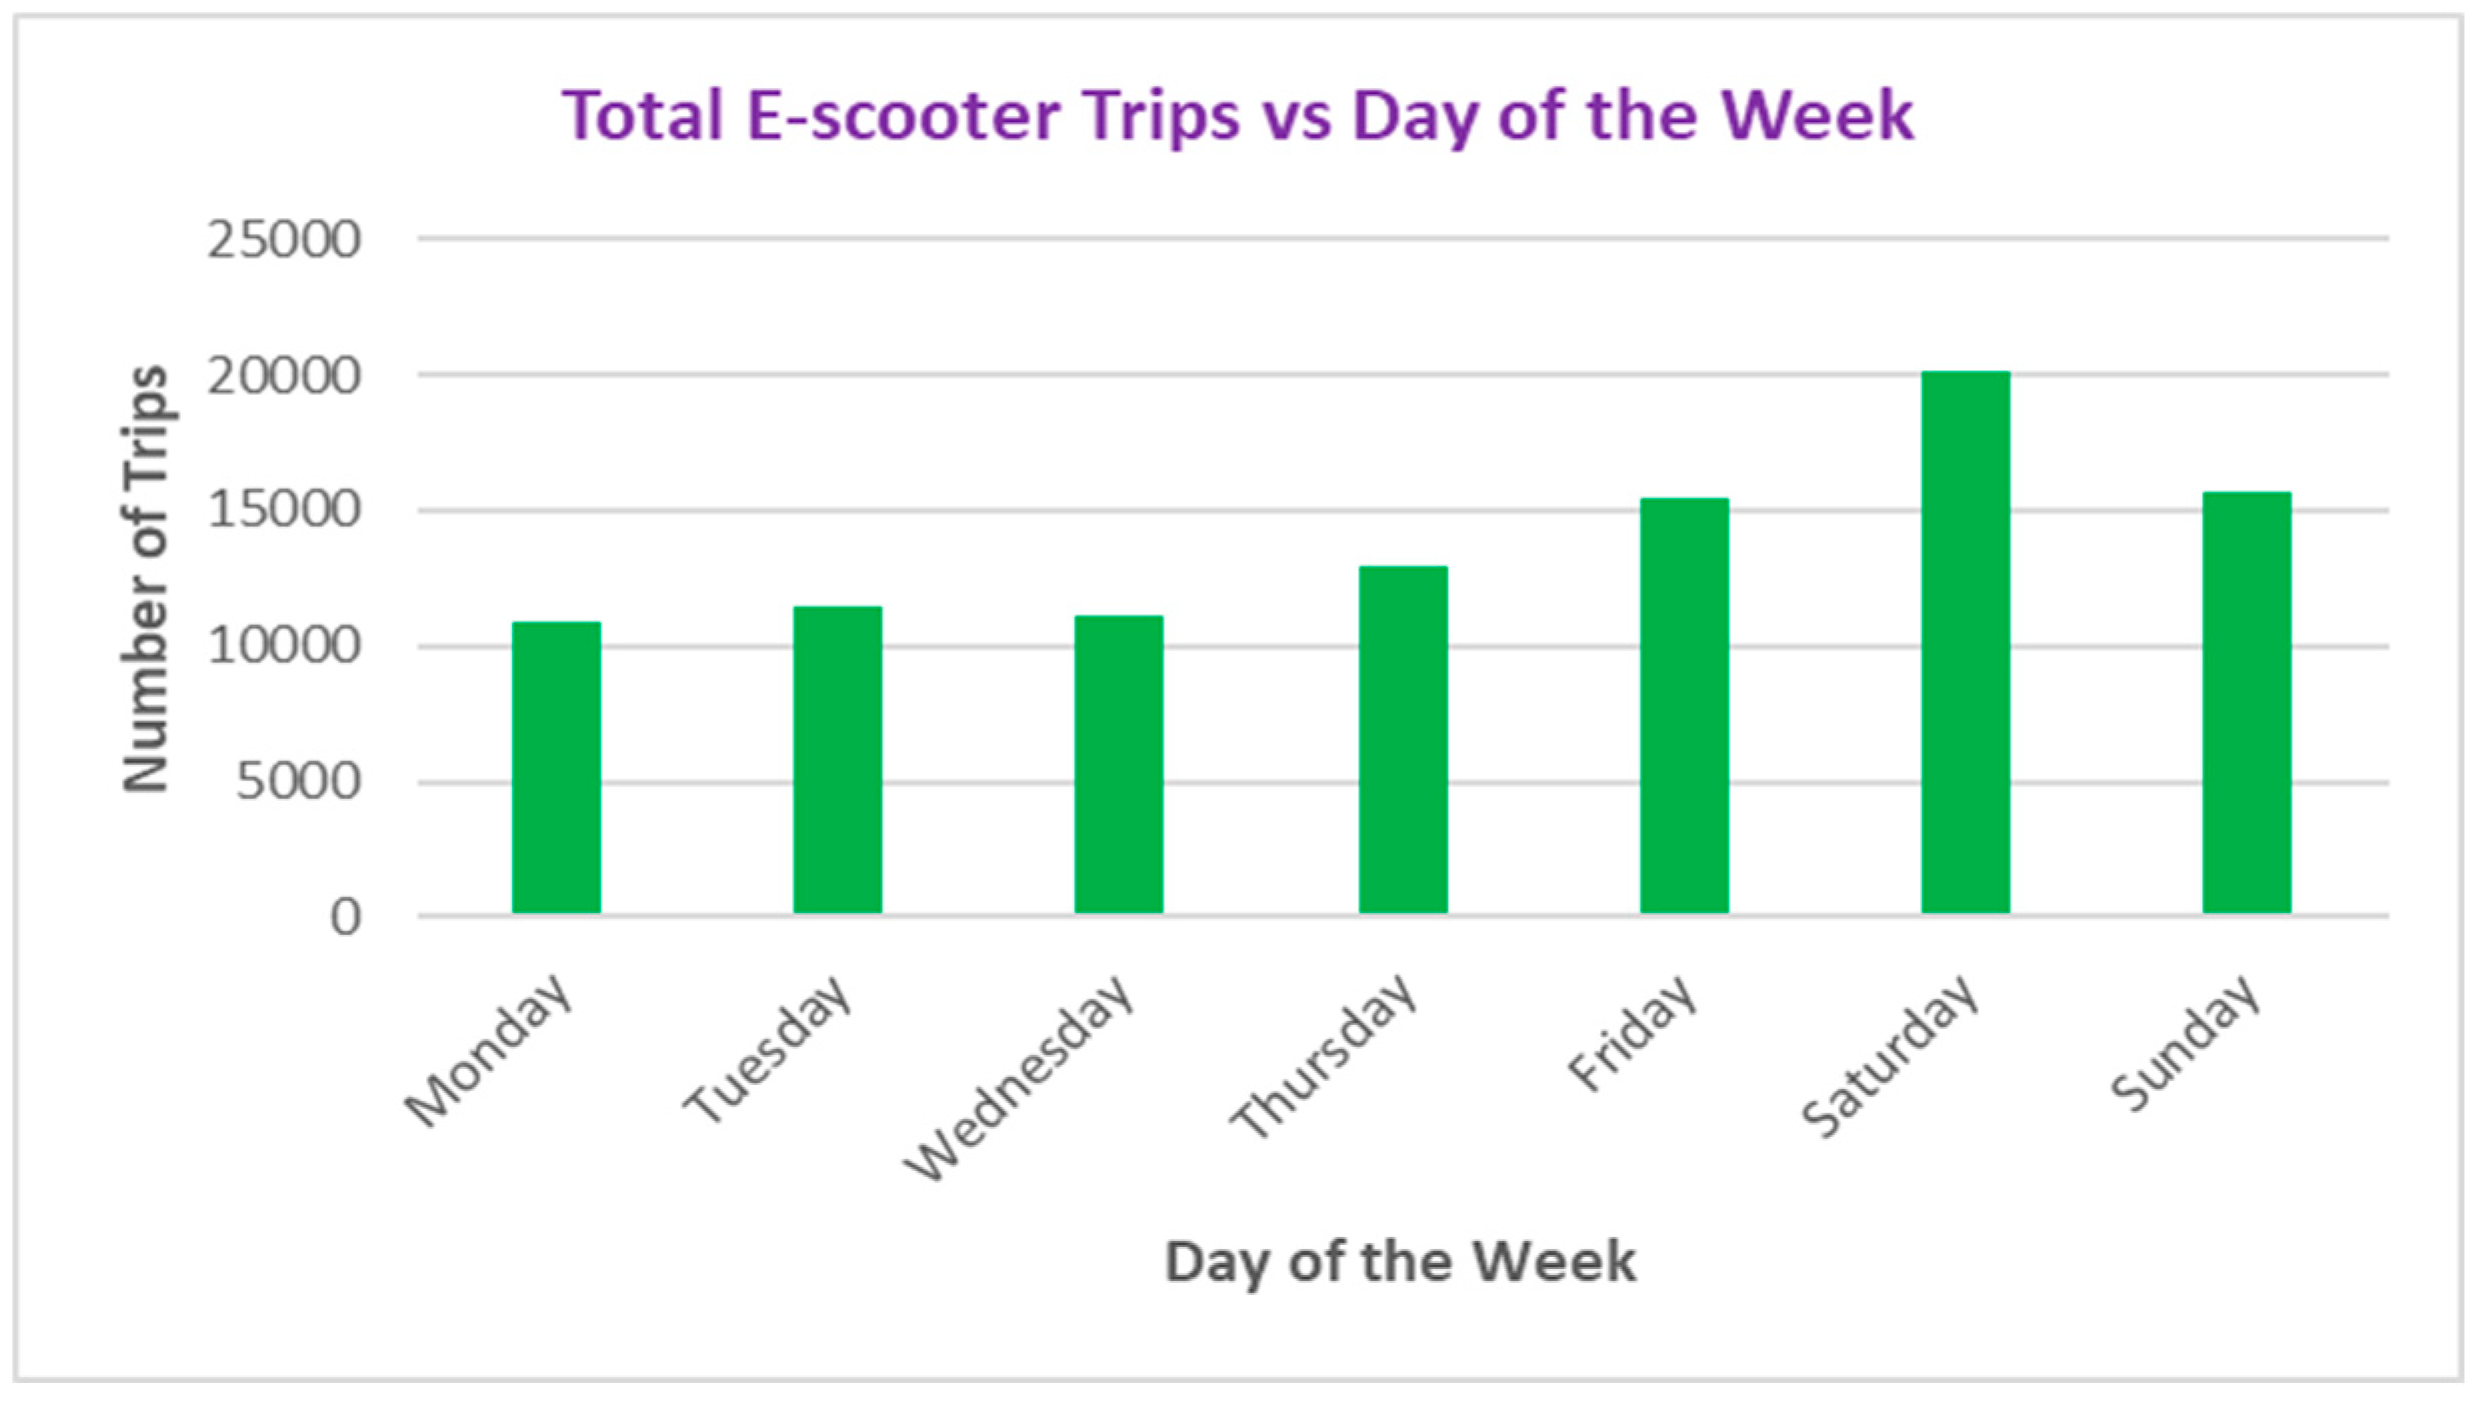
Figure 5.
Monthly Distribution of Shared VEO E-scooters Trips; Birmingham, AL Pilot Case Study.
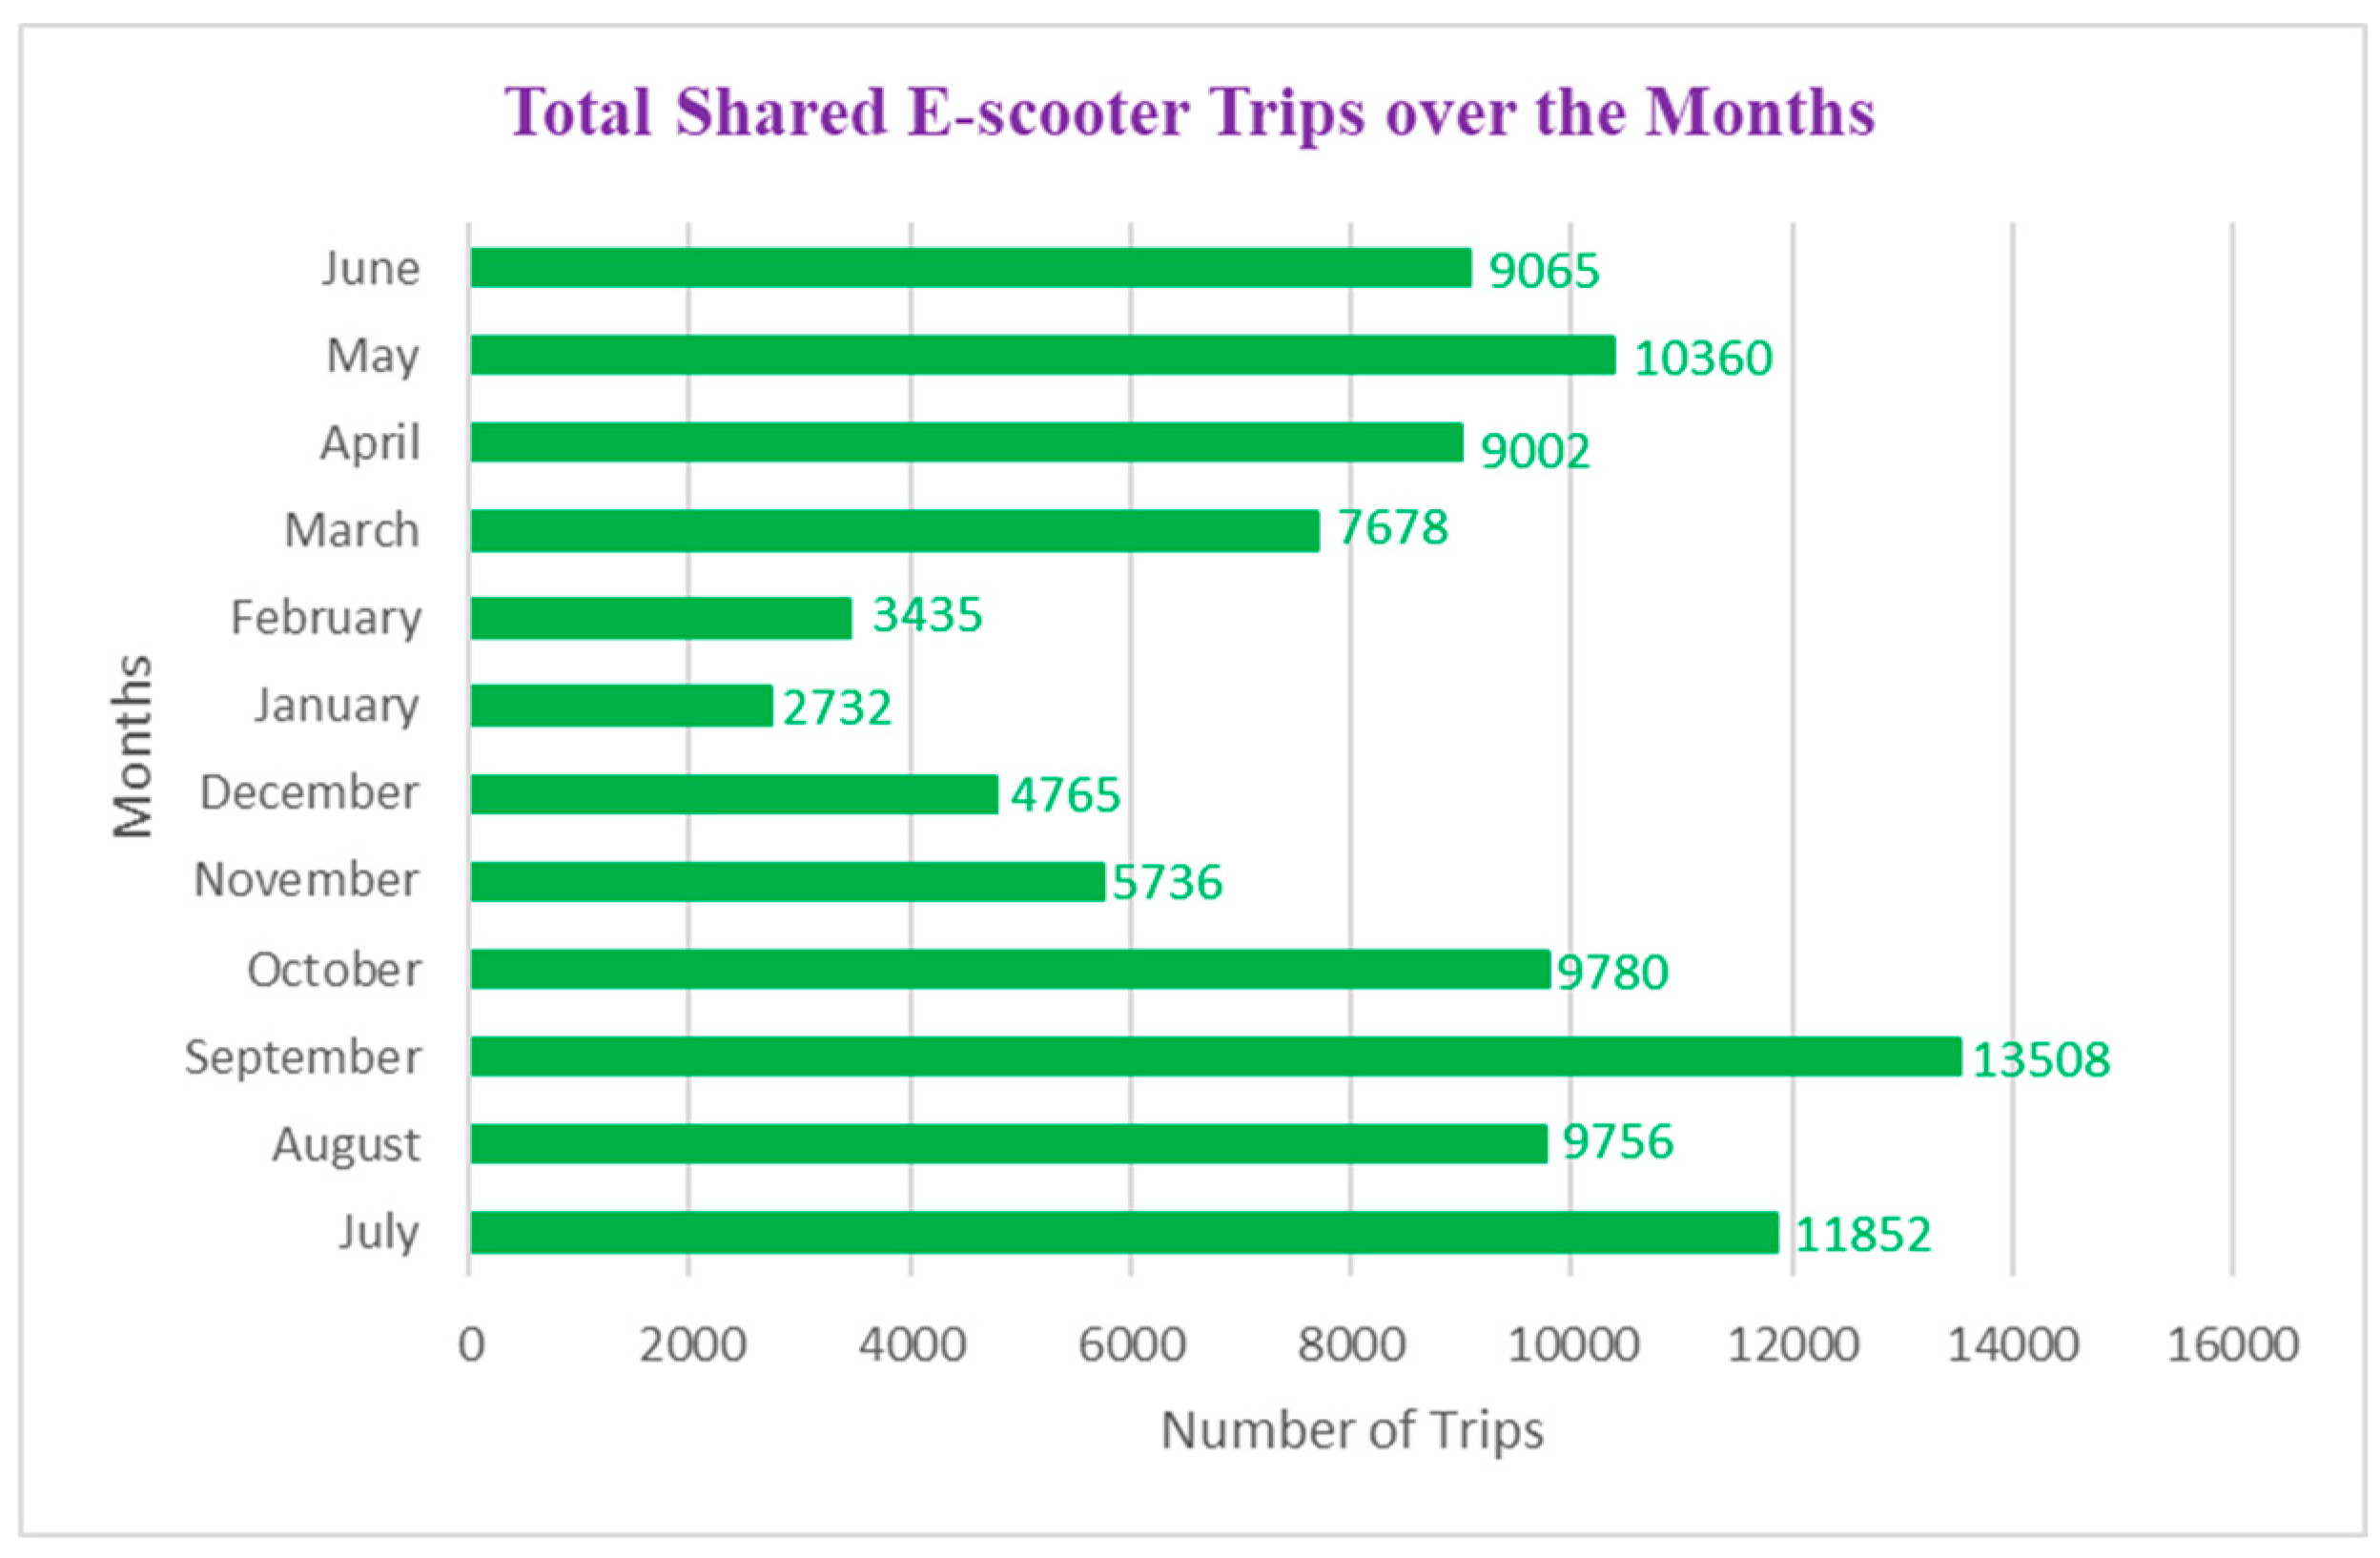
Figure 6.
Seasonal Distribution of Shared VEO E-scooters Trips; Birmingham, AL Pilot Case Study.
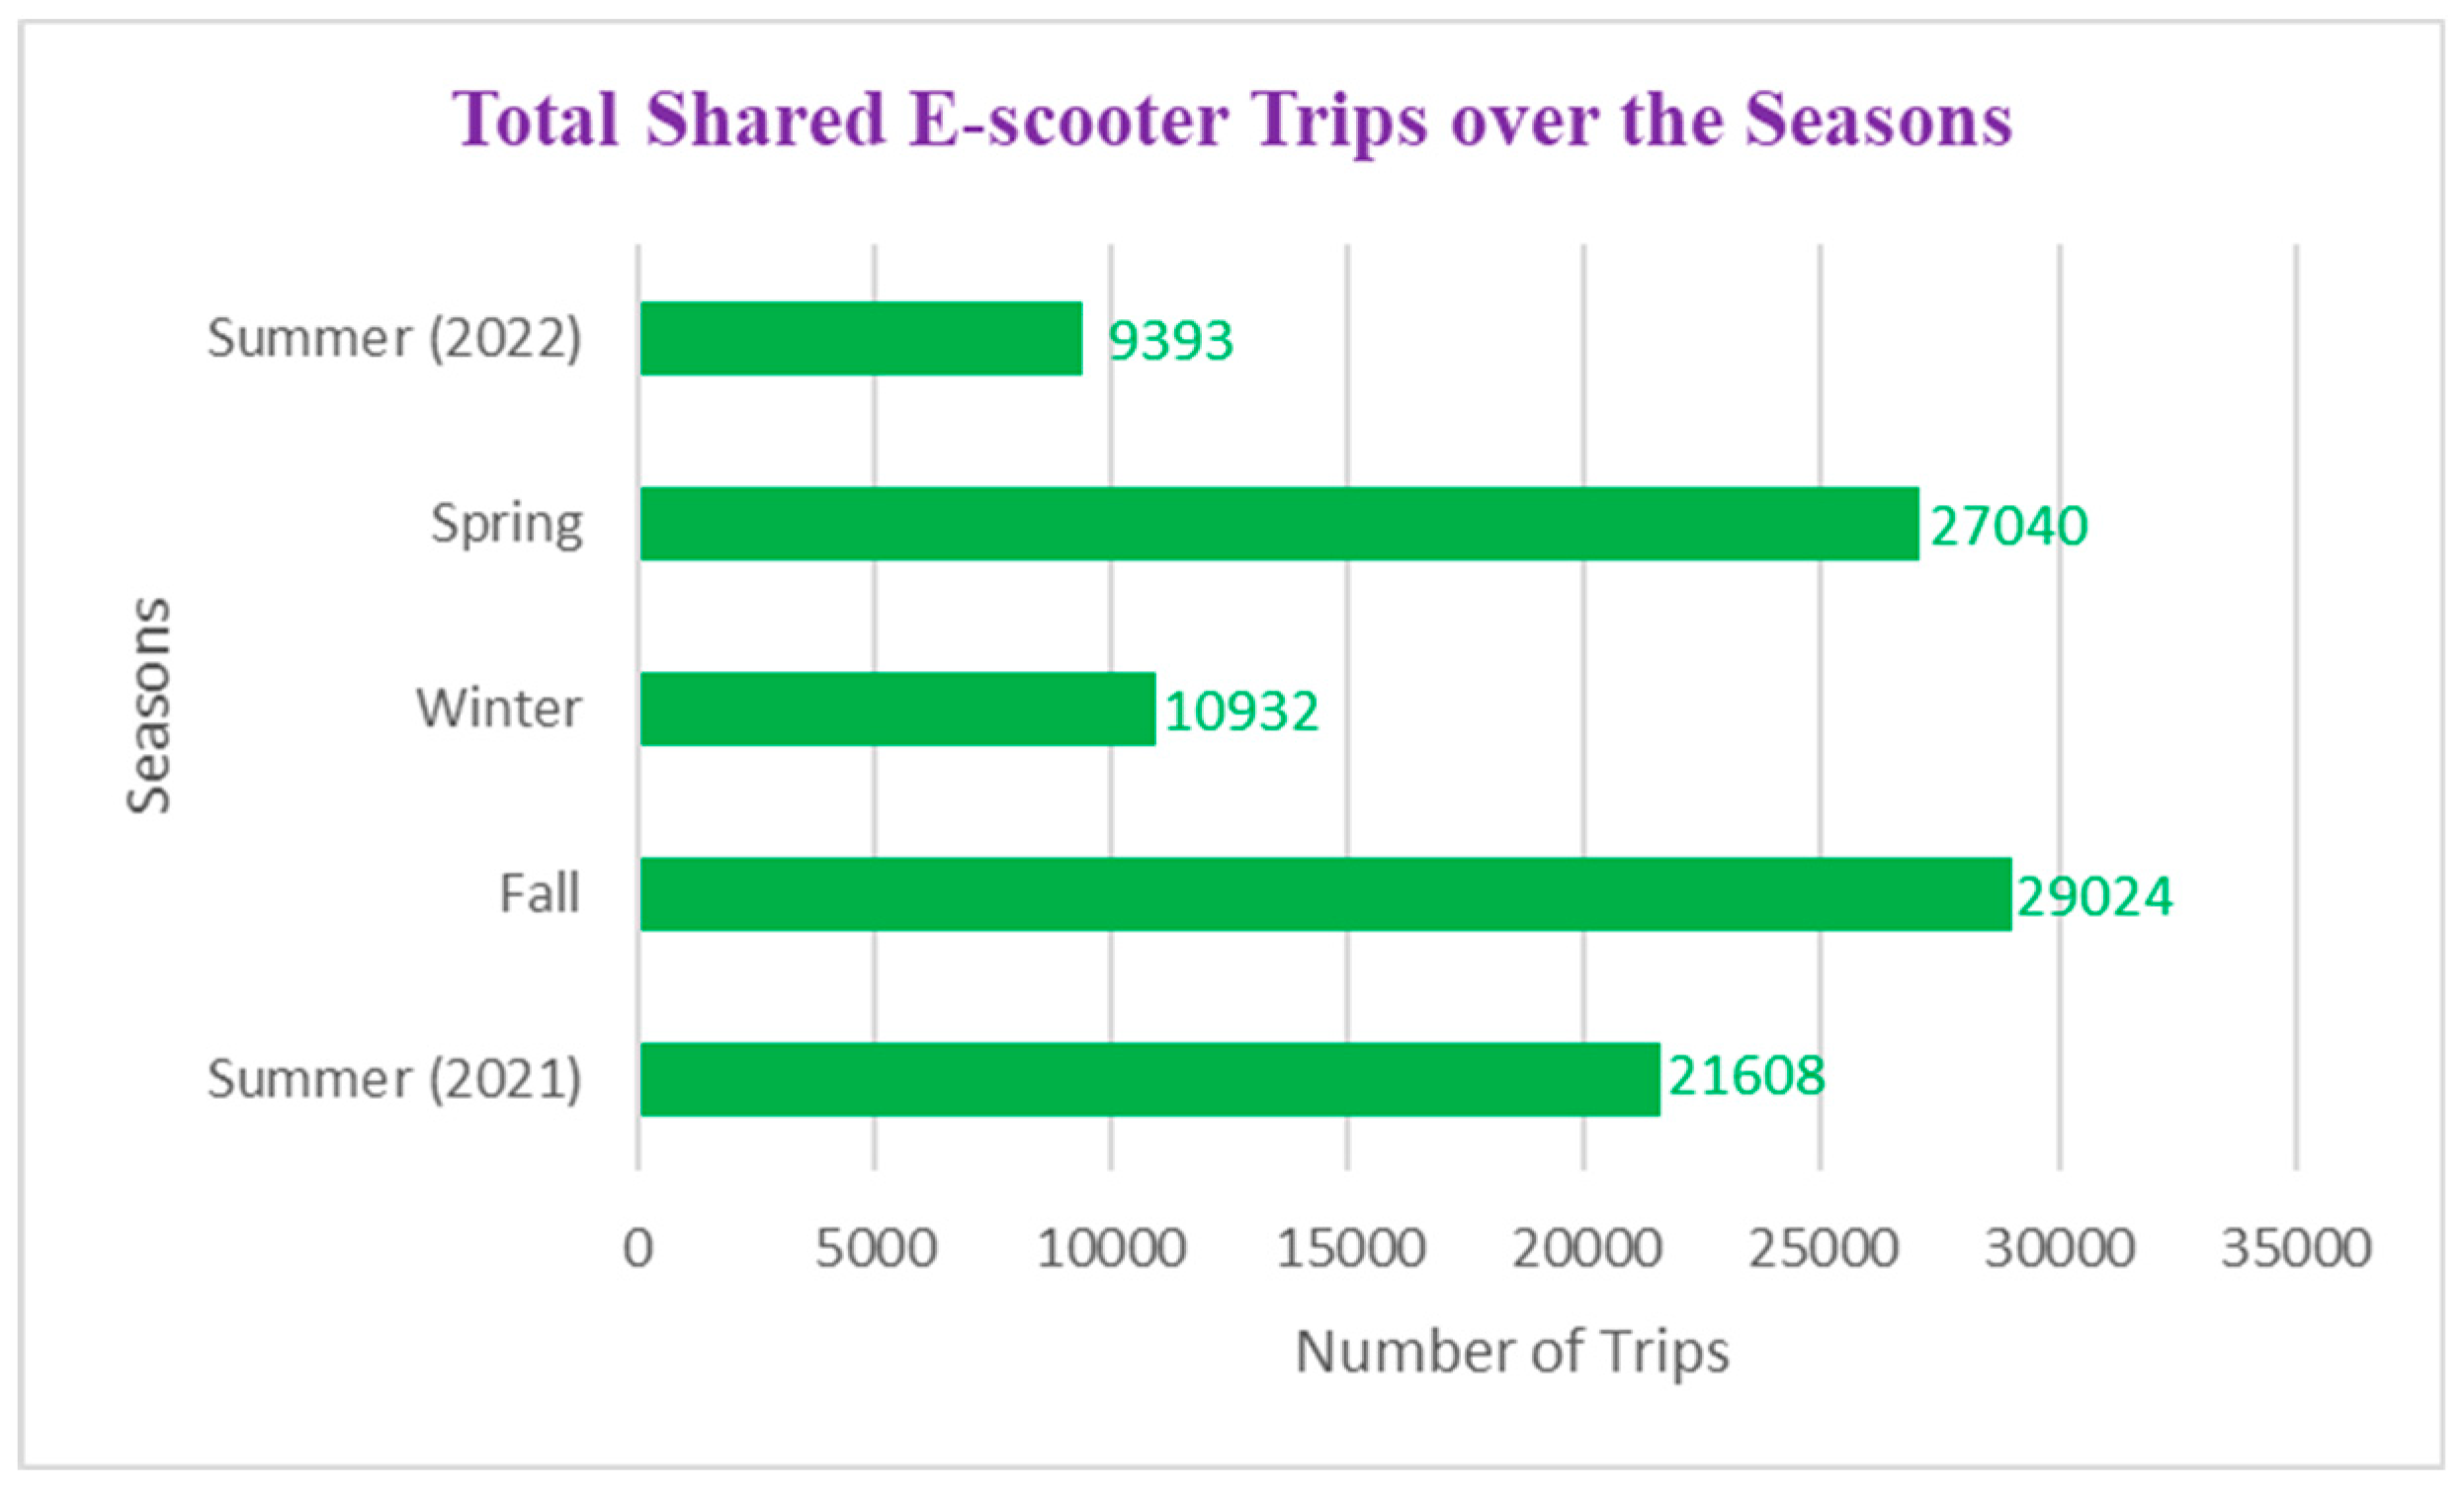
Figure 7.
Total Number of Shared VEO E-scooter Trips Divided into Different Distance Classes (Miles); Birmingham, AL Pilot Case Study.
Figure 7.
Total Number of Shared VEO E-scooter Trips Divided into Different Distance Classes (Miles); Birmingham, AL Pilot Case Study.
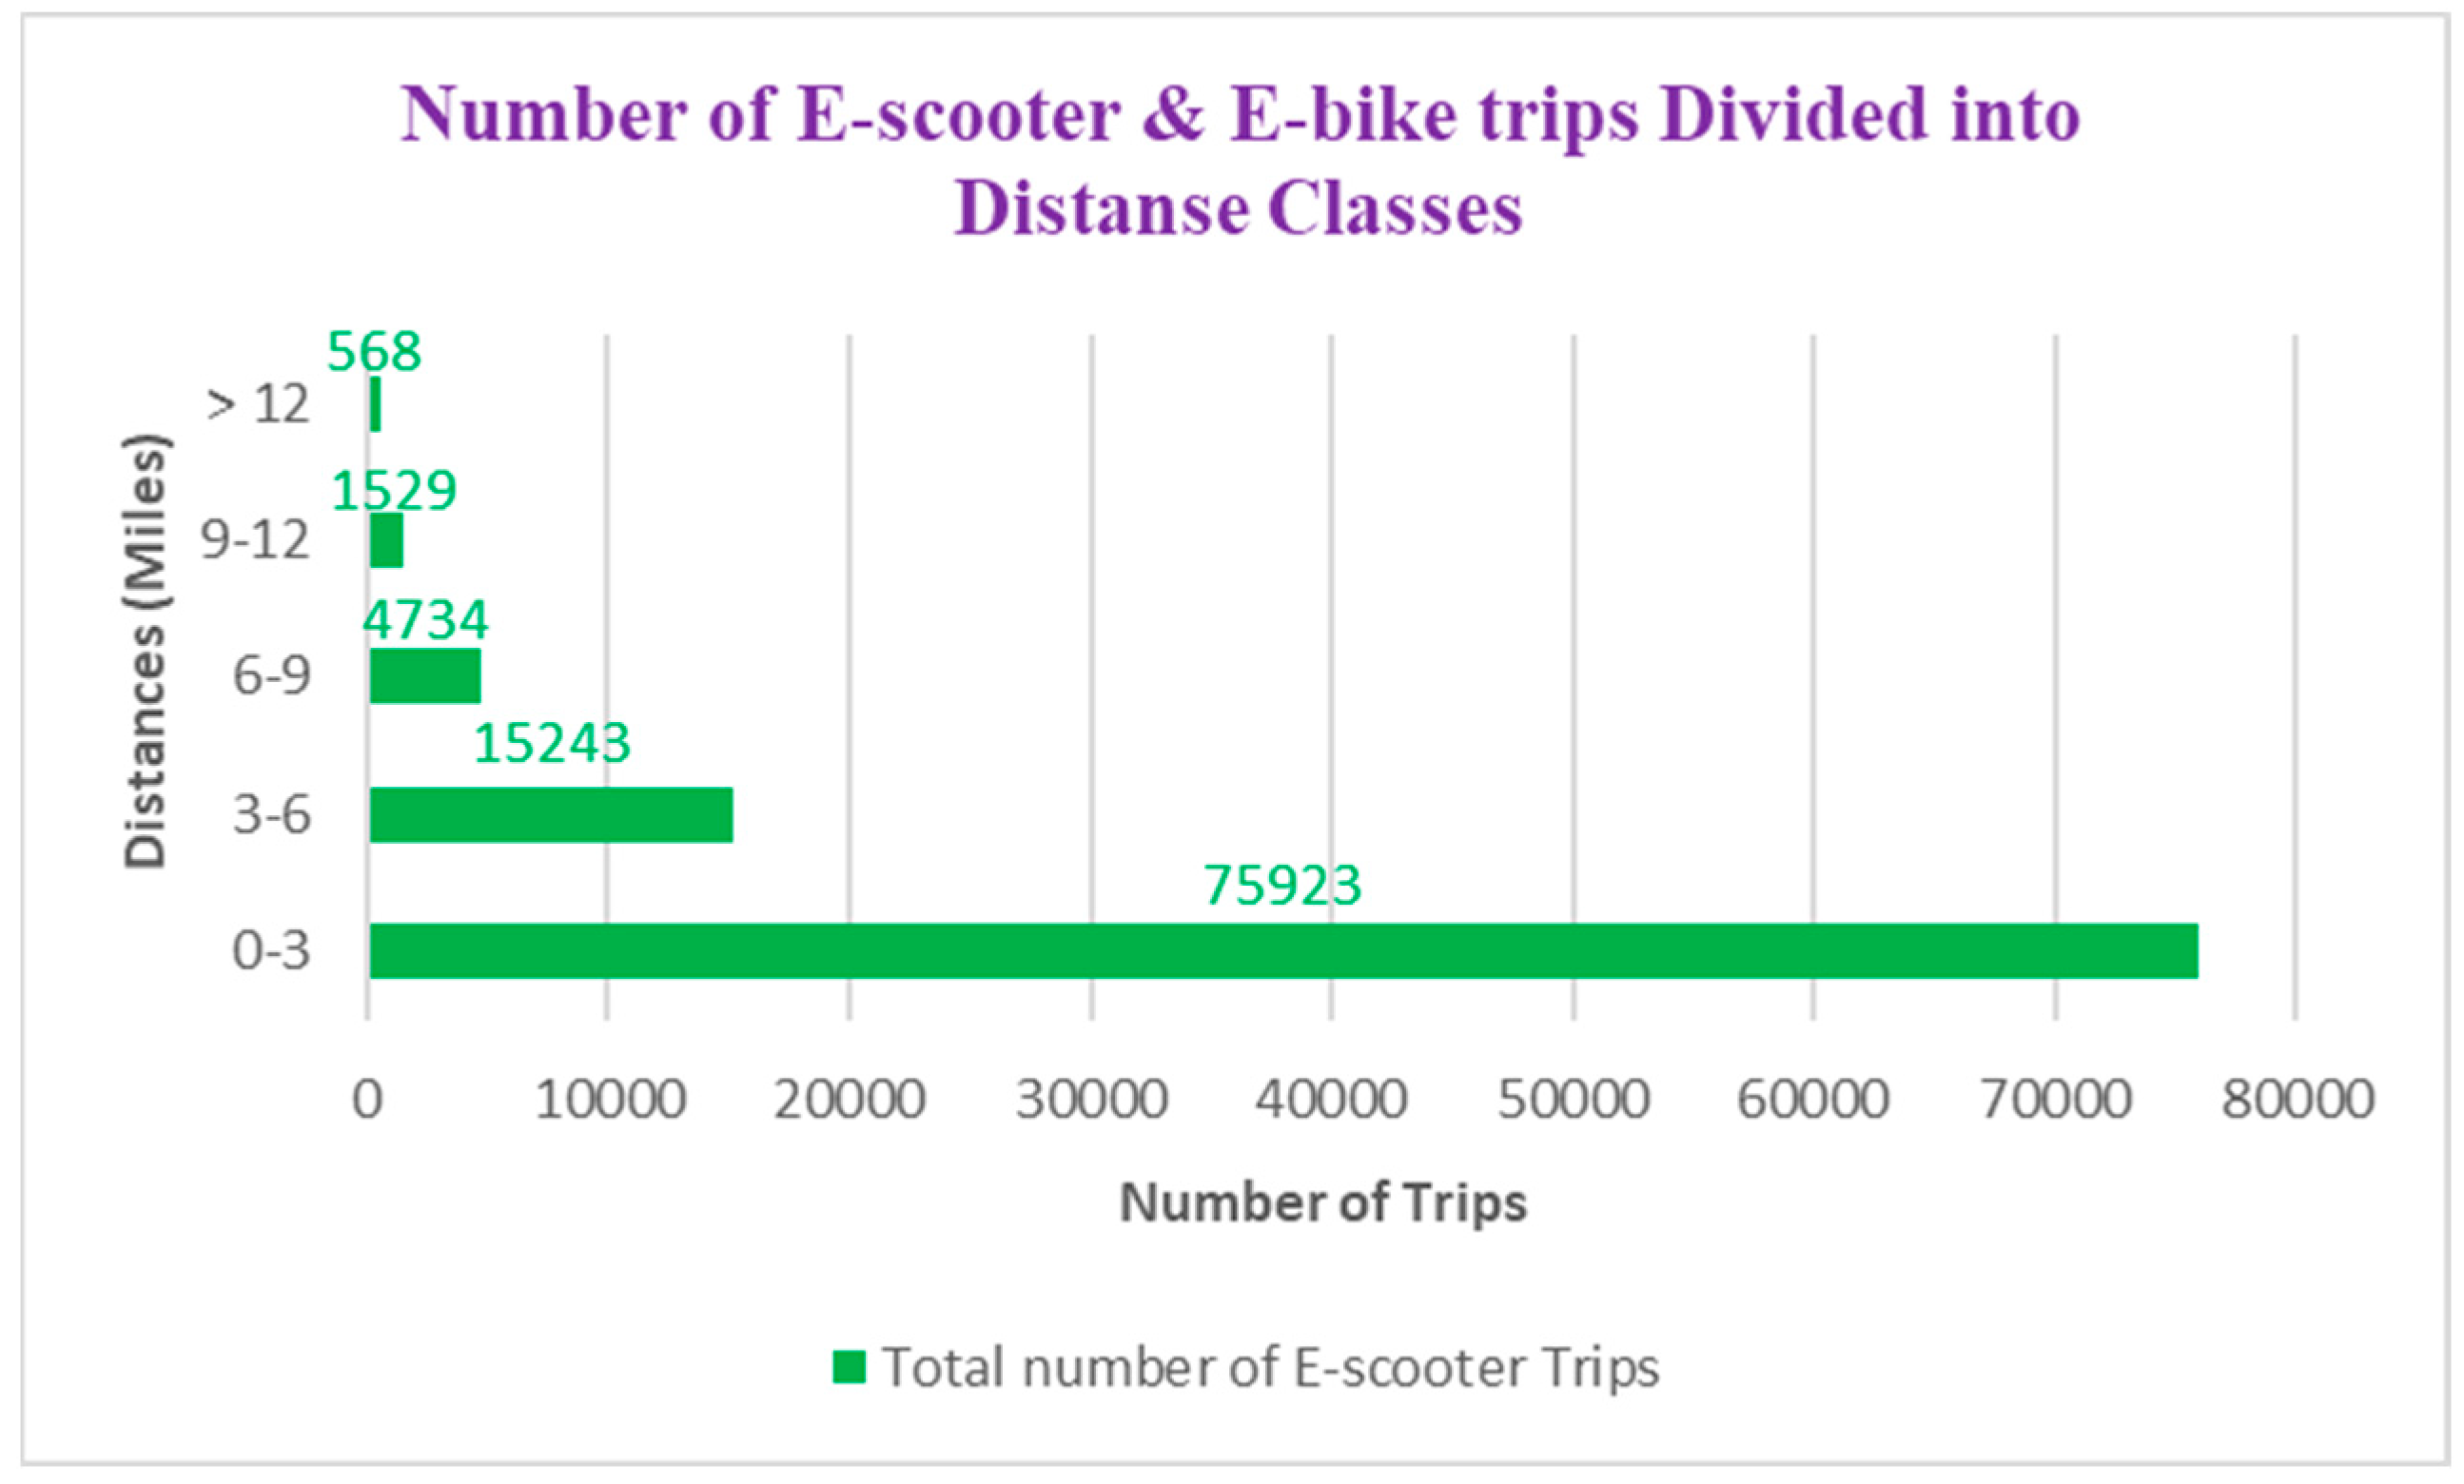
Figure 8.
Percentage of VEO E-scooter Trips Divided into Different Duration Classes (Minutes); Birmingham, AL Pilot Case Study.
Figure 8.
Percentage of VEO E-scooter Trips Divided into Different Duration Classes (Minutes); Birmingham, AL Pilot Case Study.
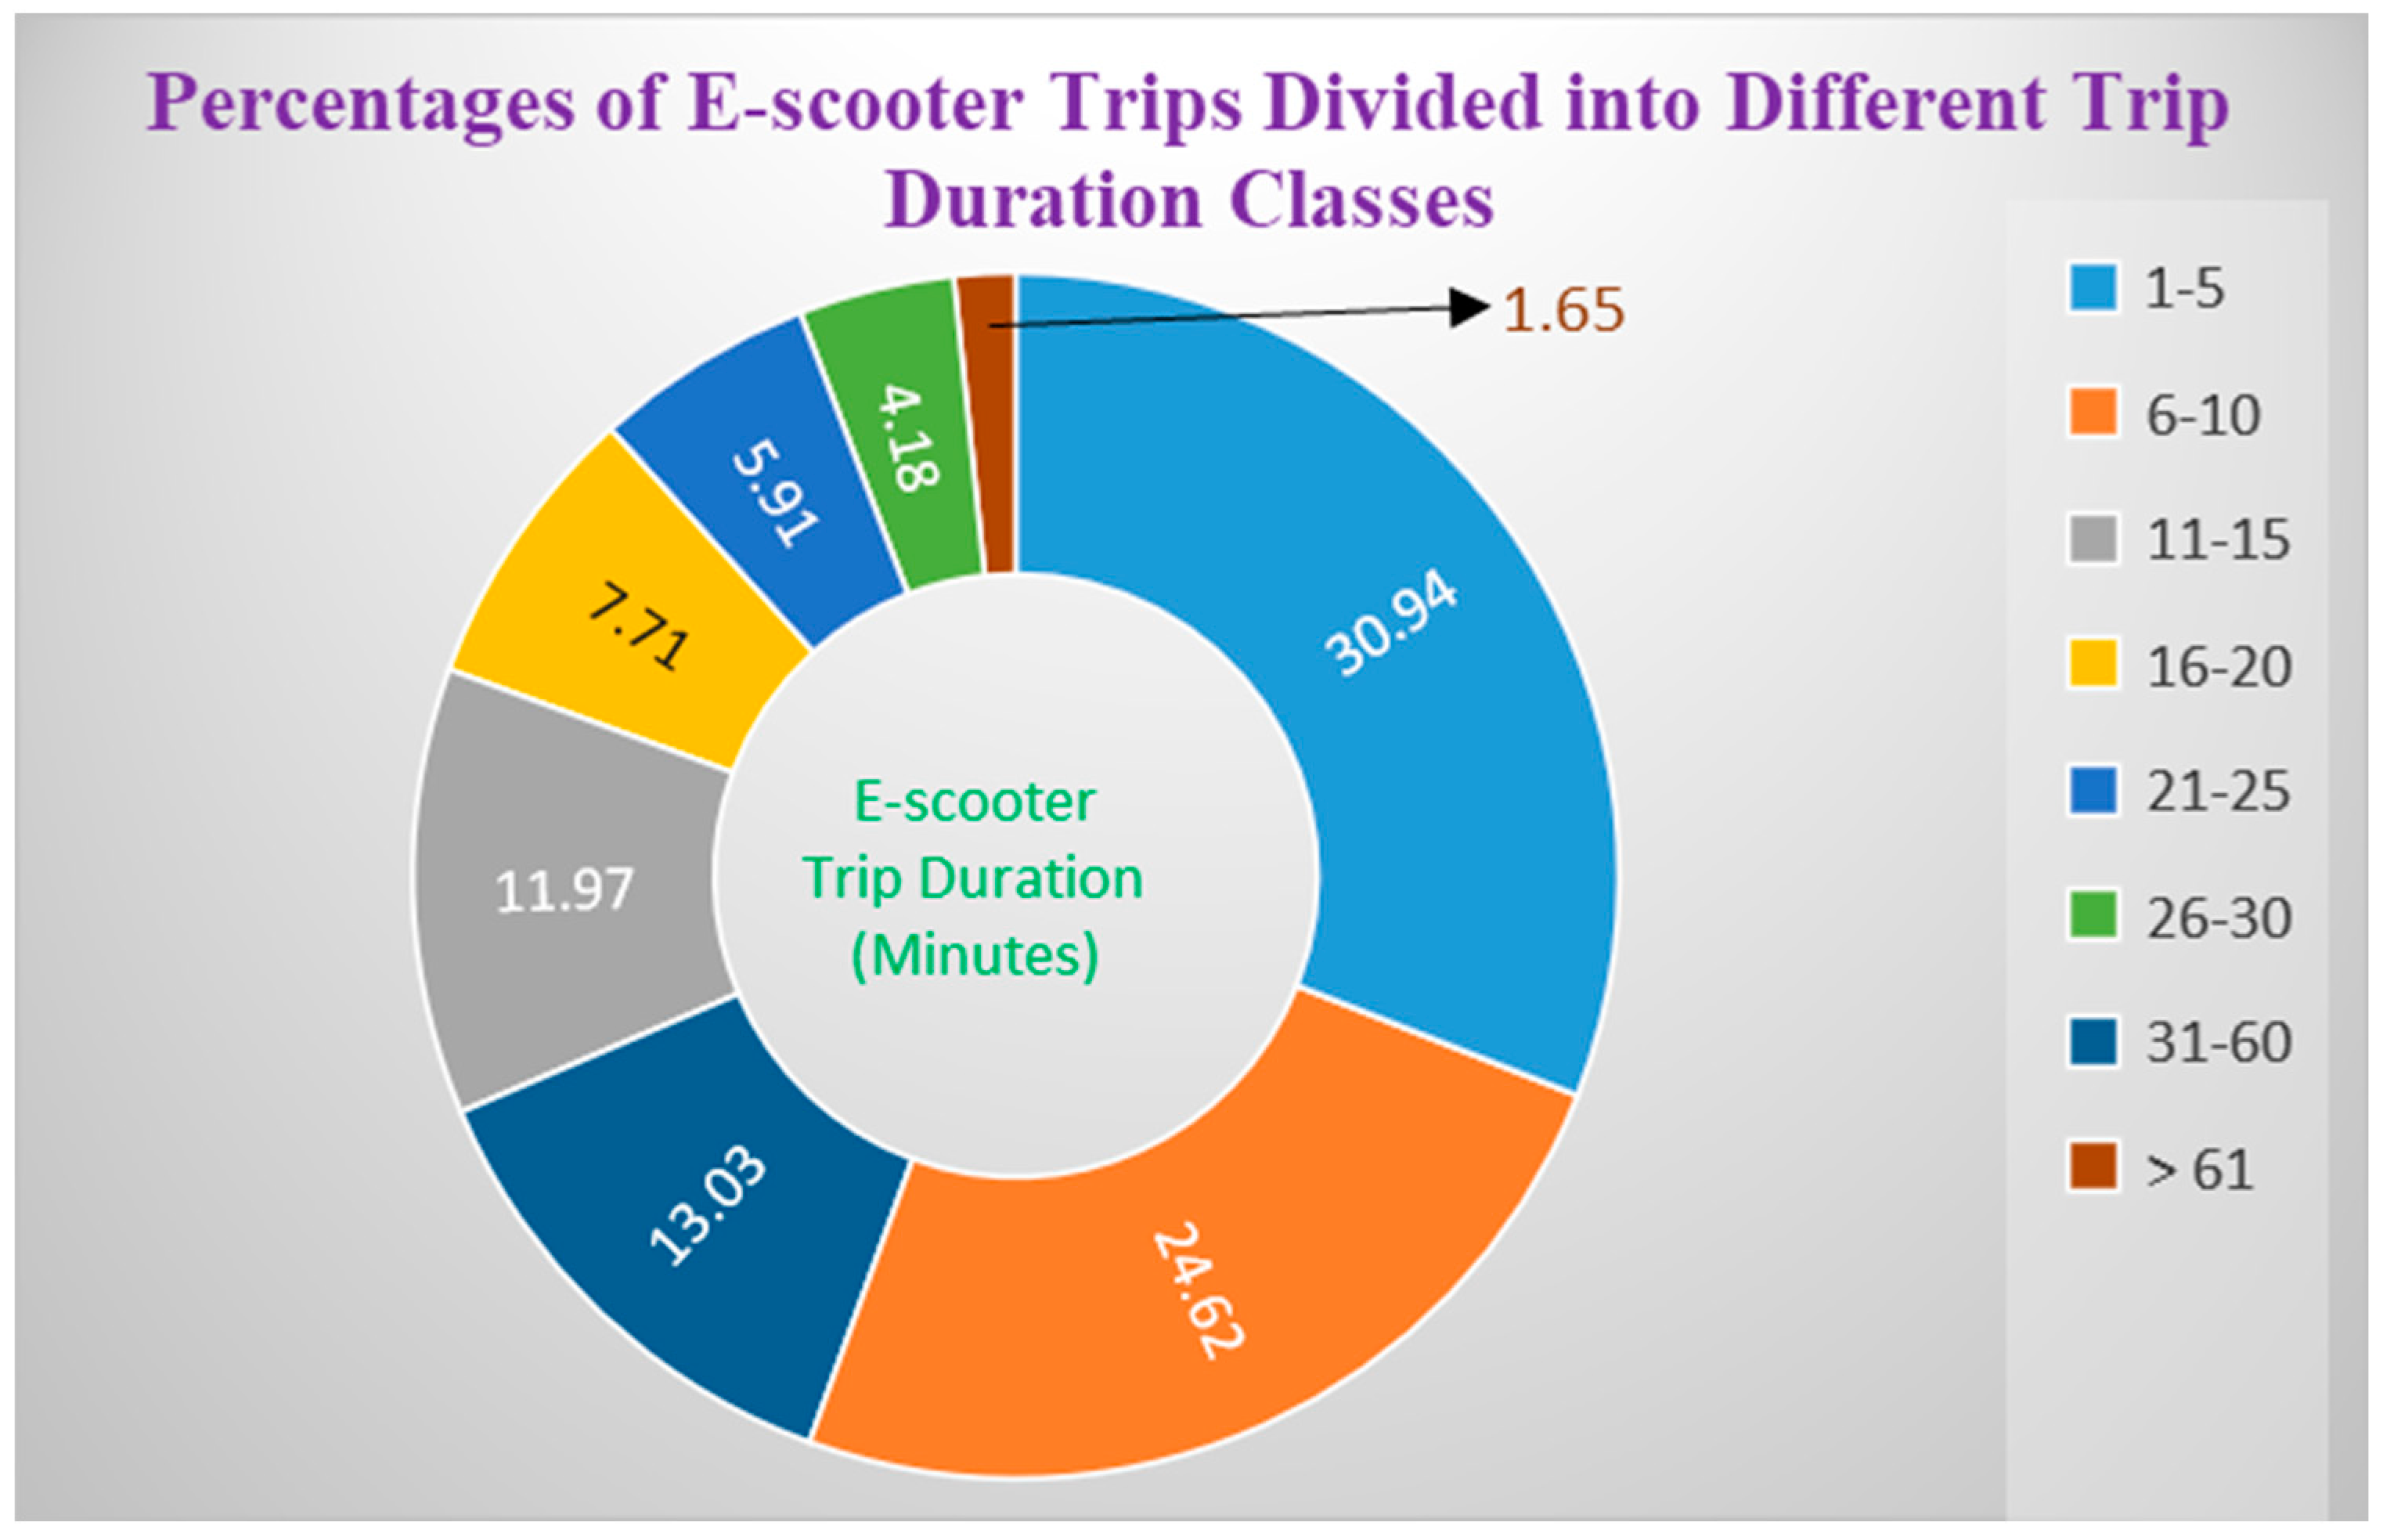
Figure 9.
Origin-Destination Connecting Lines of Shared VEO E-scooter Trips in Birmingham.
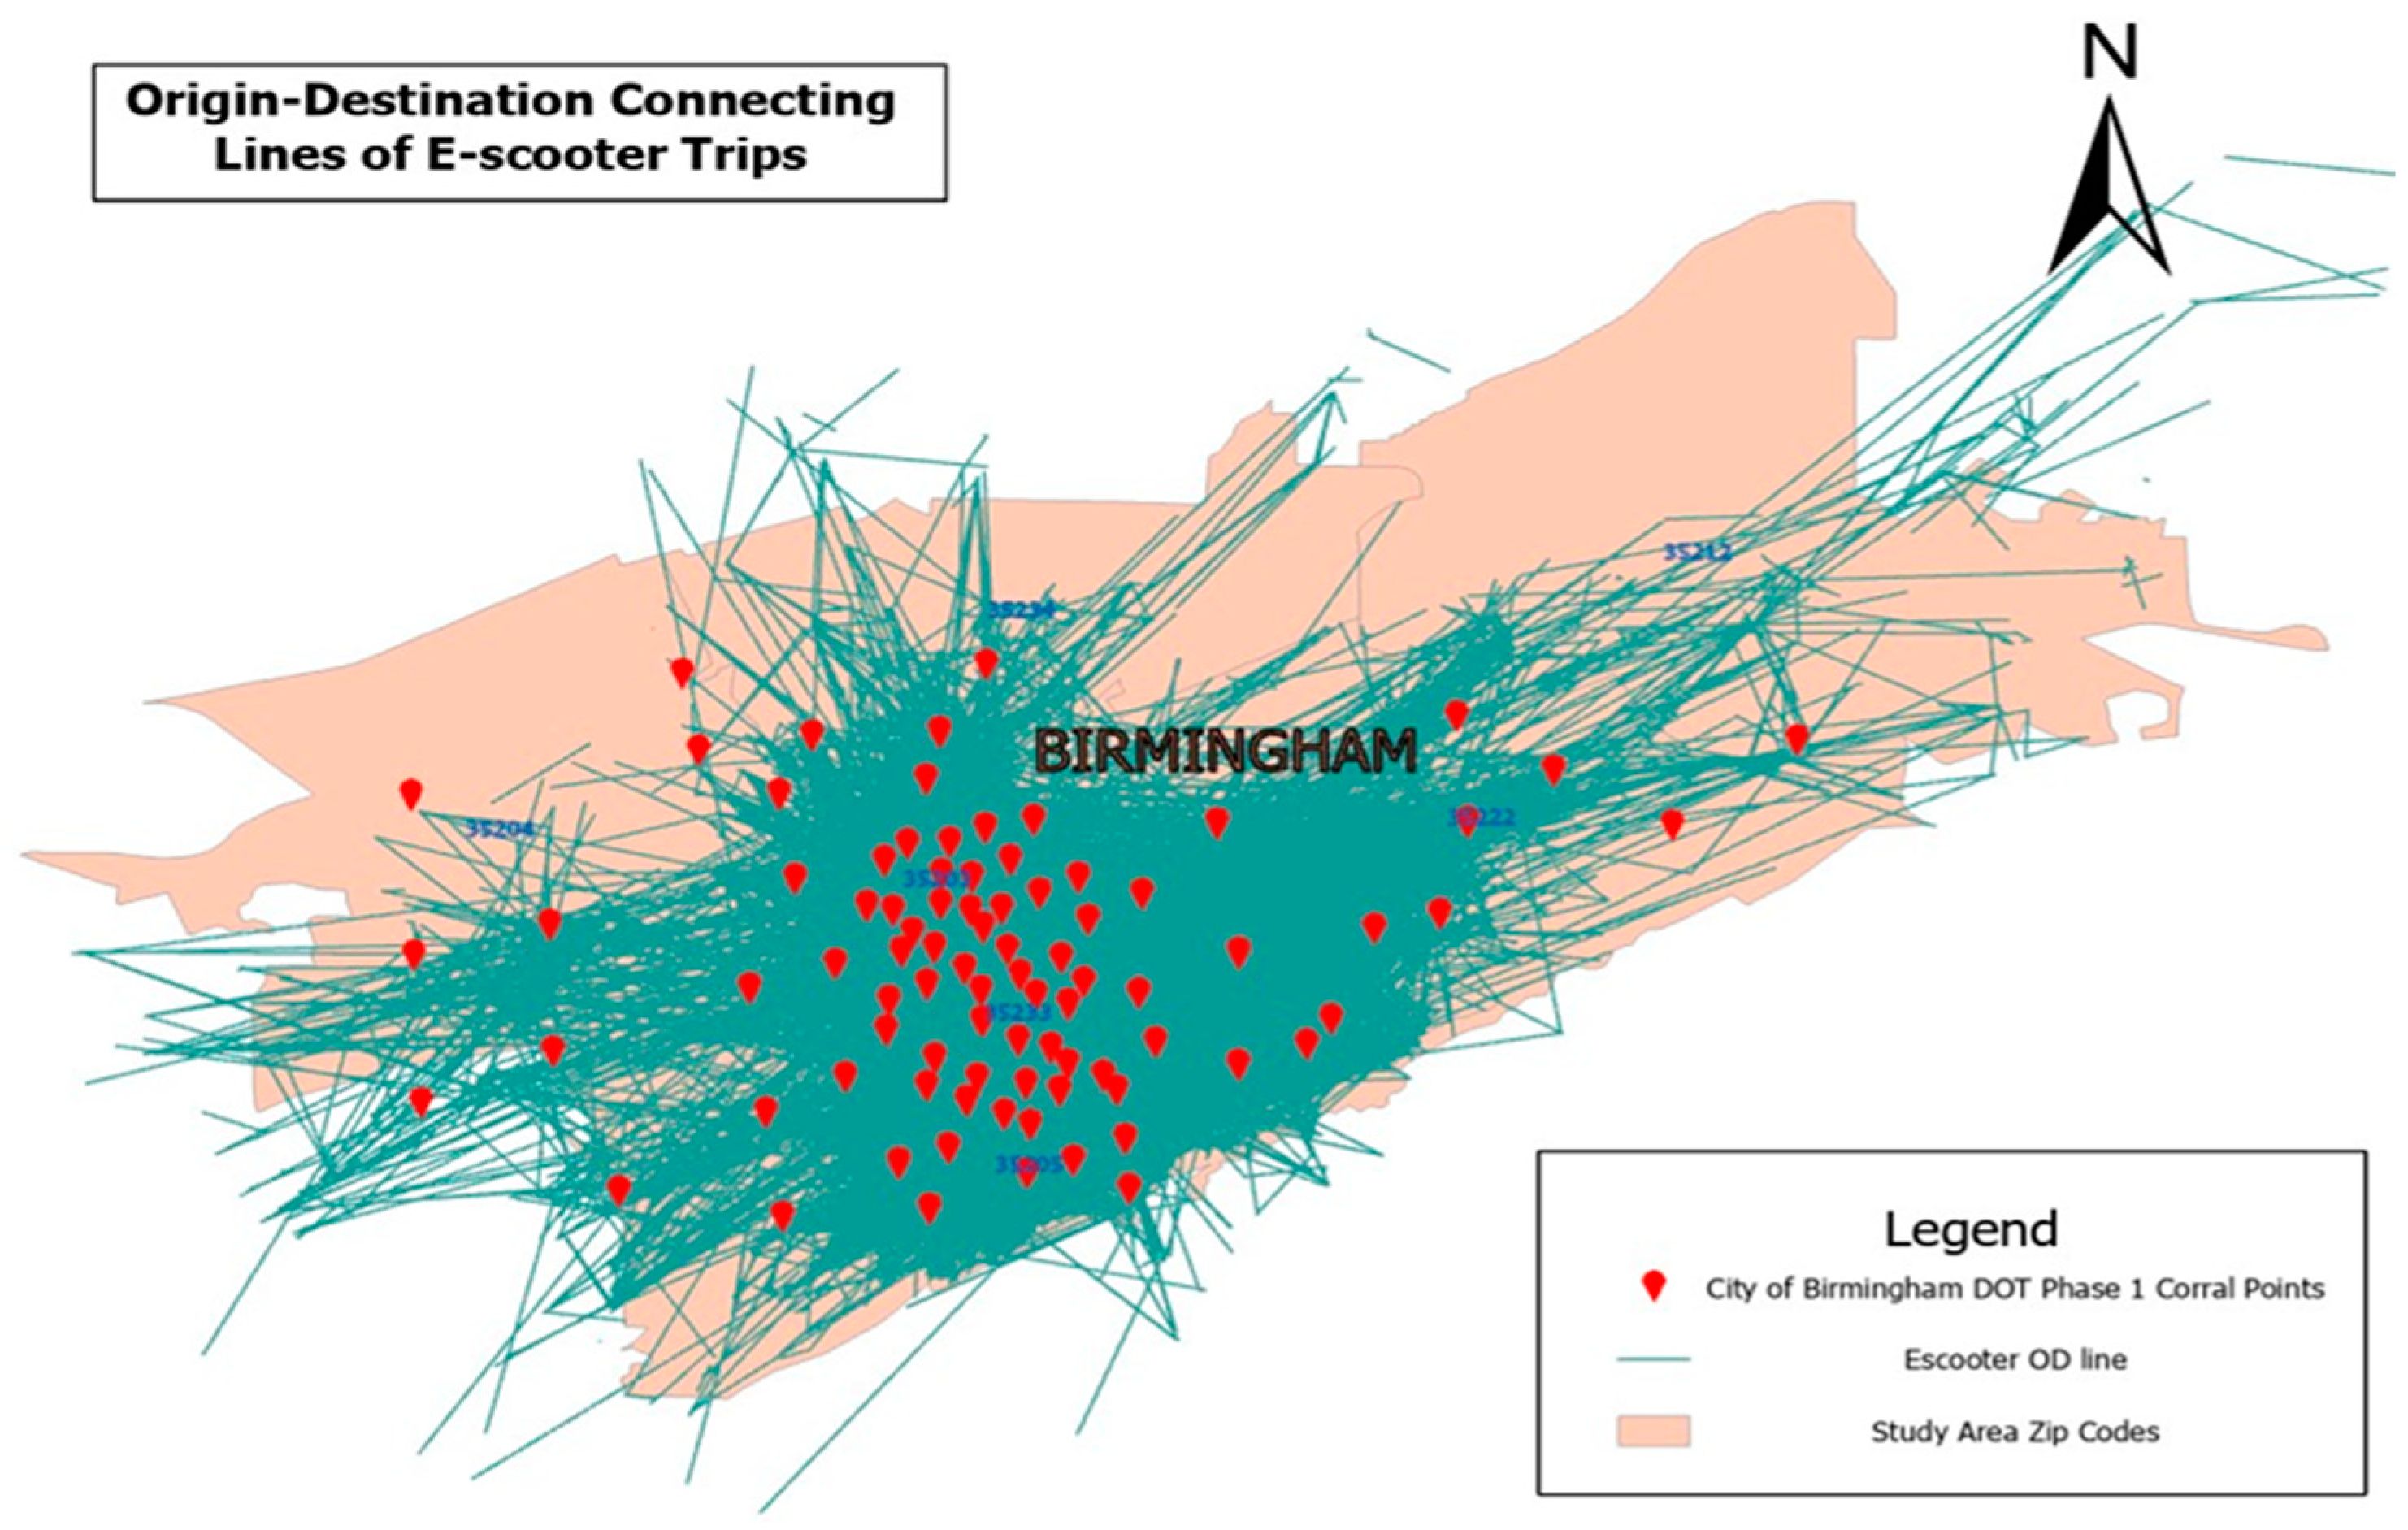
Figure 10.
Kernel Density Distribution of Shared VEO E-scooter Trips’ Origin Points by Zip Code.
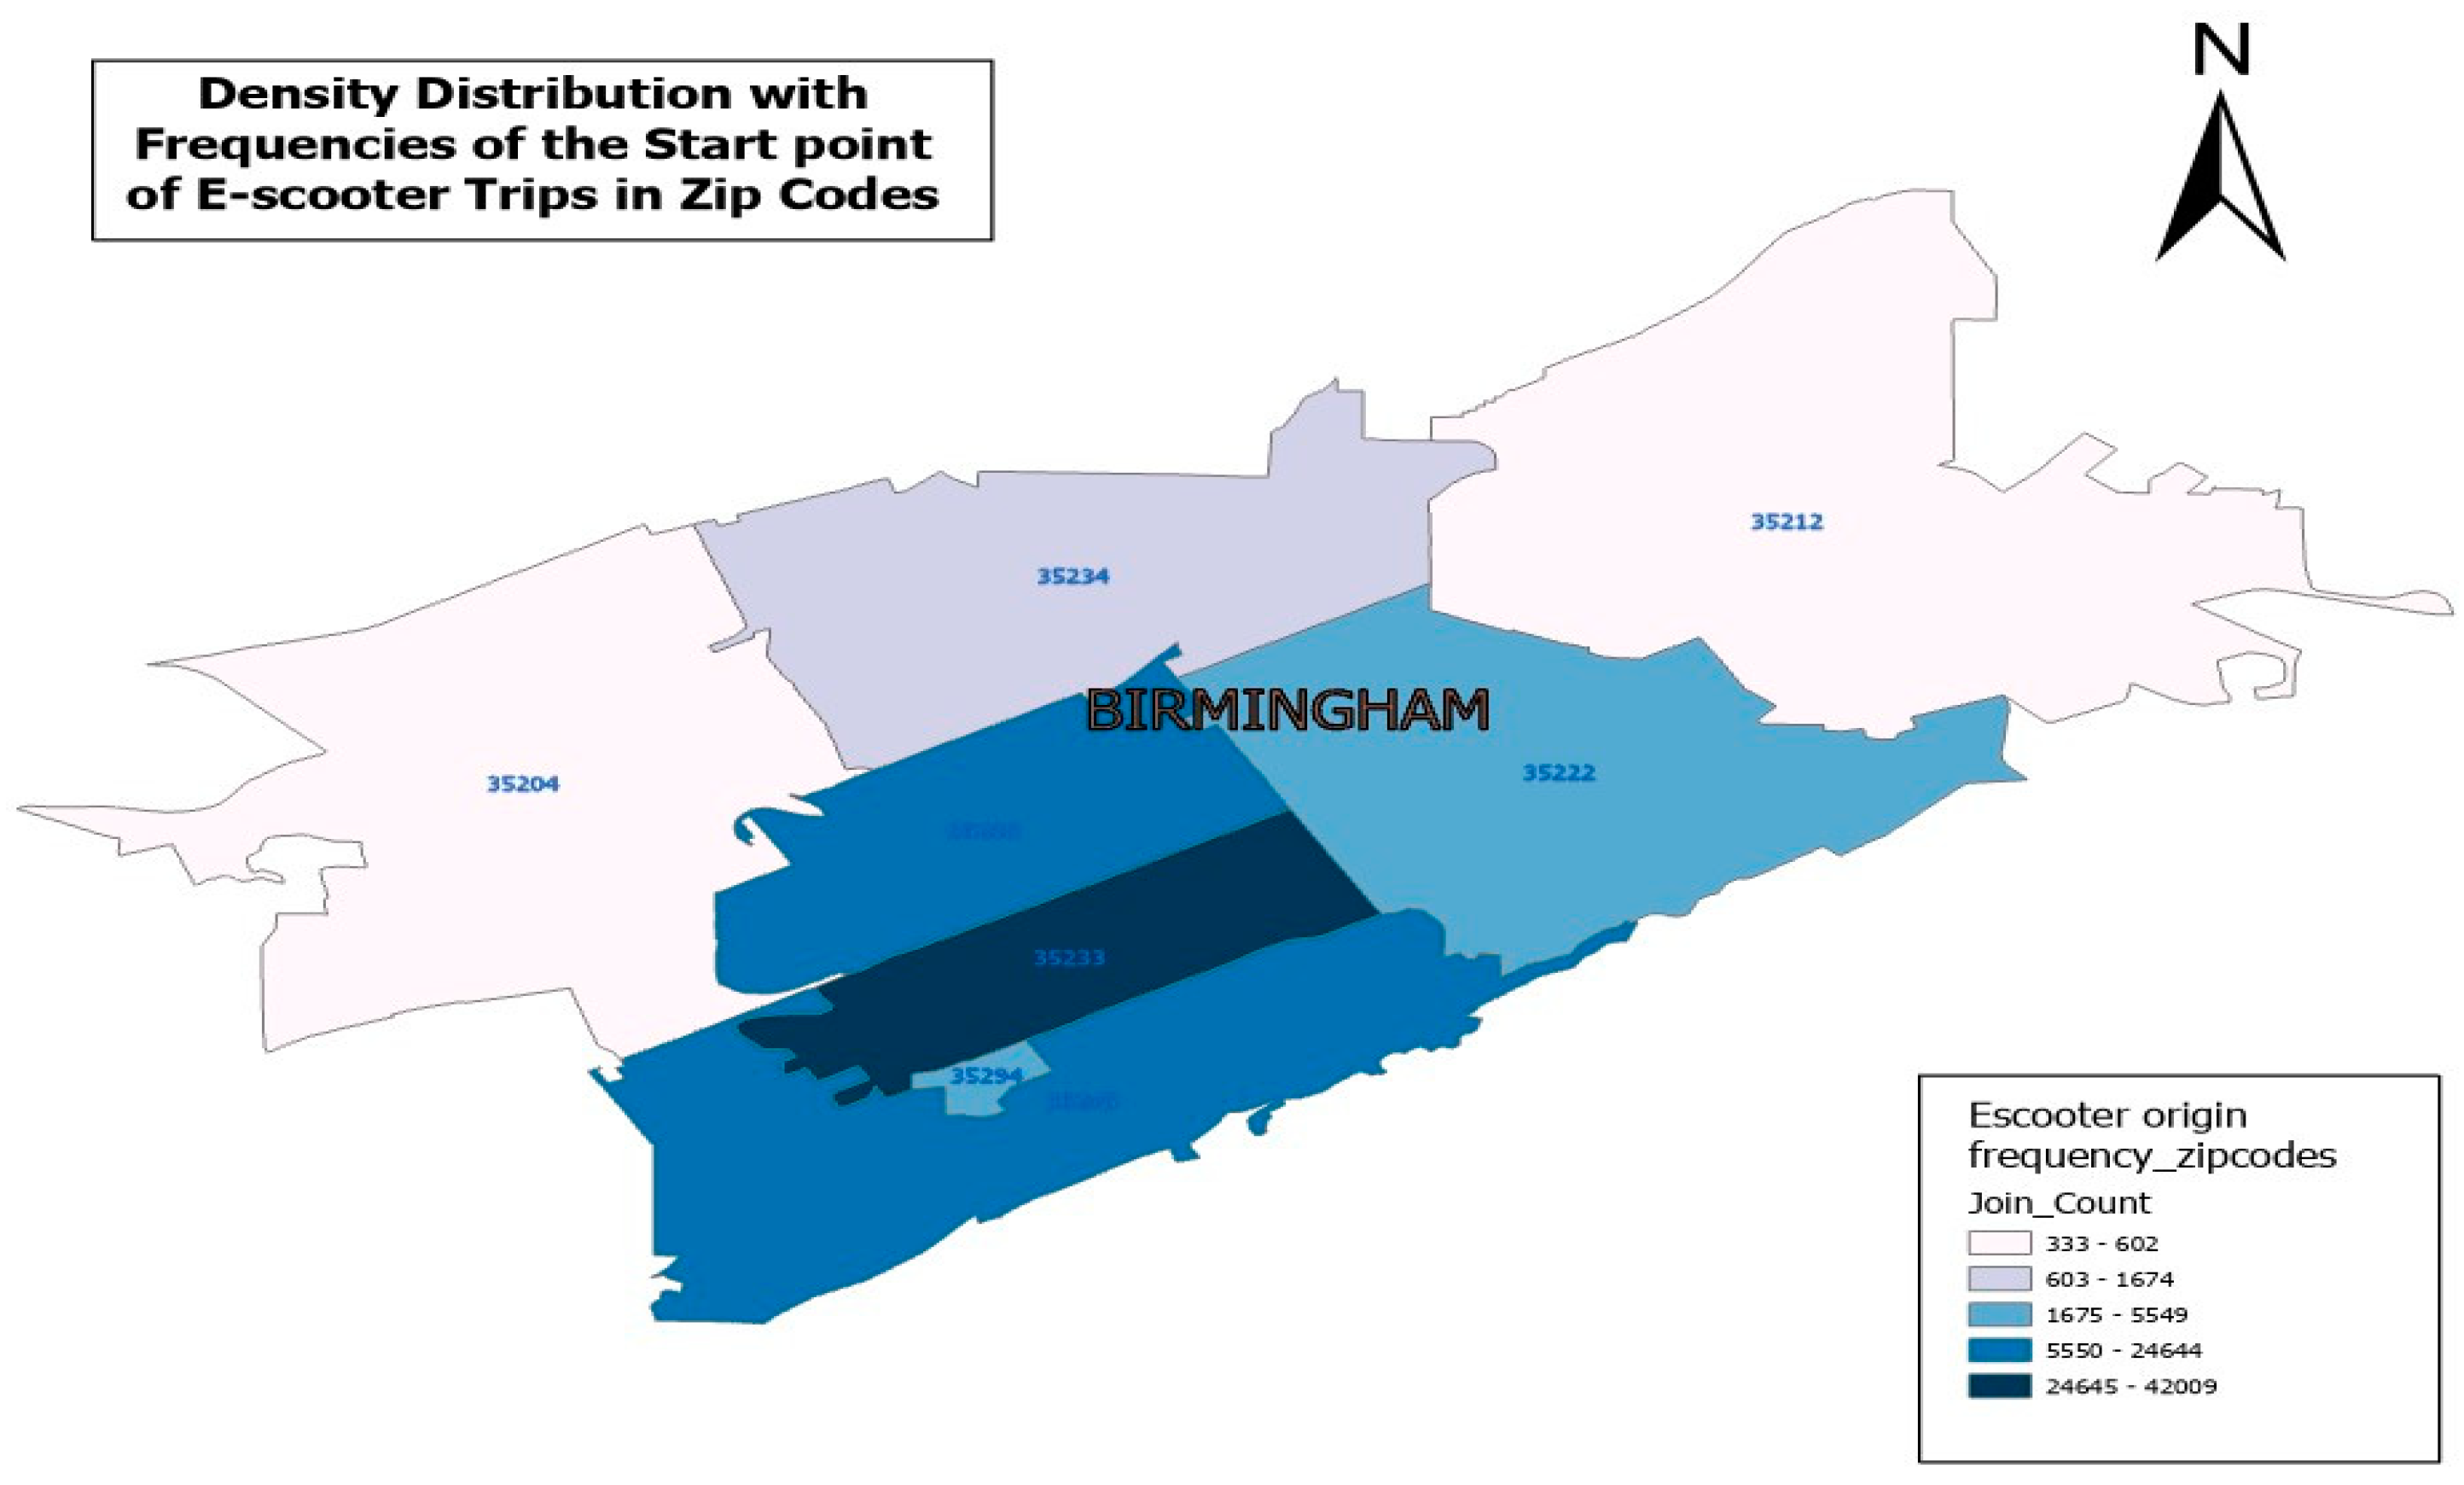
Figure 11.
Kernel Density Distribution of Shared VEO E-scooter Trips’ Destination Points by Zip Code.
Figure 11.
Kernel Density Distribution of Shared VEO E-scooter Trips’ Destination Points by Zip Code.

Figure 12.
Kernel Density Distribution of Shared VEO E-scooter Trips’ Origin Points by Block.
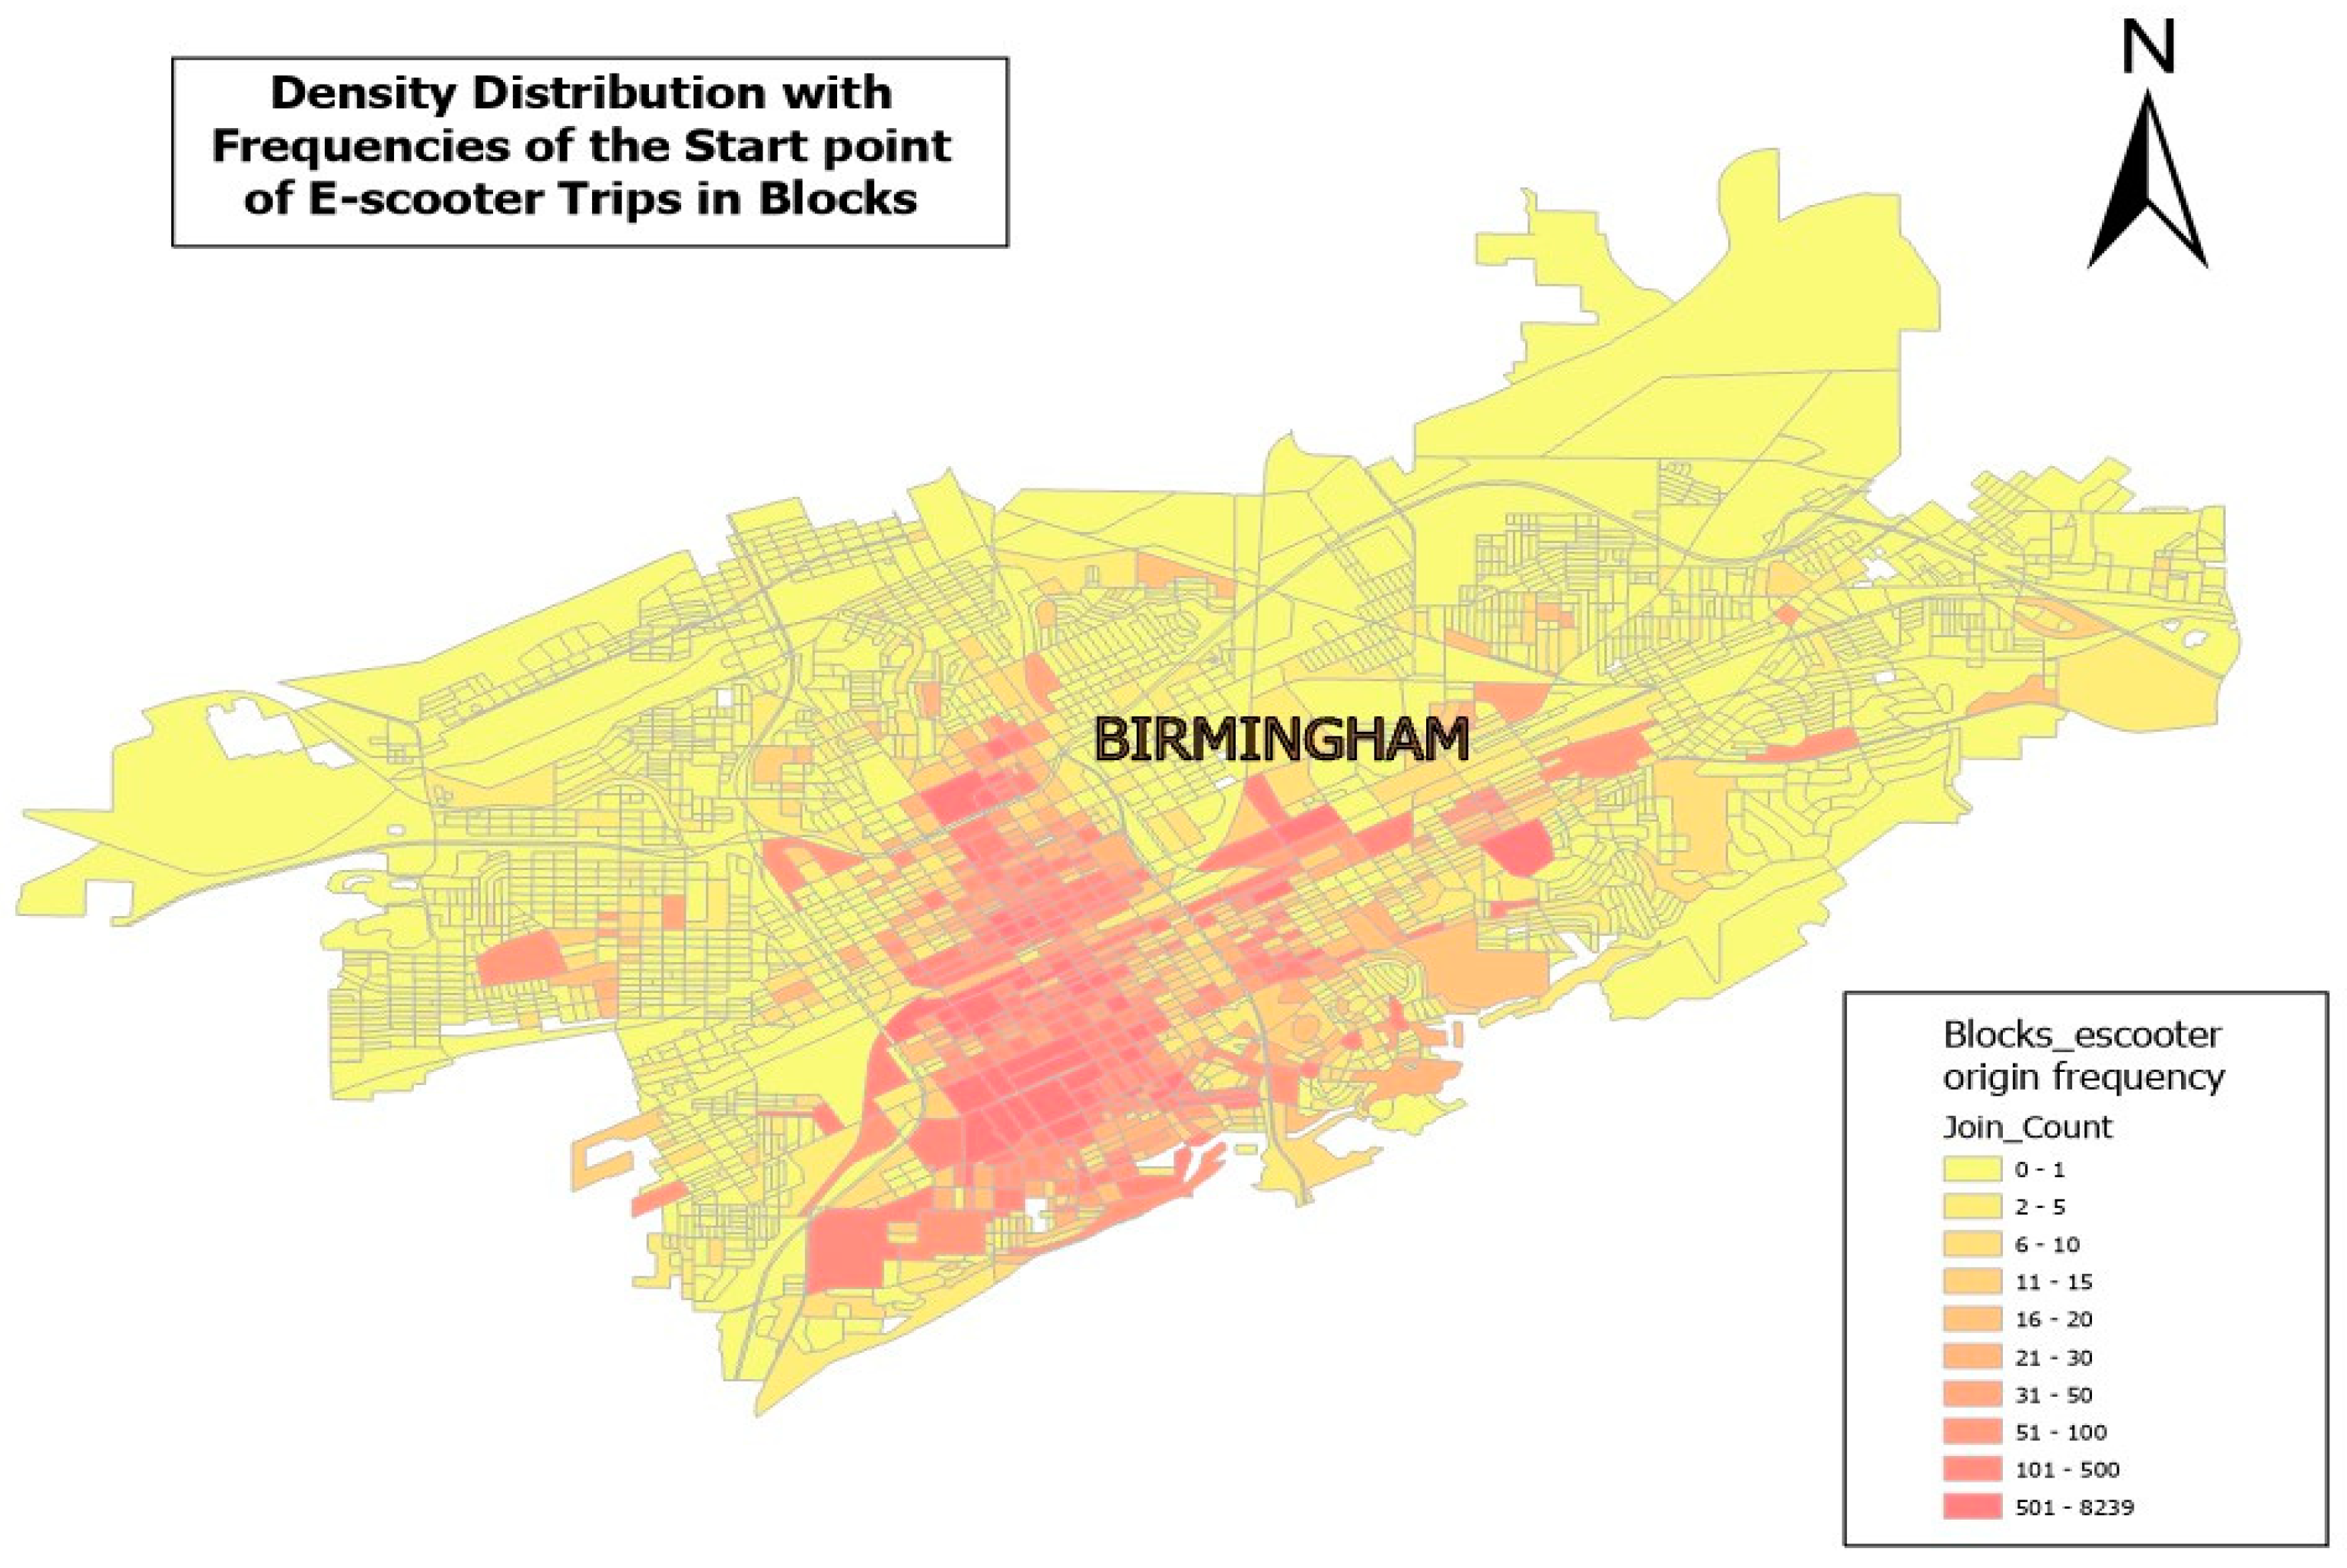
Figure 13.
Kernel Density Distribution of Shared VEO E-scooter Trips’ Destination Points by Block.

Figure 14.
Scatter Plot of Predicted vs Observed Values for Shared VEO E-scooter Negative Binomial Regression Model.
Figure 14.
Scatter Plot of Predicted vs Observed Values for Shared VEO E-scooter Negative Binomial Regression Model.
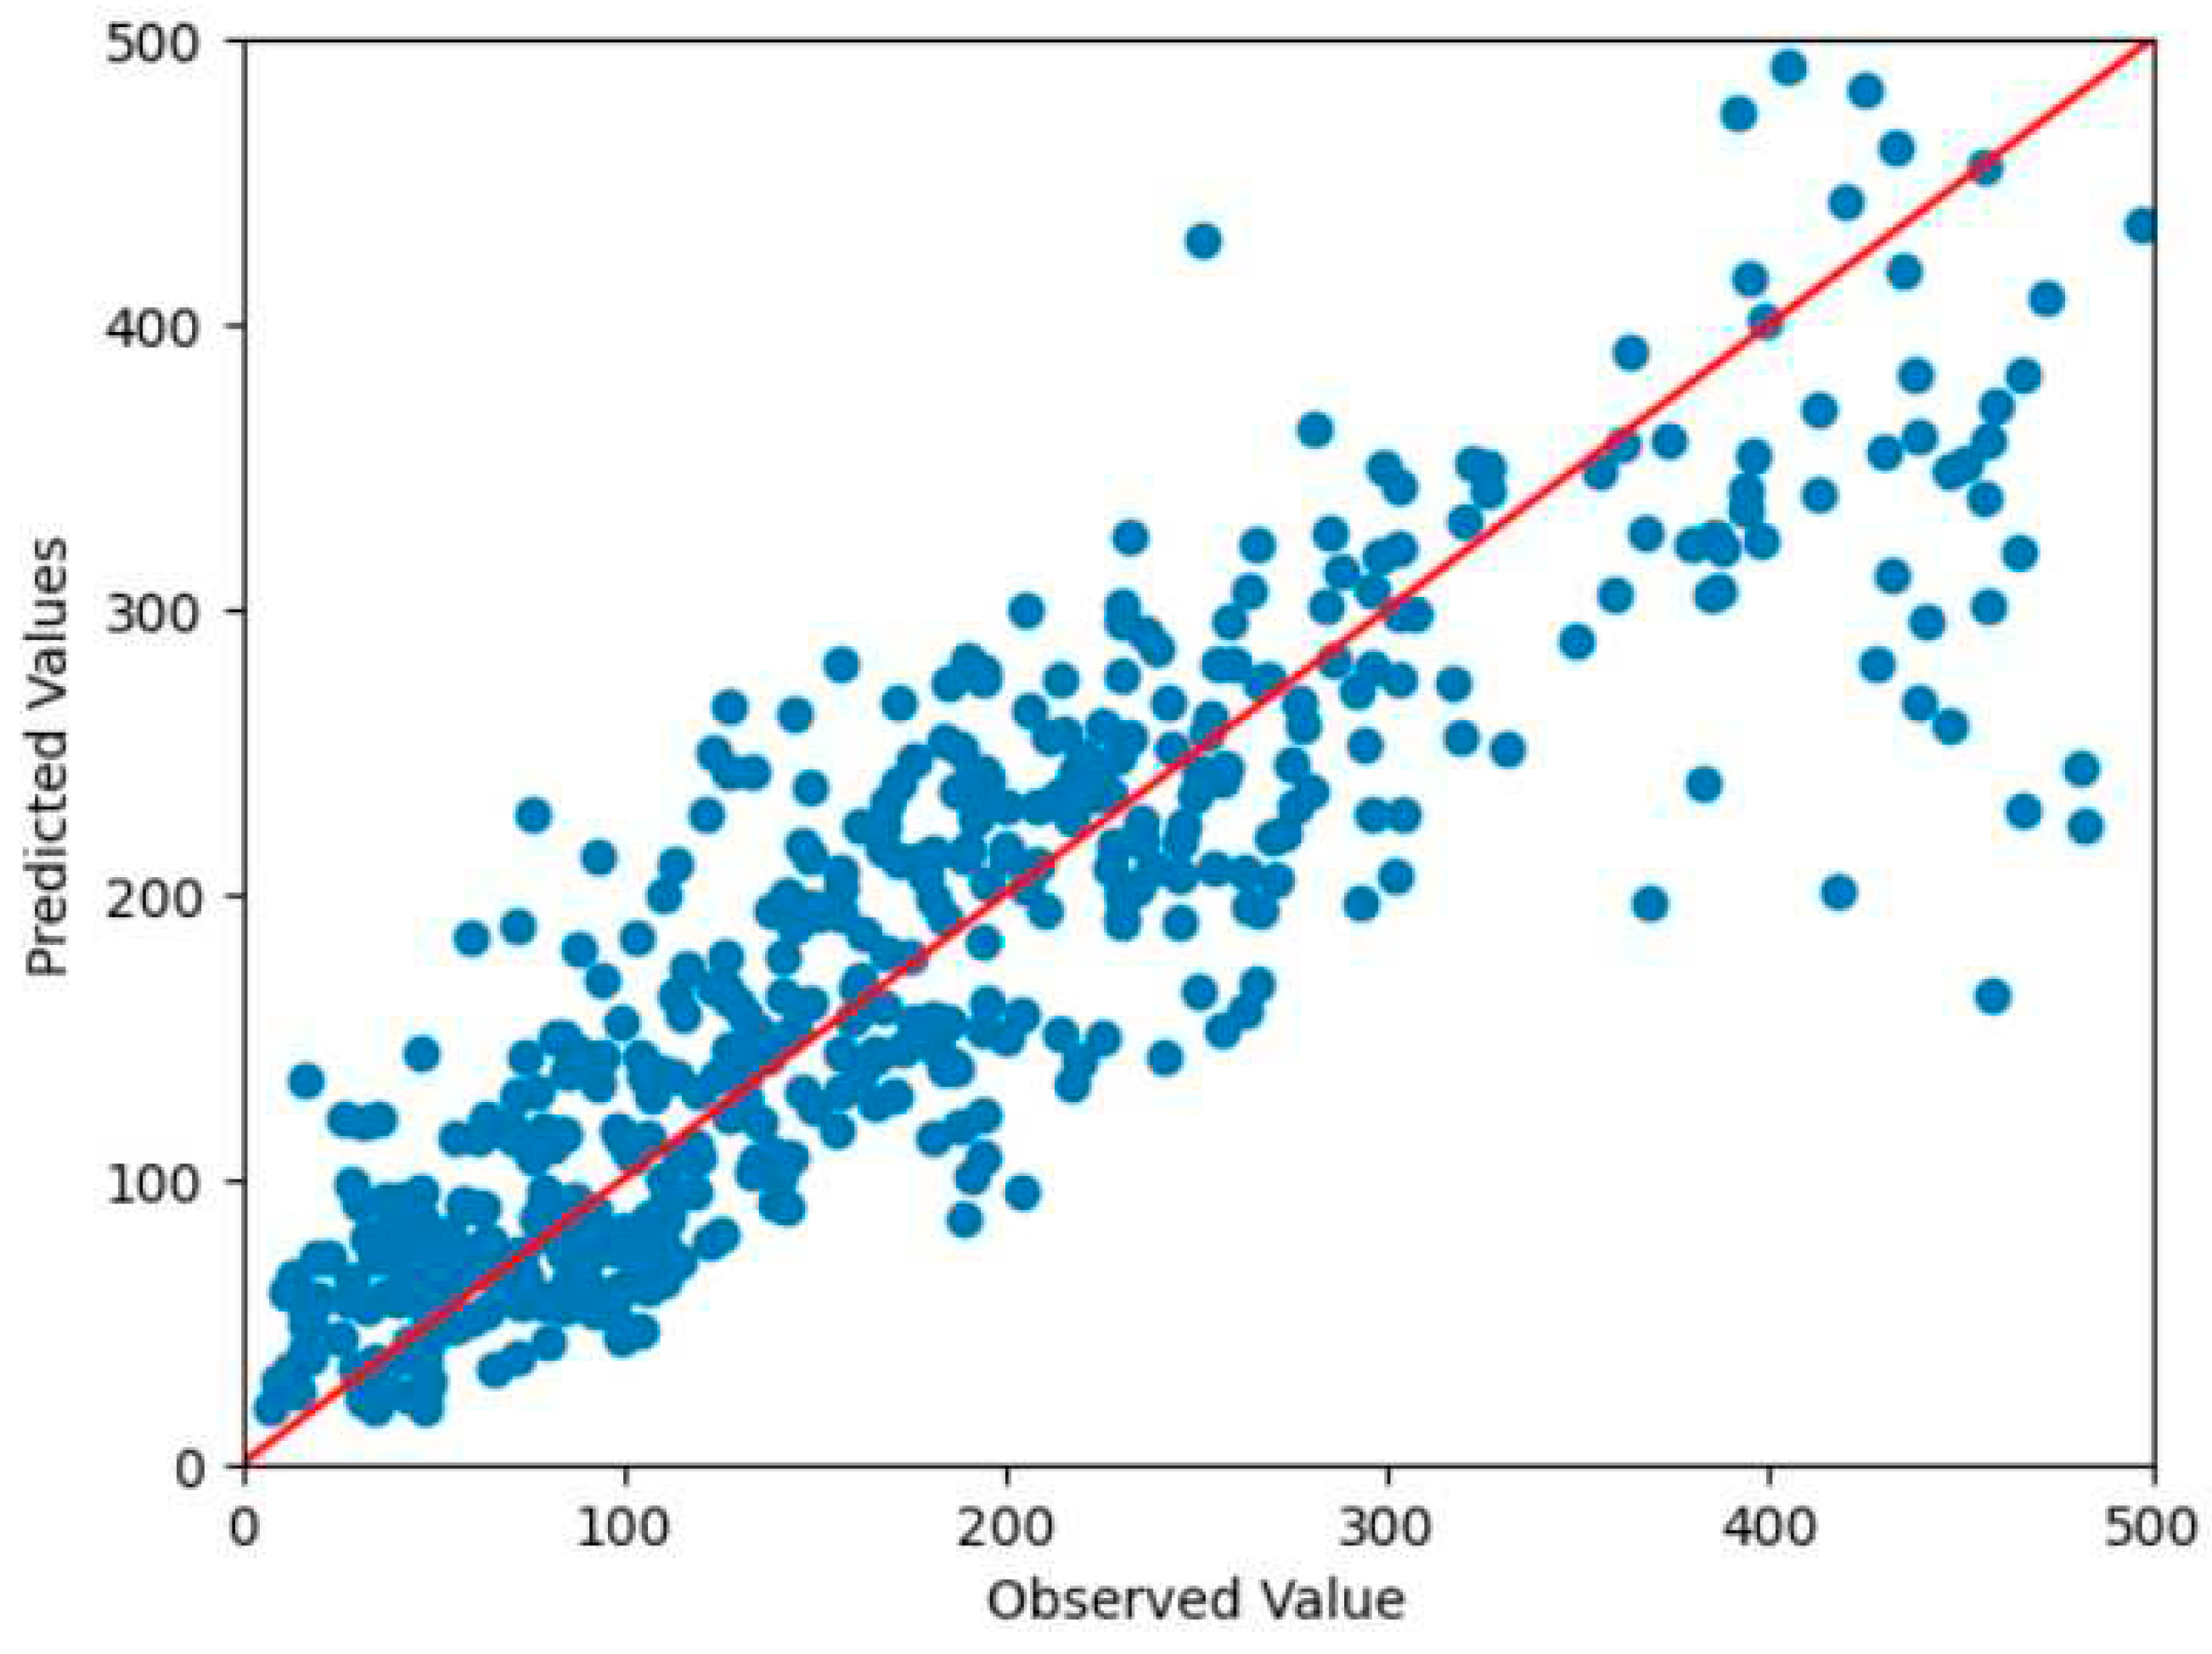
Table 2.
Summary of Trip Duration (min), Distances (miles), and Mean Speed (mph) of Shared E-scooters; Birmingham, AL Pilot Case Study.
Table 2.
Summary of Trip Duration (min), Distances (miles), and Mean Speed (mph) of Shared E-scooters; Birmingham, AL Pilot Case Study.
| Criteria | Shared E-scooters | Shared E-bikes |
|---|---|---|
| Minimum Duration (min) | 1.00 | 1.00 |
| Maximum Duration (min) | 100.00 | 100.00 |
| Average Duration (min) | 15.29 | 16.34 |
| Minimum Distance (mile) | 0.01 | 0.01 |
| Maximum Distance (mile) | 23.05 | 21.60 |
| Average Distance (mile) | 2.13 | 2.41 |
| Minimum Speed (mph) | 0.01 | 0.02 |
| Maximum Speed (mph) | 15.00 | 15.00 |
| Average Speed (mph) | 8.69 | 8.84 |
Table 3.
Descriptive Analysis of Utilization Rates of Available VEO E-scooter Vehicles.
| Descriptive Analysis | Average Time/Day/Vehicle (min) | Utilization Rate (Avg. Time/Day) (%) | Average Trips/Day/Device |
|---|---|---|---|
| Mean | 35.04 | 3.65 | 2.32 |
| Standard Error | 0.43 | 0.05 | 0.04 |
| Median | 34.87 | 3.63 | 2.27 |
| Mode | 43.00 | 4.48 | 2.00 |
| Standard Deviation | 12.41 | 1.29 | 1.26 |
| Sample Variance | 154.01 | 1.67 | 1.59 |
| Kurtosis | 13.29 | 13.29 | 525.44 |
| Skewness | 1.81 | 1.81 | 20.79 |
| Range | 146.00 | 15.21 | 33.52 |
| Minimum | 1.00 | 0.10 | 1.00 |
| Maximum | 147.00 | 15.31 | 34.52 |
| Sum | 28664.36 | 2985.80 | 1899.54 |
| Count | 818.00 | 818.00 | 818.00 |
| Confidence Level (95.0%) | 0.85 | 0.09 | 0.09 |
Table 4.
Summary of the Spatial Density Distribution Analysis.
| Mode/Origin or Destination | Maximum Frequency and Location | Minimum Frequency and Location | Mean Frequency | ||||
|---|---|---|---|---|---|---|---|
| Frequency (trips/year) | Location Type | Location Reference | Frequency (trips/year) | Location Type | Location Reference | (trips/year) | |
| E-scooter/Origin | 42009 | Zip Code | 35233 | 333 | Zip Code | 35212 | 12205.5 |
| E-scooter/Destination | 41356 | Zip Code | 35233 | 352 | Zip Code | 35212 | 12191.5 |
| E-scooter/Origin | 8239 | Block | 3001 | 0 | Block | Multiple | 32.62 |
| E-scooter/Destination | 7262 | Block | 3001 | 0 | Block | Multiple | 32.58 |
Table 5.
Blocks with the Highest Number of E-scooter Origin and Destination Trips.
| Mode Origin/Destination | Block No | Total Trips | Zip Code | Demographic Description of the Blocks (Source: livingatlas.arcgis.com) [34] |
|---|---|---|---|---|
| E-scooter Origin | BLOCK 3001 | 8239 | 35233 | Total population here: 7 |
| When aggregating this block with the 10 adjacent blocks: | ||||
| Population 18 years and over: 799 | ||||
| Percent 18 years and over: 98.4% | ||||
| Population by race/ethnicity: | ||||
| Hispanic or Latino: 5.4% | ||||
| White alone, not Hispanic or Latino: 53.8% | ||||
| Black or African American alone, not Hispanic or Latino: 29.2% | ||||
| American Indian / Alaska Native alone, not Hispanic or Latino: 0.6% | ||||
| Asian alone, not Hispanic or Latino: 7.9% | ||||
| Native Hawaiian and Other Pacific Islander Alone, not Hispanic or Latino: 0% | ||||
| Some Other Race, not Hispanic or Latino: 0.4% | ||||
| Two or More Races, not Hispanic or Latino: 2.7% | ||||
| Total housing units: 666 | ||||
| Occupancy rate: 84.2% | ||||
| BLOCK 1002 | 4278 | 35205 | Total population here: 1,210 | |
| When aggregating this block with the 10 adjacent blocks: | ||||
| Population 18 years and over: 3,068 | ||||
| Percent 18 years and over: 99% | ||||
| Population by race/ethnicity: | ||||
| Hispanic or Latino: 4.7% | ||||
| White alone, not Hispanic or Latino: 49.5% | ||||
| Black or African American alone, not Hispanic or Latino: 28.9% | ||||
| American Indian / Alaska Native alone, not Hispanic or Latino: 0.4% | ||||
| Asian alone, not Hispanic or Latino: 13.7% | ||||
| Native Hawaiian and Other Pacific Islander Alone, not Hispanic or Latino: 0.1% | ||||
| Some Other Race, not Hispanic or Latino: 0.2% | ||||
| Two or More Races, not Hispanic or Latino: 2.5% | ||||
| Total housing units: 232 | ||||
| Occupancy rate: 46.6% | ||||
| BLOCK 3040 | 3675 | 35233 | --- | |
| BLOCK 1018 | 3406 | 35205 | Total population here: 928 | |
| When aggregating this block with the 10 adjacent blocks: | ||||
| Population 18 years and over: 2,925 | ||||
| Percent 18 years and over: 99.3% | ||||
| Population by race/ethnicity: | ||||
| Hispanic or Latino: 4.6% | ||||
| White alone, not Hispanic or Latino: 49.6% | ||||
| Black or African American alone, not Hispanic or Latino: 29.6% | ||||
| American Indian / Alaska Native alone, not Hispanic or Latino: 0.4% | ||||
| Asian alone, not Hispanic or Latino: 13.6% | ||||
| Native Hawaiian and Other Pacific Islander Alone, not Hispanic or Latino: 0.1% | ||||
| Some Other Race, not Hispanic or Latino: 0.2% | ||||
| Two or More Races, not Hispanic or Latino: 2% | ||||
| Total housing units: 171 | ||||
| Occupancy rate: 63.2% | ||||
| BLOCK 4095 | 3233 | 35205 | Total population here: 8 | |
| When aggregating this block with the 10 adjacent blocks: | ||||
| Population 18 years and over: 143 | ||||
| Percent 18 years and over: 95.3% | ||||
| Population by race/ethnicity: | ||||
| Hispanic or Latino: 0% | ||||
| White alone, not Hispanic or Latino: 56.7% | ||||
| Black or African American alone, not Hispanic or Latino: 20.7% | ||||
| American Indian / Alaska Native alone, not Hispanic or Latino: 0% | ||||
| Asian alone, not Hispanic or Latino: 17.3% | ||||
| Native Hawaiian and Other Pacific Islander Alone, not Hispanic or Latino: 0% | ||||
| Some Other Race, not Hispanic or Latino: 1.3% | ||||
| Two or More Races, not Hispanic or Latino: 4% | ||||
| Total housing units: 384 | ||||
| Occupancy rate: 25.5% | ||||
| E-scooter Destination | BLOCK 3001 | 7262 | 35233 | --- |
| BLOCK 1002 | 4080 | 35205 | --- | |
| BLOCK 3040 | 3220 | 35233 | --- | |
| BLOCK 4095 | 3100 | 35205 | --- | |
| BLOCK 1018 | 2630 | 35205 | --- |
Table 6.
A Summary of the NB Model for Shared E-Scooters.
| Negative Binomial Model Regression Results | |||||
| Independent Variables | Coefficient | Standard Error | z | p>|z| | |
| Time of day interval | t(6-9) | 0.3096 | 0.014 | 22.646 | 0.000 |
| t(9-12) | 1.1072 | 0.009 | 119.556 | <0.001 | |
| t(12-15) | 1.5695 | 0.008 | 203.629 | <0.001 | |
| t(15-18) | 1.5526 | 0.009 | 179.499 | <0.001 | |
| t(18-21) | 1.4982 | 0.013 | 117.768 | <0.001 | |
| t(21-24) | 0.8626 | 0.018 | 47.769 | <0.001 | |
| Day of the week | Monday | 0.8493 | 0.01 | 83.999 | <0.001 |
| Tuesday | 0.9888 | 0.01 | 101.479 | <0.001 | |
| Wednesday | 0.9126 | 0.01 | 91.971 | <0.001 | |
| Thursday | 1.097 | 0.009 | 120.091 | <0.001 | |
| Friday | 1.1377 | 0.009 | 120.021 | <0.001 | |
| Saturday | 1.0199 | 0.014 | 74.452 | <0.001 | |
| Sunday | 0.8945 | 0.014 | 62.449 | <0.001 | |
| Month | January | 0.2432 | 0.017 | 14.421 | 0.000 |
| February | 0.3812 | 0.016 | 23.742 | 0.000 | |
| March | 0.5328 | 0.01 | 51.074 | <0.001 | |
| April | 0.594 | 0.011 | 56.205 | <0.001 | |
| May | 0.7285 | 0.011 | 65.974 | <0.001 | |
| June | 0.5842 | 0.01 | 55.711 | <0.001 | |
| July | 0.6392 | 0.012 | 53.904 | <0.001 | |
| August | 0.6445 | 0.01 | 63.751 | <0.001 | |
| September | 1.0161 | 0.01 | 106.67 | <0.001 | |
| October | 0.6873 | 0.01 | 67.426 | <0.001 | |
| November | 0.2158 | 0.011 | 19.185 | 0.000 | |
| December | 0.6331 | 0.015 | 42.832 | <0.001 | |
| Season | Spring | 1.8553 | 0.009 | 212.055 | <0.001 |
| Summer | 1.8678 | 0.01 | 185.07 | <0.001 | |
| Winter | 1.2575 | 0.01 | 129.503 | <0.001 | |
| Fall | 1.9191 | 0.008 | 227.818 | <0.001 | |
| Distance (miles) | Median Distance | 8.64E-06 | 2.45E-06 | 3.527 | 0.000 |
| Duration (minutes) | Median Duration | 0.062 | 0.002 | 30.376 | 0.000 |
Disclaimer/Publisher’s Note: The statements, opinions and data contained in all publications are solely those of the individual author(s) and contributor(s) and not of MDPI and/or the editor(s). MDPI and/or the editor(s) disclaim responsibility for any injury to people or property resulting from any ideas, methods, instructions or products referred to in the content. |
© 2023 by the authors. Licensee MDPI, Basel, Switzerland. This article is an open access article distributed under the terms and conditions of the Creative Commons Attribution (CC BY) license (http://creativecommons.org/licenses/by/4.0/).
Copyright: This open access article is published under a Creative Commons CC BY 4.0 license, which permit the free download, distribution, and reuse, provided that the author and preprint are cited in any reuse.


