
Submitted:
07 June 2024
Posted:
07 June 2024
You are already at the latest version
Abstract
NMR spectroscopy, which is based on the phenomenon of nuclear magnetic resonance, has been widely popularized by its application in medical imaging under the name of MRI. In the organic laboratory, the 13C NMR spectrum of a newly synthetized compound remains an essential step in elucidating its structure. For the chemist, the interpretation of such a spectrum, which is a set of chemical shift values, is made easier if he has a tool capable of predicting with sufficient accuracy the carbon shift values from the structure he intends to prepare. As there are few open source methods for accurately estimating this property, we applied our graph machine approach to build models capable of predicting the chemical shifts of carbons. For this study, we have focused on benzene compounds building an optimized model derived from training a database of 10577 chemical shifts originating from 2026 structures which contain up to ten types of atoms other than carbon, namely H, O, N, S, P, Si and halogens. It provides a training root mean squared relative error (RMSRE) of 0.5 %, i.e. a root mean squared error (RMSE) of 0.6 ppm, and a mean absolute error (MAE) of 0.4 ppm for estimating the chemical shifts of the 10k carbons. The predictive capability of the graph machine model is also compared with that of three commercial software on a data set of 171 original benzenic structures (1012 chemical shifts). The graph machine model proves very efficient in predicting chemical shifts with an RMSE of 0.9 ppm, and compares favorably with the RMSEs of 3.4, 1.8 and 1.9 ppm computed with ChemDraw, ACD and MestReNova softwares respectively. Finally, a Docker-based tool is proposed to predict the carbon chemical shifts of benzenic compounds solely from their SMILES codes.
Keywords:
chemical shift
; graph machines (GM)
; machine learning
; structured data
; Docker
1. Introduction
In the field of synthetic organic chemistry, it is imperative for researchers to determine the structure of an unknown or newly-prepared compound, or to verify its supposed (and expected) structure. This process, still known as structure elucidation, relies on a battery of spectroscopic analyses, including NMR techniques. Since the very early 1960s, NMR spectroscopy has undoubtedly been one of the main analytical tools applied to the most diverse challenges. As such, it is a powerful enough technique to obtain, from an NMR spectrum recorded for a given structure, information that is relevant, if not sufficient, to fully characterize it.
NMR is a physical phenomenon based on the quantum-mechanical magnetic properties of an atom's nucleus. NMR-active nuclei (with non-zero magnetic moment), such as 1H and 13C, are capable of absorbing radio frequencies when placed in a strong magnetic field. When this absorption occurs, the nucleus is said to be in resonance. Since different atoms (even if of the same kind, e.g. 13C) within a molecule resonate at different frequencies in a magnetic field of given strength, the observation of the resonance frequencies provides information about its structure. The quantity used to quantify this phenomenon is called chemical shift (δ). It is expressed in parts per million (ppm) by frequency, and is defined by Equation (1), where the numerator is expressed in Hz and the denominator in MHz:
is the resonance frequency of an atom in the molecule under study, is the resonance frequency of a reference compound and is the frequency of the spectrometer. The detected frequencies for 1H and 13C nuclei in a given solvent are usually referenced against tetramethylsilane (TMS), for which δTMS is zero.
The chemical shift is one of the most important characteristics of a nucleus in terms of NMR. The advantage of using this atomic property lies in its independence from the frequency of the spectrometer used. For example, the 13C spectrum of 2-methoxytoluene, either recorded at frequencies of 25.2 [1] or 101 MHz [2] in deuteriochloroform (CDCl3) with the same reference (TMS), leads to the chemical shifts (in ppm) assigned to the carbons of the structure shown in Figure 1 [2].
As the chemical shift of an individual carbon atom depends on its hybridization state and the overall electronic environment surrounding the nucleus (its atomic properties), its value might differ substantially for carbons in the same molecule. Indeed, some carbon chemical shifts are sensitive to the effects of substituents, sometimes up to several bonds away from the resonating carbon, particularly in conjugated or aromatic systems. Thus, the carbon of the methoxy group with the light blue dot in Figure 1 has a chemical shift equal to 53.3 ppm, very different from that of the benzylic methyl (16.2 ppm, dark blue dot) or the quaternary carbon attached to the benzylic methyl (126.6 ppm, dark purple dot). The resulting high deshielding (displacement upfield) of the latter atom is due to the fact that it belongs to a benzene ring. This phenomenon is observed for all ring carbon atoms, which resonate above 100 ppm. Interpreting such a spectrum, starting with the attribution of all the chemical shifts observed, is part of the aforementioned elucidation work. And this can be extremely difficult in the case of complex molecules or if the structure of the molecule under study is not known accurately. It is then essential to use algorithms that are capable of providing chemical shift predictions and also very useful for a whole range of applications, such as structure validation [3], automatic assignment [4] and compound elucidation [5].
Consequently, spectroscopists sought to establish in the early sixties empirical relationships between molecular structures and chemical shifts, in order to estimate unknown chemical shift values accurately [6,7]. The first models that were developed for the estimation of 13C NMR chemical shifts were based on a general additive scheme using linear regression [8]. In such methods, the basic idea is to introduce, for a given carbon of a molecule in which a hydrogen – not necessarily on that carbon – has been replaced by a substituent i, an additional term (the so-called increment) corresponding to the presence of that substituent. values are determined by recording the chemical shift differences between the unsubstituted () and singly substituted () molecule according to Equation (2):
In the presence of multiple substituents i the chemical shift of the carbon under consideration, , would be calculated by summing the values of all increments, applying the following formula, in the case of an i-substituted benzenic compound (Equation (3)):
where K is a constant representing a correction for mutual steric and/or electronic interactions of nearby substituents [9,10]. For 2-methoxytoluene (Figure 1), the chemical shift of the ring carbon bearing the methoxy group (157.8 ppm, brown dot) is calculated, in deuterochloroform, as follows:
158.6 ppm, in which is the 13C chemical shift of a carbon in benzene, represents the increment due to the ipso effect of the methoxy group (OMe) on the benzenic carbon COMe, and that of the ortho effect of the methyl group. The K correction is not negligibl in this equation, as the two substituents are ring neighbors. In this example and for this carbon, the estimated value is close to the experimental value (deviation 0.8 ppm).
To take into account the numerous electronic effects of substituents and the tedious calculations that may occur in the case of a polysubstituted ring, programs that simulate the manual calculation process based on additivity rules have been published [11,12]. In particular, Hearmon et al. proposed a microcomputer prediction based on previously published 13C chemical shift values for aromatics [13], for computing carbon chemical shifts in substituted benzenes [14]. Only a few prediction examples are given in the paper, but the program seems to be quite efficient and can work with several solvents. Above all, it has the advantage of handling a large number of substituents and producing results quickly. Pretsch et al. report a standard deviation of 5.5 ppm for a first rough test performed by predicting 168807 13C chemical shift values [11]. This approach is still implemented in some commercial software [15].
At the same time, authors began proposing Quantum Structure–Property Relationship type (QSPR-type) prediction models to estimate the chemical shifts of carbons in several chemical families using multiple linear regression (MLR) [16,17,18,19]. The descriptors used to feed these regressions are either topological (e.g. atom and valence counts, connectivity indices), geometrical, which encode information such as throughspace distances to other atoms in the molecule (e.g. the number of heavy atoms contained in a spherical shell at a given distance from the carbon center), or electronic (based on partial charges). To compute those geometric descriptors that are many in most of the models studied, three-dimensional representations of structures are required [20]. Shortly afterwards, as computer processing power improved, the performance of these models was enhanced by the use of artificial neural networks [10,16,17,18,19,20,21,22,23,24]. The main advantage of neural networks over other methods for building empirical models is that they have a greater ability to generalize to new sets of input data, once training has been carried out and optimized [20]. In addition, the results are superior to MLR analysis and additive models, in terms of predictive reliability [25]. This is not surprising, because the relationships between 13C chemical shifts and molecular structures are essentially non-linear [26]. A criticism of these models is that they are generally specific to a certain class of compounds, which is often of limited size. All these authors use had hoc descriptors, and their nature often imposes size and structure limits on the molecules of interest [27]. For example, Kvasnička's models, based on atomic descriptors encoding the substituent structure of a series of monosubstituted benzenes, although giving fairly accurate estimates, were inadequate for predicting the carbon chemical shifts of polysubstituted compounds [23]. Finally, it should be pointed out that with this type of model, it is necessary to start with a large set of descriptors, obtained after geometric optimization of the molecules, and to select the most relevant ones for the data set chosen for the study [28].
Meiler et al. have published a single neural network to predict the 13C chemical shifts of substituted benzenes [29]. Their model does not use computed descriptors as inputs, but the incremental values of monosubstituted benzenes (the term in Equation (2)), i.e. for a given substituent, four experimental chemical shift corrections, according to the position of each carbon on the benzene ring relative to this substituent (ipso, ortho, meta and para). In addition, it simultaneously computes chemical shift values for all six ring carbon atoms, with an optimized neural network having a 24-48-6 architecture. The neural network is trained by a supervised learning method with around 1000 benzene structures containing over 200 different substituents, then tested with an independent dataset of some 300 structures. The neural network prediction results are better than those obtained by the incremental prediction methods: the determination coefficients of the scatter plots of predicted shifts versus measured shifts are 0.958 and 0.99 for incremental and neural network methods respectively. In addition, the standard errors for training and test sets are equal to 1.1 ppm for the latter, a significant reduction compared to the 1.5 ppm values computed for the incremental method. The results are impressive, but the number of parameters used by the network - around 1200 - raises questions. This is larger than the number of examples presented to the model, entailing the risk of overtraining. It is therefore likely that the prediction will not be as accurate for more complex molecules. Besides, the authors note that the average deviation, which is computed as the average of all carbon chemical shift deviation for molecules with the same degree of substitution, increases with the number of substituents on the benzene ring [29]. Although it is still a vector machine-type neural network, for which a data vector is presented for each example, it partially encodes the structure of the molecule by mapping for each substituent its relative location on the ring in relation to the carbon for which the chemical shift is calculated. In this respect, it is an ancestor of the graph machines presented in Section 4.1. Unfortunately, such a neural network model cannot be used if the benzene ring is part of a larger polycyclic structure, or if the compound carries a substituent that has not been listed [13].
Another approach to 13C chemical shift prediction uses database-based algorithms that search by similarity in a database containing structures for which chemical shifts have been assigned to all carbon atoms. When similar structures are found, the chemical shifts of the atoms of interest can be computed. Prediction quality is highly dependent on the size of the database and the diversity of the structures it contains. The Hierarchical Organization of Spherical Environments (HOSE-code) [30,31] is the most widely used method for predicting chemical displacements [32,33]. It is based on the encoding of an atom-centered structure: a HOSE code encodes the neighborhood information around an NMR-active atom within a spherical radius. For each atom in a queried structure, the algorithm describes the atom environment in order to find atoms with a similar environment in a database [28]. The shift value, determined from the retrieved information, is an aggregated chemical shift value, usually an average or weighted average. An obvious disadvantage of these algorithms is their poor performance for various structures without representative structural fragments in the database. They also work quite slowly, of the order of seconds to tens of seconds for complex structures. Despite these limitations, database-based algorithms have been used in many commercial programs such as ACD/Labs [34] and NMRPredict [35], or open-source programs such as Nmrdb [36] and CSearch [37]. They are still often used as a reference to assess the effectiveness of new approaches [38,39,40,41]. For 2-methoxytoluene, the 13C predicted shift computed with the HOSE algorithm, available within the open-source application NMRShiftDB2 [42], gives a shift of 156.1 ppm for the methoxylated benzene carbon (experimental shift 157.8 ppm, deviation 1.7 ppm). On a database of 118 000 individual 13C chemical shifts using the ACD/NMR implementation of the HOSE code, the computed mean error is equal to 1.85 ppm while the standard deviation is equal to 3.05 ppm. The authors note that the approach fails with structures which are underrepresented in the database [43].
In the early 2000s, researchers started using a large number of topological descriptors to describe an atom's environment in order to predict 13C chemical displacements more generally with neural networks. Using a set of 8342 carbon atoms from molecules belonging to a wide variety of families, and containing seven different types of heavy atoms in addition to carbon, namely nitrogen, oxygen, sulfur and the halogens, le Bret [27] built up a database of chemical shifts with values ranging from -5 to 225 ppm. In his best model, le Bret uses 533 descriptors, most of them topological, to describe the environment of the carbon whose chemical shift is to be estimated, up to its third neighbors. In this particular case, the total number of connections is 9161, and the network learns on 80% of the total data set. The network yields average prediction errors equal to 2.4 and 4.5 ppm on the training and test (20 % of the data) sets respectively. The fact that the test error is twice as large as the training error suggests overtraining, which, as the author points out in the conclusion, might be ruled out by adding new molecules to the training set. Finally, the author tested his best model on a set of 170 carbon atoms belonging to 34 mono-, di- or trisubstituted pyridines [9]. The results are probably not what was expected, as the average deviation in prediction for all pyridine carbons is around 7 ppm. The author points out that the data set contains no substituted heterocyclic aromatic compounds, hence the significant electron effects caused by the presence of a nitrogen atom in the pyridine aromatic ring cannot be learnt by the network.
At the same time le Bret proposed the first large-scale approach with neural nets, dealing with more than a thousand structures, Meiler et al. reported a PC-program which allowed the computation of the 13C NMR spectra of any proposed molecular structure consisting of the covalently bonded elements C, H, N, O, P, S and the halogens, using the spherically encoded chemical environments of more than 500 000 carbon atoms [44]. Their program, based on neural nets, enables the prediction of 13C NMR spectra with average chemical shift deviations of 1.6 ppm at a computation speed around 1000 times faster than the predictions made with the HOSE code. The neural nets have 360 inputs to define five spheres and the additional sum sphere surrounding the carbon atoms whose chemical shift is to be estimated. Since nine types of atoms are defined, the number of neurons in the hidden layer of the nine networks used for each of these types depends on their frequency in the training dataset. For example, when the first aryl network is trained with 66433 quaternary aromatic atoms, the chosen number of hidden neurons is equal to 20. For this specific category of aromatic carbons, the root-mean-square deviation (RMSE) is 1.88 ppm for the training set, and 1.72 for the test set which includes 1983 aryl carbons. Similar results are obtained for tertiary (H-bearing) aryl carbons, with RMSE values of 1.57 and 1.81 for the training (113655 CH) and test (3452 CH) sets respectively. The averaged figures for the nine networks are 1.97 and 2.10 ppm for the training (510795) and test (15716) sets respectively. Therefore, their work has struck a good balance between accuracy and speed of shift prediction [45]. Shortly afterwards, this program was improved by the introduction of an extended hybrid numerical description of the carbon atom environment, resulting in a standard deviation of 2.4 ppm for an independent test data set of ∼42500 carbons [46]. As an exercise, the authors compared Taxol's carbon chemical shift prediction with a wide variety of other 13C chemical shift prediction tools, and the second smallest standard deviation was obtained here with these new neural networks (1.3 ppm for 47 carbons). The program therefore enables fast and accurate prediction of 13C NMR chemical shifts without the need to access databases of molecules or fragments. A similar approach was published by William et al. who built their models from a database of two million 13C chemical shifts (207000 molecules) [28,45]. Additional features have been added, such as a more comprehensive list of atypical atoms and the ability to take solvents into account in the prediction algorithm. Additional flags have also been used to consider the stereochemistry of double bonds. In many cases, cross increments, which refer to pairs of atoms, have been used. In that case, for each pair of atoms separated by no more than two covalent bonds, an independent identifier has been generated and stored (up to three spheres). The authors optimized the main parameters characterizing their models (number of neurons, spheres, cross-increments...), performed trainings using neural networks and partial least squares, and compared the results to those obtained with a database-based implementation of the HOSE code approach. With a test set containing 118000 13C chemical shifts (11000 molecules), both methods lead to close RMSEs, equal to 2.45 ppm (NN) and 2.61 ppm (PLS), slightly better than the 3.05 ppm obtained with the HOSE approach. It should be noted that the neural network selected has three layers of hidden neurons (100-25-5). The NN model was tested on an external dataset of 92927 independent 13C chemical shift collected by Robien et al. [47,48] For this collection of shifts, the RMSE for the prediction of the whole set is equal to 3.22. As the trainings are broken down by atom type sub-databases, RMSEs are also shown for tertiary and quaternary aromatic carbons, which are equal to 1.90 (19999 CH) and 2.60 (15289 C) respectively. These results are equivalent to those obtained previously using a comparable approach, but applied to smaller test sets (1.81 and 1.72) [44].
Recently, deep leaning (DL) neural networks have made substantial progress in various areas, and a DL-based method for accurately predicting chemical shifts of both 1H and 13C nuclei has recently emerged [39,49]. In the second cited paper, convolutional graphical neural networks are applied to learning the 13C and 1H chemical shifts of 32538 annotated molecules containing only the elements H, C, O, N, P, S, F and Cl. For 13C shifts, an accuracy of 1.2 ppm mean per-molecule root mean squared error (mol RMSE) was obtained on a 177 molecule-subset taken from NMRshiftDB, chosen because they had the greatest number of independent spectral measurements. The authors adopt the mol RMSE metric, i.e. the RMSE is first computed for all carbon chemical shifts per molecule, then averaged over all molecules considered. This result is significantly better than conventional HOSE code-based prediction, whose mol RMSE is equal to 4.24 on the same test set. A new feature, compared with conventional ML methods, which require the process of selecting and creating features from the input data, is that DL allows creation of the most suitable set of features within the process of training, without any design or involvement by the researcher [50]. These very promising results need to be reproduced on a larger database containing molecules spanning a wider variety of atoms, and taking stereochemistry into account [51]. This technique has been integrated with the NMRshiftDB2 database [52], and Kuhn et al. presented proof-of-concept methods for substructure prediction and compound classification from NMR spectra based on a convolutional neural network [53,54]. In addition, this method can complement any other prediction method, since a confidence interval is computed at the same time for each predicted value. Finally, Kuhn and al have demonstrated that their deep learning model is better than more conventional methods (HOSE, SVM) for predicting carbon NMR shifts when the number of spectra used for training exceeds 5000 [55]. Very recently, they have improved their technique by using a type of message-passing graph network block, enabling them to achieve better prediction results using fewer spectra [56]. For our pilot molecule, 2-methoxytoluene, the NN-predicted 13C shift for the methoxylated benzene carbon is equal to 157.7 ppm [42], hence is very close to the experimental shift value equal to 157.8 ppm. This good result (which is also the case for the other ring carbons) can probably be explained by the fact that 2-methoxytoluene is part of the training set.
Alongside these numerous empirical techniques, which are now reaching a form of maturity, there is a second approach to 13C NMR chemical shift prediction, namely ab initio calculations. In principle, ab initio methods can calculate the magnetic properties of any molecular structure, such as shielding tensors, shielding anisotropy and isotropic chemical displacements with respect to an applied magnetic field and the nuclear magnetic moment. These results can be achieved with high accuracy for entire molecular systems from optimized three-dimensional structures. An important benefit of ab initio methods is that the chemical shift values obtained are not biased by previous experimental results [46]. But, their most valuable advantage is undoubtedly the handling of compounds bearing exotic fragments, or which are freshly synthesized compounds. Ideally, ab initio methods need no adjustment to predict new classes of substances which are either under-represented in current databases, or for which spectrum-structure relationships are insufficiently described, or that are not properly handled by any of the empirical or ML-derived methods. Their main disadvantage is that extensive optimization of the spatial structure and/or consideration of multiple conformations, particularly for flexible molecules, makes the calculations required (very) time-consuming and costly. On the other hand, advances in calculation of NMR properties from first principles made considerable progress with the introduction of Density Functional Theory (DFT) [49,57]; today’s DFT-based methods can be quite accurate [5] and reasonably turnkey, even if they are time-consuming, and protocols have been developed for their application [58]. Once a mechanism for predicting the error bounds of individual atoms for DFT-based calculations has been developed, this type of prediction could be used in conjunction with the empirical methods. For example, the hybrid functional xOPBE predicts the 13C chemical shifts of 38 polycyclic natural products (771 carbon atoms) with very good accuracy, as indicated by the computed root-mean-square deviation of 2.1 ppm [59]. Following the best practices outlined in [5,58], the 13C chemical shift for the aryl carbon bearing the methoxy group was computed at 156.5 ppm, to be compared with the experimental value of 157.8 ppm (deviation 1.3 ppm). In addition, the development of new types of neural networks that can speed up computation while maintaining excellent prediction is in full swing [59,60,61].
Table 1 shows the chemical shift predictions of the carbon bearing the methoxy group for 2-methoxytoluene using the models described above. For this carbon, chemical shifts are predicted fairly accurately with all the models employed, the best estimates being those of the neural network-based NMRshiftDB algorithm, the ensemble method of the MestReNova software and the ACD/Labs dual prediction algorithm.
To get an idea of the performance of a few methods available today for computing 13C chemical shifts for benzene carbons, a set of 22 polysubstituted structures (128 benzenic carbons) published in the chemical literature between 2006 and 2020 was collected. Open source and commercial software were used to predict the chemical shifts of the ring carbons. The RMSE computed for the 128 chemical shift predictions with the chosen models are reported in Table 2.
Surprisingly, for this set of 22 fairly simple molecules with a molecular mass of less than 340 Da (see references and detailed results in Table S1 of the Supporting Information, hereinafter referred to as SI), the results vary widely depending on the algorithms used. With this set of 22 molecules, the commercial software ACD and MestReNova delivers the best results. Thanks to the 'ensemble' technique, when a "predictive" calculation is requested, MestReNova runs several predictors to get the final results. First, the Mestrelab predictor is run - it is actually formed by two different machine-learning predictors trained with different assigned data -, then the Modgraph predictor which uses also two different predictors takes over, and finally, a Bayesian algorithm is triggered to combine all the individual chemical shifts and confidence intervals to obtain the final predicted chemical shifts (and confidence intervals). The ACD/Labs software uses a dual prediction algorithm, based on neural networks and HOSE code algorithms, but its operation is not known (black-box effect).
The preliminary results reported in Table 2 indicate that it would be highly desirable to have an open-source model capable of predicting benzenic shifts with ppm accuracy, and just as efficient as NMRshifDB’s NN method, especially for molecules containing bromine or iodine atoms. Indeed, this family of compounds represents a significant percentage of those for which 13C NMR spectra have been published. A SciFinder search on March 11, 2024 [62], for compounds containing an isolated benzene ring, yielded 1978095 single-component structures out of a total of 3083722 structures for which 13C data were available. Of these, 546838 structures have only one aromatic ring, which is the benzenic ring, and 99% of them (529755) contain at least one of the eight atoms already mentioned, i.e. oxygen, nitrogen, phosphorus, silicon or halogen. Furthermore, these compounds have the added advantage, depending on the nature of the ring substituents, of having 13C chemical shifts covering over a hundred ppm.
Indeed, as it is unreasonable to test our approach on too large an ensemble, having a sample of molecules whose chemical shifts can vary by a hundred ppm or so is a good idea. Finally, it should be pointed out that the 540000 or so benzenic structures described by their carbon NMR spectra represent only a tiny fraction of the total number of molecules that could be obtained by combining the 174 benzenic substituents present in our final database. Considering only tetra-substituted benzenic derivatives with four different substituents, it is in fact possible to construct some 1.1 billion different molecules corresponding to 6.6 billion chemical shifts.
Therefore, in the present article, graph machine modeling (described in Section 4.1) is used to estimate the 13C chemical shifts of benzenic carbons measured at 30 °C in a CDCl3 solution. Graph machine models of increasing complexity are designed and trained from a set of 1637 molecules, corresponding to 8431 chemical shifts of benzene-like carbons. A model containing 834 variable parameters is selected after comparing the virtual leave-one-out scores of the trained models. Its ability to generalize is then assessed by predicting the 13C chemical shifts of 584 benzenic carbons from a set of 114 fresh molecules. Estimates of carbon chemical shifts that are farthest from experimental values are analyzed to detect possible errors or insufficient description of molecular structures. A new training dataset of 2026 molecules (10577 benzenic carbons) is finally built up by merging the previous training and test sets and adding new compounds to extend the range of application of the model while improving its predictive quality. Once trained under the same conditions as before, the model's performance is compared with that obtained using open-source and commercial software on a new set of 171 molecules combining 1012 benzenic carbons. After validation, the graph machine model is integrated into a demo software version 1.0 written in Python, which is available for download.
2. Results
2.1. Graph Machine Model Selection
The selection of the appropriate model, given the available data, was done by training the graph machine-based models on the 8431-dataset, as defined in Section 4.3, with an increasing number of multi-layer perceptron (MLP) hidden neurons. In addition to the computation of the virtual leave-one-out (VLOO) score, as defined in Equation (6) of Section 4.3, the Root Mean Square Training Error (RMSTE), which is an indicator of the ability of the model to account for the training data, is also computed according to Equation (4):
where is equal to 8431, is the 13C chemical shift value determined experimentally for carbon i, and is the 13C chemical shift value estimated by the model for molecule i at the end of the training. The RMSTE and VLOO score computations (see Section 4.3) are repeated three times for each number of hidden neurons, so the averages are displayed in Table 3.
As expected, the Root Mean Square Training Error decreases when the model complexity (number of hidden neurons) increases. The variation of the VLOO score follows the same trend than the RMSTE. Increasing the number of hidden neurons from 26 to 30 results in a very small decrease of the average prediction error (0.06 ppm), while the average computation time to estimate the chemical shift for a single carbon atom rises significantly (1.8 s, 50 %). Therefore, the graph machine model with 26 hidden neurons, denoted thereafter by GM26, is kept for subsequent testing.
2.2. Performance of the GM26 Model on the Compounds of the Test Set
In the present section, the 13C chemical shifts of 114 compounds, measured with our in-house equipment (see Section 4.2), are estimated by the GM26 graph machine-based model. For this purpose, estimations of the chemical shift of the 584-carbon test set are computed with the 26 hidden neuron model (selected from Table 3) for three different parameter initializations, using for each sequence the twenty-five models (out of 100) that have the smallest VLOO scores (see SI Section for more details). The means of the resulting three computations are the final predictions for the test set, whose performance, along with that on the training set, is reported in Table 4, and with more details in Tables S3 and S4 of the SI.
The computed root mean square errors, respectively equal to 0.5 and 0.7 on the training and test sets (second column, rows 1–2), indicate that the GM26 model performs finely on both sets. As expected, the performances are slightly lower in prediction; however, the RMSE value of 0.7 computed for the test set is even better than the one computed for the training set VLOO score (Table 3, antepenultimate column, second row). This demonstrates that (i) the VLOO score on the training set provides an accurate assessment of the generalization ability of the model; (ii) increasing the complexity of the model, given the available data, is not necessary; and (iii) the quality of prediction is very good. The first point (i) is particularly important, because given the size of the training set, a "leave-one-out" (LOO) experiment is difficult to carry out within a reasonable timeframe, with a cycle of 8431 successive trainings having to be carried out in this particular case. The latter point (iii) is also confirmed by the low MAE values equal to 0.4 and 0.5 ppm respectively, and by the minimum and maximum deviations observed for the GM26 model (Table 4, third column, rows 1–2), which are very moderate. In fact, only seven molecules (nine carbons, 0.1 %) in the training set have at least one carbon whose chemical shift is estimated with an absolute deviation of more than 3 ppm, while four molecules (five carbons 0.8 %) in the test set have at least one carbon whose absolute deviation in shift prediction is greater than 3 ppm. Regarding 2-methoxytoluene, which belongs to the training set, the methoxy-bearing carbon is estimated at 157.5 ppm, corresponding to a deviation of 0.4 ppm from the experimental value, a value that is similar to that obtained with other models (see Table 1). Moreover, the RMSE computed for estimating for the six carbons of the molecule ring is also equal to 0.4 ppm, indicating very good training.
2.3. Scatter plot of the GM26 Model Estimations on Both Sets
To summarize, the 13C-estimates computed with the GM26 model for the 8341 carbon atoms of the training and the 590 carbon atoms of the test set are plotted against their measured values in Figure 2. The RMSE computed for the two sets is equal to 0.5 and 0.7 ppm respectively (Table 4), and their determination coefficients R2 are above 0.99. Data points (in red) for the four test molecules, which have the largest predicted shift deviation, are also shown in Figure 2. The detailed results are available in Tables S3 and S4 of the SI.
To conclude this section, a computation with the GM26 graph machine model was performed with the 22-molecule set used to assess the six models in Table 2. The RMSE computed for the 128 predicted shifts, equal to 1.0 ppm, is the best obtained to date, as indicated in Table S1 of the SI. Unlike commercial models, differentiating between tertiary and quaternary carbons is not necessary for our model; encouraging results are obtained with a reasonable number of adjustable parameters (834). Admittedly, the number of compounds processed is modest, and the scope of the model is limited to benzenic derivatives, but it does provide accurate predictions of 13C chemical shift for these compounds.
3. Discussion
3.1. Analysis of Chemical Shift Estimates by the GM26 model on training and test sets
To understand the limitations of our GM26 model for both datasets, we analyzed the reasons why the chemical shift estimates for some carbon atoms showed a deviation from the experimental value in excess of 3 ppm. Several factors may explain this discrepancy, including: (i) the measured chemical shift value is incorrect for various reasons, e.g. the sample solvent is dimethylsulfoxide instead of CDCl3, (ii) the experimental shift has been wrongly attributed to a given carbon, which most often corresponds to an inversion in the assignment of shifts between two carbon atoms, (iii) the structure used to generate the SMILES does not match the sample form present in solution, or (iv) the model cannot learn a specific structural feature of the molecule, which is often the case if this feature is poorly represented in the training set [27]. Based on the results found, a new training set will be constructed, including any necessary corrections and the addition of new structures whenever appropriate.
3.1.1 Analysis of Training Set Estimations with the largest errors
For the training set, seven molecules (structures shown in Figure 3) have an estimated shift value, for at least one of their carbons, which differ from the experimental value by more than 3 ppm (0.4 %). The possible reasons for this discrepancy are analyzed and linked to cases i-iv detailed above. For 2’-methylacetanilide and 2,4,5-trifluorobenzoyl chloride, different values are published in the literature for the carbon chemical shifts marked in red and blue, so this is case i. The carbons of 2’-methylacetanilide, whose shifts are announced at 124.7 and 131.2 ppm in SDBS [1], were thus measured at 123.6 and 129.4 ppm respectively in four publications [63,64,65,66]. Likewise, the shift of the carbon bearing the main function of 2,4,5-trifluorobenzoyl chloride reported at 113.9 ppm in SDBS [1], is published at 118.3 ppm by Sigma-Aldrich [62], and also predicted at 118.5 ppm by ACD software [62]. It would therefore be advisable for these two molecules to correct the experimental shift values for future use.
2,3-dimethoxybenzamide (third structure in the first row of Figure 3) could correspond to case iv, since intramolecular hydrogen bonding, not encoded in its SMILES, may exist in solution. Indeed, its proton spectrum contains two peaks attributed to the amido group protons [67], one of them being deshielded due to the establishment of a hydrogen bond. Such a bond is visualized as dotted lines in the structure of 2,3-dimethoxybenzamide shown in the Figure 4. Moreover, other 2,3-dimethoxybenzamide derivatives exhibit hydrogen bonding in the solid state or in solution [68,69]. As a result, the presence of this electrostatic bond can modify the transmission of electronic effects from substituents in the benzene ring, which might not be captured properly by the GM model. But the discrepancy in shift (3.1 ppm) may also result from a misassignment of peaks for carbons numbered 5 and 6 in the 2,3-dimethoxybenzamide structure shown in Figure 4 (case ii). Consider the 2-methoxybenzamide molecule (first structure of Figure 4), whose proton spectrum shows the same phenomenon of non-equivalence between the amide group protons due to the presence of a similar hydrogen bond. Assuming that a methoxy group is added in position 3 of this structure (central structure in Figure 4) to obtain the 2,3-dimethoxybenzamide structure, and knowing that a methoxy group induces in the meta and para positions of a benzene ring, a deshielding of 1.0 ppm and a shielding of 7.8 ppm respectively [13], the extrapolated shifts calculated from the experimental shift values of 2-methoxybenzamide [70] would be equal to 122.2 ppm for carbon no. 5 and 124.8 ppm for carbon no. 6. It should be noted that this approximate computation does not include any corrective terms, as shown by equation 3. This result is the opposite of δexp. equal to 124.3 and 123 ppm for the shifts of carbon numbered 5 and 6 found in SDBS [1], but the extrapolated result for carbon no. 5 (δextr. = 122.2 ppm) would be more in line with the value estimated by the model (δest. = 121.2 ppm), with an expected deviation of around 2 ppm instead of 3.1 ppm, in the event of re-training. As a result, the shift assignments of carbon numbered 5 and 6 in 2,3-dimethoxybenzamide could be exchanged.
All molecules whose structures are shown in the second row of Figure 3, correspond to case iv. They all have a substituent on the ring, which is surrounded by bulky neighbors, preventing the regular transmission of electronic effects in the benzene system. For example, 1-mesitylethan-1-one (second row, first molecule in Figure 3) cannot accommodate the acetyl group (COCH3) in the ring plane, due to the methyl group present on neighboring ring carbons. Consequently, the graph machine model estimates a higher chemical shift value than that observed for the carbon in position 4 (in red), because it takes into account the standard deshielding effect of the acetyl group, whereas it is significantly reduced. For all three molecules, few similar examples are present in the training set, preventing the model from efficiently learning their features. Therefore, as indicated above, the addition of similar molecules to a future training set is desirable. 2-nitro-p-anisidine, whose structure is the last in the first row of Figure 3, is a tough case, with two chemical shifts poorly estimated. These shifts are also predicted with a large discrepancy by all software programs we have used (see Table S5 of SI for details). In an attempt to understand the underlying effects of substituents in 2-nitro-p-anisidine, the expected shift values for its carbons numbered 3 and 5 (central structure in Figure 5) are calculated, starting from molecules that already have two substituents of 2-nitro-p-anisidine in the appropriate position. To this end, the experimental shifts of 2-nitroaniline (①), p-anisidine (②) and 3-nitroanisole (③) for carbons numbered 3 and 5 or 2 and 6 are incremented with the values corresponding to the added substituents, i.e. methoxy, nitro and amino respectively, as shown in Figure 5.
Interestingly, all carbon shifts for the framed molecules in Figure 5 are accurately estimated (③) or predicted (① and ②) by the GM model (standard deviation (SD) 0.3 ppm for 16 carbon shifts, maximum deviation 0.6 ppm). However, as soon as a third substituent is virtually added to each of them (methoxy, nitro and amino respectively) to have the 2-nitro-p-anisidine structure, the extrapolated shifts resulting from the addition of the appropriate increments to the measured shifts of carbons numbered 3 and 5 (① and ②) or 2 and 6 (③) are fairly consistent, but more than 3 ppm away from the experimental carbon shifts of 2-nitro-p-anisidine (109.5-111.5 instead of 106.3 and 120.9-122 instead of 126.7 in ppm). The extrapolated values closest to the measured shifts are those obtained in case ③, which is consistent with the fact that the added amino substituent in the meta position of the carbons concerned has a low increment value (+0.8). One hypothesis to explain the values observed for carbon 3 and 5 shifts in 2-nitro-p-anisidine, and compatible with the effects of substituents on both positions, would be to credit the nitro group in this particular case with greater shielding effect in the ortho position (-8.4 instead of -4.9) and a strong deshielding effect in the para position (+12 instead of +6.1). This anomaly could also be explained by the existence of an intramolecular hydrogen bond between the neighboring nitro and amino groups of 2-nitro-p-anisidine, but this is not confirmed in its proton NMR spectrum at the acquisition temperature [71], moreover this H-bond would also be present for 2-nitroaniline (①), which is not the case for its proton spectrum either. Finally, it should be pointed out that the estimated shifts of the corresponding carbons for the 2-nitroaniline derivatives present in the training set, namely 4-fluoro-2-nitroaniline, 2-nitro-4-(trifluoromethyl)aniline and 2-nitro-p-toluidine, show a smaller deviation, below 1.5 ppm at most. As no convincing explanation could be provided for the discrepancies observed for 2-nitro-p-toluidine, for which the shifts measured in the laboratory have been validated in many references, it would be wise to remove it from the training set. Other 2-nitroaniline derivatives also possessing a substituent located para to the amino group, with the same electronic effects as those of the methoxy group, could be added for further investigation.
3.1.2. Analysis of Test Set Predictions with absolute errors above 3 ppm
Four molecules in the test set have at least one carbon with an absolute chemical shift deviation greater than 3 ppm (3.5 %). Their structures are shown in Figure 6, with carbons that exhibit a high deviation in their estimated shift drawn in color. Equivalent arguments involving the cases i-iv described in the above section can be drawn upon for all carbons in the test set whose shift prediction is in error. Thus, the significant prediction errors observed for two of the carbon atoms indicated in red in the structures in the first row of Figure 6 result from the use of erroneous experimental values (case i). The experimental shift of 2-bromo-5-methoxybenzaldehyde faulty carbon was recorded for our sample at 155.6 ppm, but several authors have published [72,73,74] its shift value equal to 159.2 ppm, which is more in line with the GM26 prediction. We have not been able to explain this difference in measured values for a single peak, but have sometimes observed the same phenomenon for other molecules for which several spectra recorded under the same conditions have been published. Likewise, a small peak with = 113.2 ppm was mistakenly assigned to the red tertiary carbon of 6-bromopiperonal in Figure 6, whereas its true chemical shift value is 108.1 ppm. These values must be corrected for future use.
For molecules whose structures are shown in the second row of Figure 6, the large error could correspond to the third hypothesis (case iii). In fact, both molecules exhibit intramolecular hydrogen bonding in CDCl3 solution, as confirmed by the observation of an unshielded line in their proton NMR spectrum at 17.0 and 10.9 ppm respectively [75,76]. The former value, well above 12 ppm, indicates a particularly strong hydrogen bond, which can be explained by the predominance, in solution, of the tautomeric enol form of 1,3-diphenyl-1,3-propanedione shown in Figure 7 (first structure) [75]. This predominance is confirmed by the presence in the same spectrum of a tiny peak at 4.65 ppm, a shift value expected for the methylene group protons of the dione form. The (Z)-3-hydroxy-1,3-diphenylprop-2-en-1-one structure should then be used as input for the GM construction instead of the dione’s, and the estimated shifts for the four ring carbons (two are equivalent) should result from averaging the estimated values computed for the matching carbons of the two rings (carbons labelled in Figure 7). There is no point in carrying out such a calculation at present, as no benzene derivatives with enol-type substituents are present in the training set. For 5-methoxy-3-nitrosalicylaldehyde, whose structure is also shown in Figure 7, we cannot explain such a large chemical shift deviation (3.4 ppm) for the tertiary carbon adjacent to the CHO group, despite the presence of an H-bond as indicated. In fact, all 12 salicylaldehyde derivatives present in the training set have an H-bond, and all the chemical shifts of the ortho-aldehyde carbon are estimated by the GM model with a smaller deviation (maximum deviation 1.9 ppm, mean 1.0 ppm and SD 0.4 ppm). The same applies to the six salicylaldehyde derivatives of the test set, but with higher deviations (maximum deviation 1.9 ppm, mean 1.6 ppm, SD 0.3 ppm). It is also possible that, as with 2-bromo-5-methoxybenzaldehyde mentioned above, the shift value recorded for the indicated tertiary carbon of 5-methoxy-3-nitrosalicylaldehyde is incorrect, which cannot be verified since no reference is available in the literature. Meanwhile, chemical shift prediction with the GM26 model of the labeled carbon for 3-methoxy-5-nitrobenzaldehyde (Figure 7), not present in our sets, provides a value of 117 ppm, also 2.3 ppm off the experimental value [77]. As no intramolecular H-bonds exist for this compound in solution, it may be worth adding it in a future training set.
In view of the preceding discussion (Section 3.1), the case of 5-methoxy-3-nitrosalicylaldehyde would correspond more closely to the fourth case iv, as would that of the blue carbon of 6-bromopiperonal in Figure 6, for which a shift deviation of 3.4 ppm is observed. This is not surprising for the latter, as the training set contains only three molecules with a –C(=O)X-type function having a neighboring bromine atom on the benzene ring (two aldehydes and one ester). This is also why the brominated carbon of o-bromobenzaldehyde has a poorly predicted shift (1.7 ppm off). This discrepancy could therefore be reduced by adding a few brominated benzaldehyde derivatives in position 2 in future data sets.
3.2. Design of an extended graph machine-based model
Following the in-depth analysis of the results provided by the GM26 model on the two selected sets (Section 3.1), the construction of a larger training set was undertaken in order to (i) minimize the observed deviations, and (ii) extend its prediction domain. Thus, the two previous sets used for model selection and validation were merged to produce a file containing no less than 8983 carbons (1745 molecules), six molecules having been removed for various reasons. A total of 281 molecules containing new atoms, new functional groups or highly crowded rings were then added, resulting in a total of 10577 carbons (2026 molecules). Table 6 summarizes some of the chemical families added, depending on the benzene ring substituent. The complete list of added molecules, and those removed from the 8431-carbon training set, with justifications, are provided in Tables S6 and S7 of the SI.
A graph machine model with MLP counting 26 hidden neurons was then built and trained with this new dataset of 10577 chemical shifts. First, estimations of outlier shifts, discussed in Section 3.1, were analyzed for improvement, then the performance of the new GM26 model was tested with a small set of 28 benzenic compounds (156 carbon shifts) recently published on SDBS [1] in 2022 and 2023. The results are given in Table 7 and with more details in Tables S8 and S9 of the SI.
Compared with the first GM26 model, the present model is almost as efficient with similar RMSE and MAE for the training set carbon shift estimates, as shown by the close values obtained in Table 4 and Table 7 (row 1, columns 2 and 3). In addition, lower values of maximum and minimum deviations are obtained (row 1, columns 5 and 6), and lastly the RMSE calculated for shifts incorrectly estimated or predicted with the previous model is lower (row 2, column 2: 1.9 instead of 3.3 for outliers), indicating an improvement in the quality of the estimations. Finally, the prediction of the benzenic carbon shifts of the 28 new molecules, containing all the atom types in the training database except phosphorus and silicon, gives very satisfactory results with a noteworthy RMSE equal to 1.0 ppm, the limits of which will be discussed later. Before that, the model's performance is compared with that of commercial software, and an open-source model.
3.3. Comparison of Known Models with the Graph-Machine-Based Model
To carry out this comparison, a test set containing 171 molecules taken from the literature (1974-2020) and not belonging to the training set was compiled. This selection covers all the types of atoms used in training, each of which is present in at least six different molecules, and all the 13C shift values are within our training range. The results of the computations for all models are shown in Table 8.
Firstly, as we don't know which molecules are used to parameterize the models compared to the graph machine model, the values given in Table 8 are not necessarily significant. Indeed, predictions for molecules belonging to the training set should be removed from the test RMSE computation for the compared models. In the case of the three commercial software packages ChemDraw, MestReNova and ACD, the GM model gives better overall chemical shift predictions for the 171 molecules in the test set, since the computed RMSE equal to 0.9 (row 1, column 1), is the smallest. It can also be seen that the maximum deviations are smaller in the case of the GM model, the largest error in absolute value for all predicted carbon shifts being equal to 3.6 ppm, while it is 27.6, 10.1 and 8.5 ppm for the other methods (columns 4-5). Most importantly, only 0.9% of carbons have a shift predicted by graph machines with an error greater than 3 ppm, compared with 25.3, 10.2 and 9.5% respectively for the other methods used (last column). We also report in the last row of Table 8 the prediction results obtained with the NMRshiftDB deep learning model. For our test set, the shift computation was only possible for 100 molecules (596 atoms), i.e. those containing no bromine, iodine or silicon atoms. The computed RMSE, equal to 1.1 ppm, is very low, and this good result is confirmed by the small number of carbons (2.5 %) that have a predicted shift with an error (in absolute value) greater than 3 ppm. This open-source model is therefore very effective for predicting the shifts of benzenic carbons in molecules containing the supported atoms. It's easy to launch a chemical shift calculation on the dedicated site, even if it can sometimes be a little slow, as pointed out by the authors [42]. It's also worth remembering that this model uses a training set containing almost 106 carbon atoms, i.e. 100 times more than ours. The detail of the resulting 13C chemical shift predictions with the five models for all test molecules is available for download in Table S10 of the SI.
Figure 8 shows a scatter plot of the prediction results with the GM26 and MestReNova models for the 171-molecule test set. The results obtained with the MestReNova software are compared to the graph machine results because they are the second best, and 13C shifts can be predicted for all the carbons in the test set with the most recent version of this software (v. 15.0.1). The fit is very good for the data points (red disks) corresponding to the graph machine-based model, reflected by the value of the coefficient of determination equal to 0.997, and the red regression line practically coinciding with the bisector of the graph in Figure 8. Three molecules whose indicated red carbons have the largest prediction error are also shown. The blue points corresponding to predictions obtained with the MestReNova software are further away from the diagonal, indicating less accuracy; this is confirmed by the value of the coefficient of determination equal to 0.986, less close to 1 than that calculated for the GM model. Three molecules whose red carbon shows a shift predicted with a large error are also displayed for information purposes. Note that the graph machine model correctly predicts the values of these shifts.
3.4. Some limitations of the Graph Machine-Based Model
When the final training set was built, six molecules from the first training set were removed because their shifts were not estimated with sufficient accuracy. This choice was necessary for five of them, as the experimental shifts used could not be confirmed by a second reference, or were not measured in the appropriate solvent (CDCl3). By contrast, for the sixth, 2-nitro-p-anisidine, although the numerous references available were mutually consistent, two of its shifts could not be estimated with an accuracy better than 3 ppm. The exact same behavior was observed for the 2-bromo-4-methoxy-6-nitrophenol molecule, which belongs to the test set of 26 compounds used for validation of the new graph machine model (Section 3.2). The two molecules are shown in the first row of Figure 9 with the deviations observed for the carbon shifts marked in blue (positive deviation from the experimental value) and red (negative deviation). The parallel between the two is obvious, with the same carbons in alpha-position of the methoxy group either having a shift overestimated by the model (red C), or an underestimated one (blue C). The other four molecules all have at least three neighboring carbons bearing substituents that have a certain degree of steric hindrance. The erroneous estimate is then made either on the congested carbons (salicylate and isophthalate) or on the carbon in the para position of the main group (acetanilide and benzoate).
So far, we have been unable to explain the discrepancy observed in the prediction of the two carbon shifts for the first two molecules (phenol and anisidine). The sequence of atoms on the benzenic ring that causes these discrepancies is a combination of substituents obtained by starting with nitrobenzene, adding an amino or hydroxy group in ortho position of the nitro group, and positioning a methoxy group in para position to the nitro group. Other molecules in the training set (n°1189 & n°1545) have such a distribution of substituents and indeed show a similar trend, albeit with smaller deviations (–1.6 and +2.3 ppm respectively). To confirm that hypothesis, we have predicted the shifts in 4-(methylamino)-2-nitrophenol, which is not part of any set and meets the above criteria. It turns out that, again, significant discrepancies are observed for the shift prediction of the same carbons (–3,9 and +4,6 ppm). For nuclei encumbered by several neighboring substituents, significant deviations in shift predictions are also observed, which is the case for the last molecule of the first row, and for all molecules of the second row in Figure 9. The explanatory effects are not always straightforward for the two salicylates. However, for the last two molecules of the second row in Figure 9, the electronic effects of the sandwiched groups (NHAc and CO2Me) are not correctly transmitted in their para position, as they are no longer in the plane of the benzenic ring, but rather in a perpendicular position. Thus, the amide shielding (–5 ppm) and the ester unshielding (+4 ppm) do not apply in their para position, whereas the graph machine model still takes them into account, resulting in a shift error. We have encountered similar effects in the case of thiophenol and thioanisole derivatives [78,79,80]. Other discrepancies may also arise in the prediction of the shift of highly congested molecules, this is currently a limitation of the model.
When trying to predict the 13C chemical shifts of molecules like naphthalene, pyridine or arsinine, all shown in Figure 10, the results are far from the mark. That is not surprising, as no fused aromatic bicycles are present in the training database, nor are any heteroaromatics like pyridine or arsinine, the last of which contains an atom that is not part of the training set atoms.
Clearly, our model cannot be used to predict the chemical shift of aromatic carbons in molecules very different from those in the training set, but it is still very robust, since it computes a shift as long as the provided SMILES code is correct. It is therefore essential to make sure that the molecule whose 13C shifts are to be predicted is indeed a benzene derivative containing the chemical atoms and functions advertised.
Consequently, we have developed a demonstration tool, based on Docker, fed with the built-in data (chemical shifts of 10577 benzenic carbons, SMILES of molecules). It allows one to replicate the chemical shift predictions for the 171 compounds on the test set. In addition, version 1.0 of the demo software is also capable of predicting with good accuracy (ppm range) the 13C benzenic chemical shifts of any molecule containing carbon, hydrogen, oxygen, nitrogen, halogen, sulfur, silicon and phosphorus atoms, based on its SMILES code. Details on how to install Docker, download, and use our demo, are available in Sections A and B of the CSdemo-SI.pdf file of the Supporting Information. Readers are then welcome to use the demo software (v. 1.0) to estimate the chemical shift of carbons of the test sets or of interest to them. For easy access to the molecules and carbon SMILES used, as well as the references of the papers from which they originate, where applicable, are given in SI Tables S11 to S16.
4. Materials and Methods
The design of graph machine models requires a dataset of measured experimental values, presently a set of 13C chemical shift values in the present case. An important difference as compared to the estimation of surface tension, viscosity or refraction index [81,82,83], is that the property under study is an atomic property instead of a molecular one. Consequently, the carbons of the benzenic molecules must be annotated with their experimental chemical shifts. Numerous experimental chemical shift databases are either freely available on the Internet, or commercially available from various suppliers. In addition to our own collection of 13C carbon NMR spectra, we have gathered 13C chemical shifts from the well-known spectral database for organic compounds (termed SDBS for Spectral Data Base System) provided by the National Institute of Advanced Industrial Science and Technology [1], from the CAS Database [62] or the Landolt-Börnstein collection of carbon-13 NMR data for aromatic compounds [84]. Compared with spectral data extracted from primary articles referenced in the CAS database, the advantages of using SDBS are as follows: (i) several thousands of benzenic compounds have 13C NMR spectra with chemical shift values annotated, (ii) in difficult cases, carbon shifts are assigned using several complementary NMR techniques like DEPT, HMQC or HMBC, (iii) most of the 13C spectra are recorded at 30 °C in deuterochloroform, the most routinely used NMR solvent and (iv) every compound can be searched with its name, molecular formula and CAS registry number to access its 13C spectrum. An initial dataset of 1637 benzenic compounds corresponding to 8431 measured 13C chemical shifts, ranging from 73 to 166 ppm, was compiled from data extracted from the above-mentioned databases. A second dataset was built up from 114 diverse benzenic compounds, for which a 13C spectrum was recorded in our laboratory. It contains 584 assigned carbon chemical shifts with values ranging from 82 to 162 ppm, as well as the SMILES codes corresponding to each carbon (see Section 4.2).
4.1. Graph Machine Modeling
In graph machine-based models, molecules are described as graphs derived from their 2D-structure, and the parameterized functions (called graph machines) that compute the estimation of the property or activity of interest reflect the compound molecular structures. The procedure for graph machine construction has been described in details elsewhere [83,85,86]. In this case, the main difference with previous descriptions of graph machine design, is that the property is computed for each benzenic carbon atom of all molecular structures, i.e. a graph machine is built for each carbon atom of interest. To this end, the SMILES code previously used to encode a molecular structure has been extended to point out to a specific atom of the molecule, so that the property estimate is computed for that atom. The algorithm has then been modified to perform this task routinely in the prediction step. On the contrary when building a training/validation dataset, an NMR expert's help might be needed to attribute the chemical shift values to the proper carbon atoms, and consequently to the proper SMILES codes. This construction process is illustrated in Figure 11 for two carbon atoms of 2-methoxytoluene (numbered 1 and 2) for which 13C chemical shift are estimated. The 2D-molecular structure of 2-methoxytoluene, equivalent to the displayed SMILES code [87], is first converted into a cyclic graph (step ⓐ). In the next step, i.e. transformation of the graph into a directed acyclic graph, the root node is assigned to one of the numbered atoms. This is done by using SMILES codes containing special tags for the atoms of interest, COc1[c:1](C)cccc1 for atom #1 and CO[c:1]1c(C])cccc1 for atom #2. Two labeled oriented acyclic graphs are consequently constructed, for which the designed output nodes map the carbons of interest, either #1 or #2 (large blue dots, step ⓑ). Finally, for these two directed acyclic graphs, a parameterized nonlinear function, called a node function, which is typically a multi-layer perceptron (MLP), with tanh activation functions for the hidden neurons and a linear output neuron, is implemented at each node of the graphs. The output computed by each node function (the orange triangles in Figure 11) is passed to the next node function, respecting the sequence of atoms in the initial molecule, and the graph orientation defined in step ⓑ . At the end, the function implemented on the node where all previous outputs converge, which is called the root node and corresponds to the carbon on interest, computes the output of the graph machine. The inputs of a node function are the node atom type, i.e. carbon or oxygen for 2-methoxytoluene, the degree of the atom, e.g. degree 4 for the two example atoms, and the outputs of the node functions of the previous level's leaf nodes. Since the two graphs have different output nodes, the two graph machines are also different (step ⓒ).
As a result, for a given benzenic carbon the output of each graph machine depends solely on the structure of the molecule, the position of the carbon in the ring, and the parameters of the node function. In other words, it does not depend on any descriptor, the carbon SMILES codes being the only required information. More details on graph machine construction are provided in earlier papers [85,86].
4.2. 13C NMR measurements for the molecules of the test set
To assess the accuracy of the estimations with the selected graph machine-based model described above, the 13C-NMR decoupled spectra of the 114 test molecules were recorded with a Bruker AC-300 advance at 100 MHz in deuterochloroform at 23 °C. Assignments of the chemical shifts to the proper carbon atoms were done, and in case of uncertainty between two carbon atoms for this attribution, other NMR techniques were used. As 92 molecules of the test set are also present in the SDBS 13C database, their measured 13C chemical shifts could be compared with the values retrieved from SDBS. While we didn't notice any discrepancies in the shift assignments for the 472 benzenic carbon atoms present in these 92 molecules, some differences, mostly small, were observed for some shift values. The maximum difference is equal to 0.76 ppm in the case of the c-NO2 carbon of o-nitroanisole. The standard deviation of the 472 shift differences was then computed to get an idea of the expected accuracy of the estimations of the graph machine-based model. This deviation, equal to 0.14 ppm, means that results for the shift values thereinafter can be reported with one decimal digit.
4.3. Model Selection
This step is especially important when designing machine-learning based models. Its purpose is to find, given the data available for designing the model, the model complexity that will result in the best generalization: a model that is not complex enough is unable to fit the data, hence to generalize, while a model that is too complex (overparameterized) overfits the data and generalizes poorly. Basically, for graph machines, the number of adjustable parameters depends on the number of neurons present in the hidden layer of the multilayer perceptron (MLP) that has been used to design them. Therefore, the purpose of model selection is to find the complexity (number of hidden neurons) that results in the smallest estimation of the generalization error, given the data that is available for designing the model. To perform this task, the two previously defined sets of 8431 and 584 examples were respectively used as a training/validation set (called training set for simplicity), for designing and selecting the model, and as a test set for providing the final estimation of the generalization error of the selected model. The molecules of the test set were chosen so that (i) the distributions of molecules among the chemical families considered were similar in both sets for at least the most common functional groups, and that (ii) the distribution of the 13C chemical shift values was as uniform as possible on the range of measured values, but depends also on the availability of the chemicals in the laboratory. The distributions of the functional carbon atoms for the two sets are shown in Figure 12. The distributions of the tertiary carbon atoms (CH) are not integrated in this figure for clarity, since they represent respectively 53 % and 55 % of the total number of carbon atoms in the two datasets.
As usual for machine-learning based models, the validity of the model is restricted to items that can be considered as realizations of random variables drawn from the same probability distribution as the examples of the training set. In practice, it means that reliable estimations can be expected for molecules that contain the same atoms as the molecules of the training set, and whose molecular structures are not too different from those present in the training set.
The first step is then to build the graph machines from the training set examples, and to train them. In the following, the set of graph machines that are constructed from the training examples will be termed "graph machine-based model". Given a training set of NT elements, the parameters (also termed weights) for these models are estimated by minimizing the sum of squared errors of the cost function J(θ), using the weight sharing method between all nodes of all graph machines (Equation (5)):
where is the measured value of the 13C chemical shift for the i-th element of the training set, θ is the vector of parameters, is the value of the chemical shift estimated by the graph machine for that element, and NT = 8431 as detailed above. In this work, is constructed as a combination of MLPs with a single hidden layer, that reflects the graph structure of the i-th element. This MLP is a linear combination of nonlinear functions called hidden neurons, which are the hyperbolic tangent functions of a linear combination of the variables. All minimizations of the cost function are performed by the Levenberg–Marquardt algorithm, which is well suited to optimization problems with a moderate number of variables [88].
Once training is complete, the next step is to select the most appropriate model for predicting the chemical shifts of the test set elements, i.e. to determine the complexity for which the generalization error is lowest. In the present study, the estimation of the generalization error for model selection is performed by the computation of the virtual leave-one-out (VLOO) score, which provides an unbiased estimation of the generalization ability of the model [89]. This strategy, to find the appropriate complexity of the graph machine based models, is chosen because the computation of the VLOO score is much faster than that of the LOO score, while giving equivalent results [82]. The VLOO score is based on a first-order approximation of the estimation error that would have been observed on each example of the training set, if that example had been withdrawn from that set before training. Thus, denoting by θm the parameter vector after completion of training, the VLOO score is defined as the root-mean-square of the predicted errors (Equation (6)):
where is a first-order approximation of the predicted chemical shift of carbon i provided by the i-th graph machine when the latter is not present in the training set (i.e. if the model had been trained on all training set carbons except carbon i), and is the measured value of the chemical shift for the i-th carbon of the training set. In the present case, the VLOO score is computed for the 8431 carbons of the dataset. For each complexity, 100 trainings are performed with different initial parameter values, and the mean and standard deviation of the 25 smallest VLOO scores are computed for selection of the most appropriate complexity. In general, as complexity increases, the VLOO score reaches a floor value, unless overtraining occurs, in which case the VLOO score increases after this value. The optimal complexity is that for which this minimum score is reached.
After selecting the appropriate complexity of the graph machine-based model, the parameter vectors after training θm for the 25 models that have the smallest VLOO score values are stored. These selected models are then used to predict the carbon chemical shifts of the 122-molecule test set. For all 584 carbons, graph machines are constructed as explained above (e.g., six graph machines for the six benzenic carbons of 2-methoxytoluene shown in Figure 11), and the θm parameters of the 25 kept models are successively assigned to their node functions. Finally, the average of the resulting 25 graph machine outputs provides an estimate of the chemical shift for each of the 584 carbons. The true benefit of this approach is the absence of descriptors: the SMILES codes are the only required information. Moreover, the same set of graph machines can be reused for estimating the same property in different conditions, e.g. if compounds are dissolved in another solvent. All it takes is to learn the new chemical shift values.
5. Conclusions
The estimation of the 13C chemical shifts of organic compounds still attracts much attention due to the importance of that property in the spectroscopic area. The present article reports four main innovations: (i) the estimation of the 13C chemical shifts of benzenic carbons by graph machines, a machine learning method that allows the estimation of properties or activities of molecules directly from their structure described by their SMILES codes, without requiring any other descriptors, (ii) the graph machine method, applied to a set of 10577 carbons, estimates their chemical shift with a root-mean-square error of 0.6 ppm, (iii) the comparison of the accuracy of shift predictions obtained by several methods (ChemDraw, MestReNova, ACD, NMRshiftDB, and graph machines), and (iv) a software (v. 1.0) is available for download to predict the 13C chemical shifts of a benzenic molecule from its SMILES code.
A database of 8431 benzenic 13C chemical shifts is used for training and model selection, and a database of 584 benzenic 13C chemical shifts is used for testing. Graph machines, which perform regression from the graphs derived from the SMILES codes, are first constructed for each carbon. The graph machine-based models are trained, and a model selection is performed by virtual Leave-One-Out (VLOO) to select a node function complexity of 26 neurons. The resulting root-mean-square error on the test set using this complexity is then equal to 0.7 ppm.
After analysis of the estimation and prediction results, a final graph machine-based model, with the same complexity as the previous model, is built and trained on a large set of 10557 13C experimental shifts compiled and checked carefully. Successfully tested on a set of 156 carbons of 28 molecules gathered from freshly published data, this model is applied to the 13C shift prediction of a larger set of 1011 carbons from 171 benzenic molecules, that contain up to 10 different elements other than carbon. Its performance is then compared with that of several commercial software packages. While a root-mean-square error of 0.9 ppm is obtained with graph machines for the prediction of the shift of these 1011 carbons, Chemdraw, MestReNova and ACD lead to values of 3.4, 1.9 and 1.8 ppm respectively.
The main limitations of the graph machine approach are not very different from those of conventional neural networks. Molecules derived from benzene for which the chemical shift of the ring carbons is to be estimated must contain functionalities that have been encountered in the training set. If new atoms or conformational effects are present in its structure, the predicted shifts will not be reliable, and will have to be handled with care.
In any case, the current results demonstrate for the first time the ability of graph machines to accurately estimate an atomic property, such as the chemical shift of a carbon atom, from the 2D structure of the molecule. This is consistent with the fact that this property strongly depends on the neighborhood of the atom under consideration, and shows that the information contained in the molecule SMILES code is then sufficiently relevant. In the same way as for the carbon atom, graph machines are effective in predicting the chemical shift of the proton, as well as that of other NMR-active nuclei. In a future article, we will show that the use of graph machines is also relevant for predicting another atomic property, namely the pKa of an acid group in a molecule. To model this property, however, we need to take into account the hydrogen atoms responsible for the acidity of the molecules whose pKa(s) we are studying, which graph machines can do without difficulty.
For easy duplication of the presented results and for testing of the method on other carbons belonging to similar molecules, as those present in our database, demonstration software (v. 1.0) is made available in the Supporting Information, Sections A and B.
Supplementary Materials
The following supporting information can be downloaded at the website of this paper posted on Preprints.org. The list of compounds used in the present work for training and testing of the graph machine models, and the list of compounds of the datasets used for comparison are available online as excel files, under the name of CS128-SI.xlsx for Table S1: "Carbon names, carbon SMILES, experimental, Nmrdb-estimated, NMRshiftDB-estimated, NMRshiftDB_NN-estimated, NmrPredict-estimated, Chemdraw-estimated, MestReNova-estimated and ACD-estimated 13C chemical shift values in ppm for the set of 22 molecules", ComplexitySelection-SI.xlsx for S2: "Estimation of the chemical shifts from SMILES by graph machine based models of increasing complexity", CS8431A-584T-SI.xlsx for Table S3: "Carbon names, carbon SMILES, experimental and GM26-estimated 13C chemical shift values in ppm for the training set of 1637 molecules"; Table S4: "Carbon names, carbon SMILES, experimental and GM26-estimated 13C chemical shift values in ppm for the test set of 114 molecules", Anisidine-SI.xlsx for Table S5: "Carbon names, carbon SMILES, experimental, graph machine-estimated, ACD-estimated, MestReNova-estimated, Chemdraw-estimated, Gaussian-estimated, NMRshiftDB-estimated and NmrPredict-estimated 13C chemical shift values in ppm for 2-nitro-p-anisidine", CS10577AConstruction-SI.xlsx for Table S6: "Names and references of the 281 added molecules to form the final 10577-carbon training set"; Table S7: "Names, SMILES, and explanation for deletion of six molecules in the 1637-molecule training set", CS10577A-156T-1011T-SI.xlsx for Table S8: "Carbon names, carbon SMILES, experimental and GM26-estimated 13C chemical shift values in ppm for the training set of 2026 molecules"; Table S9: "Carbon names, carbon SMILES, experimental and GM26-estimated 13C chemical shift values in ppm for the test set of 28 molecules"; Table S10: "Carbon names, carbon SMILES, experimental, GM26-predicted, MestReNova-estimated, ACD-estimated, Chemdraw-estimated and NMRshiftDB-NN-estimated 13C chemical shift values in ppm for the test set of 171 molecules", MoleculeLists-SI.xlsx for Table S11: "Names and references of the 22 molecules for the 128-carbon set"; Table S12: "Names of the 1637 molecules of the 8431-carbon training set"; Table S13: "Names of the 114 molecules of the 584-carbon test set"; Table S14: "Names of the 2026 molecules of the 10577-carbon training set"; Table S15: "Names and references other than SDBS for the 28 molecules of the 156-carbon test set"; Table S16: "Names and references of the 171 molecules of the 1011-carbon test set", GM demonstration with docker containers, and GM results with Docker are available as a pdf file under the name CSdemo-SI, The test data used in the demo can be found in an Excel file named Test156-SI.
Author Contributions
Conceptualization, F.D. and J.-L.P.; methodology, F.D., J.-L.P., C.W., and G.D.; software, J.-L.P.; formal analysis, C.W.; investigation, F.D.; resources, F.D.; data curation, F.D.; writing—original draft preparation, F.D.; writing—review and editing, F.D., and G.D.; visualization, J.-L.P., and G.D.; supervision, F.D.; project administration, F.D. All authors have read and agreed to the published version of the manuscript.
Funding
This research received no external funding.
Institutional Review Board Statement
Not applicable.
Informed Consent Statement
Not applicable.
Data Availability Statement
Not applicable.
Acknowledgments
We are grateful to B. Quenet for providing access to her computers, in particular the apple silicon computers (Mac Studio, Apple M1 and M2 Ultra processors). We would like to thank Wolfgang Robien for using the CSEARCH-Robot-Referee website, available at http://nmrpredict.orc.univie.ac.at/c13robot/robot.php.
Conflicts of Interest
The authors declare no conflicts of interest.
Sample Availability
Not applicable.
References
- AIST. Spectral Database for Organic Compounds. Available online: https://sdbs.db.aist.go.jp (accessed on 2024).
- Haydl, A.M.; Hartwig, J.F. Palladium-Catalyzed Methylation of Aryl, Heteroaryl, and Vinyl Boronate Esters. Organic Letters 2019, 21, 1337–1341. [Google Scholar] [CrossRef] [PubMed]
- Gómez, J.C.C.; Bernstein, M.; Sýkora, S. An Integrated Approach to Structure Verification Using Automated Procedures. 2015, 445-492. [CrossRef]
- Cobas, C.; Seoane, F.; Vaz, E.; Bernstein, M.A.; Dominguez, S.; Pérez, M.; Sýkora, S. Automatic assignment of 1H-NMR spectra of small molecules. Magnetic Resonance in Chemistry 2013, 51, 649–654. [Google Scholar] [CrossRef] [PubMed]
- Lodewyk, M.W.; Siebert, M.R.; Tantillo, D.J. Computational Prediction of 1H and 13C Chemical Shifts: A Useful Tool for Natural Product, Mechanistic, and Synthetic Organic Chemistry. Chemical Reviews 2012, 112, 1839–1862. [Google Scholar] [CrossRef] [PubMed]
- Grant, D.M.; Paul, E.G. Carbon-13 Magnetic Resonance. II. Chemical Shift Data for the Alkanes. Journal of the American Chemical Society 1964, 86, 2984–2990. [Google Scholar] [CrossRef]
- Lindeman, L.P.; Adama, J.Q. Carbon-13 nuclear magnetic resonance spectrometry. Chemical shifts for the paraffins through C9. Analytical Chemistry 1971, 43, 1245–1252. [Google Scholar] [CrossRef]
- Clerc, J.T.; Sommerauer, H. A minicomputer program based on additivity rules for the estimation of 13c-nmr chemical shifts. Analytica Chimica Acta 1977, 95, 33–40. [Google Scholar] [CrossRef]
- Thomas, S.; Brühl, I.; Heilmann, D.; Kleinpeter, E. 13C NMR Chemical Shift Calculations for Some Substituted Pyridines: A Comparative Consideration. Journal of Chemical Information and Computer Sciences 1997, 37, 726–730. [Google Scholar] [CrossRef]
- Thomas, S.; Stroehl, D.; Kleinpeter, E. Computer Application of an Incremental System for Calculating 13C NMR Spectra of Aromatic Compounds. Journal of Chemical Information and Computer Sciences 1994, 34, 725–729. [Google Scholar] [CrossRef]
- Fürst, A.; Pretsch, E. A computer program for the prediction of 13C-NMR chemical shifts of organic compounds. Analytica Chimica Acta 1990, 229, 17–25. [Google Scholar] [CrossRef]
- Zupan, J.; Novič, M.; Bohanec, S.; Razinger, M.; Lah, L.; Tusǎr, M.; Košir, I. Expert system for solving problems in carbon-13 nuclear magnetic resonance spectroscopy. Analytica Chimica Acta 1987, 200, 333–345. [Google Scholar] [CrossRef]
- Ewing, D.F. 13C substituent effects in monosubstituted benzenes. Organic Magnetic Resonance 1979, 12, 499–524. [Google Scholar] [CrossRef]
- Hearmon, R.A.; Liu, H.M.; Laverick, S.; Tayler, P. Microcomputer prediction and assessment of substituted benzene 13C NMR chemical shifts. Magnetic Resonance in Chemistry 1991, 30, 240–248. [Google Scholar] [CrossRef]
- Revvity Signals. ChemDraw v.23.1.1.3 Available online: https://revvitysignals.com/products/research/chemdraw (accessed on 2024).
- Ball, J.W.; Anker, L.S.; Jurs, P.C. Automated model selection for the simulation of carbon-13 nuclear magnetic resonance spectra of cyclopentanones and cycloheptanones. Analytical Chemistry 1991, 63, 2435–2442. [Google Scholar] [CrossRef]
- Small, G.W.; Jurs, P.C. Simulation of carbon-13 nuclear magnetic resonance spectra of cycloalkanols with computer-based structural descriptors. Analytical Chemistry 1989, 55, 1128–1134. [Google Scholar] [CrossRef]
- Sutton, G.P.; Jurs, P.C. Simulation of carbon-13 nuclear magnetic resonance spectra of alkyl-substituted cyclohexanones and decalones. Analytical Chemistry 1989, 61, 863–871. [Google Scholar] [CrossRef]
- Sutton, G.P.; Jurs, P.C. Simulation of carbon-13 nuclear magnetic resonance spectra of alkyl-substituted cyclohexanones and decalones. Analytical Chemistry 1990, 61, 863–871. [Google Scholar] [CrossRef]
- Anker, L.S.; Jurs, P.C. Prediction of carbon-13 nuclear magnetic resonance chemical shifts by artificial neural networks. Analytical Chemistry 1992, 64, 1157–1164. [Google Scholar] [CrossRef]
- Kvasnička, V. An application of neural networks in chemistry. Chemical Papers 1990, 44, 775–792. [Google Scholar]
- Kvasnicka, V.; Sklenak, S.; Pospichal, J. Application of neural networks with feedback connections in chemistry: prediction of carbon-13 NMR chemical shifts in a series of monosubstituted benzenes. THEOCHEM 1992, 96, 87–107. [Google Scholar] [CrossRef]
- Sklenak, S.; Kvasnicka, V.; Pospichal, J. Prediction of 13C NMR chemical shifts by neural networks in a series of monosubstituted benzenes. Chemical Papers 1994, 48, 135–140. [Google Scholar]
- Thomas, S.; Kleinpeter, E. The Assignment of the 13C-NMR Chemical Shifts of Substituted Naphthalenes from Charge Density with an Artificial Neural Network. Journal für Praktische Chemie/Chemiker-Zeitung 1995, 337, 504–507. [Google Scholar] [CrossRef]
- Ivanciuc, O.; Rabine, J.P.; Cabrol-Bass, D.; Panaye, A.; Doucet, J.P. 13C NMR Chemical Shift Prediction of sp2 Carbon Atoms in Acyclic Alkenes Using Neural Networks. Journal of Chemical Information and Computer Sciences 1996, 36, 644–653. [Google Scholar] [CrossRef]
- Meusinger, R.; Himmelreich, U. Neural networks and genetic algorithms applications in nuclear magnetic resonance spectroscopy. 2003, 23, 281–321. [CrossRef]
- Bret, C.L. A General13C NMR Spectrum Predictor Using Data Mining Techniques. SAR and QSAR in Environmental Research 2000, 11, 211–234. [Google Scholar] [CrossRef]
- Blinov, K.A.; Smurnyy, Y.D.; Churanova, T.S.; Elyashberg, M.E.; Williams, A.J. Development of a fast and accurate method of 13C NMR chemical shift prediction. Chemometrics and Intelligent Laboratory Systems 2009, 97, 91–97. [Google Scholar] [CrossRef]
- Meiler, J.; Meusinger, R.; Will, M. Neural Network Prediction of 13C NMR Chemical Shifts of Substituted Benzenes. Monatshefte für Chemie / Chemical Monthly 1999, 130, 1089–1095. [Google Scholar] [CrossRef]
- Bremser, W. Hose — a novel substructure code. Analytica Chimica Acta 1978, 103, 355–365. [Google Scholar] [CrossRef]
- Bremser, W.; Klier, M.; Meyer, E. Mutual assignment of subspectra and substructures—A way to structure elucidation by 13C NMR spectroscopy. Organic Magnetic Resonance 1975, 7, 97–106. [Google Scholar] [CrossRef]
- Schütz, V.; Purtuc, V.; Felsinger, S.; Robien, W. CSEARCH-STEREO: A new generation of NMR database systems allowing three-dimensional spectrum prediction. Fresenius' Journal of Analytical Chemistry 1997, 359, 33–41. [Google Scholar] [CrossRef]
- Steinbeck, C.; Krause, S.; Kuhn, S. NMRShiftDBConstructing a Free Chemical Information System with Open-Source Components. Journal of Chemical Information and Computer Sciences 2003, 43, 1733–1739. [Google Scholar] [CrossRef] [PubMed]
- ACD/Labs. ACD/NMR Predictors. Available online: https://www.acdlabs.com/products/spectrus-platform/nmr-predictors/ (accessed on 2024).
- Modgraph Consultants. NMR Predict. Available online: https://mestrelab.com/software/mnova-software/nmr-predict/ (accessed on 2024).
- NMRDB. NMR Predict. Available online: http://www.nmrdb.org/13c/index.shtml?v=v2.138.0 (accessed on 2024).
- Robien, W.; Haider, N. CSEARCH / NMRPREDICT. Available online: https://c13nmr.at/c13robot/robot.php (accessed on 2024).
- Kang, S.; Kwon, Y.; Lee, D.; Choi, Y.-S. Predictive Modeling of NMR Chemical Shifts without Using Atomic-Level Annotations. Journal of Chemical Information and Modeling 2020, 60, 3765–3769. [Google Scholar] [CrossRef] [PubMed]
- Kwon, Y.; Lee, D.; Choi, Y.-S.; Kang, M.; Kang, S. Neural Message Passing for NMR Chemical Shift Prediction. Journal of Chemical Information and Modeling 2020, 60, 2024–2030. [Google Scholar] [CrossRef] [PubMed]
- Kwon, Y.; Lee, D.; Choi, Y.-S.; Kang, S. Molecular search by NMR spectrum based on evaluation of matching between spectrum and molecule. Scientific Reports 2021, 11. [Google Scholar] [CrossRef] [PubMed]
- Moore, K.W.; Li, R.; Pelczer, I.; Rabitz, H. NMR Landscapes for Chemical Shift Prediction. The Journal of Physical Chemistry A 2012, 116, 9142–9157. [Google Scholar] [CrossRef] [PubMed]
- NMRshiftDB. Available online: https://nmrshiftdb.nmr.uni-koeln.de/ (accessed on 2024).
- Smurnyy, Y.D.; Blinov, K.A.; Churanova, T.S.; Elyashberg, M.E.; Williams, A.J. Toward More Reliable 13C and 1H Chemical Shift Prediction: A Systematic Comparison of Neural-Network and Least-Squares Regression Based Approaches. Journal of Chemical Information and Modeling 2008, 48, 128–134. [Google Scholar] [CrossRef] [PubMed]
- Meiler, J.; Meusinger, R.; Will, M. Fast Determination of 13C NMR Chemical Shifts Using Artificial Neural Networks. Journal of Chemical Information and Computer Sciences 2000, 40, 1169–1176. [Google Scholar] [CrossRef] [PubMed]
- Blinov, K.A.; Smurnyy, Y.D.; Elyashberg, M.E.; Churanova, T.S.; Kvasha, M.; Steinbeck, C.; Lefebvre, B.A.; Williams, A.J. Performance Validation of Neural Network Based 13C NMR Prediction Using a Publicly Available Data Source. Journal of Chemical Information and Modeling 2008, 48, 550–555. [Google Scholar] [CrossRef] [PubMed]
- Meiler, J.; Maier, W.; Will, M.; Meusinger, R. Using Neural Networks for 13C NMR Chemical Shift Prediction–Comparison with Traditional Methods. Journal of Magnetic Resonance 2002, 157, 242–252. [Google Scholar] [CrossRef] [PubMed]
- Chen, L.; Robien, W. The CSEARCH-NMR data base approach to solve frequent questions concerning substituent effects on 13C NMR chemical shifts. Chemometrics and Intelligent Laboratory Systems 1993, 19, 217–223. [Google Scholar] [CrossRef]
- Robien, W. Computer-assisted peer reviewing of spectral data: the CSEARCH protocol. Monatshefte für Chemie - Chemical Monthly 2019, 150, 927–932. [Google Scholar] [CrossRef]
- Jonas, E.; Kuhn, S. Rapid prediction of NMR spectral properties with quantified uncertainty. Journal of Cheminformatics 2019, 11. [Google Scholar] [CrossRef] [PubMed]
- Cobas, C. NMR signal processing, prediction, and structure verification with machine learning techniques. Magnetic Resonance in Chemistry 2020, 58, 512–519. [Google Scholar] [CrossRef] [PubMed]
- Kuhn, S.; Johnson, S.R. Stereo-Aware Extension of HOSE Codes. ACS Omega 2019, 4, 7323–7329. [Google Scholar] [CrossRef] [PubMed]
- Kuhn, S.; Kolshorn, H.; Steinbeck, C.; Schlörer, N. Twenty years of nmrshiftdb2: A case study of an open database for analytical chemistry. Magnetic Resonance in Chemistry 2023, 62, 74–83. [Google Scholar] [CrossRef] [PubMed]
- Kuhn, S.; Cobas, C.; Barba, A.; Colreavy-Donnelly, S.; Caraffini, F.; Borges, R.M. Direct deduction of chemical class from NMR spectra. Journal of Magnetic Resonance 2023, 348, 107381. [Google Scholar] [CrossRef] [PubMed]
- Kuhn, S.; Tumer, E.; Colreavy-Donnelly, S.; Moreira Borges, R. A pilot study for fragment identification using 2D NMR and deep learning. Magnetic Resonance in Chemistry 2021, 60, 1052–1060. [Google Scholar] [CrossRef]
- Kuhn, S.; Borges, R.M.; Venturini, F.; Sansotera, M. Dataset Size and Machine Learning - Open NMR Databases as a Case Study. 2022, 1632-1636. [CrossRef]
- Rull, H.; Fischer, M.; Kuhn, S. NMR shift prediction from small data quantities. Journal of Cheminformatics 2023, 15. [Google Scholar] [CrossRef] [PubMed]
- Jonas, E.; Kuhn, S.; Schlörer, N. Prediction of chemical shift in NMR: A review. Magnetic Resonance in Chemistry 2021, 60, 1021–1031. [Google Scholar] [CrossRef] [PubMed]
- Willoughby, P.H.; Jansma, M.J.; Hoye, T.R. A guide to small-molecule structure assignment through computation of (1H and 13C) NMR chemical shifts. Nature Protocols 2014, 9, 643–660. [Google Scholar] [CrossRef] [PubMed]
- Gao, P.; Zhang, J.; Peng, Q.; Zhang, J.; Glezakou, V.-A. General Protocol for the Accurate Prediction of Molecular 13C/1H NMR Chemical Shifts via Machine Learning Augmented DFT. Journal of Chemical Information and Modeling 2020, 60, 3746–3754. [Google Scholar] [CrossRef] [PubMed]
- Unzueta, P.A.; Greenwell, C.S.; Beran, G.J.O. Predicting Density Functional Theory-Quality Nuclear Magnetic Resonance Chemical Shifts via Δ-Machine Learning. Journal of Chemical Theory and Computation 2021, 17, 826–840. [Google Scholar] [CrossRef] [PubMed]
- Gerrard, W.; Bratholm, L.A.; Packer, M.J.; Mulholland, A.J.; Glowacki, D.R.; Butts, C.P. IMPRESSION – prediction of NMR parameters for 3-dimensional chemical structures using machine learning with near quantum chemical accuracy. Chemical Science 2020, 11, 508–515. [Google Scholar] [CrossRef] [PubMed]
- SciFinder; Chemical Abstracts Service: Columbus, O. Available online: https://scifinder-n.cas.org/ (accessed on 2024).
- Hyodo, K.; Hasegawa, G.; Oishi, N.; Kuroda, K.; Uchida, K. Direct and Catalytic Amide Synthesis from Ketones via Transoximation and Beckmann Rearrangement under Mild Conditions. The Journal of Organic Chemistry 2018, 83, 13080–13087. [Google Scholar] [CrossRef] [PubMed]
- Morisset, E.; Chardon, A.; Rouden, J.; Blanchet, J. Phenysilane and Silicon Tetraacetate: Versatile Promotors for Amide Synthesis. European Journal of Organic Chemistry 2020, 2020, 388–392. [Google Scholar] [CrossRef]
- Brasche, G.; García-Fortanet, J.; Buchwald, S.L. Twofold C−H Functionalization: Palladium-Catalyzed Ortho Arylation of Anilides. Organic Letters 2008, 10, 2207–2210. [Google Scholar] [CrossRef] [PubMed]
- Tang, L.; Wang, Z.-L.; Wan, H.-L.; He, Y.-H.; Guan, Z. Visible-Light-Induced Beckmann Rearrangement by Organic Photoredox Catalysis. Organic Letters 2020, 22, 6182–6186. [Google Scholar] [CrossRef] [PubMed]
- Stuart, J.G.; Khora, S.; McKenney, J.D.; Castle, R.N. The synthesis of dimethoxy- and trimethoxy[1]benzothieno[2,3-c]quinolines. Journal of Heterocyclic Chemistry 2009, 24, 1589–1594. [Google Scholar] [CrossRef]
- Cakmak, S.; Kutuk, H.; Odabasoglu, M.; Yakan, H.; Buyukgungor, O. Spectroscopic Properties and Preparation of Some 2,3-Dimethoxybenzamide Derivatives. Letters in Organic Chemistry 2016, 13, 181–194. [Google Scholar] [CrossRef]
- Hayrapetyan, D.; Rit, R.K.; Kratz, M.; Tschulik, K.; Gooßen, L.J. Electrochemical C−H Cyanation of Electron-Rich (Hetero)Arenes. Chemistry – A European Journal 2018, 24, 11288–11291. [Google Scholar] [CrossRef] [PubMed]
- Zhan, W.; Ji, L.; Ge, Z.-m.; Wang, X.; Li, R.-t. A continuous-flow synthesis of primary amides from hydrolysis of nitriles using hydrogen peroxide as oxidant. Tetrahedron 2018, 74, 1527–1532. [Google Scholar] [CrossRef]
- Filleux-Blanchard, M.L.; Fieus, J.; Hallé, J.C. Processus de rotation empéchée autour de la liaison C–N dans les anilines. Organic Magnetic Resonance 1973, 5, 221–225. [Google Scholar] [CrossRef]
- Van Damme, J.; van den Berg, O.; Brancart, J.; Van Assche, G.; Du Prez, F. A novel donor-π-acceptor anthracene monomer: Towards faster and milder reversible dimerization. Tetrahedron 2019, 75, 912–920. [Google Scholar] [CrossRef]
- Yong, Q.; Sun, B.; Zhang, F.-L. Palladium-catalyzed ortho-C(sp2) H bromination of benzaldehydes via a monodentate transient directing group strategy. Tetrahedron Letters 2019, 60, 151263. [Google Scholar] [CrossRef]
- Hou, J.; Li, Z.; Jia, X.-D.; Liu, Z.-Q. Bromination of Arenes Using I2O5-KBr in Water. Synthetic Communications 2013, 44, 181–187. [Google Scholar] [CrossRef]
- Chen, P.; Zhang, Q.-Q.; Guo, J.; Chen, L.-L.; Wang, Y.-B.; Zhang, X. An effective preparation of both 1,3-diketones and nitriles from alkynones with oximes as hydroxide sources. Organic & Biomolecular Chemistry 2018, 16, 8336–8344. [Google Scholar] [CrossRef] [PubMed]
- Baker, R.; Castro, J.L. Total synthesis of (+)-macbecin I. Journal of the Chemical Society, Perkin Transactions 1 1990, 47. [Google Scholar] [CrossRef]
- Brandt, G.E.L.; Blagg, B.S.J. Monoenomycin: A Simplified Trienomycin A Analogue That Manifests Anticancer Activity. ACS Medicinal Chemistry Letters 2011, 2, 735–740. [Google Scholar] [CrossRef] [PubMed]
- Schaefer, T.; Wildman, T.A.; Salman, S.R. The perpendicular conformation of 2-hydroxythiophenol. Intramolecular hydrogen bonding to a specific lone pair. Journal of the American Chemical Society 1980, 102, 107–110. [Google Scholar] [CrossRef]
- Schaefer, T.; McKinnon, D.M.; Sebastian, R.; Peeling, J.; Penner, G.H.; Veregin, R.P. Concerning lone-pair stereospecificity of intramolecular OH hydrogen bonds to oxygen and sulfur in solution. Canadian Journal of Chemistry 1987, 65, 908–914. [Google Scholar] [CrossRef]
- Schaefer, T.; Penner, G.H. Mechanisms of long-range 13C, 13C spin–spin coupling in thioanisole and its derivatives. Conformational applications. Canadian Journal of Chemistry 1988, 66, 1229–1238. [Google Scholar] [CrossRef]
- Goussard, V.; Duprat, F.; Gerbaud, V.; Ploix, J.-L.; Dreyfus, G.; Nardello-Rataj, V.; Aubry, J.-M. Predicting the Surface Tension of Liquids: Comparison of Four Modeling Approaches and Application to Cosmetic Oils. Journal of Chemical Information and Modeling 2017, 57, 2986–2995. [Google Scholar] [CrossRef] [PubMed]
- Goussard, V.; Duprat, F.; Ploix, J.-L.; Dreyfus, G.; Nardello-Rataj, V.; Aubry, J.-M. A New Machine-Learning Tool for Fast Estimation of Liquid Viscosity. Application to Cosmetic Oils. Journal of Chemical Information and Modeling 2020, 60, 2012–2023. [Google Scholar] [CrossRef] [PubMed]
- Duprat, F.; Ploix, J.-L.; Aubry, J.-M.; Gaudin, T. Fast and Accurate Prediction of Refractive Index of Organic Liquids with Graph Machines. Molecules 2023, 28, 6805. [Google Scholar] [CrossRef] [PubMed]
- Gupta, R.R.; Lechner, B.; Mikhova, B. NMR Data for Carbon-13: Aromatic Compounds; Gupta, R.R., Lechner, M.D., Eds.; Springer-Verlag: Berlin Heidelberg, 2005; Volume III. [Google Scholar]
- Dioury, F.; Duprat, A.; Dreyfus, G.; Ferroud, C.; Cossy, J. QSPR Prediction of the Stability Constants of Gadolinium(III) Complexes for Magnetic Resonance Imaging. Journal of Chemical Information and Modeling 2014, 54, 2718–2731. [Google Scholar] [CrossRef] [PubMed]
- Goulon, A.; Picot, T.; Duprat, A.; Dreyfus, G. Predicting activities without computing descriptors: graph machines for QSAR. SAR and QSAR in Environmental Research 2007, 18, 141–153. [Google Scholar] [CrossRef] [PubMed]
- Daylight Chemical Information Systems. Daylight Theory Manual. Available online: https://www.daylight.com/dayhtml/doc/theory/ (accessed on 2024).
- Dreyfus, G. Neural Networks: Methodology and Applications; Springer: Berlin ; New York, 2005; p. 497.
- Monari, G.; Dreyfus, G. Local Overfitting Control via Leverages. Neural Computation 2002, 14, 1481–1506. [Google Scholar] [CrossRef] [PubMed]
Figure 1.
13C spectrum of 2-methoxytoluene recorded at 101 MHz in a CDCl3 solution; carbon chemical shift values are in ppm.
Figure 1.
13C spectrum of 2-methoxytoluene recorded at 101 MHz in a CDCl3 solution; carbon chemical shift values are in ppm.
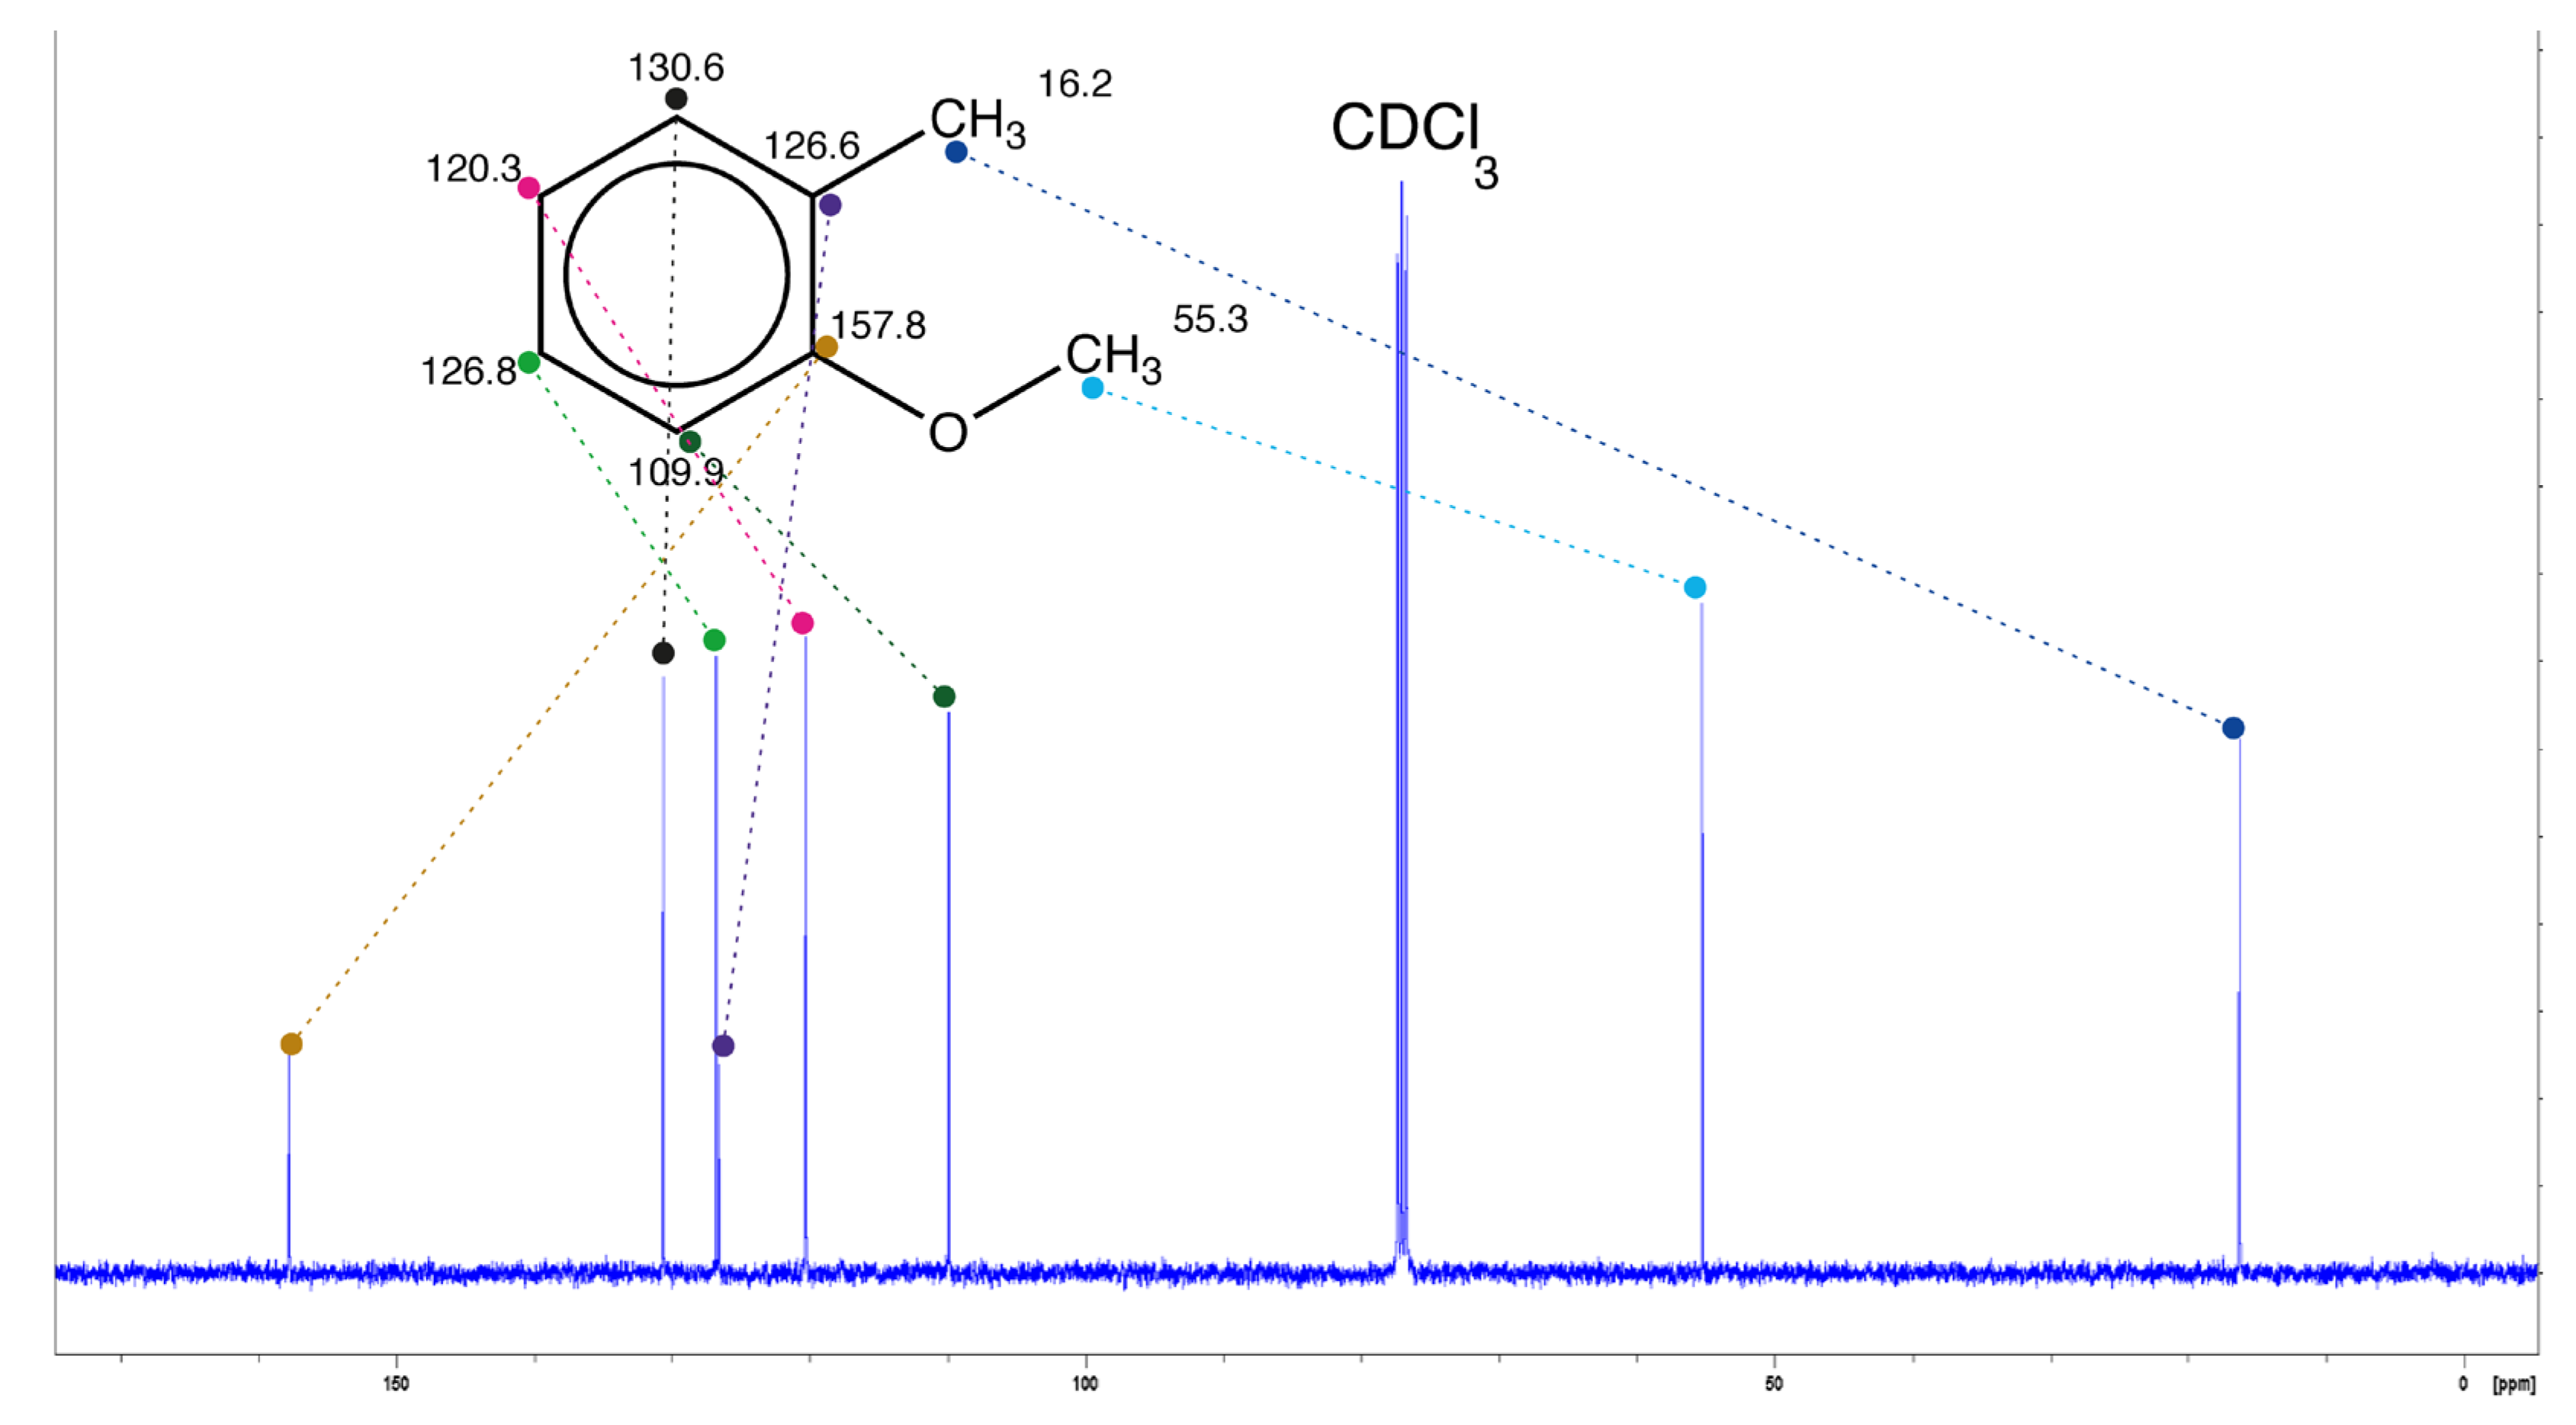
Figure 2.
Scatter plot of 13C chemical shift estimations computed by graph machine from SMILES (node function with 26 hidden neurons) for the 1637 compounds of the training set (black filled circle) and the 114 compounds of the test set (red filled circle) vs measured values of the chemical shift. The black line is the bisector of the plot.
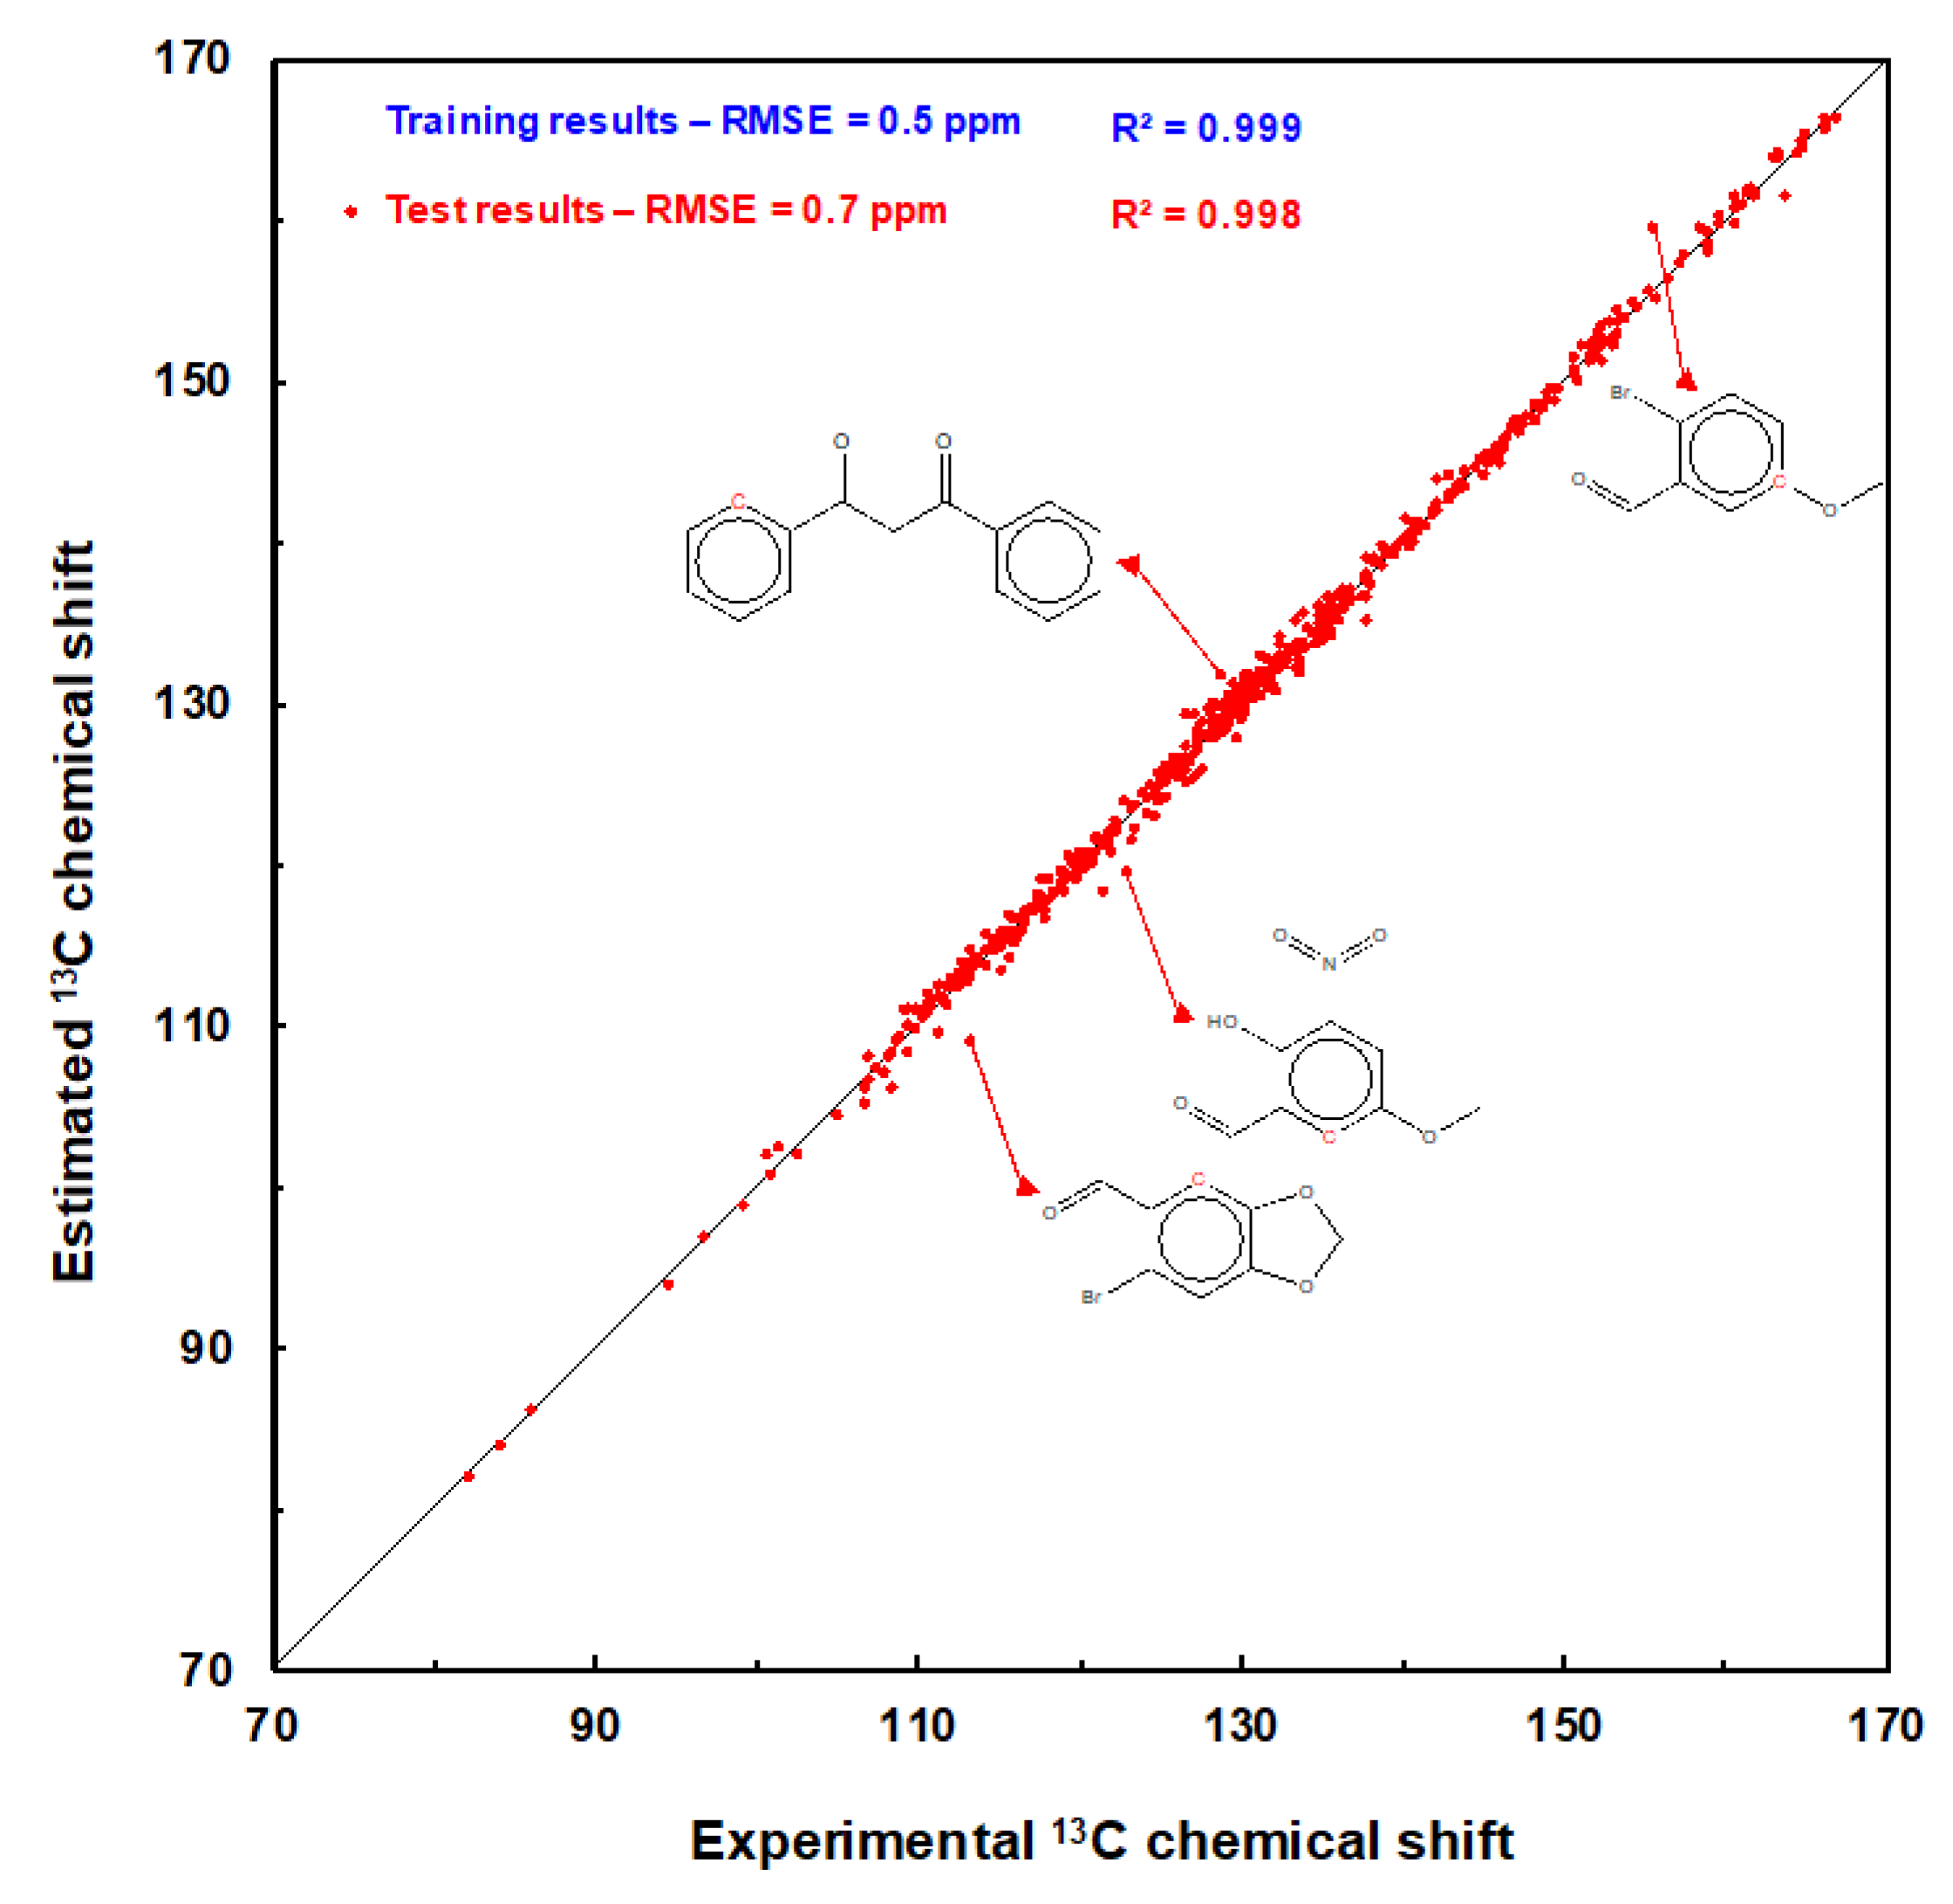
Figure 3.
Structure of training set molecules with at least one carbon whose shift estimation with the GM26 model shows an absolute deviation greater than 3 ppm. Experimental and estimated chemical shifts values ( and in ppm) are for carbon atoms shown in red and blue.
Figure 3.
Structure of training set molecules with at least one carbon whose shift estimation with the GM26 model shows an absolute deviation greater than 3 ppm. Experimental and estimated chemical shifts values ( and in ppm) are for carbon atoms shown in red and blue.
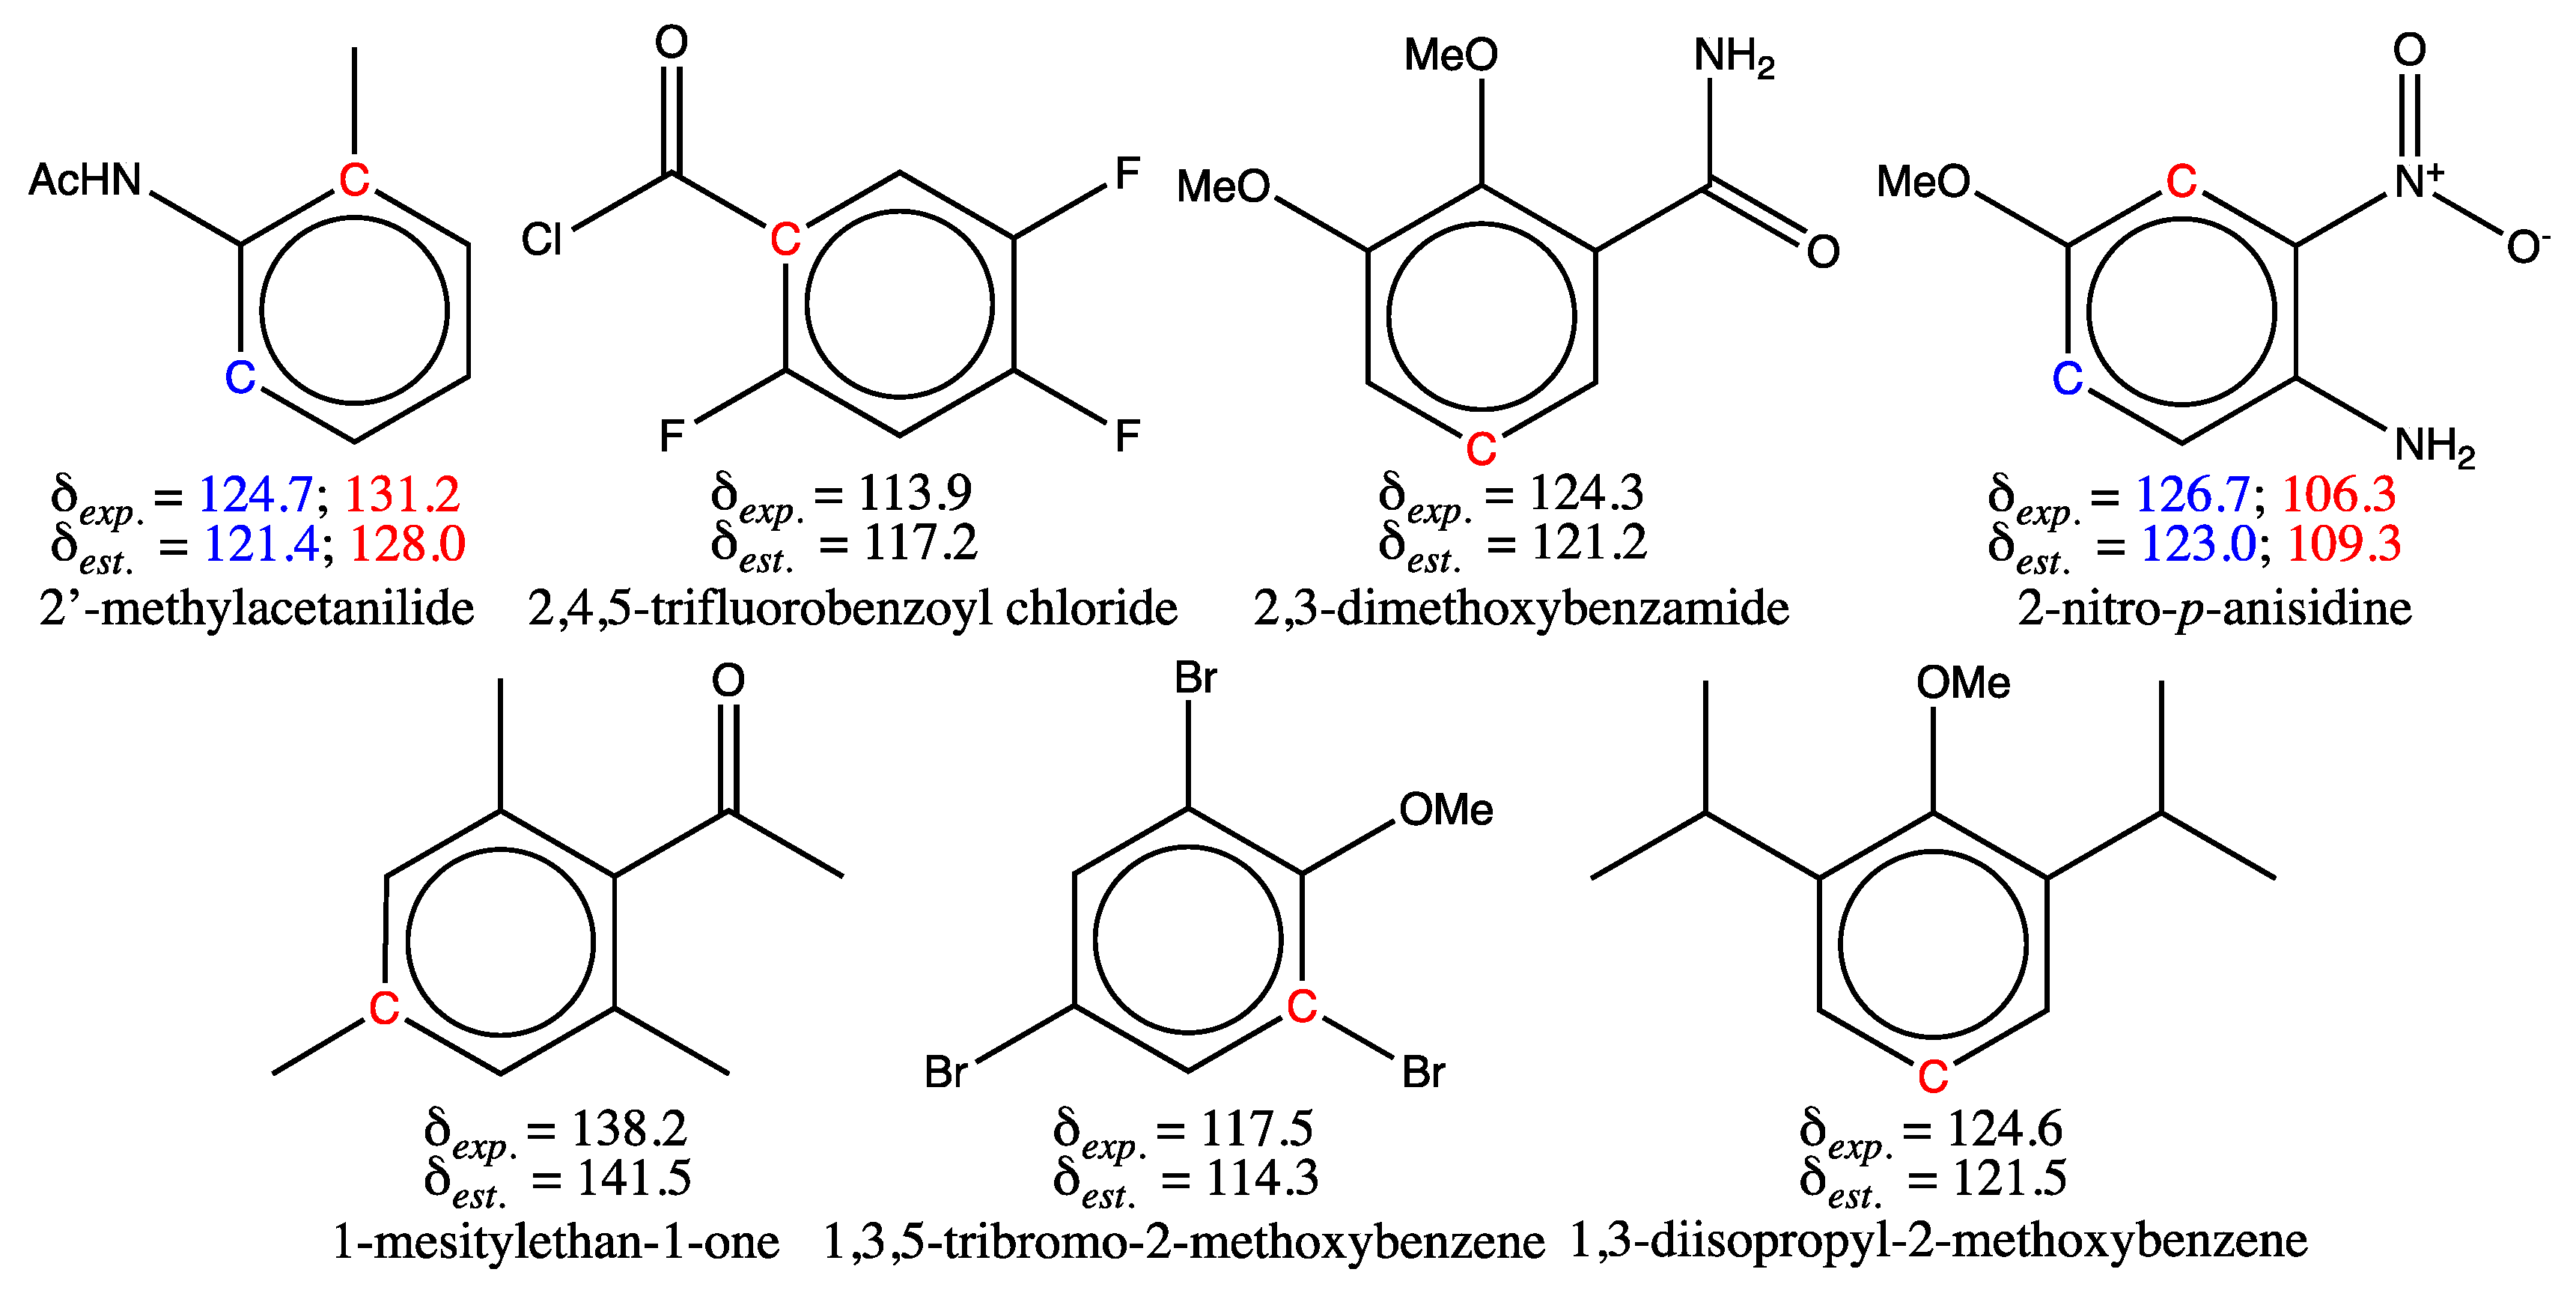
Figure 4.
Comparison of extrapolated chemical shift values for carbons 5 and 6 of 2,3-dimethoxybenzamide, computed from experimental values for relevant shifts of 2-methoxybenzamide, with their measured values. Experimental, estimated and extrapolated (in red) chemical shifts values (, and in ppm) refer to numbered carbon atoms.
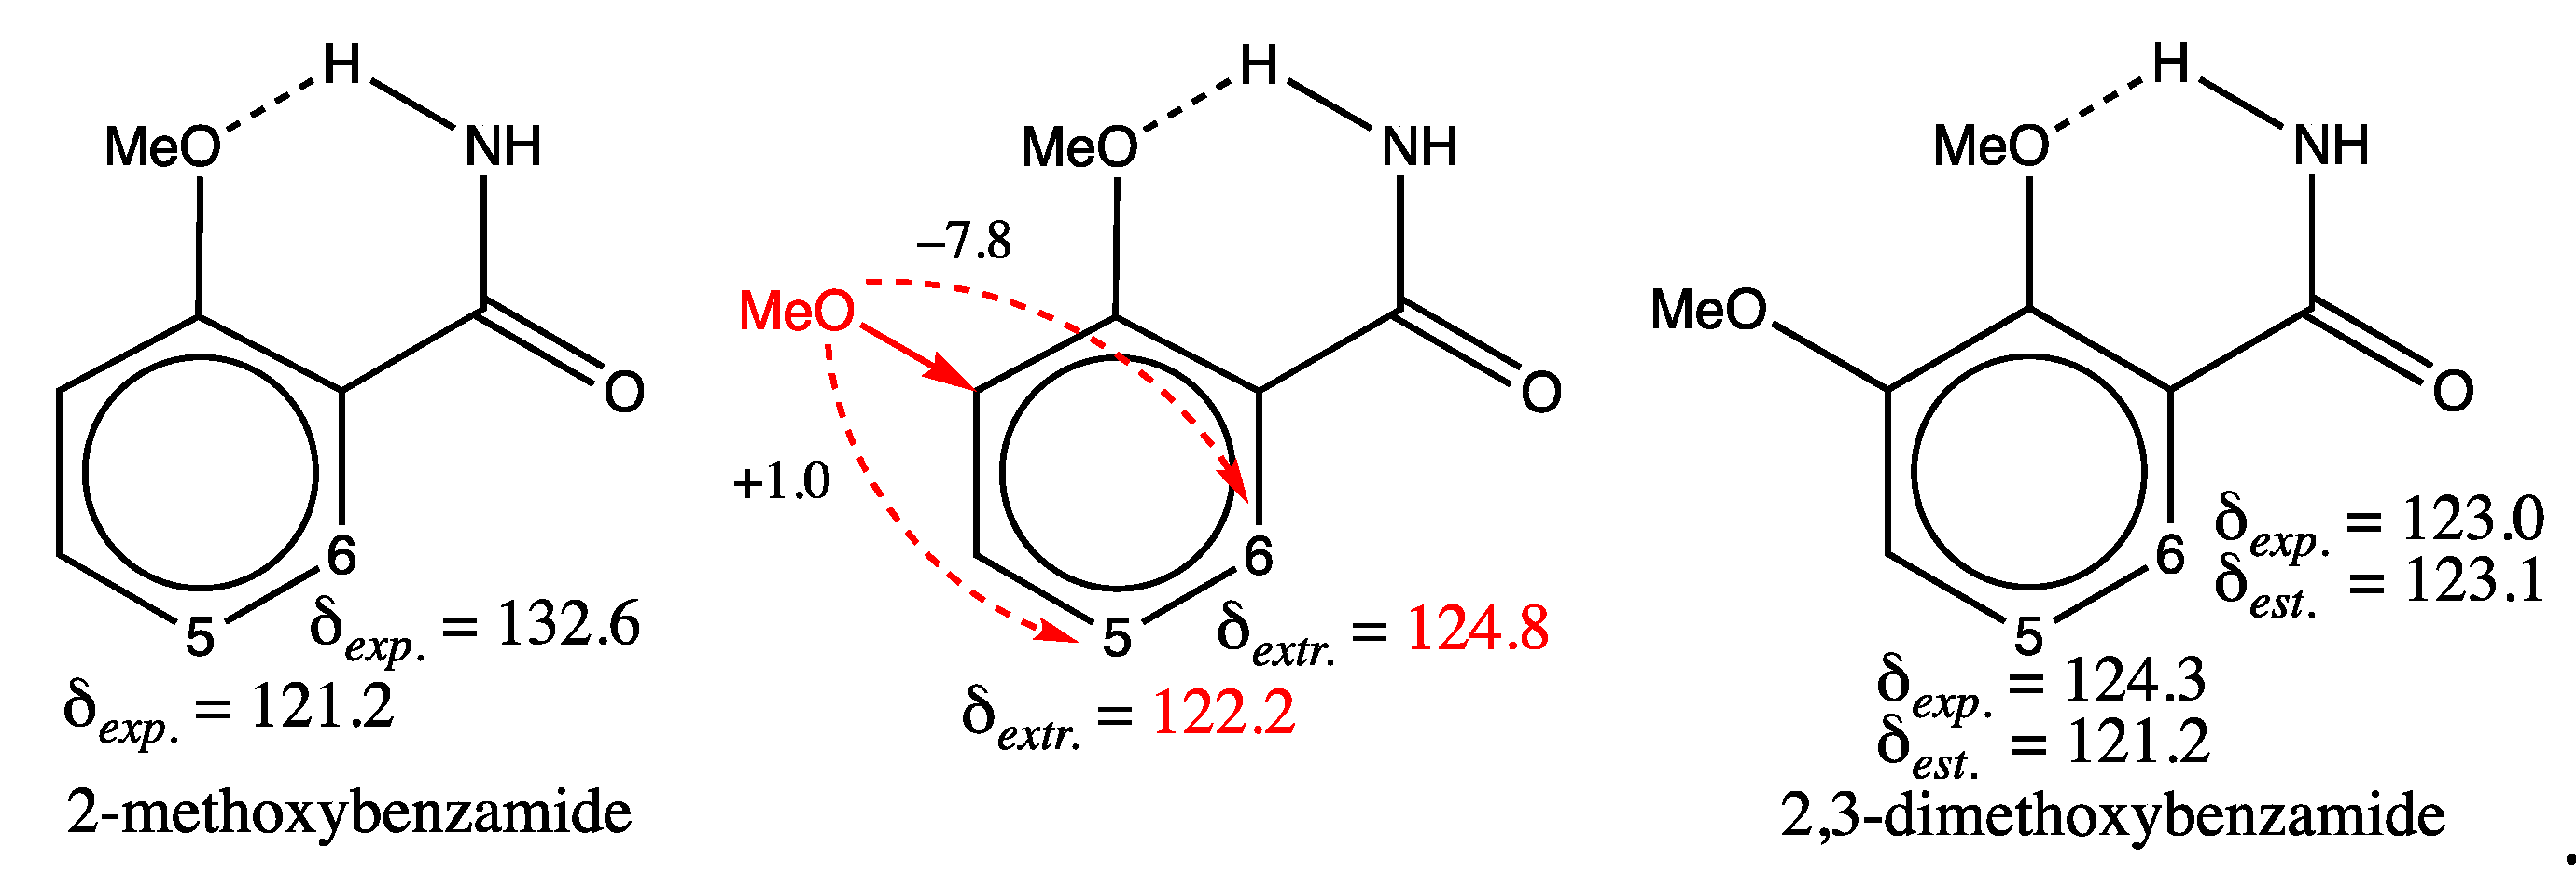
Figure 5.
Comparison of extrapolated chemical shift values for carbons 3 and 5 of 2-nitro-p-anisidine, calculated from experimental values for relevant carbon shifts of 2-nitroaniline (①), p-anisidine (②) and 3-nitroanisole (③) with their measured values. Experimental, estimated and extrapolated chemical shifts values (, and in ppm) refer to numbered carbon atoms.
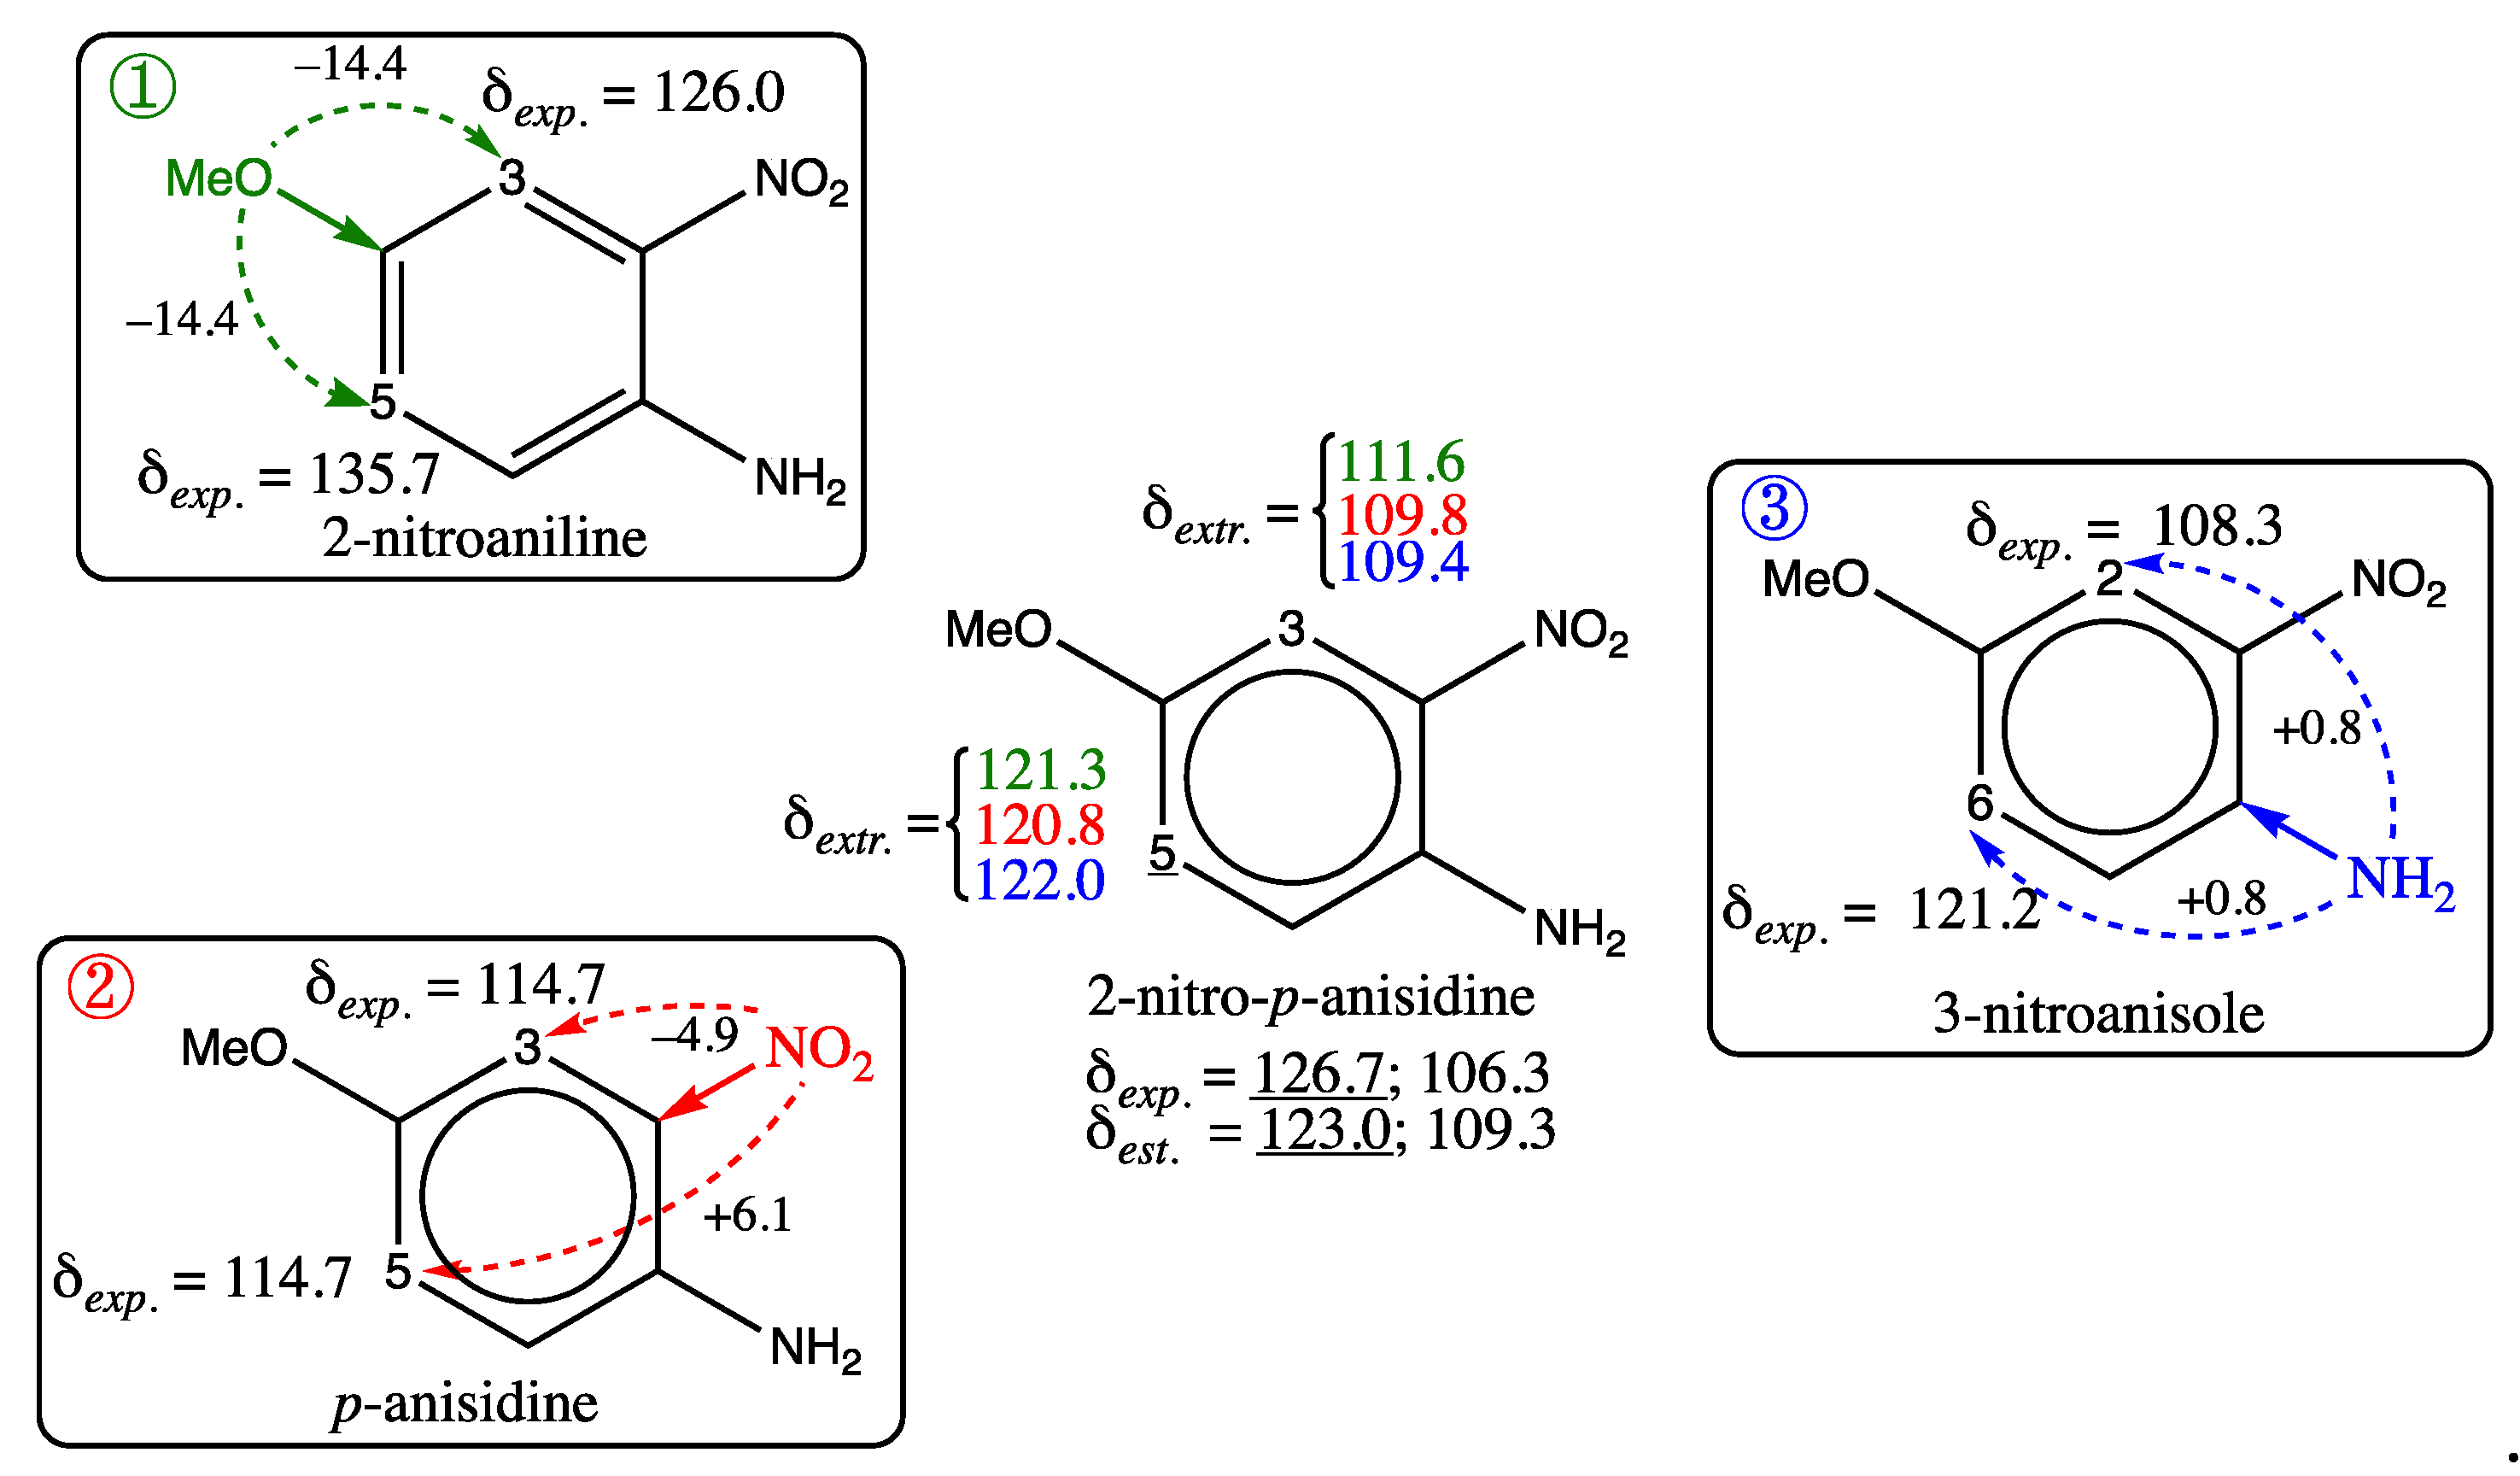
Figure 6.
Structure of the test set molecules possessing at least one carbon whose shift prediction with the GM26 model has an absolute deviation greater than 3 ppm. Experimental and predicted chemical shifts ( and in ppm) are for carbon atoms shown in color.
Figure 6.
Structure of the test set molecules possessing at least one carbon whose shift prediction with the GM26 model has an absolute deviation greater than 3 ppm. Experimental and predicted chemical shifts ( and in ppm) are for carbon atoms shown in color.
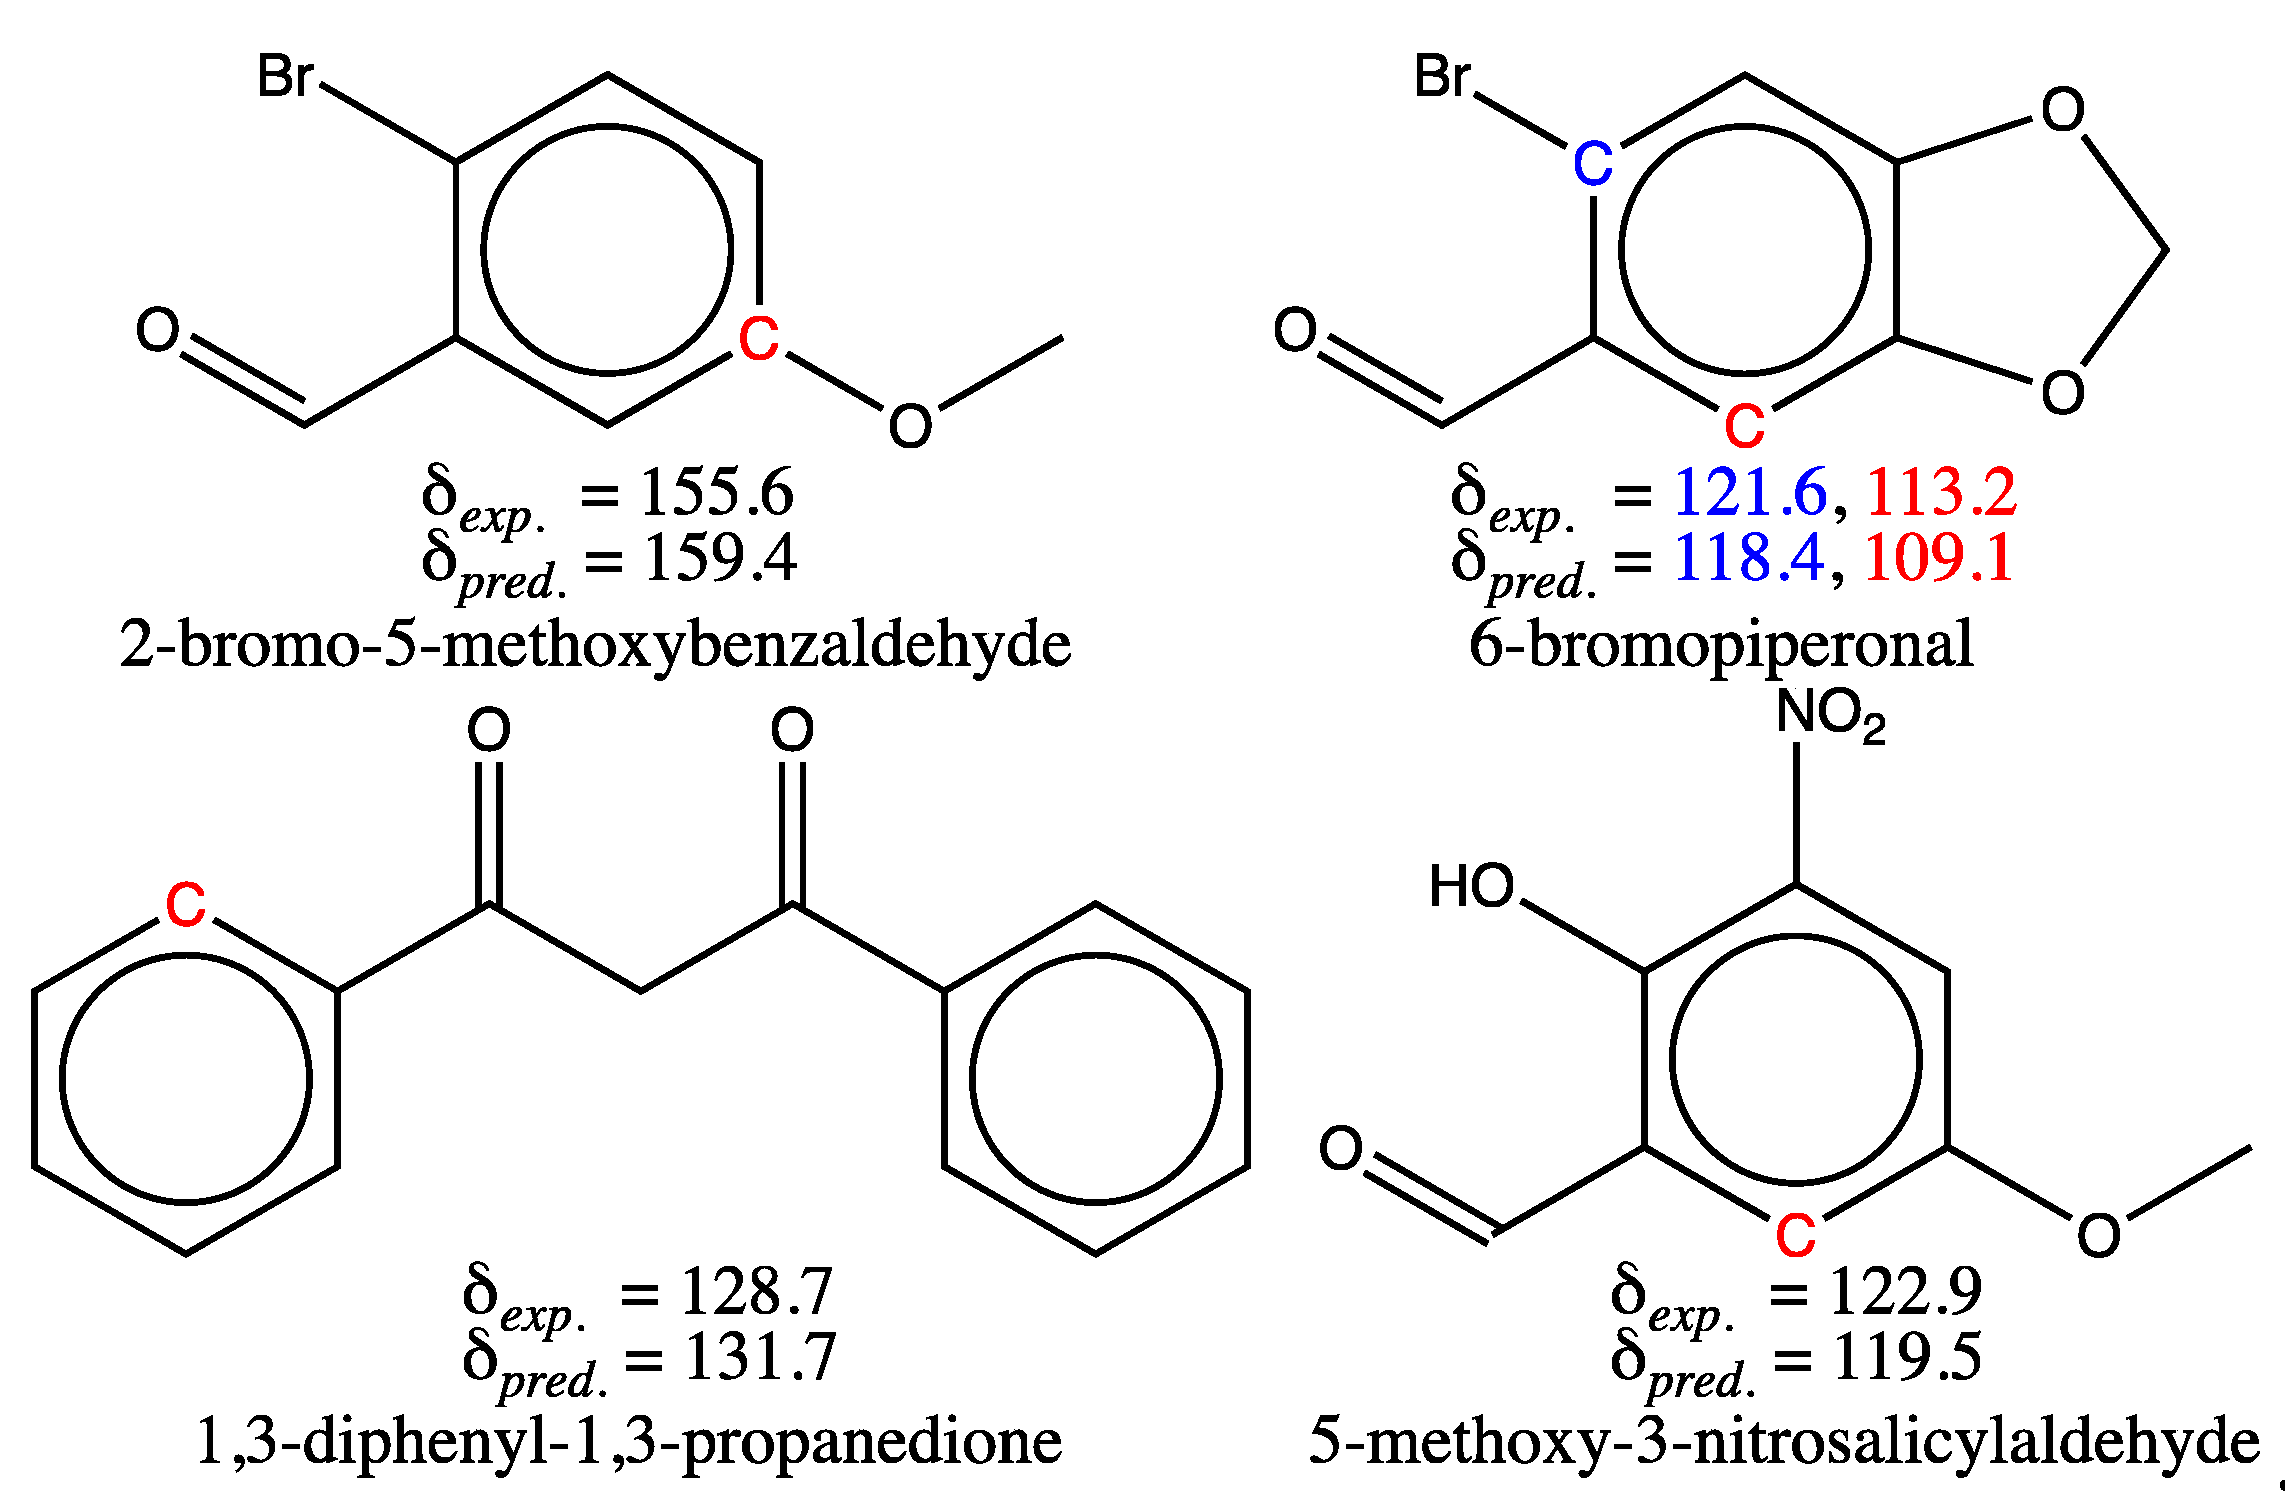
Figure 7.
Structures of: major enol form of 1,3-diphenyl-1,3-propanedione with a stabilizing H-bond, 5-methoxy-3-nitrosalicylaldehyde with an intramolecular H-bond and 3-methoxy-5-nitrobenzaldehyde; the carbon atoms mapped for the enol structure, e.g. 1 and 1’, are those that are equivalent in the NMR spectrum; the carbons shown in red are those whose chemical shift is difficult to predict.
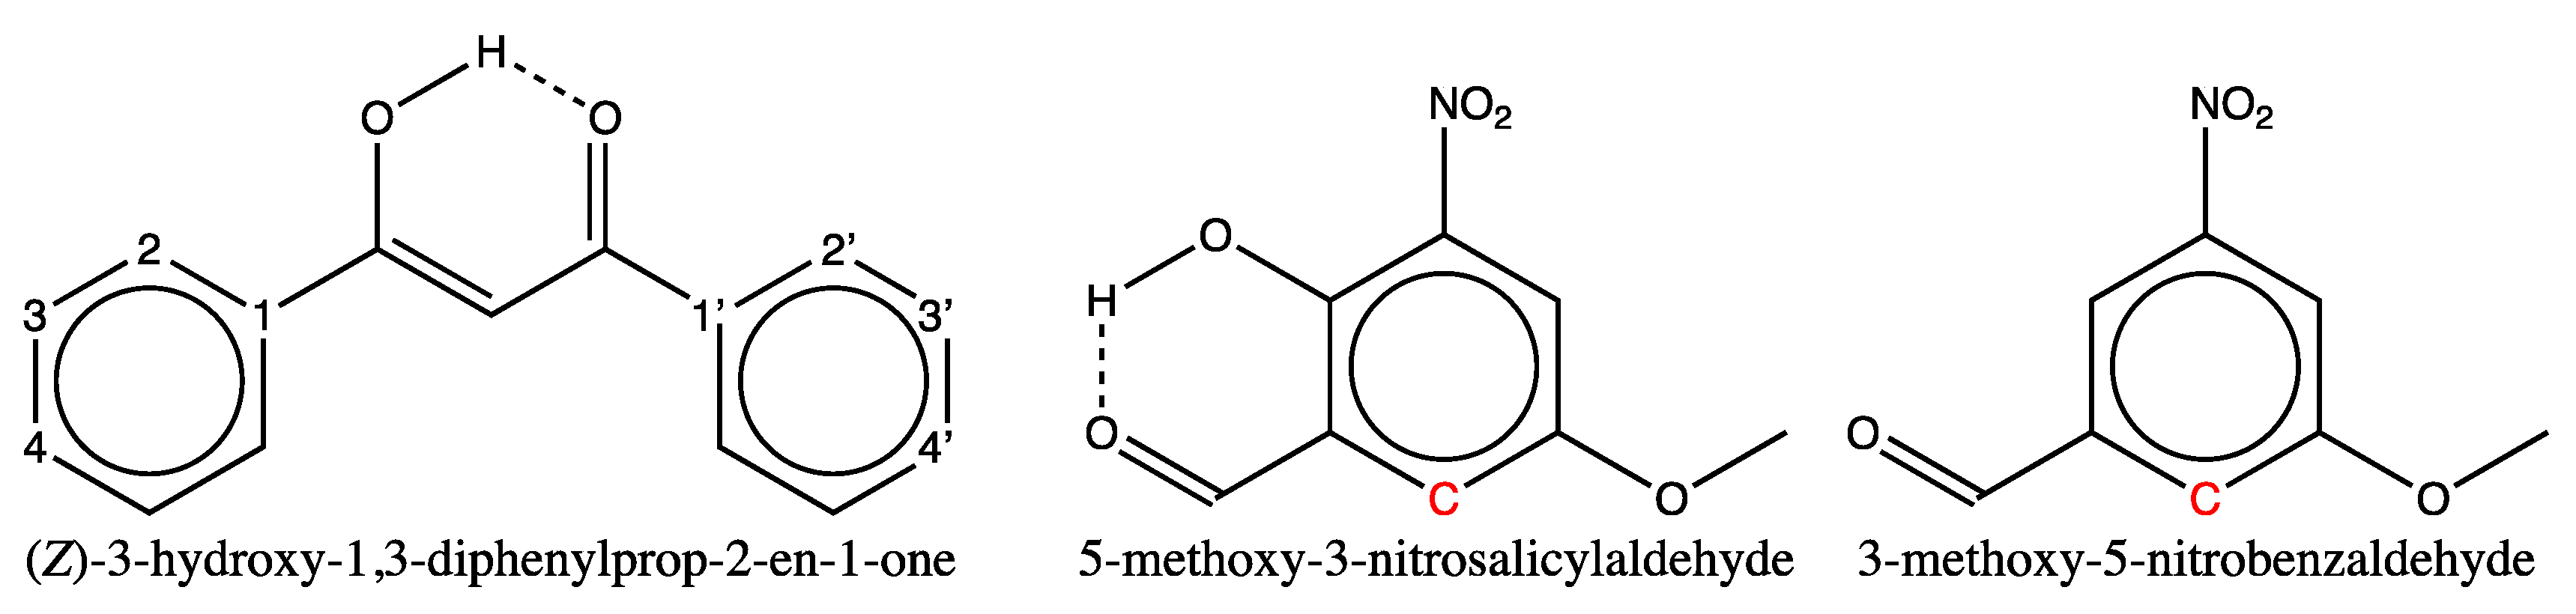
Figure 8.
Scatter plot of 13C chemical shift predictions computed by graph machines (red disks) and MestReNova software (blue disks) vs. measured shift values for the 171 molecules of the test set. The black line is the bisector of the plot, and the dash red and blue lines are the regression lines for the GM and MestReNova plots.
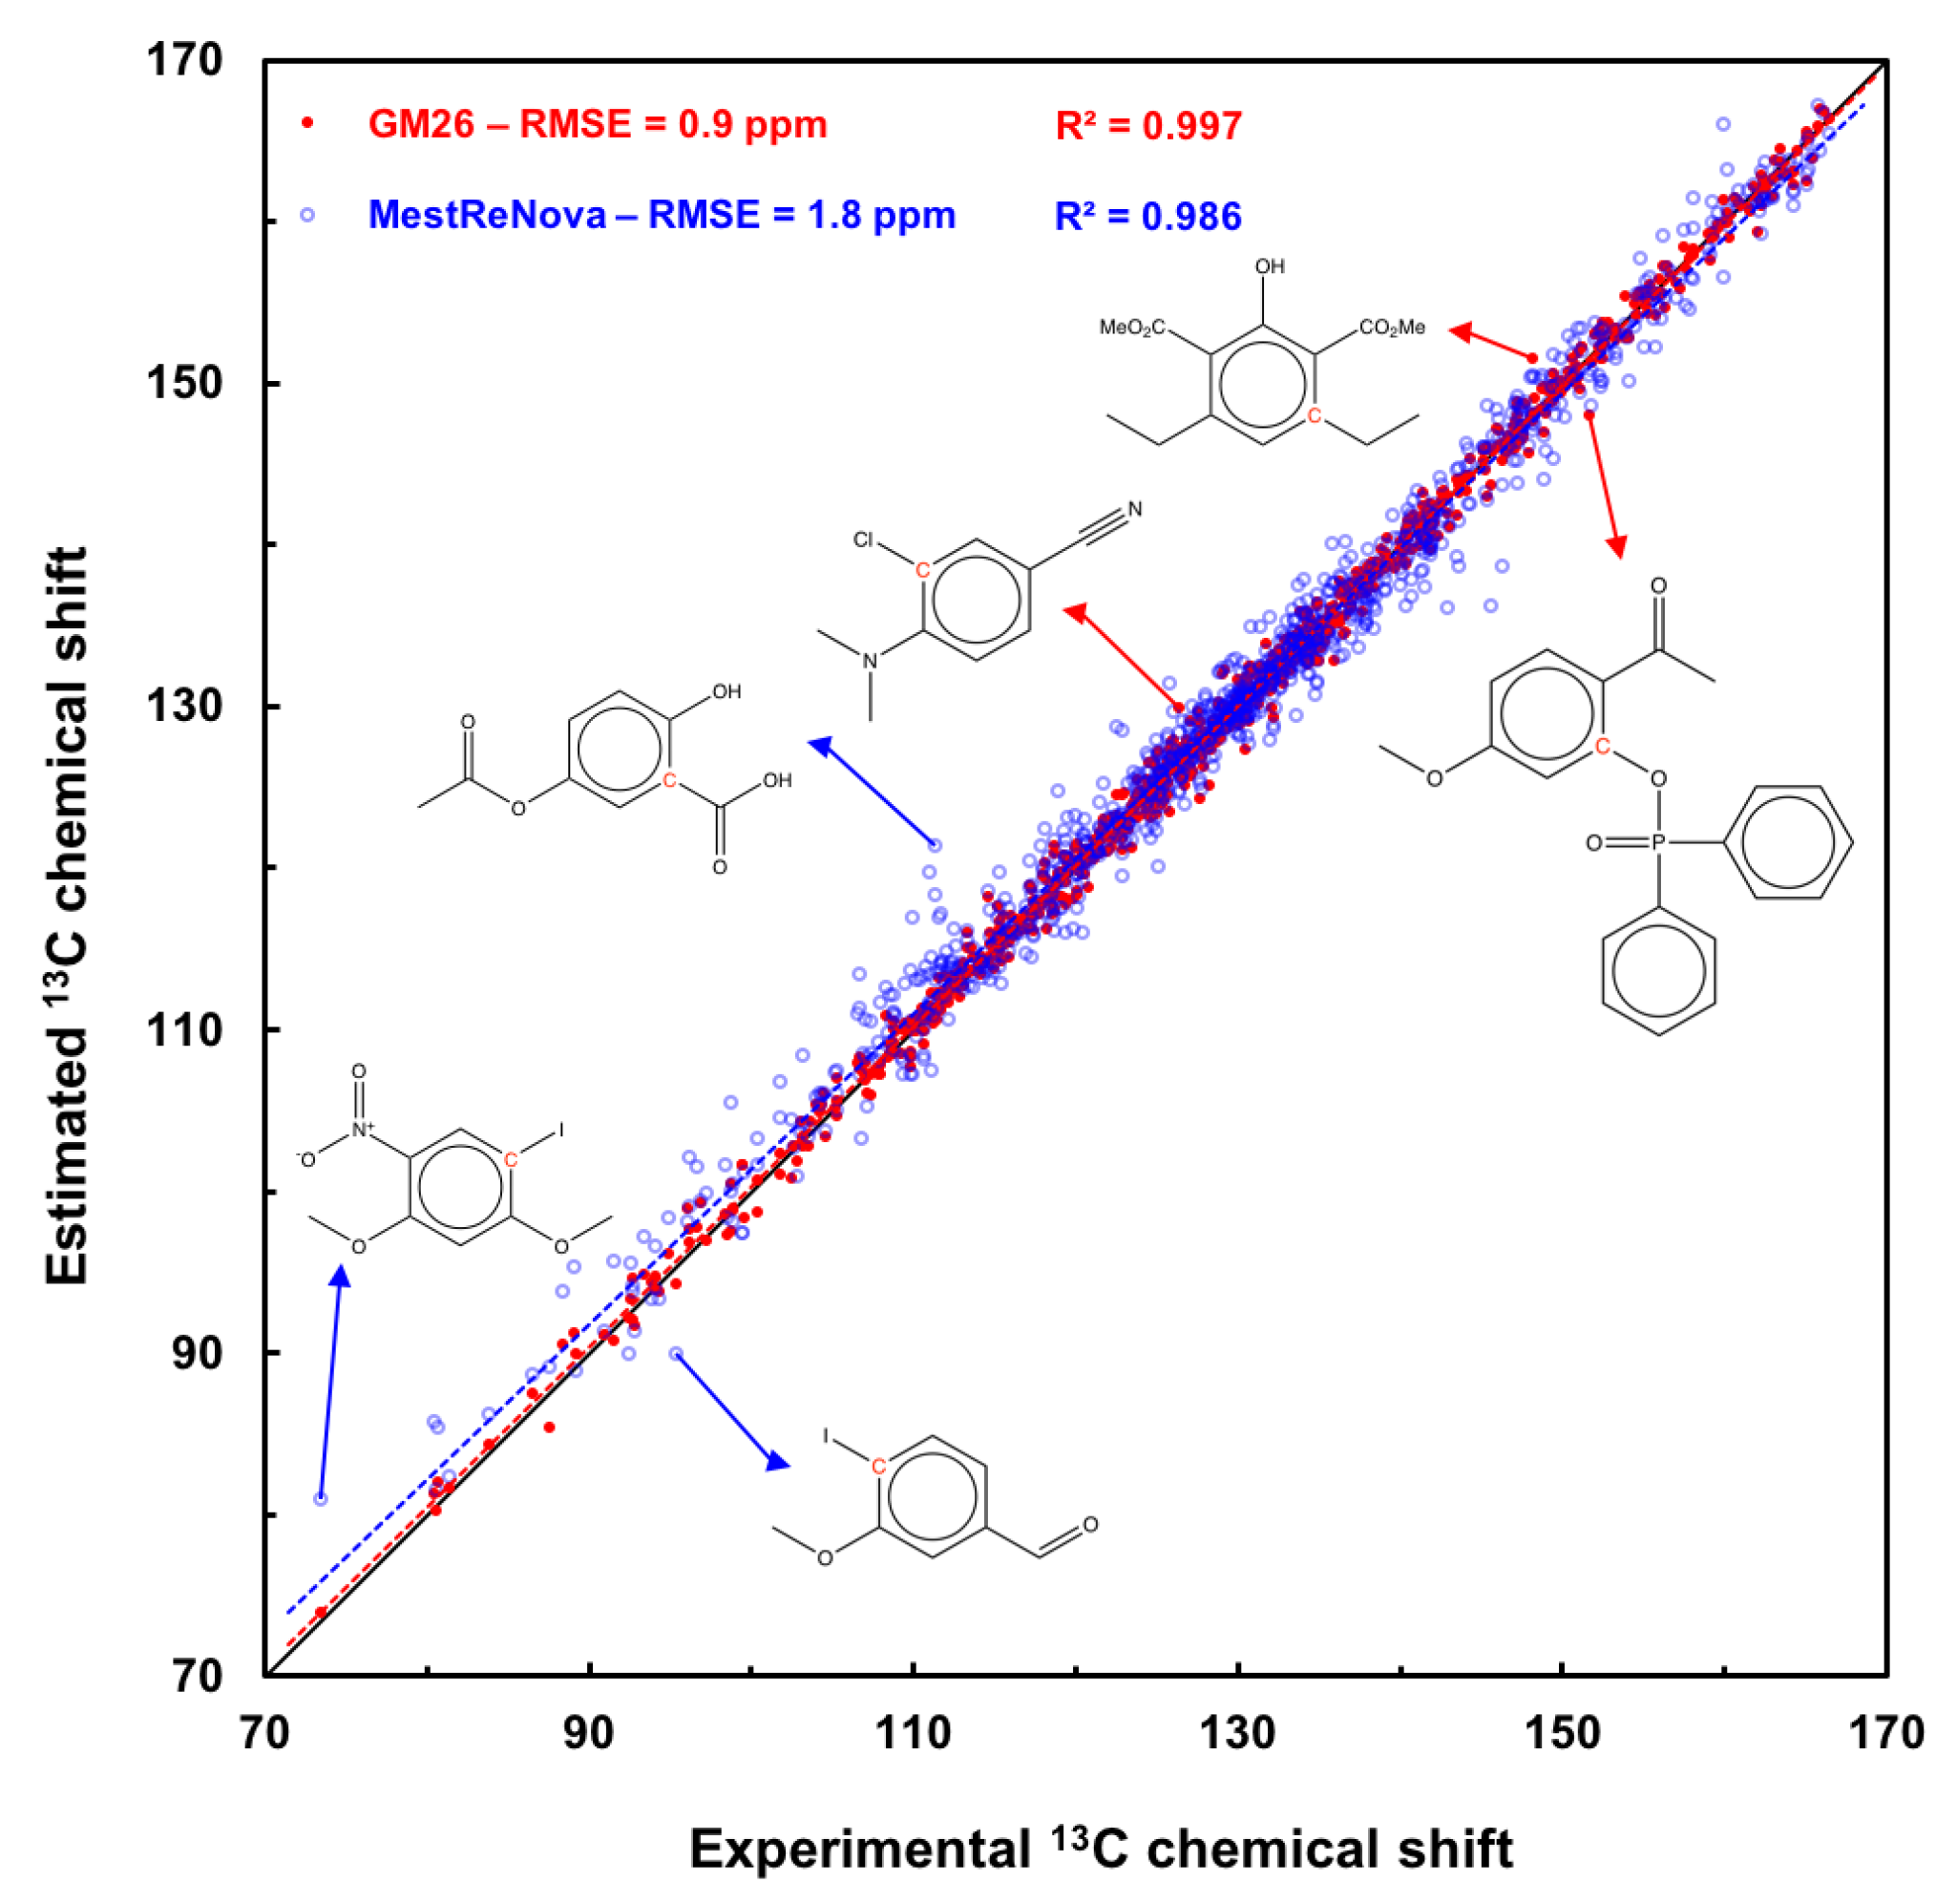
Figure 9.
Structure of training* or test† set molecules with at least one carbon whose shift estimation with the GM26 model shows a large deviation (experimental minus estimated, in ppm); shifts for blue carbon are underestimated, while they are overestimated for red carbons.
Figure 9.
Structure of training* or test† set molecules with at least one carbon whose shift estimation with the GM26 model shows a large deviation (experimental minus estimated, in ppm); shifts for blue carbon are underestimated, while they are overestimated for red carbons.
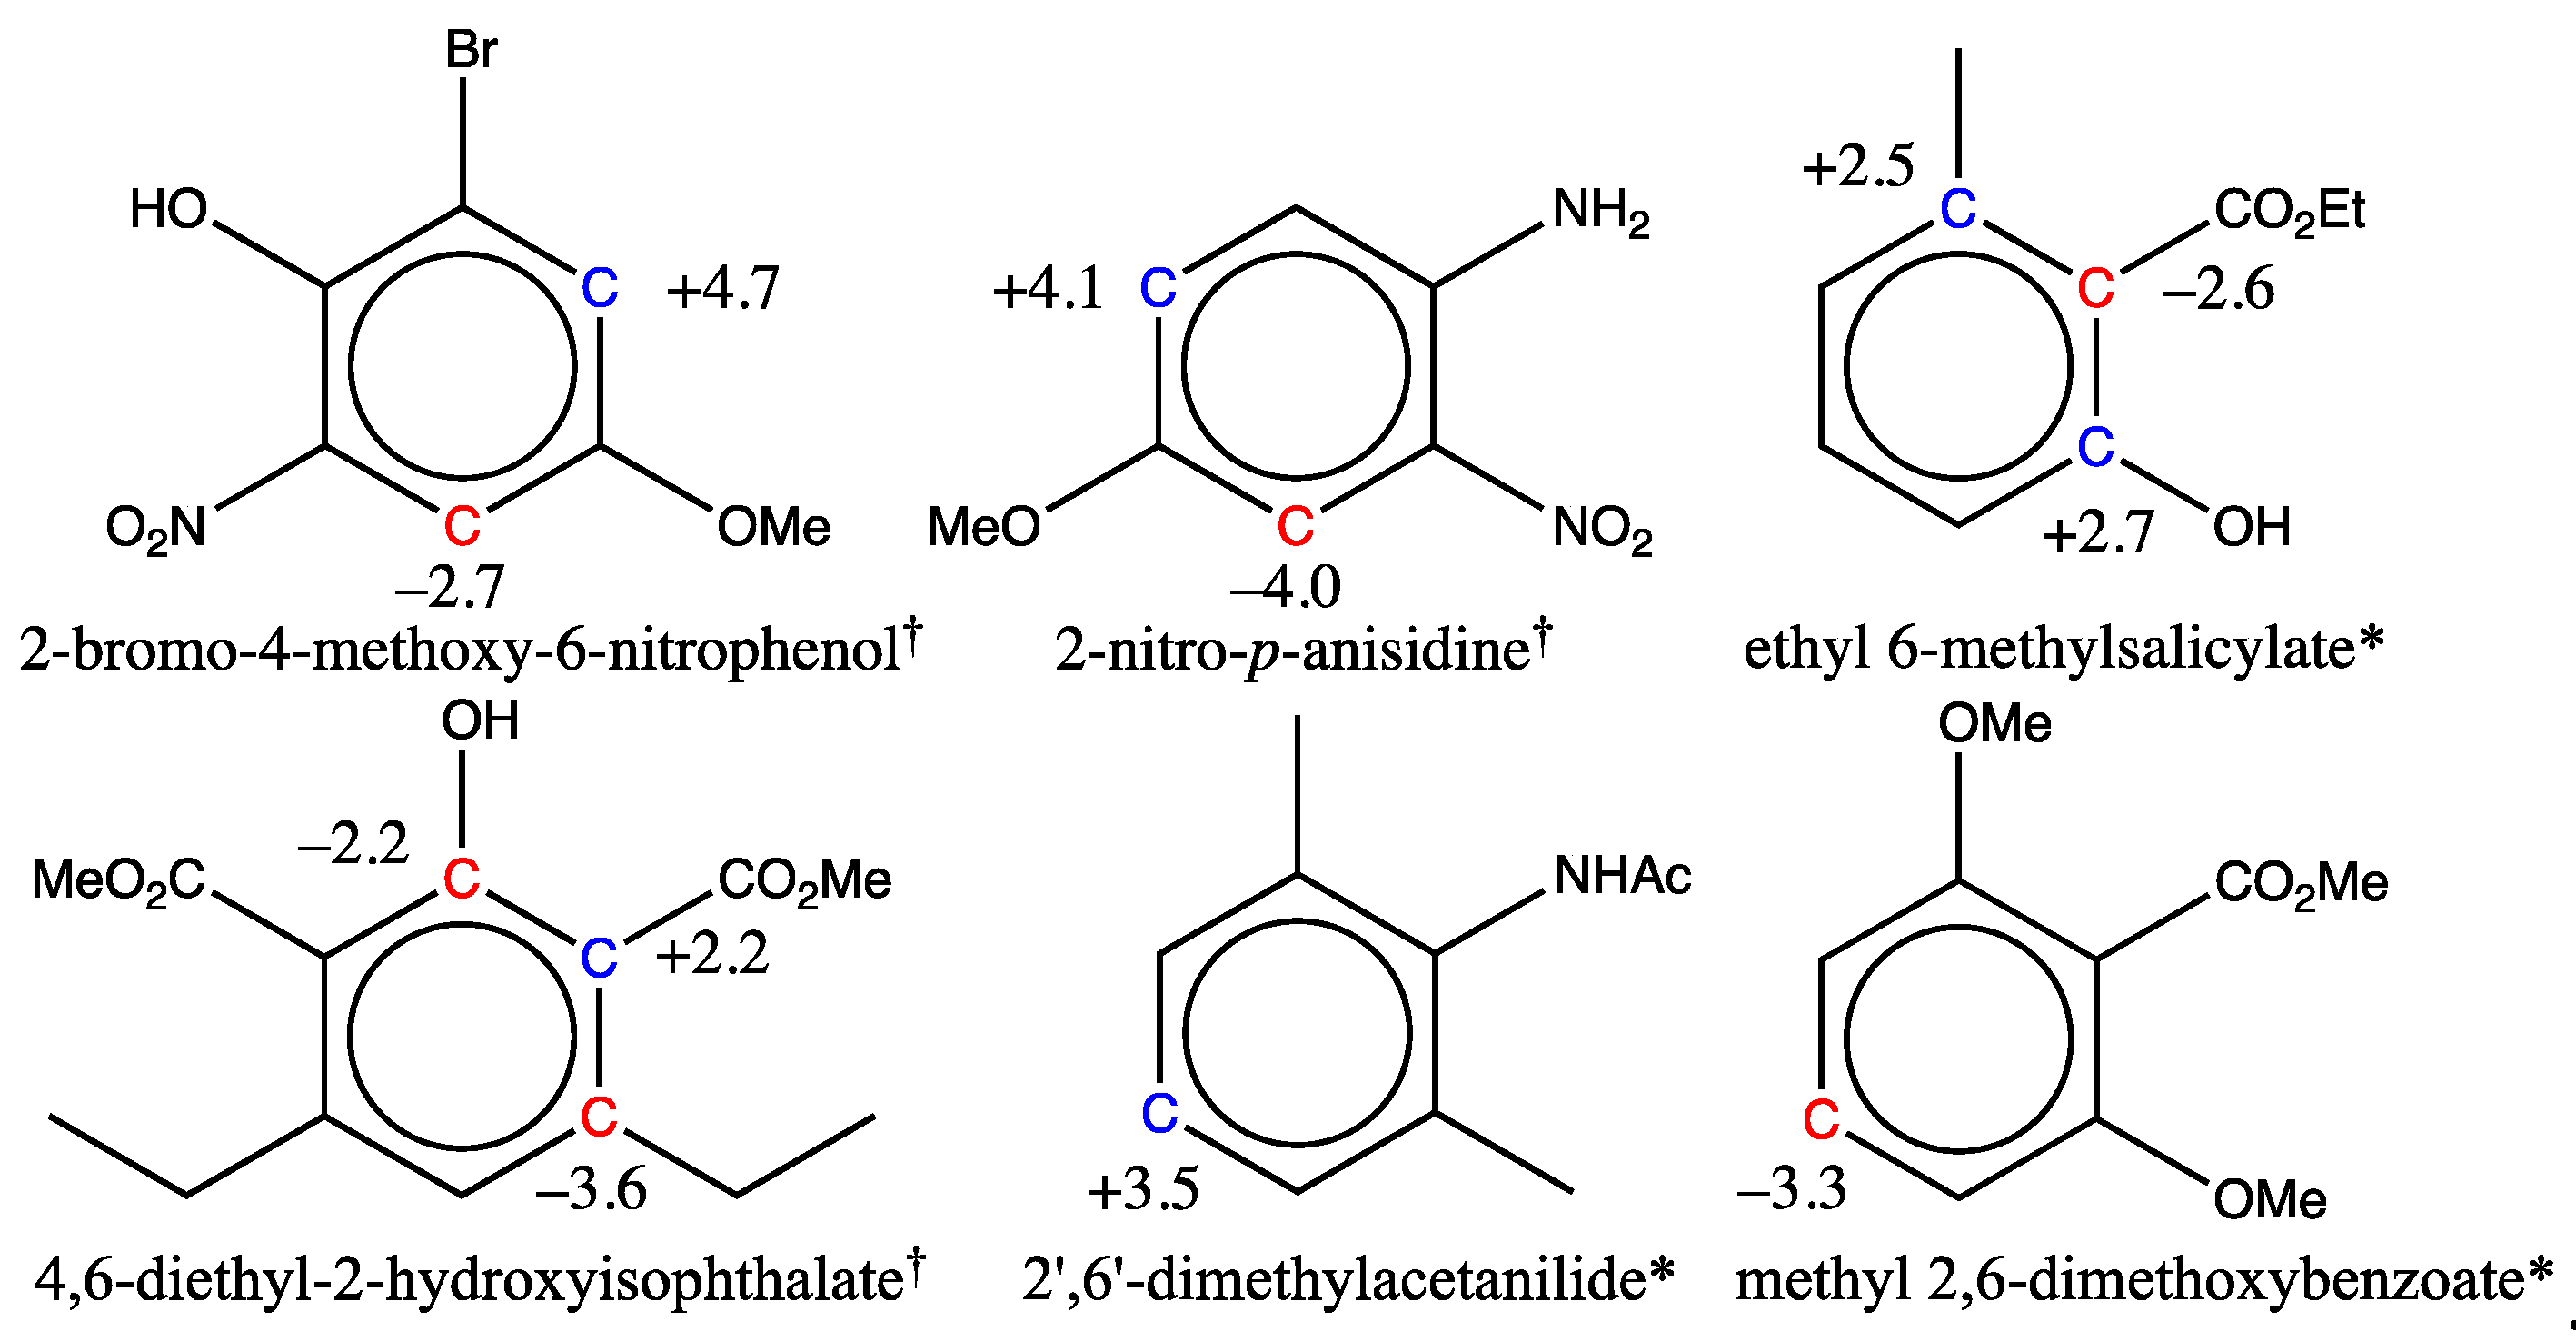
Figure 10.
Deviations encountered in the prediction of carbon shifts of three molecules outside the scope of the GM26 model (experimental minus estimated, in ppm); shifts for blue carbon are underestimated, while they are overestimated for red carbons.
Figure 10.
Deviations encountered in the prediction of carbon shifts of three molecules outside the scope of the GM26 model (experimental minus estimated, in ppm); shifts for blue carbon are underestimated, while they are overestimated for red carbons.
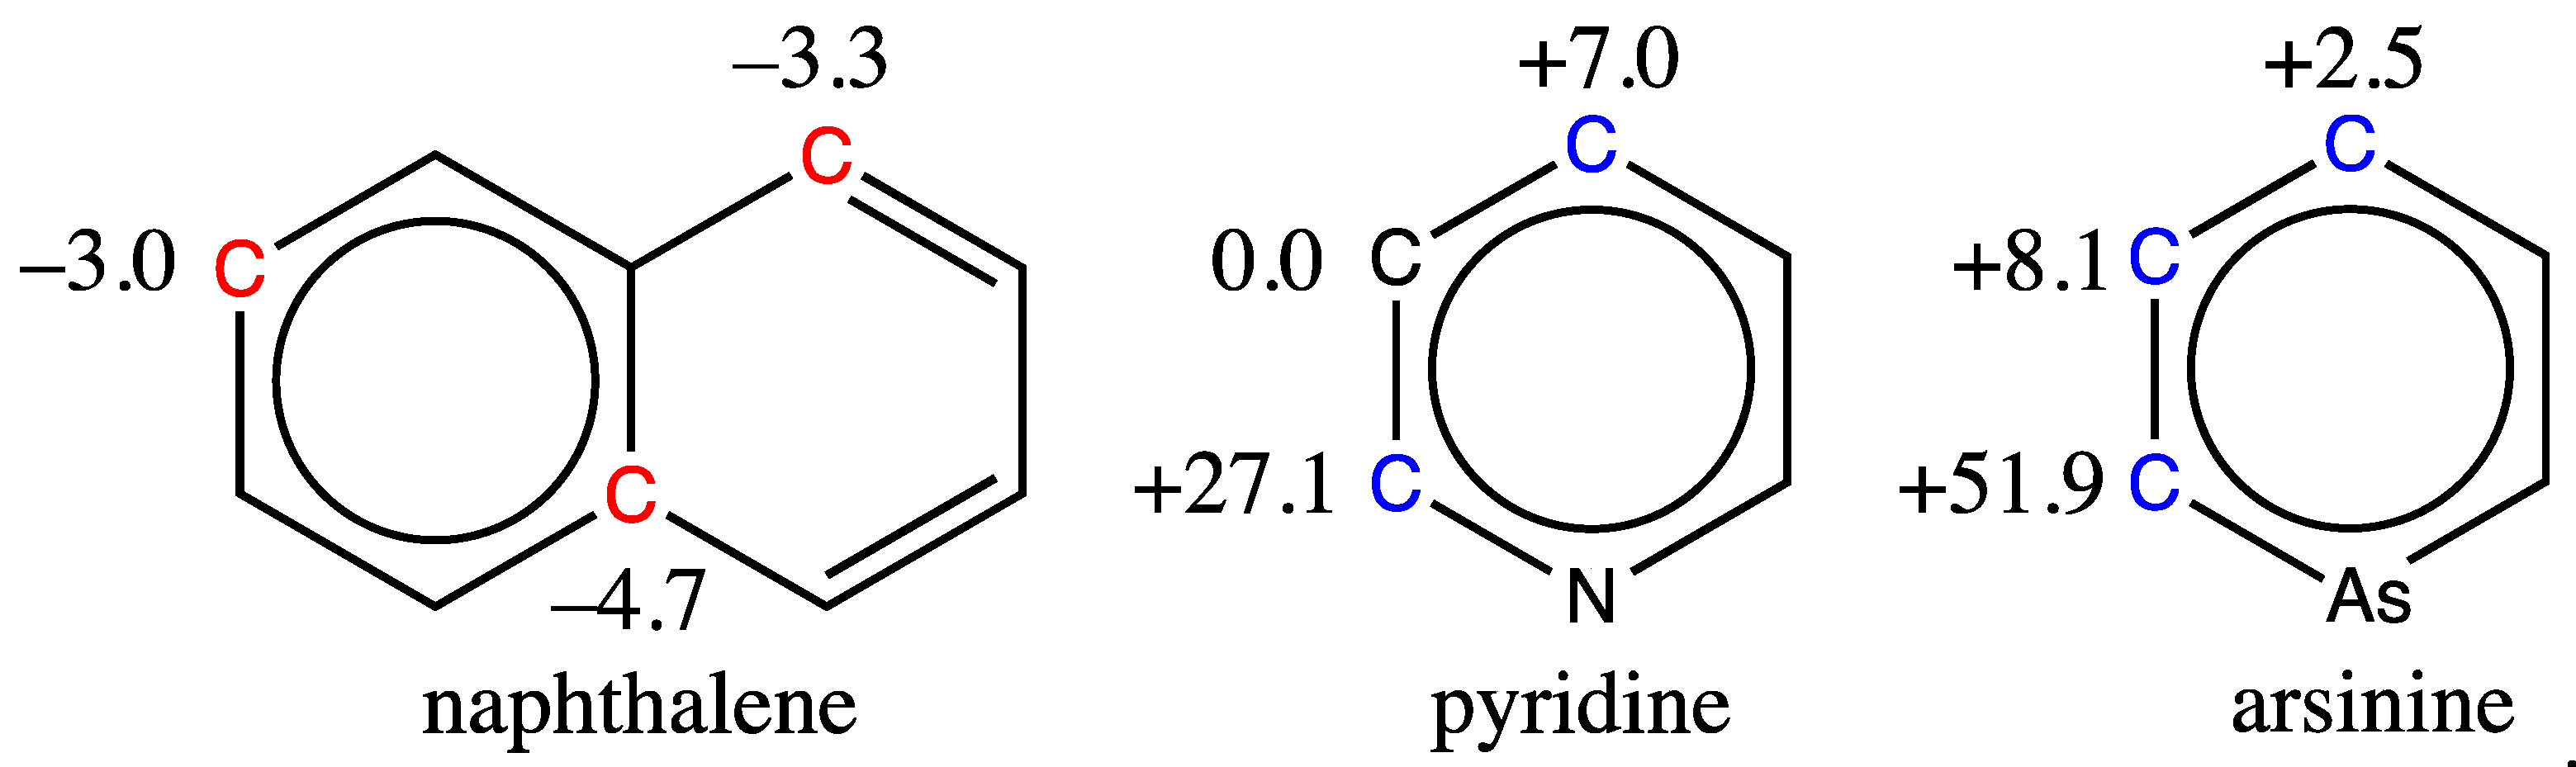
Figure 11.
Graph machine construction process for two carbons of 2-methoxytoluene: (ⓐ) conversion of the 2D-structure of 2-methoxytoluene into a cyclic graph, (ⓑ) construction of the two directed acyclic graphs for the carbons marked in red and (ⓒ) generation of the corresponding graph machines.
Figure 11.
Graph machine construction process for two carbons of 2-methoxytoluene: (ⓐ) conversion of the 2D-structure of 2-methoxytoluene into a cyclic graph, (ⓑ) construction of the two directed acyclic graphs for the carbons marked in red and (ⓒ) generation of the corresponding graph machines.
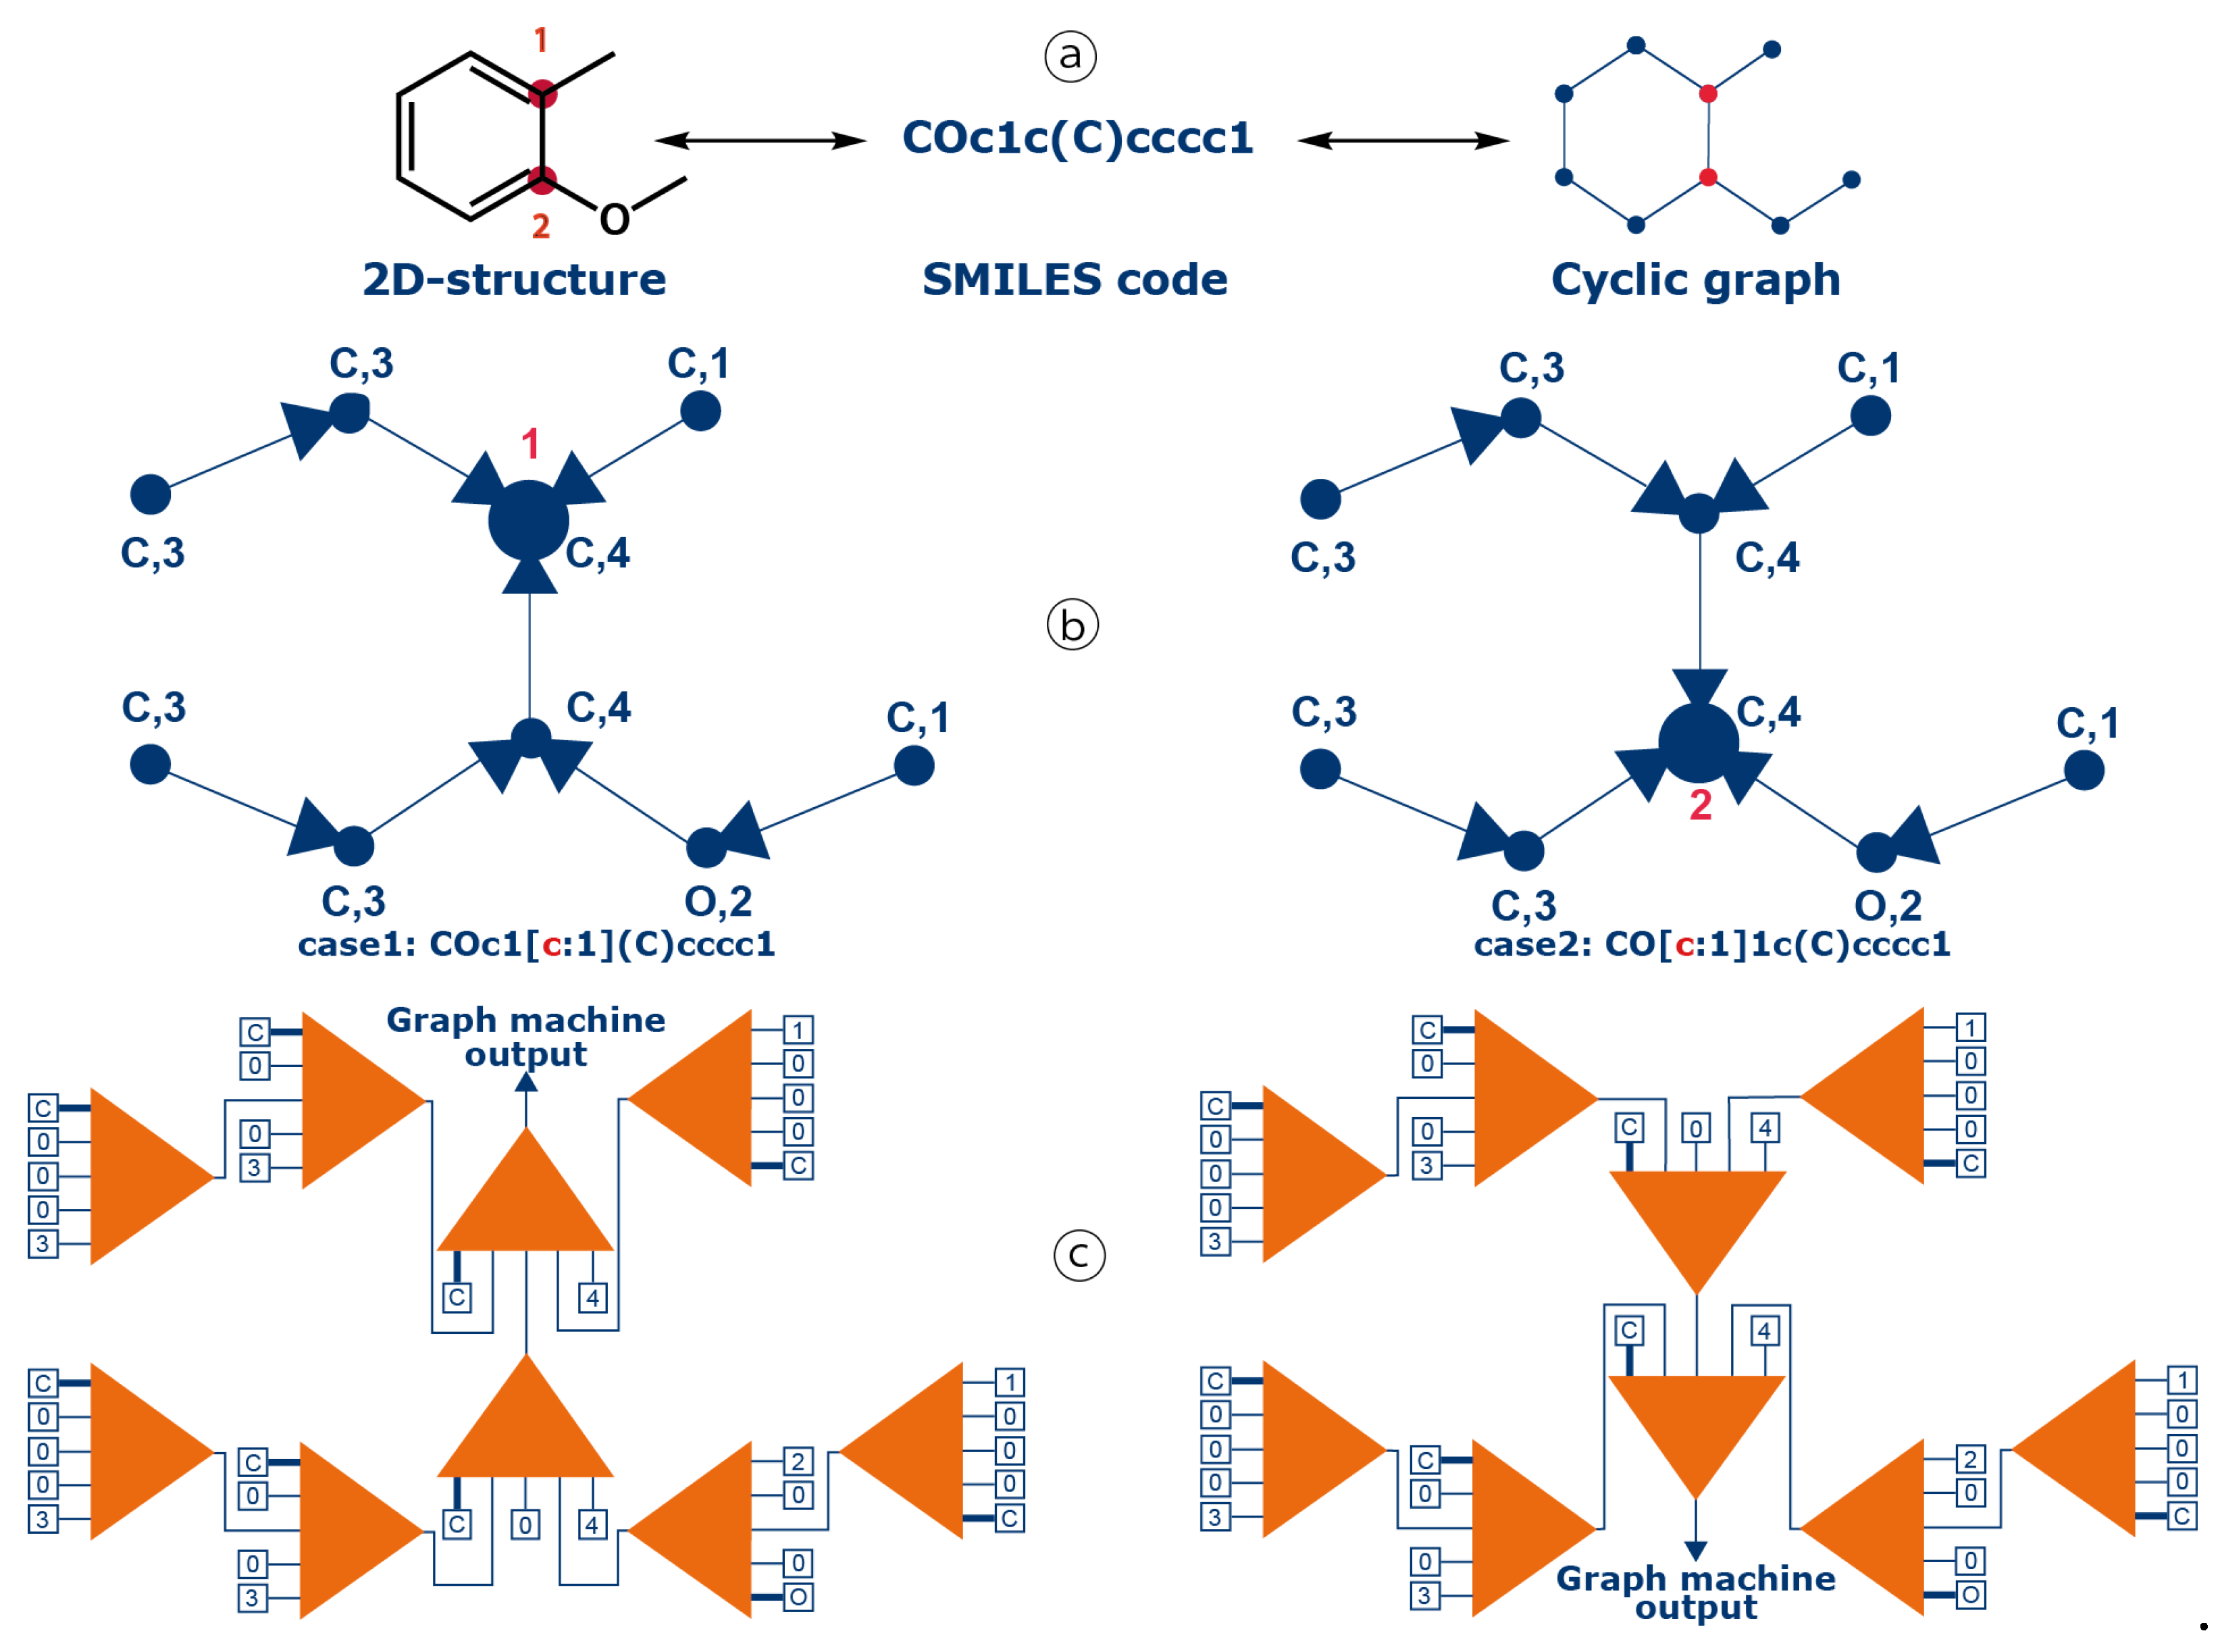
Figure 12.
Distribution of functional carbons (as percentages) for the molecules of the training (blue bars) and test (bistre-coloured bars) sets.
Figure 12.
Distribution of functional carbons (as percentages) for the molecules of the training (blue bars) and test (bistre-coloured bars) sets.
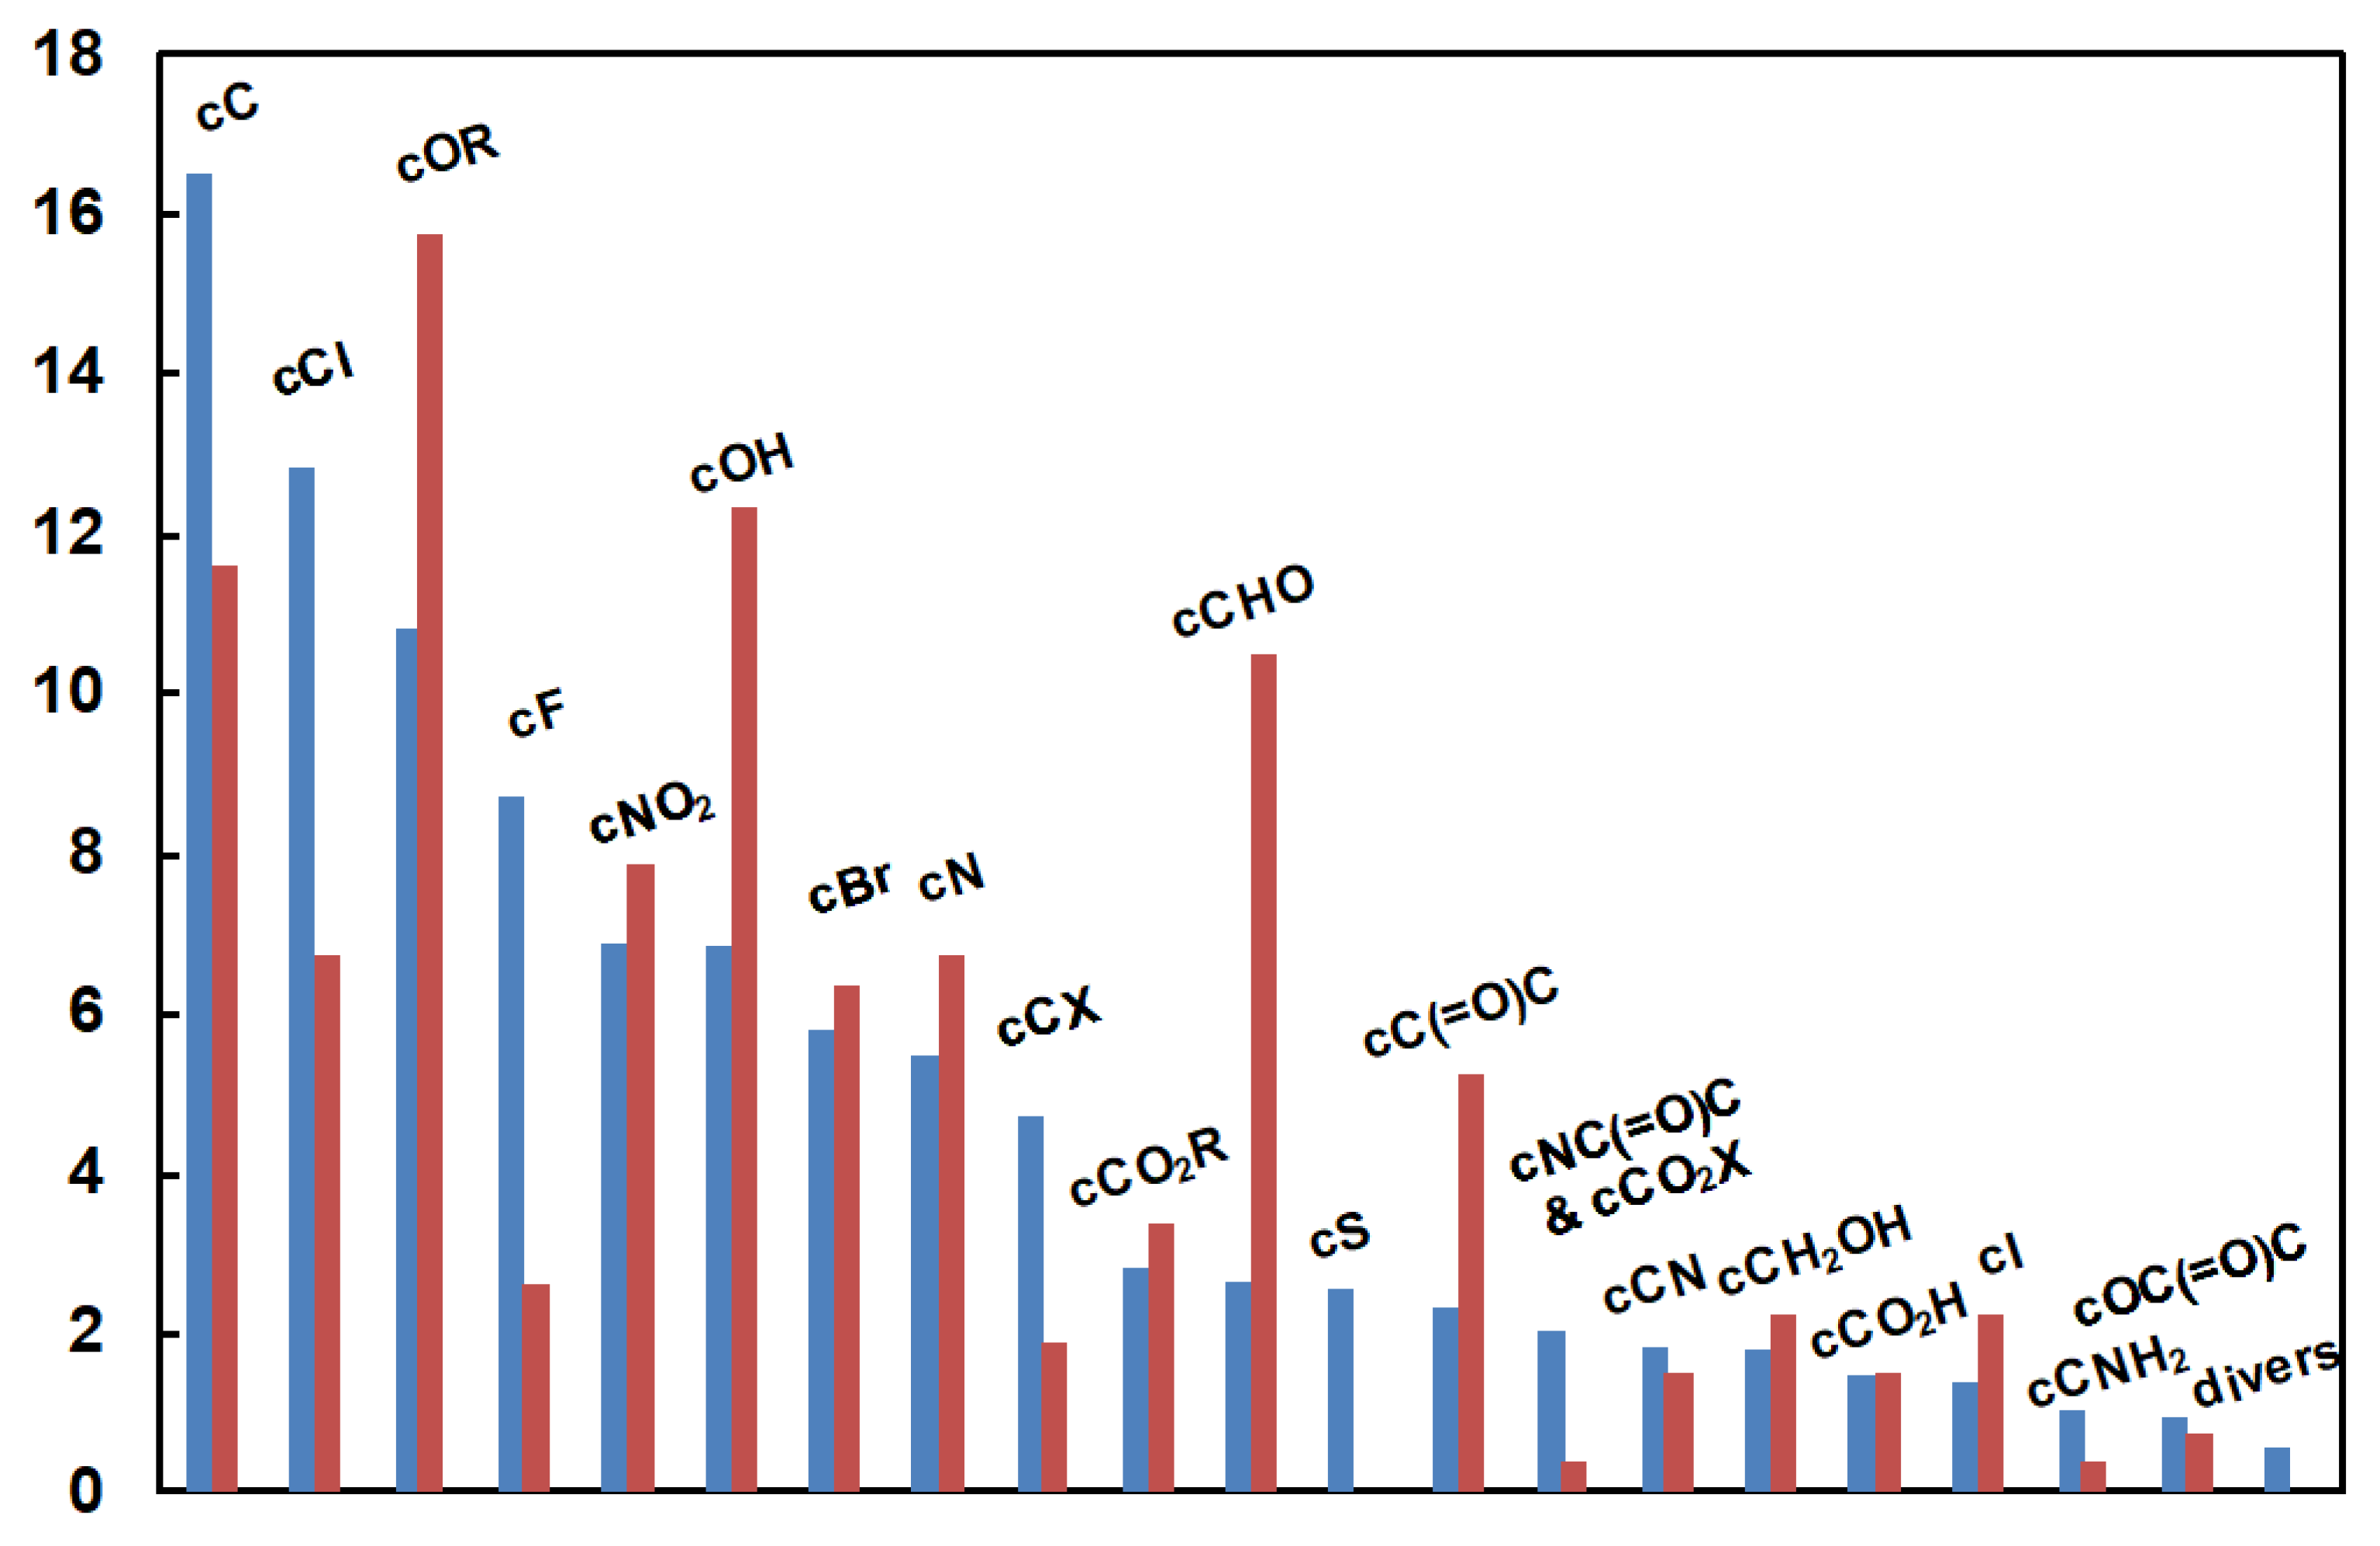

Table 1.
13C chemical shift for the cOMe carbon of 2-methoxytoluene computed with various models.
|
Model algorithm |
NMRshiftDB HOSE [NN] |
ChemDraw increments |
MestReNova ensemble |
ACD HOSE+NN |
Gaussian DFT |
| shift (ppm) | 156.1 [157.7] | 158.6 | 157.8 | 157.8 | 156.5 |
| deviation (ppm) | 1.7 [0.1] | 0.8 | 0.0 | 0.0 | 1.3 |
Table 2.
RMSE (in ppm) computed with 6 models for 22 benzenic structures.
|
Model algorithm |
Nmrdb HOSE |
NMRshiftDB HOSE [NN] 2 |
Nmr predict HOSE+NN |
ChemDraw increments |
MestReNova ensemble |
ACD HOSE+NN |
| RMSE (ppm) 1 | 4.7 | 6.6 [1.1] | 3.8 | 3.3 | 2.2 | 1.9 |
1 The root mean square error is computed for the 128 benzenic carbons in the set of 22 molecules; 2 only 78 chemical shifts are computed with the NN algorithm, as Br and I atoms are not allowed.
Table 3.
Estimation of the chemical shifts from SMILES by graph machine-based models of increasing complexity.
Table 3.
Estimation of the chemical shifts from SMILES by graph machine-based models of increasing complexity.
| Number of hidden neurons 1 |
14 | 16 | 18 | 20 | 22 | 24 | 26 | 28 | 30 |
|---|---|---|---|---|---|---|---|---|---|
| RMSTE 2 | 1.08 | 0.97 | 0.86 | 0.79 | 0.73 | 0.67 | 0.63 | 0.58 | 0.55 |
| VLOO score 3 (ppm) | 1.20 (0.003) | 1,08 (0.008) | 0.99 (0.002) | 0.92 (0.001) | 0.87 (0.002) | 0.82 (0.003) | 0.78 (0.004) | 0.75 (0.005) | 0.72 (0.001) |
| Computation time 4 | 0.9 | 1.1 | 1.3 | 1.7 | 2.1 | 2.6 | 3.2 | 4.1 | 5.0 |
1 Results for a number of hidden neurons equal to 4-12 are given in Table S2 of the SI. 2 RMSTE value in ppm of the trained model (out of 100) having the smallest RMSTE for the 8431 carbon chemical shifts of the training set. 3 Mean and standard deviation (in parenthesis) of the VLOO scores averaged over the 25 trained models (out of 100) having the smallest VLOO scores computed for three different parameter initializations for the 8431 carbons of the training set. 4 Average time (in seconds on an iMacPro) to compute one carbon chemical shift of the test set using the 25 trained models (out of 100) having the smallest VLOO scores.
Table 4.
Performance of the GM26 model for the training and test sets.
| Dataset | 1 | RMSE 2 | MAE 2 | R2 3 | MIN 4 | MAX 5 |
|---|---|---|---|---|---|---|
| Training | 8431 | 0.5 | 0.4 | 0.998 | −3.4 | 3.9 |
| Test | 584 | 0.7 | 0.5 | 0.997 | −3.8 | 4.1 |
1 Number of carbons in datasets, 2 RMSE and MAE (mean absolute error) in ppm, are averaged over the 25 trained models (out of 100) having the smallest VLOO scores for the NT carbons of the training set, 3 determination coefficient of the scatter plot of estimated versus measured shifts for the carbons of the dataset, and 4,5 minimum and maximum deviations from experiment, in ppm.
Table 6.
Examples of molecules with new atoms or functionalities used for training.
| Functionality or atom in the substituent |
Number of molecules | Example of benzene substituent |
|---|---|---|
| Phenoxy | 30 | p-CH(=O)C6H4O |
| 1,3-diketone | 14 | C6H5C(=O)CH2C(=O) |
| Sulfoxide | 17 | H3CS(=O) |
| Acetic acid | 4 | HO2CCH2 |
| Acetonitrile | 9 | NCCH2 |
| Benzoyl | 7 | C6H5C(=O) |
| Azide | 28 | N3 |
| Crowded carbon | 35 | t-Bu in position 2,4,6 |
| P | 34 | C6H5OPH(=O)O |
| Si | 21 | Me2SiH |
Table 7.
Performance of the new GM26 model for the training and test sets.
| Dataset | 1 | RMSE 2 | MAE 2 | R2 | MIN 3 | MAX 4 |
|---|---|---|---|---|---|---|
| Training | 10577 | 0.6 | 0.4 | 0.997 | −3.5 | 3.6 |
| Outliers | 125 | 1.9 (3.3) 6 | 1.6 | 0.986 | −2.5 | 2.6 |
| Test | 156 | 1.0 | 0.7 | 0.995 | −3.4 | 5.0 |
1 Number of carbons in datasets, 2 RMSE and MAE, in ppm, averaged over the 10 trained models (out of 100) having the smallest VLOO scores for the NT carbons of the training set, 3,4 minimum and maximum deviations from experiment in ppm, 5 for the 10 outliers, which are all members of the present training set, only the 12 'faulty' shifts are considered and 6 RMSE in parenthesis corresponds to the results given in Section 3.1.
Table 8.
Comparison of the performance of the new GM26 model and four other models on a test set of 1011 13C chemical shifts.
Table 8.
Comparison of the performance of the new GM26 model and four other models on a test set of 1011 13C chemical shifts.
| Model | RMSE | MAE | R2 | MIN 2 | MAX 3 | No C4 |
|---|---|---|---|---|---|---|
| GM26 | 0.9 1 | 0.7 1 | 0.997 | −3.6 | 3.6 | 9 |
| ChemDraw | 3.4 | 2.2 | 0.956 | −17.2 | 27.6 | 256 |
| MestReNova | 1.9 | 1.4 | 0.986 | −10.1 | 9.5 | 103 |
| ACD | 1.8 5 | 1.2 | 0.988 | −8.4 | 8.5 | 95 |
| NMRshiftDB (NN) | 1.1 5 | 0.8 | 0.995 | −4.5 | 4.3 | 15 |
1 RMSE and MAE, in ppm, averaged over the 10 trained models (out of 100) having the smallest VLOO scores for the 10577 carbons of the training set, 2,3 minimum and maximum deviations from experiment in ppm, 4 number of carbons with a predicted shift deviation greater than 3 ppm in absolute value, and 5 for ACD and NMRshiftDB, the RMSEs are computed with 996 and 596 shift values respectively.
Disclaimer/Publisher’s Note: The statements, opinions and data contained in all publications are solely those of the individual author(s) and contributor(s) and not of MDPI and/or the editor(s). MDPI and/or the editor(s) disclaim responsibility for any injury to people or property resulting from any ideas, methods, instructions or products referred to in the content. |
© 2024 by the authors. Licensee MDPI, Basel, Switzerland. This article is an open access article distributed under the terms and conditions of the Creative Commons Attribution (CC BY) license (http://creativecommons.org/licenses/by/4.0/).
Copyright: This open access article is published under a Creative Commons CC BY 4.0 license, which permit the free download, distribution, and reuse, provided that the author and preprint are cited in any reuse.


