

Submitted:
06 June 2024
Posted:
07 June 2024
You are already at the latest version
Abstract
This study aims to automate the optimization of a Full-Range speaker in an SUV's audio system according to the equal loudness contours principle. The input signal, and frequency responses of the amplifier and speaker were transferred to Matlab. Using ideal filter parameters, ten parametric equalizer models were created, and the speaker output was obtained using the convolution technique. The same filter settings were applied to the vehicle multimedia system, and experimental results were obtained. The simulation and experimental results were compared, showing high similarity with a Pearson correlation coefficient of 0.9295 and an RMSE of 2.29. Results were compared with the ideal contour. The Pearson correlation coefficients for simulation and experimental results were 0.6341 and 0.6715, with RMSE values of 4.88 and 2.57, showing low similarity. Consequently, each parametric equalizer filter's parameters were optimized using a genetic algorithm. The optimized parameters were applied to the vehicle multimedia system, and results were compared with the ideal contour. The Pearson correlation coefficients for simulation and experimental results were 0.965 and 0.9661, with RMSE values of 2.12 and 1.48. These results indicate that optimization aligns the speaker output closer to the ideal contour, enhancing in-vehicle audio system performance and increasing user satisfaction.
Keywords:
vehicle multimedia system
; equal loudness contours
; parametric equalizer filter
; genetic algorithm
1. Introduction
Listening to music while driving, one of the most common activities, not only serves as a source of entertainment for drivers and passengers but also significantly impacts driving comfort and overall fatigue levels. Studies demonstrate that in-car sound has a direct effect on driver comfort and fatigue levels [1]. In this context, the quality of in-car sound emerges as a critical factor that substantially influences the experiences of drivers and passengers. With advancing technology, vehicle manufacturers and audio system designers are developing various strategies to meet and enhance user expectations regarding sound quality, aiming to minimize driver fatigue.
The impact of in-car sound quality on the listening experience is evaluated within the framework of sound engineering and psychoacoustic principles [2]. Particularly, the alignment of sound characteristics from speaker output with the equal loudness contour, which reflects the human ear’s varying sensitivity to frequencies between 20 Hz and 20 kHz, is critical for the clarity and accuracy of sound [3]. Adequacy within this frequency range provides a detailed and rich audio experience, enhancing the comfort and enjoyment of drivers and passengers. Moreover, current studies indicate that systems not compliant with the equal loudness contour negatively affect drivers’ fatigue and stress levels during long periods driving. This situation significantly impacts drivers’ attention and reaction times, thereby endangering overall road safety [4]. Therefore, optimizing in-car sound systems based on this contour plays a critical role not only in enhancing the driver and passenger experience but also in maximizing road safety.
In vehicle audio systems, fine tuning of different frequency ranges is required to ensure speaker output aligns with the equal loudness contour. This tuning is accomplished using equalizers that adjust the level of sound signals within specific frequency ranges. There are three types of equalizers: Graphic Equalizer, Parametric Equalizer, and Digital Equalizer. The Graphic Equalizer allows users to manually adjust sound levels at predefined frequency bands. The Digital Equalizer, utilizing sophisticated technology, automatically adjusts the sound profile based on factors such as vehicle speed and engine noise, catering to advanced driver assistance systems. The Parametric Equalizer is a highly adjustable audio processing filter used to modify the amplitude of sound signals within certain frequency ranges. This filter provides precise control over three parameters: center frequency, gain, and quality factor (Q factor). The detailed control capability makes the Parametric Equalizer particularly suitable compared to other options for tuning speaker output according to the equal loudness contour, making it preferred in vehicle multimedia systems [5].
The in-car sound system is a complex structure comprising various components such as the vehicle multimedia system, amplifiers, speakers, cables, and connectors. Although each component affects the frequency response throughout the system in various ways, the most critical modifications are made by the speakers. Since a single speaker cannot deliver perfect performance across all frequencies, quality sound systems employ speakers designed for different frequency regions used in conjunction. Modern vehicles include a wide variety of speakers such as Subwoofers, Woofers, Mid-ranges, Full-Ranges, and Tweeters. Each of these speakers offers different responses in specific frequency ranges, requiring meticulous of equalizer settings for all speaker types in the optimization of vehicle sound systems [6].
In vehicle multimedia systems, tuning filter parameters to conform to the equal loudness contour and measuring speaker output with a sound analyzer are fundamental steps in optimization. However, these steps are detailed and challenging due to their reliance on manual tuning and experimental methods, and because repeated analyses are required to achieve optimal results. Additionally, the process of evaluating results through subjective observation complicates the consistency in achieving desired acoustic levels [6].
Given that the equal loudness contour spans a wide frequency range, multiple parametric equalizer filters are often used in vehicle multimedia systems for fine tuning. Considering that each filter is controlled by three parameters, the optimization of in-car sound systems becomes a particularly cumbersome process, especially for different types of speakers. Therefore, the use of computer-aided modeling and simulation technologies for the optimization of multiple parametric equalizer filters holds the potential to enhance the efficiency and effectiveness of the design process of in-car sound systems. Specifically, the filter design possibilities provided by computer-aided mathematical modeling software, coupled with simulations conducted through signal processing techniques to calculate the system’s frequency response, and the assessment of conformity to the equal loudness contour through statistical methods, both accelerate and simplify the optimization process of in-car sound systems. These modern approaches overcome the time and complexity issues encountered with experimental methods, offering the capability to perform detailed analyses necessary for perfecting the design and settings of in-car sound systems [7].
In addition to previous processes, the use of intelligent algorithms during the tuning of filter parameters holds the potential to further advance the optimization process. Methods such as metaheuristic algorithms and Artificial Neural Networks can be utilized to optimize the process of finding the most suitable filter combination for the equal loudness contour, providing high levels of accuracy and efficiency in parameter selection. These intelligent algorithms, compared to manual trial-and-error methods, allow for the rapid and cost-effective achievement of the ideal frequency response, reducing time and resource usage in acoustic tuning [8].
This study aims to automate the process of adjusting the Full-Range speaker in the audio system of an SUV according to the equal loudness principle. First, the input sound and the frequency responses of the speaker were transferred to the Matlab environment. Then, using the filter parameter values defined in the standards for the ideal hearing curve in 1/1 octave bands, ten Parametric Equalizers were modeled, and the speaker output was obtained using the convolution technique. The same filter settings were applied to the vehicle multimedia system, and experimental results were obtained to validate the simulations. Following this step, the center frequency, gain, and Q factor of each Parametric Equalizer were determined using a Genetic Algorithm to achieve optimal acoustic performance. These filter parameters were iteratively optimized to closely match the ideal equal loudness contour. After the optimization process, the calculated parameters were applied to the vehicle multimedia system, and the obtained experimental results were compared with the simulation results in the Matlab environment using correlation and root mean square error analyses. This allowed for a detailed examination of the effectiveness of the modeling, simulation, and applied optimization strategy.
2. Materials and Methods
2.1. Normal Equal-Loudness-Level Contours
The human ear has the ability to perceive sound waves at different frequencies; however, this perceptual capacity can vary significantly depending on the frequencies. Fletcher and Manşon developed a chart called the equal loudness contours based on their research and experimental studies on this subject. This chart was later standardized under the name ISO 226 Standard. This standard includes the equal-loudness contours, which define the sound pressure levels required for sounds at different frequencies to be perceived as equally loud by the human ear. The equal-loudness contours for different phons are shown in Figure 1.
Equal Loudness contours were determined by taking as reference the frequency of 1000 Hz, which is well perceived by the human ear. These contours are specifically designed considering the psychoacoustic effects on humans. The contours are created based on the average responses of individuals aged between 18 and 25 years, who are considered otologically normal, forming an ideal ear model [9].
2.2. System Components and Modeling
The in-vehicle audio system comprises multiple components forming a complex structure. Key components include a signal generator, an audio analyzer, BNC connectors, a speaker, and a vehicle multimedia system. The transmission of signals starts with the input sound from the signal generator, traveling through BNC connectors to the audio analyzer, and then to the speaker. Ultimately, the sound waves produced by the speaker are delivered to users via the in-vehicle multimedia system. These components are critical not only for the in-vehicle audio quality but also directly influence the auditory experience of drivers and passengers. The final output obtained in the vehicle audio system is the result of multiplying the frequency responses of the system components with each other.Therefore, the frequency response of each component is among the critical factors directly impacting system performance. The system diagram is shown in Figure 2. Subsequent sections will address the modeling of each component in terms of frequency response and examine the interactions between these responses.
- A)
- Input Sound
White noise is frequently preferred in the calibration processes of sound systems because it has equal sound intensity in a wide frequency range such as 20 Hz - 20 kHz. This feature allows for objective testing of the system’s frequency response throughout the entire frequency band, thus enabling a comprehensive analysis of system performance. Particularly in acoustic arrangements of sound systems and rooms, this broad-spectrum sound source is utilized to assess system performance and make necessary adjustments. Consequently, the responses of sound systems at various frequencies can be objectively measured and optimized.
A similar application is found in in-vehicle sound systems. Thanks to its balanced and comprehensive frequency spectrum, white noise provides an ideal test signal for accurately detecting the frequency response of sound systems across a wide frequency range. A significant advantage is that during in-vehicle acoustic adjustments using white noise signals, it is possible to interactively examine and adjust the effects of applied filters across all frequencies [6].
Acoustic analyzers use frequency weighting curves to simulate the human ear’s sensitivity to different frequencies. The A, B, and C weighting scales, displayed in Figure 3, represent various frequency response filters employed in sound measurements. The process of weighting adjusts the measured decibel (dB) values of sounds at specific frequencies to match the sensitivity levels perceived by the human ear at those frequencies. Given the human ear’s lower sensitivity to low frequencies and higher sensitivity to high frequencies, these weighting curves are essential for accurately reflecting perceived sound intensity. By aligning measured sound levels more closely with the natural response of the human ear, these curves enhance the effective assessment of sound’s true impact. Therefore, weighting filters are applied to the white noise signal used as the input sound.
A-weighting primarily represents the sensitivity of the human ear to ambient noise measurements at low sound levels. This scale is more sensitive between frequencies of 500 Hz to 10 kHz, while it reduces sounds at lower and higher frequencies, making it ideal for everyday environmental sound measurements. B-weighting is designed for medium to high sound levels (70 to 80 phon) and slightly emphasizes sounds across the frequency range, making it useful in environments like cinema and music production. C-weighting is used at high sound levels and provides a flatter response across a wide frequency range, measuring low and high-frequency sounds at nearly their original levels. This accuracy is especially required in industrial settings and at concerts [11].
B-weighting is designed to better reflect the sensitivity of the human ear at medium to high sound levels. In setting vehicle sound systems, it is necessary to regulate the system based on the mid to upper sound levels, hence the use of B-weighting shown in Figure 3, which presents the frequency response from 20 Hz to 20 kHz. In this context, our study is based on the equal-loudness contour at 1000 Hz with an amplitude level of 80 dB as shown in Figure 1. After applying the B-weighting process to the white noise signal, it has been used as the input sound in our study. The frequency response of this input sound is depicted in Figure 4.
- A)
- Parametric Equalizer Filters
The parametric equalizer filter is a commonly used tool in audio processing and music production and has become a standard component in automotive multimedia systems. This filter adjusts the audio signal by targeting specific frequency ranges, thereby facilitating the adjustment of the sound’s tonal balance. The parametric equalizer is adjusted based on three primary parameters: center frequency (f0), bandwidth (or Q factor), and gain (G). The gain modifies the intensity of the sound signal by increasing or decreasing the amplitude within the selected frequency band. The bandwidth determines the range of frequencies where the filter is effective and is usually expressed in octaves. The Q factor is defined as the inverse of the ratio of the bandwidth to the center frequency and indicates the sharpness of the filter. A high Q factor means a narrower bandwidth and a sharper filter response. These parameters allow users to finely tune how narrowly or broadly they want to affect a specific frequency, thereby precisely achieving the desired sound characteristics.
The parametric equalizer is a crucial tool in audio processing, primarily incorporating various filter types such as peaking (bell), shelving, and notch filters. In vehicle multimedia systems, the peaking filter is particularly favored. This filter facilitates the adjustment of in-vehicle sound systems in accordance with the principle of equal loudness through its advantages such as frequency adjustment flexibility, tone control, and focused frequency intervention. The peaking filter is designed to either emphasize or attenuate signals within a specific frequency band and plays a critical role in sound processing and equalization [12].
The mathematical model of the peaking filter is represented by a transfer function H(f) that describes its effect on the frequency domain of the signal. This transfer function defines the relationship between the input and output of the signal as a function of frequency and is commonly formulated as Equation (1).
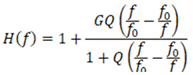
Here, f represents the frequency under study, f0 is the center frequency (the frequency to be emphasized or attenuated), G denotes the gain (in amplitude level, measured in dB), and Q represents the quality factor (which inversely defines the bandwidth of the filter) [5].
According to the principle of equal loudness, precise regulation of different frequency bands is necessary. Therefore, multiple parametric equalizer filters are generally used. The ISO 226:2003 standard defines the characteristics of parametric filters required to achieve an ideal equal loudness contour. In accordance with this standard, ten parametric filters are adjusted at specified frequencies, with corresponding gain and Q factor values, designed to provide optimal sound correction. Each of these filters is set according to the frequency, gain, and Q factor values detailed in Table 1.
In this study, ten parametric equalizer filters have been utilized to ensure an ideal sound experience in vehicle multimedia systems. A filter order of 12 was chosen, which is aligned with the order of existing filters in in-vehicle multimedia sound systems. The filters were created using the fdesign.parameq function available in the DSP System Toolbox library of Matlab R2021b software. This function allows users to design a parametric equalizer filter with specified parameters.
- C)
- Amplifier
Amplifiers serve as fundamental power-boosting devices in sound systems. In vehicle multimedia systems, amplifiers increase the amplitude of the received audio signal, enabling speakers to produce sound at higher volumes and with higher quality. This improves the signal-to-noise ratio (SNR), enhancing the clarity and detail of the sound while minimizing distortions.
In vehicle entertainment systems, Class-D amplifiers are particularly preferred. These amplifiers are advantageous due to their high energy efficiency and quality sound output. Class-D amplifiers process audio signals in digital format, amplifying them directly without converting them back to analog signals. This process allows them to achieve high sound levels with less energy consumption compared to traditional analog amplifiers. Additionally, these amplifiers provide a balanced and consistent response across a wide frequency range, making them ideal for music and sound effects [13]. In this study, an amplifier suitable for 4-ohm speakers was selected. Figure 5 details the frequency response of the chosen amplifier at 4 ohms.
- D)
- Speaker
Speakers function as the final output component of sound systems; they convert filtered and amplified audio signals into physical sound waves and deliver them to listeners.
The types of speakers used in vehicle sound systems are specially designed to provide optimal performance across different frequency ranges. Essentially, these speakers are categorized into four main types to cover low, mid, and high frequencies: subwoofer/woofer, mid-range, tweeter, and full-range speakers. Each type of speaker is optimized for a specific frequency range, and the frequency ranges of these speakers are detailed in Table 2 [6].
The type of speaker used in this study is the Full-Range speaker, which covers a wide frequency range. Figure 6 shows the frequency response of the Full-Range speaker. The manufacturer states that the effective operating frequency of this speaker is between 85 Hz and 12.5 kHz. This wide frequency range indicates that the speaker can adequately produce both low-frequency bass sounds and high-frequency treble sounds. In this study, the modeling of the speaker was based on this frequency response curve.
2.3. Modeling and Optimization of System Output
In this study, to ensure an ideal audio experience in vehicle multimedia systems, the processes of signal processing, filtering, integration of amplifier and speaker responses were detailed, and the combined effect of these components was optimized. While creating the system model, a B-weighting white noise signal was used as the input signal, followed by the integration of parametric equalizer filters, amplifier, and speaker components sequentially. This integration is based on the cascading method, where the output of each system component serves as the input for the next component. This method allows for the step-by-step processing of the signal and the sequential application of each component’s effect.
In this cascading process, the role of convolution, one of the fundamental concepts of signal processing theory, is of great importance. Convolution, as a mathematical operation, involves applying a system response (e.g., the frequency response of an equalizer filter or an amplifier) to an input signal. This process is essentially performed by “folding” each point of the input signal with the system response and summing the results.
The convolution theorem explains the frequency domain representation of this process: the convolution of two signals (input and system response) in the time domain is equivalent to the multiplication of these signals in the frequency domain. This transformation is shown in Equation (2).

This property allows engineers and designers in the field of signal processing, particularly in filter design and audio processing applications, to perform complex signal processing operations more efficiently. In this study, since the system components were modeled in the frequency domain, the convolution operation was also performed in this domain [14].
To model the resulting signal at the system output, the amplitude responses of the input signal, amplifier, and speaker components described in Figure 4, Figure 5 and Figure 6 were first imported into Matlab. Since the signals were defined in the frequency domain, the frequency responses of the parametric equalizer filters were calculated using the “freqz” function, and their amplitude responses were obtained. Here, a sampling frequency of 96 kHz, which is also used in the actual setup, was employed. The convolution of these obtained signals was performed by multiplication, as shown in Equation (2), and the speaker output was modeled.
In this study, statistical analyses were used to measure the performance by comparing the experimental results obtained from the speaker output. Pearson correlation analysis and root mean square error (RMSE) methods were utilized for this purpose.
Pearson correlation analysis is a statistical method used to measure the linear relationship between two data sets. This analysis helps determine how two variables change together and produces a correlation coefficient (r) between -1 and 1. A correlation coefficient close to 1 indicates a strong positive linear relationship, while a value close to -1 indicates a strong negative linear relationship. A value near 0 suggests no relationship between the two data sets. In this study, Pearson correlation analysis was used to examine the linear relationship between the obtained results. The Pearson correlation coefficient is calculated using Equation (3).
 Here x and y refer to the data sets, and n refers to the total number of data points.
Root mean square error (RMSE) is a method used to measure the magnitude of differences between two data sets. RMSE evaluates the deviations among the obtained results and quantitatively indicates the amount of error. A low RMSE value indicates that the results are close to each other. RMSE is calculated using Equation (4).
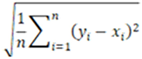
These statistical analyses played a critical role in evaluating the agreement between the ideal contour and the experimental and simulation results. While Pearson correlation analysis determined the linear relationship between the results, RMSE analysis quantitatively measured the accuracy of this relationship [15].
To align the signal output from the speaker with the ideal contour given by the equal loudness principle, the optimization of filter parameters was performed. Metaheuristic algorithms were preferred for the optimization. Metaheuristic algorithms are methods capable of conducting effective and efficient searches over large solution spaces and are not specific to a particular problem. In this study, the genetic algorithm (GA), one of the metaheuristic algorithms, was chosen.
The genetic algorithm is an optimization technique based on the principles of biological evolution and operates on solution sets called chromosomes. Initially, an initial population consisting of random solutions is created. Then, the fitness of each solution is evaluated according to a specific objective. Solutions with higher fitness values are selected to have greater representation in subsequent generations. Crossover operations are performed among the selected solutions to create new solutions (offspring), and small random changes (mutations) are applied to the solutions obtained from the crossover. Finally, the population is updated with the new solutions, and the process is repeated until a certain fitness value is achieved or a specified number of iterations is reached [16].
Genetic algorithms have the capability to operate effectively in large and complex solution spaces. In terms of flexibility and adaptability, genetic algorithms can be tailored to various optimization problems and provide flexibility for different objectives [17]. Given the numerous frequency and parameter combinations in vehicle audio systems, genetic algorithms are ideal for addressing such problems.
In this study, the “optimoptions” and “ga” functions from MATLAB’s Global Optimization Toolbox were used for the GA. The GA was configured with a population size of 100 individuals. Thus, 100 different solutions were evaluated in each generation, allowing for a more comprehensive search of the solution space. Additionally, the algorithm was allowed to run for a maximum of 100 generations, ensuring that the algorithm had sufficient time to search for a solution while controlling the processing time.
The fitness function was determined by comparing the speaker output obtained in each iteration with the ideal contour. Using statistical methods, the differences between the ideal contour and the obtained results were calculated, and these differences were used as the output of the objective function. The genetic algorithm iteratively updated the filter parameters (f0, Q and G) to maximize these outputs and find the optimal solution.
3. Results
First, the parametric equalizer filter parameters defined by the standards for equal loudness given in Table 1 were applied to the modeling software created to calculate the speaker output. The resulting speaker output contour is shown in Figure 7. Here, the blue line represents the simulation results, while the black line represents the ideal contour taken from the principle of equal loudness, with the effective frequency range of the speaker highlighted.
Subsequently, the experimental setup shown in Figure 8 was established to create the test environment. This experimental setup was also intended to evaluate the degree of alignment between the modeling and simulation results with real-world application and to measure the performance of the simulation model.
In the test setup, the same filter parameters were loaded into the vehicle multimedia sound system, and the speaker output was measured. The simulation and experimental results are presented together in Figure 9 and compared with the ideal contour. Here, the blue line represents the simulation results, the red line represents the experimental results, and the black line represents the ideal contour.
First, the experimental and simulation results were compared for the effective frequency range of the speaker to evaluate the performance of the simulation model. For this purpose, Pearson correlation analysis and root mean square error (RMSE) calculations were performed. The correlation coefficient between the experimental and simulation results was found to be 0.9295. This result indicates a high degree of similarity, demonstrating the success of the simulation model. Due to the unknown frequency responses of the cables, vehicle multimedia system, and audio analyzer, these factors were not included in the models, which affected the similarity. The RMSE value was calculated as 2.29. Attenuations caused by the elements and cables of the experimental setup created differences in amplitude values, which impacted the root mean square error rate.
Subsequently, the simulation results and experimental results were compared with the ideal contour. The Pearson correlation coefficient for the simulation and experimental results was found to be 0.6341 and 0.6715, respectively. The RMSE values were calculated as 4.88 and 2.57, respectively. As seen from the results, despite applying the ideal filter values, high similarity results with the ideal contour were not achieved. As shown in Figure 6, the speaker response is more sensitive to certain frequencies, causing deviations in amplitudes, which affected the overall system performance and reduced the similarity to the ideal contour.
Following these processes, the parametric equalizer parameters were calculated using a genetic algorithm-based optimization algorithm. The filter parameters obtained from the optimization are presented in Table 3.
The obtained parameters were applied to the modeling software created to calculate the speaker output, and simulation results were obtained. Additionally, the filter parameters were loaded into the vehicle multimedia sound system, and the speaker output was measured. The simulation and experimental results are presented together in Figure 10 and compared with the ideal contour. Here, the blue line represents the simulation results, the red line represents the experimental results, and the black line represents the ideal contour.
The Pearson Correlation analysis and root mean square error (RMSE) calculations used in previous analyses were also applied to the simulation model and experimental setup after optimization. The correlation coefficient between the experimental and simulation results was calculated to be 0.9291, and the RMSE value was 2.32. According to the analysis results, the simulation and experimental results showed a high degree of parallelism, indicating that the simulation model is consistent with the experimental data and demonstrating the reliability of the model.
Subsequently, the simulation and experimental results were compared with the ideal contour. The correlation coefficient between the ideal contour and the simulation results was found to be 0.965, with an RMSE value of 2.12. The correlation coefficient between the ideal contour and the experimental results was calculated to be 0.9661, with an RMSE value of 1.48. These results indicate that the filter parameters obtained after optimization provide a high similarity to the ideal contour.
The correlation coefficients approaching 1 indicate that both the simulation and experimental results have a strong linear relationship with the ideal contour after optimization. This demonstrates an increase in the accuracy and reliability of the model. The decrease in RMSE values shows that the filter parameters obtained after optimization yield results close to the ideal contour and that amplitude deviations are minimized. Low RMSE values indicate a significant improvement in system performance and a reduction in the model’s error margin.
These results also demonstrate a significant improvement in the performance of the in-vehicle audio system. By bringing the speaker output closer to the ideal contour through optimization, a higher quality and more comfortable audio experience for drivers and passengers has been achieved. This shows that genetic algorithm-based optimization is an effective method for optimizing the frequency response of in-vehicle audio systems and enhances system performance in real-world applications.
4. Conclusions
This study aims to automate the process of optimizing the Full-Range speaker in the audio system of an SUV according to the equal loudness principle. First, the frequency responses of the speaker and the input sound were transferred to the Matlab environment. Using the filter parameter values defined in the standards for 1/1 octave bands, ten parametric equalizers were modeled, and the speaker output was obtained using the convolution technique. The same filter settings were applied to the vehicle multimedia system, and experimental results were obtained. These experimental results were validated by comparing them with the simulations.
To achieve optimal acoustic performance, the center frequency, gain, and Q factor of each parametric equalizer were determined using a Genetic Algorithm. These filter parameters were iteratively optimized to closely match the ideal equal loudness contour. After the optimization process, the calculated parameters were applied to the vehicle multimedia system, and the obtained experimental results were compared with the simulation results in the Matlab environment using correlation and root mean square error (RMSE) analyses. This allowed for a detailed examination of the effectiveness of the modeling, simulation, and applied optimization strategy.
First, the parametric equalizer filter parameters defined according to standard equal loudness contour were applied to our modeling software, and the speaker output was calculated. Then, the same filter parameters were applied to the test setup, and the speaker output was measured. The simulation and experimental results were analyzed, yielding a Pearson correlation coefficient of 0.9295 and an RMSE value of 2.29. These findings indicate a high degree of similarity between the simulation and experimental results, demonstrating that the simulation model is consistent with the experimental data and performs successfully. Components not included in the model and attenuations from the test setup affected the correlation coefficient and RMSE calculations. Subsequently, the results were compared with the ideal contour defined by the equal loudness principle. The Pearson correlation coefficients for the simulation and experimental results were found to be 0.6341 and 0.6715, respectively, with RMSE values of 4.88 and 2.57. As understood from the results, despite using the ideal filter values, there was a low level of similarity with the equal loudness contour. The used speaker is more sensitive to certain frequencies, causing deviations in amplitudes, which affected the overall system performance and reduced the similarity to the ideal contour.
Following the relevant analyses and tests, the parameters of the ten parametric equalizer filters were calculated using a genetic algorithm-based optimization software. The calculated parameters were applied to both the modeling software and the test setup for computation and measurement. First, the simulation and experimental results were compared with each other. The correlation coefficient between the simulation and experimental results was calculated to be 0.9291, with an RMSE value of 2.32. As in the previous analysis, the simulation and experimental results showed a high degree of parallelism, demonstrating that the simulation model is consistent with the experimental data and confirming its reliability. Subsequently, the results were compared with the ideal contour. For the simulation and experimental results, the Pearson correlation coefficients were found to be 0.965 and 0.9661, respectively, with RMSE values of 2.12 and 1.48. Upon examining the results, it is observed that the Pearson correlation coefficient for the simulation results improved by 52.2% and the RMSE value improved by 56.6%. For the experimental results, the Pearson correlation coefficient improved by 43.9% and the RMSE value improved by 42.4%. This not only facilitates the real-world application of the study but also allows for finer adjustments to be made.
The results obtained after optimization indicate that the speaker output has been brought closer to the ideal contour, significantly improving the performance of the in-vehicle audio system. Both the simulation and experimental results demonstrate that the optimization effectively aligns the speaker response with the ideal contour, thereby providing a higher quality and more comfortable audio experience for drivers and passengers. These findings show that genetic algorithm-based optimization is an effective method for optimizing the frequency response of in-vehicle audio systems and enhancing system performance in real-world applications.
For future studies, it is recommended to better understand and include in the modeling some factors that were not considered in this study (frequency responses of cables, vehicle multimedia system, and audio analyzer). Additionally, modeling and optimization studies are planned using a genetic algorithm to bring the ideal contour closer to the head region of the driver’s seat.
In conclusion, this study demonstrates the effectiveness of a genetic algorithm-based approach for optimizing the speaker output according to the equal loudness contour. It shows the potential to achieve higher performance and user satisfaction in in-vehicle audio systems.
Author Contributions
Conceptualization, V.B., O.C and G.Y.; methodology, V.B., O.C and G.Y.; software, V.B. and O.C.; validation, V.B. and O.C.; formal analysis, V.B., O.C and G.Y.; investigation, V.B. and O.C.; resources, V.B.; data curation, V.B. and O.C.; writing—original draft preparation, V.B., O.C and G.Y.; writing—review and editing, V.B., O.C and G.Y.; visualization, V.B. and O.C.; supervision, G.Y. All authors have read and agreed to the published version of the manuscript.
Funding
Not applicable.
Institutional Review Board Statement
Not applicable.
Informed Consent Statement
Not applicable.
Data Availability Statement
Data sharing not applicable to this article as no datasets were generated or analyzed during the current study.
Conflicts of Interest
The authors declare no conflicts of interest.
References
- Paulraj, M. P.; Yaacob, S.; Andrew, A. M. Vehicle Noise Comfort Level Indication: A Psychoacoustic Approach. In Proceedings of the 2010 6th International Colloquium on Signal Processing & its Applications; IEEE: 2010; pp 1-5. [CrossRef]
- Howard, D.; Angus, J. Acoustics and Psychoacoustics 4th Edition; Routledge: 2013.
- Rościszewska, T.; Miśkiewicz, A.; Rogala, T.; Rudzki, T.; Fidecki, T. Concert Hall Sound Clarity: A Comparison of Auditory Judgments and Objective Measures. Arch. Acoust. 2012, 41-46. [CrossRef]
- Reed, M. P.; Ebert, S. M.; Jones, M. L. H.; Park, B. D. US National Highway Traffic Safety Administration; US National Highway Traffic Safety Administration: Washington, DC, 2021.
- Winer, E. The Audio Expert: Everything You Need to Know About Audio; Routledge: 2017.
- Golla, S. T. Acoustical Tuning of Car Audio System; Doctoral Dissertation, Indian Institute of Technology Hyderabad, 2016.
- von Tuerckheim, F.; Münch, T. Automated Sound Optimization of Car Audio Systems Using Binaural Measurements and Parametric IIR Filters. In Audio Engineering Society Convention 137; Audio Engineering Society: 2014.
- Pepe, G.; Gabrielli, L.; Squartini, S.; Tripodi, C.; Strozzi, N. Deep Optimization of Parametric IIR Filters for Audio Equalization. IEEE/ACM Trans. Audio, Speech, Lang. Process. 2022, 30, 1136-1149. [CrossRef]
- International Organization for Standardization. Acoustics: Normal Equal-Loudness-Level Contours; ISO Standard No. 226:2003, 2003.
- Head Acoustics. Frequency Weighting of Airborne Sound Signals; Application Note 12/17, 2017.
- Sutton, T. J.; Elliott, S. J.; McDonald, A. M.; Saunders, T. J. Active Control of Road Noise Inside Vehicles. Noise Control Eng. J. 1994, 42, 137-147.
- McCarthy, B. Sound Systems: Design and Optimization: Modern Techniques and Tools for Sound System Design and Alignment; Routledge: 2012.
- Mei, S.; Hu, Y.; Xu, H.; Wen, H. The Class D Audio Power Amplifier: A Review. Electronics 2022, 11 (19), 3244. [CrossRef]
- Oppenheim, A. V.; Willsky, A. S.; Nawab, S. H. Signals and Systems, 2nd ed.; Prentice Hall: 1996.
- Ott, R. L.; Longnecker, M. An Introduction to Statistical Methods and Data Analysis; Cengage Learning: 2016.
- Yi, S.; Zou, S. Genetic Algorithm Theory and Its Application. In Proceedings of the 2018 3rd International Conference on Automation, Mechanical Control and Computational Engineering (AMCCE 2018); Atlantis Press: 2018; pp 519-524. [CrossRef]
- Alam, T.; Qamar, S.; Dixit, A.; Benaida, M. Genetic Algorithm: Reviews, Implementations, and Applications. arXiv 2020, arXiv:2007.12673. [CrossRef]
Figure 1.
Normal equal-loudness-level contours for pure tones.
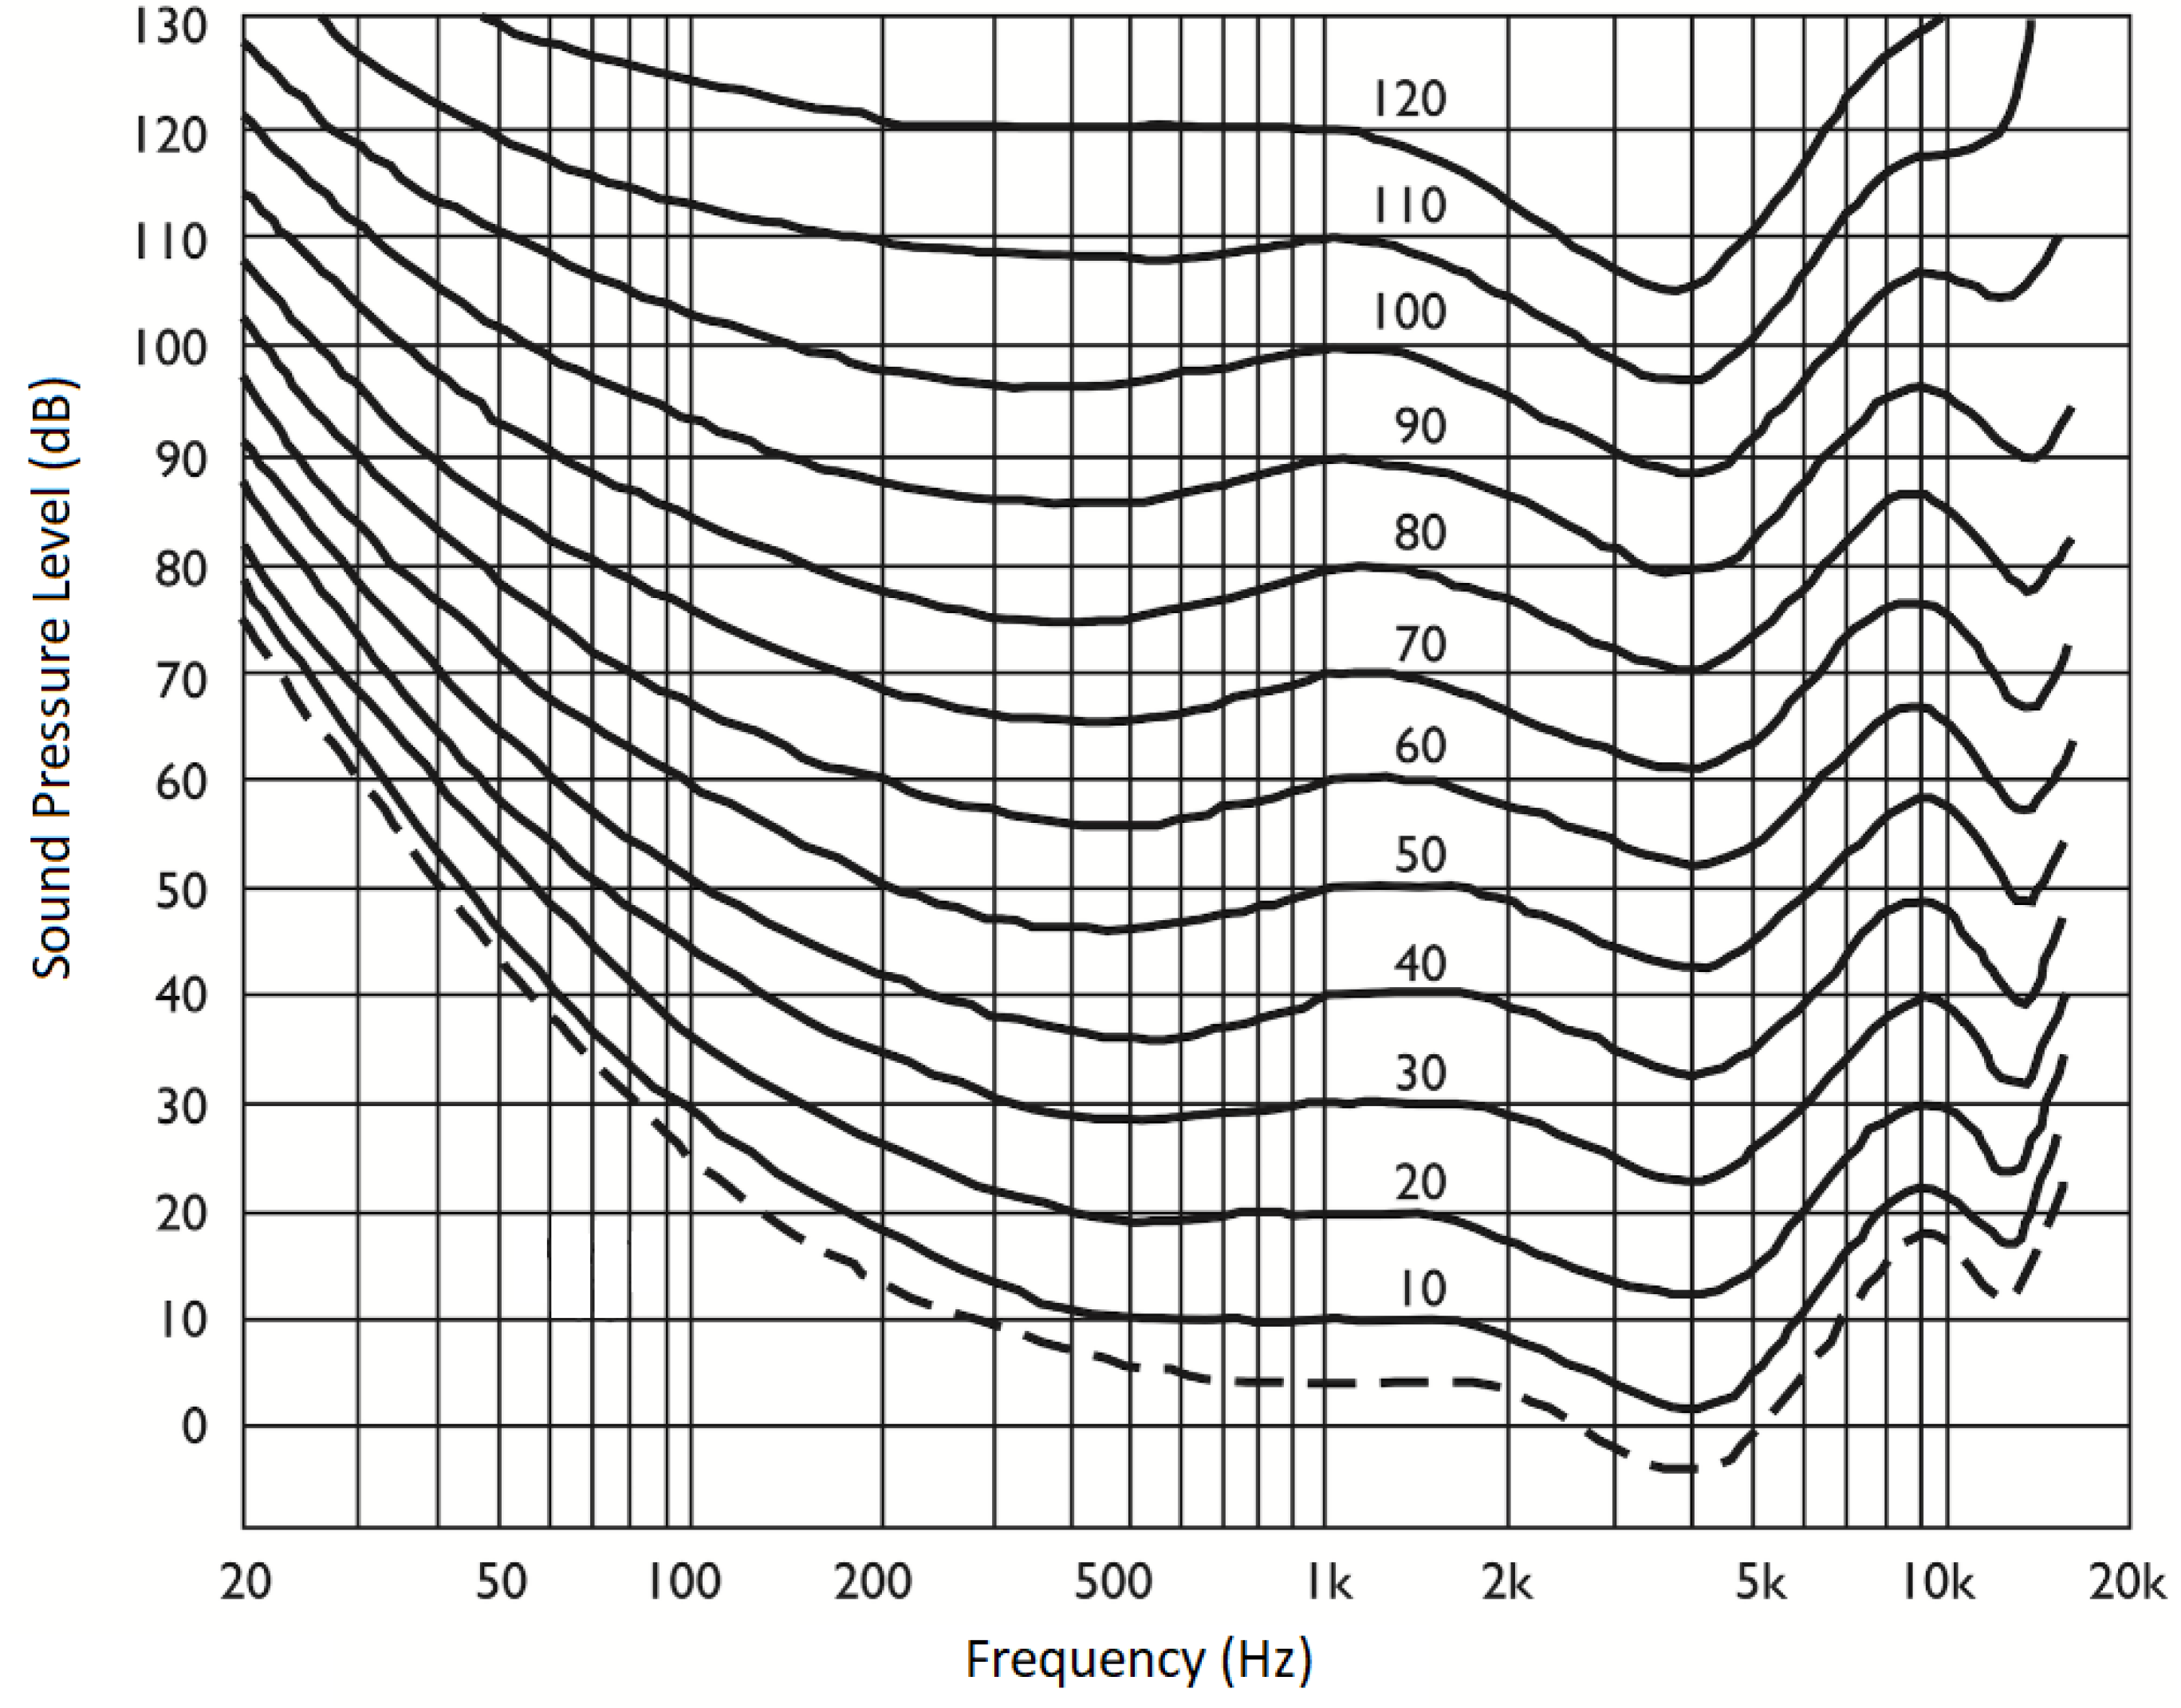
Figure 2.
In-vehicle audio system measurement diagram.
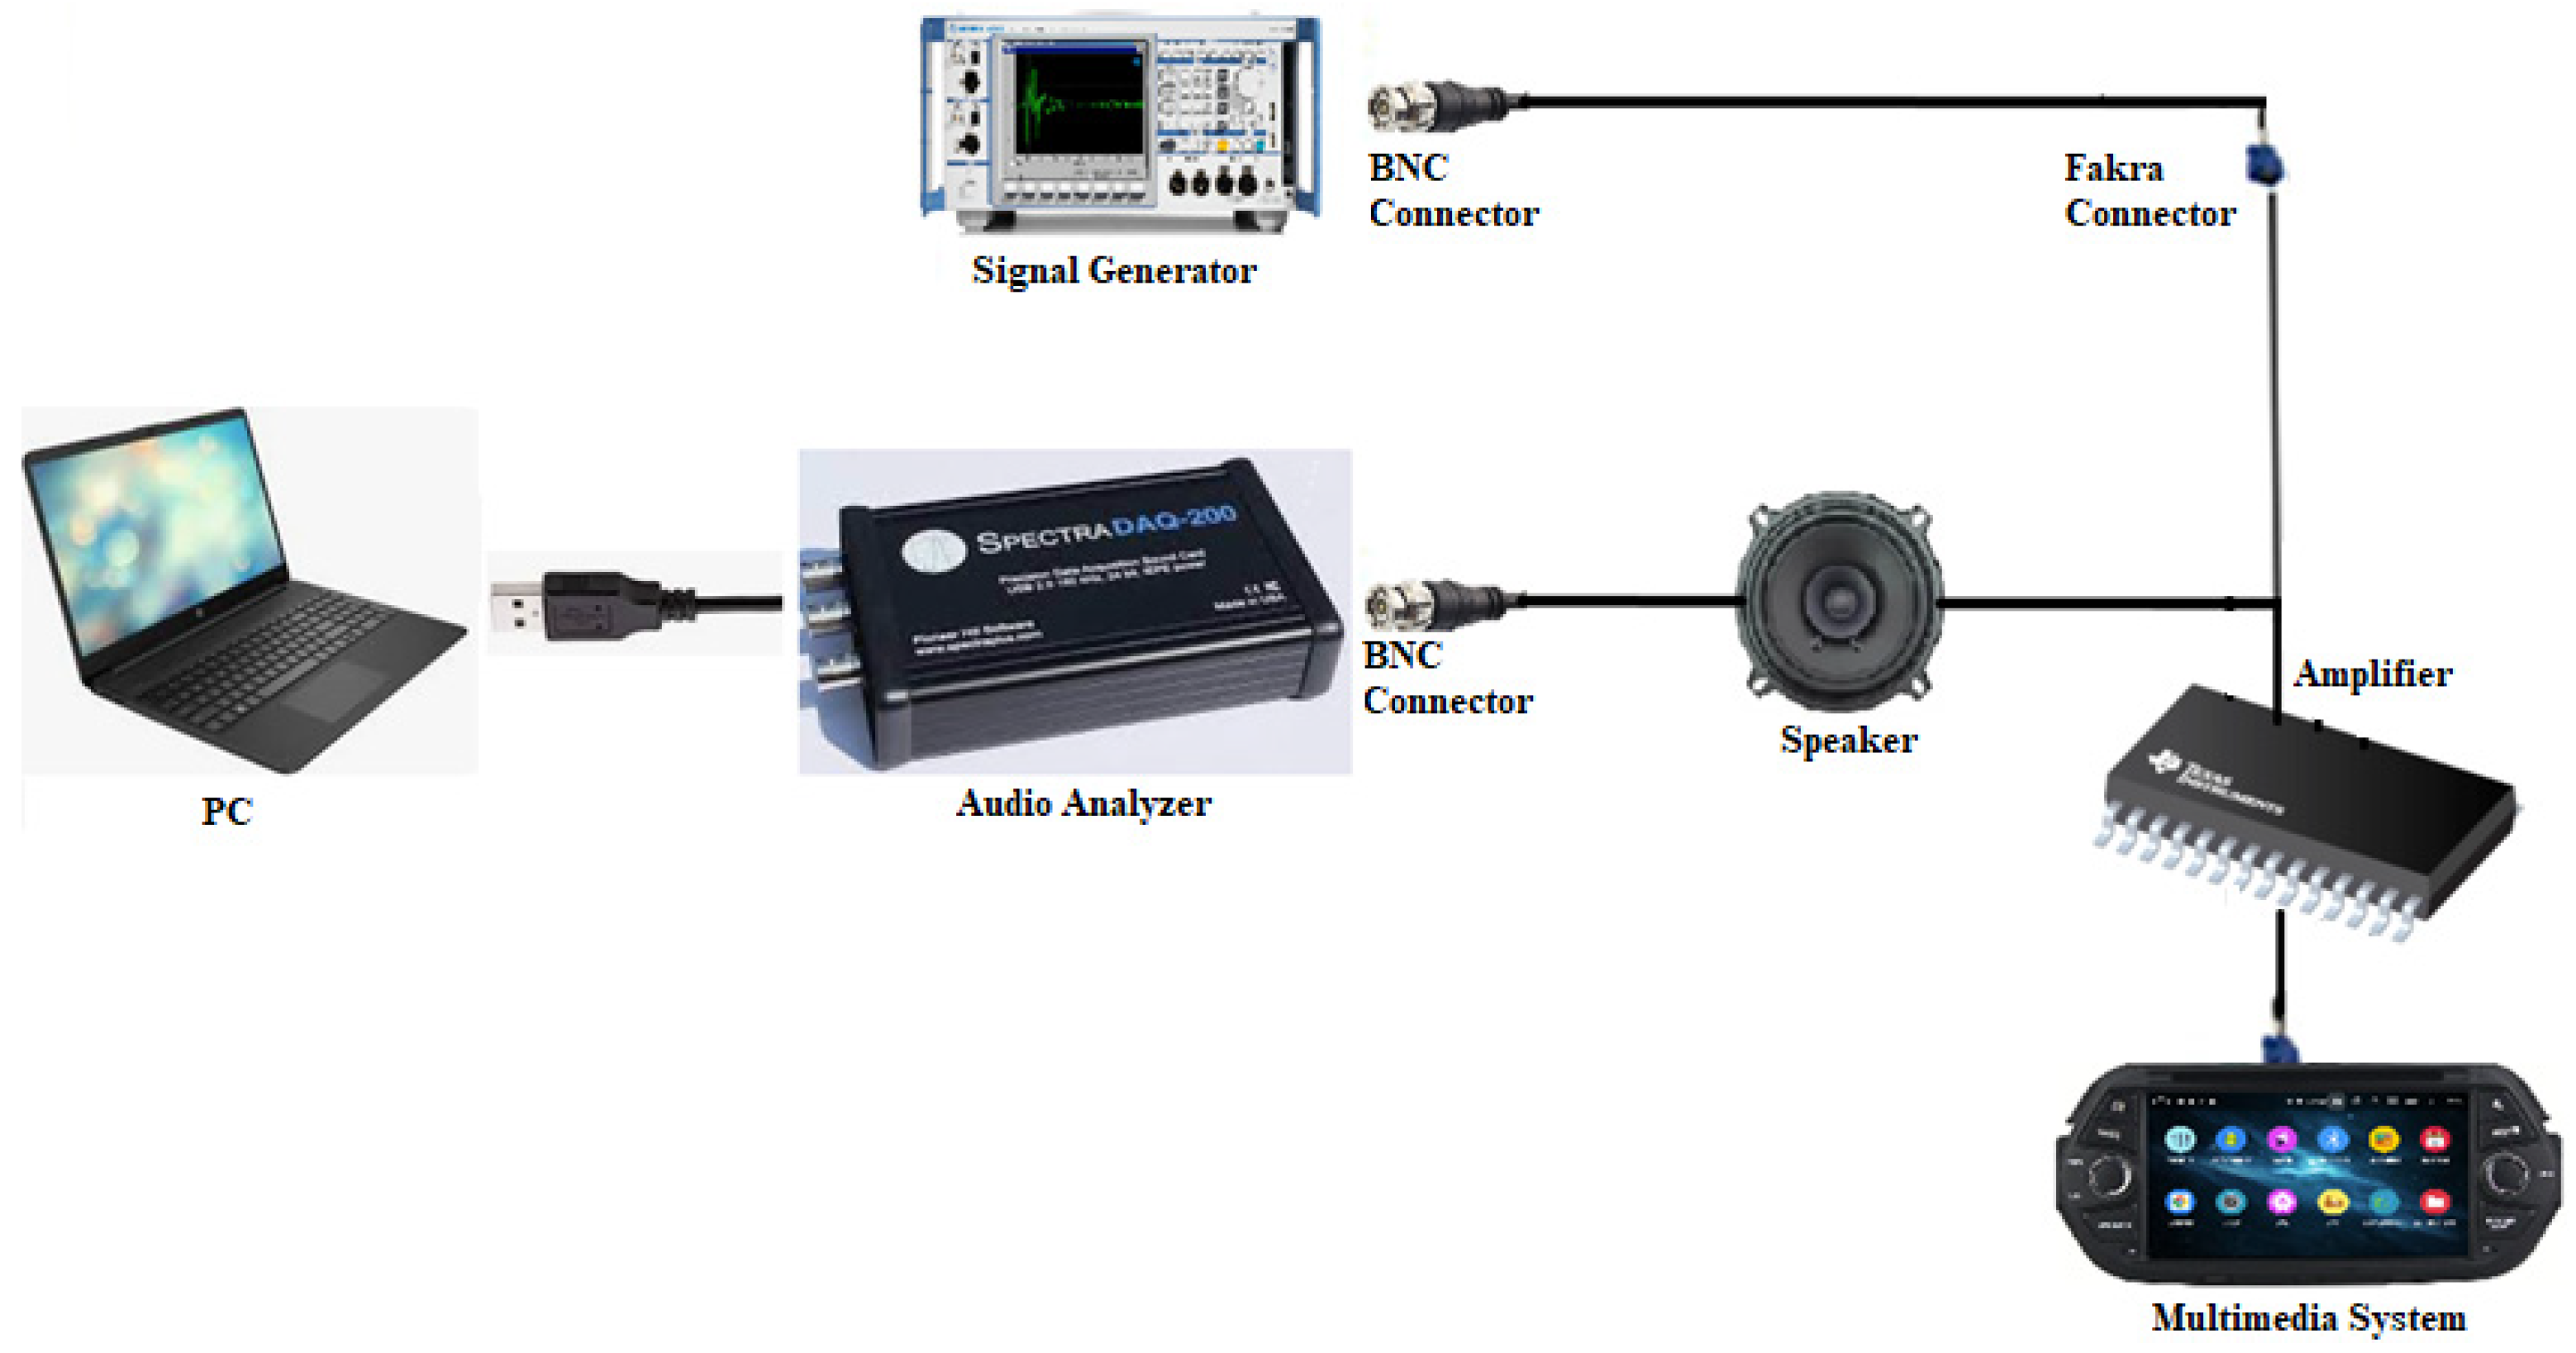
Figure 3.
Frequency Weighted Filters for A, B and C Weightings [10].
Figure 3.
Frequency Weighted Filters for A, B and C Weightings [10].
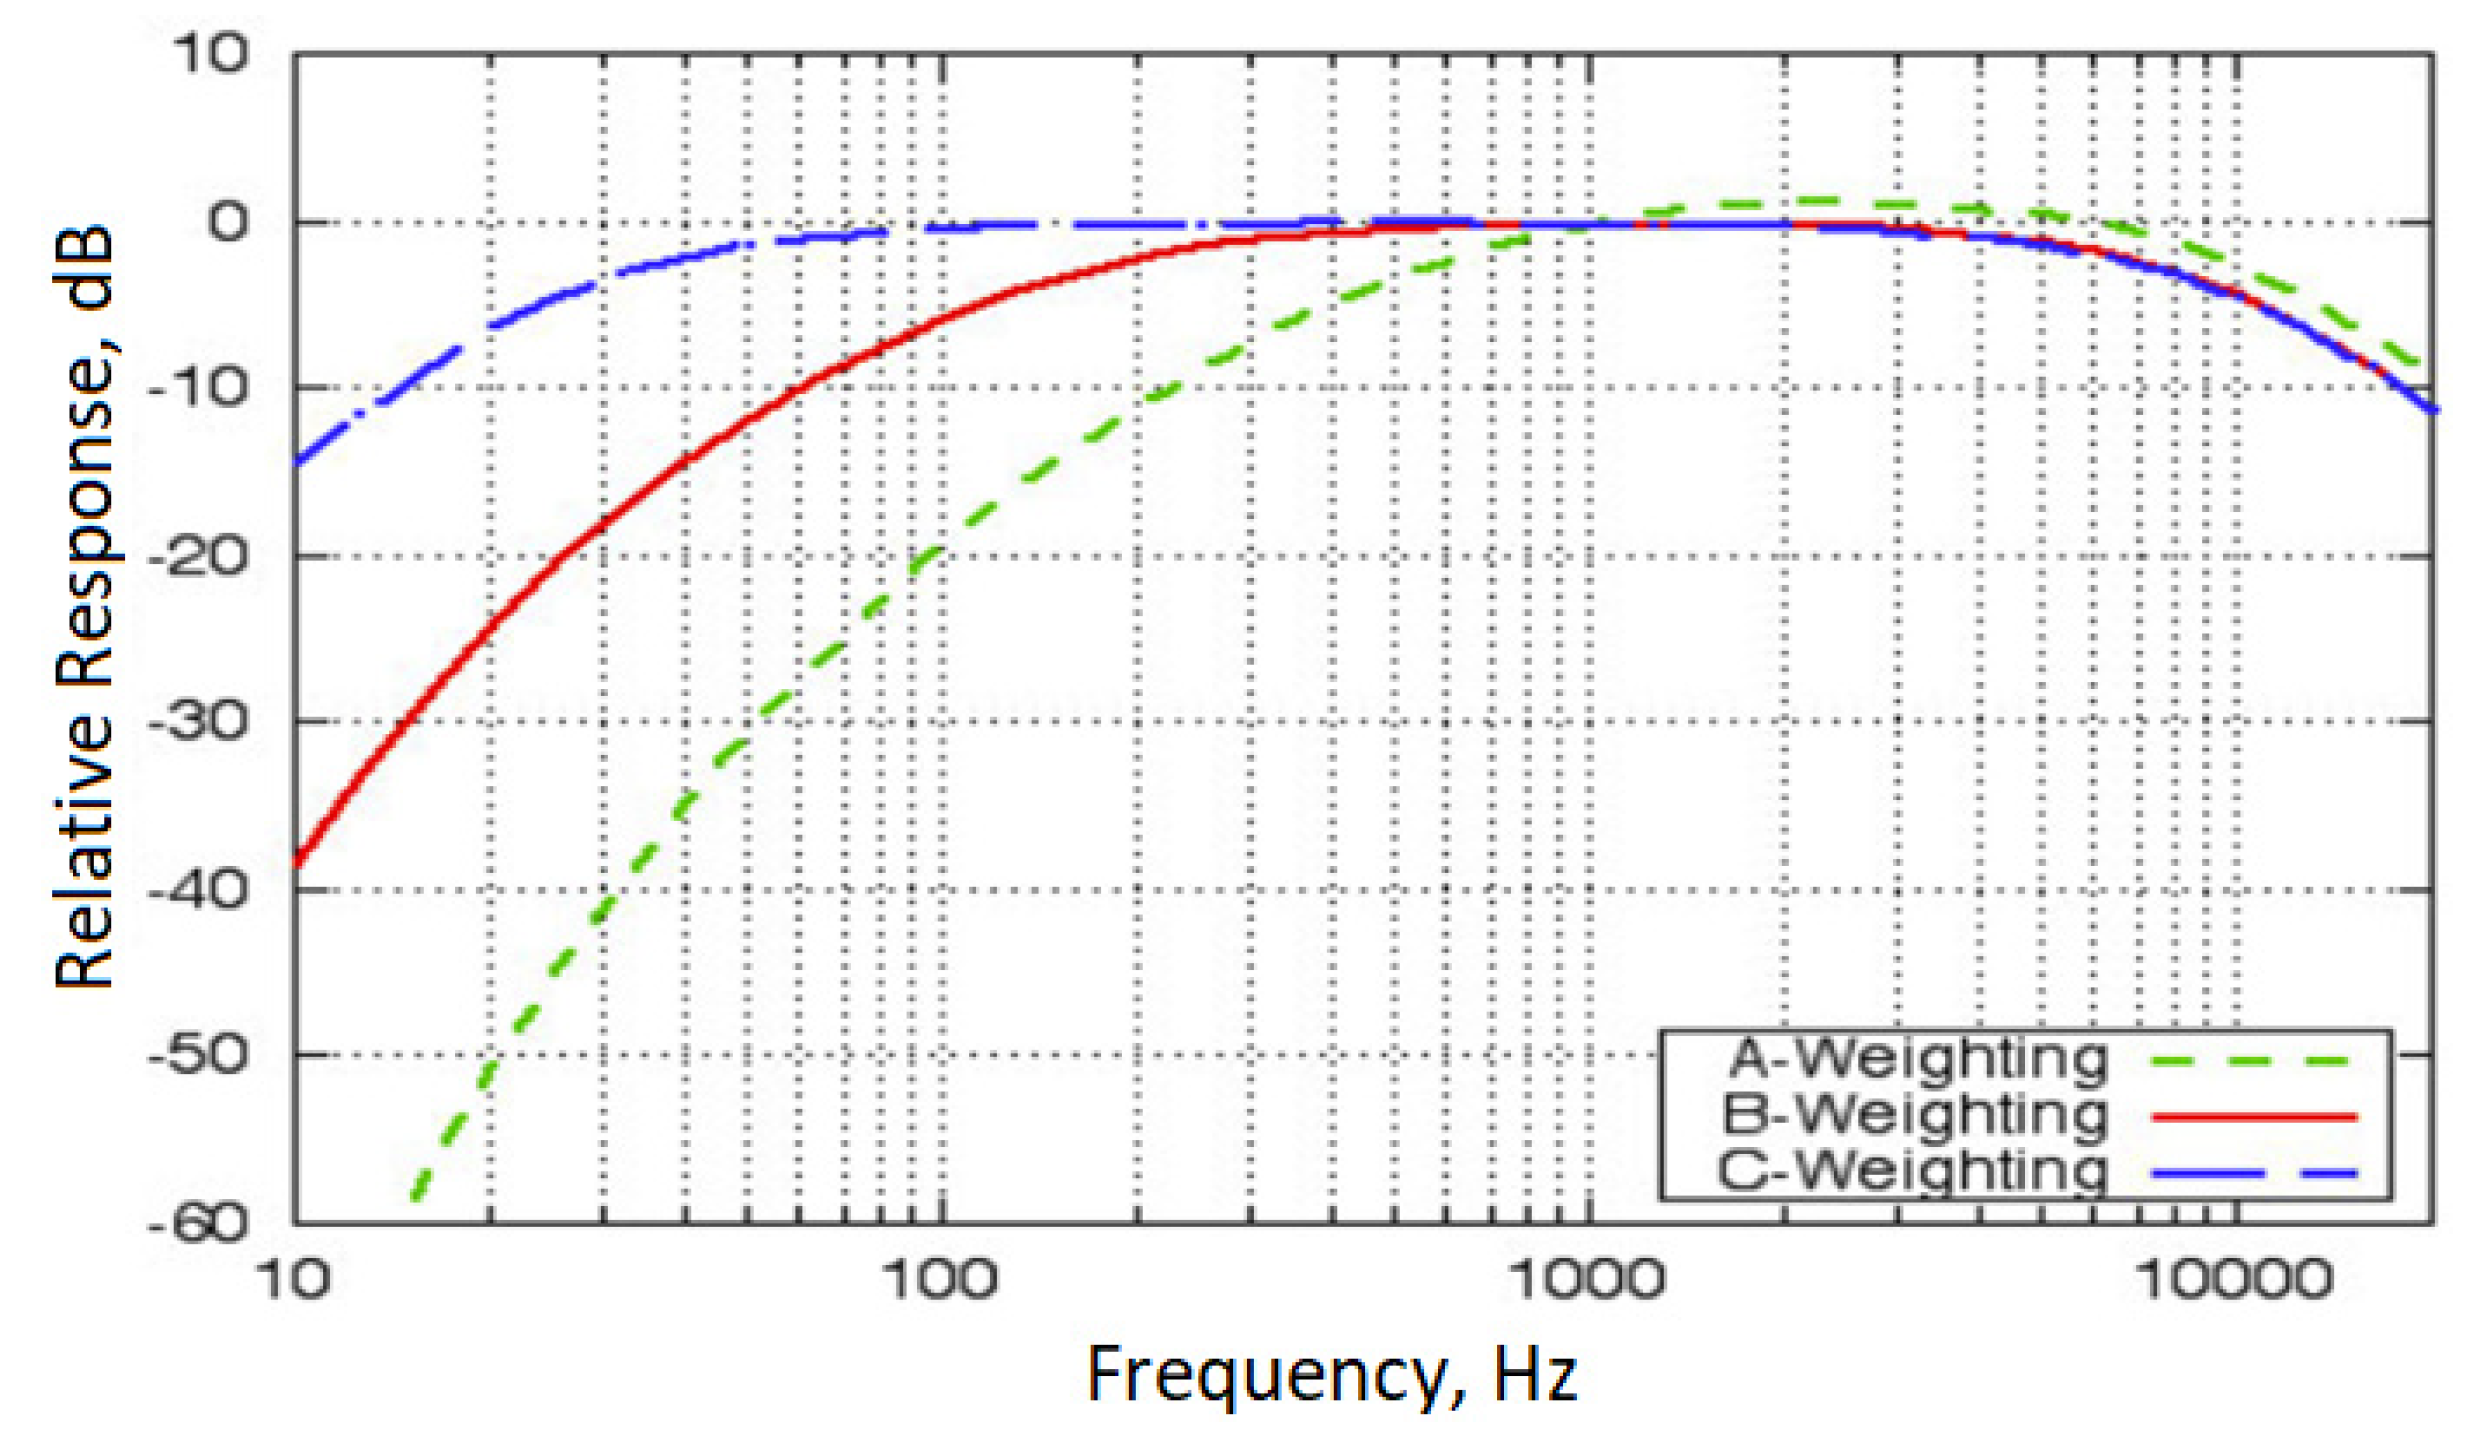
Figure 4.
B-Frequency response of the weighting filter.
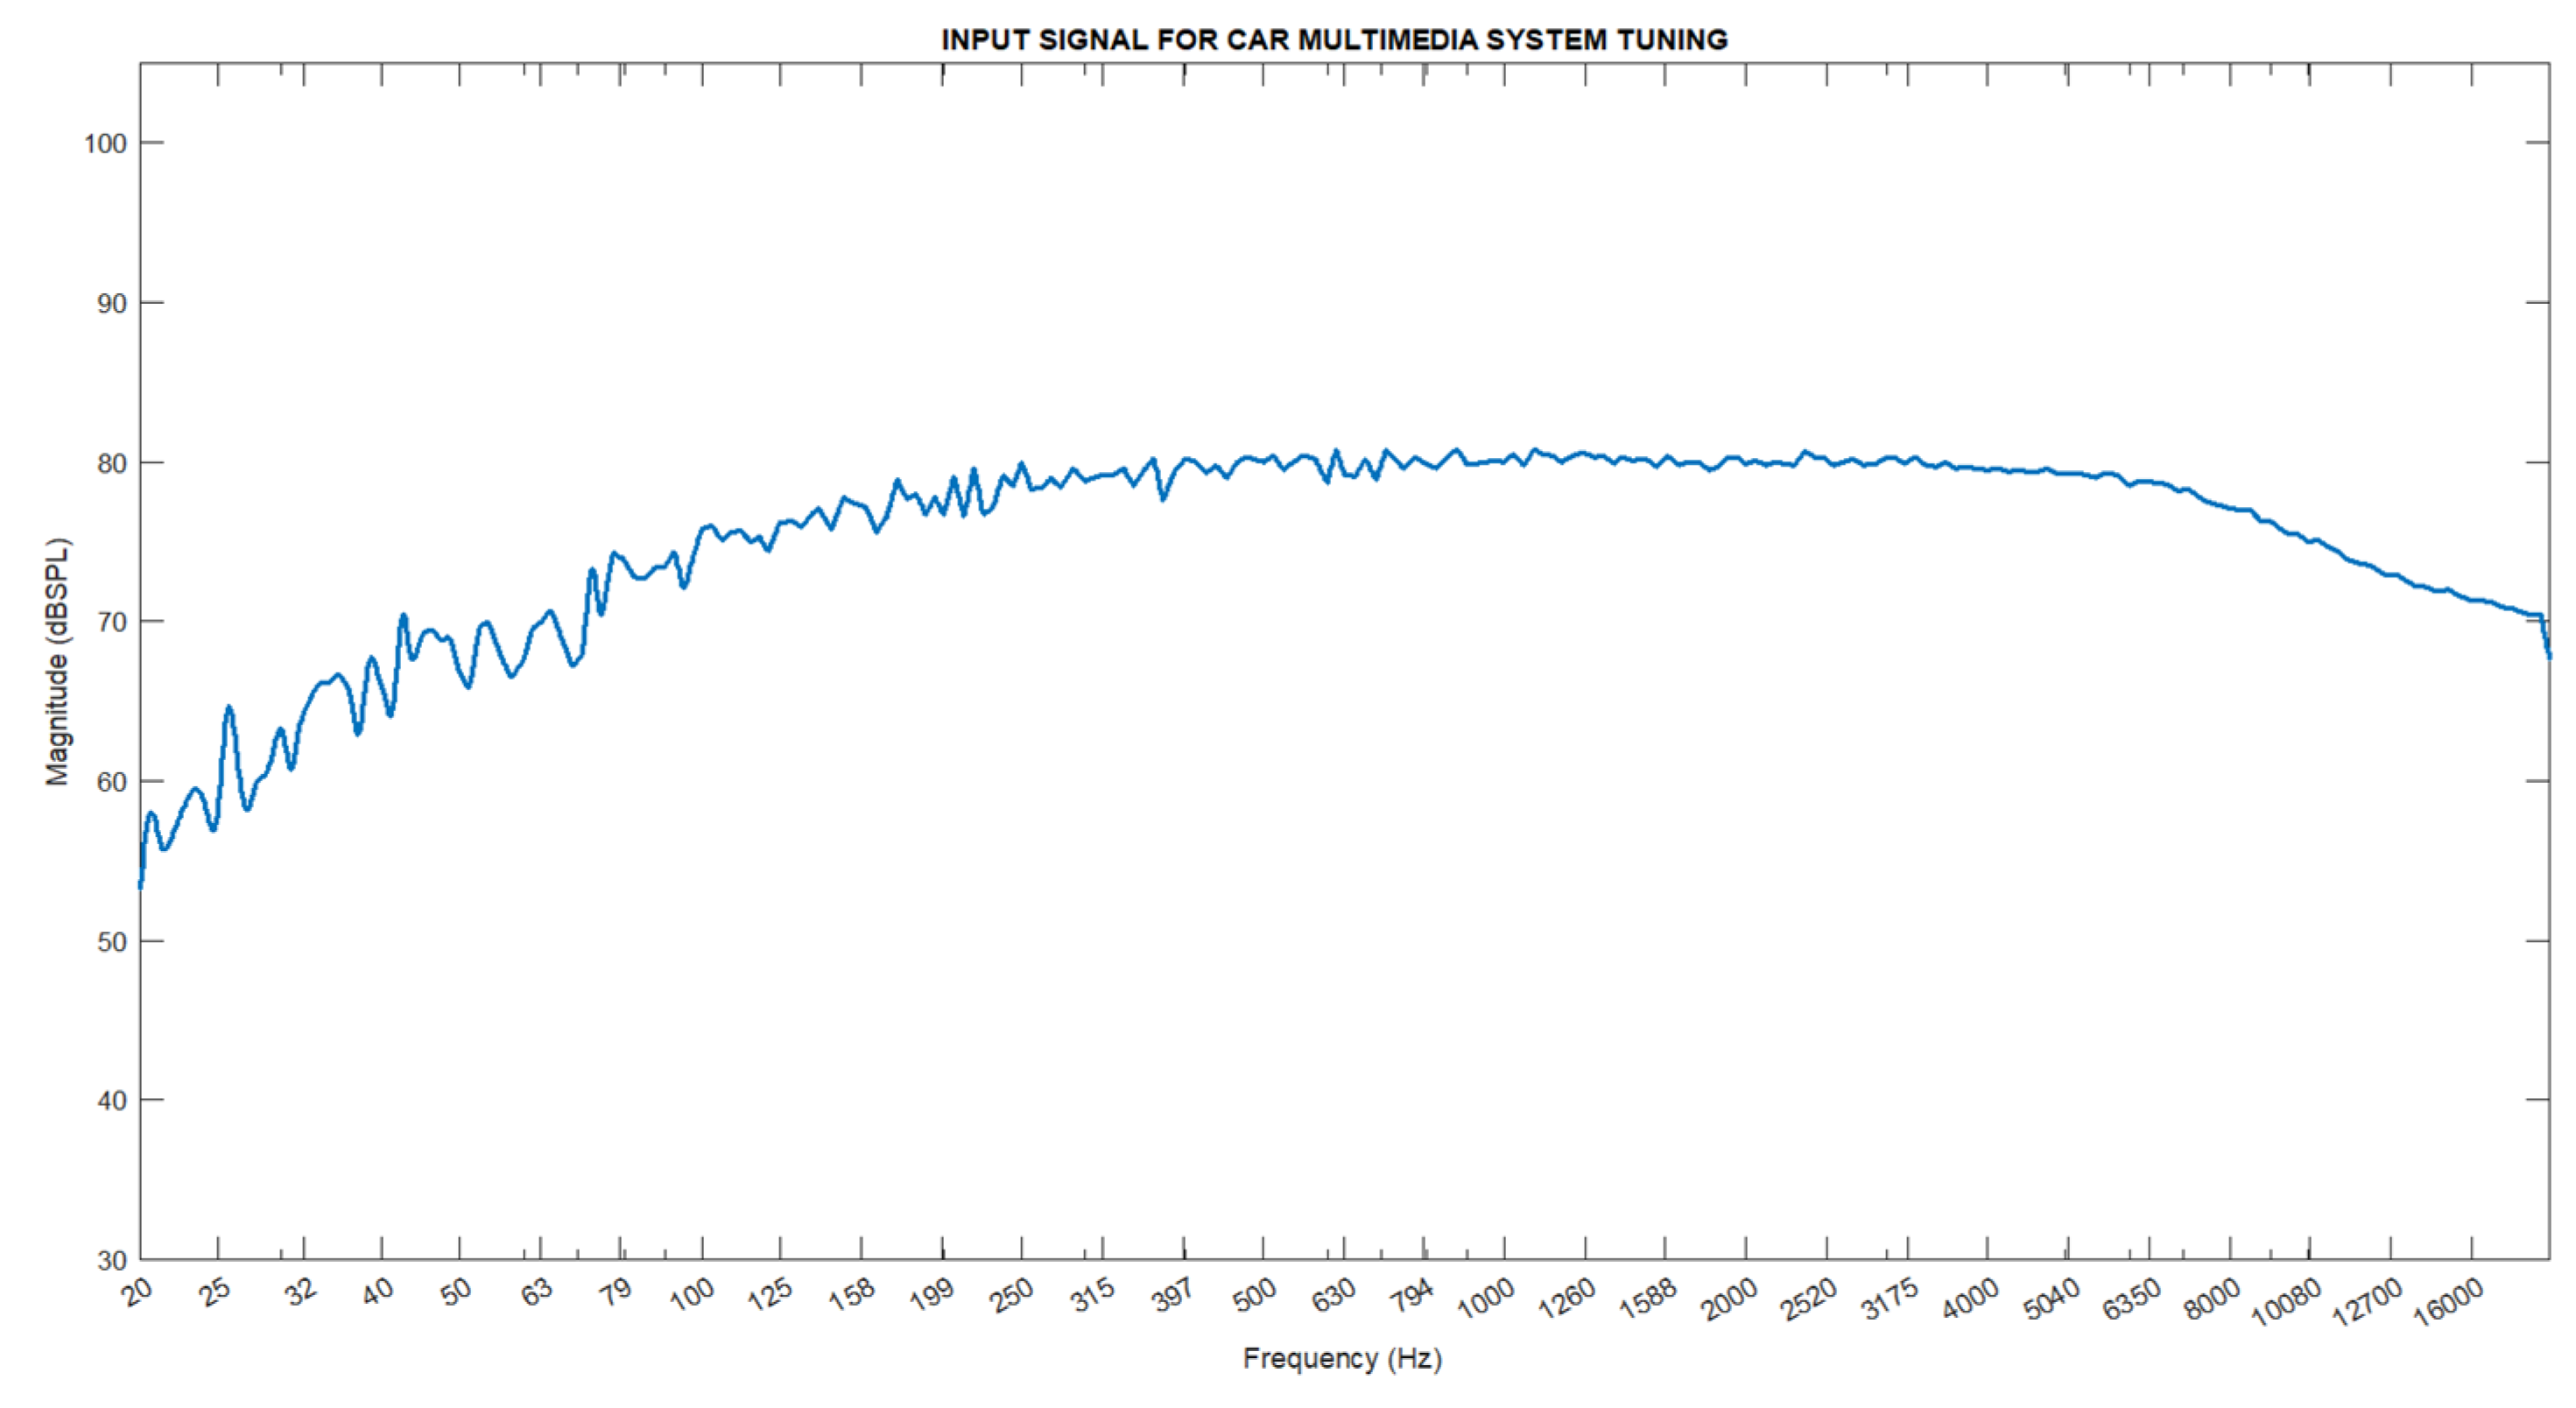
Figure 5.
Class-D Amplifier Load Response.
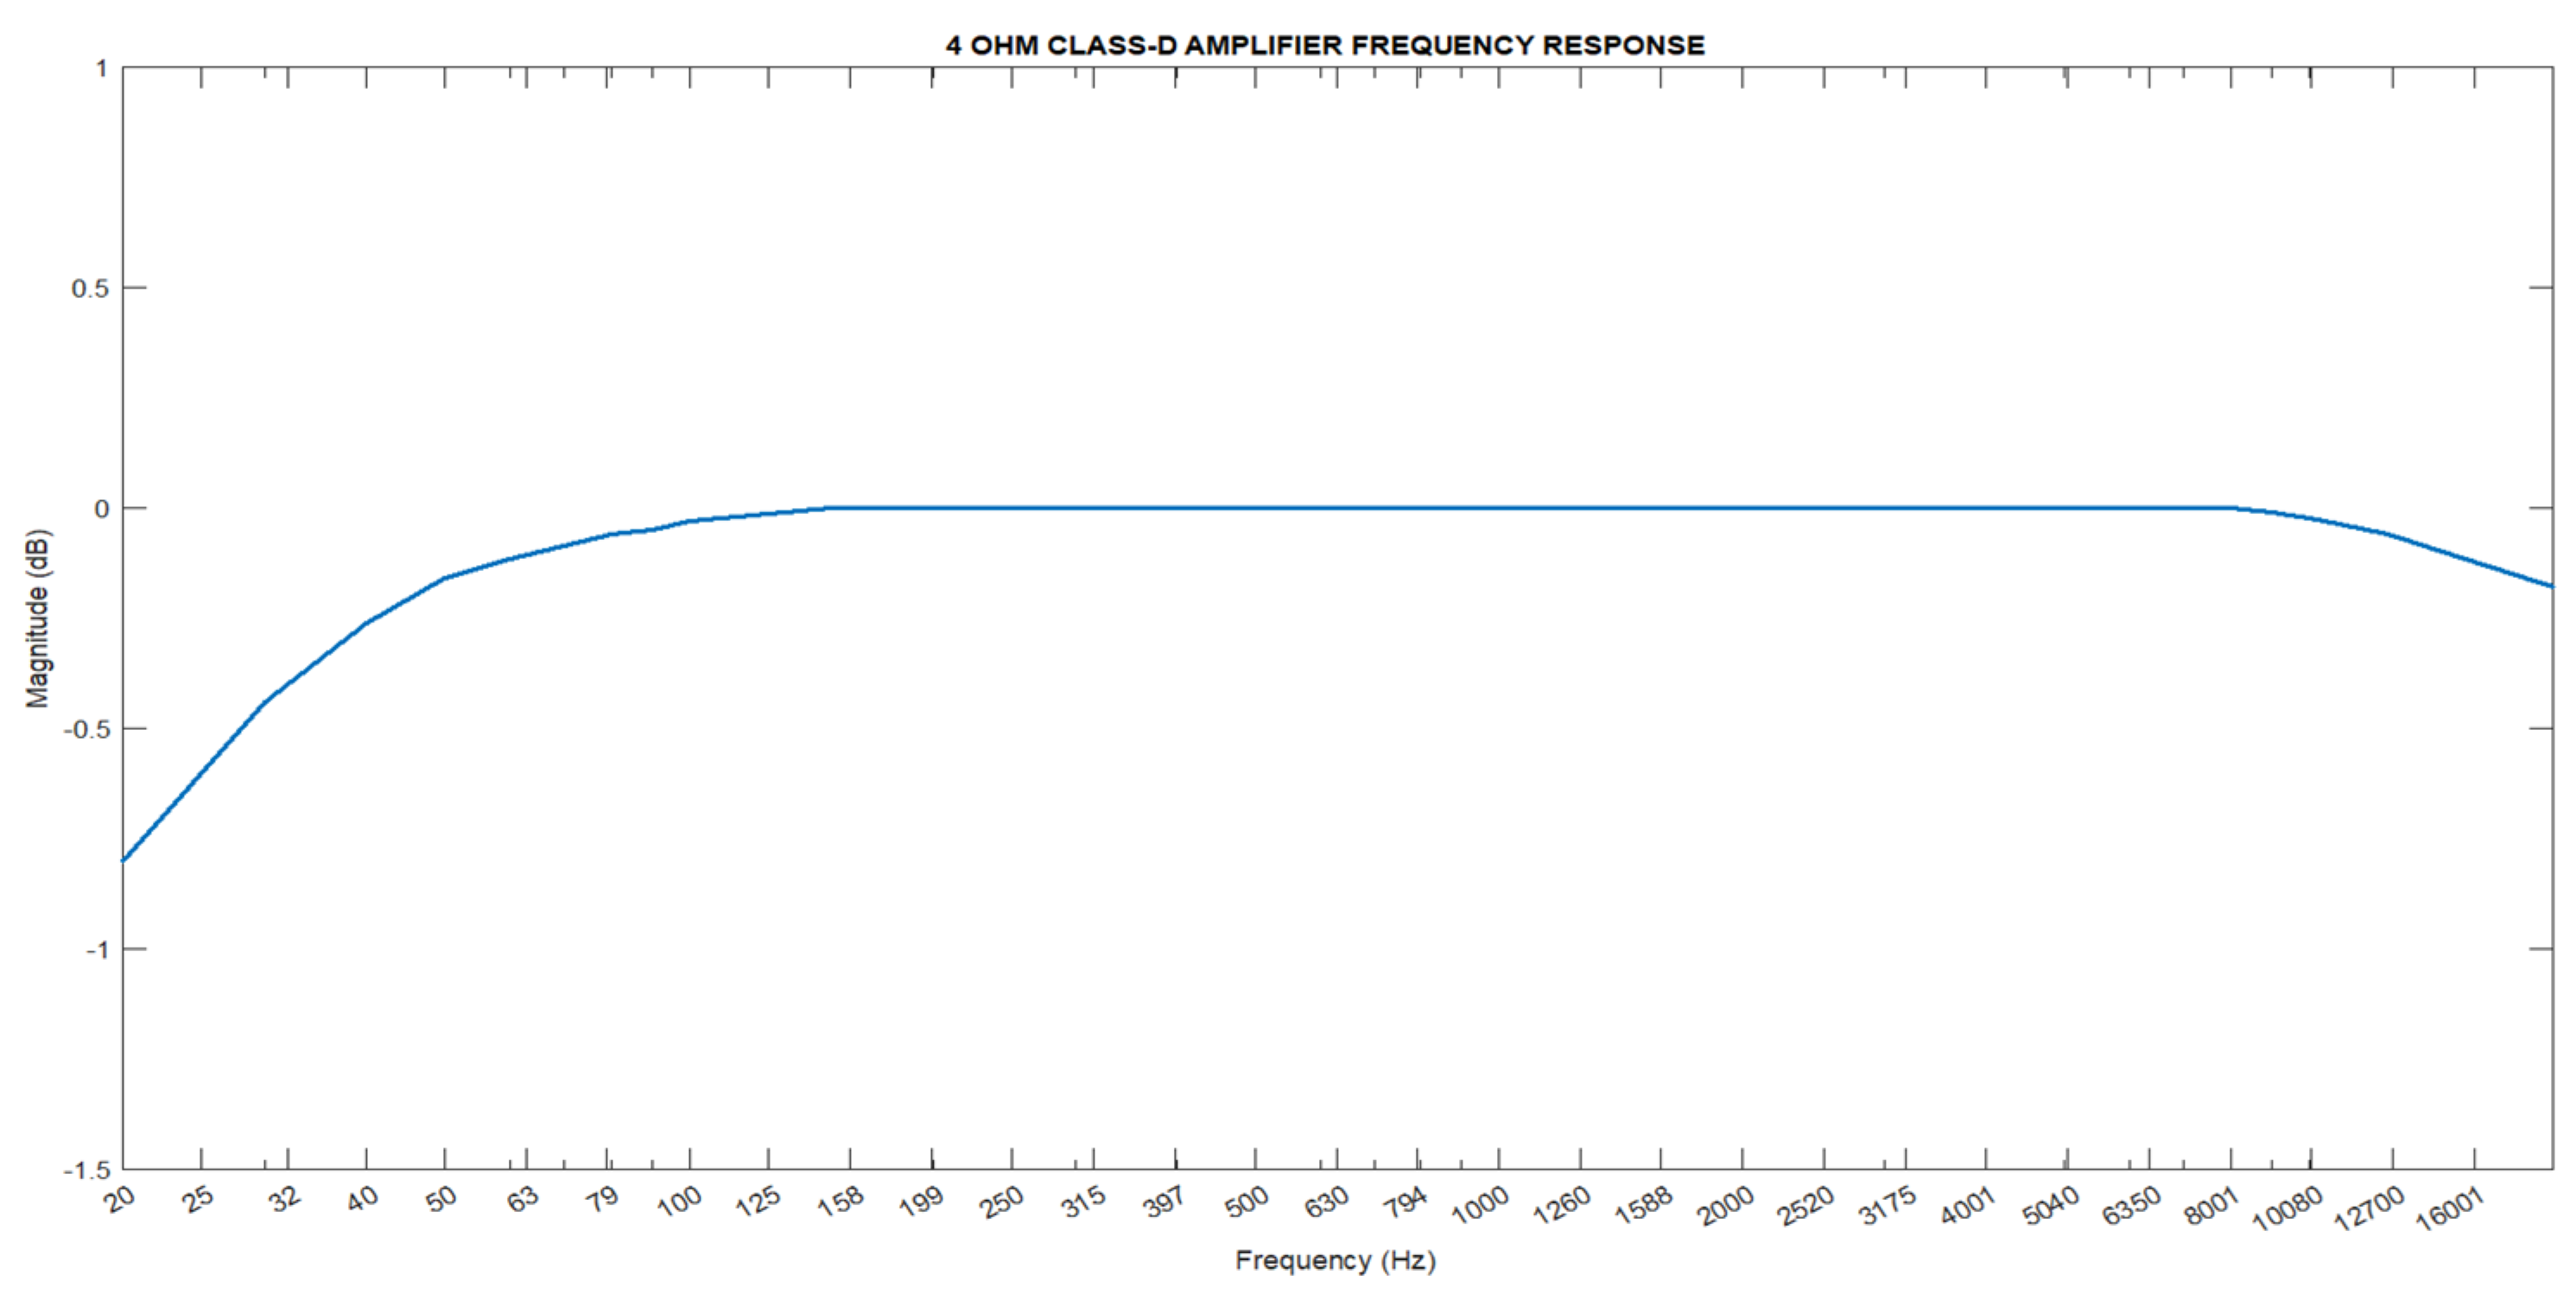
Figure 6.
Full-Range Speaker Frequency Response.
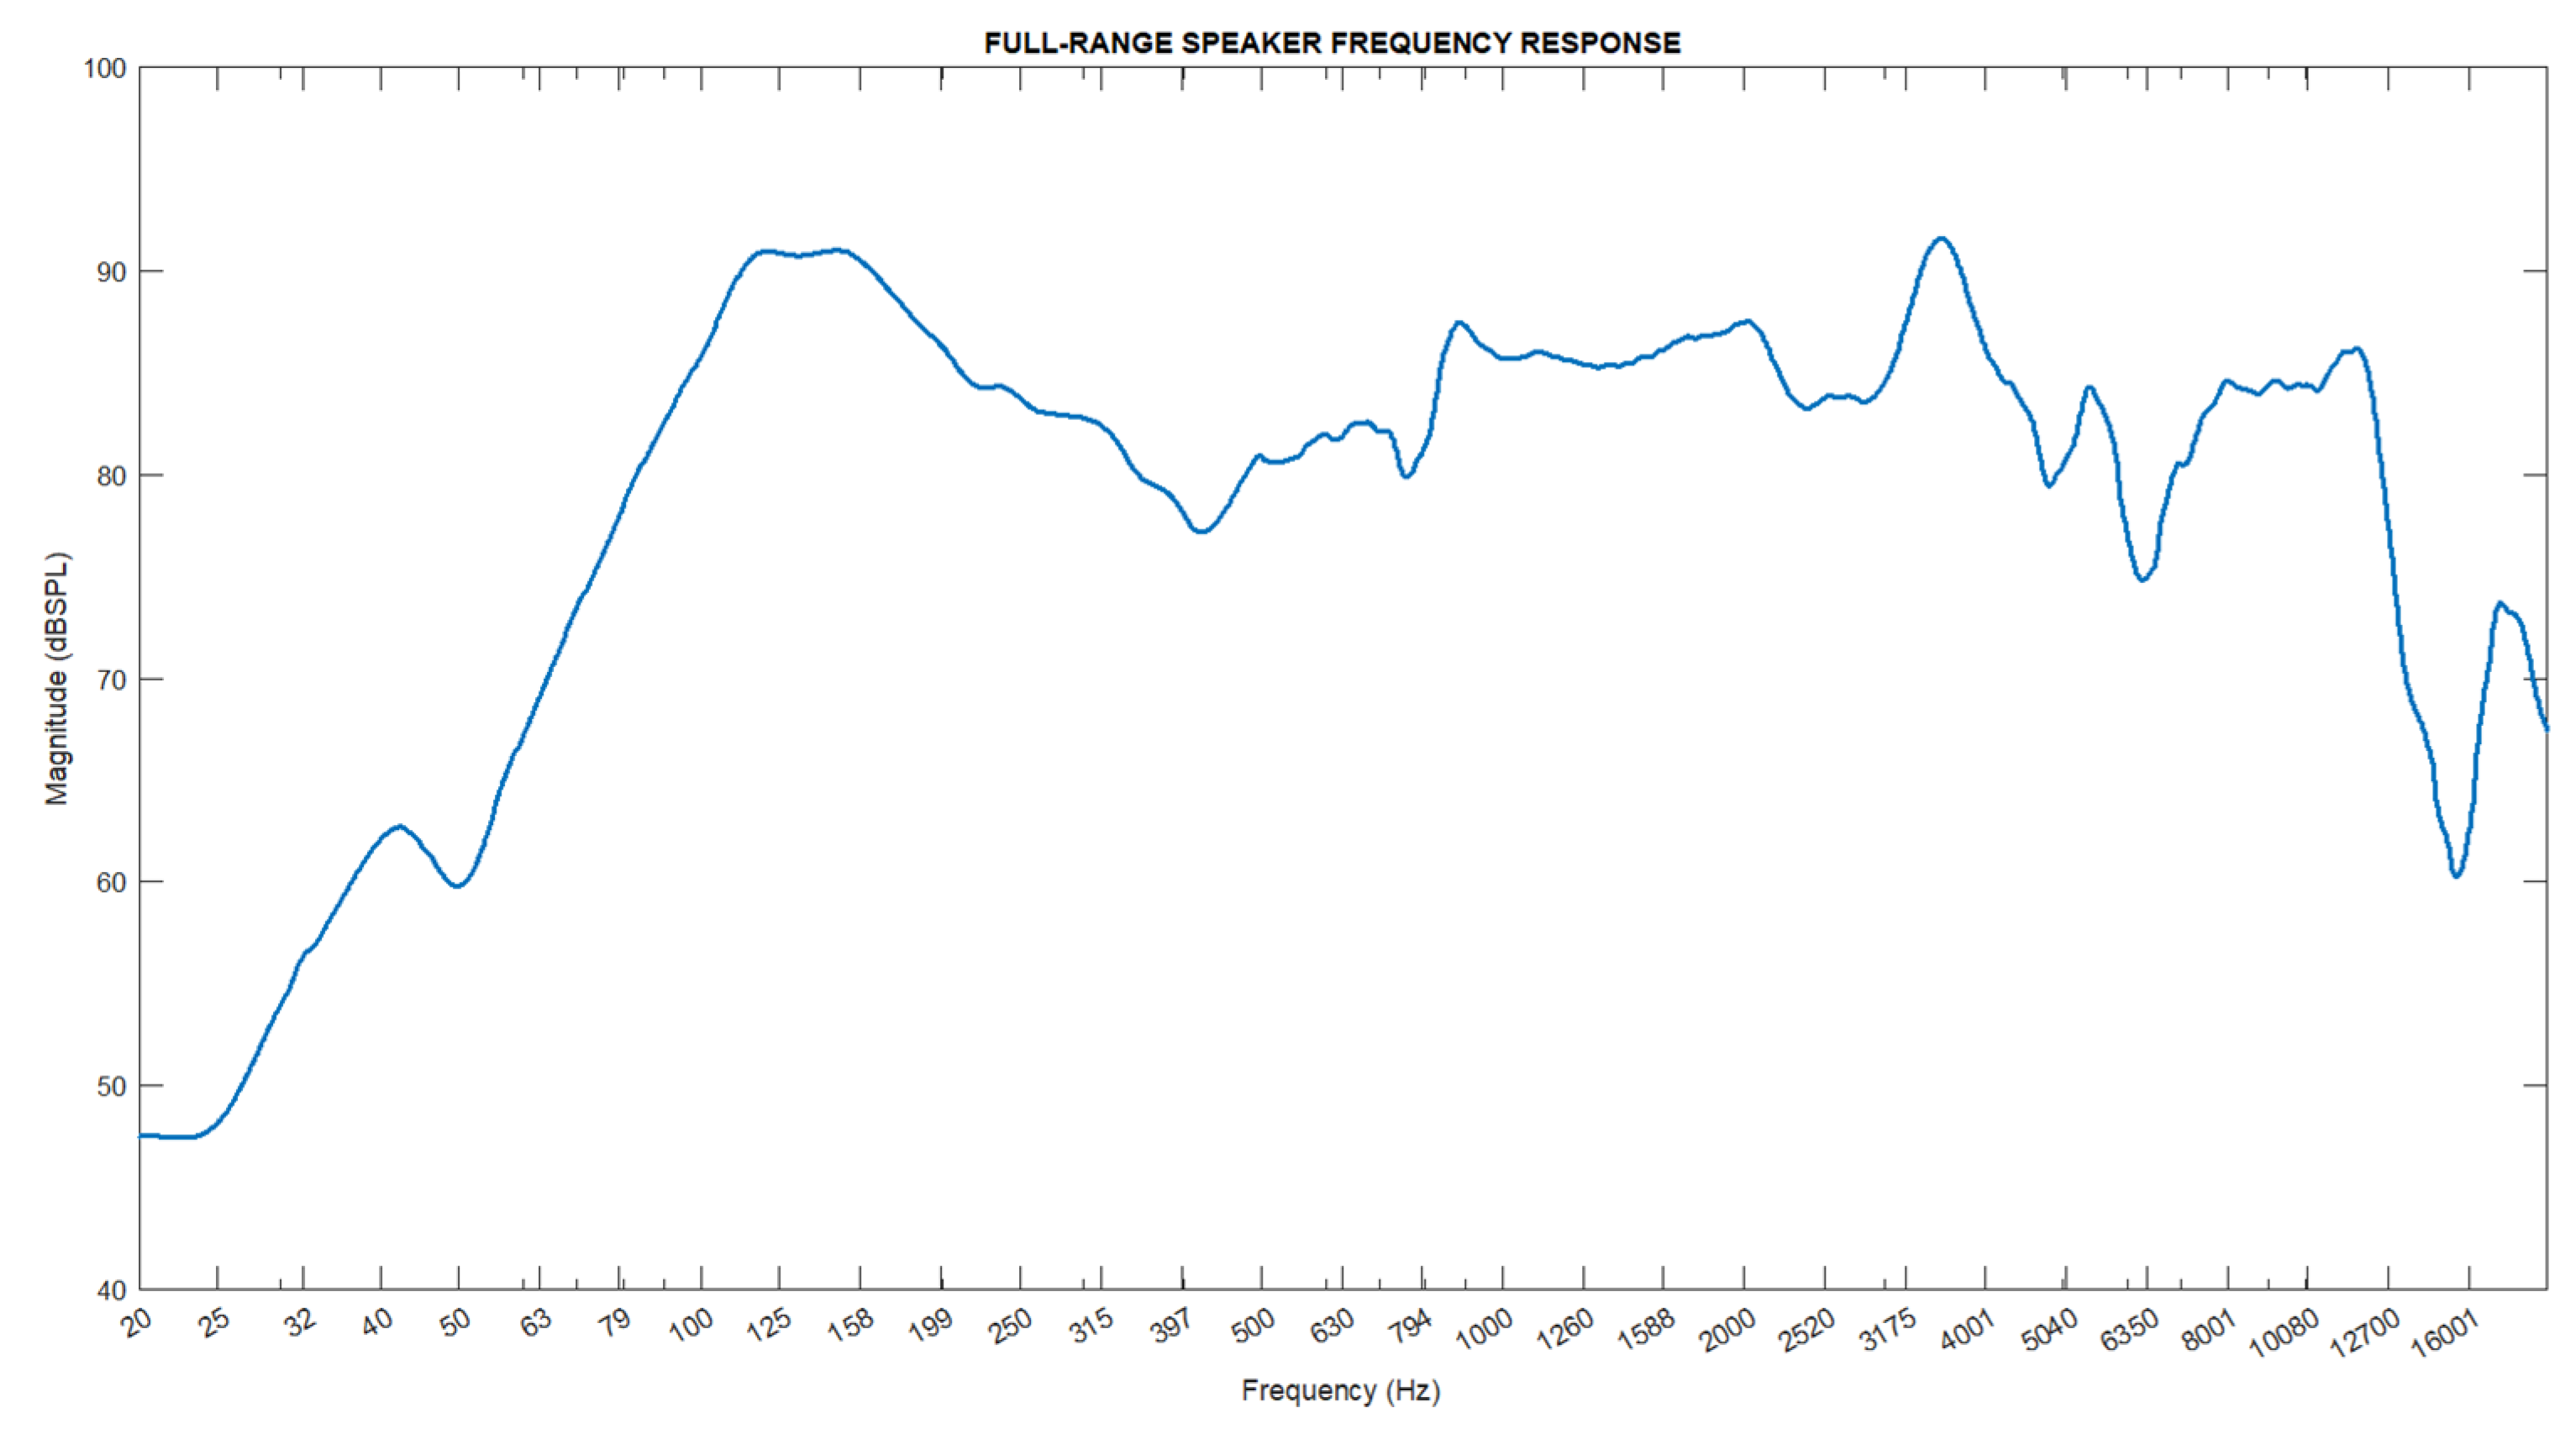
Figure 7.
Comparison of simulation results of speaker output obtained with ideal filter parameters and the equal loudness contour.
Figure 7.
Comparison of simulation results of speaker output obtained with ideal filter parameters and the equal loudness contour.
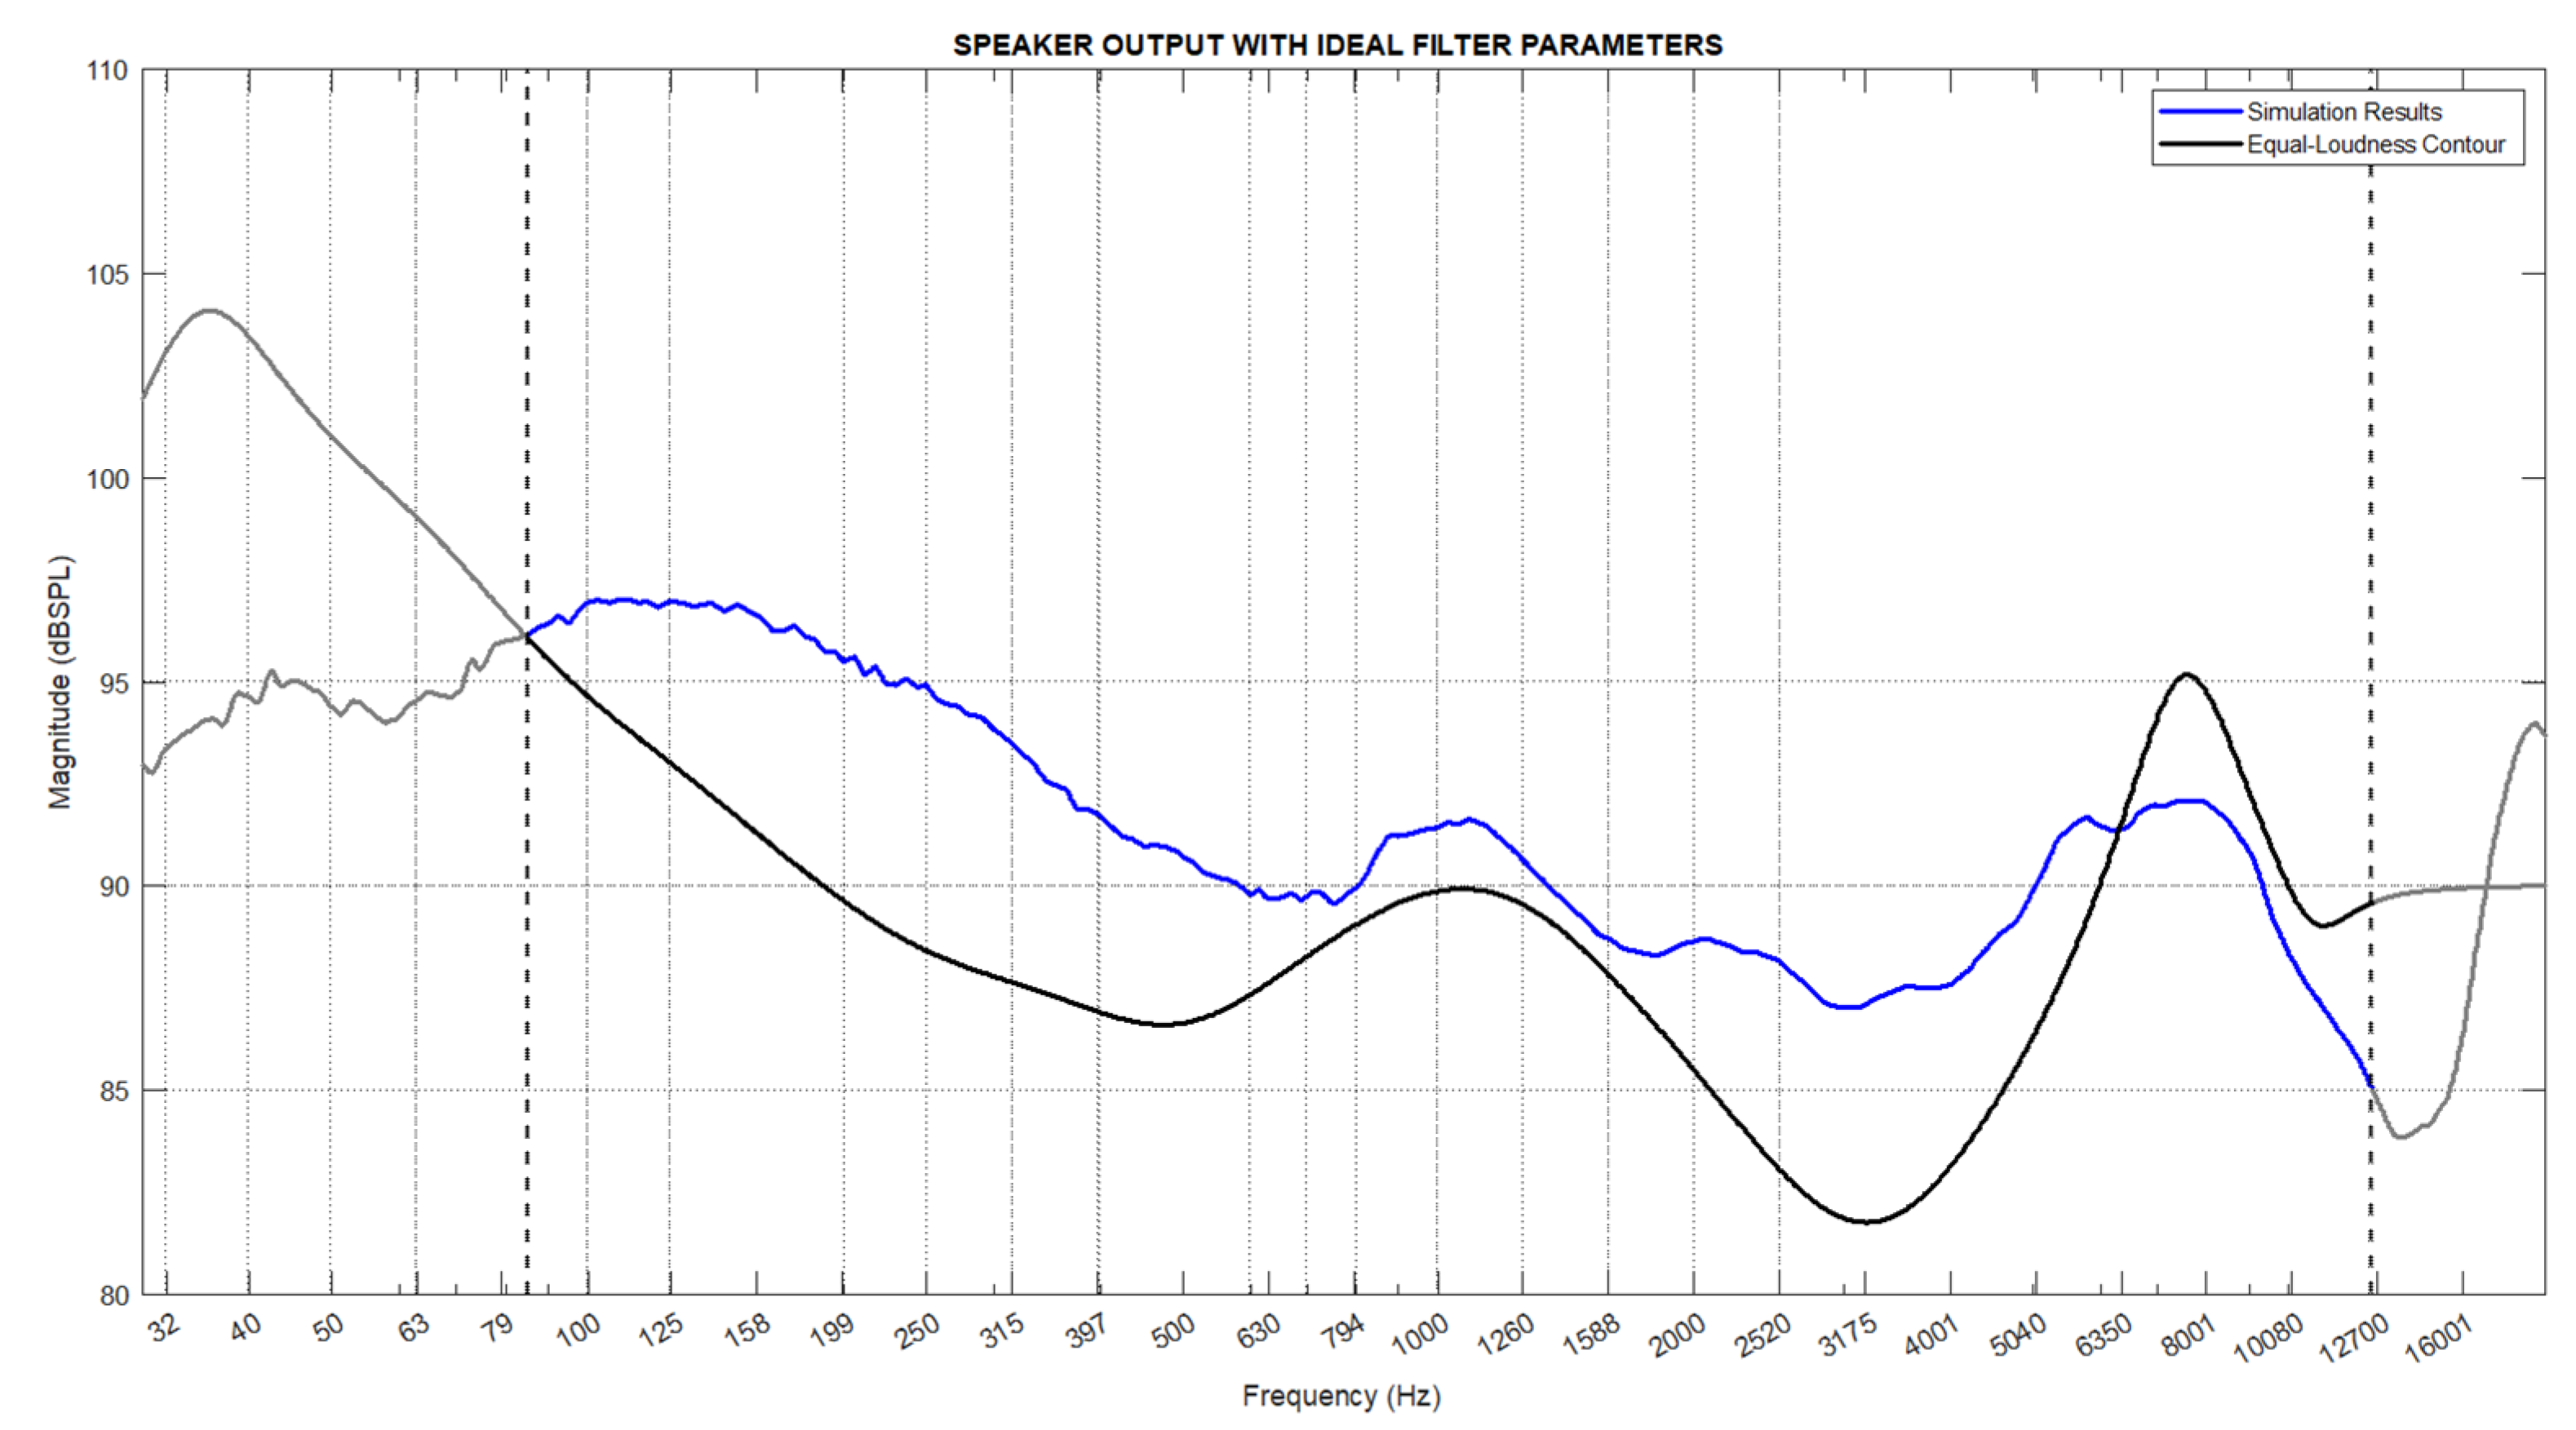
Figure 8.
Test setup in a laboratory environment (Real-world scenario).
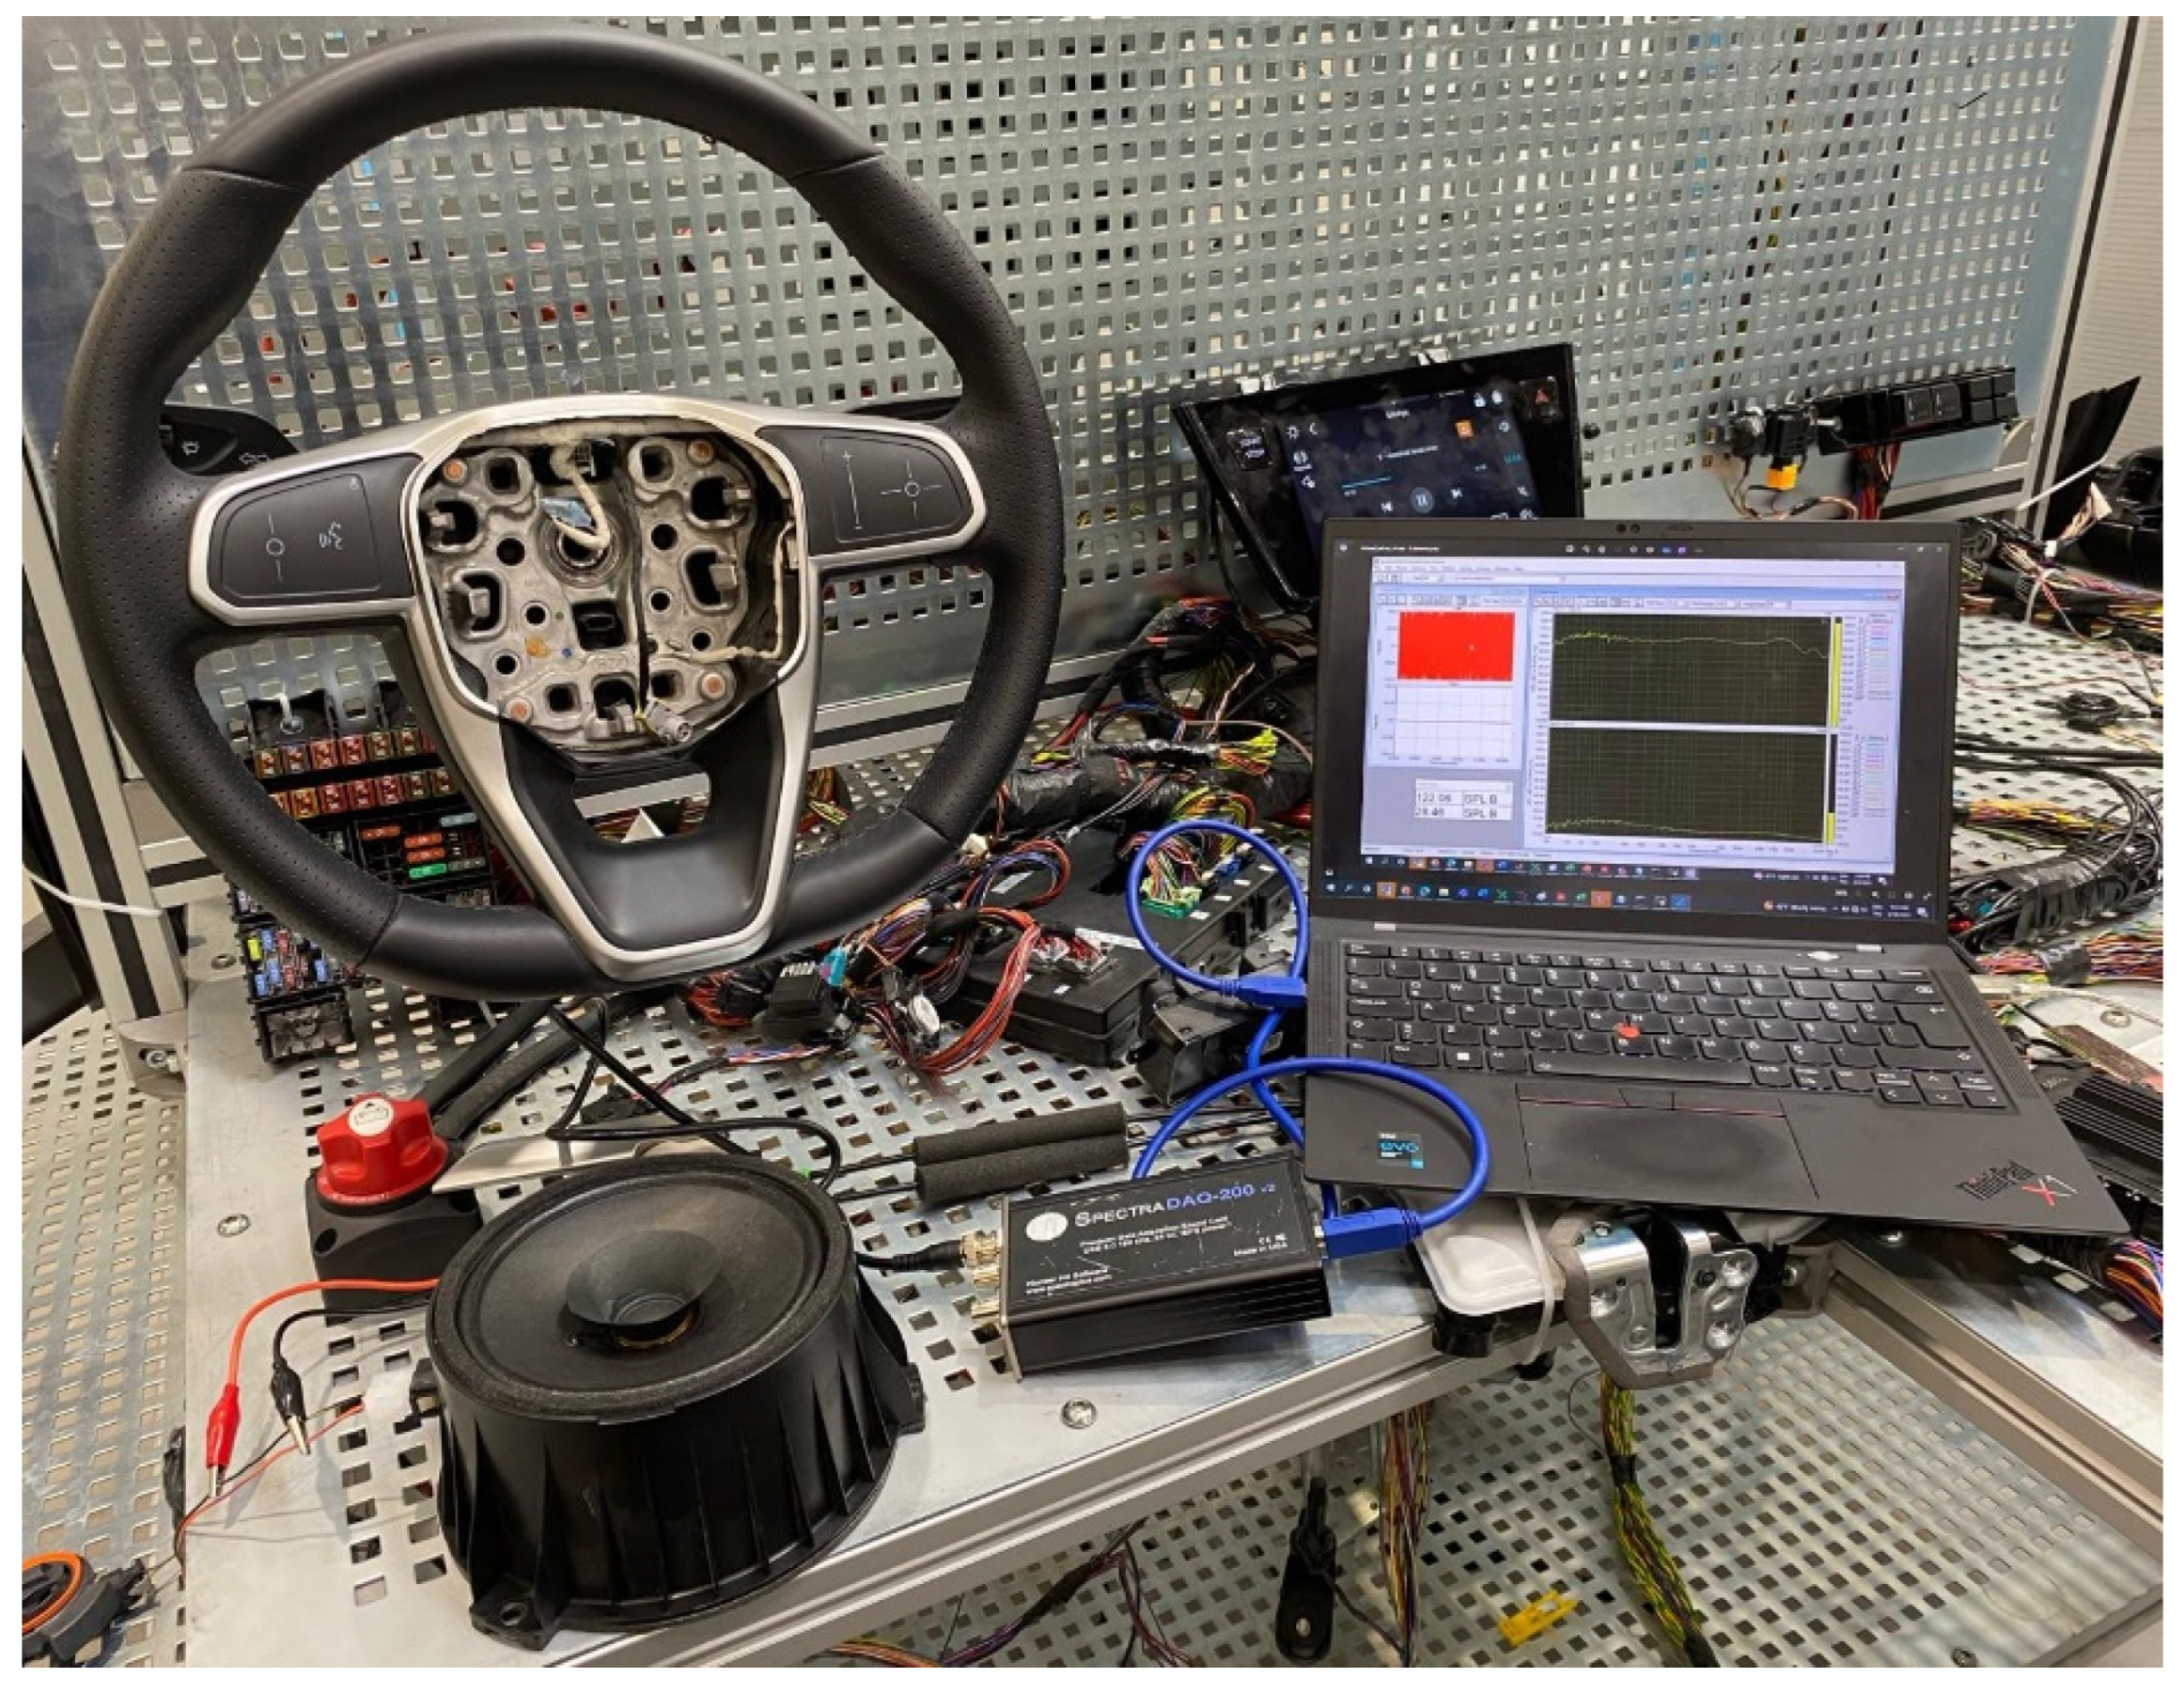
Figure 9.
Comparison of simulation, experimental, and equal loudness contour for speaker output obtained with ideal filter parameters.
Figure 9.
Comparison of simulation, experimental, and equal loudness contour for speaker output obtained with ideal filter parameters.
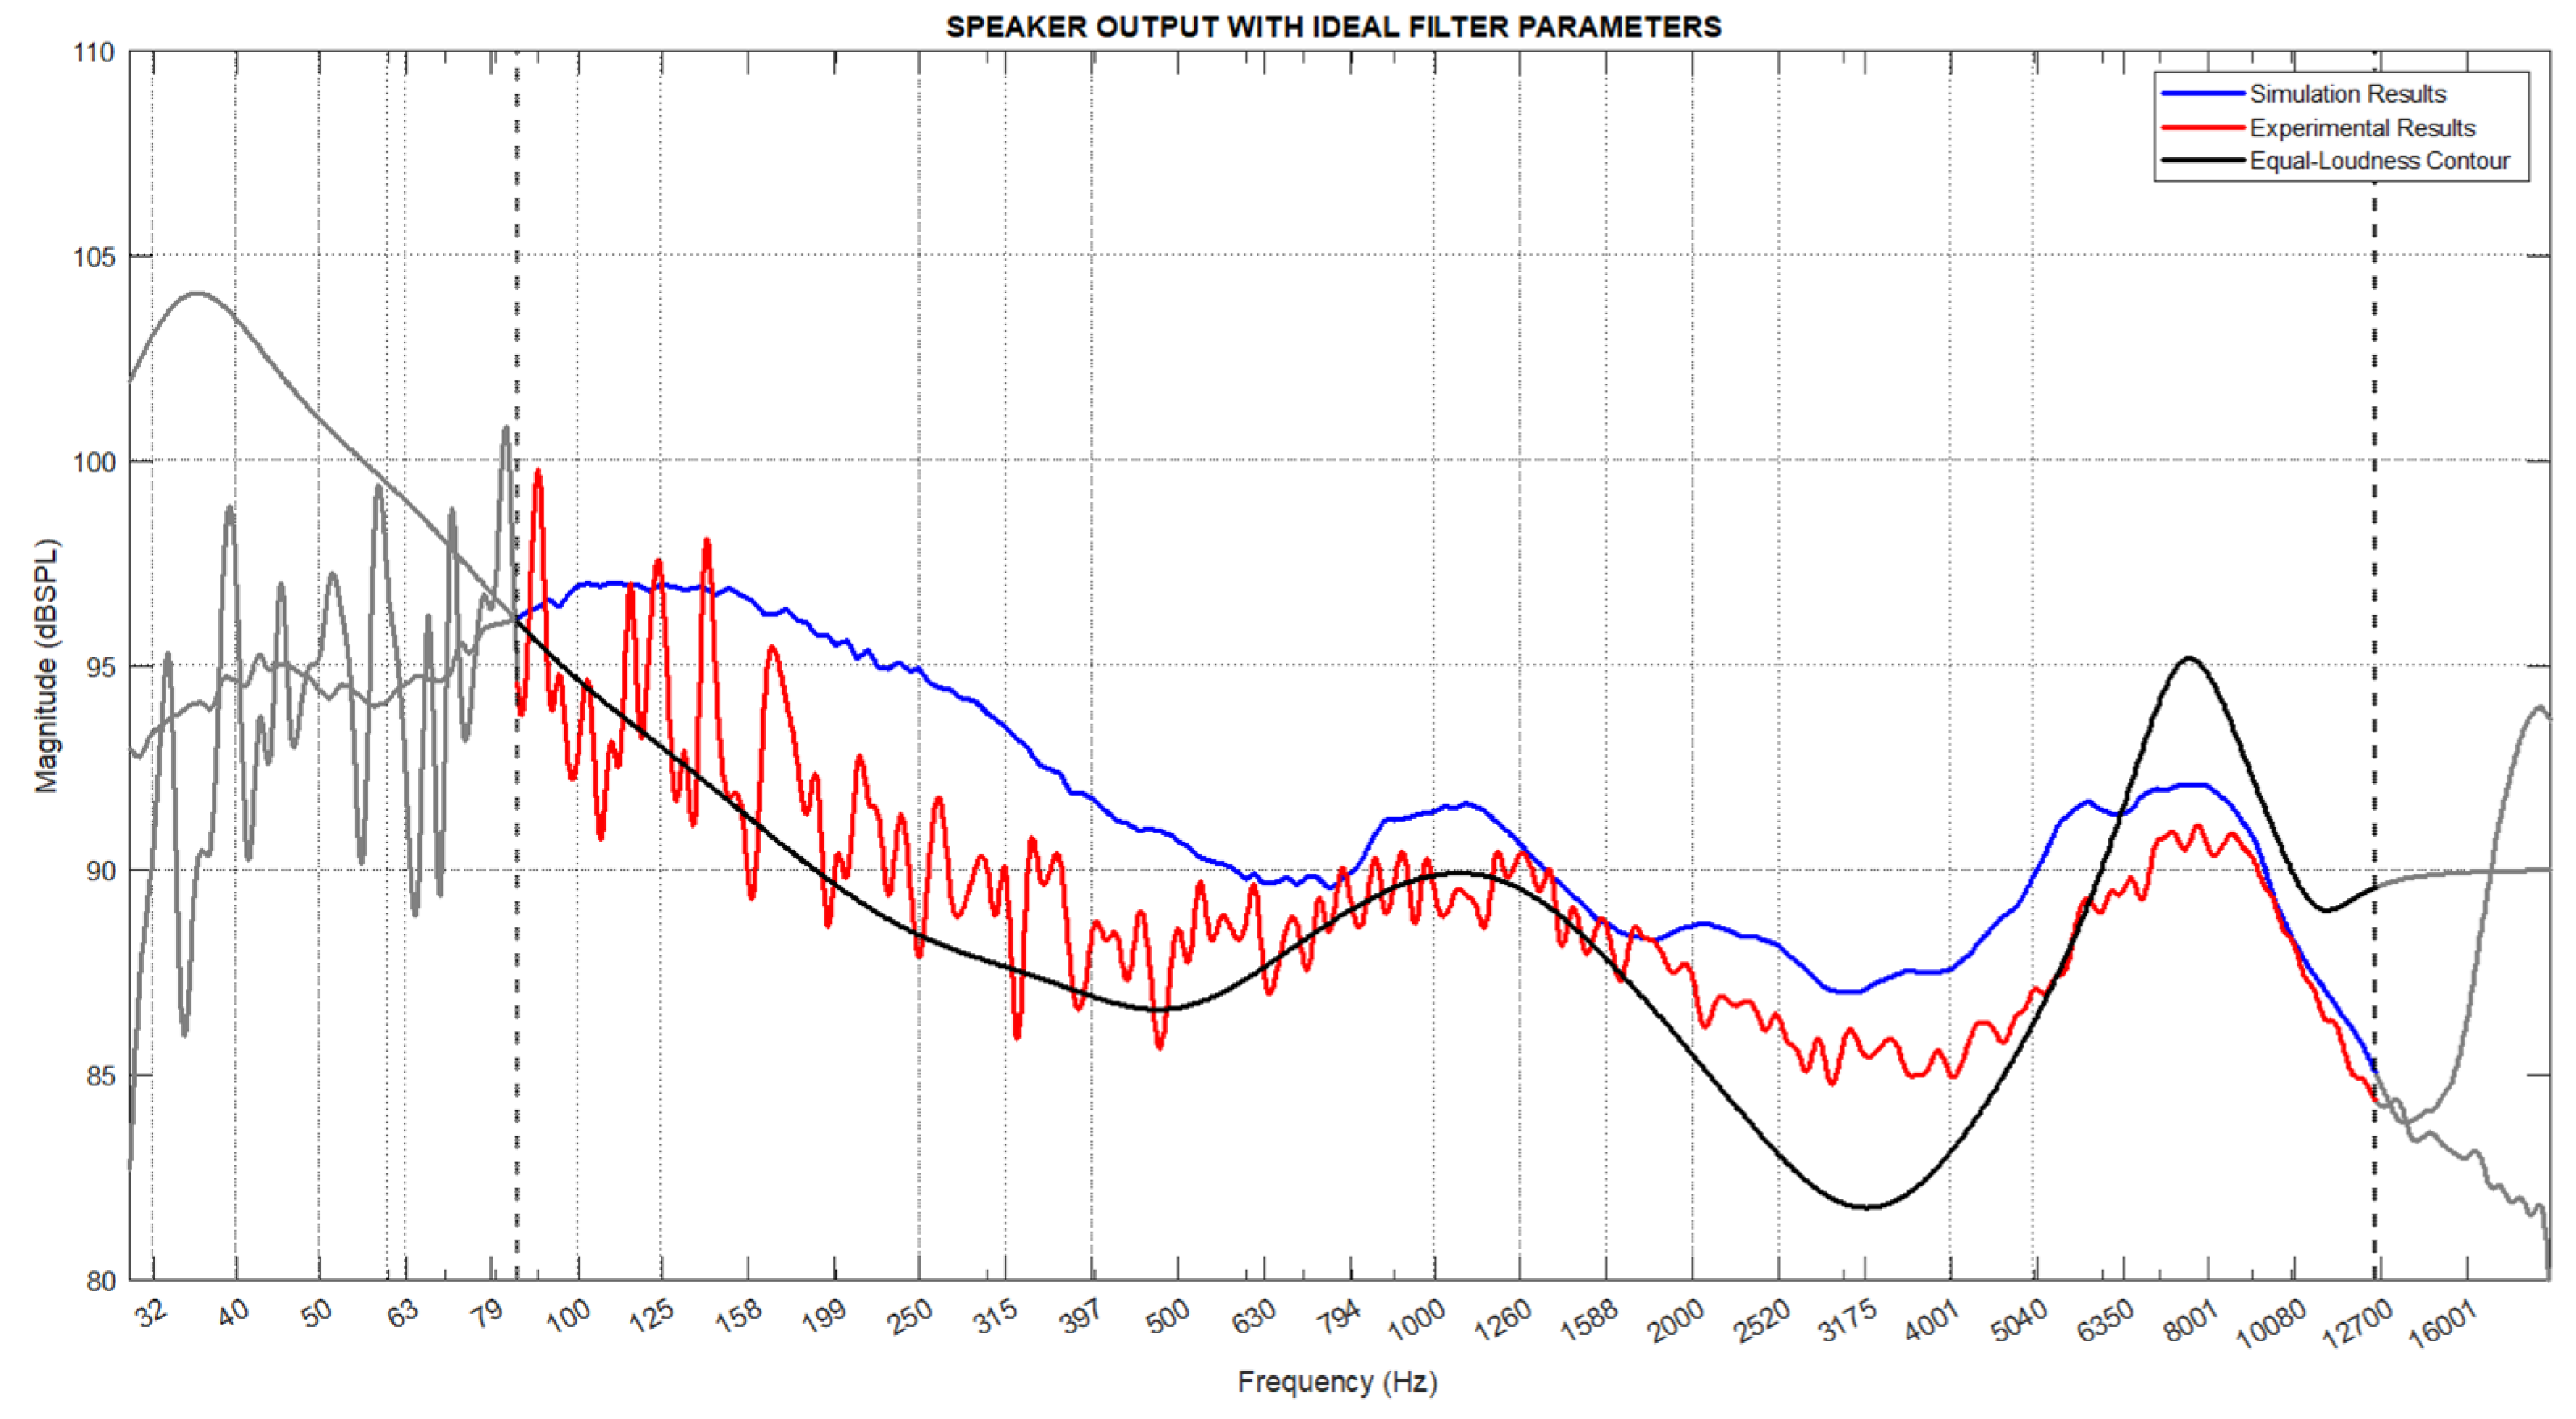
Figure 10.
Comparison of simulation, experimental, and equal loudness contour for speaker output obtained with optimized filter parameterss.
Figure 10.
Comparison of simulation, experimental, and equal loudness contour for speaker output obtained with optimized filter parameterss.
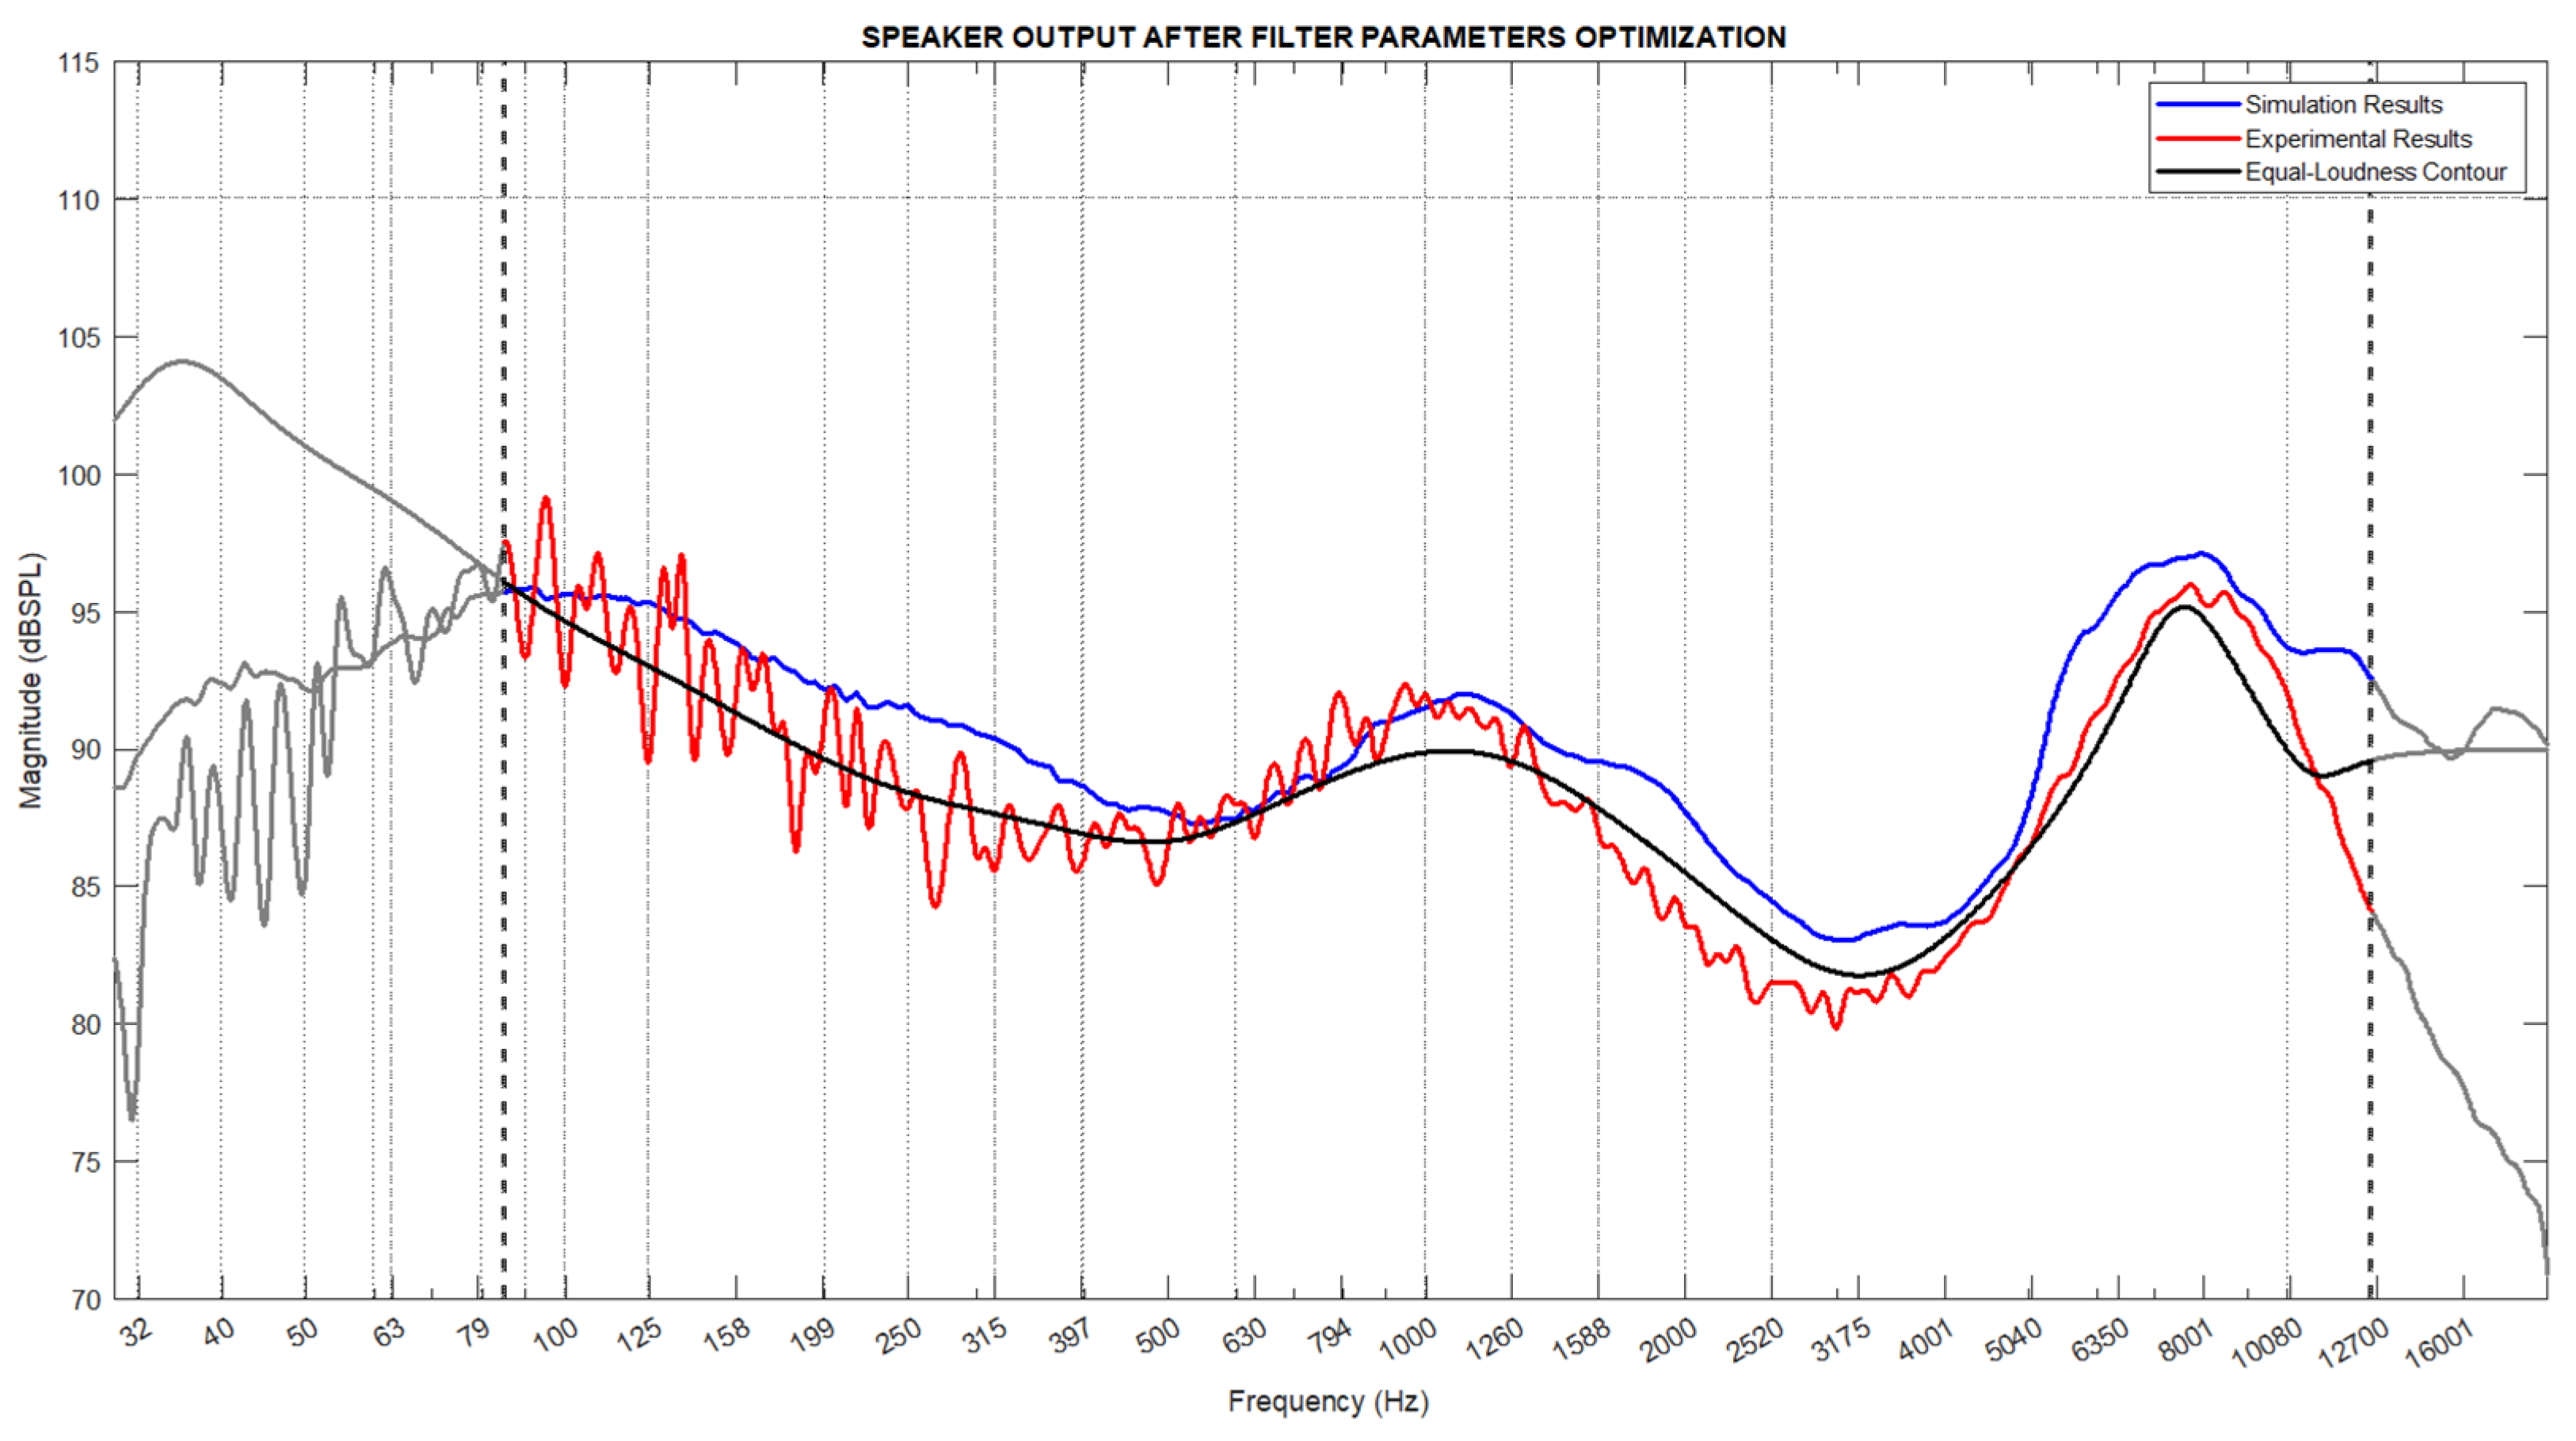

Table 1.
ISO_226_2003 norm Equal Loudness Contour filter values.
| Center Frequency Values (Hz) | Gain Values (dB) | Q Factor Values |
|---|---|---|
| 55 | 10.4 | 0.9 |
| 71 | 11.2 | 0.6 |
| 125 | -2.4 | 0.7 |
| 250 | -2.4 | 0.7 |
| 500 | -1.2 | 0.7 |
| 1060 | 7.5 | 1.0 |
| 1280 | 2.0 | 0.9 |
| 3220 | -10.0 | 1.0 |
| 6400 | 10.5 | 1.9 |
| 8100 | 9.5 | 2.0 |
Table 2.
Frequency Ranges of Speakers.
| Speaker Type | Frequency Range |
|---|---|
| Subwoofer | 20 Hz – 200 Hz |
| Woofer | 04 Hz – 500 Hz |
| Mid-Range | 250 Hz – 4000 Hz |
| Tweeter | 2000 Hz – 20000 Hz |
| Full-Range | 80 Hz – 12500 Hz |
Table 3.
Parametric equalizer filter parameters obtained from the optimization.
| Center Frequency Values (Hz) | Gain Values (dB) | Q Factor Values |
|---|---|---|
| 57 | 11.9 | 0.9 |
| 64 | 11.9 | 0.6 |
| 159 | -0.5 | 1.1 |
| 340 | -3.3 | 0.7 |
| 596 | 0.6 | 0.7 |
| 889 | 6.1 | 1.2 |
| 1160 | 7.0 | 0.9 |
| 3321 | -11.8 | 0.9 |
| 6775 | 12.0 | 1.6 |
| 7797 | 11.4 | 1.7 |
Disclaimer/Publisher’s Note: The statements, opinions and data contained in all publications are solely those of the individual author(s) and contributor(s) and not of MDPI and/or the editor(s). MDPI and/or the editor(s) disclaim responsibility for any injury to people or property resulting from any ideas, methods, instructions or products referred to in the content. |
© 2024 by the authors. Licensee MDPI, Basel, Switzerland. This article is an open access article distributed under the terms and conditions of the Creative Commons Attribution (CC BY) license (http://creativecommons.org/licenses/by/4.0/).
Copyright: This open access article is published under a Creative Commons CC BY 4.0 license, which permit the free download, distribution, and reuse, provided that the author and preprint are cited in any reuse.


