
Submitted:
05 June 2024
Posted:
07 June 2024
You are already at the latest version
Abstract
Although the influence of climate on the fire regime is unanimously recognized, most publications are studies on this influence are at the global scale. Therefore, this study aims to demonstrate the role of climate in the incidence of wildfires at the country and regional scale using statistical analysis and machine learning methods. Mainland Portugal was chosen as a case study due to its climate and because it is the European region most affected by wildfires. Results demonstrate the climate signature in the spatial and temporal distribution of the wildfire incidence. The conclusions of the study include (i) the existence of two pyro-regions, with different types of climate (Csb and Csa) composed of NUTS II regions: the northern region composed of the Norte and Centro regions and the southern region composed of Alentejo and Algarve; (ii) the intra-annual variability in the incidence of wildfires, characterized by two peaks, one in spring and the other in summer, are a consequence of the country's type of climate; and, (iii) how the annual cycle of wildfire incidence varies over the years depends on the weather conditions throughout each year. These results are of fundamental importance for wildfire managers, especially in the context of climate change.
Keywords:
wildfire
; climate impact
; spatial distribution
; intra-annual variability
; Portugal
1. Introduction
Wildfire is a global scale and continuous phenomenon observed in almost all regions and climates of the world, namely, in Australia, in the savanna ring surrounding the tropical forests of central Africa, in the agricultural lands and savanna extending into the Amazon Basin, in the forest of the Mediterranean Basin, in the rangelands and forests of North America and Central Asia, in southern Asia’s forests and rice fields, in the grain-producing lands, and in the boreal forests [1]. On average, the annual number of wildfires worldwide has seen considerable variation. During the 2001–2018 period, historical estimates of annual global wildfire burned areas ranged from 394 to 519 million hectares, with an average of 463 million hectares [2]. Wildfires are a fundamental and dynamic factor of both terrestrial and atmospheric systems and a critical component of the natural earth system’s ecological process, at scales ranging from local to global [3,4]. Wildfires can have natural and human causes (lightning/natural, negligent or intentional), and are strongly conditioned and driven by human activities and climatic factors [5,6,7,8,9].
Weather and climate control, directly and indirectly, the most of the aspects of wildfires [10,11]. Climate aids to set the vegetation growth by providing adequate precipitation, temperature and sunlight [8]. On the other hand, weather plays an important role in the dryness and flammability of fuels by promoting radiative and convective heat transfer, evapotranspiration, and supplying oxygen to the combustion zone [8,12]. Weather and climate determine the wildfire danger season characteristics, wildfire ignition potential, where ignition occurs, wildfire behaviour, severity and extinction as well as the wildfire management activities [12,13,14]. Therefore, it is not surprising that high wildfire activity, usually associated with the occurrence of large wildfires, is associated with concurrent anomalous atmospheric conditions, namely thermodynamic and circulation patterns (e.g., high air temperature, strong hot and dry winds, low air humidity and cumulative precipitation) and medium to long term climate anomalies (e.g., extended drought periods) [1,11,15,16,17,18].
Despite a large number of studies on the influence of weather on the wildfire regime, there are only a few publications on the objective influence of climate at global or continental scales [10,19,20,21,22,23,24,25], and even less suggest this relationship, at country or regional scale [26,27,28,29,30,31,32,33,34]. Therefore, this study is about the influence of climate on the wildfire regime, in particular on the wildfire incidence. Mainland Portugal was selected as a case study for several reasons, including being the European region most affected by wildfires, having different types of temperate climate and administrative regions, high-quality databases and a vast scientific literature on the wildfire regime for this region [35,36,37]. The results of such a study are important for wildfire managers and policymakers, especially in a context of climate change that suggests a northward shift of current climate types and, for this region, the decrease or disappearance of some current climate types, and the emergence of more arid climate types (hotter and drier) characteristic of desert regions [38,39,40].
To briefly situate the study in a broad context, ensure clarity, and highlight the importance and robustness of the results obtained, it is essential to clearly and objectively define the concepts and procedures used. Firstly, it is important to highlight the difference between weather and climate. Adopting a thermodynamic approach, weather can be defined as the state of the atmosphere, that is, by the values of the climatic elements (e.g., pressure, precipitation, air temperature and humidity), from a few minutes to around two weeks, in a given location or region of a few thousand km2. Consequently, wildfire weather can be defined as the atmospheric or weather conditions which influence wildfire ignition, behaviour, and suppression [41]. Based on the same approach, climate can be defined as the state of the climate system or, in an operational way, as the description of the statistical distribution of climate elements, for a sufficiently long period. Although some definitions of climate indicate a wide range of periods, ranging from a few months to millennia [3], the WMO suggests a climatological period of at least 30 years to compute/produce a climate normal [42,43]. Although climate can be described based on statistical analysis of data characterizing weather, for a long period, it is clear that the two concepts differ in spatiotemporal scales and approach/object of study. Climate can be evaluated for one location or the entire globe. Wildfire climate can be defined as the climate conditions which influence the wildfire regime [41].
The statistical distribution is a function that defines the possible and most common/frequent/likely values of a variable and is described by the shape, central tendency and variability. This description may include several statistical measures of location (e.g., mean, mode, median), dispersion (e.g., standard deviation, variance, interquartile range), shape and symmetry (e.g., kurtosis and skewness). Climate variability refers to variations in these and other statistics, including those that characterize the occurrence of extreme events, on all spatial and temporal scales beyond that of individual weather events [3]. Spatial climate variability includes well-known altitudinal () and latitudinal (, towards, the poles) temperature gradients, which are superimposed on more complex regional patterns (e.g., temperature, precipitation, storm frequency) that can generate large differences in surface air temperature and soil moisture. Temporal climate variability includes diurnal variations (e.g., the usual daily temperature range of 5 to 15ºC), seasonal (with an amplitude greater than that of the diurnal cycle in high latitudes and smaller in low latitudes), and interannual (of the order of up to 1ºC in air temperature, but on the order of the average annual value in the case of precipitation), as well as on many other (shorter and longer) scales.
Second, this study is about wildfires and not fires. Fire is the product of the chemical reaction of rapid combustion/oxidation in which fuel, oxygen and heat participate in the correct proportions, resulting in heat transfer and light emission [41,44]. A wildfire is an uncontrolled fire in vegetation that requires a decision or action regarding its suppression [44,45,46]. Therefore, terms such as wildfire regime or wildfire incidence will be used instead of the terms fire regime or fire incidence, more frequently found in the literature with the same meaning. The wildfire regime is defined not only, in the strict sense, based on intrinsic attributes of the wildfire (e.g., spatial pattern of occurrence, frequency, season, dimension/size, intensity, severity and type of wildfire) but, in the broad sense, depending on a more comprehensive set of attributes, also including causes, conditioning factors and consequences. The wildfire incidence is simply the number of wildfires (NW) and/or the burnt area (BA).
The literature includes several publications reporting studies on the influence of the climate on the spatial distribution of biomes and, therefore, vegetation and the incidence of wildfires [47,48,49,50]. The vast majority of these studies are global or for large regions. In this sense, is it important to know whether the climate signature is also recognized in the spatial distribution of wildfire incidence on a much smaller scale? The influence of climate on the spatial distribution of wildfire incidence is associated with the type of climate in each region, which, in turn, is defined based on the annual cycle, intra-annual/seasonal patterns and values for specific months of the climate elements, mainly precipitation and surface air temperature [40].
There are also a vast number of publications reporting studies on the influence of climate variability and weather, including weather/climate extreme events, on interannual variability of wildfire incidence. However, to the best of our knowledge, there is still no study on the inter-annual variability of the intra-annual variability of wildfire incidence. Therefore, this study also aims to answer the following questions: How does the intra-annual variability of wildfire incidence vary? and, what is the cause of this variation?
The influence of climate on the wildfire regime is unanimously recognized from a qualitative point of view. Several previous studies point to the influence of wildfire climate on wildfire incidence in Portugal and the world, especially on the spatial and temporal distribution, especially in the intra-annual variability [25,31,51,52,53,54]. In Portugal and many regions of the world, the interannual variability of wildfire incidence is essentially due to climatic variability and the occurrence of anomalous wildfire weather and extreme events [15,16,17,18,34,39,55,56,57,58,59,60]. However, the objective and quantitative assessment of this influence in all its dimensions is a gap in the current state of knowledge of wildfire science. To fill this gap, this study's main aim is to better understand and demonstrate quantitatively the influence of climate on the wildfire regime, specifically on the spatial distribution and intra-annual variability of wildfire incidence. In more detail, the study aims to answer the following questions:
RQ1: What is the influence of climate on the spatial distribution of wildfire incidence, at the scale of the country or smaller regions (e.g., administrative or regions for statistical purposes)? In this context, it is hypothesized that the influence of climate on the spatial distribution of wildfire incidence should be evident up to the scale of the climate subtype of the Köppen-Geiger climate classification. Additionally, specific objectives include identifying patterns in the spatial distribution of wildfire incidence in different regions and verifying their compatibility with the type of climate.
RQ2: How does the intra-annual variability in wildfire incidence vary? In this context, the hypothesis is that the annual cycle of wildfire incidence metrics can be characterized by having, or not, one or two peaks, one, main, in summer and another, secondary, at the end of winter/beginning of spring. This hypothesis arises as an alternative to an alternative small variation that does not imply significant changes in the pattern of the two peaks. The specific objective is to identify and characterize/justify the variability of the annual cycle of wildfire incidence.
RQ3: How can the interannual variability of the intra-annual variability of wildfire incidence be explained? In this case, the hypothesis is that the interannual variability of intra-annual variability in wildfire incidence is due to climate variability. The specific objectives associated with this issue are to characterize and justify the interannual variability of the intra-annual variability of wildfire incidence and identify the main climatic drivers of this variation.
The answers to these questions are very important, as they allow us to demonstrate the influence of climate on the incidence of wildfires, namely in their spatial (RQ1) and temporal distribution, in particular in intra-annual variability (RQ2), as well as will allow us to understand the wildfire climate conditions necessary for the occurrence of a peak in the annual cycle of wildfire incidence (RQ3) and support wildfire management at regional and seasonal scales. Demonstrating the influence of climate on the incidence of wildfires is of fundamental importance as it will be the basis for inferring the evolution that these modes of variability will occur in the context of climate change. There has been a migration of climate types towards the poles an increasing trend in the area of arid type and a decreasing trend in polar type [40].
2. Materials and Methods
2.1. Study Area
Mainland Portugal has an area of about 89,000 km2, located between Spain, at the north and east, and the Atlantic Ocean at the west and south. This area can be divided by the Tagus River into two regions of approximately the same size but very different according to several human and biophysical variables/drivers. The northern half is characterized by an irregular topography, a denser river network and the predominance of forest and semi-natural areas [12,37,61]. The population in this region is more concentrated on the western coast, which is in line with the location of the road densely areas. The southern half of the country is characterized by lowlands with the concentration of the population on the western and southern coasts and very low road density elsewhere. This region is dominated by agricultural areas with mixed and broad-leaved forests mainly concentrated near the southwest coast and in the south of the country [12,37,61].
The heterogeneous variation of the above-mentioned characteristics is in a close relationship with the predominance of the warm temperate (group C) climate with dry summer within the country [62,63,64]. The main type of climate in mainland Portugal (temperate) is strongly influenced by the position and magnitude of the Azores anticyclone, and the moderate effect of the Atlantic Ocean during the entire year, but also by the advection of warm air temperature over the Mediterranean Sea and the Sahara Desert during summer [55,65]. This type of climate promotes the growth of vegetation during the wet and mild winter and early springtime, and its hydric and thermal stress during the summer months when most fire occurrences are reported [12]. The mainland can also be divided into two different sub-types of temperate climate, namely the two subtypes of dry summer or Mediterranean climates: (i) Csb (dry and warm summer) which predominates in the northern area mentioned above, and (ii) Csa (dry and hot summer) which predominates in the southern area mention above [62,63,64]. An additional reason for choosing mainland Portugal as the study area is that the Csa and Csb climate types are transitional climate types (between the arid climate type and the other temperate climate types) and these border regions between the main types of climate present some instability/variability associated with changes in the type of climate over time [40]. These types of climate have changed, including migration to the north, eventually associated with the poleward expansion of the Hadley cell [66,67,68,69].
For this study, the authors used the official Nomenclature of Territorial Units for Statistics level II (NUTSII), which divides Portugal into 5 basic economic regions, namely Norte, Centro, Área Metropolitana de Lisboa (AML), Alentejo, and Algarve (Figure 1). According to this nomenclature, the North (NR) and South Region (SR), previously mentioned in the last paragraphs are, respectively composed of the Norte + Centro and the Alentejo + Algarve NUTS II regions.
2.2. The Wildfire/Portuguese Rural Fire Dataset
The Portuguese Rural Fire Dataset (PRFD) for 2001 – 2017, was used as the wildfire dataset. The PRFD includes extensive information about each wildfire that occurred in mainland Portugal, namely the location (in terms of administrative regions), cause, date and time of ignition and extinguishment, and burned area in the bush, forest and agricultural areas.
The PRFD results from the statistical wildfire dataset provided by the Portuguese Institute for the Conservation of Nature and Forest (Instituto da Conservação da Natureza e das Florestas, ICNF) and from the application of a careful quality control analysis, to identify and correct a few numbers of data errors/inconsistencies [35]. The PRFD has been used in numerous studies on the wildfire regime in Portugal and Europe [11,14,17,18,70,71,72] and was recently and specially updated to 2017, for this study. It is important to underline that the PRFD only comprises wildfires with BA≥0.1 ha for homogeneity reasons.
2.3. The Climate/Atmospheric Dataset
The meteorological dataset used in this study is the ERA5, which is a state-of-the-art global climate reanalysis dataset produced by the European Centre for Medium-Range Weather Forecasts (ECMWF) as part of the Copernicus Climate Change Service. ERA5 provides a piece of comprehensive, detailed and high-resolution information on atmospheric, oceanic, and land surface conditions by assimilating a wide range of observational data, including satellite and ground-based measurements and serves multiple purposes, including climate research, weather forecasting, and environmental monitoring. ERA5 covers the period from 1950 to the present, with hourly temporal resolution and about 31 km spatial resolution [73,74].
The extracted data covers the climatological 38-year period (1980 – 2017) and consists of daily fields at 12 UTC, with a spatial resolution of 0.125°×0.125° latitude/longitude grid, over a spatial domain (10°W – 6°E, 36.5°N – 42.5°N) centred in Portugal of the following meteorological variables:
- air temperature at 2 m height (hereafter, T2m);
- wind speed and direction at 10 m (hereafter, W10m);
- relative humidity at 850 hPa which corresponds to about 1500 m of altitude (hereafter, RH);
- total precipitation (hereafter, TP).
Monthly means of the climate elements were computed based on the daily fields. We also computed the number of rainy days (RD), based on daily TP, and the number of days with easterly wind (EWD), based on W10m, suggested by the findings of previous studies [17,18,75,76]. All these weather variables work at scales where fire, weather, fuels and topography interact (Benson et al., 2008; Jolly et al., 2015). For example, Pereira et al. [17] show that the inter-annual variability of burnt area in Portugal is partly due to the amount of precipitation in the wildfire season and in the preceding late spring season and partly to the occurrence of atmospheric circulation patterns that induce extremely hot and dry spells over western Iberia. For the Western Mediterranean, Amraoui et al. [55] identify and characterize the synoptic patterns of several meteorological fields associated with the occurrence of extreme wildfire activity episodes.
2.3. The Methodology
This is not a review study but draws on the results of a large number of previous studies. Additionally, different methods are used to identify and characterize the spatial and temporal distribution of wildfire incidence and to find relationships with climate. Specifically, tools available in geographic information systems were used to associate spreadsheets (e.g., PRFD) and shapefile databases (e.g., administrative and NUTS II regions). Descriptive statistical analysis and statistical climatology techniques were used to evaluate intra-annual and inter-annual variability. Correlation and composite analysis were also used to evaluate the influence of climate on wildfire incidence. Correlation analysis comprises the computation of the Pearson coefficient of correlation (). Composite analysis comprises the computation of two averages and one anomaly for each meteorological variable from the list above. The composite is the arithmetic average for a subsample whereas the composite anomaly is simply the difference between the composite and the climatological mean computed for the entire period [17,55,77]. A positive anomaly means above average climatological conditions (e.g., higher than normal air temperature) while a negative anomaly means below the average climatological conditions (e.g., lower than normal relative humidity) [12].
Multivariate statistical analysis and/or machine learning methods (supervised and unsupervised) were used to complement and validate results from other methodologies. Specifically, we use Principal Component Analysis (PCA), Cluster Analysis (CA) and a vast set of supervised classification models, namely: Naïve Bayes; Random Forest; Support Vector Machines (SVM); k-nearest neighbours (kNN); Logistic Regression; Neural Networks (NN) and AdaBoost. The application of these methods is not unique and depends on several parameters, including normalization, or not, of the original variables, normalization method, type of linkage and number (of Principal Components, PC, or significant clusters, estimated or imposed), metrics used in distance-based methods (e.g., Euclidean, Mahalanobis, city block). We used the PCA toolbox for MATLAB version 1.5 [78], which includes a collection of MATLAB modules for calculating unsupervised multivariate models for data structure analysis (PCA, CA and Multidimensional Scaling, MDS) and four methods to assess the optimal number of PC: Average Eigenvalue Criterion (AEC), Corrected Average Eigenvalue Criterion (CAEC), the linear (KL) and a non-linear power function (KP) of the K correlation index [79,80]. Additionally, there are several algorithms/models to perform the same analysis. For example, cluster analysis comprises methods based on distance connectivity (Hierarchical Clustering analysis, HCA), centroids (e.g., k-means algorithm), distribution (clusters are identified using statistical distributions), or density (e.g., DBSCAN which defines clusters as connected dense regions). This diversity leads to similar but also different results and requires the user to select/identify the method most appropriate to their data.
3. Results and Discussion
3.1. The Spatial Distribution of the Wildfire Incidence
Analysis of the wildfire database for the 17-year study period (2001 – 2017) revealed a total of 410,000 wildfires and 2.5 Mha of burned area in mainland Portugal. The spatial distribution of the NW and BA based on the NUTS II regions (Figure 1) shows two regions of very high wildfire incidence. The NR, composed of the NUTSII regions of the Norte and Centro, account, respectively, for about 83% and 85% of the total of NW and BA. In addition, it is in the Norte that most wildfires occur (56.6% of total NW), but the BA is larger in Centro (46.2% of the total BA). On the other hand, the southern region, made up of the remaining NUTSII regions, presents much lower wildfire incidence values, namely NW and BA in Alentejo, NW in Algarve and BA in AML.
Since the NUTSII regions have very different dimensions, adequate comparison requires standardization of wildfire incidence, for example, dividing the wildfire incidence by the area (A) of each region. However, the absolute or relative values of wildfire incidence show similar patterns. The exceptions are the following: NW/A values are the highest in the AML, a consequence of the record of a high number of occurrences in the relatively small region; and, for one of BA/A in the Algarve (25 ha/km2) roughly between the highest values in the northern region (46 ha/km2) and the lowest in Alentejo and AML (8 ha/km2). It is important to note that the spatial distribution results are in line with findings from other previous studies, carried out with other objectives, using other methodologies, different databases or versions of the PRFD [12,37,81,82].
The BA/NW values (shown in the right panel of Figure 1) must be analyzed carefully as they depend greatly on the quality of the database, namely its completeness. This is the reason why, in this study, only wildfires with an area greater than 0.1 ha were considered, a value above which the PRFD is considered to be relatively complete. The pattern of this measure reveals higher values in the Algarve and Centro and lower in the Norte and AML. These results are due to the effect, sometimes combined, of two factors: the different number and size of wildfires. Thus, lower values of BA/NW are due to the large number of wildfires reported in the metropolitan regions of Porto and Lisbon while higher values are essentially due to the large number of large wildfires in the Centro region [16,37,60,82,83,84] and a small number of large wildfires in the Algarve [15,18].
In summary, the most important result of this simple preliminary statistical analysis is that, in terms of wildfire incidence, the country can be divided into two clusters/regions: the northern region (NR) composed of the NUTS II regions of Norte and Centro, and the southern region (SR) of the country, composed of the NUTS II regions of AML, Alentejo and Algarve. The differences in the average wildfire incidence metrics (NW and BA) in these two regions (NR and SR) are evident and confirmed by statistical significance tests. In addition, PCA results are in line with these and can be summarized as follows: (i) the number of optimal PCs is 1 for NW, 2 for BA and 3 for NW and BA; (ii) for NW, with auto scaling and range scaling, the PCA clearly groups Norte and Centro in NR and Alentejo and Algarve in SR, with AML on the border of the two groups; (iii) For BA, the regions are grouped as suggested in the previous statistical analysis, in which AML is part of the same group as Alentejo and Algarve; (iv) when PCA is performed for the NW and BA series together, PCA2 separates the NW series from the BA series, 4 groups of variables are identified in the plane of PC1 (explains 53% of the observed variance) and PC3 (11% of the variance), namely: BA in the Centro and Norte (low values of PC1 and negative values of PC3), NW in the same 2 regions (high values of PC1 and negative values of PC3), BA in AML, Alentejo and Algarve (low PC1 values and positive PC3 values) and NW in the same 3 regions (high PC1 values and positive PC3 values). Regardless of the options (using autoscaling or range scaling; linkage single, complete or centroid) the HCA carried out based on NW or BA always provides the same results: AML appears associated with the Algarve, and then with the Alentejo, with no large distinction/distance between these three regions, and then they are associated with the Norte and the Centro (in that order) but at a much greater distance from the other three regions. The unsupervised machine learning methods (Hierarchical Aggregation with Euclidean distances, Louvain Aggregation and K-Means with a fixed number of aggregates from 2 to 4) confirm the AML-Alentejo-Algarve and Centro-Norte clustering for NW and BA.
Finally, it is important to note that the aggregation of NUTS II regions is due to the type of climate in the NR and SR regions, namely Csb in NR and Csa in SR. This relationship is immediately evident by visual inspection, as the border between NR and SR almost coincides with the border between the two types of climate, but also by the correlation, composite, and cluster analysis carried out on the meteorological variables for the two regions. For example, the correlation coefficient (r) between monthly T2m, RH, number of rainy days and the easterly wind is much higher between the NUTS II regions of SR (Algarve and Alentejo) and NR (Centro and Norte) than including two NUTS II regions, one belonging to NR and the other to SR. For example, for T2m and , but and ; for PT, and but and . Values of for RH, number of rainy days and number of easterly wind days are similar. The composite analysis also confirms the existence of the two different pyro regions (NR and SR). For example, the long-term average of the climate elements and parameters tends to be similar for the Norte and Centro regions and, independently, for the Alentejo and Algarve regions. These results are especially evident for precipitation (total precipitation and rainy days), air relative humidity and meridional wind. The composite of air temperature for spring and summer also allows for discrimination of the regions belonging to NR and SR. Results of unsupervised machine learning algorithms confirm previous clustering of the wildfire incidence drove by climate. For example, HCA using Euclidean distance, single linkage and different data scaling autoscaling, range scaling or mean centring) performed for the climate elements (T2m, RH, TP, RD, EWD) in each region tend to cluster the northern and southern NUTS II regions into the NR and SR. Results for k-means clustering are similar.
3.2. The Interannual Variability of Wildfire Incidence
The temporal evolution of the series of annual sums of NW and BA illustrates the interannual variability of wildfire incidence (Figure 2). It is worth noting some stark contrasts in wildfire incidence between individual years. In mainland Portugal, a very high incidence of wildfires was observed in 2003, 2005 and 2017, when approximately half of the general total of BA was recorded (17.6% in 2017, 17% in 2003 and 13.6% in 2005) resulting from only around 20% of the general total of NF (10% in 2005, 5.8% in 2003 and 4.1% in 2017). On the contrary, the year 2014 was characterized by a low incidence of wildfires, with very low values of both BA and NF, which represent 0.8% of the total BA and 2.4% of the total NF. Annual BA was also very low in the years of 2007 and 2008. The NW shows a decreasing trend of approximately -8200 fires per year (-0.2%). BA does not show a trend, largely because of the exceptionally high BA in 2017. These results of the trend analysis for NW may be associated with improvements in wildfire management (e.g., prevention actions, detection system, firefighting resources, and policy decisions) [12,85], but for BA reflect the effect of the occurrence of extreme and uncontrolled wildfires, associated with exceptionally anomalous weather conditions [12,18,58,83,84,86].
The interannual variability has been described by several researchers and justified in terms of several factors, especially atmospheric/meteorological and climatic, including atmospheric circulation patterns, and the occurrence of extreme events, such as storms, heat waves and droughts [e.g., 1,87]. All of these factors are part of the characteristics of the climate of each region. However, as the interannual variability in the incidence of wildfires is well-known, well studied and even modelled [11,71,72,88], the influence of climate on this variability is outside the scope of this study. However, it is worth highlighting the spatial variability of this interannual variability that results from the different climatic conditions in each region.
The analysis of the interannual variability of the wildfire incidence at the NUTS II regional scale (not shown) discloses some significant differences between regions. In the Norte, BA was especially high in 3 years when it totalled 37% of the total BA in the region (14.5% in 2005, 11.8% in 2016 and 10.7% in 2013) resulting from 21% of the total NW of the region. On the contrary, the incidence of wildfires in this region was very low in 2014 and 2008 (0.7% and 0.8% of the total in BA and 1.8% and 3.2% of the total in NW in the region, respectively). The year 2005 was also critical in the NUTS II Centro region, representing 16.1% of the total BA and 10.4% of the total NW in the region. In addition to the year 2005, the extreme incidence of wildfires in this region was also observed in the years 2003 and 2017 due to its high BA, 16.8% and 30% of the region's total, respectively, and the low NW observed in these years, accounting for 6.1%. and 4.1% of the region's total, respectively. As in the North region, 2014 was the year with a very low incidence of wildfires in the Centro region, with just 0.7% of the total in BA and 2.6% of the total in NF in the region. The AML region has a very low wildfire incidence, with only 0.8% and 8.7% of the overall total for BA and NW, respectively. The sum of BA in just 3 years totals around 45% of the BA in the region: 23.5% in 2003, 13.5% in 2004 and 8.5% in 2005, which results in around 24% of the total NW in this region. The incidence of wildfires in Alentejo is also, in general, low except for 2003, when BA accounted for around 60% of the region's total BA. The Algarve is the region with the lowest NF and the second lowest BA in the country, recording 1.7% and 5.1% of the general total of NF and BA, respectively. Similar to what was observed in AML and Alentejo, the annual BA in the Algarve region is very low, except for the years 2003, 2004 and 2012, which summed up 87% of the region's total BA: 45% in 2003, 24.1% in 2004 and 17.5 in 2012. The extreme incidence of wildfires in 2003 and 2004 is not due to the relatively low NW recorded (3.4% and 4.0% of the region's total, respectively), but due to the total BA. In contrast, the years 2006 and 2007 recorded higher NW, around 11% and 9% of the region's total, but very low BA, around 0.2% and 0.4% of the region's total, respectively. As a consequence of these results, the BA/NW ratio in each region tends to present higher and lower values, respectively in years with higher BA and lower NW.
Trend analysis performed at NUTS II regions basis also leads to interesting results. In the Norte and Centro, it is evident a downward trend in annual NW while annual BA shows a slight increase. In the AML region, annual NW and BA present a decreasing tendency. On the other hand, in Alentejo and Algarve regions, annual BA presents a downward trend but annual NW presents an upward tendency until the year 2006 for Algarve and 2007 for Alentejo and, from then on, the NW reverses to a downward trend. Finally, the interannual variability of NW in mainland Portugal follows a downward trend, visibly influenced by the tendencies in the Norte and Centro regions. The BA trend of mainland Portugal is practically constant throughout the study period, and results from the balance between the slightly upward trends in Norte and Centro and the downward trends in the remaining regions.
3.3. The Intra-Annual Variability of Wildfire Incidence
The evolution of the long-term/climatological averages of the two measures of wildfire incidence (NW and BA) in each month of the year illustrates the intra-annual variability (Figure 3). The highest rates of wildfire incidence are observed in the months of June to October. The sum of the monthly averages of BA and NW in this period represents the vast majority of the incidence of wildfires, namely 94% and 77%, of the total sum of BA and NW, respectively. The highest monthly BA and NF in mainland Portugal are observed in August, when count for 45% and 24% of the total of BA and NF, respectively. On the other hand, the lowest monthly average values of BA and NW were recorded in the same month of January, accounting, respectively, for 0.2% and 0.9% of the sum of BA and NW, followed by the December average which accounts for just a little more (0.3% and 1.2%) of the sum of the monthly averages of BA and NW.
The intra-annual variability of wildfire incidence in each region (not shown) and for mainland Portugal (Figure 3) is quite similar but also presents some differences that are important to mention. For example, the spatial pattern of the Pearson correlation coefficient between the monthly averages of incident incidence in each region and mainland Portugal is very similar. In the case of NW, the correlation coefficient varies between 0.99 in the Norte and Centro, 0.95 in AML and 0.90 in Alentejo and Algarve while for BA, it varies between 0.98 in the Norte and Centro, 0.95 in AML, and around 0.90 in Alentejo and Algarve.
These results reveal, in general, the great similarity between the intra-annual variability of the incidence of wildfires in the 5 NUTS II regions and mainland Portugal, but also that this similarity is greater in NR than in SR. These results are a consequence of the higher incidence of wildfires in NR, which tends to dominate the observed pattern of variability. The main differences to note are in the peak of Summer and Spring. Concerning the summer peak in Mainland Portugal, the peak is almost the same in the Norte, with a higher value in October in the Centro, a higher value in July in Alentejo, similar values in July and August in the Algarve, and in July, August and September at AML. The spring peak is centred in March in all regions but is evident in BA and NW in the Norte region, only slightly in the NW in Centro and Alentejo, and almost non-existent in Algarve and AML.
The intra-annual variability of the incidence of wildfires in Portugal evaluated and illustrated here is similar to that presented in other previous studies for different periods and even wildfire datasets [39,55,89] used to identify and characterize pyro-regions [34,71,72]. The greater incidence of wildfires in the summer has been used to concentrate studies at this time of year [11,17].
The intra-annual variability in the incidence of wildfires in Portugal is a main example of the influence of climate on the wildfire regime [1,53,87], well apparent also in wildfire weather danger indices [39,90] and the consequences of wildfires, particularly on water quality [91], described in several studies. As mentioned in section 2.1, the temperate climate type of mainland Portugal is characterized by rainy and mild winter and early spring, which promotes vegetation growth, and hot and dry summer, which leads to water and thermal stress on vegetation (Parente et al., 2016). These conditions favour the occurrence of wildfires, especially if extreme events such as droughts and heat waves occur [15,16].
3.4. Variability of the Annual Cycle of the Wildfire Incidence
The intra-annual variability of wildfire incidence was assessed based on averages for the entire period of the monthly sums of NW and BA, which do not reflect the dispersion of these values. Additionally, one of the causes of intra-annual variability is the type of climate, and it is expected that this variability varies with climate variability, particularly from year to year. This interannual variability of intra-annual variability was evaluated in this study with a process of classifying years of study in terms of BA in two seasons, namely spring (sum of BA in the months of February, March and April, ) and summer (sum of BA in the months of June, July, August, September and October, ). A year was classified into one of four types, depending on whether or not it had a BA peak. Specifically, a year can be of type: 1 - if there is no BA peak in spring or summer; 2 - only has a spring peak, 3 - only has a summer peak, or 4 - has both peaks. The criterion for a given year to have, or not, a BA peak, for example, in spring is if the value in that year is higher or lower than the 50th percentile of the standardized series (subtracting the mean and dividing by the standard deviation) of these values, for the entire study period.
These criteria made it possible to identify 6 years of type 1, 4 of type 2, 5 of type 3 and 2 of type 4 (Table 1). It is important to mention that alternative criteria were tested with similar results, that is, leading to approximately the same classification. For example, it was tested to consider BA in different periods (e.g., , ). It is worth noting that the classification of most years based on values for mainland Portugal would be the same if it were carried out based on the values of the same quantities in most regions, especially the most important in terms of the incidence of wildfires. However, every year, without exception, there is at least one region that would have a different classification from the entire country. The regions classified differently from mainland Portugal tend to be those with the lowest incidence of fires (e.g., AML, Alentejo and Algarve) and in years with greater NW.
These results confirm the great variability in the spatial distribution of wildfire incidence, particularly in BA. The heterogeneity in the distribution of incident incidence is evident, even upon visual inspection of the NW and BA maps each year [37,81]. A concentration of the incidence of wildfires, not just the larger ones, in certain regions is evident, as has already been reported in previous studies [12,15,16,61,70,92,93,94,95,96]. This spatial heterogeneity is necessarily associated with climatic (spatial) variability, namely with the fact that the atmospheric conditions conducive to the occurrence and development of wildfires do not have to be observed simultaneously throughout the territory, at least with the same magnitude, despite the small size of the country [57,97,98,99].
The criteria adopted classified the years as intended, but it is important to also describe and discuss the results obtained with other methodologies, that allow us to confirm, interpret and validate previous results. Unsupervised Machine Learning clustering algorithms were used, namely Hierarchical Aggregation with Euclidean distances between points, Louvain Aggregation and K-Means, forcing 4 clusters and using the series of and . Results obtained with the Louvain Aggregation are the closest to those obtained with the classical statistical approach, in the sense that the classifications only differ in two years: 2002, which is in the transition between types 1 and 3, and 2010, which is in the transition between types 1 and 3.
The use of a supervised machine learning method supported the results of unsupervised machine learning. Various methods/models were used, but the results obtained by AdaBoost, Naïve Bayes, Neural Network, and Logistic Regression [01njgRef] stand out, expressed in terms of the Confusion Mariz for the numbers of inputs (Table 2). The learning target was the result obtained by the Louvain Aggregation algorithm.
3.5. Cause of Inter-Annual Variability of Intra-Annual Variability in the Incidence of Wildfires
To confirm climate variability as one of the causes of interannual variability and intra-annual variability in wildfire incidence, a composite analysis of the usual and frequently recognized climatic elements as playing an important role in wildfire incidence was carried out, namely W10m, T2m, RH and TP. It is important to mention that, unlike other studies in which composites and anomalies are calculated for a set of wildfire occurrence days (Refs), in this study the analysis was carried out for monthly periods. This option follows the methodological approach adopted in the previous section but has the consequence of diluting the meteorological signal of conditions favourable to wildfires, with a typical duration of a few days to one or two weeks, in conditions with a possibly opposite signal, available on other days of the month. Instead of, but based on W10m, the easterly wind anomalies will be displayed. This decision follows the results of previous studies [e.g., 55] that identified the easterly wind over the territory as one of the drivers of the wildfires, as during summer tends to be hot and dry, and during winter is cold and dry. Likewise, as it is the absence of precipitation that favours wildfires, instead of the precipitation anomaly, the anomaly number of rainy days is shown.
Although calculations were carried out for all years and regions, to limit the number of figures in the manuscript, only the results for one year, representative of each type, will be presented. Results obtained for 2014 (Figure 4), a year of type 1, confirm the inexistence of wildfire seasons (negative anomalies of NW and BA), associated with usual to high humidity (null or positive RH and TP anomalies) and usual to low air temperature and wind (null to negative Wind and T2m anomalies) during the usual seasons’ months.
Results for 2012 (Figure 5), a year of type 2, disclose the existence of a Spring wildfire season, especially evident in the NW (positive anomalies in February and March) and only slightly visible in BA. The existence of the Spring wildfire season is explained by the anomalies of the climatic elements, namely the low humidity (negative anomalies of RH and TP) and above average easterly wind (in February and March) and near normal (in February) to above average (in March) air temperature anomalies in this period.
Anomalies for the year 2003 (Figure 6), confirm this year's belonging to type 3, with positive anomalies of BA from June to September, with the maximum in August, in line with the positive anomaly of NW in that month, although the irregular behaviour of the NW anomalies in the other months of the summer season.
This summer wildfire season of 2003 is justified by the near-normal air humidity, wind and precipitation and above-normal air temperature in August and September. The below-normal NW and BA (negative anomalies) in October are associated with a significant change in the wildfire weather, namely an increase in precipitation and air humidity (positive anomalies of RH and TP) and a decrease in air temperature (negative anomaly of T2m).
Finally, the results for 2005 (Figure 7), help to understand this year as of type 4. The positive anomalies of NW in February and March as well as from June to August, along with the positive anomalies of BA in March and from June to September, although only significant in July and August, illustrate the existence of both wildfire seasons. Anomalies of the climate elements justify both wildfire seasons. Precipitation was only above normal in October, air humidity was below normal almost the entire year (significant positive anomalies only in March), air temperature was above normal except in winter and above normal easterly wind also almost the entire year (negative anomalies only in April, May and October).
The correct interpretation and validation of these results require mentioning that the spring wildfire season in Portugal is only observable in the NE of the country, namely in the W part of the North region and the NW part of the Central region. The existence of a peak in the incidence of wildfires centred in March is characteristic of the Northern region of the Iberian Peninsula [34,39,71,72]. Additionally, this peak is not observed every year and is much more evident in the NW than in BA [100]. Two of the main reasons for this are: (i) the lack of atmospheric conditions completely favourable to wildfires (in general, winter temperatures remain low and wildfires occur essentially favoured by the occurrence of drought during this period); and, (ii) because, at this time of year, wildfires are easily detected, fought and, consequently, extinguished.
The local nature of the peak incidence of spring wildfires is further evidenced by the results of the correlation analysis between the series of climatic elements in the different NUTS II regions. In this sense, it is important to highlight that the Pearson correlation coefficient values described at the end of section 3.2 were calculated for all 204 months within the 17-year study period. Values of calculated only for the summer months follow the same pattern (high correlation between series from the NUTS II regions of NR and SR, but no correlation between series, one from each region, NR and SR), but are still slightly higher. However, the correlation analysis only for the FMA months of the spring wildfire season reveals high () only between the Norte and Centro series, for any of the climatic elements considered in this study.
4. Conclusions
The results obtained allow us to answer the research questions posed, test the established hypotheses, achieve the defined objectives and reach the conclusions described below. Firstly, and in general, climate has a clear signature in the spatial and temporal distribution of fire incidence. This conclusion has been demonstrated on a global scale, and suggested on a regional scale, in previous studies, as a result of research and bibliographic review, but it was demonstrated objectively on a regional scale, in this study for Portugal.
Specifically, and secondly, the spatial distribution of fire incidence is the result of climate characteristics, namely the type of climate in each region. The spatial distribution in the different NUTS II regions of Portugal is grouped into two regions, characterized by a higher incidence in the north than in the south. This distribution follows the spatial distribution of climatic elements.
Thirdly, the interannual variability of fire incidence in mainland Portugal depends on meteorological and climatic conditions. As it has already been well studied and even modelled, it is outside the scope of this study. However, the results obtained reveal that interannual variability presents spatial variability which, consequently and objectively, can only be due to the spatial variability of climatic conditions.
Fourthly, the intra-annual distribution is a consequence of the general characteristics of Portugal's temperate climate, namely a mild and humid semester and a hot and dry semester, which favours the existence of a peak in the incidence of fires in the summer, centred In August. The existence of a secondary peak centred in March has more local characteristics, as it is characteristic of the NW of the country, in line with the distribution of fire incidence in the northern region of the Iberian Peninsula. Additionally, as it occurs in late winter and early spring, it is essentially due to a lack of humidity (dry conditions) rather than low air temperatures.
Fifthly, the annual cycle of fire incidence varies considerably from year to year. Additionally, this interannual variability of intra-annual variability is due to the climate, namely climate variability. The above conclusions could have been inferred from previous studies but were objectively demonstrated in this study. However, the demonstration of the existence and cause of interannual variability and intra-annual variability is presented for the first time in this study.
These conclusions were obtained from the application of an objective methodology that integrated a vast and varied set of methods, namely statistical climatology analysis, exploratory and multivariate statistical analysis, and machine learning. Finally, these conclusions are of fundamental importance for fire, forest and landscape managers as well as political decision-makers in the context of climate change, characterized by the northward shift of climate types in mid-latitudes, due to global warming.
Author Contributions
Conceptualization, M.P. and M.A.; methodology, M.P., N.G. and M.A.; software, M.P., N.G. and M.A.; validation, M.P. and M.A.; formal analysis, M.P., N.G. and M.A.; investigation, M.P. and M.A.; resources, M.P.; data curation, M.P. and M.A.; writing—original draft preparation, M.P.; writing—review and editing, M.P. and M.A.; visualization, M.P. and M.A.; supervision, M.P. and M.A.; project administration, M.P. and M.A.; funding acquisition, M.P. All authors have read and agreed to the published version of the manuscript.
Funding
The study was also supported by National Funds through FCT - Foundation for Science and Technology under the project UIDB/04033/2020.
Data Availability Statement
All data used in this study are freely accessible on the platforms of data providers, referred to in section 2. The datasets generated and/or analyzed during the current study are available from the corresponding author upon reasonable request.
Acknowledgments
We wish to thank/acknowledge the Portuguese Institute for the Conservation of Nature and Forest (Instituto da Conservação da Natureza e das Florestas, ICNF) for providing the original wildfire data and Copernicus Climate Change Service (C3S) Climate Data Store (CDS) for providing the climate data.
Conflicts of Interest
The authors declare no conflicts of interest. The funders had no role in the design of the study; in the collection, analyses, or interpretation of data; in the writing of the manuscript; or in the decision to publish the results.
References
- Pereira, M.G.; Parente, J.; Amraoui, M.; Oliveira, A.; Fernandes, P.M. The Role of Weather and Climate Conditions on Extreme Wildfires. Extrem. Wildfire Events Disasters Root Causes New Manag. Strateg. 2020, 55–72. [Google Scholar] [CrossRef]
- Lizundia-Loiola, J.; Otón, G.; Ramo, R.; Chuvieco, E. A Spatio-Temporal Active-Fire Clustering Approach for Global Burned Area Mapping at 250 m from MODIS Data. Remote Sens. Environ. 2020, 236, 111493. [Google Scholar] [CrossRef]
- Barros, V.; Stocker, T.; Qin, D.; Dokken, D.; Ebi, K.; Mach, K.; Plattner, G.; Allen, S.; Tignor, M.; Midgley, P. IPCC, 2012: Glossary of Terms. In Managing the Risks of Extreme Events and Disasters to Advance Climate Change Adaptation; Field, C.B., V. Barros, T.F. Stocker, D. Qin, D.J. Dokken, K.L. Ebi, M.D. Mastrandrea, K.J. Mach, G.-K. Plattner, S.K. Allen, M. Tignor, and P.M.M., Ed.; Cambridge University Press, Cambridge, UK and New York, NY, USA, 2012; pp. 555–564.
- Bowman, D.M.J.S.; Balch, J.K.; Artaxo, P.; Bond, W.J.; Carlson, J.M.; Cochrane, M.A.; D’Antonio, C.M.; DeFries, R.S.; Doyle, J.C.; Harrison, S.P.; et al. Fire in the Earth System. Science (80-. ). 2009, 324, 481–484. [Google Scholar] [CrossRef] [PubMed]
- Shi, K.; Touge, Y. Characterization of Global Wildfire Burned Area Spatiotemporal Patterns and Underlying Climatic Causes. Sci. Reports 2022 121 2022, 12, 1–17. [Google Scholar] [CrossRef]
- Page, Y. Global Fire Activity Patterns (1996–2006) and Climatic Influence: An Analysis Using the World Fire Atlas. Atmos. Chem. Phys. 2008, 8, 1911–1924. [Google Scholar] [CrossRef]
- Grillakis, M.; Voulgarakis, A.; Rovithakis, A.; Seiradakis, K.D.; Koutroulis, A.; Field, R.D.; Kasoar, M.; Papadopoulos, A.; Lazaridis, M. Climate Drivers of Global Wildfire Burned Area. Environ. Res. Lett. 2022, 17, 045021. [Google Scholar] [CrossRef]
- Aldersley, A.; Murray, S.; Cornell, S. Global and Regional Analysis of Climate and Human Drivers of Wildfire. Sci. Total Environ. 2011, 409, 3472–3481. [Google Scholar] [CrossRef] [PubMed]
- Hantson, S.; Pueyo, S.; Chuvieco, E. Global Fire Size Distribution Is Driven by Human Impact and Climate. Glob. Ecol. Biogeogr. 2015, 24, 77–86. [Google Scholar] [CrossRef]
- Flannigan, M.D.; Krawchuk, M.A.; De Groot, W.J.; Wotton, B.M.; Gowman, L.M. Implications of Changing Climate for Global Wildland Fire. Int. J. Wildl. Fire 2009, 18, 483–507. [Google Scholar] [CrossRef]
- Pereira, M.G.; Calado, T.J.J.T.; DaCamara, C.C.C.C.; Calheiros, T. Effects of Regional Climate Change on Rural Fires in Portugal. Clim. Res. 2013, 57, 187–200. [Google Scholar] [CrossRef]
- Parente, J.; Pereira, M.G.M.G.; Tonini, M. Space-Time Clustering Analysis of Wildfires: The Influence of Dataset Characteristics, Fire Prevention Policy Decisions, Weather and Climate. Sci. Total Environ. 2016, 559, 151–165. [Google Scholar] [CrossRef]
- Venäläinen, A.; Korhonen, N.; Hyvärinen, O.; Koutsias, N.; Xystrakis, F.; Urbieta, I.R.; Moreno, J.M. Temporal Variations and Change in Forest Fire Danger in Europe for 1960-2012. Nat. Hazards Earth Syst. Sci. 2014, 14, 1477–1490. [Google Scholar] [CrossRef]
- Telesca, L.; Pereira, M.G. Time-Clustering Investigation of Fire Temporal Fluctuations in Portugal. Nat. Hazards Earth Syst. Sci. 2010, 10, 661–666. [Google Scholar] [CrossRef]
- Parente, J.; Amraoui, M.; Menezes, I.; Pereira, M.G.G. Drought in Portugal: Current Regime, Comparison of Indices and Impacts on Extreme Wildfires. Sci. Total Environ. 2019, 685, 150–173. [Google Scholar] [CrossRef]
- Parente, J.; Pereira, M.G.; Amraoui, M.; Fischer, E.M. Heat Waves in Portugal: Current Regime, Changes in Future Climate and Impacts on Extreme Wildfires. Elsevier 2018, 631–632, 534–549. [Google Scholar] [CrossRef]
- Pereira, M.G.; Trigo, R.M.; Da Camara, C.C.; Pereira, J.M.C.; Leite, S.M. Synoptic Patterns Associated with Large Summer Forest Fires in Portugal. Agric. For. Meteorol. 2005, 129, 11–25. [Google Scholar] [CrossRef]
- Trigo, R.M.; Pereira, J.M.C.; Pereira, M.G.; Mota, B.; Calado, T.J.; Dacamara, C.C.; Santo, F.E. Atmospheric Conditions Associated with the Exceptional Fire Season of 2003 in Portugal. Int. J. Climatol. 2006, 26. [Google Scholar] [CrossRef]
- Moritz, M.A.; Parisien, M.-A.; Batllori, E.; Krawchuk, M.A.; Van Dorn, J.; Ganz, D.J.; Hayhoe, K.; Moritz, M.A.; Parisien, M.-A.; Batllori, E.; et al. Climate Change and Disruptions to Global Fire Activity. Ecosphere 2012, 3, 1–22. [Google Scholar] [CrossRef]
- Krawchuk, M.A.; Moritz, M.A.; Parisien, M.A.; Van Dorn, J.; Hayhoe, K. Global Pyrogeography: The Current and Future Distribution of Wildfire. PLoS One 2009, 4, e5102. [Google Scholar] [CrossRef]
- Dwyer, E.; Grégoire, J.-M.; Pereira, J.M.C. Climate and Vegetation as Driving Factors in Global Fire Activity. 2000, 171–191. [CrossRef]
- Bedia, J.; Herrera, S.; Gutiérrez, J.M.; Benali, A.; Brands, S.; Mota, B.; Moreno, J.M. Global Patterns in the Sensitivity of Burned Area to Fire-Weather: Implications for Climate Change. Agric. For. Meteorol. 2015, 214–215, 369–379. [Google Scholar] [CrossRef]
- Archibald, S.; Lehmann, C.E.R.; Gómez-Dans, J.L.; Bradstock, R.A. Defining Pyromes and Global Syndromes of Fire Regimes. Proc. Natl. Acad. Sci. U. S. A. 2013, 110, 6442–6447. [Google Scholar] [CrossRef]
- Abatzoglou, J.T.; Williams, A.P.; Boschetti, L.; Zubkova, M.; Kolden, C.A. Global Patterns of Interannual Climate–Fire Relationships. Glob. Chang. Biol. 2018, 24, 5164–5175. [Google Scholar] [CrossRef]
- Oliveira, A.; Parente, J.; Amraoui, M.; Pereira, M.; Fernandes, P. Global-Scale Analysis of Wildfires; 2018; Vol. 20;
- Wasserman, T.N.; Mueller, S.E. Climate Influences on Future Fire Severity: A Synthesis of Climate-Fire Interactions and Impacts on Fire Regimes, High-Severity Fire, and Forests in the Western United States. Fire Ecol. 2023 191 2023, 19, 1–22. [Google Scholar] [CrossRef]
- Keeley, J.E.; Syphard, A.D. Different Historical Fire–Climate Patterns in California. Int. J. Wildl. Fire 2017, 26, 253–268. [Google Scholar] [CrossRef]
- Giorgis, M.A.; Zeballos, S.R.; Carbone, L.; Zimmermann, H.; von Wehrden, H.; Aguilar, R.; Ferreras, A.E.; Tecco, P.A.; Kowaljow, E.; Barri, F.; et al. A Review of Fire Effects across South American Ecosystems: The Role of Climate and Time since Fire. Fire Ecol. 2021 171 2021, 17, 1–20. [Google Scholar] [CrossRef]
- Littell, J.S.; Gwozdz, R.B. Climatic Water Balance and Regional Fire Years in the Pacific Northwest, USA: Linking Regional Climate and Fire at Landscape Scales. 2011, 117–139. [CrossRef]
- Zhao, H.; Zhang, Z.; Ying, H.; Chen, J.; Zhen, S.; Wang, X.; Shan, Y. The Spatial Patterns of Climate-Fire Relationships on the Mongolian Plateau. Agric. For. Meteorol. 2021, 308–309, 108549. [Google Scholar] [CrossRef]
- Fréjaville, T.; Curt, T. Spatiotemporal Patterns of Changes in Fire Regime and Climate: Defining the Pyroclimates of South-Eastern France (Mediterranean Basin). Clim. Change 2015, 129, 239–251. [Google Scholar] [CrossRef]
- Keeley, J.E.; Syphard, A.D. Climate Change and Future Fire Regimes: Examples from California. Geosci. 2016, Vol. 6, Page 37 2016, 6, 37. [Google Scholar] [CrossRef]
- Margolis, E.Q.; Swetnam, T.W. Historical Fire–Climate Relationships of Upper Elevation Fire Regimes in the South-Western United States. Int. J. Wildl. Fire 2013, 22, 588–598. [Google Scholar] [CrossRef]
- Calheiros, T.; Nunes, J.P.; Pereira, M.G. Recent Evolution of Spatial and Temporal Patterns of Burnt Areas and Fire Weather Risk in the Iberian Peninsula. Agric. For. Meteorol. 2020, 287, 107923. [Google Scholar] [CrossRef]
- Pereira, M.G.; Malamud, B.D.; Trigo, R.M.; Alves, P.I. The History and Characteristics of the 1980-2005 Portuguese Rural Fire Database. Nat. Hazards Earth Syst. Sci. 2011, 11. [Google Scholar] [CrossRef]
- Molina-Terrén, D.M.; Xanthopoulos, G.; Diakakis, M.; Ribeiro, L.; Caballero, D.; Delogu, G.M.; Viegas, D.X.; Silva, C.A.; Cardil, A. Analysis of Forest Fire Fatalities in Southern Europe: Spain, Portugal, Greece and Sardinia (Italy). Int. J. Wildl. Fire 2019, 28, 85–98. [Google Scholar] [CrossRef]
- Parente, J.; Pereira, M.G.J.M.G. Structural Fire Risk: The Case of Portugal. Sci. Total Environ. 2016, 573, 883–893. [Google Scholar] [CrossRef]
- Beck, H.E.; Zimmermann, N.E.; McVicar, T.R.; Vergopolan, N.; Berg, A.; Wood, E.F. Present and Future Köppen-Geiger Climate Classification Maps at 1-Km Resolution. Sci. Data 2018, 5, 1–12. [Google Scholar] [CrossRef]
- Calheiros, T.; Pereira, M.G.; Nunes, J.P. Assessing Impacts of Future Climate Change on Extreme Fire Weather and Pyro-Regions in Iberian Peninsula. Sci. Total Environ. 2021, 754, 142233. [Google Scholar] [CrossRef]
- Chen, D.; Chen, H.W. Using the Köppen Classification to Quantify Climate Variation and Change: An Example for 1901–2010. Environ. Dev. 2013, 6, 69–79. [Google Scholar] [CrossRef]
- 2012.
- WMO World Meteorological Organization. Guidelines on the Calculation of Climate Normals. 2017, 16.
- Gent, P.R. Climate Normals: Are They Always Communicated Correctly? Weather Forecast. 2022, 37, 1531–1532. [Google Scholar] [CrossRef]
- MEFISTO Forest Fire Multilingual Glossary Portuguese Version 2018.
- Glossary of Wildland Fire, PMS 205 | NWCG Available online:. Available online: https://www.nwcg.gov/glossary-of-wildland-fire-pms-205 (accessed on 11 August 2021).
- Stacey, R. 2012.
- Bowman, D.M.J.S.; Kolden, C.A.; Abatzoglou, J.T.; Johnston, F.H.; van der Werf, G.R.; Flannigan, M. Vegetation Fires in the Anthropocene. Nat. Rev. Earth Environ. 2020 110 2020, 1, 500–515. [Google Scholar] [CrossRef]
- Harris, R.M.B.; Remenyi, T.A.; Williamson, G.J.; Bindoff, N.L.; Bowman, D.M.J.S. Climate–Vegetation–Fire Interactions and Feedbacks: Trivial Detail or Major Barrier to Projecting the Future of the Earth System? Wiley Interdiscip. Rev. Clim. Chang. 2016, 7, 910–931. [Google Scholar] [CrossRef]
- Rundel, P.W.; Arroyo, M.T.K.; Cowling, R.M.; Keeley, J.E.; Lamont, B.B.; Vargas, P. Mediterranean Biomes: Evolution of Their Vegetation, Floras, and Climate. Annu. Rev. Ecol. Evol. Syst. 2016, 47, 383–407. [Google Scholar] [CrossRef]
- Gold, Z.J.; Pellegrini, A.F.A.; Refsland, T.K.; Andrioli, R.J.; Bowles, M.L.; Brockway, D.G.; Burrows, N.; Franco, A.C.; Hallgren, S.W.; Hobbie, S.E.; et al. Herbaceous Vegetation Responses to Experimental Fire in Savannas and Forests Depend on Biome and Climate. Ecol. Lett. 2023, 26, 1237–1246. [Google Scholar] [CrossRef]
- Wang, X.; Parisien, M.-A.; Taylor, S.W.; -, al; Hanan, E. J.; Ren, J.; Tague, C.L.; Alberta, in; Ellen Whitman, C.; Parks, S.A.; et al. Measurement of Inter- and Intra-Annual Variability of Landscape Fire Activity at a Continental Scale: The Australian Case. Environ. Res. Lett. 2016, 11, 035003. [Google Scholar] [CrossRef]
- Alvarado, S.T.; Fornazari, T.; Cóstola, A.; Morellato, L.P.C.; Silva, T.S.F. Drivers of Fire Occurrence in a Mountainous Brazilian Cerrado Savanna: Tracking Long-Term Fire Regimes Using Remote Sensing. Ecol. Indic. 2017, 78, 270–281. [Google Scholar] [CrossRef]
- Amraoui, M.; Parente, J.; Pereira, M. Fire Seasons in Portugal: The Role of Weather and Climate. In Advances in forest fire research 2018; Imprensa da Universidade de Coimbra, 2018; pp. 472–479.
- Saha, M. V.; Scanlon, T.M.; D’Odorico, P. Climate Seasonality as an Essential Predictor of Global Fire Activity. Glob. Ecol. Biogeogr. 2019, 28, 198–210. [Google Scholar] [CrossRef]
- Amraoui, M.; Pereira, M.G.; DaCamara, C.C.; Calado, T.J. Atmospheric Conditions Associated with Extreme Fire Activity in the Western Mediterranean Region. Sci. Total Environ. 2015, 524–525, 524–525. [Google Scholar] [CrossRef]
- Amraoui, M.; Liberato, M.L.R.; Calado, T.J.; DaCamara, C.C.; Coelho, L.P.; Trigo, R.M.; Gouveia, C.M. Fire Activity over Mediterranean Europe Based on Information from Meteosat-8. For. Ecol. Manage. 2013, 294, 62–75. [Google Scholar] [CrossRef]
- Calheiros, T.; Benali, A.; Pereira, M.; Silva, J.; Nunes, J. Drivers of Extreme Burnt Area in Portugal: Fire Weather and Vegetation. Nat. Hazards Earth Syst. Sci. 2022, 22, 4019–4037. [Google Scholar] [CrossRef]
- Campos, C.; Couto, F.T.; Filippi, J.B.; Baggio, R.; Salgado, R. Modelling Pyro-Convection Phenomenon during a Mega-Fire Event in Portugal. Atmos. Res. 2023, 290, 106776. [Google Scholar] [CrossRef]
- Hoinka, K.P.; Carvalho, A.; Miranda, A.I.; Hoinka, K.P.; Carvalho, A.; Miranda, A.I. Regional-Scale Weather Patterns and Wildland Fires in Central Portugal. Int. J. Wildl. Fire 2009, 18, 36–49. [Google Scholar] [CrossRef]
- Turco, M.; Jerez, S.; Augusto, S.; Tarín-Carrasco, P.; Ratola, N.; Jiménez-Guerrero, P.; Trigo, R.M. Climate Drivers of the 2017 Devastating Fires in Portugal. Sci. Rep. 2019, 9. [Google Scholar] [CrossRef]
- Tonini, M.; Pereira, M.G.; Parente, J.; Vega Orozco, C. Evolution of Forest Fires in Portugal: From Spatio-Temporal Point Events to Smoothed Density Maps. Nat. Hazards 2017, 85. [Google Scholar] [CrossRef]
- Kottek, M.; Grieser, J.; Beck, C.; Rudolf, B.; Rubel, F. World Map of the Köppen-Geiger Climate Classification Updated. Meteorol. Zeitschrift 2006, 15, 259–263. [Google Scholar] [CrossRef]
- Peel, M.C.; Finlayson, B.L.; McMahon, T.A. Updated World Map of the Köppen-Geiger Climate Classification. Hydrol. Earth Syst. Sci. 2007, 11, 1633–1644. [Google Scholar] [CrossRef]
- Rubel, F.; Kottek, M. Observed and Projected Climate Shifts 1901-2100 Depicted by World Maps of the Köppen-Geiger Climate Classification. Meteorol. Zeitschrift 2010, 19, 135–141. [Google Scholar] [CrossRef]
- Dasari, H.P.; Pozo, I.; Ferri-Yáñez, F.; Araújo, M.B. A Regional Climate Study of Heat Waves over the Iberian Peninsula. Atmos. Clim. Sci. 2014, 04, 841–853. [Google Scholar] [CrossRef]
- Kang, S.M.; Lu, J. Expansion of the Hadley Cell under Global Warming: Winter versus Summer. J. Clim. 2012, 25, 8387–8393. [Google Scholar] [CrossRef]
- Previdi, M.; Liepert, B.G. Annular Modes and Hadley Cell Expansion under Global Warming. Geophys. Res. Lett. 2007, 34. [Google Scholar] [CrossRef]
- Grise, K.M.; Davis, S.M. Hadley Cell Expansion in CMIP6 Models. Atmos. Chem. Phys. 2020, 20, 5249–5268. [Google Scholar] [CrossRef]
- Lu, J.; Vecchi, G.A.; Reichler, T. Expansion of the Hadley Cell under Global Warming. Geophys. Res. Lett. 2007, 34, 6805. [Google Scholar] [CrossRef]
- Pereira, M.G.; Caramelo, L.; Orozco, C.V.; Costa, R.; Tonini, M. Space-Time Clustering Analysis Performance of an Aggregated Dataset: The Case of Wildfires in Portugal. Environ. Model. Softw. 2015, 72. [Google Scholar] [CrossRef]
- Sousa, P.M.; Trigo, R.M.; Pereira, M.G.; Bedia, J.; Gutiérrez, J.M. Different Approaches to Model Future Burnt Area in the Iberian Peninsula. Agric. For. Meteorol. 2015, 202, 11–25. [Google Scholar] [CrossRef]
- Trigo, R.M.; Sousa, P.M.P.M.; Pereira, M.G.M.G.; Rasilla, D.; Gouveia, C.M.C.M.; Dacamara, C.C.; Sousa, P.M.P.M.; Pereira, M.G.M.G.; Rasilla, D.; Gouveia, C.M.C.M. Modelling Wildfire Activity in Iberia with Different Atmospheric Circulation Weather Types. Int. J. Climatol. 2016, 36, 2761–2778. [Google Scholar] [CrossRef]
- Hersbach, H.; Bell, B.; Berrisford, P.; Biavati, G.; Horányi, A.; Muñoz Sabater, J.; Nicolas, J.; Peubey, C.; Radu, R.; Rozum, I.; et al. ERA5 Hourly Data on Single Levels from 1979 to Present. Copernicus Clim. Chang. Serv. Clim. data store 2018, 10. [Google Scholar]
- Hersbach, H.; Bell, B.; Berrisford, P.; Hirahara, S.; Horányi, A.; Muñoz-Sabater, J.; Nicolas, J.; Peubey, C.; Radu, R.; Schepers, D.; et al. The ERA5 Global Reanalysis. Q. J. R. Meteorol. Soc. 2020, 146, 1999–2049. [Google Scholar] [CrossRef]
- Santos, L.S.C. dos The Role of Wind Direction on the Occurrence of Large Fire Events in Portugal. 2023.
- DaCamara, C.C.; Trigo, R.M.; Viegas, D. Circulation Weather Types and Their Influence on the Fire Regime in Portugal. Adv. For. FIRE Res. 2018 2018, N/A, 9. [Google Scholar] [CrossRef] [PubMed]
- Pereira, M.G. A Atmosfera Como Um Laboratório de Física: A Influência Meteorológica Nos Incêndios Rurais. Gaz. física 2022, 45, 26–31. [Google Scholar]
- Ballabio, D. A MATLAB Toolbox for Principal Component Analysis and Unsupervised Exploration of Data Structure. Chemom. Intell. Lab. Syst. 2015, 149, 1–9. [Google Scholar] [CrossRef]
- Kaiser, H.F. The Application of Electronic Computers to Factor Analysis. Educ. Psychol. Meas. 1960, 20, 141–151. [Google Scholar] [CrossRef]
- Todeschini, R. Data Correlation, Number of Significant Principal Components and Shape of Molecules. The K Correlation Index. Anal. Chim. Acta 1997, 348, 419–430. [Google Scholar] [CrossRef]
- Parente, J.; Pereira, M.G.G.; Amraoui, M.; Tedim, F. Negligent and Intentional Fires in Portugal: Spatial Distribution Characterization. Sci. Total Environ. 2018, 624, 424–437. [Google Scholar] [CrossRef] [PubMed]
- Verde, J.C.; Zêzere, J.L. Assessment and Validation of Wildfire Susceptibility and Hazard in Portugal. Nat. Hazards Earth Syst. Sci. 2010, 10, 485–497. [Google Scholar] [CrossRef]
- Castellnou, M.; Guiomar, N.; Rego, F.; Fernandes, P.M. Fire Growth Patterns in the 2017 Mega Fire Episode of October 15, Central Portugal. Adv. For. fire Res. 2018, 447–453. [Google Scholar]
- Ramos, A.M.; Russo, A.; DaCamara, C.C.; Nunes, S.; Sousa, P.; Soares, P.M.M.; Lima, M.M.; Hurduc, A.; Trigo, R.M. The Compound Event That Triggered the Destructive Fires of October 2017 in Portugal. iScience 2023, 26, 106141. [Google Scholar] [CrossRef] [PubMed]
- Beighley, M.; Hyde, A.C. 2018.
- Collins, R.D.; de Neufville, R.; Claro, J.; Oliveira, T.; Pacheco, A.P. Forest Fire Management to Avoid Unintended Consequences: A Case Study of Portugal Using System Dynamics. J. Environ. Manage. 2013, 130, 1–9. [Google Scholar] [CrossRef] [PubMed]
- Pereira, M.G.; Nunes, J.P.; Silva, J.M.N.; Calheiros, T. Regional Issues of Fire Management: The Role of Extreme Weather, Climate and Vegetation Type. Fire Hazards Socio-economic Reg. Issues. [CrossRef]
- Nunes, S.A.; Dacamara, C.C.; Turkman, K.F.; Calado, T.J.; Trigo, R.M.; Turkman, M.A.A. Wildland Fire Potential Outlooks for Portugal Using Meteorological Indices of Fire Danger. Nat. Hazards Earth Syst. Sci. 2019, 19, 1459–1470. [Google Scholar] [CrossRef]
- Neves, A.K.; Campagnolo, M.L.; Silva, J.M.N.; Pereira, J.M.C. A Landsat-Based Atlas of Monthly Burned Area for Portugal, 1984–2021. Int. J. Appl. Earth Obs. Geoinf. 2023, 119, 103321. [Google Scholar] [CrossRef]
- Aparício, B.A.; Santos, J.A.; Freitas, T.R.; Sá, A.C.L.; Pereira, J.M.C.; Fernandes, P.M. Unravelling the Effect of Climate Change on Fire Danger and Fire Behaviour in the Transboundary Biosphere Reserve of Meseta Ibérica (Portugal-Spain). Clim. Change 2022, 173, 1–20. [Google Scholar] [CrossRef]
- Nitzsche, N.; Nunes, J.P.; Parente, J. Assessing Post-Fire Water Quality Changes in Reservoirs: Insights from a Large Dataset in Portugal. Sci. Total Environ. 2024, 912, 169463. [Google Scholar] [CrossRef]
- Kanevski, M.; Pereira, M.G.M. Local Fractality: The Case of Forest Fires in Portugal. Phys. A Stat. Mech. its Appl. 2017, 479, 400–410. [Google Scholar] [CrossRef]
- Parente, J.; Tonini, M.; Amroui, M.; Pareira, M. Socioeconomic Impacts and Regional Drivers of Fire Management: The Case of Portugal. In Fire Hazards: Socio-economic and regional issues; Rodrigo-Comino, J., Ed.; Springer Nature Switzerland AG, 2023.
- Parente, J.; Tonini, M.; Stamou, Z.; Koutsias, N.; Pereira, M. Quantitative Assessment of the Relationship between Land Use/Land Cover Changes and Wildfires in Southern Europe. Fire 2023, Vol. 6, Page 198 2023, 6, 198. [Google Scholar] [CrossRef]
- Ermitão, T.; Páscoa, P.; Trigo, I.; Alonso, C.; Gouveia, C. Mapping the Most Susceptible Regions to Fire in Portugal. Fire 2023, 6, 254. [Google Scholar] [CrossRef]
- Fernández-Guisuraga, J.M.; Martins, S.; Fernandes, P.M. Characterization of Biophysical Contexts Leading to Severe Wildfires in Portugal and Their Environmental Controls. Sci. Total Environ. 2023, 875. [Google Scholar] [CrossRef] [PubMed]
- Trigo, R.M.; DaCamara, C.C. Circulation Weather Types and Their Influence on the Precipitation Regime in Portugal. Int. J. Climatol. A J. R. Meteorol. Soc. 2000, 20, 1559–1581. [Google Scholar] [CrossRef]
- Fonseca, A.R.; Santos, J.A. High-Resolution Temperature Datasets in Portugal from a Geostatistical Approach: Variability and Extremes. J. Appl. Meteorol. Climatol. 2018, 57, 627–644. [Google Scholar] [CrossRef]
- Rodrigues, M.; Trigo, R.M.; Vega-García, C.; Cardil, A. Identifying Large Fire Weather Typologies in the Iberian Peninsula. Agric. For. Meteorol. 2020, 280, 107789. [Google Scholar] [CrossRef]
- Williams, P.D.; Silva, P.; Carmo, M.; Rio, J.; Novo, I. Changes in the Seasonality of Fire Activity and Fire Weather in Portugal: Is the Wildfire Season Really Longer? Meteorol. 2023, Vol. 2, Pages 74-86 2023, 2, 74–86. [Google Scholar] [CrossRef]
Figure 1.
Spatial distribution of the wildfire incidence in Continental Portugal in the 2001 – 2017 period based on the Nomenclature of Territorial Units for Statistics level II (NUTS II) regions, namely Norte, Centro, Área Metropolitana de Lisboa (AML), Alentejo, and Algarve.
Figure 1.
Spatial distribution of the wildfire incidence in Continental Portugal in the 2001 – 2017 period based on the Nomenclature of Territorial Units for Statistics level II (NUTS II) regions, namely Norte, Centro, Área Metropolitana de Lisboa (AML), Alentejo, and Algarve.
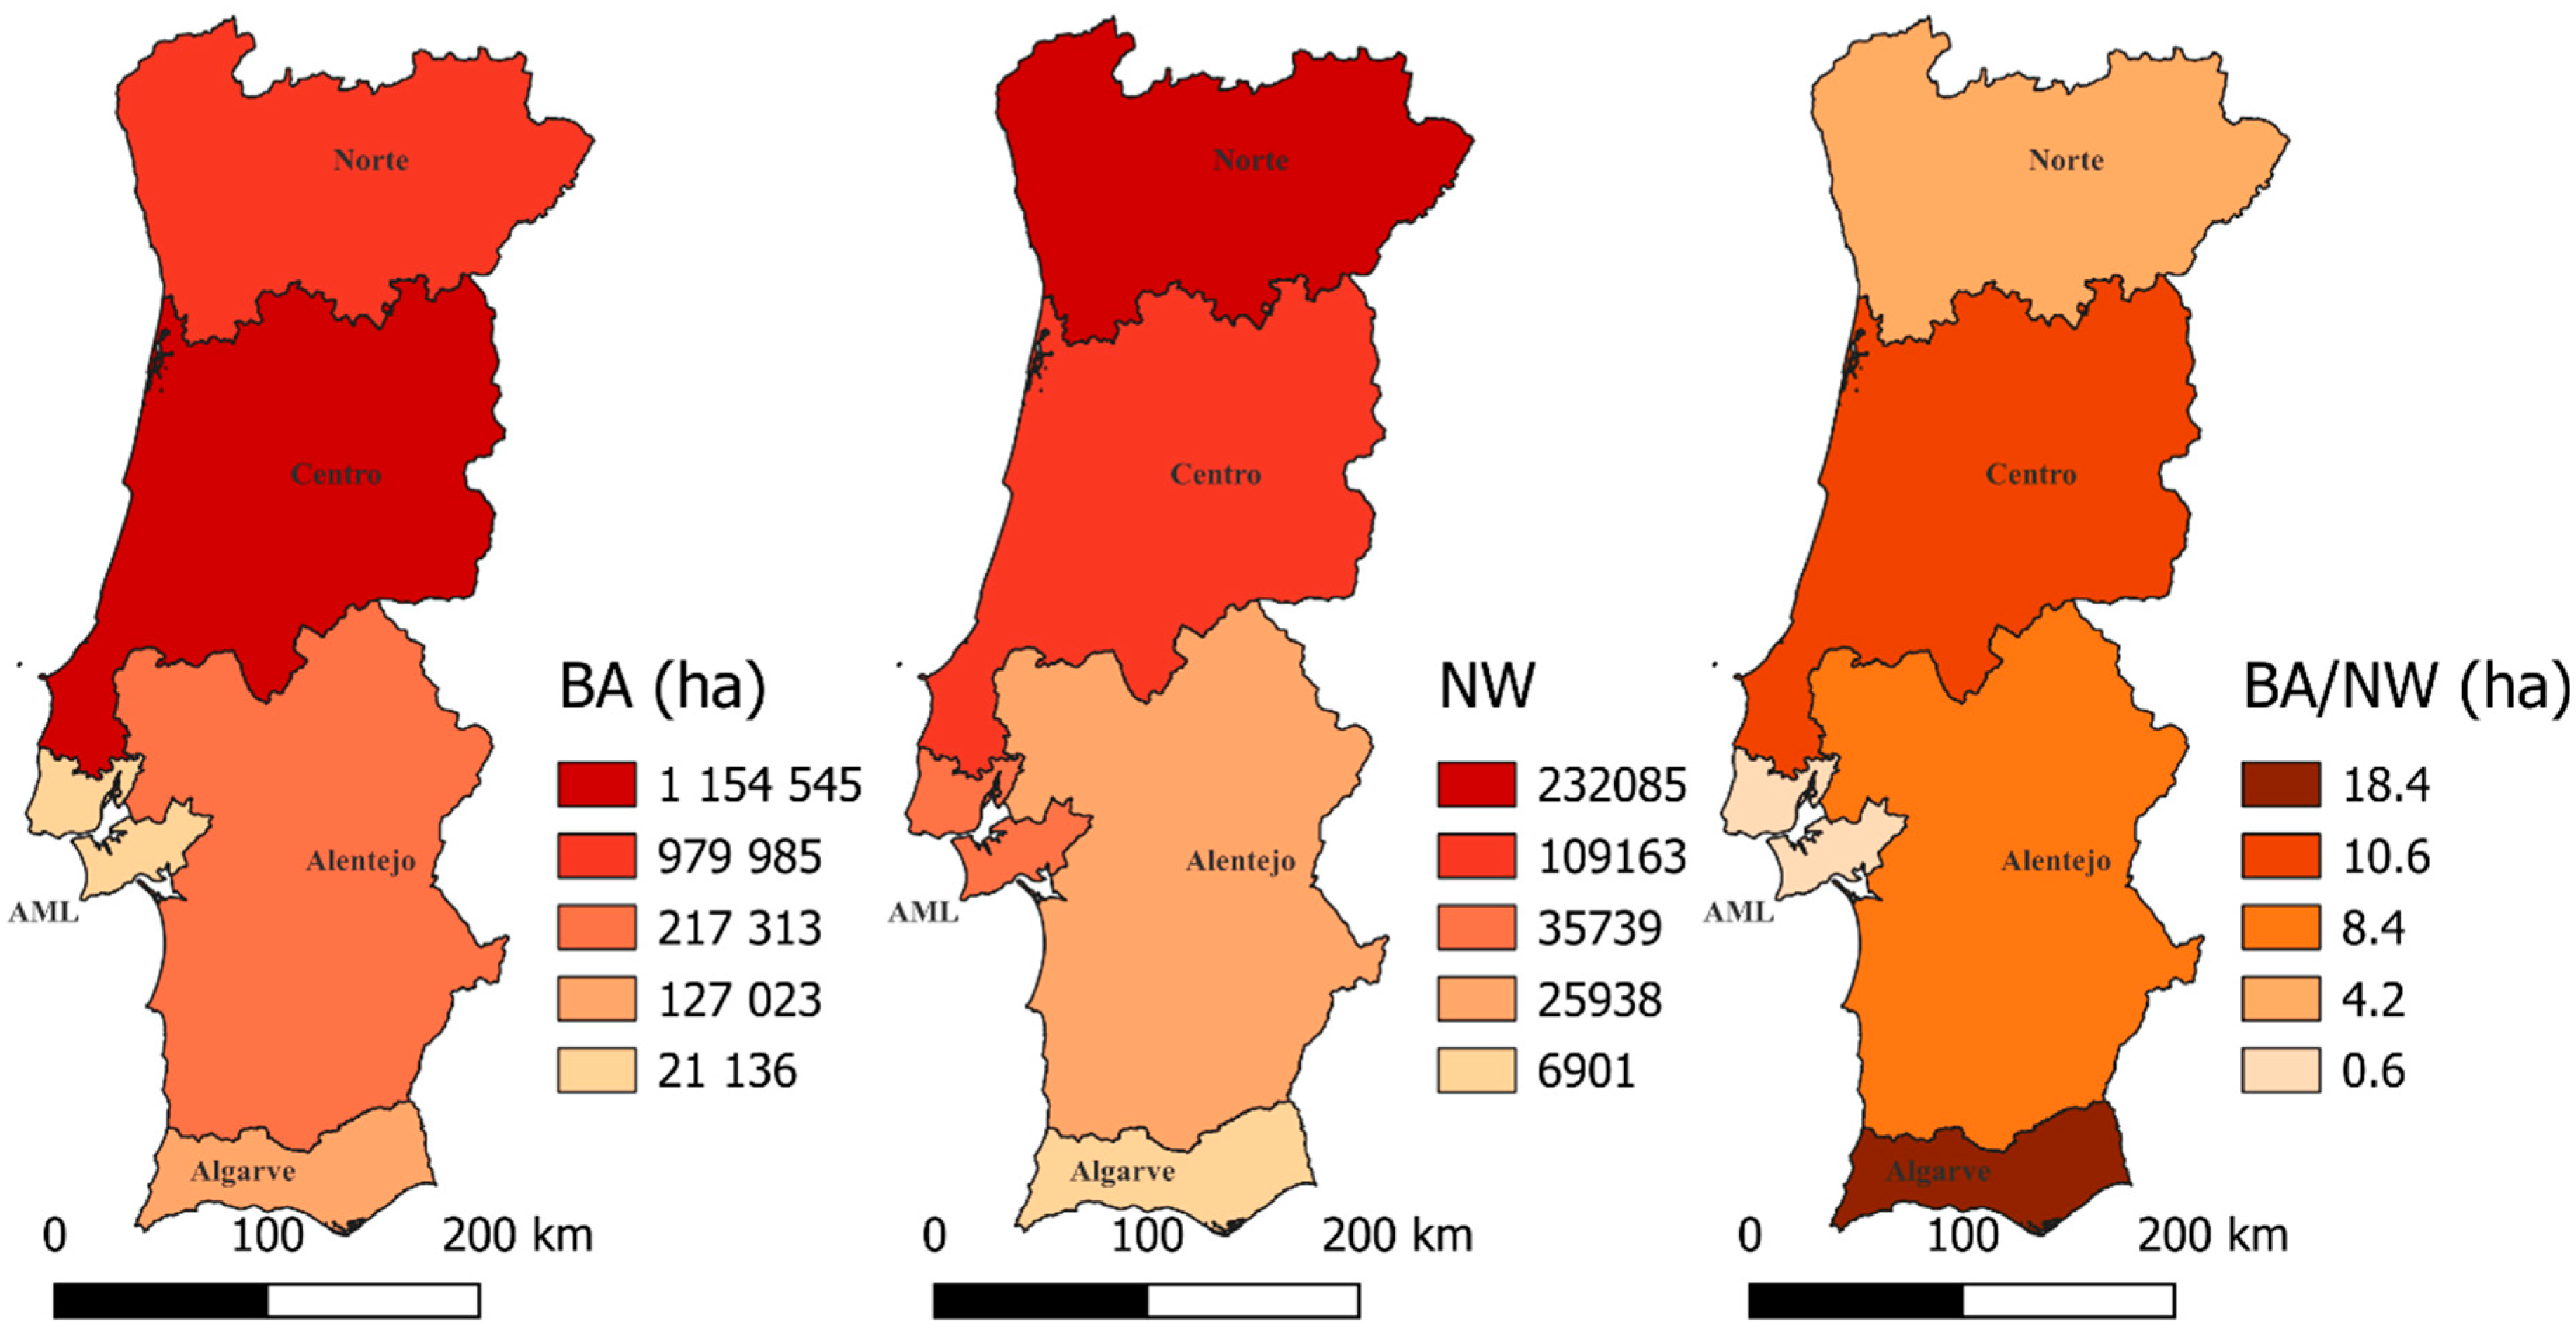
Figure 2.
Temporal evolution of the annual number of wildfires (NW) and burnt area (BA) in Mainland Portugal in the 2001 – 2017 period.
Figure 2.
Temporal evolution of the annual number of wildfires (NW) and burnt area (BA) in Mainland Portugal in the 2001 – 2017 period.
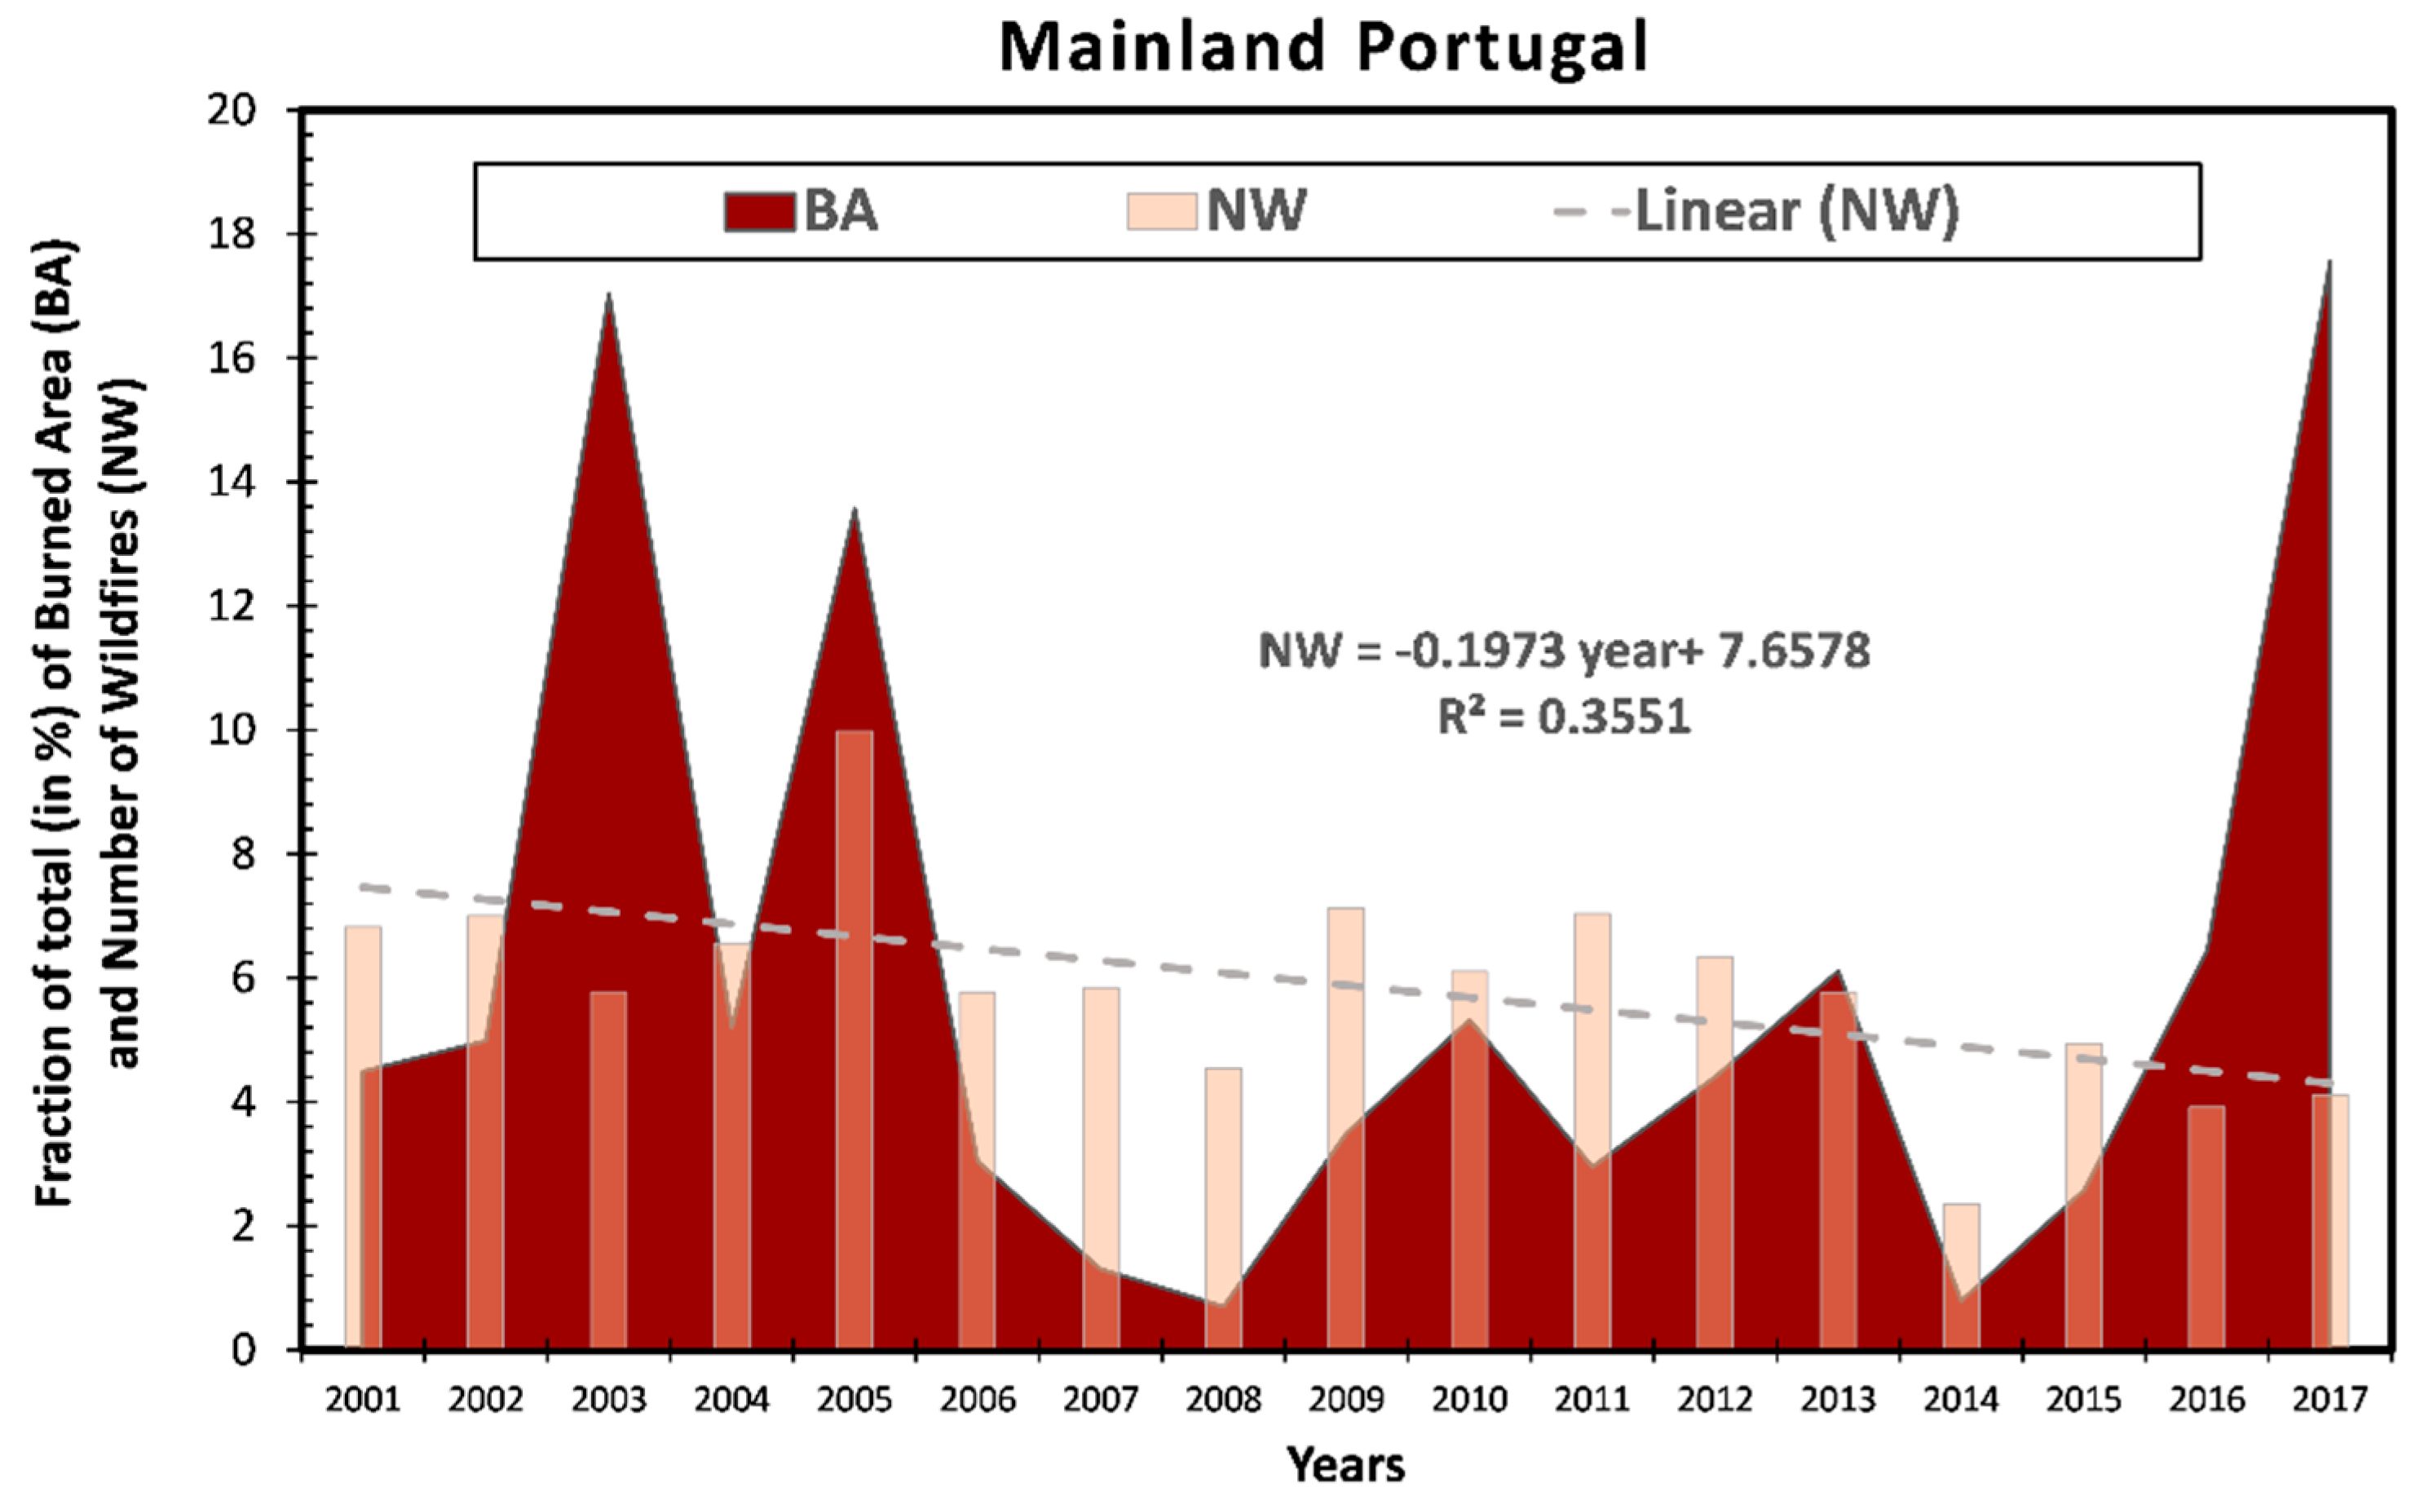
Figure 3.
The evolution of the arithmetic means of the monthly sum of the number of wildfires (NW) and burned area (BA) in Mainland Portugal in the 2001 – 2017 period.
Figure 3.
The evolution of the arithmetic means of the monthly sum of the number of wildfires (NW) and burned area (BA) in Mainland Portugal in the 2001 – 2017 period.

Figure 4.
Monthly anomalies (from the top to the bottom panel) of easterly wind speed (m/s) at 10 m, total precipitation (TP), air temperature (ºC) at 2 m high (T2m), relative humidity (%) at 850 hPa level (RH), number of wildfires (NF) and burned area (BA) in mainland Portugal for the year of 2014 (type 1). Values presented in the panel of Wind correspond to the anomalies of days with easterly wind and for TP to the number of rainy days.
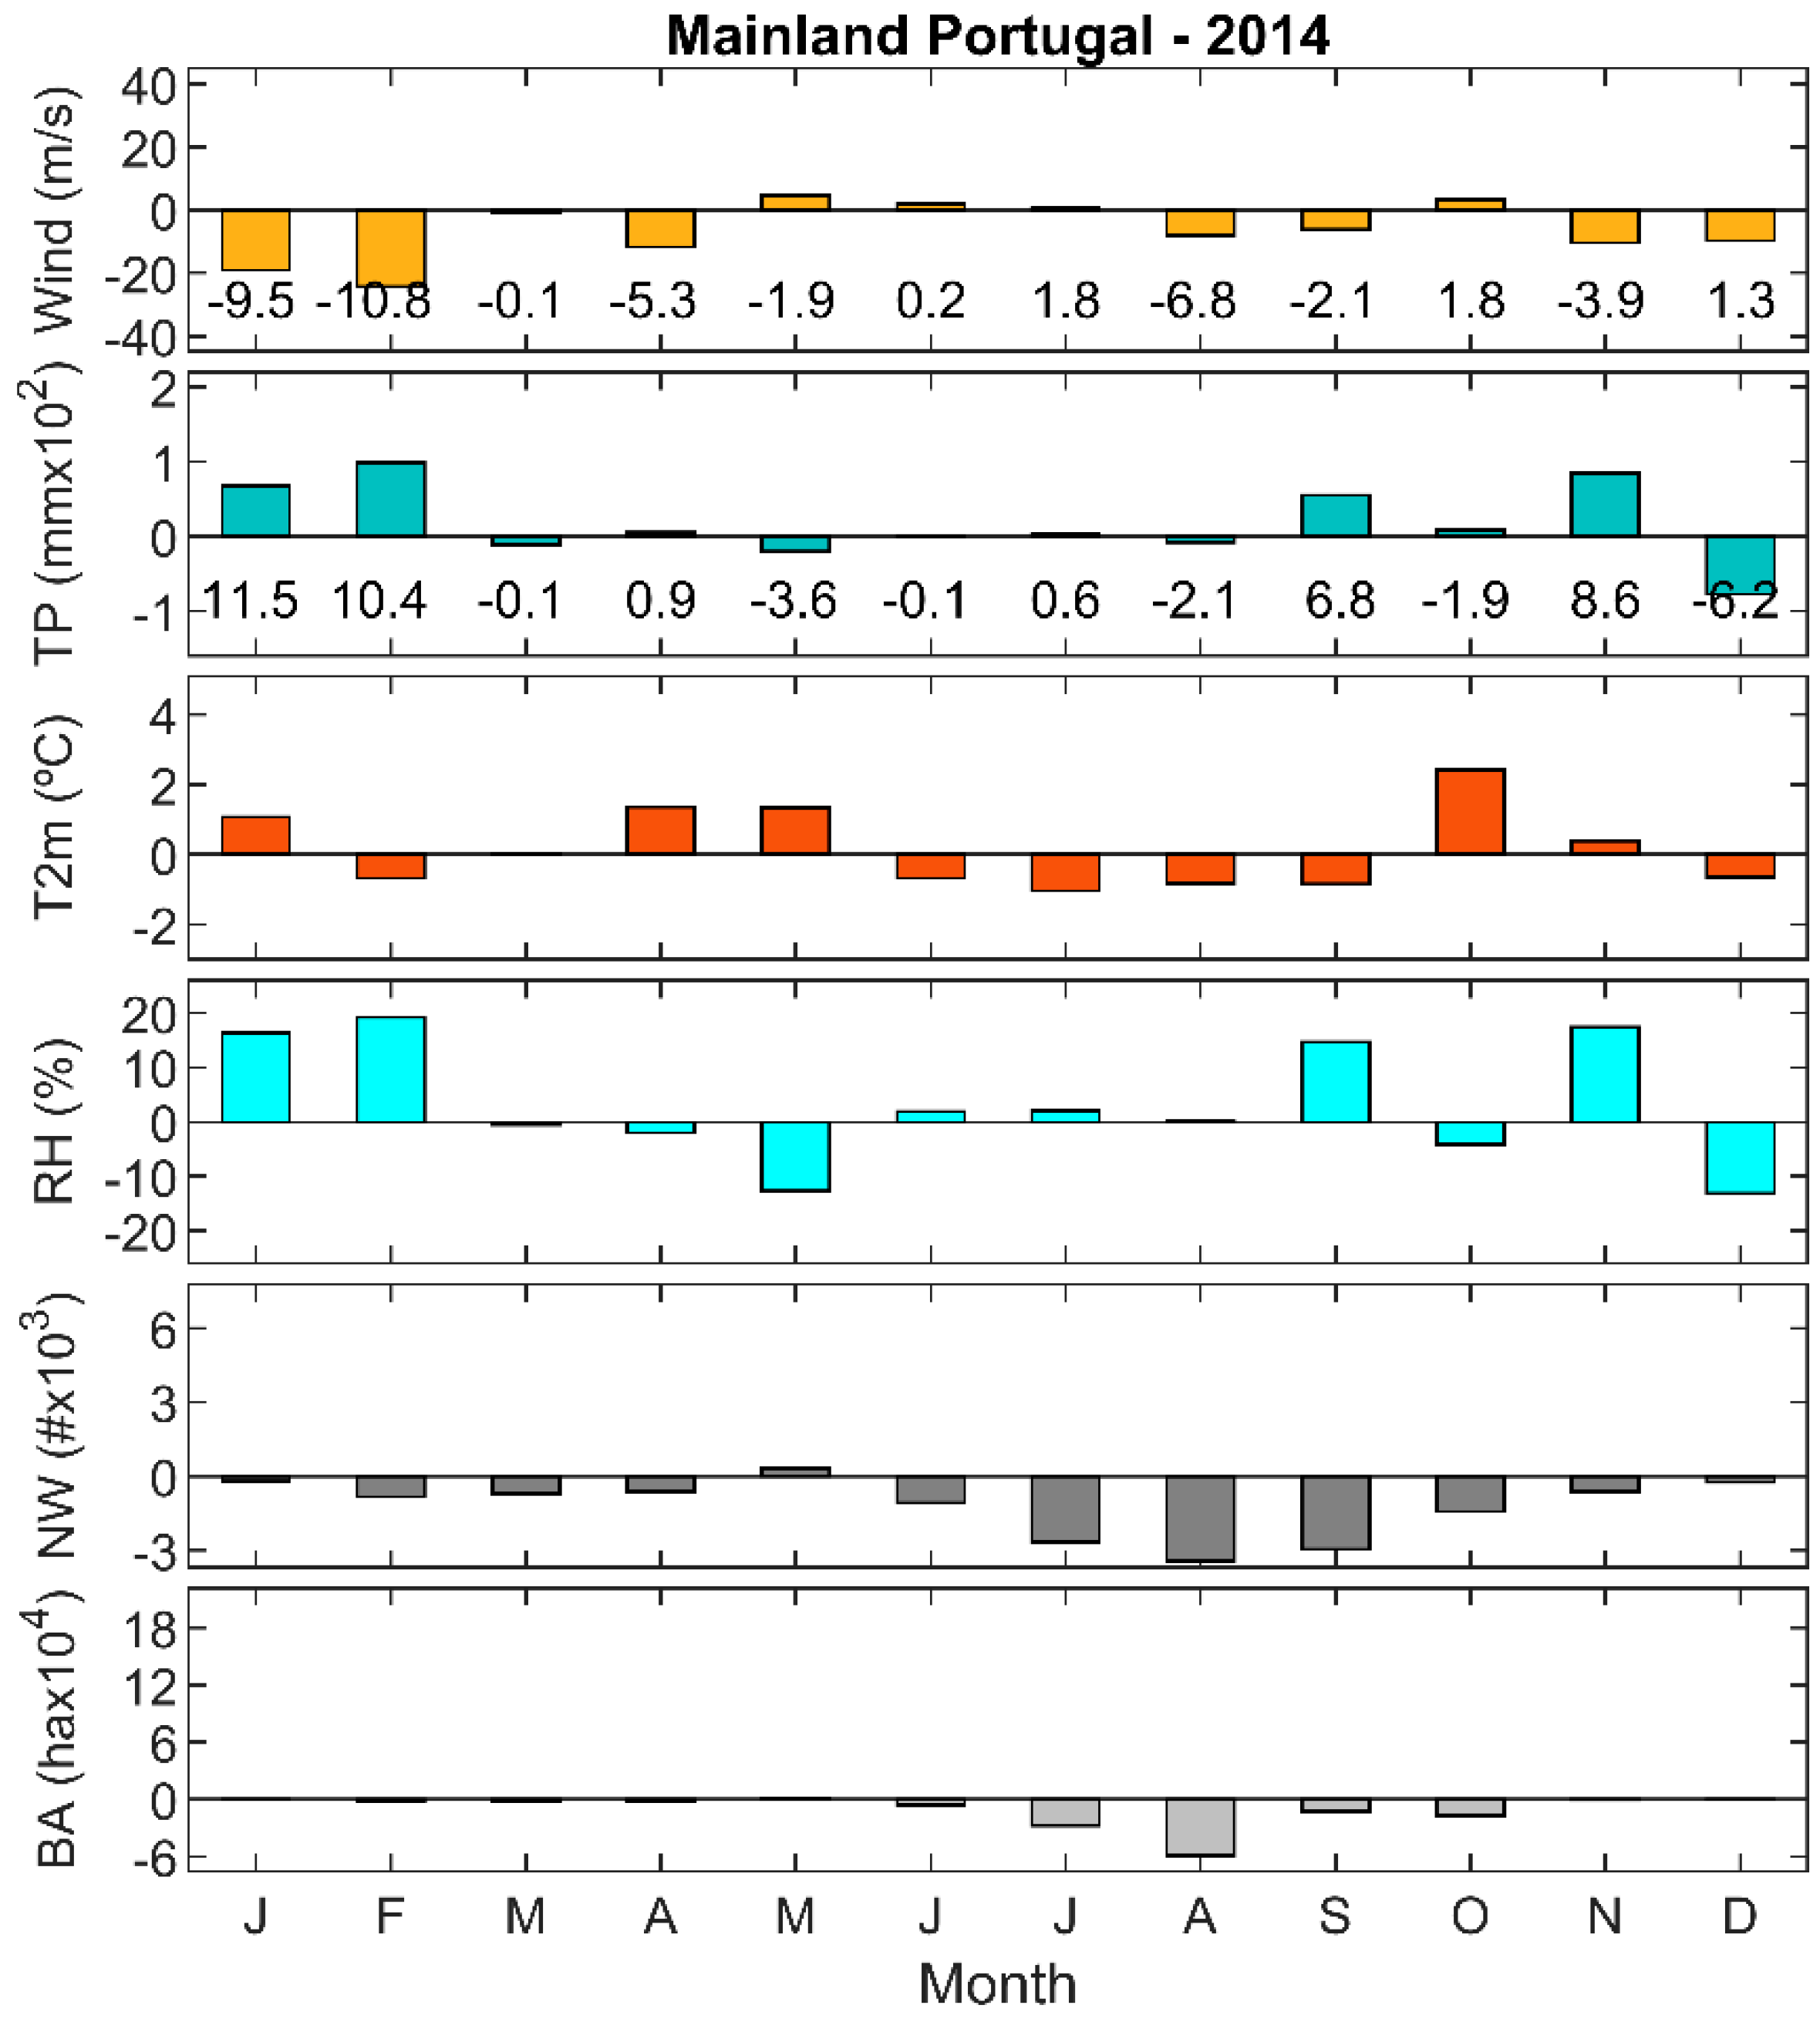
Figure 5.
As in Figure 4, but for 2012, a year of type 2, with a wildfire season in Spring defined as the months of February, March and April.
Figure 5.
As in Figure 4, but for 2012, a year of type 2, with a wildfire season in Spring defined as the months of February, March and April.
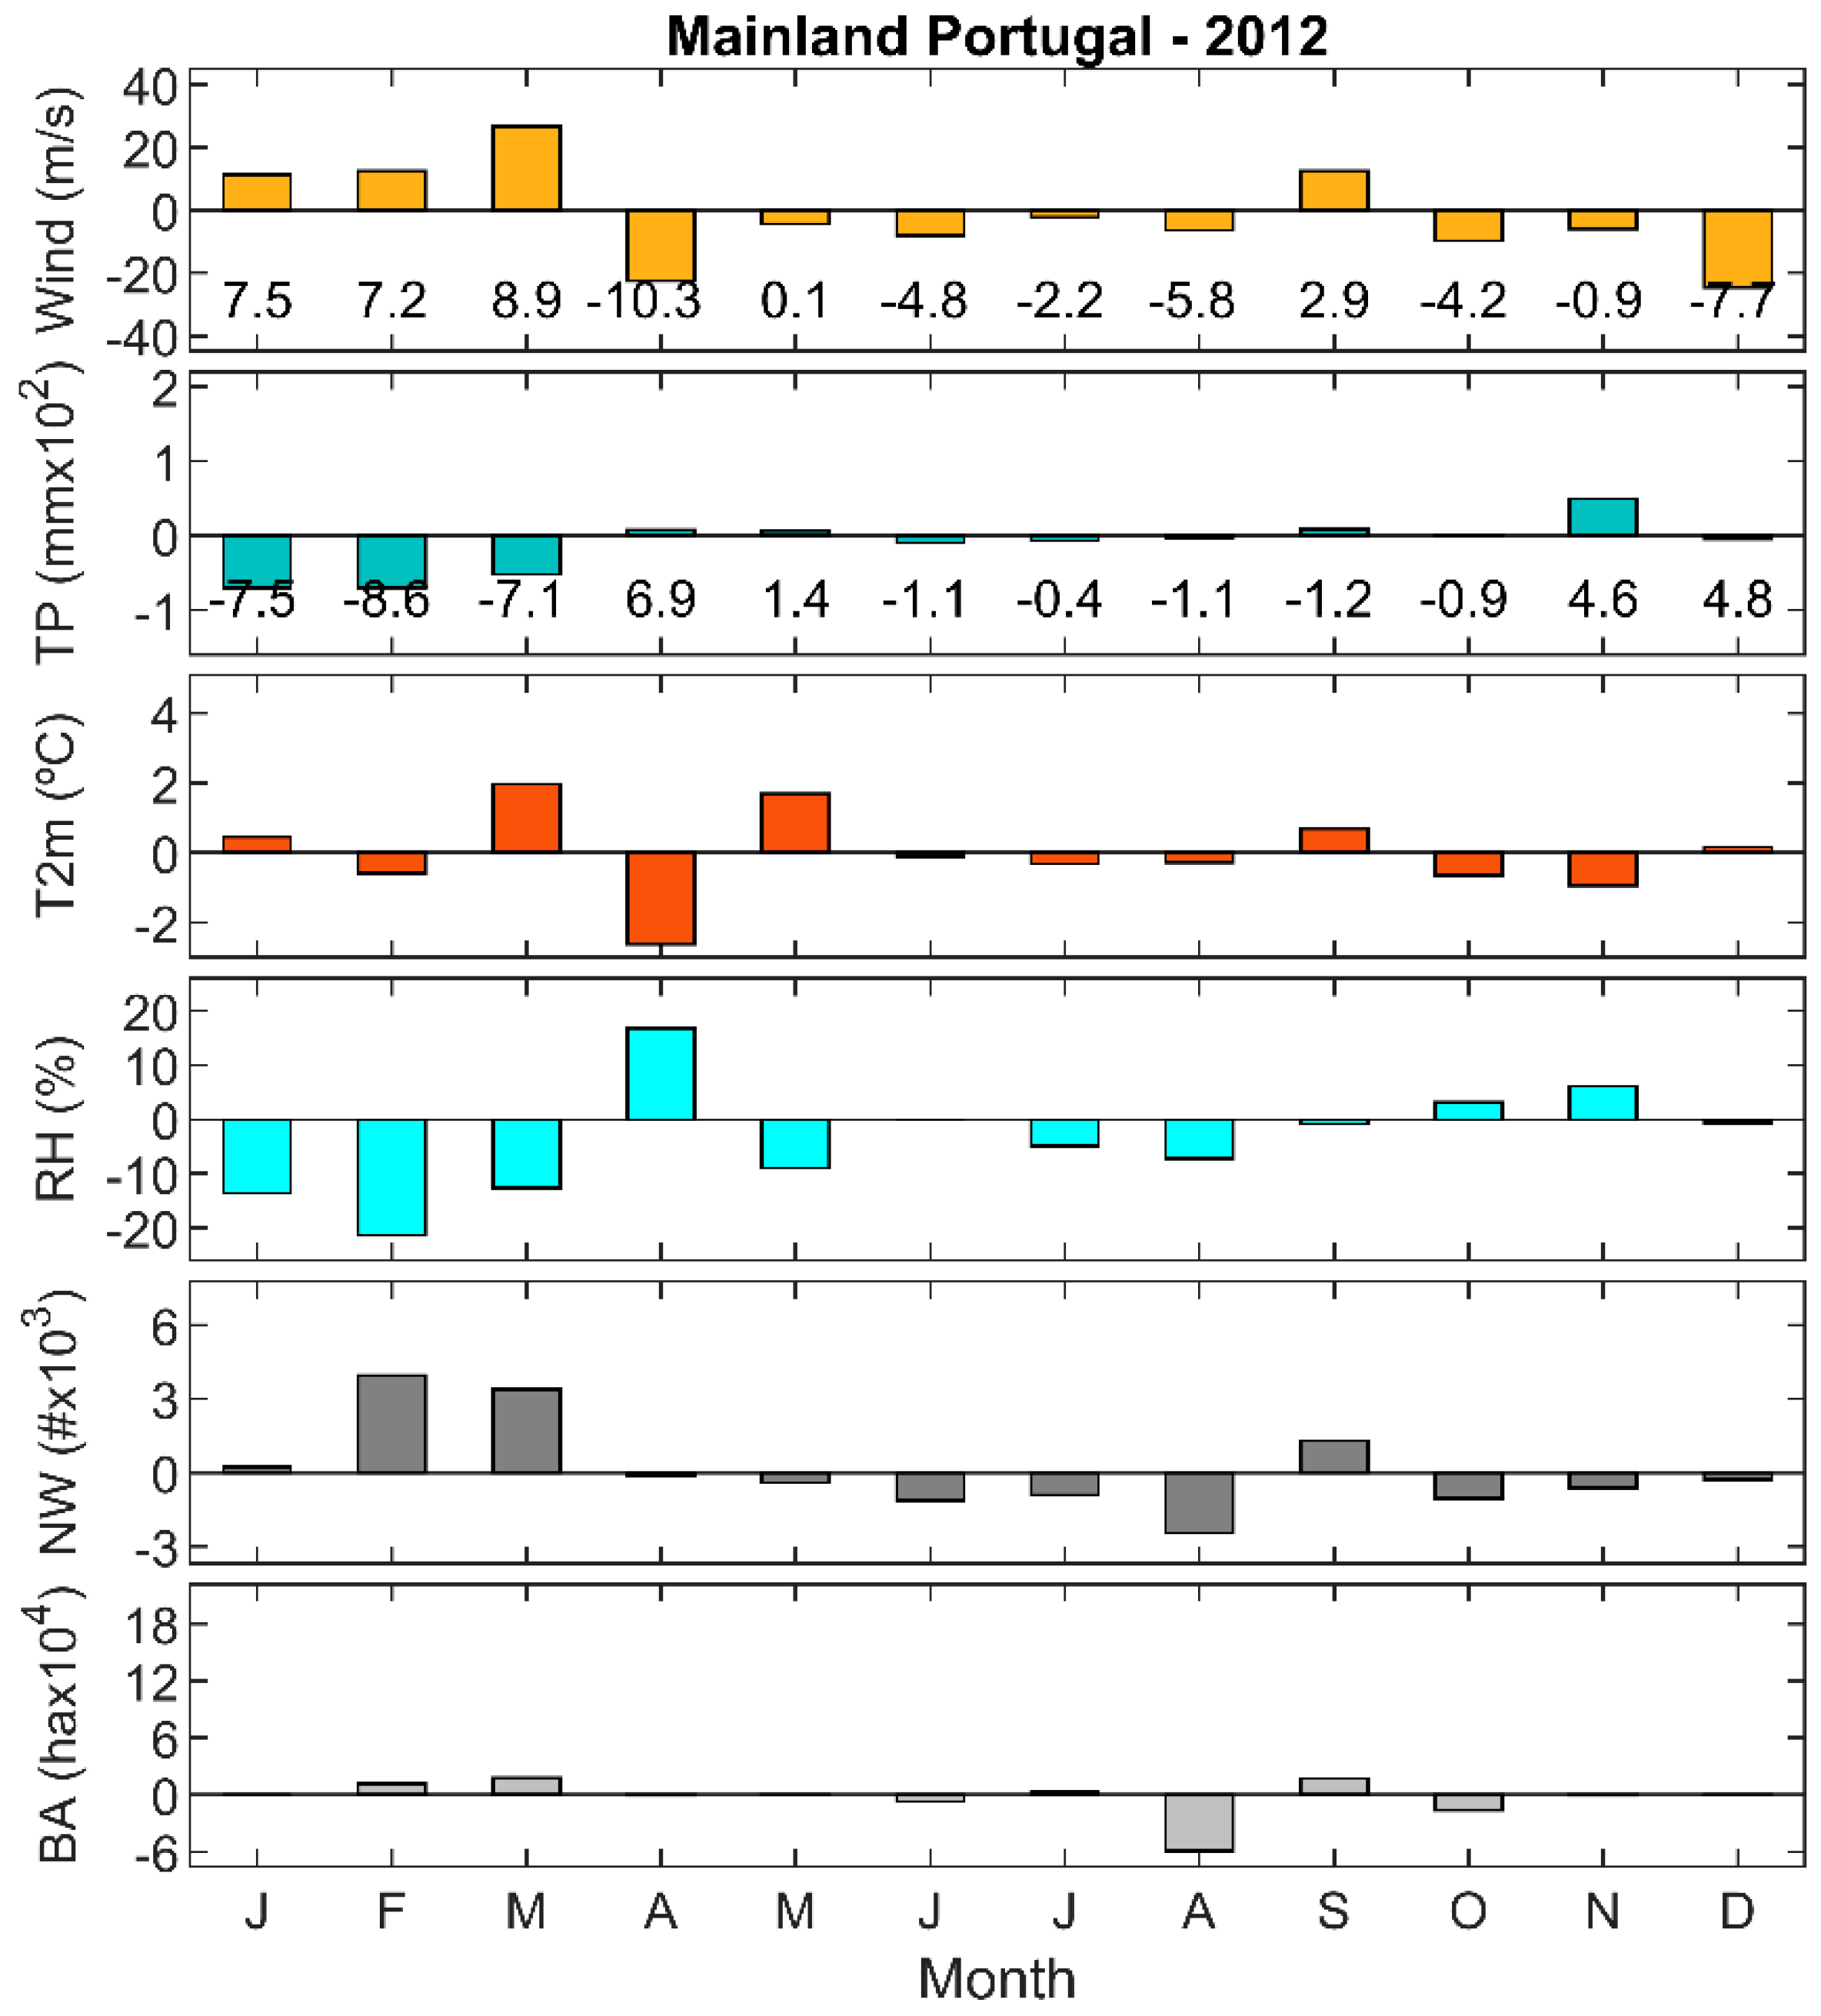
Figure 6.
As in Figure 4, but for 2003, a year of type 3, with a wildfire season in Summer defined as the months of June to October.
Figure 6.
As in Figure 4, but for 2003, a year of type 3, with a wildfire season in Summer defined as the months of June to October.
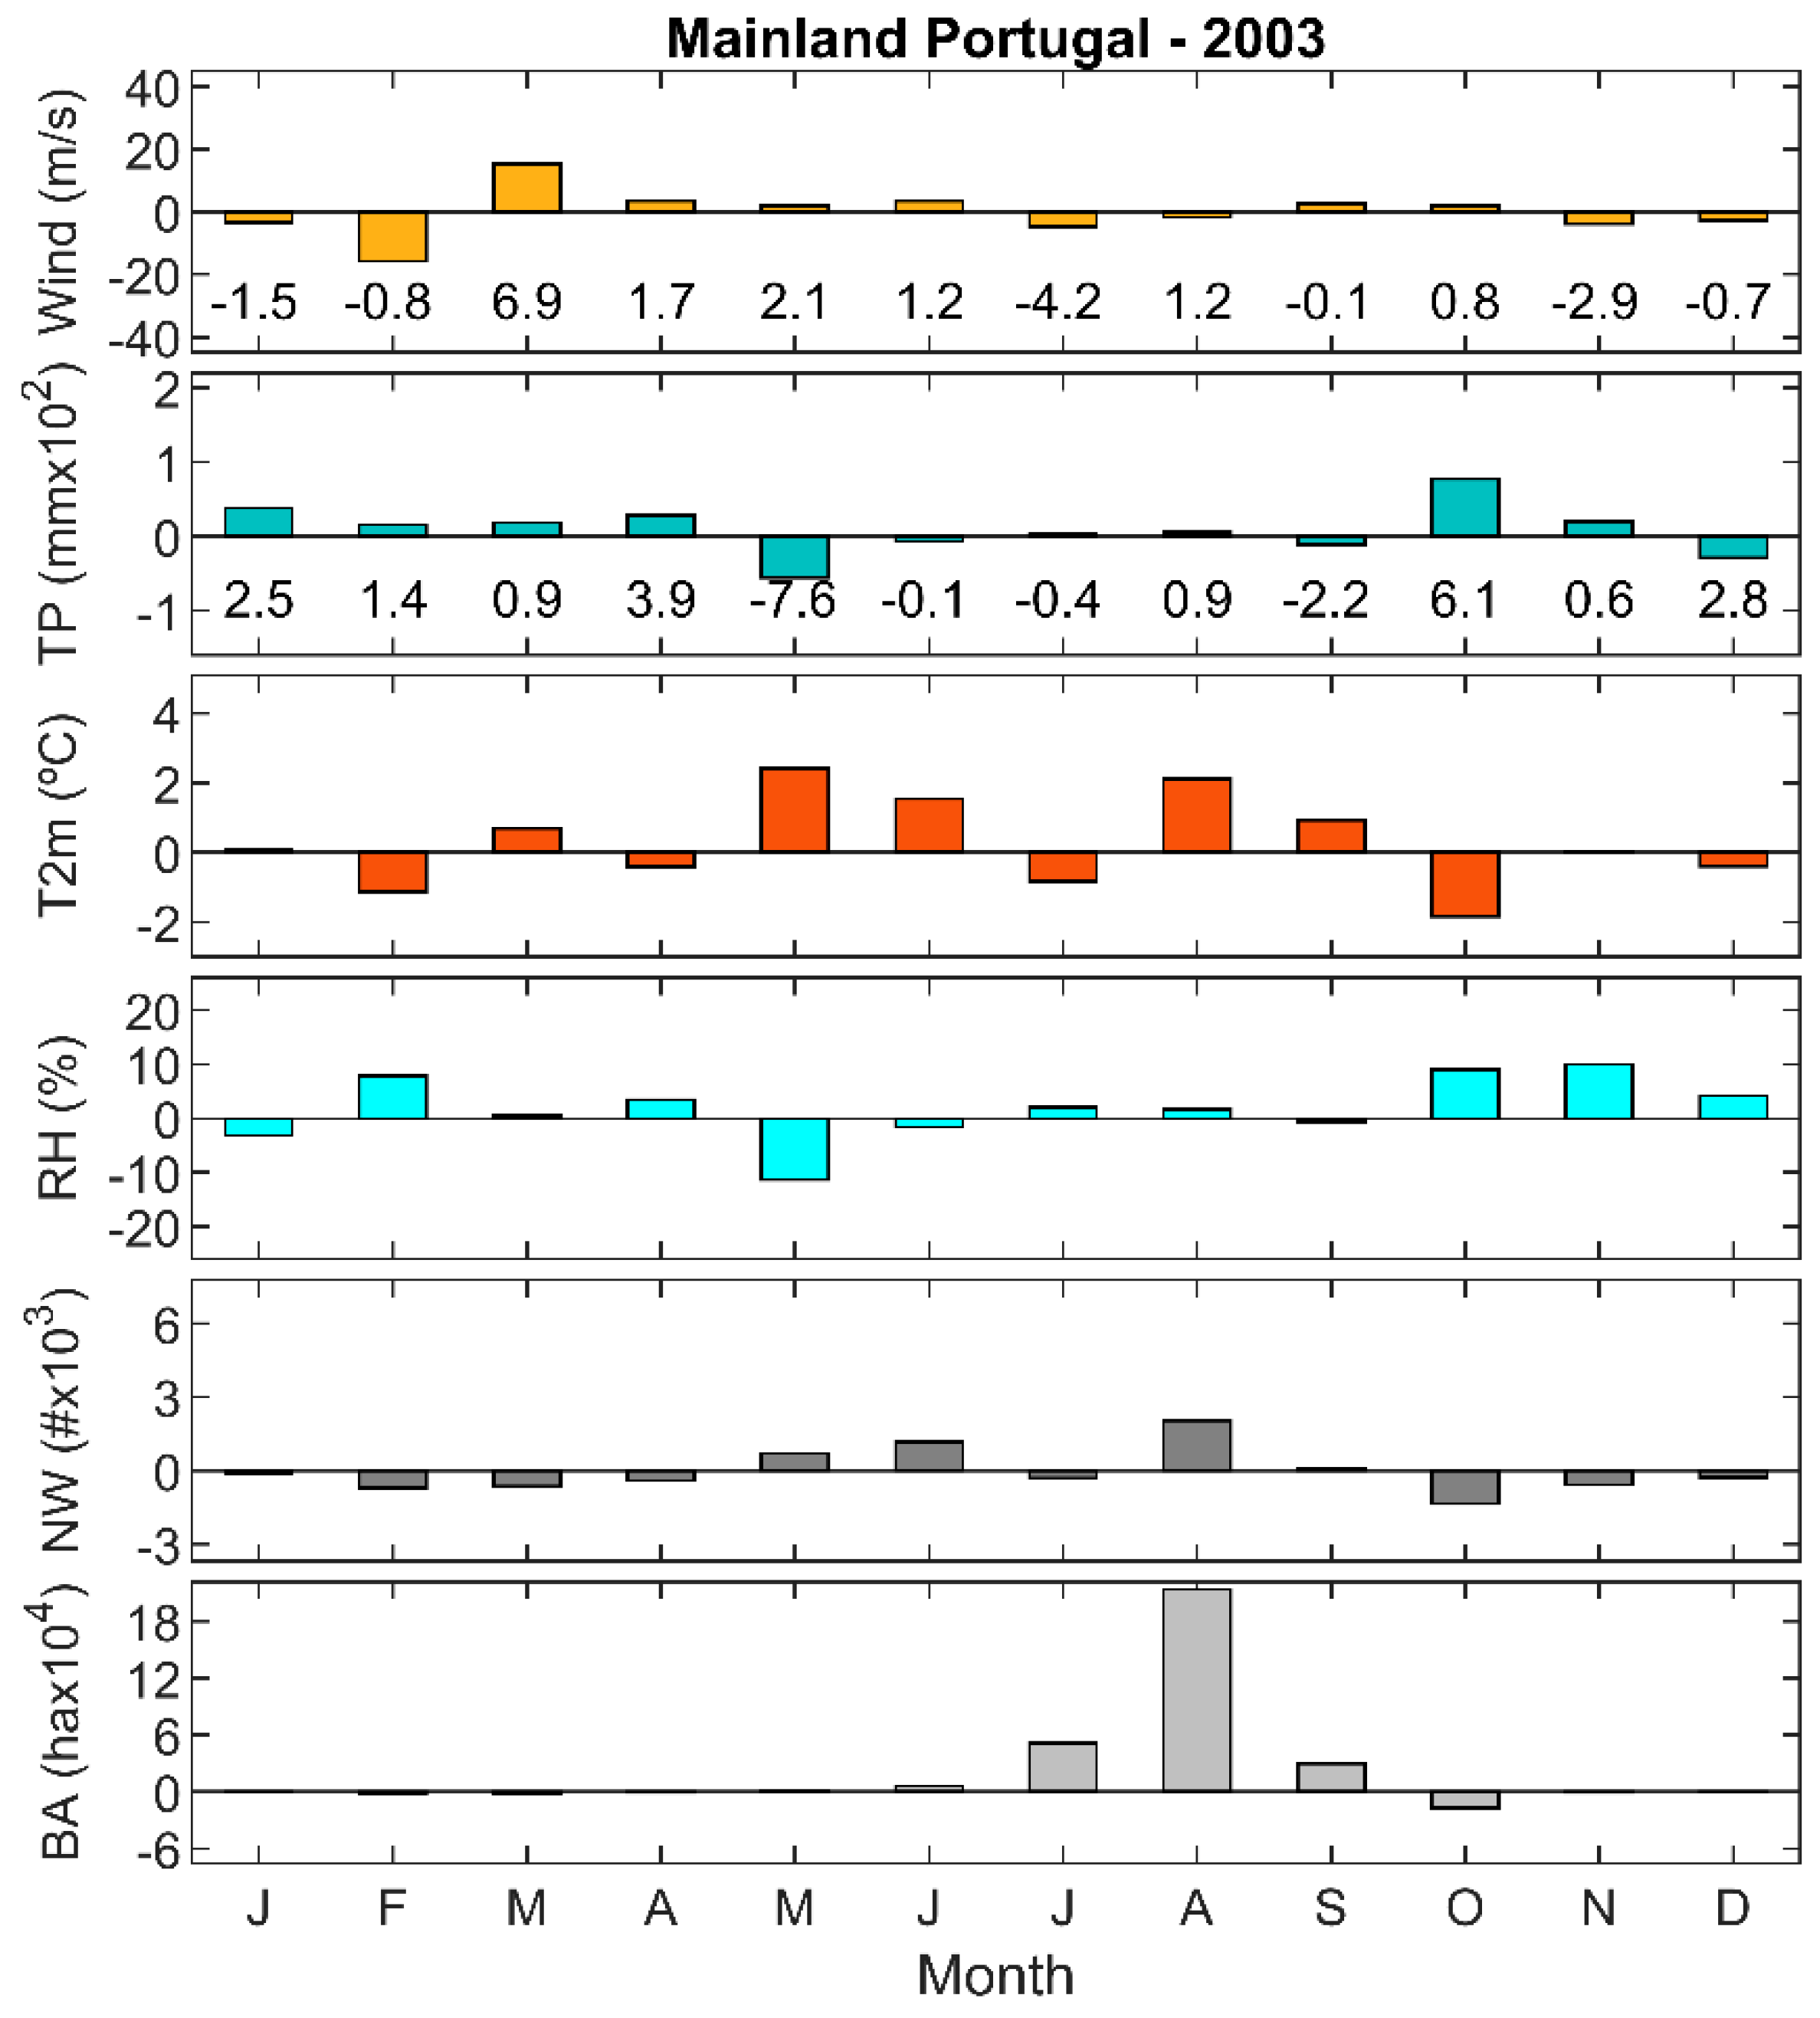
Figure 7.
As in Figure 4, but for 2003, a year of type 4, with wildfire seasons in Spring, defined as the months of February, March and April, and Summer, defined as the months of June to October.
Figure 7.
As in Figure 4, but for 2003, a year of type 4, with wildfire seasons in Spring, defined as the months of February, March and April, and Summer, defined as the months of June to October.
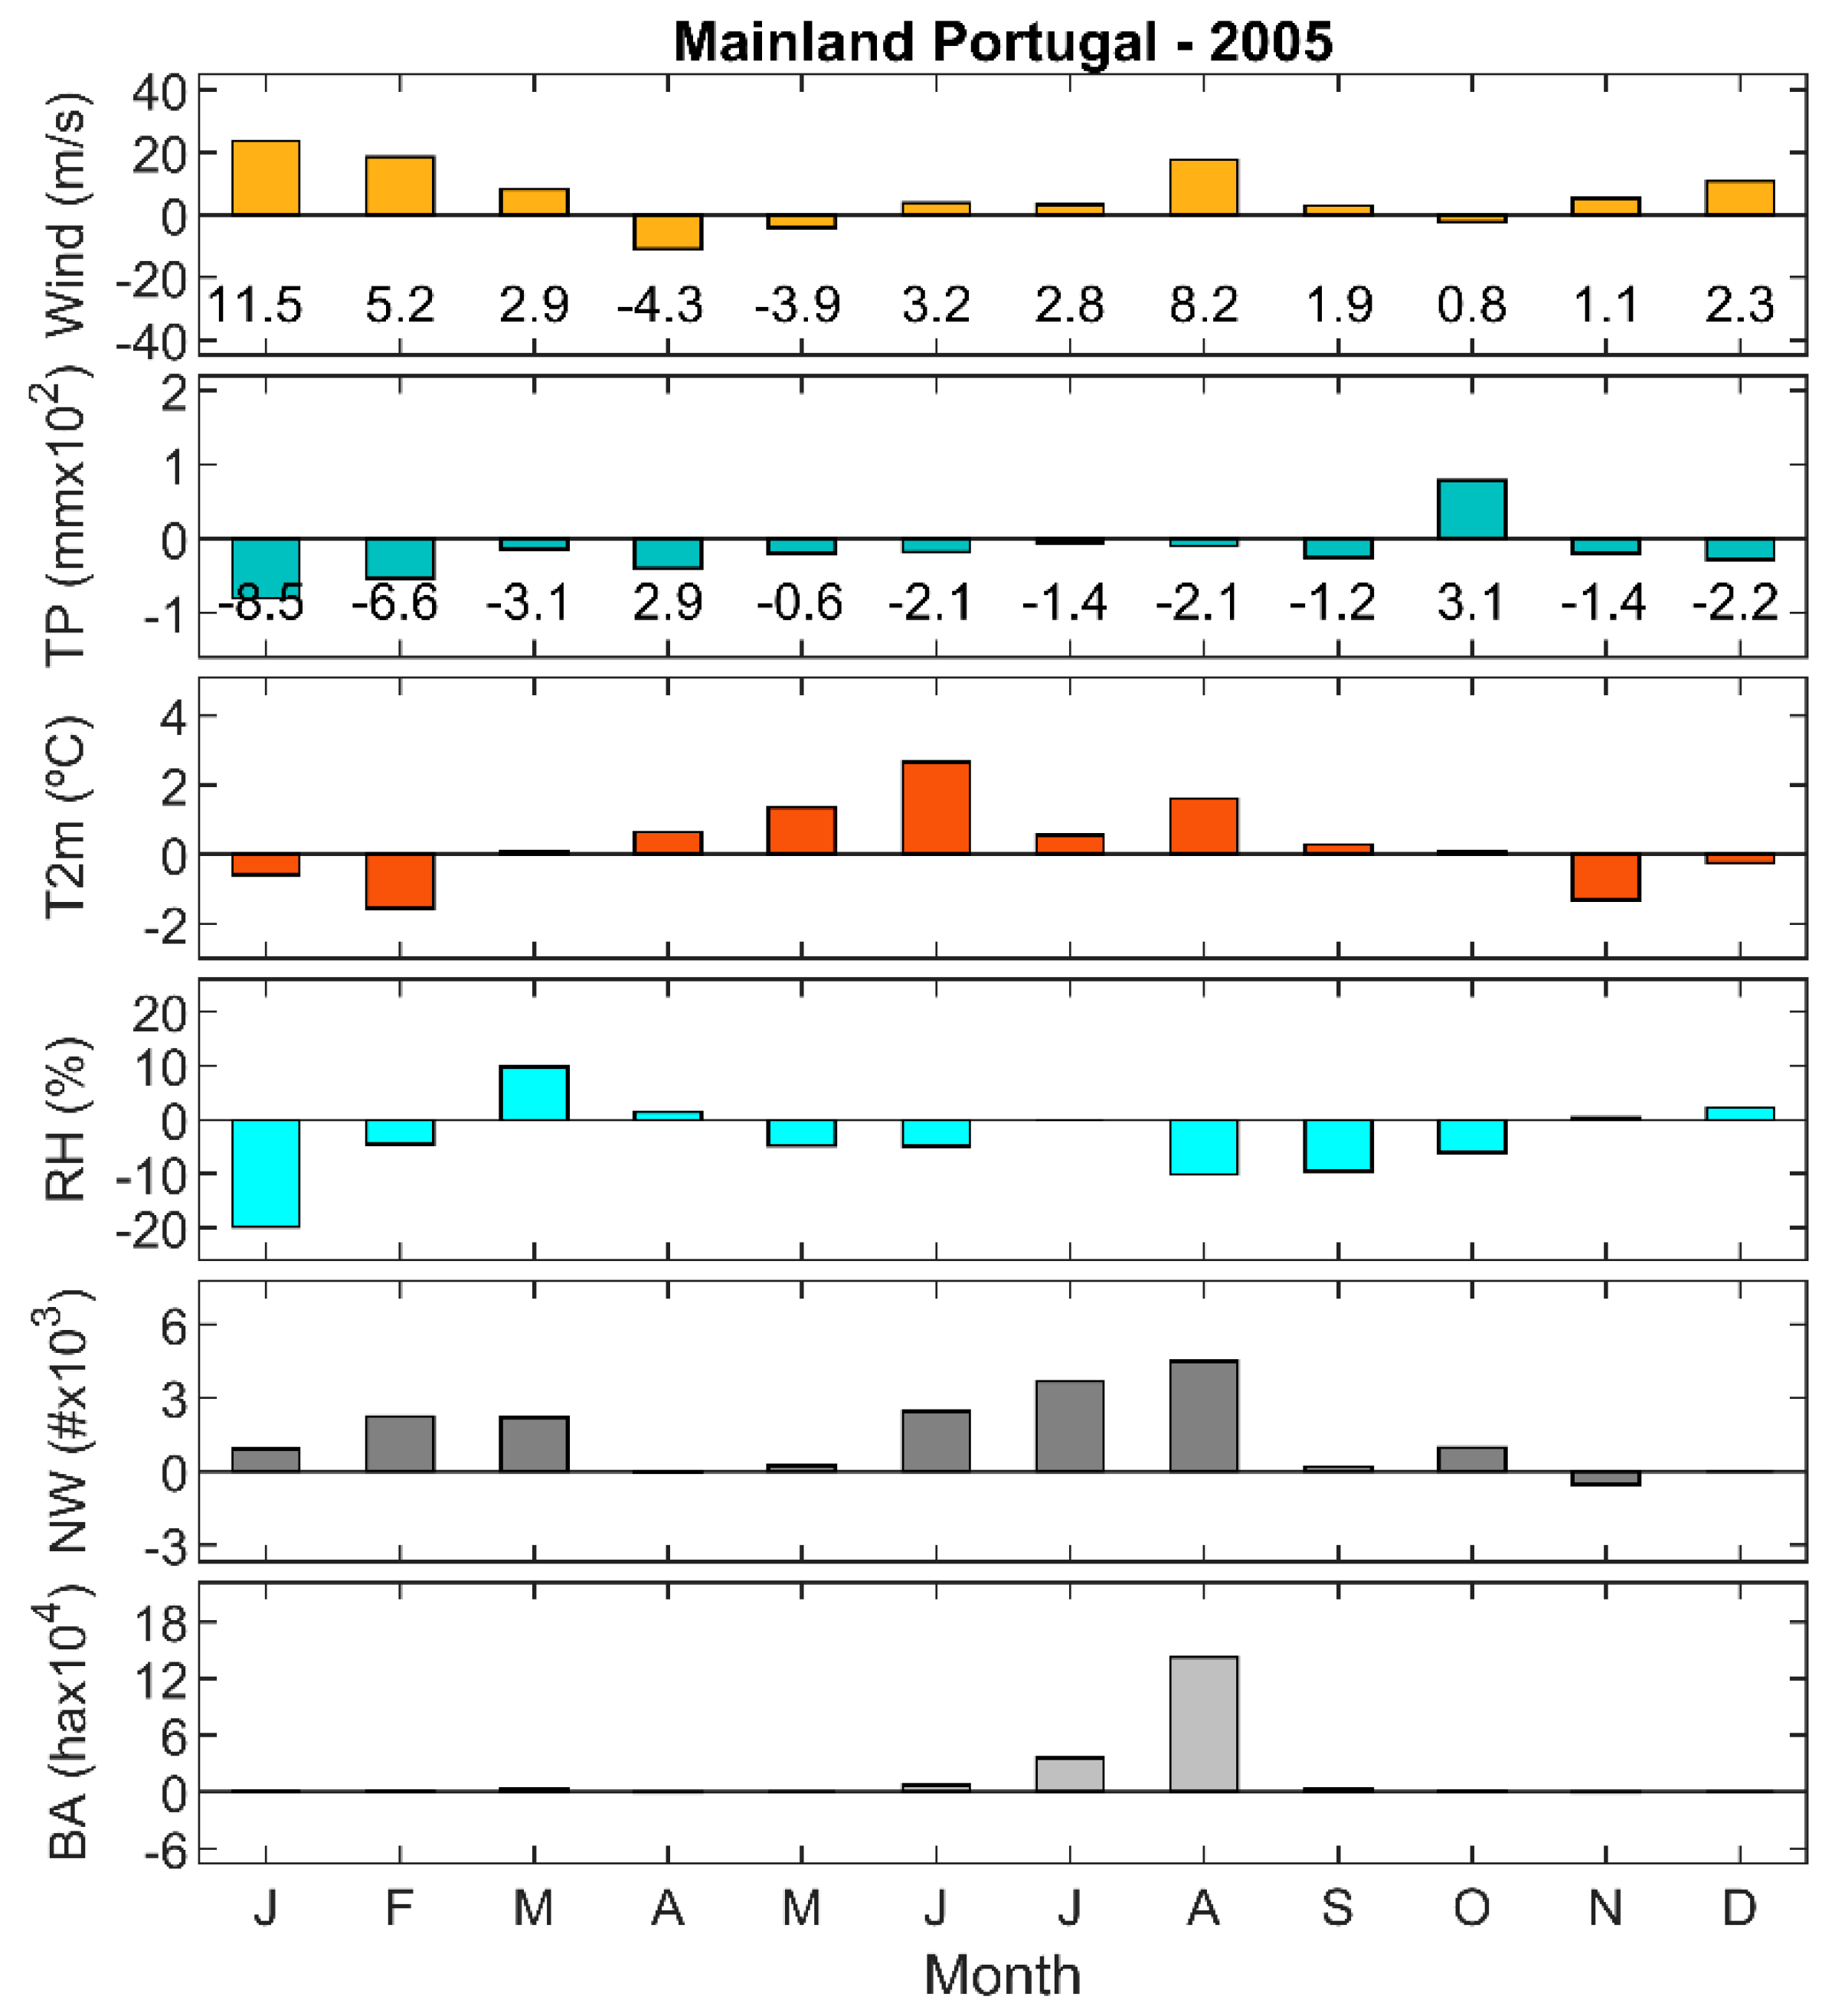

Table 1.
The classification of the study years into four types depending on the existence of the winter/or summer seasons for mainland Portugal (M. Portugal) and for the five NUTS II regions. Type 1: years without any wildfire season; Type 2: years with the winter wildfire season; Type 3: years with the summer wildfire season; Type 4: years with both winter and summer wildfire seasons.
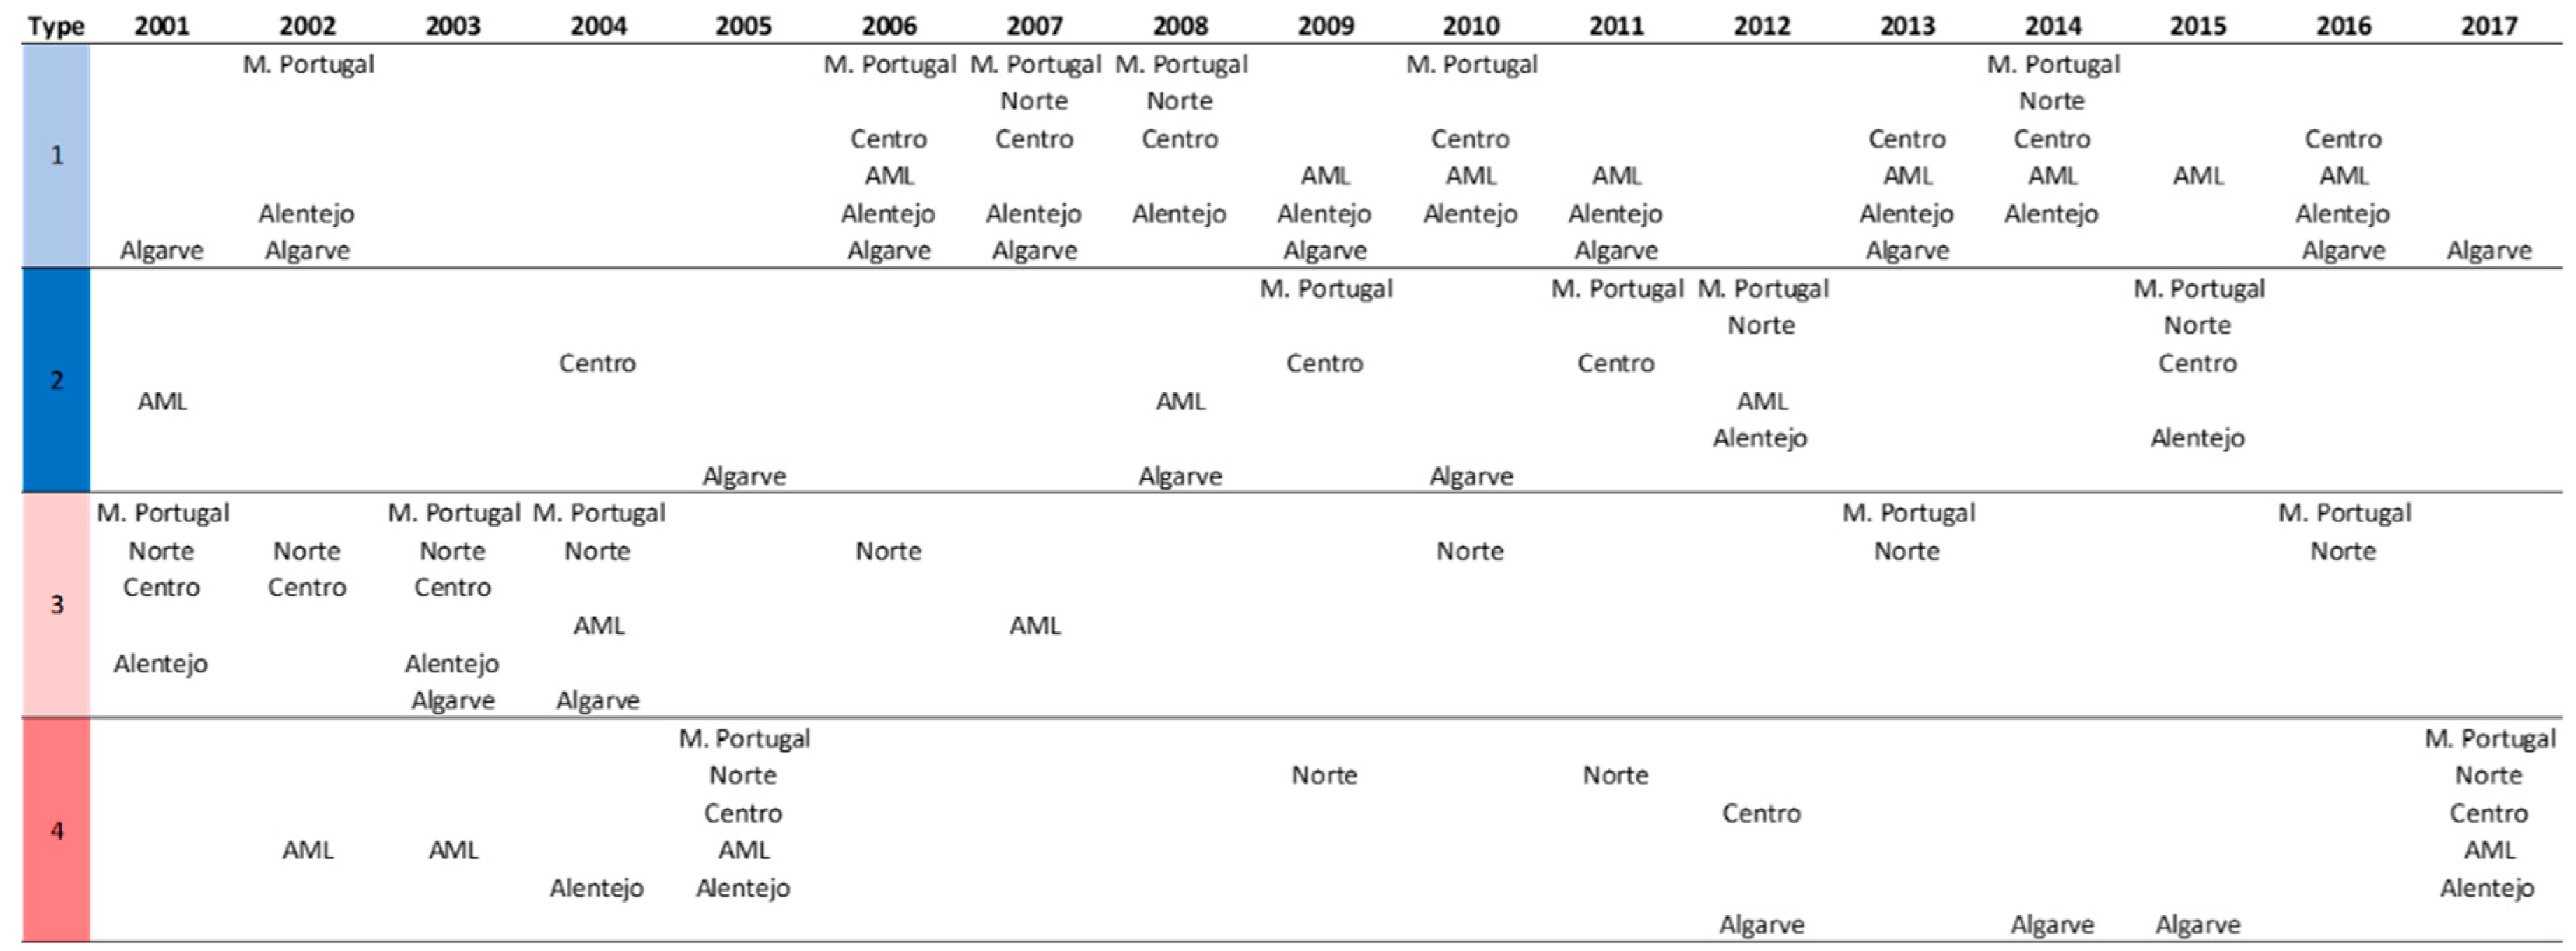 |
Table 2.
Confusion matrix (showing number of instances): (a) Logistic Regression; (b) Neural Network; (c) Naïve Bayes; (d) AdaBoost.
Table 2.
Confusion matrix (showing number of instances): (a) Logistic Regression; (b) Neural Network; (c) Naïve Bayes; (d) AdaBoost.
|
Disclaimer/Publisher’s Note: The statements, opinions and data contained in all publications are solely those of the individual author(s) and contributor(s) and not of MDPI and/or the editor(s). MDPI and/or the editor(s) disclaim responsibility for any injury to people or property resulting from any ideas, methods, instructions or products referred to in the content. |
© 2024 by the authors. Licensee MDPI, Basel, Switzerland. This article is an open access article distributed under the terms and conditions of the Creative Commons Attribution (CC BY) license (https://creativecommons.org/licenses/by/4.0/).
Copyright: This open access article is published under a Creative Commons CC BY 4.0 license, which permit the free download, distribution, and reuse, provided that the author and preprint are cited in any reuse.


