
Submitted:
04 June 2024
Posted:
05 June 2024
You are already at the latest version
Abstract
The goal of this study is to create regression models estimating the daily Penman–Monteith reference evapotranspiration (PMR) using latitude–temperature data for the state of Sinaloa, Mexico. Daily series of minimum–maximum temperature (1979–2017) were obtained from seven weather stations in Sinaloa. The reference evapotranspiration was calculated by the methods of Penman–Monteith using empirical equations (PMC), Hargreaves (HAC), and PMR. Prior to calculating PMC, the incident solar radiation (SR) was calculated. From the Acaponeta station (2005–2008, 2011–2013 and 2015–2017), all complete observed variables were obtained: mean temperature, incident solar radiation (SRg), average relative humidity and average wind speed at a height of 10 m. The data from the eight weather stations were provided by the National Meteorological Service and the National Water Commission. The daily observed Penman–Monteith reference evapotranspiration (PMO) was calculated. For validation, three simple linear regressions (SLR) were applied: SR vs SRg, PMC vs PMO and PMR vs PMO. hypothesis tests were applied to each SLR: Pearson correlation (Pr) vs critical Pearson correlation (Pcr). All rP were significantly different from zero (> |0.576|): SRg vs SR (Pr = 0.951), PMC vs PMO (Pr = 0.592), and PMR vs PMO (Pr = 0.625). This study provides new models that can motivate and support the design and implementation of intelligent irrigation in the state considered “the breadbasket of Mexico.”
Keywords:
reference evapotranspiration
; Penman–Monteith
; Hargreaves
; intelligent irrigation
; “the breadbasket of Mexico”
1. Introduction
Historically, to guarantee the feeding of the world population, agriculture has been the activity that has consumed the greatest amount of water [1]. Approximately 40% of the world’s food depends on activities inherent to agricultural irrigation [2]. This constantly increasing water demand [3] can trigger significant meteorological droughts [4,5,6], which are accentuated in arid regions [6, 7], where the incident solar radiation (SR) is more intense [8, 9]. Intense SR causes approximately 60% of precipitation to return to the atmosphere in the form of evapotranspiration [10, 11], causing these regions to be classified as vulnerable to desertification [12]. For example, in semi-arid regions, agricultural irrigation is a parameter that should trend towards intelligent irrigation [13,14,15,16]. To develop intelligent irrigation, valuable information must be available that establishes the relationship between crop growth and water balance [17], in which reference evapotranspiration (ETo) is essential [18]. According to [19] and [20], ETo is the potential evapotranspiration of a hypothetical grass surface, with uniform height, well-watered and with active growth, and which depends entirely on climatological variables [9, 21]. According to [9, 22–24], it is always advisable to use empirical equations to estimate ETo by the Penman–Monteith (PMC) method, even when data is lacking, mainly because it remains the most precise method. Of alternative methods, Hargreaves (HAC) continues to be the most used, mainly due to its high accuracy/number of variables used ratio [25,26,27]. However, [26] and [27], state that another possible way to estimate ETo by Penman–Monteith is through simple linear regressions (SLR) and simple nonlinear regressions (SNR); PMR (dependent variable) vs HAC (independent variable), which more accurately calculates the hydric requirements of crops.
In Mexico, approximately 77% of the volume of the total water resource is allocated to the agricultural sector, and two thirds of the national territory is characterized by an aridity index ranging from arid to semi-arid [13]. In particular, the state of Sinaloa has a predominantly semi-arid climate [7], and according to [13] and [23], this condition predisposes it to focus efforts on the characterization of PMR, as well as the subsequent design and administration of intelligent irrigation systems [13, 23]. Intelligent irrigation could improve the volumes of yields of Sinaloan crops, as well as encourage the conservation of water resources [23, 28].
In this study, daily series (1979–2017) of minimum (Tmin) and maximum (Tmax) temperatures were obtained from seven weather stations in Sinaloa from National Water Commission (CONAGUA) [29]. PMC, HAC and PMR were calculated. At another weather station, Acaponeta, observed daily series (2005–2008, 2011–2013 and 2015–2017) were obtained of mean temperature (TmeaO), incident solar radiation (SRg), average relative humidity () and average wind speed at a height of 10 m (). The data for the eight stations were provided by the CONAGUA [29] and CONAGUA–National Meteorological Service (SMN) (CONAGUA–SMN) [30]. At Acaponeta, daily observed Penman–Monteith ETo (PMO) was calculated. For validation, three SLR were obtained: SR vs SRg, PMC vs PMO and PMR vs PMO. A hypothesis test was applied: Pearson correlation (Pr) vs Pearson critical correlation (Pcr). In the three SLR, the condition Pr > Pcr was met; that is, all Pr were significantly different from zero [31].
The goal was to create PMR estimation models using latitude–temperature data for the state of Sinaloa, Mexico.
Although most of the weather stations for public use in Sinaloa lack the full set of climate variables necessary for the calculation of PMO [7], in this study, predictive models of PMR are provided using the variables latitude–temperature. These models can help ensure the feeding of “the breadbasket of Mexico” through intelligent irrigation [13, 23].
2. Materials and Methods
2.1. Study Area
Sinaloa is in the northwest of Mexico (Figure 1), and because it is the most important agricultural state in Mexico, it is called “the breadbasket of Mexico” [32]. Furthermore, this state is the main producer of export-oriented crops [33] cited by [32]. Due to the planted area and sensitivity to extremes of RHO–Tmax–Tmin, two of the most important crops in Sinaloa are corn and beans [28].
2.2. Data
2.2.1. Daily Maximum () and Minimum Temperature ()
Using data from CONAGUA (https://smn.conagua.gob.mx/es/climatologia/informacion-climatologica/informacion-estadistica-climatologica)[29], daily series of Tmax and Tmin were obtained from 70 weather stations in Sinaloa for the period 1942–2019. These same series were previously obtained by [34]. Through a review of the availability of recent information (< 5% missing data), in this study it was decided to work with seven weather stations (Culiacán, El Playón, Las Tortugas, Rosario, La Concha, Ixpalino and Sanalona II (Figure 1), for the period 1979–2017.
2.2.2. Imputation of Missing Data, Homogenization of Series and Determination of the Mean Daily Temperature (Tmn)
Using RStudio software, with the Climatol library [35] and the orthogonal regression method, missing daily data of Tmax and Tmin were estimated by imputation. Using the standard normal homogeneity test (SNHT) [36] method, with Climatol, the series were also homogenized. By means of the semi-sum of the complete and homogeneous series of Tmax and Tmin, the daily series of Tave were determined.
In general, the greatest thermal extremes were registered in Ixpalino (Tmax = 46.50 °C day−1), El Playón and Las Tortugas (Tmin = −6.00 C day−1) and El Playón (Tmn = 38.00 C day−1, Table 1).
2.2.3. Wind Speed at 10 m Height (Uz)
Through the National Oceanic and Atmospheric Administration (NOAA)
[37] (https://downloads.psl.noaa.gov/Datasets/ncep.reanalysis2/Monthlies/gaussian_grid/), the monthly series (Jan–Dec) of wind speed at a height of 10 m (Uz) were obtained for the period 1979–2017. Due to the availability of satellite information, Uz was obtained for only two coordinates in the state of Sinaloa: 1) 25° 43′ 14″ N by 108° 45′ 00″ W and 2) 23° 55′ 42″ N by 106° 46′ 48″ W.
2.3. Empirical Equations to Estimate Penman–Monteith Reference Evapotranspiration, Calculated with Missing Data (PMC) and Observed Data (PMO)
2.3.1. Wind Speed at 2 m Height (U2)
Although [9, 38], state that wind speed is not very relevant for estimating PMC in semi-arid regions, in this study, using Equation 1, wind speed was obtained at a height of 2 m (U2) [19, 22].
where U2 = monthly average wind speed at a height of 2 m (m s–1), Uz = average wind speed measured at a height of 10 m (m s–1) and z = measurement height of Uz (m).
Since PMC is the international standard because of its greater measurement accuracy [9], in this study, PMC was estimated daily using Equations 2–10. These equations, which are recommended by [19, 22] when there are missing data, are given as follows:
where eaC = calculated actual vapor pressure and Tmin = daily minimum air temperature (°C).
where es = saturation vapor pressure (kPa) and Tmn = daily mean air temperature (°C).
where ∆ = slope of the saturated vapor pressure curve (kPa °C–1).
where SR = calculated incident solar radiation (MJ m–2 day–1), KRS = solar radiation adjustment coefficient (dimensionless), with a value of 0.16 for continental conditions and 0.19 for coastal conditions (in this study, KRS = 0.16 was used), Tmax = maximum daily air temperature (°C) and Ra = extraterrestrial solar radiation (obtained through tabulated values, with respect to latitude, MJ m–2 day–1).
where SRo = incident solar radiation with clear sky (MJ m–2 day–1).
where Rnl = net longwave radiation (MJ m–2 day–1), σ = Stefan–Boltzmann constant (0.4903 × 10⁻⁸ MJ K–4 m–2 day–1) and TmnK = mean daily air temperature (°K4).
where Rns = net shortwave radiation (MJ m–2 day–1).
where Rn = net radiation (MJ m–2 day–1).
where PMC = Penman–Monteith reference grass evapotranspiration (mm day–1, calculated with missing data), PMO = Penman–Monteith observed grass reference evapotranspiration (mm day–1, at the Acaponeta station), G = soil heat flux density (MJ m–2 day–1, null for daily estimates) and γ = psychrometric constant (0.0677 kPa °C–1).
2.4. Calculated Hargreaves Reference Evapotranspiration (HAC, Alternative Method Used)
When the absence of data does not allow Equation 10 to be used, [25] recommend the use of Expression 11 to estimate HAC, which is widely recommended worldwide, due to the high ratio accuracy/number of variables used.
where HAC = Hargreaves reference evapotranspiration (mm day–1).
PMC and HAC were also calculated as monthly (Jan–Dec), seasonal (Mar–Aug) and annual (Jan–Dec) averages.
2.5. Pre-Validation
2.5.1. Normality Test and Correlation Coefficients
A Shapiro–Wilk normality test was applied to all PMC and HAC series [39]. To find out whether PMC and HAC were significantly correlated, a Pr was applied to the series that presented normality and a Spearman correlation (Sr) was applied to the series that did not present normality.
2.5.2. Simple Linear Regressions (SLR) and Simple Nonlinear Regressions (SNR)
To generate sensitive models [7] to predict PMR (dependent variable) based on HAC (independent variable), SLR were initially fitted (Equation 12). A Shapiro–Wilk normality test was applied to the SLR residuals. When the residuals were not normal, a SNR (10 different functions) was applied, fitting a curvilinear estimate. Of the 10 functions, the following were chosen: a) exponential function (monthly series, Equation 13) and potential function (seasonal series, Equation 14), which were selected due to the highest R2 recorded.
where e = Euler number (2.7182) and a, b = regression coefficients which describe the relationship between PMR and HAC.
2.5.3. Hypothesis Test
For each SLR and SNR, the Pr and Sr were obtained by the square root of R2 (Sections 2.5.2). To find out if each Pr and Sr were significantly different from zero, hypothesis tests were applied [31, 40]. Each Pr and Sr (Section 2.5.1) were compared with a Pcr = |0.316| (Equation 15) and a critical Spearman correlation coefficient (Scr = 0.318, Equation 16).
where tc = critical value of the student t statistic and df = degrees of freedom (n–2).
where z = 1.96, n = 39 (for the period 1979–2017).
The design of the hypotheses is shown in Equations 17–18:

Also, the root mean square error (RMSE) between PMC and PMR was calculated.
2.6. Validation
Using the CONAGUA–SMN database (https://smn.conagua.gob.mx/tools/GUI/sivea_v3/sivea.php)[30], the following observed data were obtained from the Acaponeta station: TmnO, UZO, SRg and RHO, for the periods 2005–2008, 2011–2013 and 2015–2017. PMO was calculated, reapplying Equations 1, 3–4, 6–10 and 19.
where eaO = observed actual vapor pressure and RHO = observed mean daily relative humidity (%).
Three SLR were applied: 1) SR (La Concha) vs SRg (Acaponeta), 2) PMC (La Concha) vs PMO (Acaponeta) and 3) PMR (La Concha) and PMO (Acaponeta). A Shapiro–Wilk normality test was applied to the residuals of the three SLR. From each SLR, Pr = (R2)0.5 was obtained. To find out if Pr were significantly different from zero, another hypothesis test was carried out between Pr vs Pcr = |0.576| (for n = 12). Finally, the RMSE values were calculated between the calculated and observed values of the three SLR. The pre-validation and validation were an adaptation of the development by [7].
2.7. Software Used
To carry out this research, the following programs were used: RStudio version 4.3.0, Past version 4.08, XLstat version 2023, Panoply version 5.2.6 and CorelDRAW version 2019.
3. Results
3.1. Calculated Monthly Average Reference Evapotranspiration: Penman–Monteith (PMC) and Hargreaves (HAC) Methods
3.2. Normality Test for the Calculated Average Reference Evapotranspiration: Penman–Monteith (PMC) and Hargreaves (HAC) Methods
3.2.1. Monthly (Jan–Dec), Seasonal (Mar–Aug) and Annual (Jan–Dec) Series
For PMC–Ixpalino in all months (Jan–Dec), p(normal) and W ranged from 0.090 to 0.623 and from 0.951 to 0.978, respectively (Figure 3a). In total, 37 monthly series did not present normality; PMC = 15 series and HAC = 22 series (Figure 3a). The seasonal series (Mar–Aug) did not present normality [p(normal) < 0.05] were PMC–El Playón [p(normal) = 7.8 × 10⁻⁵], HAC–El Playón [p(normal) = 1.7 × 10⁻⁶], HAC–Las Tortugas [p(normal) = 0.003] and HAC–Rosario [p(normal) = 0.008, Figure 3b]. The annual series (Jan–Dec) without normality were PMC–El Playón [p(normal) = 2.3 × 10⁻⁴], HAC–El Playón [p(normal) = 9.4 × 10⁻⁷], HAC–Las Tortugas [p(normal) = 0.006] and HAC–Ixpalino [p(normal) = 0.018, Figure 3b].
3.3. Pearson (rP) and Spearman (rS) Correlations of Calculated Average Reference Evapotranspiration: Penman–Monteith (PMC) and Hargreaves (HAC) Methods
3.3.1. Monthly Correlations (Jan–Dec)
As shown in Table 2, the correlations ranged from rP = 0.443 (El Playón–Jul) to rP = 0.929 (Las Tortugas–Jan). All rP and rS were significantly different from zero (rP > rcP = |0.316| and rS > rcS = |0.318|).
3.3.2. Seasonal (Mar–Aug) and Annual (Jan–Dec) Correlations
As shown in Table 3, all seasonal (Mar–Aug) and annual (Jan–Dec) rP and rS were significantly different from zero (rP > rcP = 0.316 and rS > rcS = 0.318;). Seasonal correlations (Mar–Aug) ranged from rP = 0.693 (Sanalona II) to rP = 0.907 (La Concha). The annual correlations (Jan–Dec) ranged from rS = 0.831 (El Playón) to rP = 0.921 (La Concha).
3.4. Linear (SLR) and Simple Nonlinear Regressions (SNR) of Calculated Average Reference Evapotranspiration: Penman–Monteith (PMR, Dependent Variable) and Hargreaves (HAC, Independent Variable) Methods
3.4.1. Normality Test Of Monthly (Jan–Dec), Seasonal (Mar–Aug) and Annual (Jan–Dec) Residuals
The only series of monthly residuals (Jan–Dec) that did not present normality was Sanalona II–Oct [p(normal) = 0.046 and W = 0.942, Figure 4a]. In the normal monthly series, the p(normal) values ranged from 0.059 (El Playón–May) to 0.951 (Culiacán–Nov, Figure 4a). As seen in Figure 4b, Las Tortugas for the seasonal period (Mar–Aug) [p(normal) = 0.028 and W = 0.936] was the only series that did not register normality. In the normal seasonal series, the p(normal) values ranged from 0.237 (Ixpalino) to 0.445 (Rosario). In the normal annual series, the p(normal) values ranged from 0.221 (Ixpalino) to 0.964 (La Concha).
3.4.2. Monthly Coefficients and Goodness of Fit (Jan–Dec)
3.4.3. Coefficients and Seasonal (Mar–Aug) and Annual (Jan–Dec) Goodness of Fit
Seasonal fit (Mar–Aug, Table 5) ranged from R2 = 0.480 (rP = 0.693, Sanalona II) with RMSE = 0.156 mm day–1 to R2 = 0.823 (rP = 0.907, La Concha) with RMSE = 0.117 mm day–1. Annual fit (Jan–Dec) ranged from R2 = 0.719 (rP = 0.848, Sanalona II) with RMSE = 0.112 mm day–1 to R2 = 0.848 (rP = 0.921, La Concha) with RMSE = 0.082 mm day–1. For SNR–potential function (Las Tortugas–seasonal, Table 5), the fit was R2 = 0.699 (rS = 0.836 > rcS = |0.318|).
3.5. Validation
3.5.1. Simple Linear Regressions (SLR) between Calculated and Observed Values from: 1) Incident Radiation (SR vs SRg), 2) Penman–Monteith Reference Evapotranspiration, Calculated with Equations (PMC vs PMO) and 3) Calculated with Regressions (PMR vs PMO)
All the monthly average SLR (Figures 5a–5c) recorded rP significantly different from zero (rP > rcP = |0.576|, for n = 12). Specifically for SR vs SRg, the measures of fit were: R2 = 0.905, rP = 0.951 and RMSE = 0.684 mm day–1 (Figure 5a). In PMC vs PMO, the measures of fit were R2 = 0.350, rP = 0.592 and RMSE = 0.590 mm day–1 (Figure 5b). For PMR vs PMO, the measures of fit were R2 = 0.391, rP = 0.625 and RMSE = 0.578 mm day–1 (Figure 5c). The residuals of the three SLR presented normality: p(normal) = 0.193 and W = 0.907 (Figure 5a), p(normal) = 0.344 and W = 0.927 (Figure 5b) and p(normal) = 0.464 and W = 0.937 (Figure 5c).
4. Discussion
The results of Figure 2a are similar to those reported by [41], who found a range from PMC = 3.0 mm day–1 to PMC = 5.8 mm day–1 for the Culiacán valley, in the period 2013–2014. The variation between PMC vs HAC ranged from RMSE = 1.861 mm day–1 (El Playón, Figure 2b) to RMSE = 1.972 mm day–1 (Culiacán, Figure 2a), that is, ETo presents a tendency towards underestimation of PMC and overestimation of HAC (RMSE > 0.3 mm day–1) [9].
According to [42], the results of PMC–Ixpalino series (Figure 3a) presents normality. According to [43], in the results of Figure 3b, the seasonal series (Mar–Aug) that did not present normality were: PMC–El Playón, HAC–El Playón, HAC–Las Tortugas and HAC–Rosario, because did not present the condition of p(normal) > 0.05. According to [43] and [44], the annual series (Jan–Dec) that did not present normality were PMC–El Playón, HAC–El Playón, HAC–Las Tortugas and HAC–Ixpalino, this due that p(normal) < 0.05.
According to [31] and [40], the results of Table 2 establish the significant monthly relationship (Jan–Dec) of PMC vs HAC, so monthly modeling of PMR is appropriate (Equations 12–14), applying SLR and SNR, as recommended by [19, 22] and applied by [27, 45].
Because all the correlations of Table 3 were significant [31, 40], SLR and SNR can be applied to estimate PMR with seasonal (Mar–Aug) and annual (Jan–Dec) scale, with HAC as the independent variable [27,28,29,30,31,32,33,34,35,36,37,38,39,40,41,42,43,44,45].
According to [43] in the results of Figure 4b, and for the seasonal period (Mar–Aug), the only series that did not present normality was Las Tortugas, because p < 0.05. All series that did present the condition of p > 0.05 were considered as normal series [42].
All RLS (Table 4) exceeded rcP = |0.316| [31, 40] (significant correlation) and did not register a trend towards underestimation or overestimation (RMSE < 0.300 mm day–1)[9]. In Table 4 and for Sanalona II–Oct (SNR–exponential function), the results were rS = 0.840 > rcS = |0.318| [31, 40] (significant correlation) [31, 40]. The methodology of Table 4 was applied to obtain more accurate estimates [19, 22], and was previously applied by [26, 27].
All SLR (seasonal and annual, Table 5) exceeded rcP = |0.316| [31, 40] (significant correlation) and showed no trend towards underestimation or overestimation (RMSE < 0.300 mm day–1) [9]. These results are in agreement with [19, 22], who state that PMR models are more accurate than when only Equations 1–10 (PMC) are used. [46] also state that HAC estimation is the most recommended method when data is not available to estimate PMC.
In validation, the three SLR (Figures 5a–5c) performed well (RMSE < 1.0 mm día–1)[47]. In this study, SR was highly influential (approximately 90.5%) for estimating PMC, which agrees with [8], who point out that SRg in Sinaloa is decisive for the estimation of PMC. According to results of PMC vs PMO (Figure 5b), Equations 1–10 were reliable and sensitive for estimating PMC, even when the series presented missing data [9, 48, 49]. The results of Figure 5c and according to [19, 22, 26, 27], the models of this study are also reliable and sensitive for predicting PMR. Finally, because the residuals of the three SLR (Figures 5a–5c) presented normality, the SLR are an appropriate statistical tool to use for comparison of calculated and observed data [7].
5. Conclusions
Due to the lack of data variables from weather stations of Sinaloa, PMC and HAC were estimated with the use of equations. PMC presented trends towards underestimation and HAC presented trends towards overestimation. For the first time in Sinaloa, monthly (Jan–Dec), seasonal (Mar–Aug) and annual (Jan–Dec) SLR and SNR were generated to estimate PMR (dependent variable), using HAC (independent variable). Although the equations are a good tool to estimate PMC, the use of PMR estimation models is more precise (without trends of underestimation or overestimation). To try to improve the fit of PMR vs PMO, in future studies it is recommended to estimate PMR using any other alternative method for ETo, for example, Thornwaite, Priestley–Taylor, Valiantzas, Makkink, Schendel, Jensen, or Turc, among other methods. Knowledge of PMR in Sinaloa can contribute to facilitating the calculation of crop evapotranspiration, which can enable the design of intelligent irrigation plans that are efficient, sustainable, and affordable. The PMR models of this study are also a valuable tool when complete climate series are lacking, which are necessary for the calculation of PMO, since in this study to obtain PMR only latitude–temperature is required. These predictive models can also help ensure, in the near future, the feeding of the population of “the breadbasket of Mexico,” specifically through the relationship of less irrigation water/greater sustainability of food production.
Author Contributions
Ll.C.O. (Principal Researcher) contributed to the interpretation of work and wrote the manuscript, E.G.R.D. (Postgrate Student) and N.C.M. (Researcher) analyzed data, P.G.R.E., G.S.L.A. and M.M.J. (Researchers) drawed and analized Tables and Figures.
Funding
This research was financially supported by Secretariat of Investigation and Postgraduate Studies of the National Polytechnic Institute (SIP-IPN) though projects 20231577 and 20240953.
Institutional Review Board Statement
Not applicable.
Informed Consent Statement
Not applicable.
Conflicts of Interest
The authors declare no conflict of interest.
References
- Ribeiro, V.P.; Desuó, N.L.; Marques, P.A.A.; Achcar, J.A. , Junqueira, A.M.; Chinatto, A.W.; Jr. Junqueira, C.C.M.; Maciel, C.D.; Balestieri, J.A.P. A Stochastic Bayesian Artificial Intelligence Framework to Assess Climatological Water Balance under Missing Variables for Evapotranspiration Estimates. Agronomy 2023, 13, 2970. [Google Scholar] [CrossRef]
- Raheem, A.; Ahmad, I.; Arshad, A.; Liu, J.; Rehman, Z.U.; Shafeeque, M.; Rahman, M.M.; Saifullah, M.; Iqbal, U. Numerical Modeling of Groundwater Dynamics and Management Strategies for the Sustainable Groundwater Development in Water-Scarce Agricultural Region of Punjab, Pakistan. Water 2024, 16, 34. [Google Scholar] [CrossRef]
- United Nations, Department of Economic and Social Affairs, Population Division. World Population Prospects 2022. Available online: https://population.un.org/wpp/Download/Standard/Population/.
- Yu, X.J.; Zhang, L.X.; Zhou, T.J.; Zheng, J.H. Assessing the performance of CMIP6 models in simulating droughts across global drylands. Adv. Atmos. Sci. 2024, 41, 193–208. [Google Scholar] [CrossRef]
- Abel, D.; Ziegler, K.; Gbode, I.E.; Weber, T.; Ajayi, O.V.; Traoré, S.B.; Paeth, H. Robustness of climate indices relevant for agriculture in Africa deduced from GCMs and RCMs against reanalysis and gridded observations. Clim. Dyn. 2024, 62:1077–1106. [CrossRef]
- 6. Cardoso, do Vale T.M.; Constantino, S.M.E.; Bezerra, C.J.; Barbosa, A.L.M.; Bezerra, B.G.; Tôrres, R.D.; Rodrigues, M.P. Climate and water balance influence on agricultural productivity over the Northeast Brazil. Theor. Appl. Climatol. 2024, 155:879–900. [CrossRef]
- Llanes, C.O.; Norzagaray, C.M.; Gaxiola, A.; Pérez, G.E.; Montiel, M.J.; Troyo, D.E. Sensitivity of four indices of meteorological drought for rainfed maize yield prediction in the state of Sinaloa, Mexico. Agriculture 2022, 12, 525. [Google Scholar] [CrossRef]
- González, C.J.M.; Cervantes, O.R.; Ojeda, B.W.; López, C.I. Predicción de la evapotranspiración de referencia mediante redes neuronales artificiales. Ing. Hidrául. Méx. 2008; XXIII, 127–138, http://repositorio.imta.mx/handle/20.500.12013/852. [Google Scholar]
- Sentelhas, P.C.; Gillespie, T.J.; Santos, E.A. Evaluation of FAO Penman–Monteith and alternative methods for estimating reference evapotranspiration with missing data in Southern Ontario, Canada. Agric. Water Manag. 2010, 97: 635–644. [CrossRef]
- Zhang, J.; Zhou, X.; Yang, S.; Ao, Y. Spatiotemporal Variations in Evapotranspiration and Their Driving Factors in Southwest China between 2003 and 2020. Remote Sens. 2023, 15, 4418. [Google Scholar] [CrossRef]
- Nikolaou, G.; Neocleous, D.; Manes, A.; Kitta, E. Calibration and validation of solar radiation-based equations to estimate crop evapotranspiration in a semi-arid climate. Int. J. Biometeorol. 2024, 68:1–15. [CrossRef]
- Sekhar, S.M.; Prasad, R.S.; Maity, R. Climate change may cause oasification or desertification both: an analysis based on the spatio-temporal change in aridity across India. Theor. Appl. Climatol. 2024, 155:1167–1184. [CrossRef]
- Espinosa, E.B.; Flores, M.H.; Hernández, R.A.; Carrillo, F.G. Diseño de un sistema de riego hidrante parcelario con los los métodos por turnos y Clement: análisis técnico económico. Terra Latinoam. 2016; 34, 431–440, https://www.scielo.org.mx/scielo.php?pid=S0187-57792016000400431&script=sci_abstract. [Google Scholar]
- Zhao, L.; Wang, Y.; Shi, Y.; Zhao, X.; Cui, N.; Zhang, S. Selecting essential factors for predicting reference crop evapotranspiration through tree-based machine learning and Bayesian optimization. Theor. Appl. Climatol. 2023. [Google Scholar] [CrossRef]
- Pereira, S.L.; Paredes, P.; Oliveira, M.C.; Montoya, F.; López, U.R.; Salman, M. Single and basal crop coefficients for estimation of water use of tree and vine woody crops with consideration of fraction of ground cover, height, and training system for Mediterranean and warm temperate fruit and leaf crops. Irrig. Sci. 2023. [Google Scholar] [CrossRef]
- Kiraga, S.; Peters, R.T.; Molaei, B.; Evett, S.R.; Marek, G. Reference Evapotranspiration Estimation Using Genetic Algorithm-Optimized Machine Learning Models and Standardized Penman–Monteith Equation in a Highly Advective Environment. Water 2024, 16, 12. [Google Scholar] [CrossRef]
- Peng, X.; Liu, X.; Wang, Y.; Cai, H. Evapotranspiration Partitioning and Estimation Based on Crop Coefficients of Winter Wheat Cropland in the Guanzhong Plain, China. Agronomy 2023, 13, 2982. [Google Scholar] [CrossRef]
- Farmer, W.; Strzepek, K.; Schlosser, A.C.; Droogers, P.; Gao, X. A method for calculating reference evapotranspiration on daily time scales . Global Sciece Policy Change MIT 2011, 195, 1–21, https://www.researchgate.net/publication/265591168_A_Method_for_Calculating_Reference_Evapotranspiration_on_Daily_Time_Scales. [Google Scholar]
- Allen, R.G.; Pereira, L.S.; Raes, D.; Smith, M. Evapotranspiración del cultivo: Guías para la determinación de los requerimientos de agua de los cultivos. Ed. FAO, 1998, 56, 298p. https://openknowledge.fao.org/server/api/core/bitstreams/8802ddc9-86b6-4f13-96b7-4871dd3aee65/content.
- Sabino, M.; de Souza, A.P. Global Sensitivity of Penman–Monteith Reference Evapotranspiration to Climatic Variables in Mato Grosso, Brazil. Earth 2023, 4, 714–727. [Google Scholar] [CrossRef]
- Abdel, F.M.K.; Abd, E.K.S.; Zhang, Z.; Merwad, A.R.M.A. Exploring the Applicability of Regression Models and Artificial Neural Networks for Calculating Reference Evapotranspiration in Arid Regions. Sustainability 2023, 15, 15494. [Google Scholar] [CrossRef]
- Allen, R.G. , Pereira, L.S., Raes, D., Smith, M. Crop Evapotranspiration. Guidelines for Computing Crop Water Requirements. FAO, FAO Irrig. Drain. 1998b, 56. 300 p. https://www.researchgate.net/publication/235704197_Crop_evapotranspiration-Guidelines_for_computing_crop_water_requirements-FAO_Irrigation_and_drainage_paper_56.
- Liang, Y.; Feng, D.; Sun, Z.; Zhu, Y. Evaluation of Empirical Equations and Machine Learning Models for Daily Reference Evapotranspiration Prediction Using Public Weather Forecasts. Water 2023, 15, 3954. [Google Scholar] [CrossRef]
- Okkan, U.; Fistikoglu, O.; Ersoy, B.Z.; Noori, T.A. Analyzing the uncertainty of potential evapotranspiration models in drought projections derived for a semi-arid watershed. Theor. Appl. Climatol. 2024, 155:2329–2346. [CrossRef]
- Hargreaves, G.H.; Samani, Z.A. Reference crop evapotranspiration from temperature. Appl. Eng. Agric. 1985, 1, 96–99, https://www.researchgate.net/publication/247373660_Reference_Crop_Evapotranspiration_From_Temperature. [Google Scholar] [CrossRef]
- Trezza, R. Estimación de la evapotranspiración de referencia a nivel mensual en Venezuela. ¿cuál método utilizar? Bioagro, 2008; 20, 89–95, https://www.researchgate.net/publication/293459862_Estimation_of_monthly_reference_evapotranspiration_in_Venezuela_Which_method_to_be_used. [Google Scholar]
- Toro, T.A.M.; Arteaga, R.R.; Vázquez, P.M.A.; Ibáñez, C.L.A. Estimation models for the reference evapotranspiration value in the northern Banana zone of Antioquian Uraba (Colombia). Agrociencia, 2015; 49, 821–836, https://www.scielo.org.mx/scielo.php?script=sci_arttext&pid=S1405-31952015000800001.
- Secretaría de Agricultura, Ganadería, Desarrollo Rural, Pesca y Alimentación (SAGARPA). Agenda Técnica Agrícola de Sinaloa, Segunda Edición; SAGARPA, 2015: Mexico City, Mexico, 242 p. Available online: https://issuu.com/senasica/docs/25_sinaloa_2015_sin.
- Comisión Nacional del Agua (CONAGUA). Estaciones meteorológicas. https://smn.conagua.gob.mx/es/climatologia/informacion-climatologica/informacion-estadistica-climatologica. Accessed on 15 January 2024.
- Comisión Nacional del Agua (CONAGUA)–Servicio Meteorológico Nacional (SMN). Estaciones meteorológicas (Estación Acaponeta). https://smn.conagua.gob.mx/tools/GUI/sivea_v3/sivea.php. Accessed on 03 March 2024.
- 31. Oxford Cambridge and RSA (OCR). Formulae and statistical tables (ST1), 2022; 1–8, Available online: https://www.ocr.org.uk/Images/174103-unit-h869-02-statistical-problem-solving-statistical-tables-st1-.pdf.
- Galindo, R.J.G.; Alegría, H. Toxic effects of exposure to pesticides in farm workers in Navolato, Sinaloa (Mexico). Rev. Int. Contam. Ambie. 2018, 34, 505–516. [Google Scholar] [CrossRef]
- SAGARPA. Estimación de las exportaciones agroalimentarias a nivel de entidad federativa. Secretaría de Agricultura, Ganadería, Pesca y Acuacultura. 2011, p. Available online: http://www.sagarpa.gob.mx/agronegocios/Documentos/pablo/Documentos/Estima_Exp_Edo.pdf 23/07/2017.
- Llanes, C.O. Predictive association between meteorological drought and climate indices in the state of Sinaloa, northwestern Mexico. Arab. J. Geosci. 2023, 16:79. [CrossRef]
- Guijarro, J.A. Homogenization of climatic series with Climatol. 2018, 23 p. https://www.researchgate.net/publication/325203476_Homogenization_of_climatic_series_with_Climatol?channel=doi&linkId=5afda3fea6fdcc3a5a90bd5b&showFulltext=true.
- Alexandersson, H. A homogeneity test applied to precipitation data. J. Climatol. 1986, 6, 661–675. [Google Scholar] [CrossRef]
- National Oceanic and Atmospheric Administration (NOAA). Index of /Datasets/ncep.reanalysis2/Monthlies/gaussian_grid. https://downloads.psl.noaa.gov/Datasets/ncep.reanalysis2/Monthlies/gaussian_grid/. Accessed on 22 January 2024.
- Varga, H.Z.; Szalka, É.; Szakál, T. Determination of Reference Evapotranspiration Using Penman-Monteith Method in Case of Missing Wind Speed Data under Subhumid Climatic Condition in Hungary. Atmos. Clim. Sci. 2022, 12, 235–245. [Google Scholar]
- Leal, L.H.D.C.; Rocha, W.F.D.C. Model adequacy checking in homogeneity and stability studies. MAPAN 2023, 39, 445–448. [Google Scholar] [CrossRef]
- Zar, J.H. Biostatistical analysis. 2010, 944 p. https://bayesmath.com/wp-content/uploads/2021/05/Jerrold-H.-Zar-Biostatistical-Analysis-5th-Edition-Prentice-Hall-2009.pdf.
- López, A.J.E.; Díaz, V.T.; Watts, T.T.; Rodríguez, J.C.; Castellanos, V.A.E.; Partida, R.L.; Velázquez, A.T.J. Evapotranspiración y coeficientes de cultivo de chile Bell en el Valle de Culiacán, México. Terra Latinoam. 2015, 33, 209–219. [Google Scholar]
- Pugh, S.; Fosdick, B. K, Nehring, M.; Gallichotte, E.N.; VandeWoude, S.; Wilson, A. Estimating cutoff values for diagnostic tests to achieve target specificity using extreme value theory. BMC Med. Res. Methodol. 2024, 24–30. [CrossRef]
- Bressane, A.; Siminski, A.; Gurjon, G.I.; Peres, M.C.; Scofano, G.C.; dos Santos, G.A.l.; Silva, M.B; de Castro, L.C.; Galante, N.G. Prioritization of key indicators for the classification of successional stages in regenerating subtropical Atlantic Forest, Southern Brazil: a proposal based on multivariate order statistics. Environ. Syst. Decis. 2023, 43, 232–241. [Google Scholar] [CrossRef]
- Llanes, C.O.; Estrella, G.R.D.; Parra, G. R.E.; Gutiérrez, R.O.G.; Ávila, D.J.A.; Troyo, D.E. Modeling yield of irrigated and rainfed bean in central and southern Sinaloa state, Mexico, based on essential climate variables. Atmosphere 2024, 15, 573. [Google Scholar] [CrossRef]
- Feng, Y.; Jia, Y.; Cui, N.; Zhao, L.; Li, C.; Gong, D. Calibration of Hargreaves model for reference evapotranspiration estimation in Sichuan basin of southwest China. Agric. Water Manag. 2017, 181, 1–9. [Google Scholar] [CrossRef]
- Gu, X.; Long, A.; He, X.; Wang, H.; Lai, X.; Pang, N.; Liu, H.; Yu, H. Response of runoff to climate change in the Manas River Basin flow-producing area, Northwest China. Appl. Water Sci. 2024, 14, 43. [Google Scholar] [CrossRef]
- Kumar, S.; Sharda, R.; Goyal, P.; Siag, M.; Kaur, P. Reference Evapotranspiration Modelling Using Artificial Neural Networks Under Scenarios of Limited Weather Data: A Case Study in the Malwa Region of Punjab. Environ. Model. Assess. 2023. [Google Scholar] [CrossRef]
- Córdova, M.; Carrillo, R.G.; Crespo, P.; Wilcox, B.; Célleri, R. Evaluation of the Penman–Monteith (FAO 56 PM) Method for Calculating Reference Evapotranspiration Using Limited Data. Mt. Res. Dev. 2015, 35, 230–239. [Google Scholar] [CrossRef]
- Valle, J.G.L.C.; Vourlitis, G.L.; Amorim, C.L.F.; da Silva, P.R.; Nogueira, J.S.; Lobo, F.A.; Abu, R.Md.T.I.; Rangel, R.T. Evaluation of FAO-56 Procedures for Estimating Reference Evapotranspiration Using Missing Climatic Data for a Brazilian Tropical Savanna. Water 2021, 13, 1763. [Google Scholar] [CrossRef]
Figure 1.
Study area, Sinaloa state.
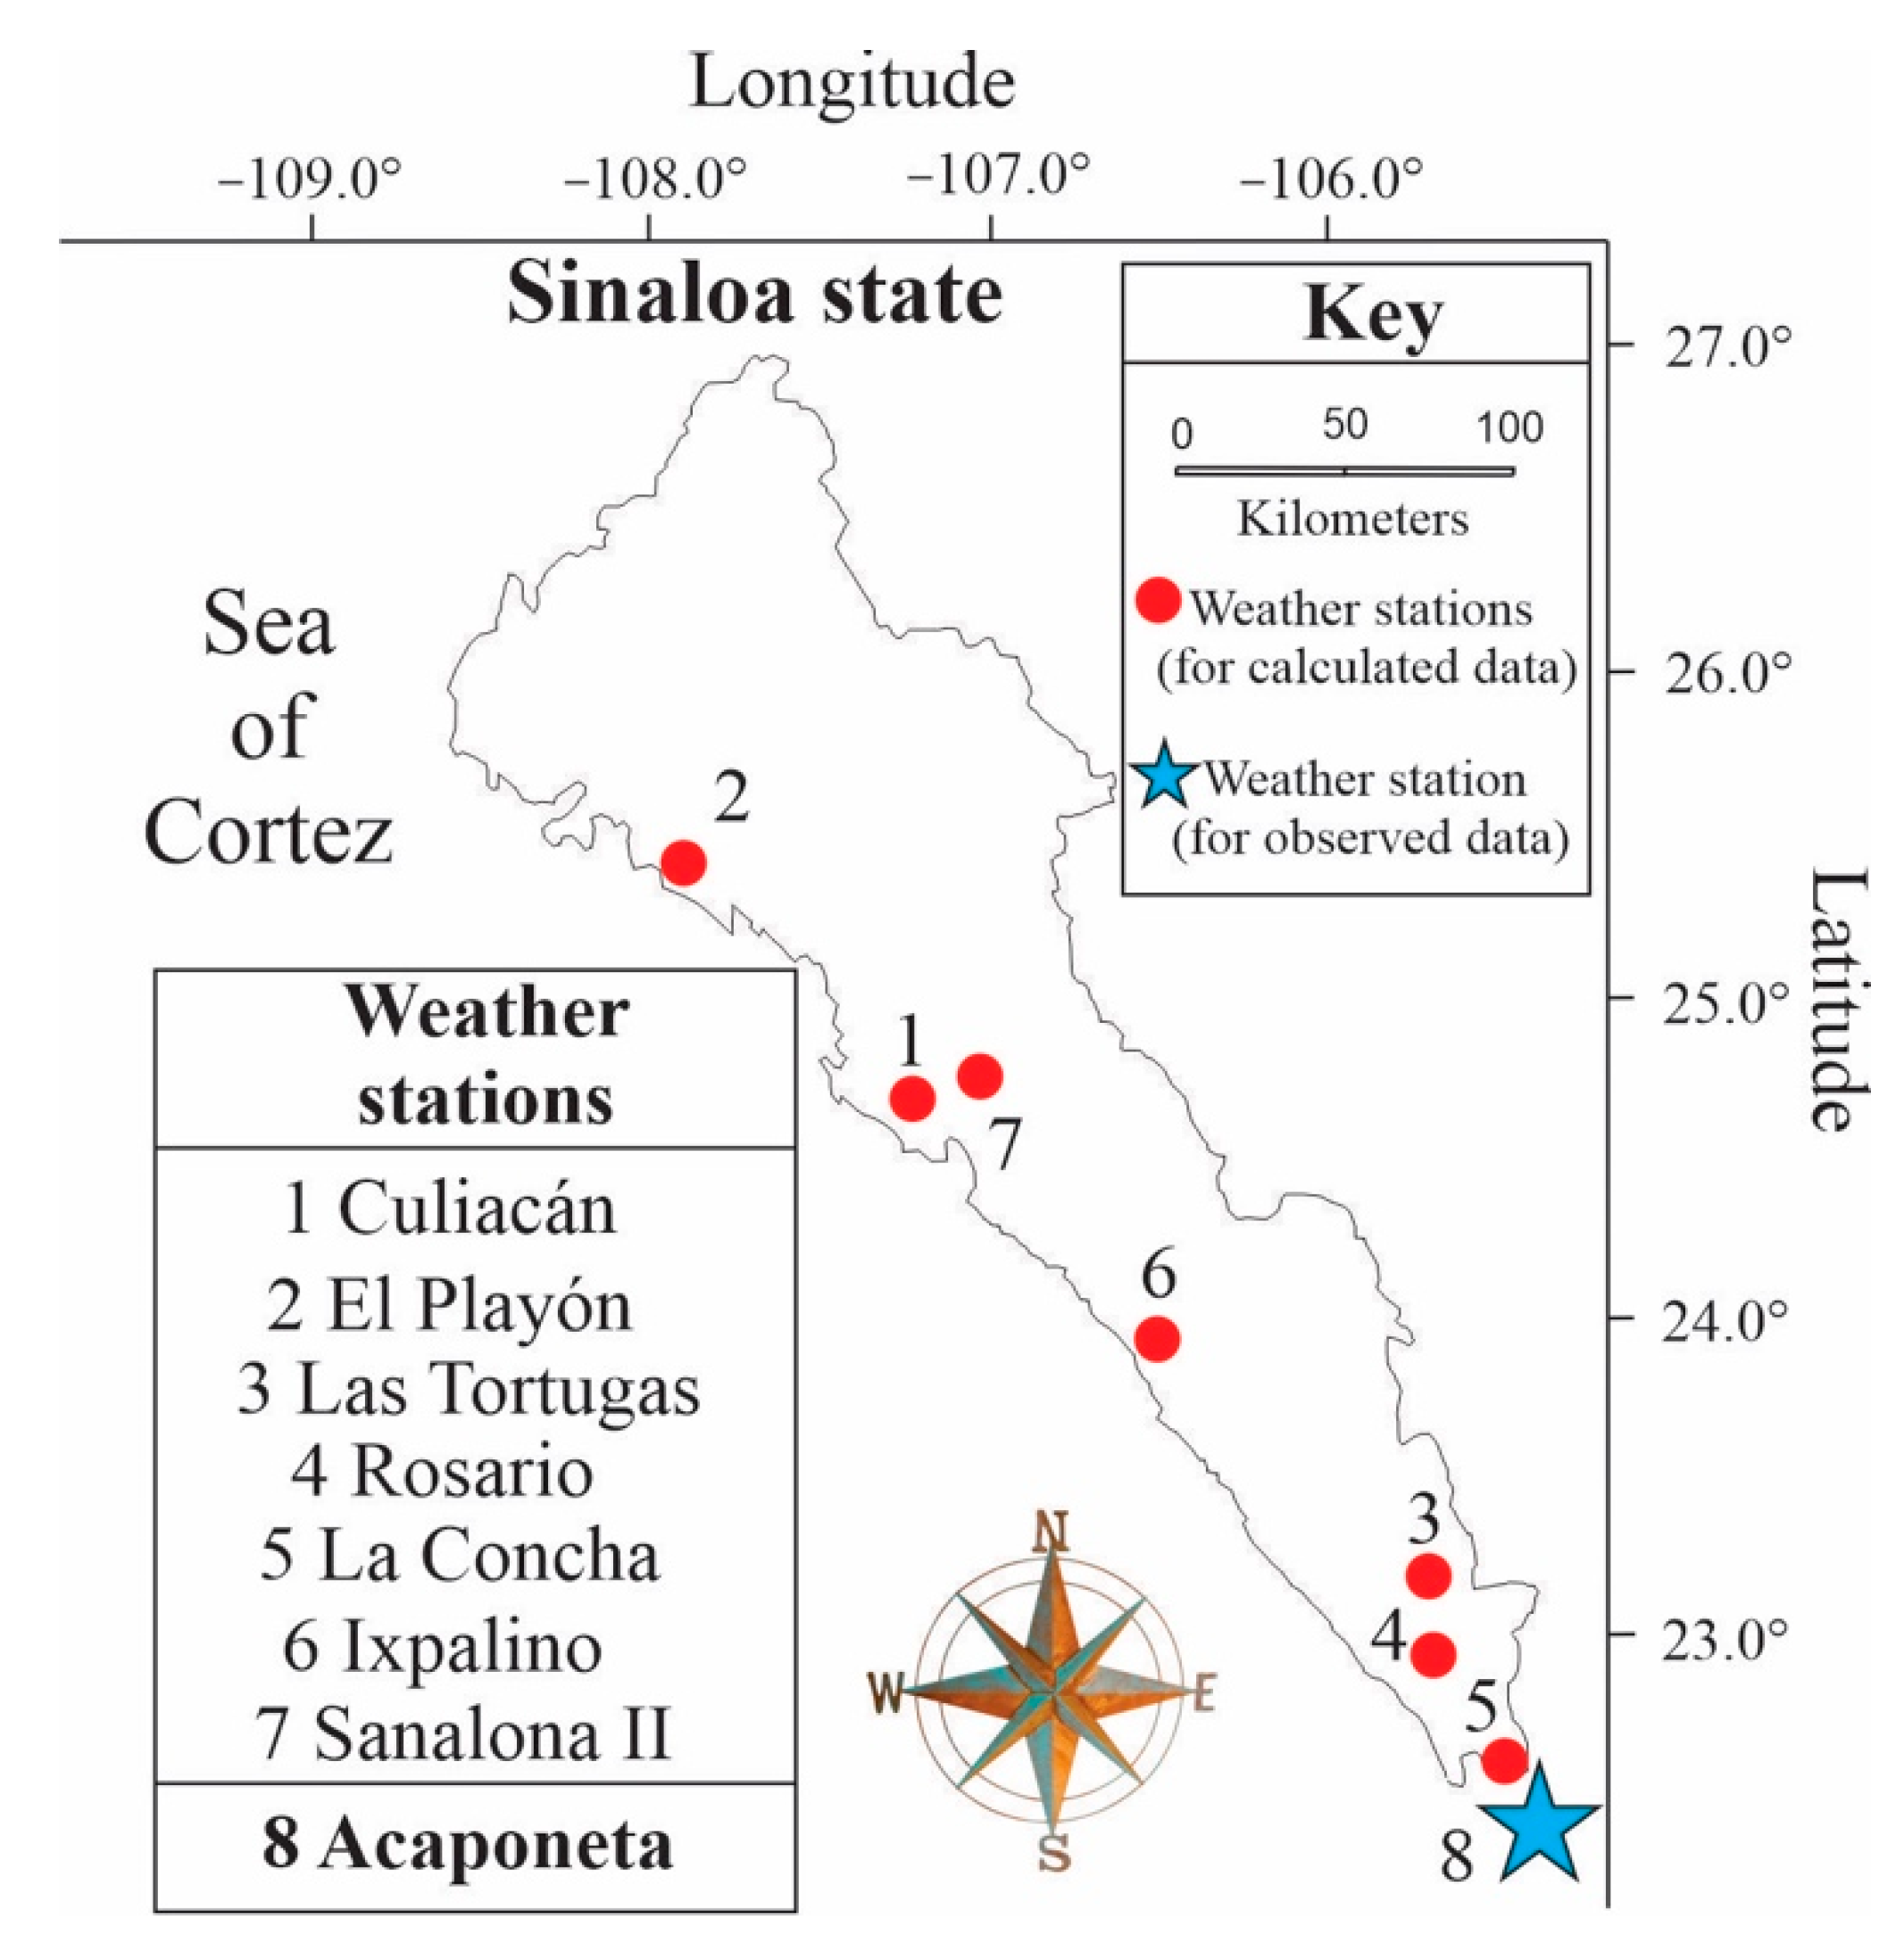
Figure 2.
Calculated monthly average reference evapotranspiration: Penman–Monteith (PMC) and Hargreaves (HAC) methods for the period 1979–2017 (mm day–1).
Figure 2.
Calculated monthly average reference evapotranspiration: Penman–Monteith (PMC) and Hargreaves (HAC) methods for the period 1979–2017 (mm day–1).
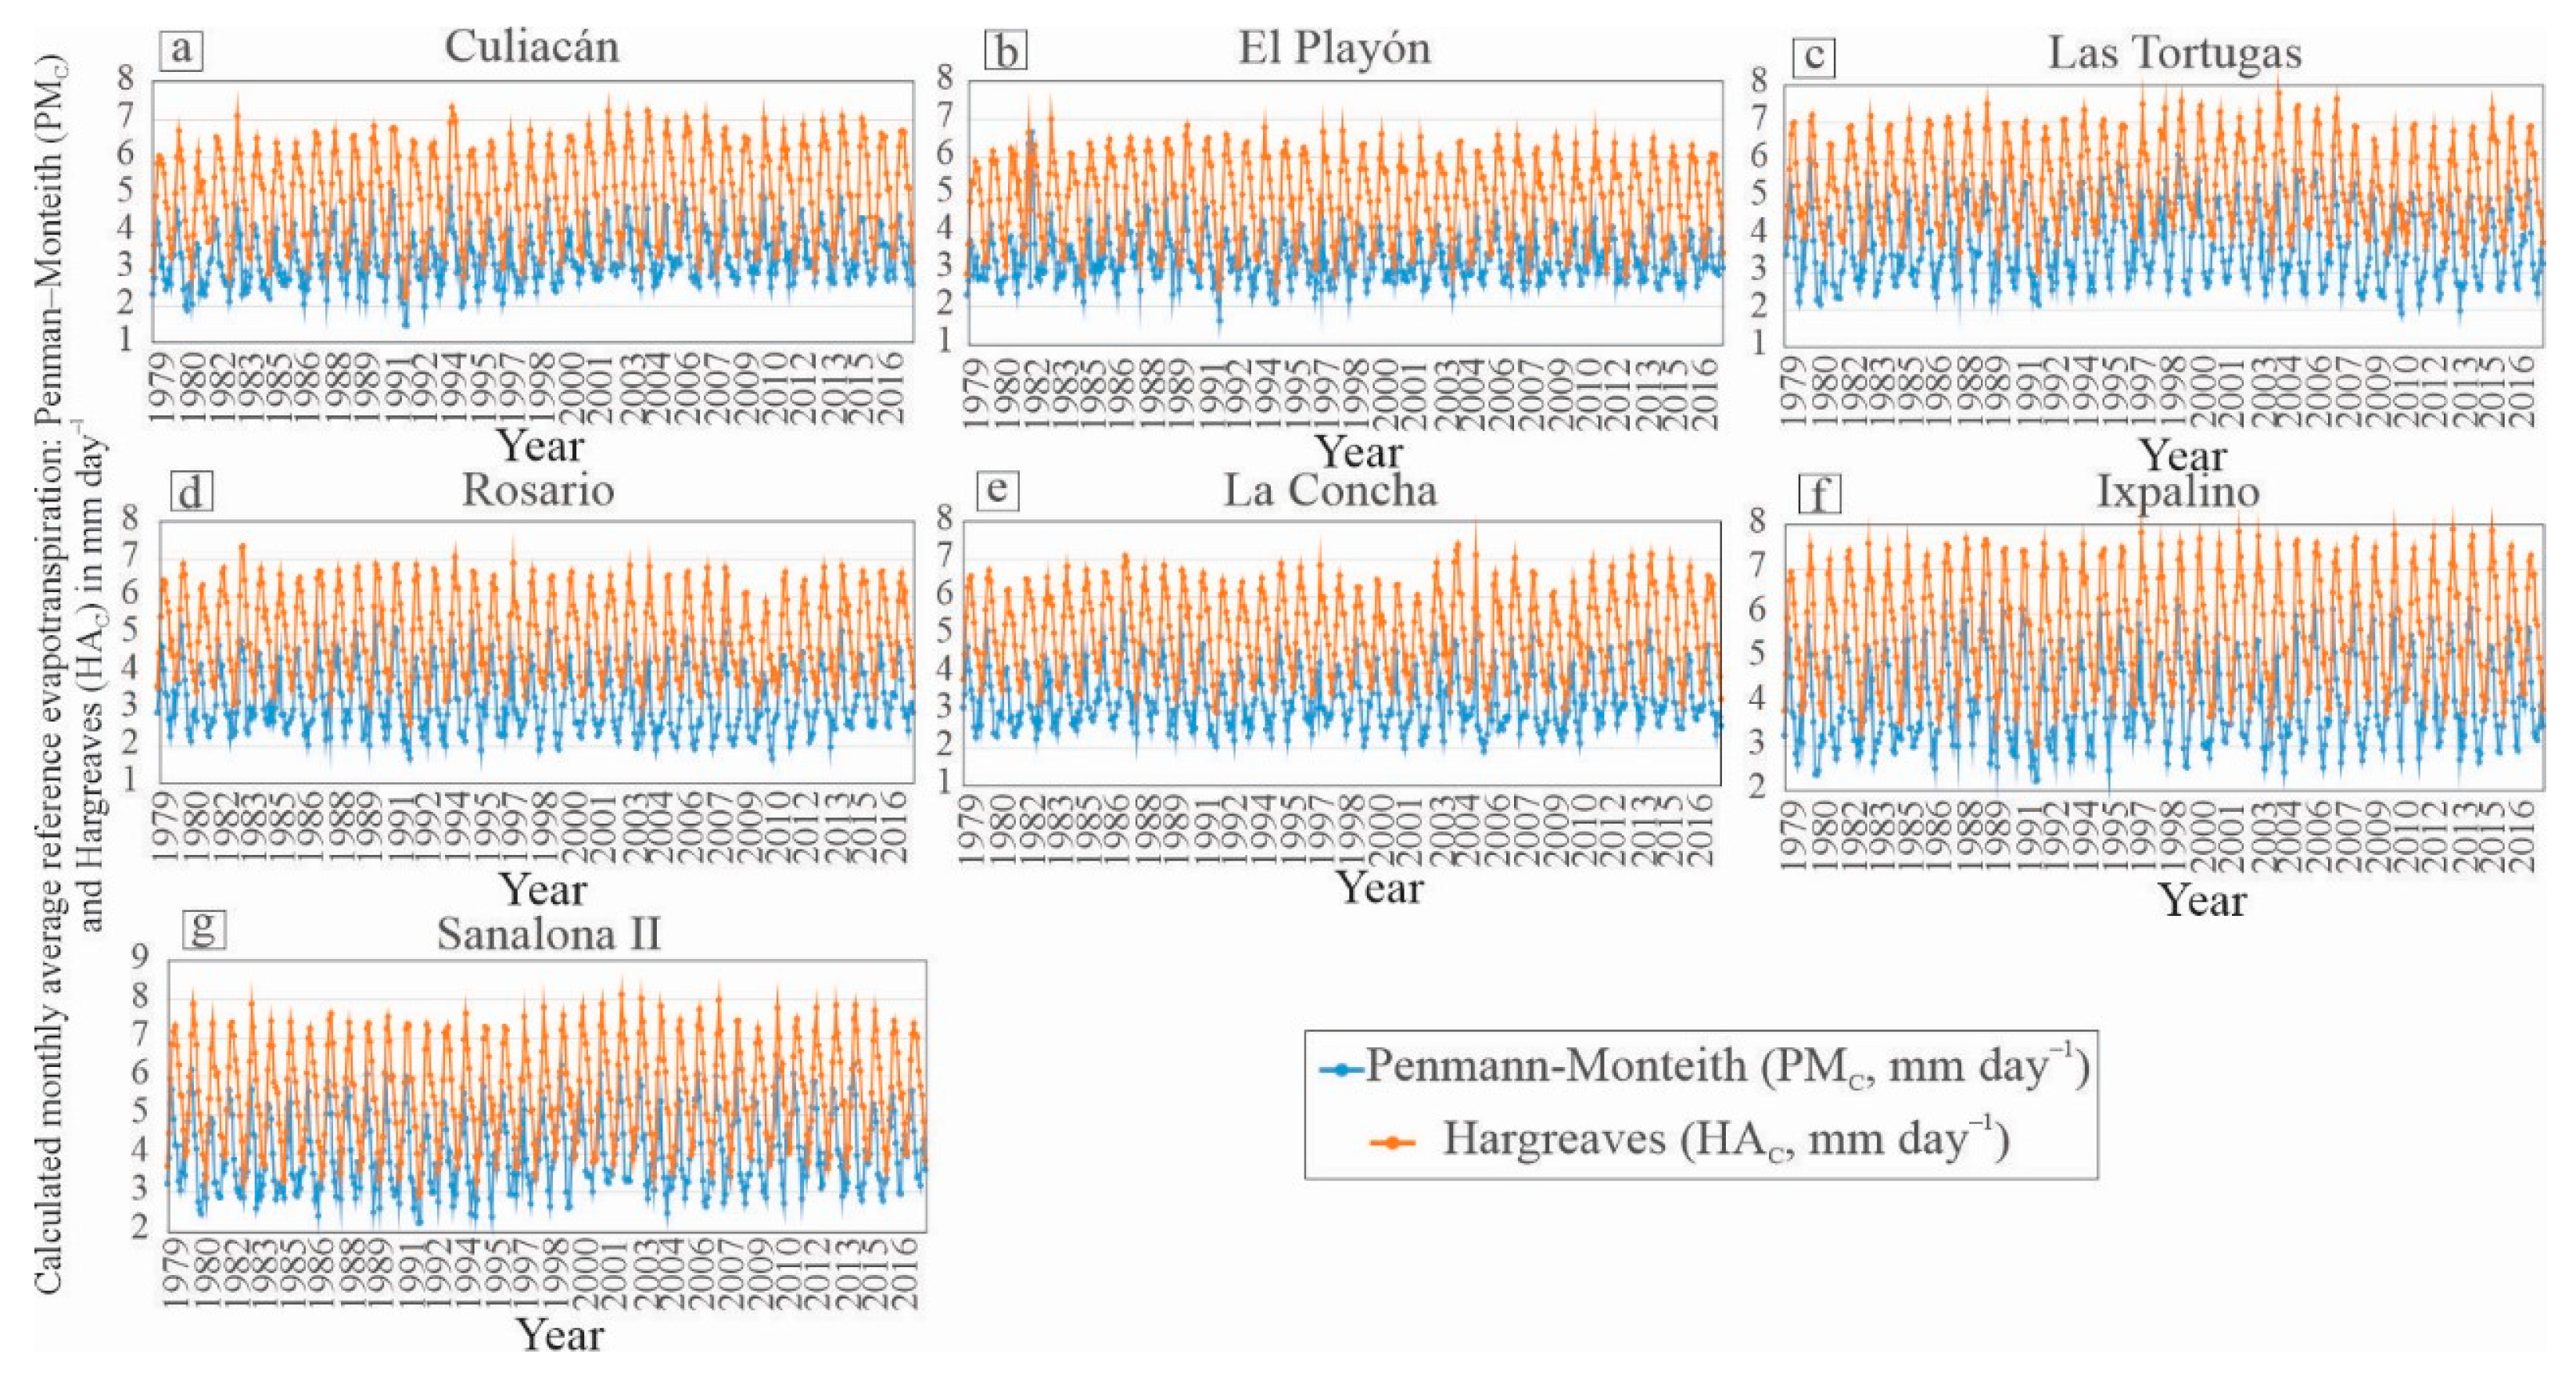
Figure 3.
Normality of the monthly series (Jan–Dec) of calculated reference evapotranspiration: Penman–Monteith (PMC) and Hargreaves (HAC) methods, for the period 1979–2017 (dimensionless).
Figure 3.
Normality of the monthly series (Jan–Dec) of calculated reference evapotranspiration: Penman–Monteith (PMC) and Hargreaves (HAC) methods, for the period 1979–2017 (dimensionless).
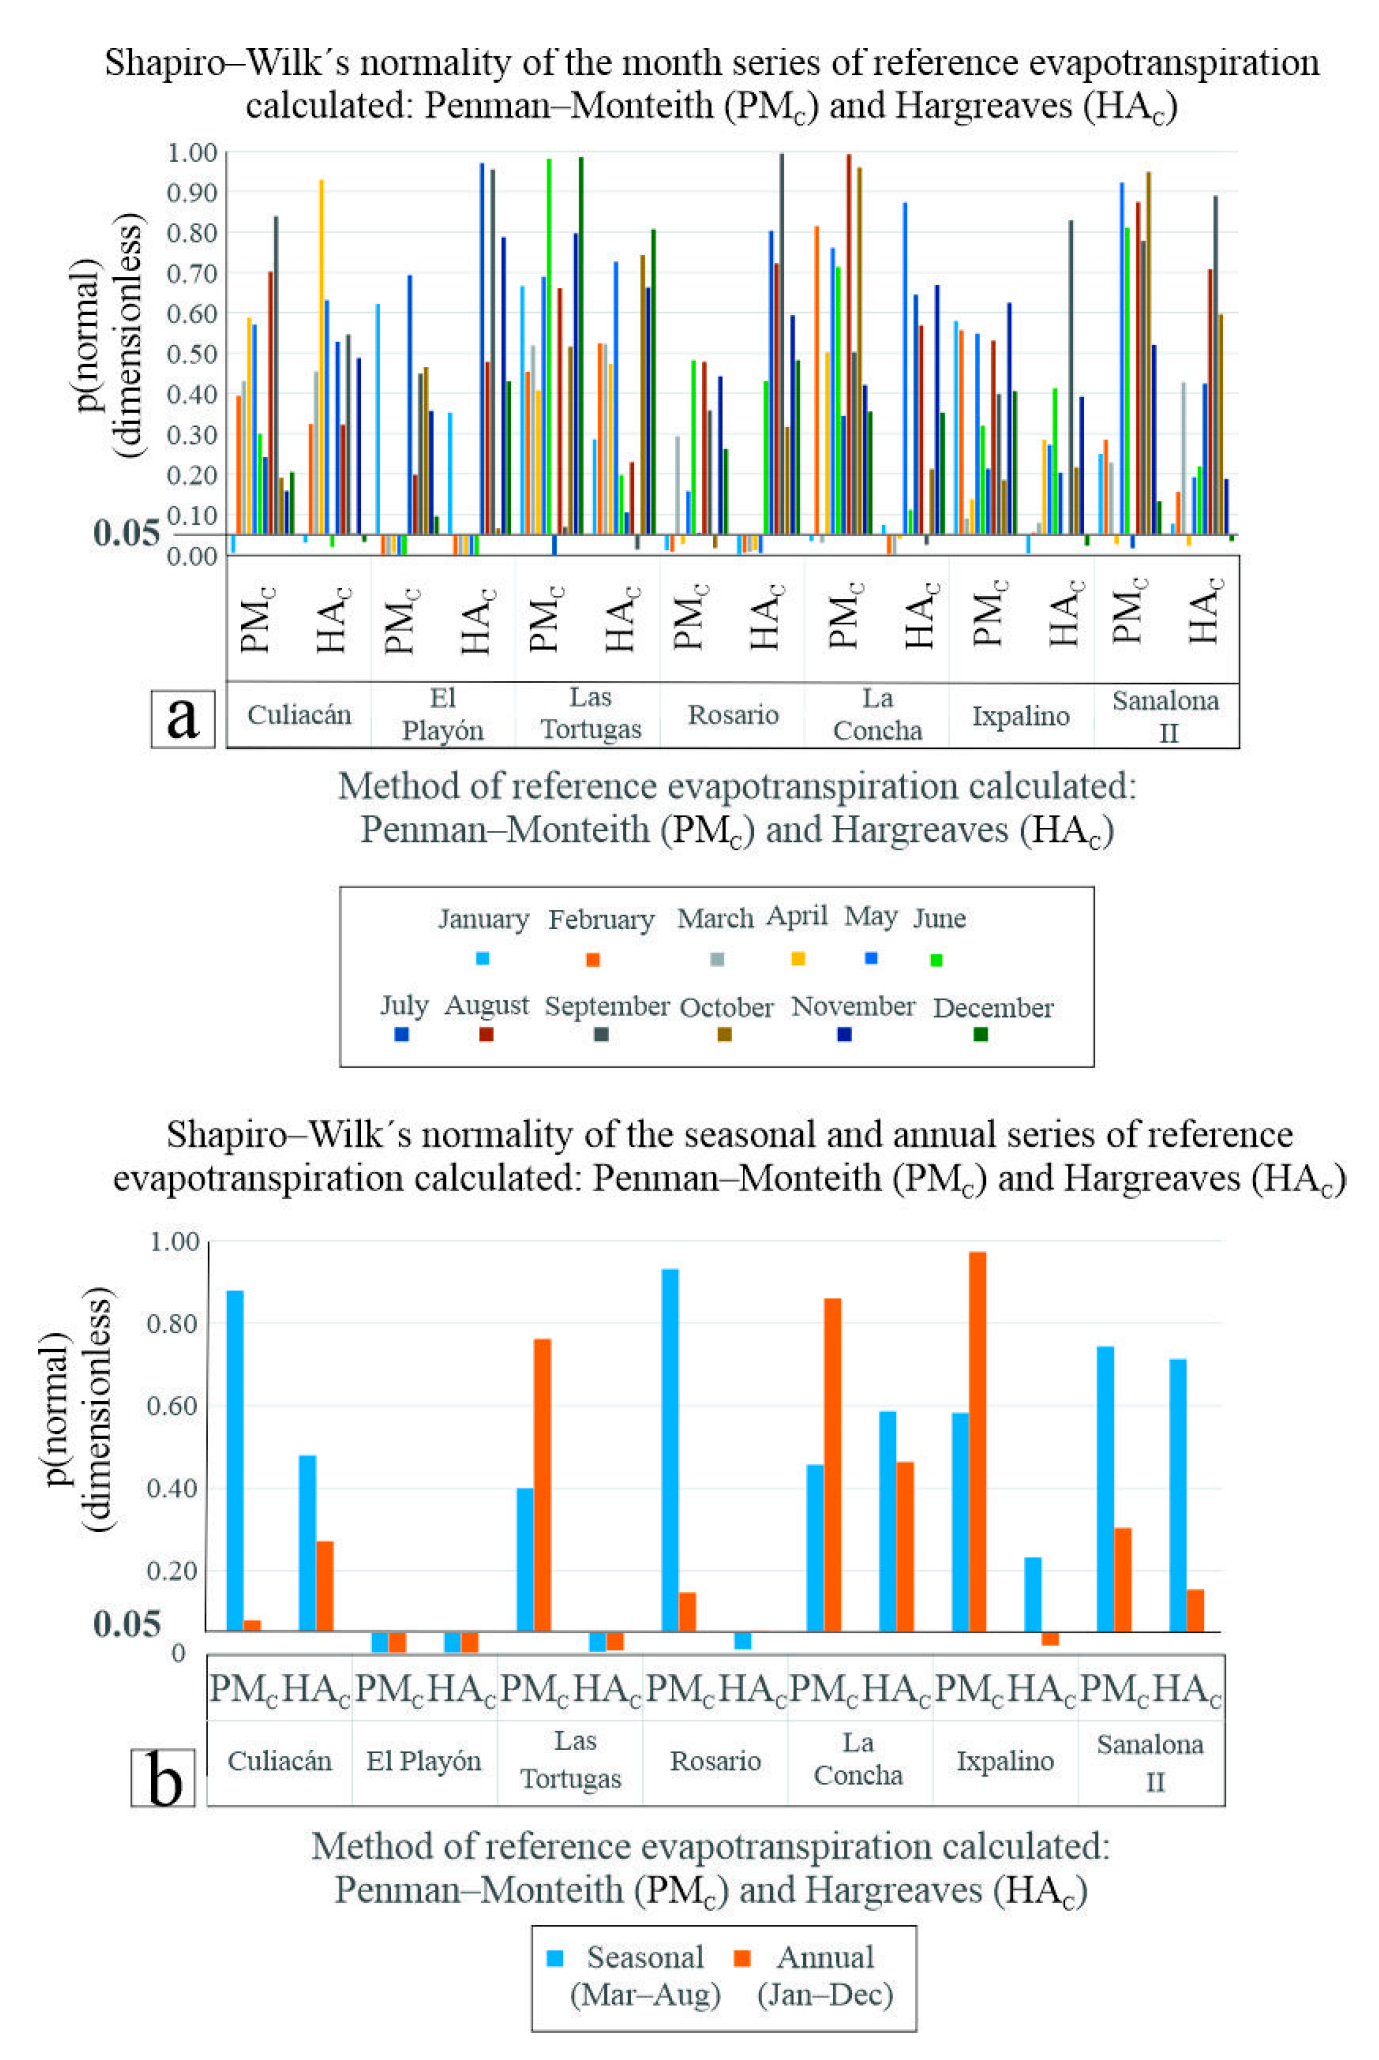
Figure 4.
Normality of regression residuals between reference evapotranspiration calculated from Penman–Monteith (PMR) and Hargreaves (HAC): a) monthly (Jan–Dec) and b) seasonal (Mar–Aug) and annual (Jan–Dec) (dimensionless).
Figure 4.
Normality of regression residuals between reference evapotranspiration calculated from Penman–Monteith (PMR) and Hargreaves (HAC): a) monthly (Jan–Dec) and b) seasonal (Mar–Aug) and annual (Jan–Dec) (dimensionless).
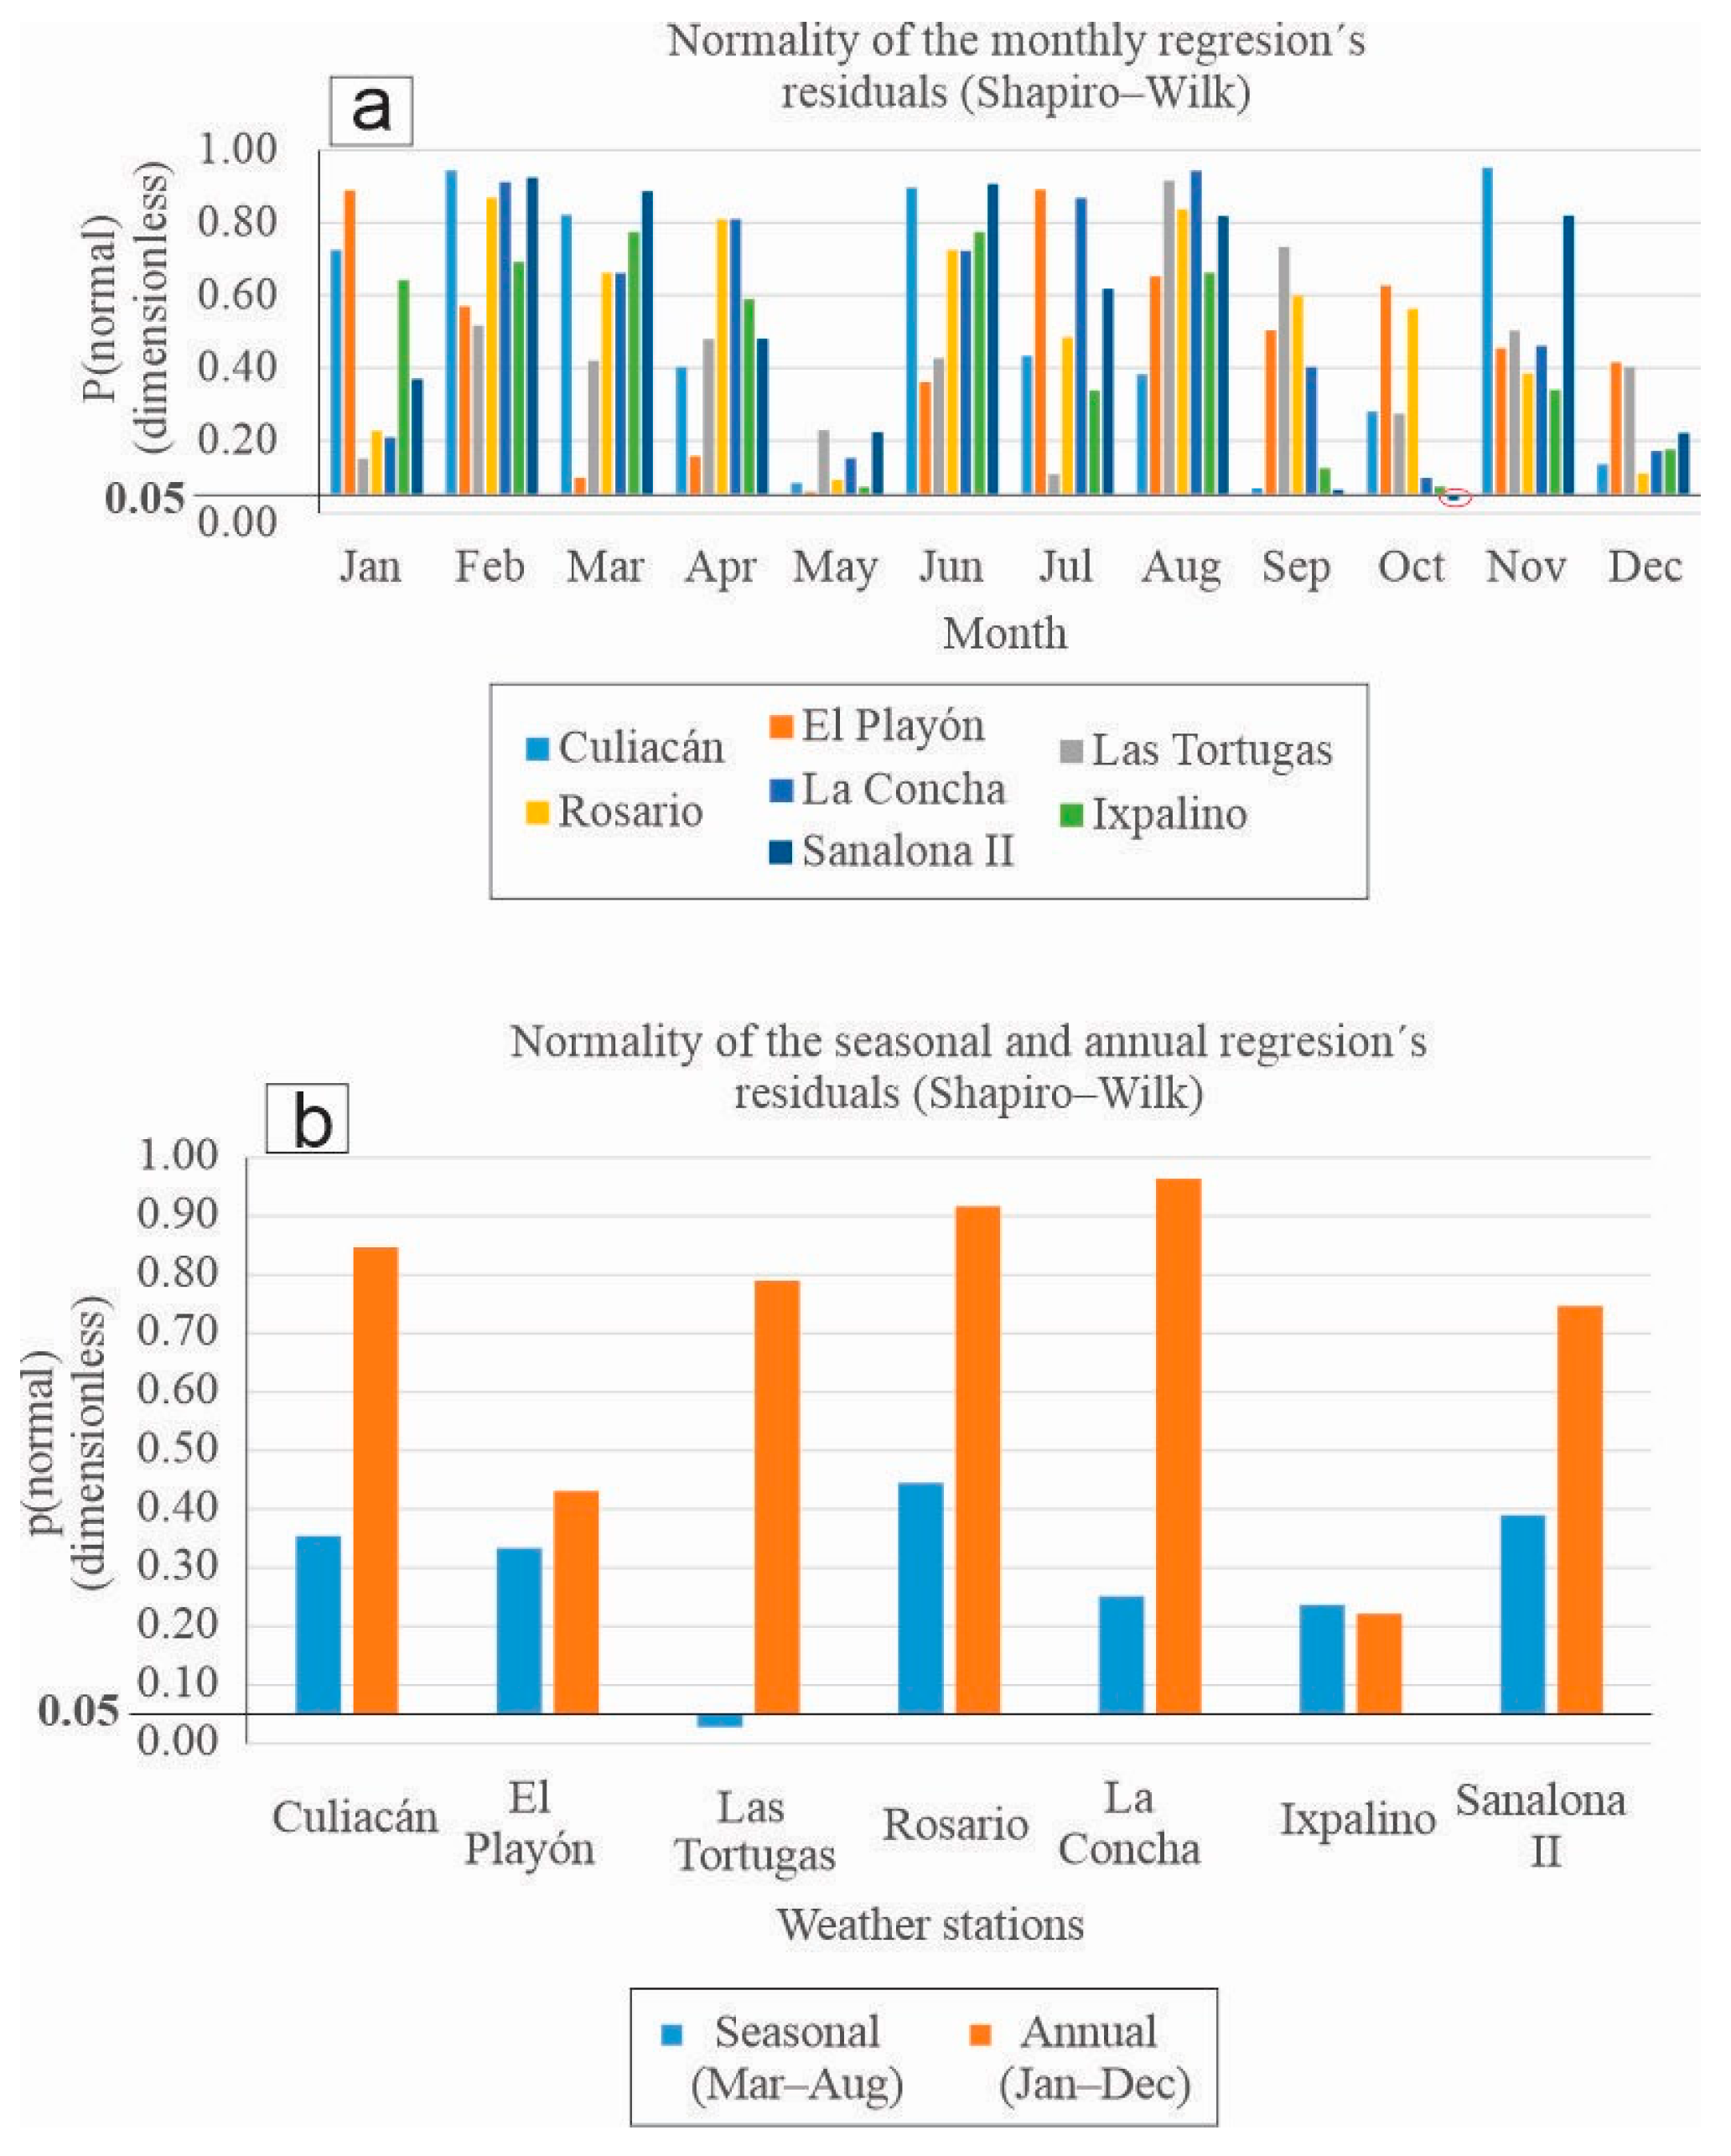
Figure 5.
Regressions of calculated and observed values: a) incident solar radiation (SR vs SRg, mm day–1), b) Penman–Monteith reference evapotranspiration, calculated with equations (PMC vs PMO, mm day–1) and c) same as b), but calculated with regressions (PMR vs PMO, mm day–1).
Figure 5.
Regressions of calculated and observed values: a) incident solar radiation (SR vs SRg, mm day–1), b) Penman–Monteith reference evapotranspiration, calculated with equations (PMC vs PMO, mm day–1) and c) same as b), but calculated with regressions (PMR vs PMO, mm day–1).
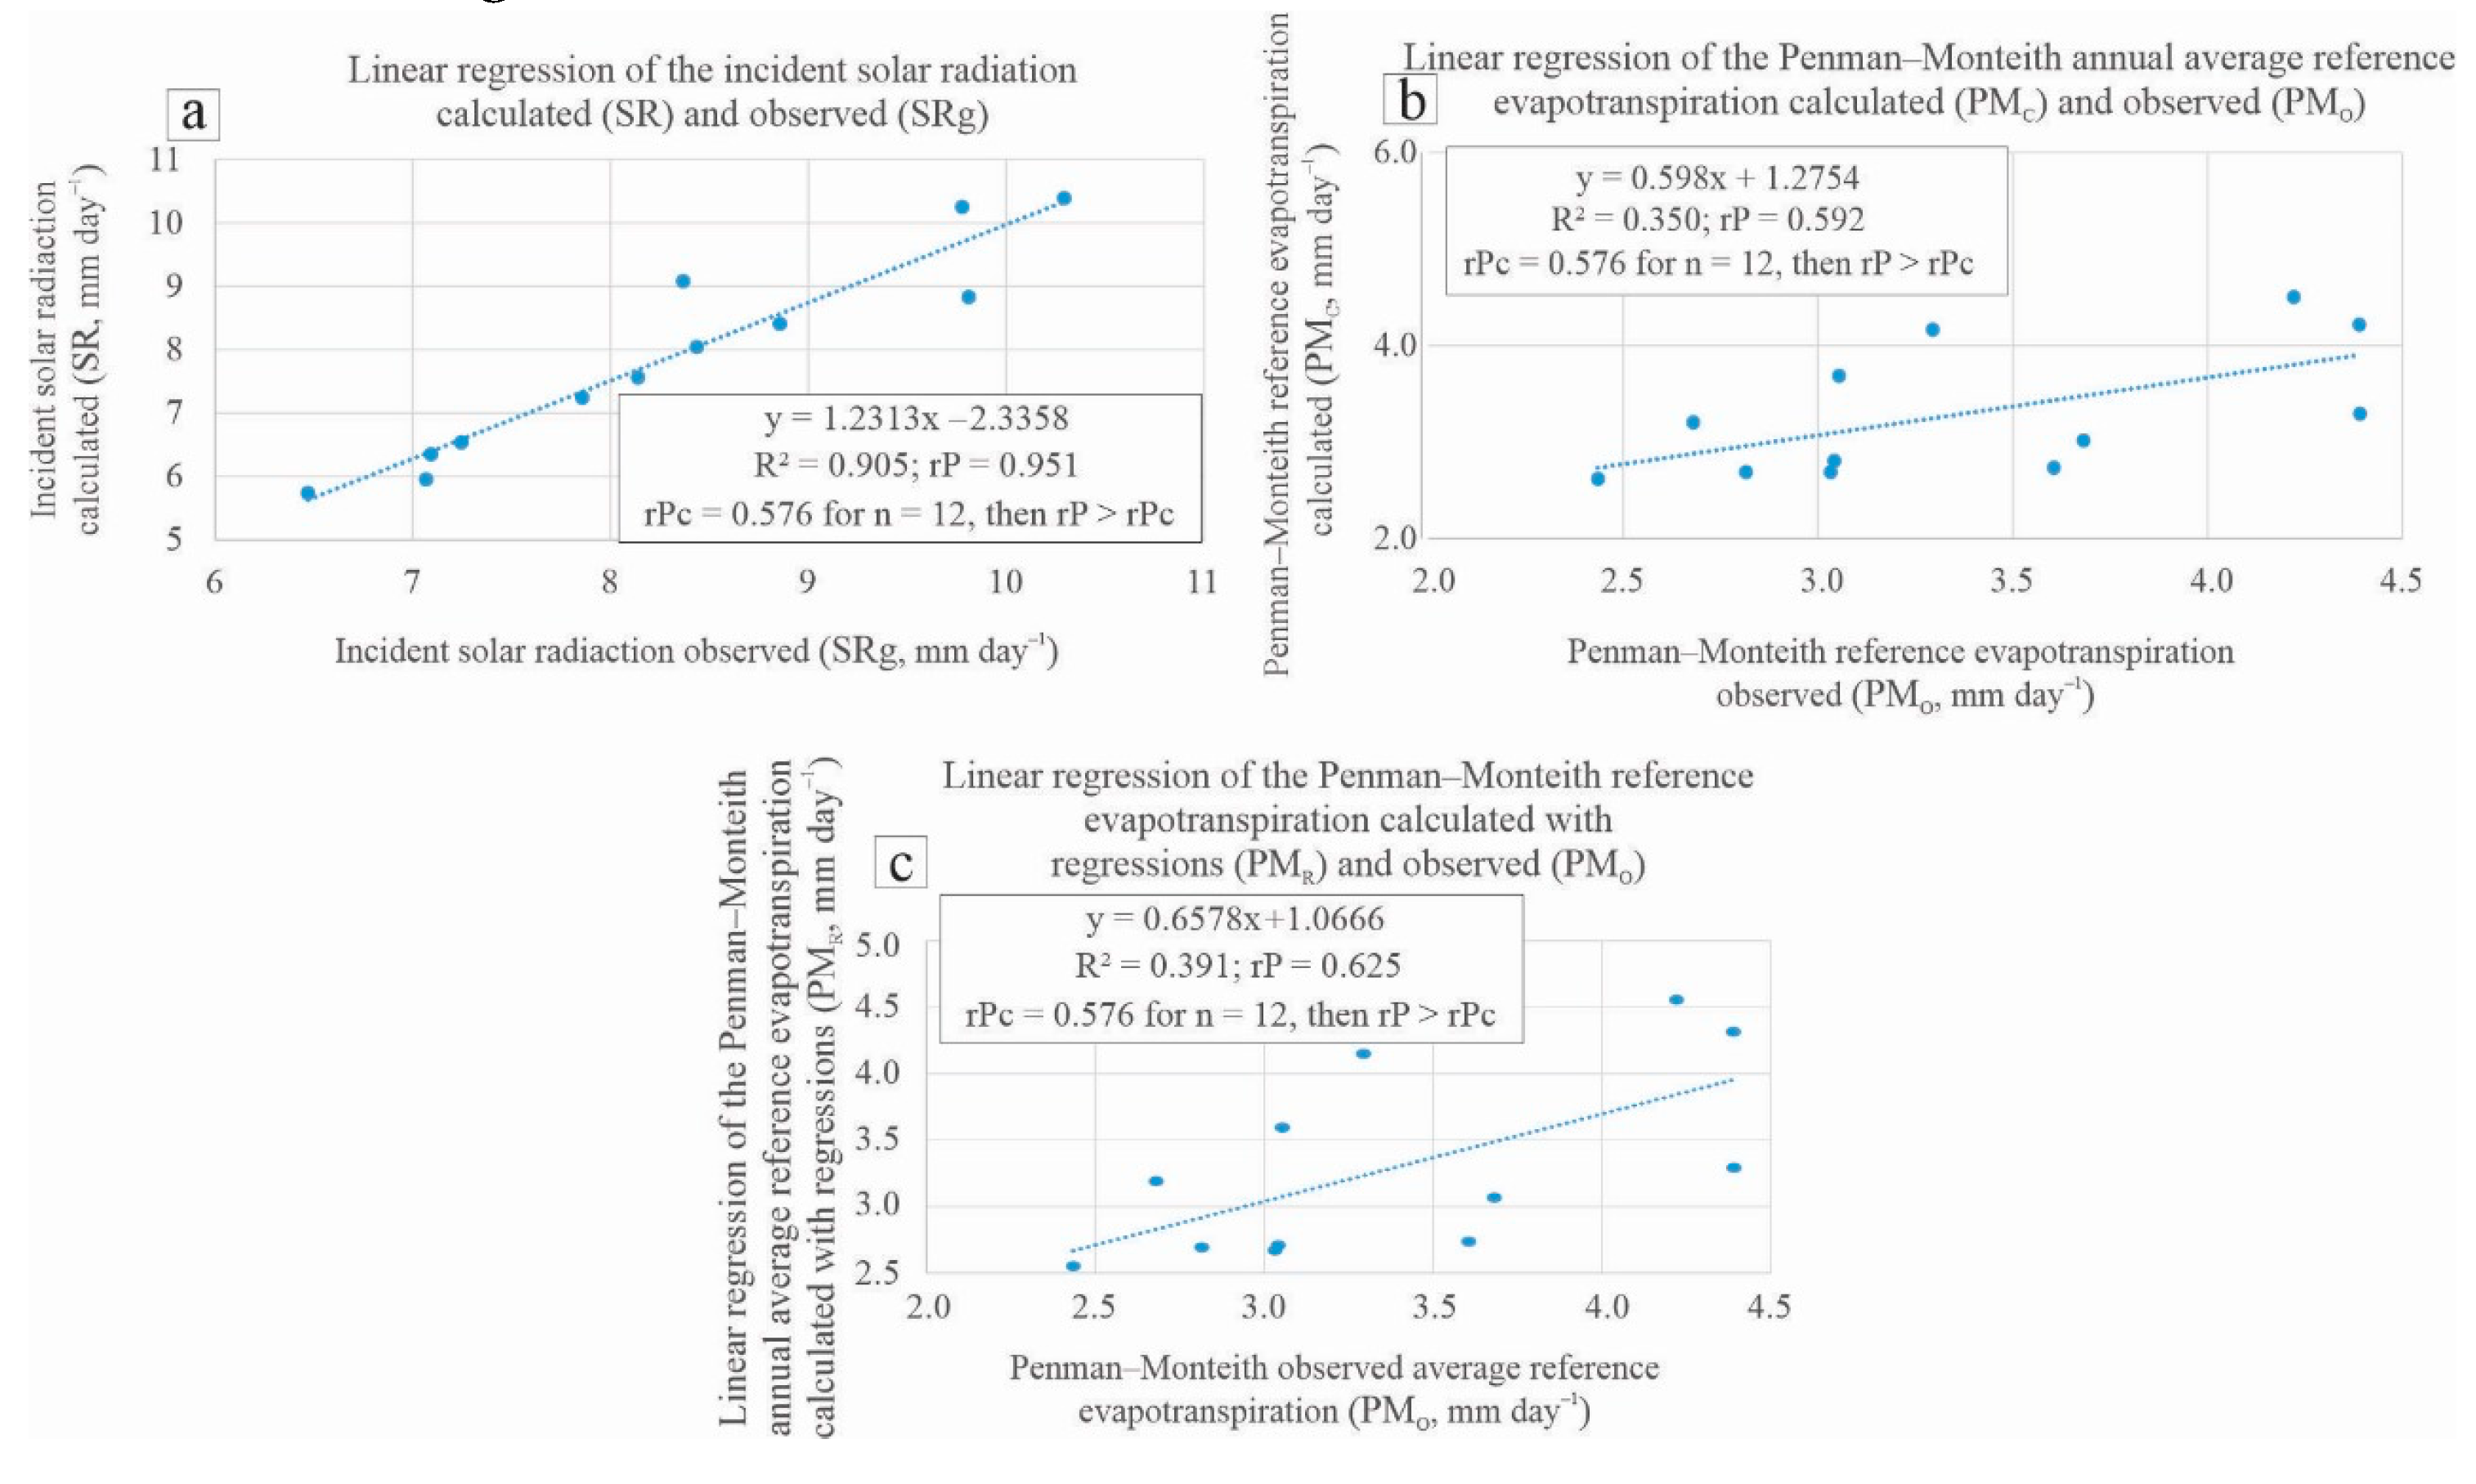

Table 1.
Maximum, minimum, and average values of the maximum (Tmax), minimum (Tmin) and mean (Tmn) temperatures, in Sinaloa, for the period 1979–2017.
Table 1.
Maximum, minimum, and average values of the maximum (Tmax), minimum (Tmin) and mean (Tmn) temperatures, in Sinaloa, for the period 1979–2017.
| Weather station | Statistical variable | Tmax (°C day–1) | Tmin (°C day–1) | Tmn (°C day–1) |
|---|---|---|---|---|
| Culiacán | Maximum | 45.50 | 29.80 | 35.00 |
| Minimum | 15.50 | 2.00 | 11.00 | |
| Average | 33.29 | 19.30 | 26.30 | |
| El Playón | Maximum | 45.50 | 37.00 | 38.00 |
| Minimum | 13.00 | –6.00 | 8.75 | |
| Average | 31.54 | 16.52 | 24.03 | |
| Las Tortugas | Maximum | 41.50 | 28.00 | 33.50 |
| Minimum | 17.50 | –6.00 | 11.00 | |
| Average | 33.56 | 16.87 | 25.21 | |
| Rosario | Maximum | 41.00 | 31.00 | 35.00 |
| Minimum | 17.00 | 1.40 | 14.00 | |
| Average | 32.66 | 18.86 | 25.76 | |
| La Concha | Maximum | 43.50 | 30.00 | 34.90 |
| Minimum | 19.00 | 4.00 | 14.00 | |
| Average | 33.86 | 20.17 | 27.02 | |
| Ixpalino | Maximum | 46.40 | 28.50 | 34.65 |
| Minimum | 19.00 | –1.30 | 11.70 | |
| Average | 35.08 | 17.34 | 26.21 | |
| Sanalona II | Maximum | 43.00 | 27.20 | 34.35 |
| Minimum | 17.00 | –5.00 | 8.25 | |
| Average | 33.94 | 15.19 | 24.56 |
Table 2.
Pearson (rP) and Spearman (rS) correlations of the calculated monthly average reference evapotranspiration (Jan–Dec): Penman–Monteith (PMC) and Hargreaves (HAC) methods (dimensionless).
Table 2.
Pearson (rP) and Spearman (rS) correlations of the calculated monthly average reference evapotranspiration (Jan–Dec): Penman–Monteith (PMC) and Hargreaves (HAC) methods (dimensionless).
| Type of correlation | Weather station | Jan | Feb | Mar | Apr | May | Jun | Jul | Aug | Sep | Oct | Nov | Dec | |
|---|---|---|---|---|---|---|---|---|---|---|---|---|---|---|
| Pearson (rP) | Culiacán | 0.895 | 0.848 | 0.869 | 0.780 | 0.639 | 0.781 | 0.908 | 0.867 | 0.865 | ||||
| El Playón | 0.896 | 0.443 | 0.691 | 0.888 | 0.841 | 0.845 | 0.840 | |||||||
| Las Tortugas | 0.929 | 0.878 | 0.808 | 0.772 | 0.734 | 0.848 | 0.831 | 0.850 | 0.829 | 0.866 | ||||
| Rosario | 0.890 | 0.793 | 0.852 | 0.913 | 0.857 | 0.842 | ||||||||
| La Concha | 0.831 | 0.839 | 0.753 | 0.820 | 0.850 | 0.811 | 0.831 | |||||||
| Ixpalino | 0.887 | 0.856 | 0.812 | 0.566 | 0.822 | 0.473 | 0.754 | 0.867 | 0.853 | 0.842 | ||||
| Sanalona II | 0.920 | 0.892 | 0.864 | 0.560 | 0.722 | 0.702 | 0.846 | 0.836 | 0.877 | |||||
| Spearman (rS) | Culiacán | 0.846 | 0.719 | 0.845 | ||||||||||
| El Playón | 0.767 | 0.682 | 0.816 | 0.725 | 0.749 | |||||||||
| Las Tortugas | 0.656 | 0.798 | ||||||||||||
| Rosario | 0.793 | 0.820 | 0.721 | 0.790 | 0.757 | 0.832 | ||||||||
| La Concha | 0.856 | 0.809 | 0.866 | 0.859 | 0.843 | |||||||||
| Ixpalino | 0.916 | 0.750 | ||||||||||||
| Sanalona II | 0.740 | 0.551 | 0.837 | |||||||||||
| n = 39; rcP = |0.316|; rcS = |0.318| | ||||||||||||||
Table 3.
Pearson (rP) and Spearman (rS) correlations of calculated seasonal (Mar–Aug) and annual (Jan–Dec) average reference evapotranspiration: Penman–Monteith (PMC) and Hargreaves (HAC) methods (dimensionless).
Table 3.
Pearson (rP) and Spearman (rS) correlations of calculated seasonal (Mar–Aug) and annual (Jan–Dec) average reference evapotranspiration: Penman–Monteith (PMC) and Hargreaves (HAC) methods (dimensionless).
| Type of correlation | Weather station | Seasonal (Mar–Aug) | Annual (Jan–Dec) | |
| Pearson (rP) | Culiacán | 0.852 | 0.895 | |
| El Playón | ||||
| Las Tortugas | ||||
| Rosario | 0.865 | |||
| La Concha | 0.907 | 0.921 | ||
| Ixpalino | 0.698 | |||
| Sanalona II | 0.693 | 0.848 | ||
| Spearman (rS) | Culiacán | |||
| El Playón | 0.794 | 0.831 | ||
| Las Tortugas | 0.773 | 0.854 | ||
| Rosario | 0.823 | |||
| La Concha | ||||
| Ixpalino | 0.839 | |||
| Sanalona II | ||||
| n = 39; rcP = |0.316|; rcS = |0.318| | ||||
Table 4.
Monthly regression coefficients to estimate calculated reference evapotranspiration: Penman–Monteith (PMR, dependent variable) and Hargreaves (HAC, independent variable) (dimensionless).
Table 4.
Monthly regression coefficients to estimate calculated reference evapotranspiration: Penman–Monteith (PMR, dependent variable) and Hargreaves (HAC, independent variable) (dimensionless).
| Coefficients of each equation by weather station | |||||||||||||
|---|---|---|---|---|---|---|---|---|---|---|---|---|---|
| Month | Type of coefficient of the equation | Culiacán | El Playón | Las Tortugas | Rosario | La Concha | Ixpalino | Sanalona II | |||||
| Jan | a | –1.330 | –1.864 | –2.877 | –1.942 | –2.116 | –3.322 | –2.851 | |||||
| Feb | –2.734 | –2.612 | –2.359 | –2.335 | –1.838 | –3.967 | –3.833 | ||||||
| Mar | –2.178 | –2.952 | –2.485 | –2.225 | –2.486 | –3.926 | –3.479 | ||||||
| Apr | –3.045 | –2.405 | –3.781 | –3.793 | –3.274 | –4.429 | –4.668 | ||||||
| May | –1.781 | –2.705 | –2.400 | –2.113 | –3.364 | –3.021 | –0.777 | ||||||
| Jun | –1.495 | –1.551 | –2.915 | –2.650 | –1.694 | –5.048 | –3.747 | ||||||
| Jul | 0.105 | –0.313 | –1.712 | –1.042 | –1.269 | 0.286 | –0.100 | ||||||
| Aug | –0.951 | –1.938 | –1.229 | –1.137 | –1.164 | –1.935 | –1.079 | ||||||
| Sep | –1.784 | –1.655 | –0.914 | –0.851 | –0.966 | –2.229 | –2.295 | ||||||
| Oct | –2.350 | –2.887 | –2.354 | –1.469 | –1.935 | –2.901 | 0.530 | ||||||
| Nov | –2.440 | –2.280 | –2.558 | –1.947 | –2.062 | –2.521 | –3.186 | ||||||
| Dec | –1.409 | –0.956 | –2.661 | –1.763 | –1.673 | –2.705 | –2.731 | ||||||
| Jan | b | 1.250 | 1.456 | 1.639 | 1.368 | 1.426 | 1.779 | 1.714 | |||||
| Feb | 1.488 | 1.486 | 1.379 | 1.340 | 1.228 | 1.716 | 1.733 | ||||||
| Mar | 1.193 | 1.368 | 1.266 | 1.190 | 1.227 | 1.507 | 1.460 | ||||||
| Apr | 1.192 | 1.094 | 1.314 | 1.310 | 1.224 | 1.402 | 1.454 | ||||||
| May | 0.883 | 1.033 | 0.988 | 0.936 | 1.120 | 1.069 | 0.782 | ||||||
| Jun | 0.782 | 0.798 | 1.009 | 0.974 | 0.816 | 1.302 | 1.113 | ||||||
| Jul | 0.526 | 0.605 | 0.829 | 0.709 | 0.751 | 0.515 | 0.576 | ||||||
| Aug | 0.664 | 0.852 | 0.708 | 0.691 | 0.700 | 0.832 | 0.688 | ||||||
| Sep | 0.885 | 0.883 | 0.704 | 0.686 | 0.717 | 0.963 | 0.976 | ||||||
| Oct | 1.140 | 1.293 | 1.128 | 0.932 | 1.044 | 1.239 | 0.366 | ||||||
| Nov | 1.388 | 1.409 | 1.364 | 1.209 | 1.251 | 1.382 | 1.570 | ||||||
| Dec | 1.259 | 1.179 | 1.561 | 1.295 | 1.287 | 1.610 | 1.670 | ||||||
| Plain | Simple linear regression (SLR) | ||||||||||||
| Bold | Simple nonlinear regression (SNR) | ||||||||||||
Table 5.
Seasonal and annual regression coefficients, to estimate calculated reference evapotranspiration: Penman–Monteith (PMR, dependent variable) and Hargreaves (HAC, independent variable) (dimensionless).
Table 5.
Seasonal and annual regression coefficients, to estimate calculated reference evapotranspiration: Penman–Monteith (PMR, dependent variable) and Hargreaves (HAC, independent variable) (dimensionless).
| Weather station | Seasonal (Mar–Aug) | Annual (Jan–Dec) | |||
|---|---|---|---|---|---|
| a | b | a | b | ||
| Culiacán | –0.916 | 0.761 | –1.182 | 0.888 | |
| El Playón | –2.216 | 0.992 | –2.304 | 1.141 | |
| Las Tortugas | 0.352 | 1.328 | –1.365 | 0.947 | |
| Rosario | –1.428 | 0.853 | –0.124 | 0.841 | |
| La Concha | –2.005 | 0.945 | –1.771 | 1.001 | |
| Ixpalino | –3.036 | 1.114 | –3.994 | 1.420 | |
| Sanalona II | –1.358 | 0.869 | –2.873 | 1.233 | |
| Plain | Simple linear regression (SLR) | ||||
| Bold | Simple nonlinear regression (SNR) | ||||
Disclaimer/Publisher’s Note: The statements, opinions and data contained in all publications are solely those of the individual author(s) and contributor(s) and not of MDPI and/or the editor(s). MDPI and/or the editor(s) disclaim responsibility for any injury to people or property resulting from any ideas, methods, instructions or products referred to in the content. |
© 2024 by the authors. Licensee MDPI, Basel, Switzerland. This article is an open access article distributed under the terms and conditions of the Creative Commons Attribution (CC BY) license (https://creativecommons.org/licenses/by/4.0/).
Copyright: This open access article is published under a Creative Commons CC BY 4.0 license, which permit the free download, distribution, and reuse, provided that the author and preprint are cited in any reuse.


