
Submitted:
01 June 2024
Posted:
03 June 2024
You are already at the latest version
Abstract
Global warming and the associated increasing frequency of heatwaves are on the rise leading to numerous health complications. Diabetic patients are more vulnerable to heat exposure than healthy individuals, owing to their impaired sweating ability, however, little is known about how heat exposure may impact the function of skin cells, commonly keratinocytes. Our recent report provided the first proof-of-concept revealing that the metabolic composition of sweat EVs is associated with metabolic changes in healthy individuals and type 2 diabetes patients. Given this and the shared cellular proprieties of eccrine sweat glands with keratinocytes, we questioned whether the metabolic changes in sweat EVs may mirror the responses of keratinocytes upon heat exposure. To this, we exposed HaCat, which were maintained in low (mimicking healthy condition) and high glucose (mimicking diabetes condition) to acute (90 min), chronic (48 h), and repetitive heat exposure at 40 ⁰C. Through conducting a set of experiments including a targeted metabolomics approach, Greiss assay, western blotting analysis, and electron microscopy studies.
The data demonstrate that heat exposure results in substantial changes of metabolite levels belonging to amino acids, pyrimidine metabolism, and glycolysis pathways in high glucose maintained HaCat cells when compared to those noted in low glucose condition. Exploring the molecular mechanisms through which heat exposure may impact the metabolic composition in keratinocytes, our discoveries highlight nitric oxide (NO) as a novel biomarker that the level is correlated with heat duration and frequency. Furthermore, data reveal that the HSP-70 protein levels and mitochondrial morphology are consequently altered.
This study provides evidence of shared metabolic alterations in keratinocytes and sweat EVs collected from clinical study and proposes, for the first time, NO as a novel biomarker for monitoring changes in health and diabetes upon heat exposure.
Keywords:
Keratinocytes
; high glucose
; heatwaves
; NO
; HSP-70
; metabolites
; diabetes
1. Introduction
With an increased frequency and duration of heatwaves associated with climatic changes, the incidence of ensuing hospitalization and mortality worldwide has significantly increased, notably for diabetic patients [1,2,3,4].
Diabetes is a metabolic disorder characterized by increased blood glucose levels, insulin resistance, and damage to multiple organs [5,6]. Recently, evidence suggested that individuals with diabetes are more vulnerable to heat exposure than healthy individuals, and reported a higher mortality rate in diabetic patients when compared with those without diabetes [7,8,9,10].
Owing to the presence of sweat glands, the skin plays a crucial role in the thermoregulation via the production of sweat [11,12]. In diabetes condition, however, the thermoregulatory mechanism is impaired because of various complications, such as the signalling dysfunction in the endothelium and non-endothelium caused by cardiovascular problems; the metabolic features such as irregular insulin distribution and chronic high blood glucose; the alternation of autonomous nervous function, and the decreased blood flow to the skin, thus leading to a decreased sweating ability [13,14,15].
Importantly, clinical studies claim the therapeutic effects of heat treatments on diabetes through controlling hyperglycemic level and reducing insulin resistance [16,17,18,19]. One proposed hypothesis is that heat can affect human sweating rate and the sweat composition. Moreover, the interplay between nitric oxide and heat shock proteins pathways appears to be one of the molecular mechanisms via which heat may promote the production of sweat [20,21,22,23,24]. NO is a free radical generated by the oxidation of L-arginine [23,24,25,26]. Recently, specific attention was attributed to NO, commonly in the skin via its key roles in regulating numerous biological processes in health and diseases [27,28,29,30]. This is, in part, due to the biphasic role of NO pathway in modulating the oxidative stress and mitochondrial function [30,31,32,33].
Heat shock proteins (HSP) are highly abundant intracellular proteins, contributing to various biological activities in normal physiological conditions, but also dynamically acting against distinct stimulus such as heat [20,24,34,35,36]. Among these functions, HSPs play a critical role in cellular protein homeostasis and cyto-protection. Several studies have explored the role of HSPs in diabetes, and it has been established that HSP protein levels are affected in diabetes and are associated with diabetic complications [20,23,37]. A study suggests that HSP70 is linked directly to heat effects on keratinocytes, and expression of HSP-70 in the epidermis and dermis indicates activation of protein synthesis and anti-inflammatory processes, to prevent photodamage [38].
Recently, our report identified the presence of metabolites in sweat extracellular vesicles (EVs) with a pioneering extraction and collection methodology. The findings reveal that sweat metabolites are influenced by heat in healthy individuals and exhibit a correlation with glucose levels [39].
In this study, our objective is to establish a cause-and-effect relationship by initially characterizing the changes that occur in the skin during heat exposure and their subsequent consequences. To gain insight into how heat affects the human skin at the cellular level under controlled glucose conditions, we employed an in-vitro cell line model using immortalized keratinocyte cell lines (HaCat). We maintained HaCat in low glucose (5 mM) and high (25 mM) glucose levels mimicking a healthy and diabetic cell environment. We exposed these cells to heat for varying durations to explore the effects of elevated temperature comprehensively.
The data reveals a contradictory metabolic composition in keratinocytes maintained in high glucose compared to that observed in their EVs, indicating that these vesicles may serve to buffer the intracellular space ensuring maintenance of homeostasis. NO is identified as a potential target to be associated with heat responses in high glucose-maintained keratinocytes. Furthermore, the heat exposure duration and frequency show positive effects on improving NO production, which is correlated with the increase of HSP-70 protein level and the activation of mitochondrial function.
Our study provides, for the first time, an insight into skin health and guides preventive strategies for diabetes-related skin complications. Additionally, it contributes to better understanding the molecular mechanisms that may take part in the production of sweat, thus proposing new therapeutic approaches. However, further investigations using sweat glands organoids may represent a more realistic model for mimicking the in vivo responses toward heat exposure.
2. Results
1.1. Heat Exposure Alters the Metabolic Profile of Skin Keratinocytes
Eccrine sweat glands play a major role in maintaining skin homoeostasis [12,40,41]. Owing to their origin, sweat glands exhibit almost the same properties as keratinocytes through regenerating the whole epidermis [42]. Recently, we reported that metabolite levels from sweat EVs are influenced by heat exposure and proposed them as means for reflecting metabolic changes in healthy and diabetes disease [39,43].
To provide a link between the observed metabolic composition of sweat EVs from healthy and diabetic patients [39], and that from keratinocytes upon heat exposure, HaCat cell we used. The cells were maintained in low (5mM) and high (25mM) glucose and then subjected to a short heat exposure at 40 ⁰C during 90 min. The metabolic patterns of the cells were explored through performing a targeted metabolomics approach, as previously described in Rahat et al., 2023 (Fig. 1A).
These data revealed, for the first time, that heat exposure resulted in downregulation of six metabolites in high glucose-maintained cells when compared to their levels in low glucose condition. The three metabolites including arginine, valine (amino acids), and uracil (pyrimidine metabolism) were significantly decreased (Fig. 1B-D). The rest of metabolites including creatinine (creatine pathway), isoleucine and asparagine (amino acids) were decreased, although not statistically significant (Supplementary Figure. 1A-D). Furthermore, the level of leucine and serine (amino acid), and lactate (glycolysis) metabolites were substantially elevated (Fig. 1E-G).
When evaluating the metabolites associated with the fatty acid pathway, we found a trend of decrease in the level of linoleate and myristate, while the level of palmitate metabolite was not changed in high glucose-maintained cells when compared to their levels in low glucose condition (Supplementary Figure. 1D-F).
Our current results show that metabolic changes in keratinocytes are contradictory to those previously observed in sweat EVs collected from healthy and type 2 diabetes (T2D) [39]. This result might suggest that EVs serve to buffer the intracellular space, however further investigations are needed.
Overall, our data suggest that keratinocytes may serve as an in vitro model for mirroring metabolic changes in sweat EVs, commonly for investigating glucose metabolism upon heat exposure in healthy and diabetic conditions.
1.1.1. Figure 1
Recently, our clinical results demonstrated a pioneering methodology for isolating and characterizing sweat EVs from clinical grade patches. Moreover, the data highlighted the use of certain metabolites as potential biomarkers for monitoring the heat effects on healthy and T2D subjects (39). Nevertheless, due to the inaccessible information concerning the basal levels of metabolites brought by the diabetes condition in sweat EVs collected at room temperature, our normalization method, however, was limited.
To specifically identify potential metabolites whose levels are specifically influenced by heat exposure and by high glucose condition, we examined and compared the basal levels of the altered metabolites upon acute heat exposure, shown in Figure 1, in cells maintained in high- versus low glucose conditions at 37 ⁰C. These findings highlight arginine as the only metabolite whose level was significantly inversely associated with acute heat exposure. In high glucose-maintained cells at 37⁰C, level of arginine was found to be moderately increased, although not statistically significant, when compared to its level in low glucose condition (Figure 2A). To further explore the molecular mechanisms via which heat exposure may modulate arginine metabolism, we selected one of its downstream molecules, nitric oxide (NO), as a target to be examined. Given that NO is generated by the oxidation of L-arginine [23,24,25,26], and our results demonstrating a decreased level of arginine in high glucose-maintained cells upon heat exposure, we hypothesized that heat exposures may influence the production of NO. Using a Greiss kit followed by a colorimetric assay, NO levels were evaluated as previously described [44] (Figure 2B).
Following 90 min of heat exposure, the concentration of NO showed a slight decrease in high glucose-maintained cells when compared to low glucose condition (Figure 2C). This result supports our hypothesis indicating a positive association between the level of arginine metabolite and the production of NO upon heat exposure in keratinocytes. Thus, proposing NO pathway as one molecular mechanism via which heat exposure may influence the responses of keratinocytes in high glucose condition.
1.1.1. Figure 2
As recently proposed in clinical studies, the duration of heat exposure is a key when investigating its therapeutic effect on diabetes [16,17,18,19]. Given this and our results indicating the altered NO production upon acute heat exposure, we aimed to explore how longer heat exposure, referred as to the chronic exposure, may influence its levels. The cells were exposed to heat for 48 h, following this, the cellular production of NO was examined using Greiss assay.
The finding demonstrated a significant decrease of NO level in high glucose-maintained cells when compared to its level in low glucose condition (Figure 2D).
Based on the contradictory profiling of the metabolic composition observed in sweat EVs [39] with the one noted in herein keratinocytes model upon acute heat exposure, we hypothesize that EVs may serve to buffer the intracellular space responses to heat. To test this hypothesis, we isolated the EVs from the supernatants of cells maintained in low and high glucose conditions following 48 h of heat exposure. The NO concentration in both EVs was then evaluated (Figure 2E). Findings indicate that, upon chronic heat exposure, the calculated number of EVs produced in high glucose-maintained cells was higher than that noted in low glucose condition. This was associated with a significant increase of NO in the EVs issued from the cells maintained in high glucose when compared to its level in the EVs collected from cells in low glucose condition (Figure 2F). Our results confirm the hypothesis suggesting that EVs serve to buffer the intracellular space in keratinocytes.
Overall, results propose NO as a novel biomarker for monitoring heat exposure consequences on keratinocytes when maintained in high glucose condition.
1.3. Acute and Chronic Heat Exposures Result in Altered HSP-70 and Mitochondrial Morphology in Keratinocytes
Based on the literature, Heat Shock Protein 70 (HSP-70) plays a protective role in response to heat stress through functioning as a molecular chaperone to preserve cellular function [35,45], and the recent report proposing that HSP-70 may modulate NO pathway [24]. We aimed therefore to examine its expression levels upon acute and chronic heat exposure by conducting western bloating (Figure 3A).
At 90min, judged by western blotting images followed by band intensity quantification, a significant decrease of HSP-70 levels was observed in high glucose-maintained cells when compared to that noted in low glucose condition (Figure 3B,C). In agreement, HSP-70 was downregulated after 48 h of heat exposure, although not statistically significant (Figure 3D,E). The data suggest the pattern of HSP-70 is associated with the observed levels of arginine and NO upon acute and chronic heat exposure conditions, respectively.
1.3.1. Figure 3
Considering reports indicating that HSP-70 plays an important role in mitochondrial homeostasis via preserving protein (re-) folding [34,35,46,47], we aimed to examine whether, upon heat exposure, the decreased level of HSP-70 might trigger mitochondrial phenotype changes in high glucose conditions.
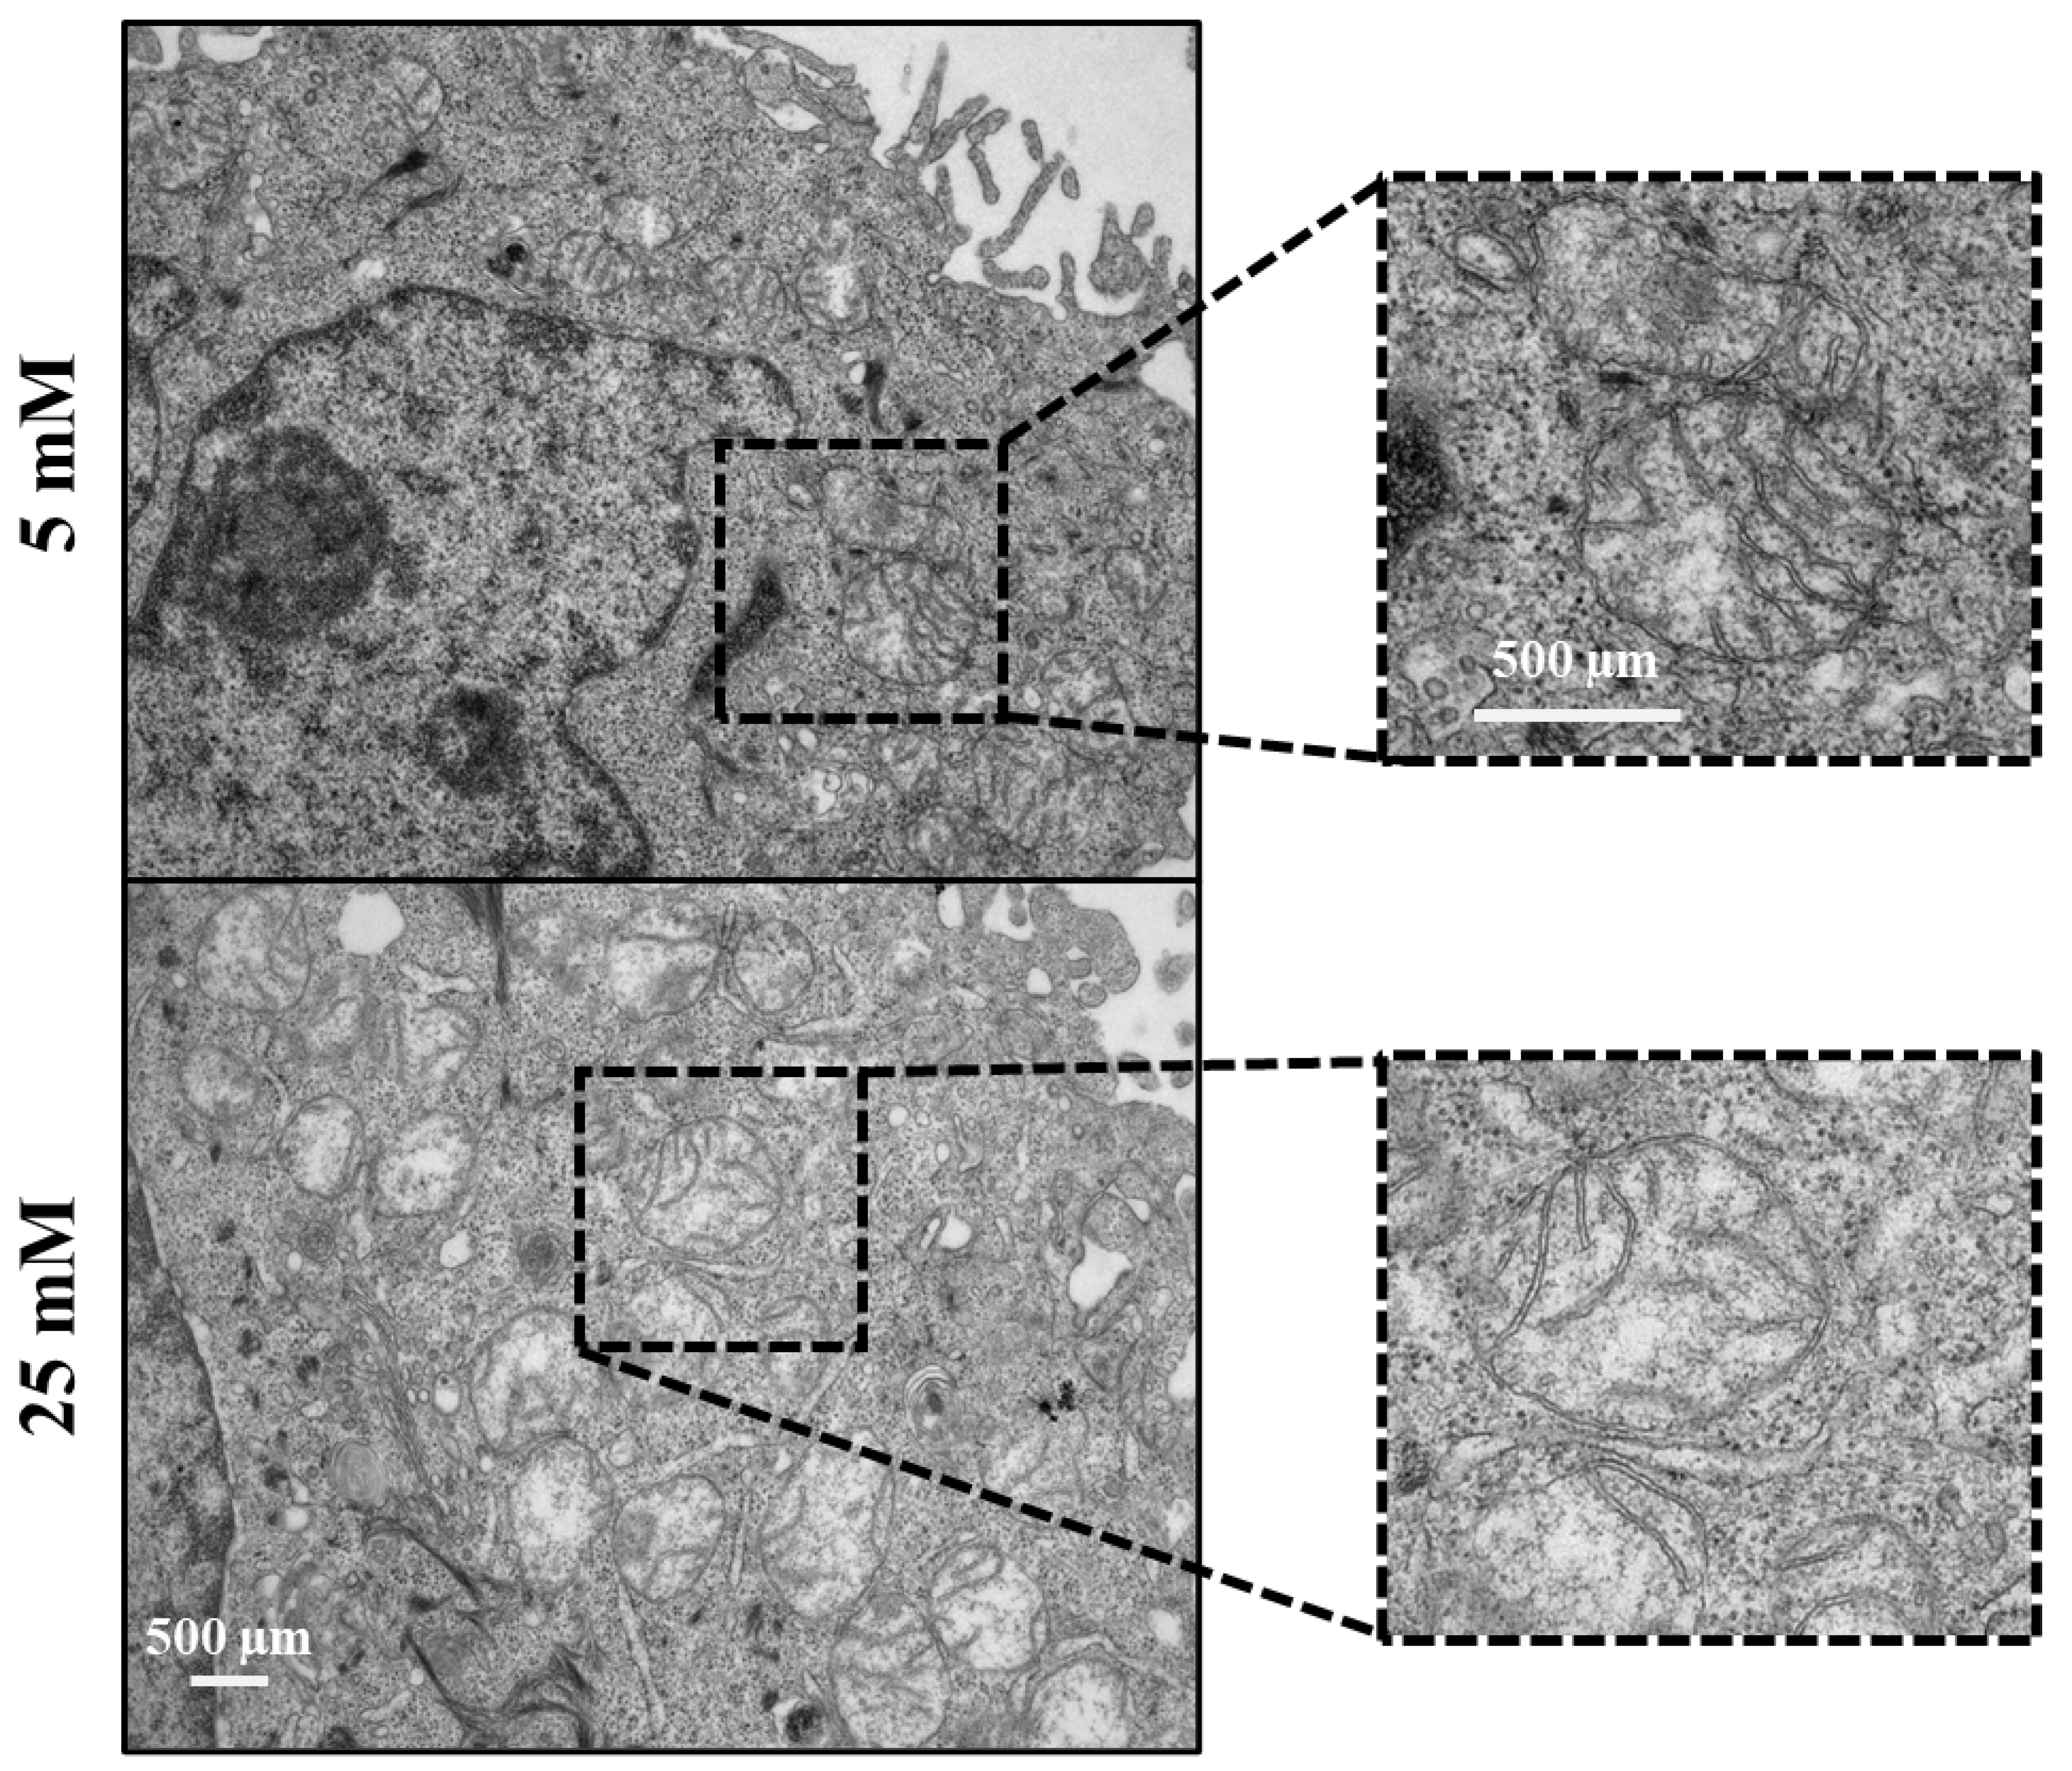
Electron microscopy images revealed that mitochondria in 25mM maintained glucose appeared structurally normal with various shapes (elongated or round), with well-arranged cristae and an electron-dense matrix upon acute heat exposure. In 5mM maintained cells, however, the mitochondria appeared typically swollen, they were enlarged and round, and composed of irregularly organized cristae accompanied by a partially or totally electron-lucent matrix (Figure 4, dashed rectangle).
Data suggests that mitochondria in high glucose-maintained cells are more resistant to the short duration of heat exposure than those in low glucose-maintained cells. This can be explained by a protective mechanism in which NO is playing a key role in orchestrating the oxidative status of the cells [26,33]. Furthermore, the significant decrease of hypoxanthine metabolite, a marker of oxidative stress in health and diseases [48,49,50,51], in high glucose-maintained cells agreed with this hypothesis (Figure 3D). Our observation supports the hypothesis that mitochondria in cells maintained in high glucose are more resistant to acute heat exposure than those in low glucose condition. This can be explained by a protective mechanism in which NO and HSP-70 pathways may interplay for coping with the heat exposure.
Together, these findings propose a potential interlink between HSP-70, mitochondrial morphology, and NO changes in keratinocytes upon heat treatment, although further investigations are needed.
1.3.1. Figure 4
1.4. Repetitive Heat Exposure Improves the Levels of NO and HSP-70 Protein Leading to Altered Mitochondrial Phenotype in Keratinocytes
Recently, clinical studies reported that heat therapy has beneficial results in improving insulin sensitivity and glycemic control for diabetic patients [18,19,52,53]. Based on this, we aimed to explore whether frequent heat exposure may improve the levels of NO and consequently HSP-70 protein in high glucose-maintained keratinocytes. Cells underwent three repetitive heat exposure for 90 min as illustrated in Figure 5A. Greiss assay and western blotting were performed to examine the levels of NO and HSP-70 protein.
Our result demonstrates an increase, though not statistically significant, of NO production in high glucose-maintained cells when compared to that noted in low glucose condition (Figure 5B). This was correlated with a significant elevation of HSP-70 at protein level (Figure 5B).
Electron microscopy images reveal an altered mitochondrial phenotype in both cells maintained in low- and high glucose conditions following repetitive heat exposure (Figure 6A). Judged by the noted disorganized cristae network in both cells, the data suggest that repetitive heat exposure may stimulate the function of mitochondria such as the respiration capacity and mitochondrial membrane potential. Thus, indicating a beneficial effect of frequent heat on improving mitochondrial function in high glucose-maintained keratinocytes. Moreover, based on the apoptotic cell number in the cells maintained in low and high glucose (data not shown), our data indicate that the altered phenotype of mitochondria appears not toxic. This is supported by the increased level on NO, which acts as an anti-apoptotic player via protecting the cells from oxidative damage [30,31,32,33].
These findings reveal, for the first time, the beneficial effects of frequent heat exposure on modulating mitochondrial function via promoting the production of NO and upregulating HSP-70 protein. Thus, we propose NO as a novel biomarker to be considered when monitoring the therapeutic effects of heat treatment on controlling glycemic level, commonly in diabetes.
3. Discussion
The purpose of this study is to investigate the use of HaCat cells as an in vitro model, a representative of sweat glands cells, to test whether heat exposure with different durations and frequency may impact the metabolic pattern in keratinocytes. Thus, enabling the identification of distinct metabolites that can be used as sweat biomarkers for monitoring wellbeing and changes in diseases. Given this aim and our recent data highlighting that metabolic composition of sweat EVs is altered in healthy and T2D conditions upon heat exposure. We applied, therefore the same experimental design as previously described [39], and performed a targeted metabolomics approach.
Our results propose NO as a novel biomarker to be associated with heat response in high glucose-maintained keratinocytes. Moreover, the alteration of NO is associated with our discoveries from a target metabolomic approaches that highlight arginine as the only metabolite to be specifically modulated by acute heat exposure in high glucose-maintained keratinocytes. This agrees with our recent published observation in which we demonstrate that following external heat exposure, the level of arginine metabolite is increased in sweat EVs collected from T2D patients when compared to its level in healthy subjects [39]. Similarly, following internal heat brought by an exercise test, the level of arginine metabolite is substantially elevated in sweat EVs of healthy subjects when compared to its level in the recovery state of the same individual [43]. Hier et al., reported that, in healthy subjects, heat exposure increases the arginine concentration in sweat, which appears to be independent of its variation in the blood [54].
Sweat glands express nitric oxide synthase enzyme (NOS) that the function is to produce NO via the oxidation of L-arginine [32,55,56], thus influencing the sweat composition. Importantly, during exercise in the heat, a relationship between the function of NOS and sweat production was proposed [57,58,59]. Data indicate that the inhibition of NOS attenuates the rate of human sweat and propose the NO pathway as a regulator for sweat secretion [58,59], however, the molecular mechanisms remain to be addressed.
Evidence supports that diabetes is associated with a deceased levels of HSPs in insulin-sensitive tissue [36,52,60]. Recently, clinical studies have shown the effectiveness of heat exposure as a therapeutic solution for diabetes, thus patients with T2D are recommended to have several series of heat exposure per week [19]. Data indicate that heat activates heat shock proteins, which consequently improve insulin resistance, glycemic control, and inflammation in T2D patients [19,20,21,24,38,61]. Similarly, in healthy keratinocytes, HSP-70 expression levels were elevated following multiple heat pulses [38]. Our results agree with the literature demonstrating, for the first time, that repetitive heat exposures increase HSP-70 protein levels, which correlate with an increase of NO levels in high glucose-maintained keratinocytes. Based on the literature and our results, we hypothesize that the interplay between HSP-70 and NO pathways may be proposed as the first molecular mechanism via which heat exposure can influence sweat production and composition.
The second hypothesis is that sweating rate might be controlled by the relationship between calcium and mitochondrial signaling, which, in turn, can impact the NO pathway. Diabetes is associated with decreased sweating ability caused by a series of events, including the cardiovascular complications, irregular insulin distribution and chronic glycemia, a decreased skin blood flow and dehydration, and dysfunction of nerves connected to sweat glands [7,62]. Moreover, studies report the association between the high serum calcium levels and the risk of T2D [63,64,65], which may trigger alteration of sweating rate, which is commonly seen in T2D patients. Multiple clinical studies, therefore, were conducted to explore whether exercise tests in the heat may ameliorate the capacity of sweat glands for producing sweat in healthy and diabetic patients. The data showed contradictory outcomes indicating that human sweating rate may or not be correlated with the altered calcium signaling caused by the internal body-heat [58,66,67]. One study, however, performed by Shamsuddin et al., showed that the cultured sweat gland cells, in vitro, are dependently secreting sweat in association with the external calcium present in the medium [68]. The interlink between cellular calcium levels and mitochondrial pathways for controlling cell homeostasis is well documented [69,70,71,72]. Recently, we reported that high blood glucose increases the intracellular calcium concentrations and consequently results on mitochondrial morphology changes in primary keratinocytes and murine skin. Our data highlight Trisk95 as main player in this mechanism [73]. High glucose condition increases oxidative stress and the production of cellular ROS [74,75,76]. Furthermore, being an oxidant, NO play a central role in regulating oxidative stress [33]. Given the literature and our herein results showing the alterations in morphological appearance of mitochondria, upon heat exposure, we thus propose that calcium may modulate NO pathway via mitochondria as an intermediate player. Further investigations using sweat gland cells with gain or loss of function of Trisk95 for assessing the calcium and NO relationship under heat exposure will be performed.
Our current study supports a vital role for skin in physiological responses to heat exposure via sweat production, in which the metabolic composition is influenced by the action of keratinocytes. Moreover, we advance the understanding of this intricate interplay by establishing a correlation between specific glucose environments and cellular physiology via identification of new players. Finaly, we propose NO as a novel biomarker when monitoring the therapeutic effect of heat treatment, such as for diabetes.
4. Materials and Methods
Cell Culture and Glucose Treatment
HaCat cell lines were maintained in low glucose (5mM D-Glucose) DMEM, and high glucose (25mM D-Glucose) DMEM to mimic healthy and diabetic skin cells environment, respectively. HaCat cells were cultured in 5mM and 25mM D-glucose DMEM media (Thermo Fisher) supplemented with 1% Penicillin/Streptomycin (Sigma), 10% FBS (Gibco) and maintained at 37°C in a humidified incubator under 5% CO2. The media was replaced every 48 hours after the seeding of the cells. When needed the cells were maintained in different passages after detachment with Trypsin-EDTA (Gibco Life Technology).
Heat Exposure
Acute and chronic heat exposures
On the day of treatment, HaCat cell cultures were rinsed with growth media to eliminate dead cells. Following this, fresh growth media was added to all control and treatment plates. Control cell plates were incubated for 90 minutes and 48 hours at 37°C in a humidified incubator with 5% CO2, while treatment plates were incubated at 40°C under the same conditions.
After heat exposure, cells were rinsed with 1x PBS and subsequently collected for protein, metabolomics, and electron microscopy analyses, in which each conducted according to their respective protocols. This protocol was repeated twice to have biological replicates and subsequent analyses were performed as explained below.
Repetitive heat exposure
On the day of the treatment, HaCat cells maintained at 5mM and 25mM glucose levels were subjected to repeated heat exposure. In this experimental setup, the cells were exposed to 40°C in a humidified incubator under 5% CO2 for 90 minutes every 24 hours, repeated three times, (following each heat exposure the cells were returned to an incubator at 37°C under the same incubation condition) and cell collection occurred after the third heat exposure. The cells to study heat recovery were collected 24 hours after the third heat exposure.
Following the repeated heat exposure (and recovery in the case of recovery cells) the cells were washed with 1x PBS and subsequently collected for protein, RNA, Metabolomics, and Electron microscopy, each conducted according to their respective protocols. The protocol was repeated twice to have biological replicates and further analysis was proceeded as explained below.
Protein Extraction and Isolation
The cell lysis was carried out by using radioimmunoprecipitation assay (RIPA) buffer (Cell Signaling Technology) supplemented with protease (Roche) and phosphatase inhibitor cocktail (Sigma-Aldrich). The samples were incubated with the lysis buffer for 30 minutes on ice and lysates were cleared by centrifugation at 16,000 x g for 15 minutes at 4°C. The protein concentration in the supernatant was measured using Pierce BCA Protein Assay Kit (Thermo Fisher), according to the manufacturer’s protocol. The absorption was detected by Perkin Elmer Victor3 multilabel reader and concentration was calculated by using BSA standard curve equation.
Western Blotting Analysis
The quantity of protein in the samples was calculated using BCA assay (PierceTM BCA Protein Assay Kit) according to the manufacturer’s recommendations. Equal amounts of total protein (30 µg) were separated by SDS-PAGE and electrophoretically transferred to nitrocellulose membranes (741280, BioTop, Germany). The membranes were then incubated overnight at 4°C with the following primary antibodies Anti-HSP70 (sc-373867, Santa Cruz Biotechnology), Anti-b-Actin and then with the secondary antibody (P0260, Aligent Tech, Glostrup, Denmark). The blots were then developed using PierceTM ECL plus western blotting substrate (32132, Thermo Fisher Scientific, USA).
Targeted LC-MS Metabolomics Analysis
For Targeted metabolomics profiling, the metabolites were extracted from cells using 400µl of cold LC-MS grade extraction solvent (Acetonitrile:Methanol:MQ; 40:40:20) and subsequently, samples were vortexed for 2 min and sonicated for 1 min followed by centrifugation at 14000rpm at 4°C for 5 minutes. After centrifugation supernatants were transferred into polypropylene tubes and placed into Nitrogen gas evaporator and dried samples were suspended with 40µl of extraction solvent (ACN:MeOH:MQ; 40:40:20) and vortexed for 2 min and transfered into HPLC glass auto sampler vials. 2µl of samples were injected with Thermo Vanquish UHPLC coupled with Q-Exactive Orbitrap quadrupole mass spectrometer equipped with a heated electrospray ionization (H-ESI) source probe (Thermo Fischer Scientific). A SeQuant ZIC-pHILIC (2.1×100 mm, 5-μm particle) column (Merck) was used for chromatographic separation. The gradient elution was carried out with a flow rate of 0.100 ml/minutes with using 20mM ammonium hydrogen carbonate, adjusted to pH 9.4 with ammonium solution (25%) as mobile phase A and acetonitrile as mobile phase B. The gradient elution was initiated from 20% Mobile phase A and 80% of mobile phase B and maintain till 2min., followed by 20% Mobile phase A gradually increasing up to 80% till 17 min., then 80% to 20% Mobile phase A decrease in 17.1 min. and maintained up to 24 minutes. The column oven and auto-sampler temperatures were set to 40 ± 3 °C and 5 ± 3 °C, respectively. MS was equipped with a heated electrospray ionization (HESI) source using polarity switching and following setting: resolution of 35,000, the spray voltages: 4250 V for positive and 3250 V for negative mode, the sheath gas: 25 arbitrary units (AU), and the auxiliary gas: 15 AU, sweep gas flow 0, Capillary temperature: 275°C, S-lens RF level: 50.0. Instrument control operated with the Xcalibur 4.1.31.9 software (Thermo Fischer Scientific). The peak integration was done with the TraceFinder 4.1 software (Thermo Fischer Scientific) using confirmed retention times for 450 metabolites standardized with library kit MSMLS-1EA (Merck). Peak smoothening was adjusted to 7 and sample peak threshold set to 50 000 m/z. The data quality was monitored throughout the run using pooled QC sample prepared by pooling 5µl from each suspended samples and interspersed throughout the run as every 10th sample. The metabolite data was checked for peak quality (poor chromatograph), % RSD (20% cutoff) and carryover (20% cutoff).
Metabolomics Data Analysis
Identified metabolites were normalized to cell number prior to analyzing data using Metaboanalyst 5.0 (www.metaboanalyst.ca). Missing values were replaced by the limit of detection, set as 20 % of the minimum positive value of each metabolite and normalization of all samples was made by using log transformation. Metabolites with a fold change of 1.5 and a p-value of 0.1 using unpaired non-parametric t-test were considered significant.
Isolation of Extracellular Vesicles from Keratinocytes
After long-term heat exposure of 48 h, medium was collected and filtered through 40 μm Sterile Cell Strainers (CLS431750, Corning™) to remove dead cells. The supernatant was cleared from cellular components by centrifugation twice at 2500 x g for 15 min at 4°C. The filtrate was then re-filtered through 0.8 µm vacuum filter units (Thermo Fisher Scientific, Waltham, MA, USA). The filtrate was centrifuged in a Sorvall AH-629 rotor at 100,000× g for 12 h, in a Sorvall Ultracentrifuge Machine WX ultra 90 (VWR, Thermo Electron Corporation, Radnor, PA, USA). The supernatant was collected, the pellets were washed using 1× PBS followed by centrifugation at 100,000× g for 2 h, and then were resuspended in 1× PBS.
Nanoparticle Tracking Analysis
To measure the EV number and concentration, nanoparticle tracking analysis (NTA) was performed using a NanoSight NS300 (NanoSight Ltd., Amesbury, UK) equipped with a 405 nm laser. At least four 60 s videos were recorded for each sample, with a camera level of 14 and the detection threshold set at 5. Temperature was monitored throughout the measurements. Videos recorded for each sample were analyzed with NTA software version 3 to determine the concentration and size of measured particles, with the corresponding standard error. For analysis, automatic settings were used for blur, minimum track length and minimum expected particle size. Double-distilled H2O was used to dilute the sample.
Electron Microscopy_ Negative Staining
HaCat cells were fixed in 1 % glutaraldehyde and 4 % formaldehyde mixture in 0.1 M phosphate buffer (pH 7.2) for 10 min. Cells were detached and fixation was continued for 1 hour and stored at +4° C in the fixative. After fixation cells were centrifuged to a pellet, immersed in 2% Agarose in distilled water, and postfixed in 1% osmium tetroxide, dehydrated in acetone, and embedded in Epon LX 112 (Ladd Research Industries, Vermont, USA). Thin sections (70 nm) were cut with Leica Ultracut UCT ultramicrotome, stained using uranyl acetate and lead citrate, and examined in Tecnai G2 Spirit transmission electron microscope (FEI Europe, Eindhoven, The Netherlands) operated at 100 kV. Images were captured with a Quemesa bottom-mounted CCD camera (Olympus Soft Imaging Solutions GMBH, Münster Germany) using Radius software (EMSIS GmbH, Münster, Germany).
Nitrite Concentration Determination
HaCat cells were exposed to heat as explained earlier in the experimental design. Cell lysate was prepared using RIPA buffer (Cell Signaling Technology. Nitrite concentration was determined using a Greiss reagent kit (G7921, Thermo Scientific). The standard nitrite concentration solutions were prepared up to 100 mg. Cell lysate samples and standards were combined with Greiss reagent following the protocol provided with the kit, and incubated for 30 min. After incubation, the absorbance at 544 nm was measured with a spectroscope (Victor V3, Perkin Elmers, Massachusetts, USA). The standard curve was plotted by using nitrite standards and respective absorbance at 544nm. Nitrite concentration in cell lysate was calculated by the corresponding standard curve equation.
Statistical Analysis
All analyses were performed with GraphPad Prism software, version (9.3.1), which was used for the statistical analyses. The two-tailed Student t-test was employed and * P-values less than 0.05 were considered significant.
5. Conclusions
In conclusion, our study focused on the significant impact of heat exposure on cellular dynamics, particularly in the context of high-glucose environments. The concentration of glucose emerged as a critical factor shaping the skin cell reaction to heat exposure, highlighting the metabolites as potential indicators in the cellular responses.
In a broader context, our research highlights a crucial link between specific glucose environments and the skin's adaptive response to heat stress. Emphasizing the role of keratinocytes, our study suggests that cellular responses may trigger preventive mechanisms such as sweat production, aiding in adapting to elevated temperatures under varying glucose conditions. This insight might help in understanding the implications of heat as a therapeutic solution for diabetes via monitoring NO as a novel indicator in skin and sweat.
Authors Contribution
NA and SJ-V created the idea. NA and ST-R designed the experiments. ST-R performed the experiments related to NO concentration and HSP-70 expression. A-IN performed the metabolomics analysis and provided the data. I.M. assessed the mitochondrial morphology via electron microscopy. NA prepared the figures and wrote the paper with the help of ST-R. SV edited the paper. All authors reviewed and edited the paper
Supplementary Materials
The following supporting information can be downloaded at: Preprints.org.
Funding
This work was supported by the Finnish Research Impact Foundation Tandem Industry Academia grant (NA), the European Regional Development Fund project PrintoDise (SV, ST-R), the Infotech Oulu Institute projects (NA, SV), NETSKINMODELS COST Action CA21108 and the Academy of Finland Flagship GeneCellNano (ST-R, NA, SV). The FIMM Metabolomics Unit was supported by HiLIFE and Biocenter Finland (A-IN).
Data Availability Statement
The data sets generated and/or analyzed during the current study are available from the corresponding author on request.
Acknowledgments
We thank J. Kekolahti-Liias and P. Haipus for their excellent technical assistance in the laboratory. We thank Susanna Kosamo for English proofreading of the paper. We also appreciate Mira Mäkelä for her contributions to the project and intellectual support. Additionally, we acknowledge Keerthanaa Balasubramanian Shanthi and Naveed Ahmad for providing the initial protocols for the isolation of extracellular vesicles in cells, which we subsequently modified for our study.
Conflicts of Interest
The authors declare no competing interests that could have appeared to influence the work reported in this paper.
References
- Stone, B. Jr., Mallen, E., Rajput, M., Gronlund, C.J., Broadbent, A.M., Krayenhoff, E.S., Augenbroe, G., O’Neill, M.S., and Georgescu, M. (2021) Compound Climate and Infrastructure Events: How Electrical Grid Failure Alters Heat Wave Risk. Environ. Sci. Technol. 55, 6957–6964.
- Vardoulakis, S., Dear, K., Hajat, S., Heaviside, C., Eggen, B., and McMichael, A.J. (2014) Comparative Assessment of the Effects of Climate Change on Heat- and Cold-Related Mortality in the United Kingdom and Australia. Environ Health Perspect. 122, 1285–1292.
- IPCC_AR6_WGII_SummaryForPolicymakers.pdf [online] https://www.ipcc.ch/report/ar6/wg2/downloads/report/IPCC_AR6_WGII_SummaryForPolicymakers.pdf (Accessed November 2, 2022).
- Gronlund, C.J., Sullivan, K.P., Kefelegn, Y., Cameron, L., and O’Neill, M.S. (2018) Climate change and temperature extremes: A review of heat- and cold-related morbidity and mortality concerns of municipalities. Maturitas. 114, 54–59.
- Galicia-Garcia, U., Benito-Vicente, A., Jebari, S., Larrea-Sebal, A., Siddiqi, H., Uribe, K.B., Ostolaza, H., and Martín, C. (2020) Pathophysiology of Type 2 Diabetes Mellitus. Int J Mol Sci. 21, 6275.
- IDF Diabetes Atlas 7th.pdf [online] https://www.diabetesatlas.org/upload/resources/previous/files/7/IDF%20Diabetes%20Atlas%207th.pdf (Accessed October 30, 2022).
- Kenny, G.P., Sigal, R.J., and McGinn, R. (2016) Body temperature regulation in diabetes. Temperature (Austin). 3, 119–145.
- Cuschieri, S., and Calleja Agius, J. (2021) The interaction between diabetes and climate change – A review on the dual global phenomena. Early Human Development. 155, 105220.
- Xu, Z., Tong, S., Ho, H.C., Lin, H., Pan, H., and Cheng, J. (2022) Associations of heat and cold with hospitalizations and post-discharge deaths due to acute myocardial infarction: What is the role of pre-existing diabetes? International Journal of Epidemiology. 51, 134–143.
- Xu, Z., Tong, S., Cheng, J., Crooks, J.L., Xiang, H., Li, X., Huang, C., and Hu, W. (2019) Heatwaves and diabetes in Brisbane, Australia: A population-based retrospective cohort study. International Journal of Epidemiology. 48, 1091–1100.
- Murota, H., Matsui, S., Ono, E., Kijima, A., Kikuta, J., Ishii, M., and Katayama, I. (2015) Sweat, the driving force behind normal skin: An emerging perspective on functional biology and regulatory mechanisms. Journal of Dermatological Science. 77, 3–10.
- Baker, L.B. (2019) Physiology of sweat gland function: The roles of sweating and sweat composition in human health. Temperature (Austin). 6, 211–259.
- Kennedy, W.R., Sakuta, M., Sutherland, D., and Goetz, F.C. (1984) The sweating deficiency in diabetes mellitus: Methods of quantitation and clinical correlation. Neurology. 34, 758–758.
- Fealey, R.D., Low, P.A., and Thomas, J.E. (1989) Thermoregulatory Sweating Abnormalities in Diabetes Mellitus. Mayo Clinic Proceedings. 64, 617–628.
- Greaney, J.L., Kenney, W.L., and Alexander, L.M. (2016) Sympathetic regulation during thermal stress in human aging and disease. Autonomic Neuroscience. 196, 81–90.
- Carrillo, A.E., Flouris, A.D., Herry, C.L., Poirier, M.P., Boulay, P., Dervis, S., Friesen, B.J., Malcolm, J., Sigal, R.J., Seely, A.J.E., and Kenny, G.P. (2016) Heart rate variability during high heat stress: A comparison between young and older adults with and without Type 2 diabetes. American Journal of Physiology-Regulatory, Integrative and Comparative Physiology. 311, R669–R675.
- Oster, H. (2020) Getting hot about diabetes—Repeated heat exposure improves glucose regulation and insulin sensitivity. Acta Physiologica. 229, e13524.
- Sebők, J., Édel, Z., Dembrovszky, F., Farkas, N., Török, Z., Balogh, G., Péter, M., Papp, I., Balogi, Z., Nusser, N., Péter, I., Hooper, P., Geiger, P., Erőss, B., Wittmann, I., Váncsa, S., Vigh, L., and Hegyi, P. (2022) Effect of HEAT therapy in patiEnts with type 2 Diabetes mellitus (HEATED): Protocol for a randomised controlled trial. BMJ Open. 12, e062122.
- Sebők, J., Édel, Z., Váncsa, S., Farkas, N., Kiss, S., Erőss, B., Török, Z., Balogh, G., Balogi, Z., Nagy, R., Hooper, P.L., Geiger, P.C., Wittmann, I., Vigh, L., Dembrovszky, F., and Hegyi, P. (2021) Heat therapy shows benefit in patients with type 2 diabetes mellitus: A systematic review and meta-analysis. International Journal of Hyperthermia. 38, 1650–1659.
- Hooper, P.L., Balogh, G., Rivas, E., Kavanagh, K., and Vigh, L. (2014) The importance of the cellular stress response in the pathogenesis and treatment of type 2 diabetes. Cell Stress and Chaperones. 19, 447–464.
- Bathaie, S.Z., Jafarnejad, A., Hosseinkhani, S., and Nakhjavani, M. (2010) The effect of hot-tub therapy on serum Hsp70 level and its benefit on diabetic rats: A preliminary report. International Journal of Hyperthermia. 26, 577–585.
- Henstridge, D.C., Bruce, C.R., Drew, B.G., Tory, K., Kolonics, A., Estevez, E., Chung, J., Watson, N., Gardner, T., Lee-Young, R.S., Connor, T., Watt, M.J., Carpenter, K., Hargreaves, M., McGee, S.L., Hevener, A.L., and Febbraio, M.A. (2014) Activating HSP72 in Rodent Skeletal Muscle Increases Mitochondrial Number and Oxidative Capacity and Decreases Insulin Resistance. Diabetes. 63, 1881–1894.
- Molina, M.N., Ferder, L., and Manucha, W. (2015) Emerging Role of Nitric Oxide and Heat Shock Proteins in Insulin Resistance. Curr Hypertens Rep. 18, 1.
- Hooper, P.L. (2003) Diabetes, Nitric Oxide, and Heat Shock Proteins. Diabetes Care. 26, 951–952.
- Lundberg, J.O., and Weitzberg, E. (2022) Nitric oxide signaling in health and disease. Cell. 185, 2853–2878.
- Jobgen, W.S., Fried, S.K., Fu, W.J., Meininger, C.J., and Wu, G. (2006) Regulatory role for the arginine–nitric oxide pathway in metabolism of energy substrates. The Journal of Nutritional Biochemistry. 17, 571–588.
- Adler, B.L., and Friedman, A.J. (2015) Nitric oxide therapy for dermatologic disease. Future Sci OA. 1, FSO37.
- Daniela, B.-G., Thomas, R., and Kolb-Bachofen, V. (1998) Nitric Oxide in Human Skin: Current Status and Future Prospects. J Invest Dermatol. 110, 1–7.
- Cals-Grierson, M.-M., and Ormerod, A.D. (2004) Nitric oxide function in the skin. Nitric Oxide. 10, 179–193.
- Andrabi, S.M., Sharma, N.S., Karan, A., Shahriar, S.M.S., Cordon, B., Ma, B., and Xie, J. (2023) Nitric Oxide: Physiological Functions, Delivery, and Biomedical Applications. Adv Sci (Weinh). 10, 2303259.
- Arany, I., Brysk, M.M., Brysk, H., and Tyring, S.K. (1996) Regulation of Inducible Nitric Oxide Synthase mRNA Levels by Differentiation and Cytokines in Human Keratinocytes. Biochemical and Biophysical Research Communications. 220, 618–622.
- Cinelli, M.A., Do, H.T., Miley, G.P., and Silverman, R.B. (2020) Inducible nitric oxide synthase: Regulation, structure, and inhibition. Med Res Rev. 40, 158–189.
- Joshi, M.S., Ponthier, J.L., and Lancaster, J.R. (1999) Cellular antioxidant and pro-oxidant actions of nitric oxide. Free Radical Biology and Medicine. 27, 1357–1366.
- Kim, J.Y., Han, Y., Lee, J.E., and Yenari, M.A. (2018) The 70-kDa heat shock protein (Hsp70) as a therapeutic target for stroke. Expert Opin Ther Targets. 22, 191–199.
- Havalová, H., Ondrovičová, G., Keresztesová, B., Bauer, J.A., Pevala, V., Kutejová, E., and Kunová, N. (2021) Mitochondrial HSP70 Chaperone System—The Influence of Post-Translational Modifications and Involvement in Human Diseases. International Journal of Molecular Sciences. 22, 8077.
- Hooper, P.L., and Hooper, P.L. (2009) Inflammation, heat shock proteins, and type 2 diabetes. Cell Stress and Chaperones. 14, 113–115.
- Bathaie, S.Z., Jafarnejad, A., Hosseinkhani, S., and Nakhjavani, M. (2010) The effect of hot-tub therapy on serum Hsp70 level and its benefit on diabetic rats: A preliminary report. Int J Hyperthermia. 26, 577–585.
- Scieglinska, D., Krawczyk, Z., Sojka, D.R., and Gogler-Pigłowska, A. (2019) Heat shock proteins in the physiology and pathophysiology of epidermal keratinocytes. Cell Stress and Chaperones. 24, 1027–1044.
- Rahat, S.T., Mäkelä, M., Nasserinejad, M., Ikäheimo, T.M., Hyrkäs-Palmu, H., Valtonen, R.I.P., Röning, J., Sebert, S., Nieminen, A.I., Ali, N., and Vainio, S. (2023) Clinical-Grade Patches as a Medium for Enrichment of Sweat-Extracellular Vesicles and Facilitating Their Metabolic Analysis. International Journal of Molecular Sciences. 24, 7507.
- Lin, Y., Chen, L., Zhang, M., Xie, S., Du, L., Zhang, X., and Li, H. (2021) Eccrine Sweat Gland and Its Regeneration: Current Status and Future Directions. Front Cell Dev Biol. 9, 667765.
- Chen, R., Zhu, Z., Ji, S., Geng, Z., Hou, Q., Sun, X., and Fu, X. (2020) Sweat gland regeneration: Current strategies and future opportunities. Biomaterials. 255, 120201.
- Fu, X., Li, J., Sun, X., Sun, T., and Sheng, Z. (2005) Epidermal stem cells are the source of sweat glands in human fetal skin: Evidence of synergetic development of stem cells, sweat glands, growth factors, and matrix metalloproteinases. Wound Repair Regen. 13, 102–108.
- Ali, N., Rahat, S.T., Mäkelä, M., Nasserinejad, M., Jaako, T., Kinnunen, M., Schroderus, J., Tulppo, M., Nieminen, A.I., and Vainio, S. (2023) Metabolic patterns of sweat-extracellular vesicles during exercise and recovery states using clinical grade patches. Front Physiol. 14, 1295852.
- Weller, R., Pattullo, S., Smith, L., Golden, M., Ormerod, A., and Benjamin, N. (1996) Nitric Oxide Is Generated on the Skin Surface by Reduction of Sweat Nitrate. Journal of Investigative Dermatology. 107, 327–331.
- Saibil, H. (2013) Chaperone machines for protein folding, unfolding and disaggregation. Nat Rev Mol Cell Biol. 14, 630–642.
- Hartl, F.U., Bracher, A., and Hayer-Hartl, M. (2011) Molecular chaperones in protein folding and proteostasis. Nature. 475, 324–332.
- Kampinga, H.H., and Craig, E.A. (2010) The Hsp70 chaperone machinery: J-proteins as drivers of functional specificity. Nat Rev Mol Cell Biol. 11, 579–592.
- Johnson, T.A., Jinnah, H.A., and Kamatani, N. (2019) Shortage of Cellular ATP as a Cause of Diseases and Strategies to Enhance ATP. Front Pharmacol. 10, 98.
- Farthing, D.E., Farthing, C.A., and Xi, L. (2015) Inosine and hypoxanthine as novel biomarkers for cardiac ischemia: From bench to point-of-care. Exp Biol Med (Maywood). 240, 821–831.
- Fujiwara, M., Sato, N., and Okamoto, K. (2022) Hypoxanthine Reduces Radiation Damage in Vascular Endothelial Cells and Mouse Skin by Enhancing ATP Production via the Salvage Pathway. rare. 197, 583–593.
- Wu, W., Song, Y., Sun, M., Li, Y., Xu, Y., Xu, M., Yang, Y., Li, S., and Zhang, F. (2023) Corneal metabolic biomarkers for moderate and high myopia in human. Experimental Eye Research. 237, 109689.
- Gupte, A.A., Bomhoff, G.L., Swerdlow, R.H., and Geiger, P.C. (2009) Heat Treatment Improves Glucose Tolerance and Prevents Skeletal Muscle Insulin Resistance in Rats Fed a High-Fat Diet. Diabetes. 58, 567–578.
- Yang, J., Yin, P., Zhou, M., Ou, C.-Q., Li, M., Liu, Y., Gao, J., Chen, B., Liu, J., Bai, L., and Liu, Q. (2016) The effect of ambient temperature on diabetes mortality in China: A multi-city time series study. Science of The Total Environment. 543, 75–82.
- Hier, S.W., Cornbleet, T., and Bergeim, O. (1946) THE AMINO ACIDS OF HUMAN SWEAT. Journal of Biological Chemistry. 166, 327–333.
- Abu-Soud, H.M., Gachhui, R., Raushel, F.M., and Stuehr, D.J. (1997) The Ferrous-dioxy Complex of Neuronal Nitric Oxide Synthase: DIVERGENT EFFECTS OF l-ARGININE AND TETRAHYDROBIOPTERIN ON ITS STABILITY*. Journal of Biological Chemistry. 272, 17349–17353.
- Shimizu, Y., Sakai, M., Umemura, Y., and Ueda, H. (1997) Immunohistochemical Localization of Nitric Oxide Synthase in Normal Human Skin: Expression of Endothelial-type and Inducible-type Nitric Oxide Synthase in Keratinocytes. The Journal of Dermatology. 24, 80–87.
- Welch, G., Foote, K.M., Hansen, C., and Mack, G.W. (2009) Nonselective NOS inhibition blunts the sweat response to exercise in a warm environment. J Appl Physiol (1985). 106, 796–803.
- Lee, K., and Mack, G.W. (2006) Role of nitric oxide in methacholine-induced sweating and vasodilation in human skin. Journal of Applied Physiology. 100, 1355–1360.
- Stapleton, J.M., Fujii, N., Carter, M., and Kenny, G.P. (2014) Diminished nitric oxide-dependent sweating in older males during intermittent exercise in the heat. Experimental Physiology. 99, 921–932.
- Kurucz, I., Morva, Á., Vaag, A., Eriksson, K.-F., Huang, X., Groop, L., and Koranyi, L. (2002) Decreased Expression of Heat Shock Protein 72 In Skeletal Muscle of Patients With Type 2 Diabetes Correlates With Insulin Resistance. Diabetes. 51, 1102–1109.
- Pallubinsky, H., Phielix, E., Dautzenberg, B., Schaart, G., Connell, N.J., de Wit-Verheggen, V., Havekes, B., van Baak, M.A., Schrauwen, P., and van Marken Lichtenbelt, W.D. (2020) Passive exposure to heat improves glucose metabolism in overweight humans. Acta Physiol (Oxf). 229, e13488.
- Liu, Y., Billiet, J., Ebenezer, G.J., Pan, B., Hauer, P., Wei, J., and Polydefkis, M. (2015) Factors influencing sweat gland innervation in diabetes. Neurology. 84, 1652–1659.
- Becerra-Tomás, N., Estruch, R., Bulló, M., Casas, R., Díaz-López, A., Basora, J., Fitó, M., Serra-Majem, L., and Salas-Salvadó, J. (2014) Increased Serum Calcium Levels and Risk of Type 2 Diabetes in Individuals at High Cardiovascular Risk. Diabetes Care. 37, 3084–3091.
- Sun, G., Vasdev, S., Martin, G.R., Gadag, V., and Zhang, H. (2005) Altered Calcium Homeostasis Is Correlated With Abnormalities of Fasting Serum Glucose, Insulin Resistance, and β-Cell Function in the Newfoundland Population. Diabetes. 54, 3336–3339.
- Zhu, J., Xun, P., Bae, J.C., Kim, J.H., Kim, D.J., Yang, K., and He, K. (2019) Circulating calcium levels and the risk of type 2 diabetes: A systematic review and meta-analysis. British Journal of Nutrition. 122, 376–387.
- Mack, G.W., Smith, B.S., and Rowland, B. (2019) TEA-sensitive K + channels and human eccrine sweat gland output. Journal of Applied Physiology. 127, 921–929.
- Mack, G.W. (2020) Role of nitric oxide synthase in human sweat gland output. J Appl Physiol (1985). 129, 386–391.
- Shamsuddin, A.K.M., Reddy, M.M., and Quinton, P.M. (2008) Iontophoretic β-adrenergic stimulation of human sweat glands: Possible assay for cystic fibrosis transmembrane conductance regulator activity in vivo. Experimental Physiology. 93, 969–981.
- Giorgi, C., De Stefani, D., Bononi, A., Rizzuto, R., and Pinton, P. (2009) Structural and functional link between the mitochondrial network and the endoplasmic reticulum. Int J Biochem Cell Biol. 41, 1817–1827.
- Rieusset, J. (2018) The role of endoplasmic reticulum-mitochondria contact sites in the control of glucose homeostasis: An update. Cell Death Dis. 9, 388.
- Fieni, F., Lee, S.B., Jan, Y.N., and Kirichok, Y. (2012) Activity of the mitochondrial calcium uniporter varies greatly between tissues. Nat Commun. 3, 1317.
- Marchi, S., Patergnani, S., Missiroli, S., Morciano, G., Rimessi, A., Wieckowski, M.R., Giorgi, C., and Pinton, P. (2018) Mitochondrial and endoplasmic reticulum calcium homeostasis and cell death. Cell Calcium. 69, 62–72.
- Ali, N., Rezvani, H.R., Motei, D., Suleman, S., Mahfouf, W., Marty, I., Ronkainen, V.-P., and Vainio, S.J. (2020) Trisk 95 as a novel skin mirror for normal and diabetic systemic glucose level. Sci Rep. 10, 12246.
- D’Autréaux, B., and Toledano, M.B. (2007) ROS as signalling molecules: Mechanisms that generate specificity in ROS homeostasis. Nat Rev Mol Cell Biol. 8, 813–824.
- Bandeira, S. de M., da Fonseca, L.J.S., Guedes, G. da S., Rabelo, L.A., Goulart, M.O.F., and Vasconcelos, S.M.L. (2013) Oxidative Stress as an Underlying Contributor in the Development of Chronic Complications in Diabetes Mellitus. Int J Mol Sci. 14, 3265–3284.
- Giacco, F., and Brownlee, M. (2010) Oxidative stress and diabetic complications. Circ Res. 107, 1058–1070.
Figure 1.
Metabolic composition of keratinocytes upon acute heat exposure. (A) Schematic representation of the experimental methodology. (B–G) Metabolite levels of arginine (B), uracil (C), valine (D), leucine (E), serine (F), and lactate (G) in high glucose- versus low glucose- maintained cells upon 90 min of heat exposure. Data are metabolite peak area fold changes ± SEM after normalization to the cell number and compared to control cells. Two-tailed Student’s t-test was used. *P < 0.05.1.1. Acute and chronic heat exposures alter NO levels in HaCat cells.
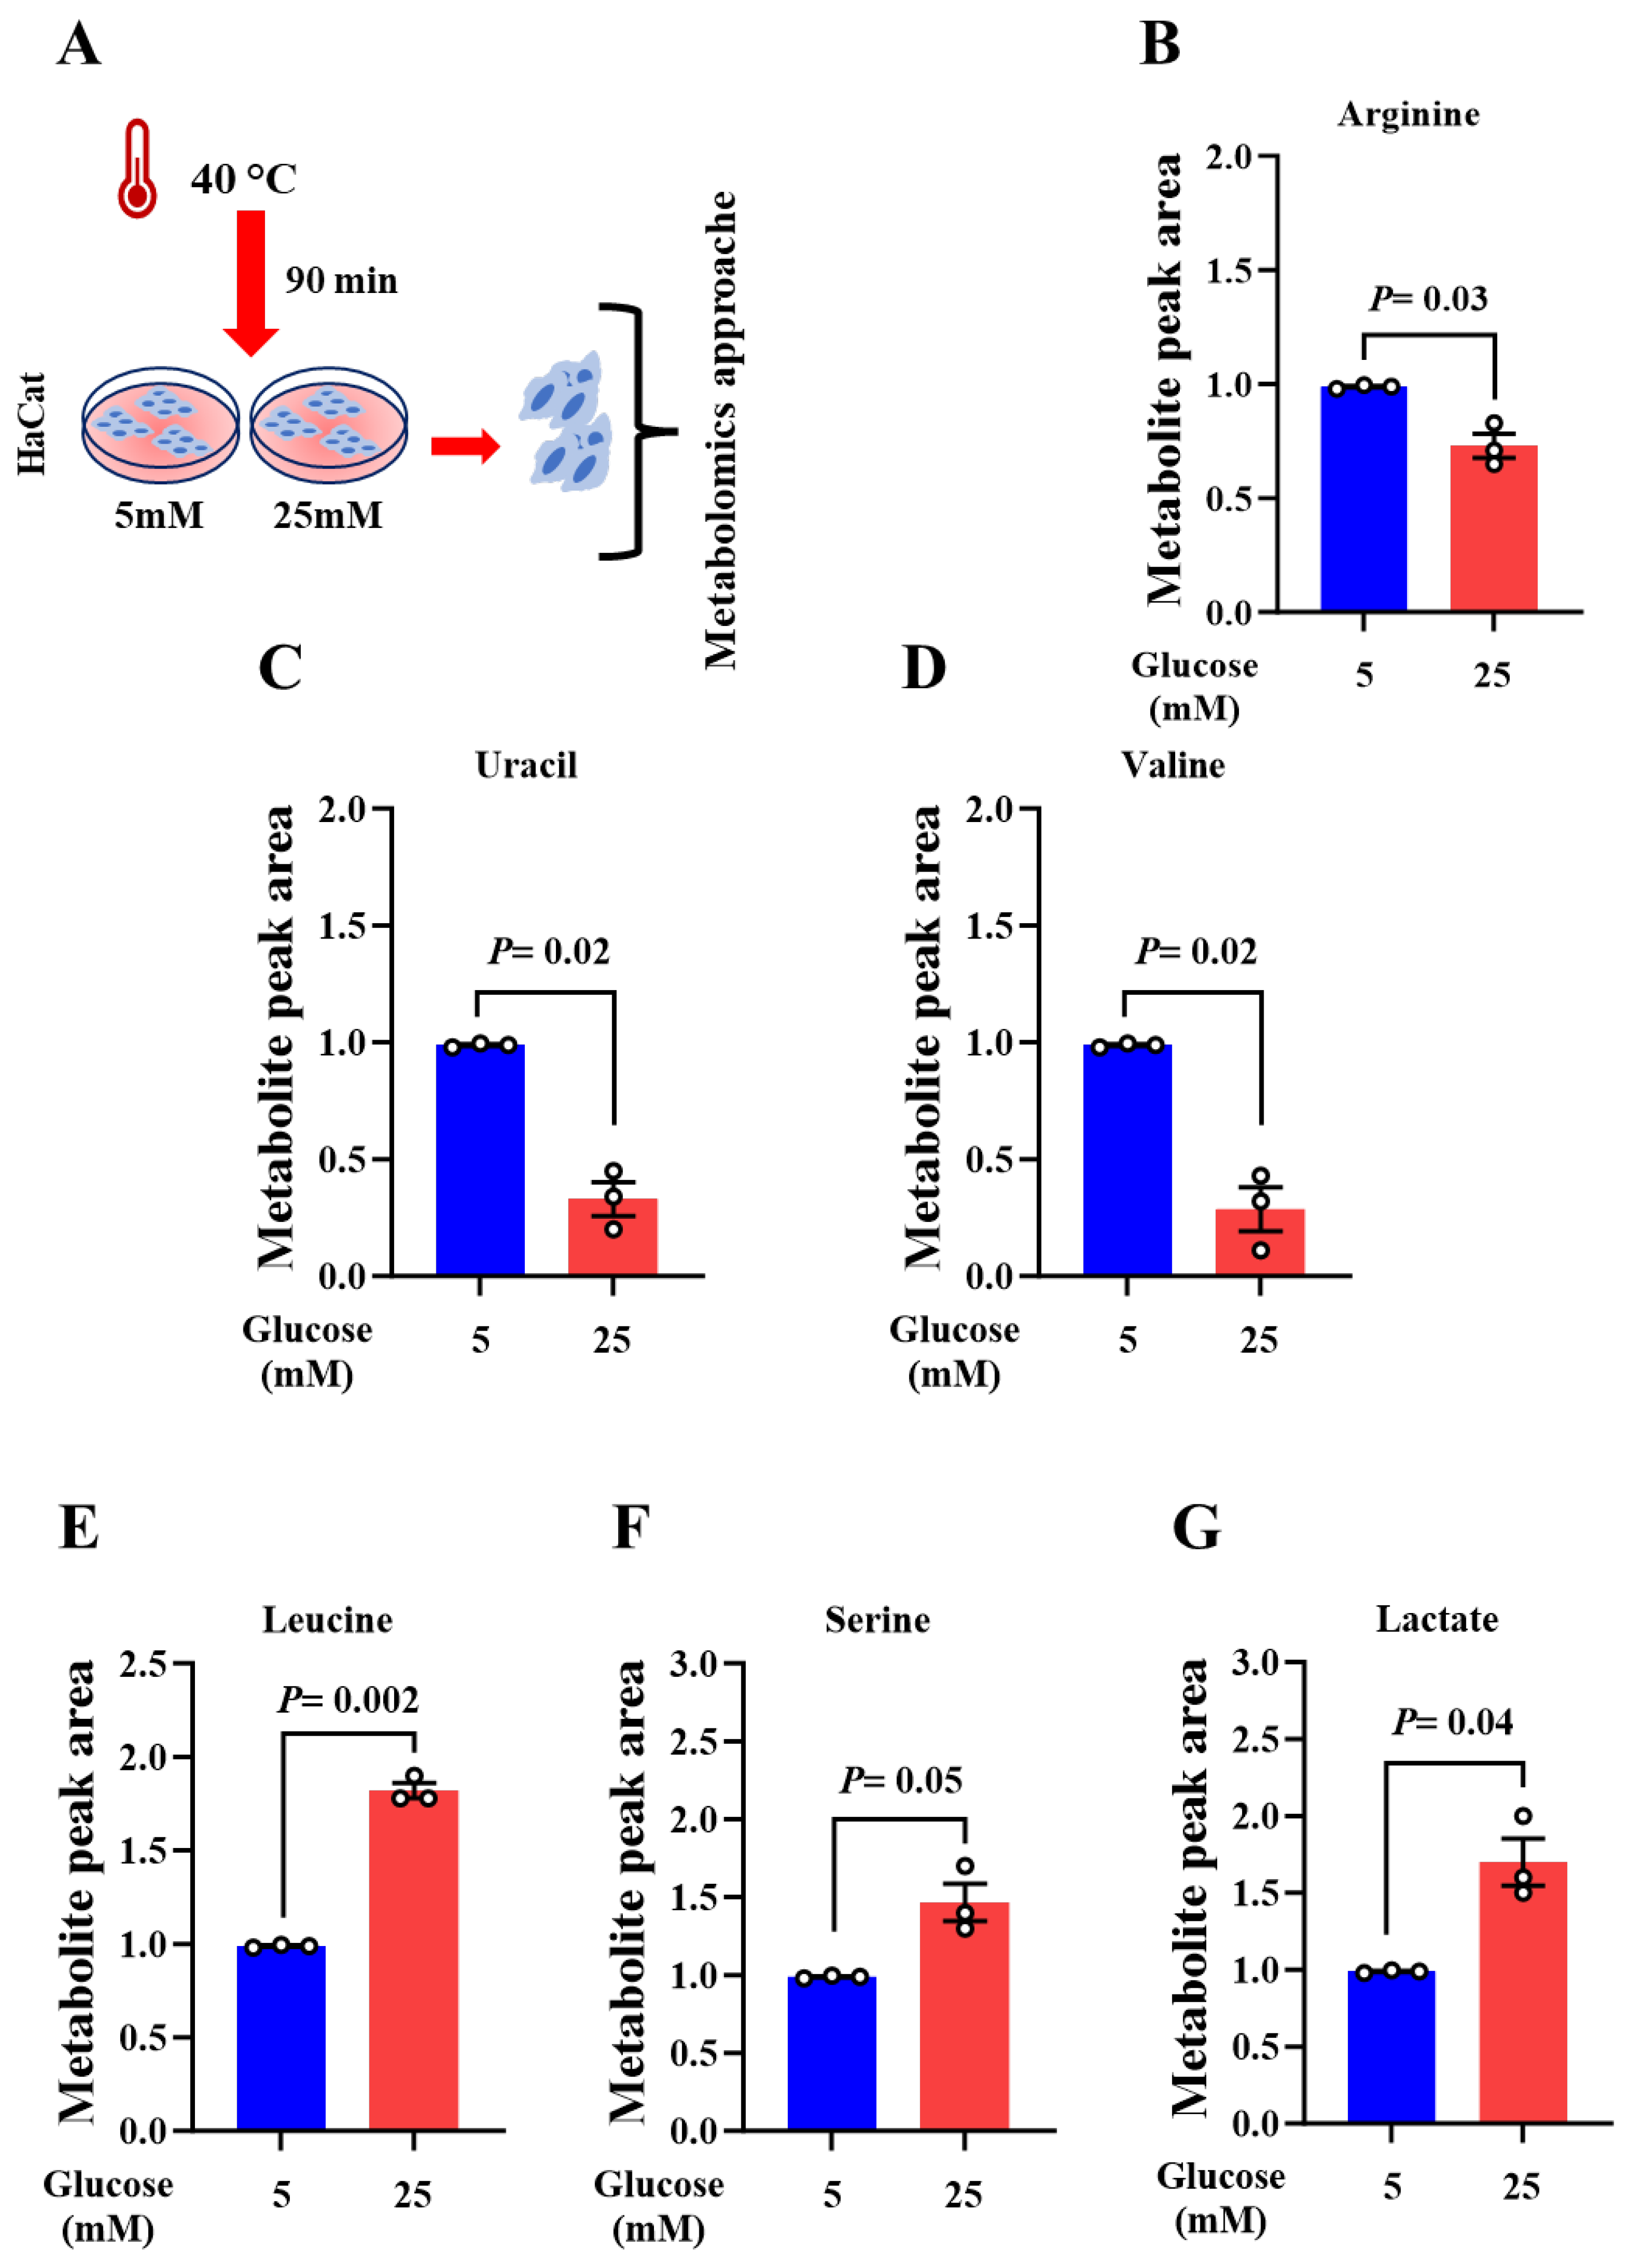
Figure 2.
Nitric oxide is a new target of acute and chronic heat exposure in high glucose-maintained keratinocytes. (A) Metabolite level of arginine in HaCat cells that were grown at 37°C in presence of low and high glucose conditions. (B) Schematic representation of the experimental methodology. (C) Nitrate concentration in low- and high glucose-maintained HaCat upon acute heat exposure during 90min. (D) NO concentration in low- and high glucose-maintained HaCat upon chronic heat exposure during 48min. The results are average after normalization to protein concentration and to the control ± SEM in three separate experiments. (E) Schematic representation of the experimental methodology. (F. NO concentration in EVs isolated from the cells maintained in low- and high glucose-maintained following 48 h of heat exposure. Data are average after normalization to EVs concentration ± SEM in three independent experiments. Two-tailed Student’s t-test was used. *P < 0.05.
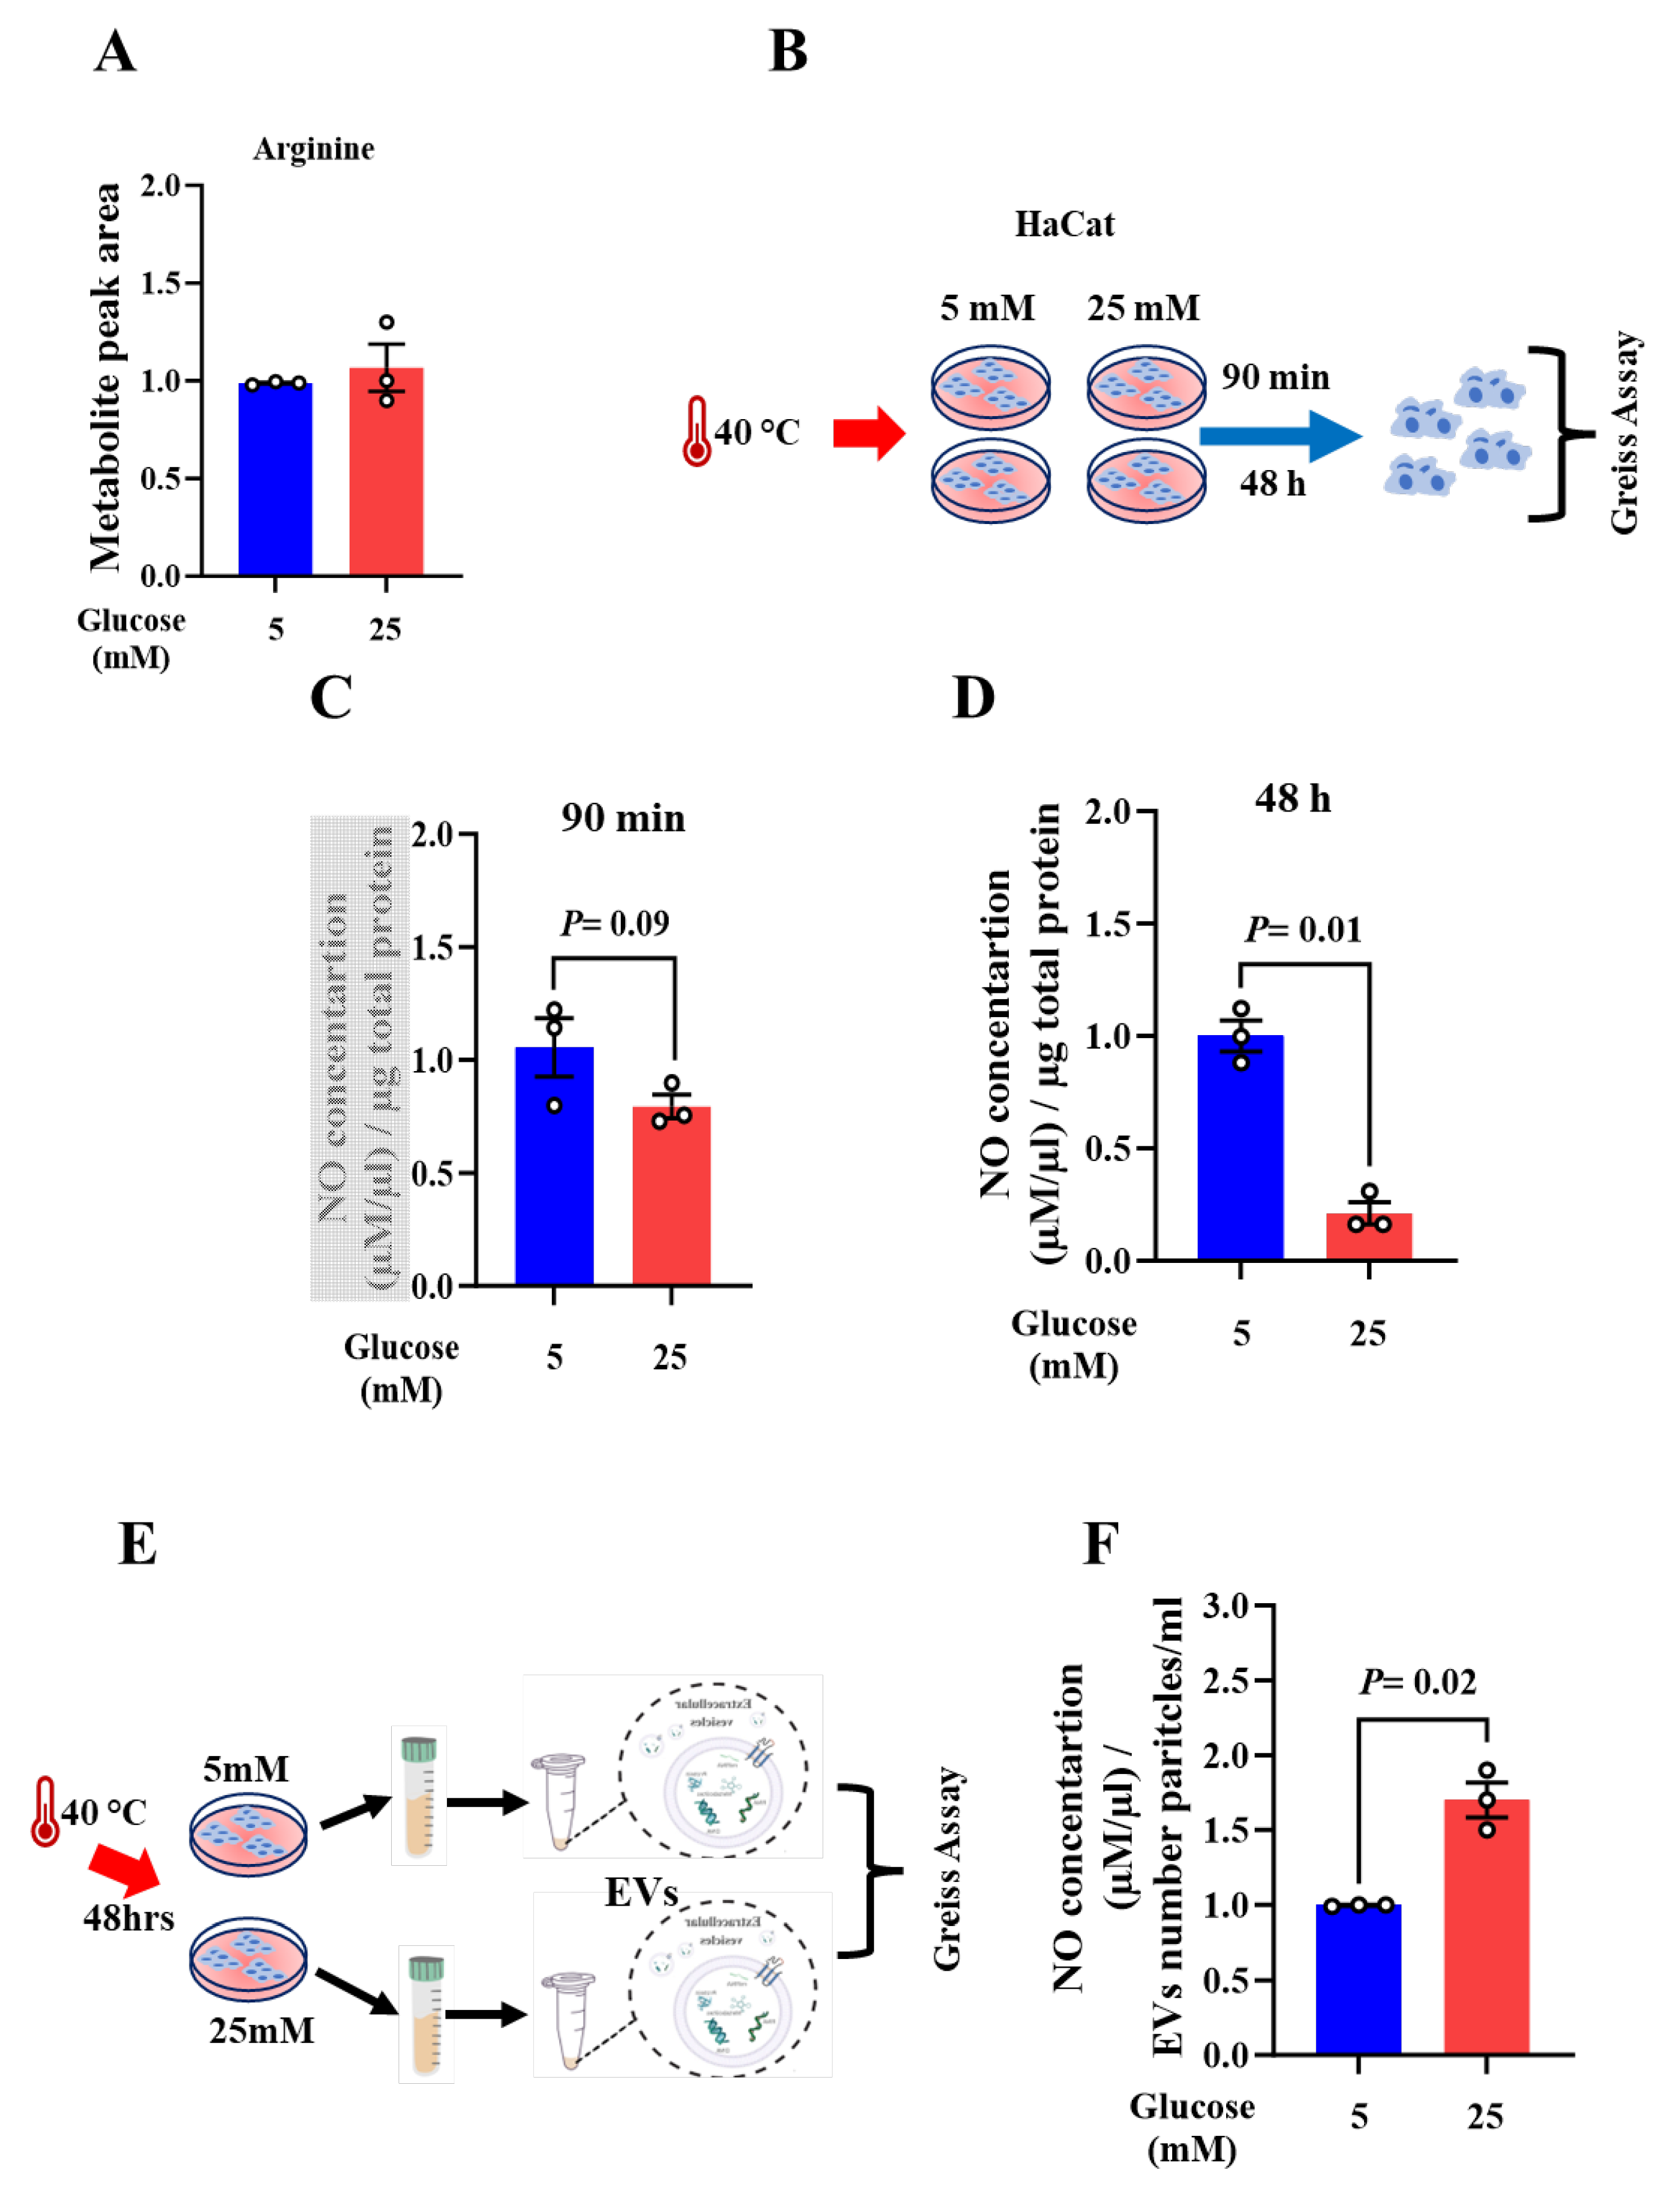
Figure 3.
HSP-70 protein is altered upon acute and chronic heat exposures. (A) Schematic representation of the experimental methodology. (B) Western blotting analysis of HSP-70 in HaCat upon acute heat exposure for 90 min. (C) Quantification of HSP-70 protein expression levels upon acute heat exposure during 90min. The results are shown as averages after normalization to the control ± SEM in three separate experiments. β-actin was used as a loading control. (D) Western blotting analysis of HSP-70 in HaCat following 48 h of heat exposure. (E) Quantification of HSP-70 protein expression levels upon chronic heat exposure during 48 h. The results are shown as averages after normalization to the control ± SEM in three separate experiments. β-actin was used as a loading control. (F) Metabolite level of hypoxanthine upon acute heat exposure during 90min. Two-tailed Student’s t-test was used. *P < 0.05.
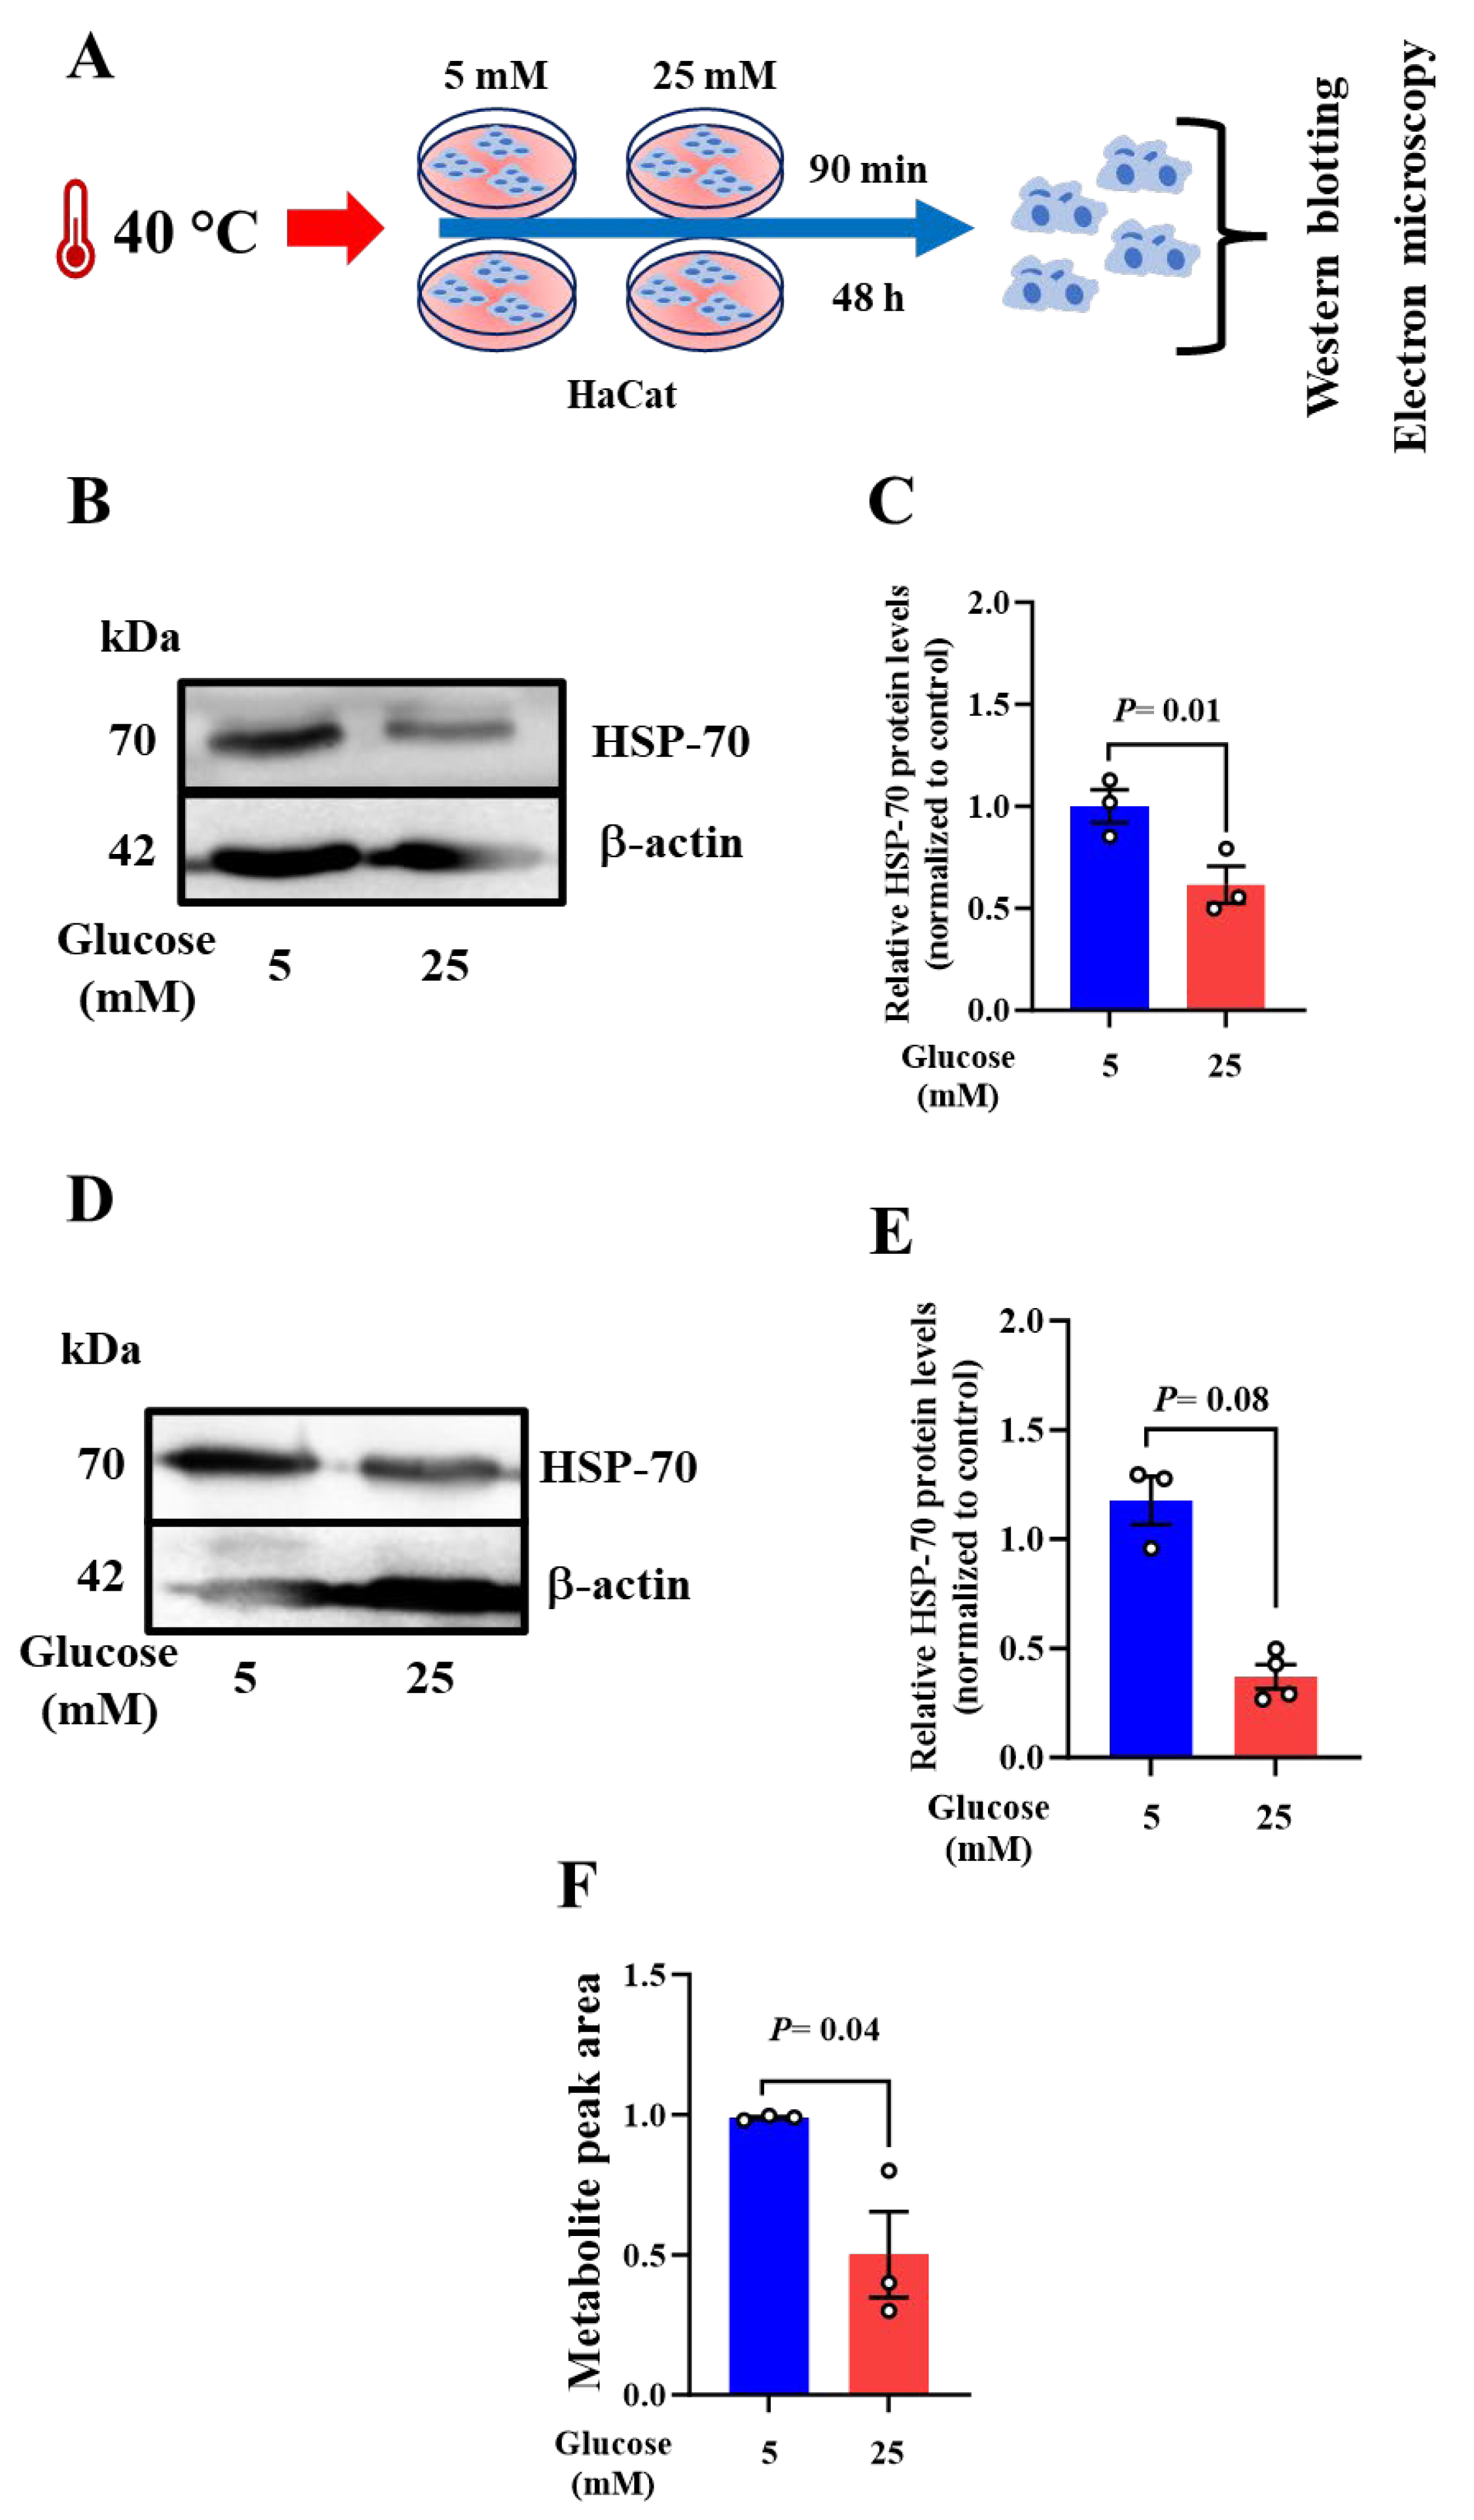
Figure 4.
Keratinocytes exhibit a specific mitochondrial phenotype upon acute heat exposure. Acute heat exposure leads to an abnormal mitochondrial phenotype (swollen and enormous, round in shape, disarrangement of the cristae accompanied by partially or totally electron-lucent matrix) (black dotted rectangle). In 25mM maintained cells, however, normal mitochondria of different shapes (elongated or round) with well-arranged cristae and electron dense were observed (black dotted rectangle). Scale bar = 500µm.
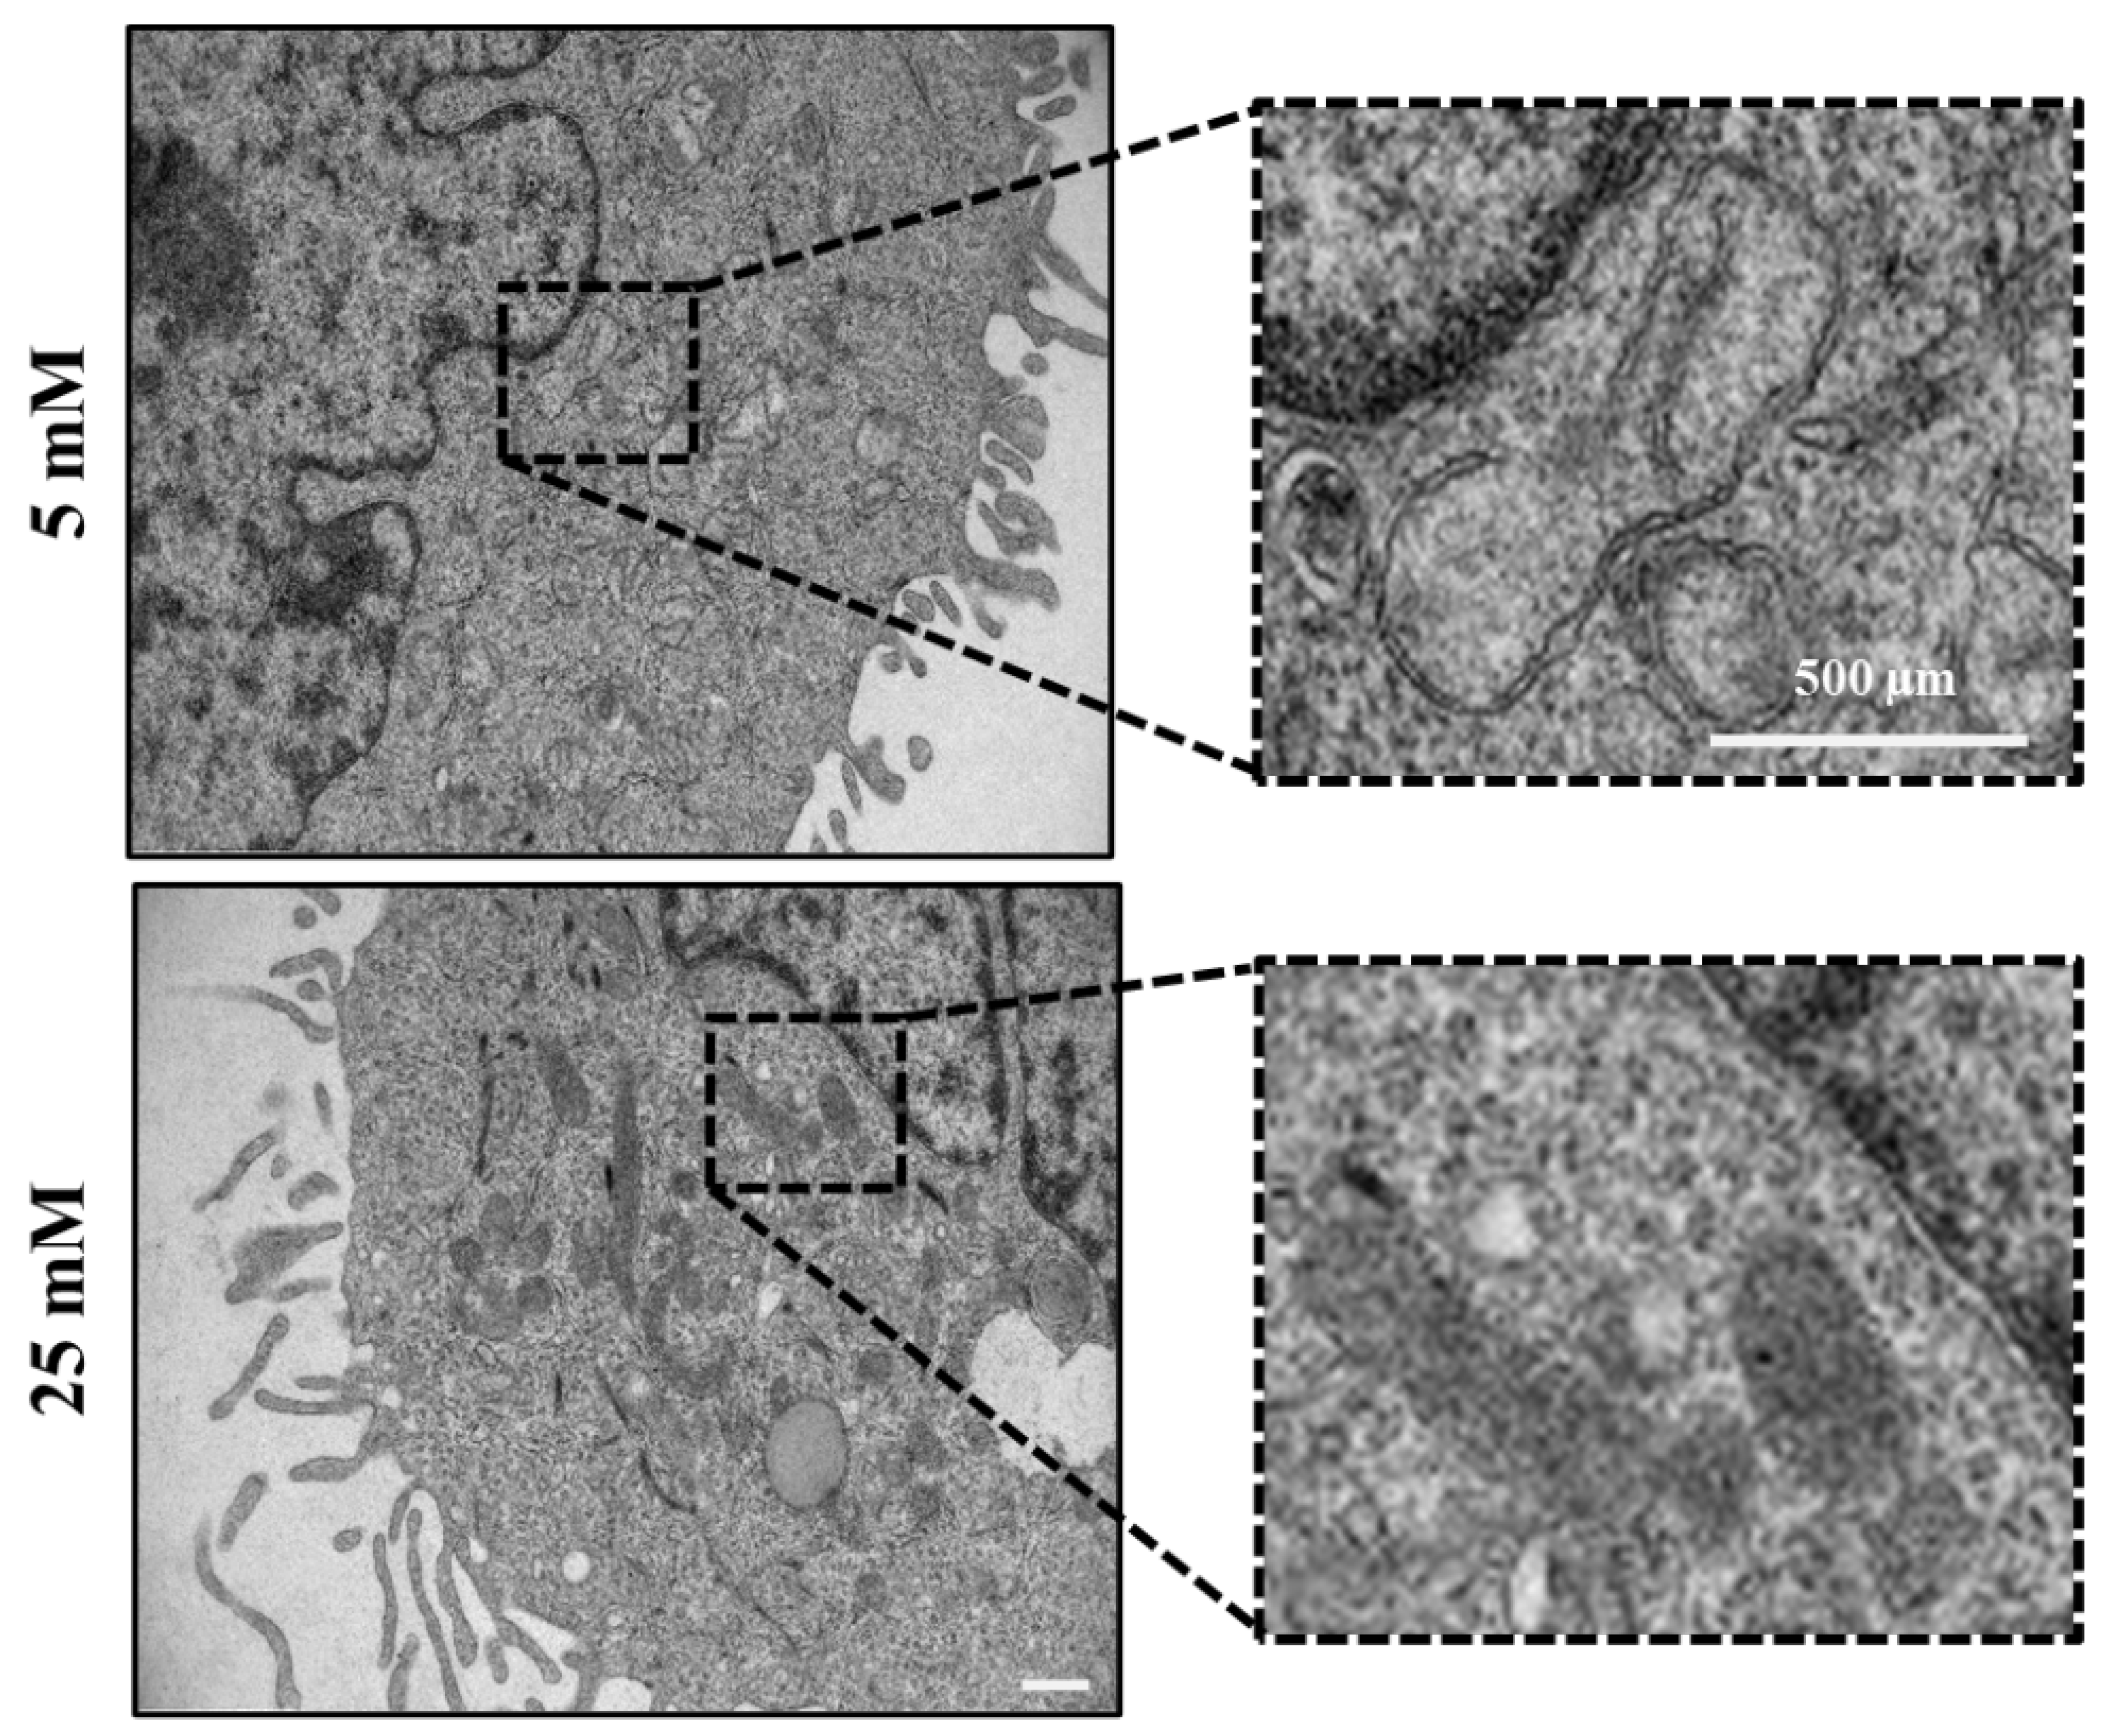
Figure 5.
Repetitive heat exposure positively influences keratinocytes responses in high glucose conditions. (A) Schematic representation of the experimental methodology. (B) Nitrate concentration in low- and high glucose-maintained HaCat upon repetitive heat exposure. The results are average after normalization to protein concentration and to the control ± SEM in three separate experiments. (C) Western blotting analysis of HSP-70 in HaCat upon acute heat exposure for 90 min. (D) Quantification of HSP-70 protein expression levels upon acute heat exposure during 90min. The results are shown as averages after normalization to the control ± SEM in three separate experiments. β-actin was used as a loading control. Two-tailed Student’s t-test was used. *P < 0.05.
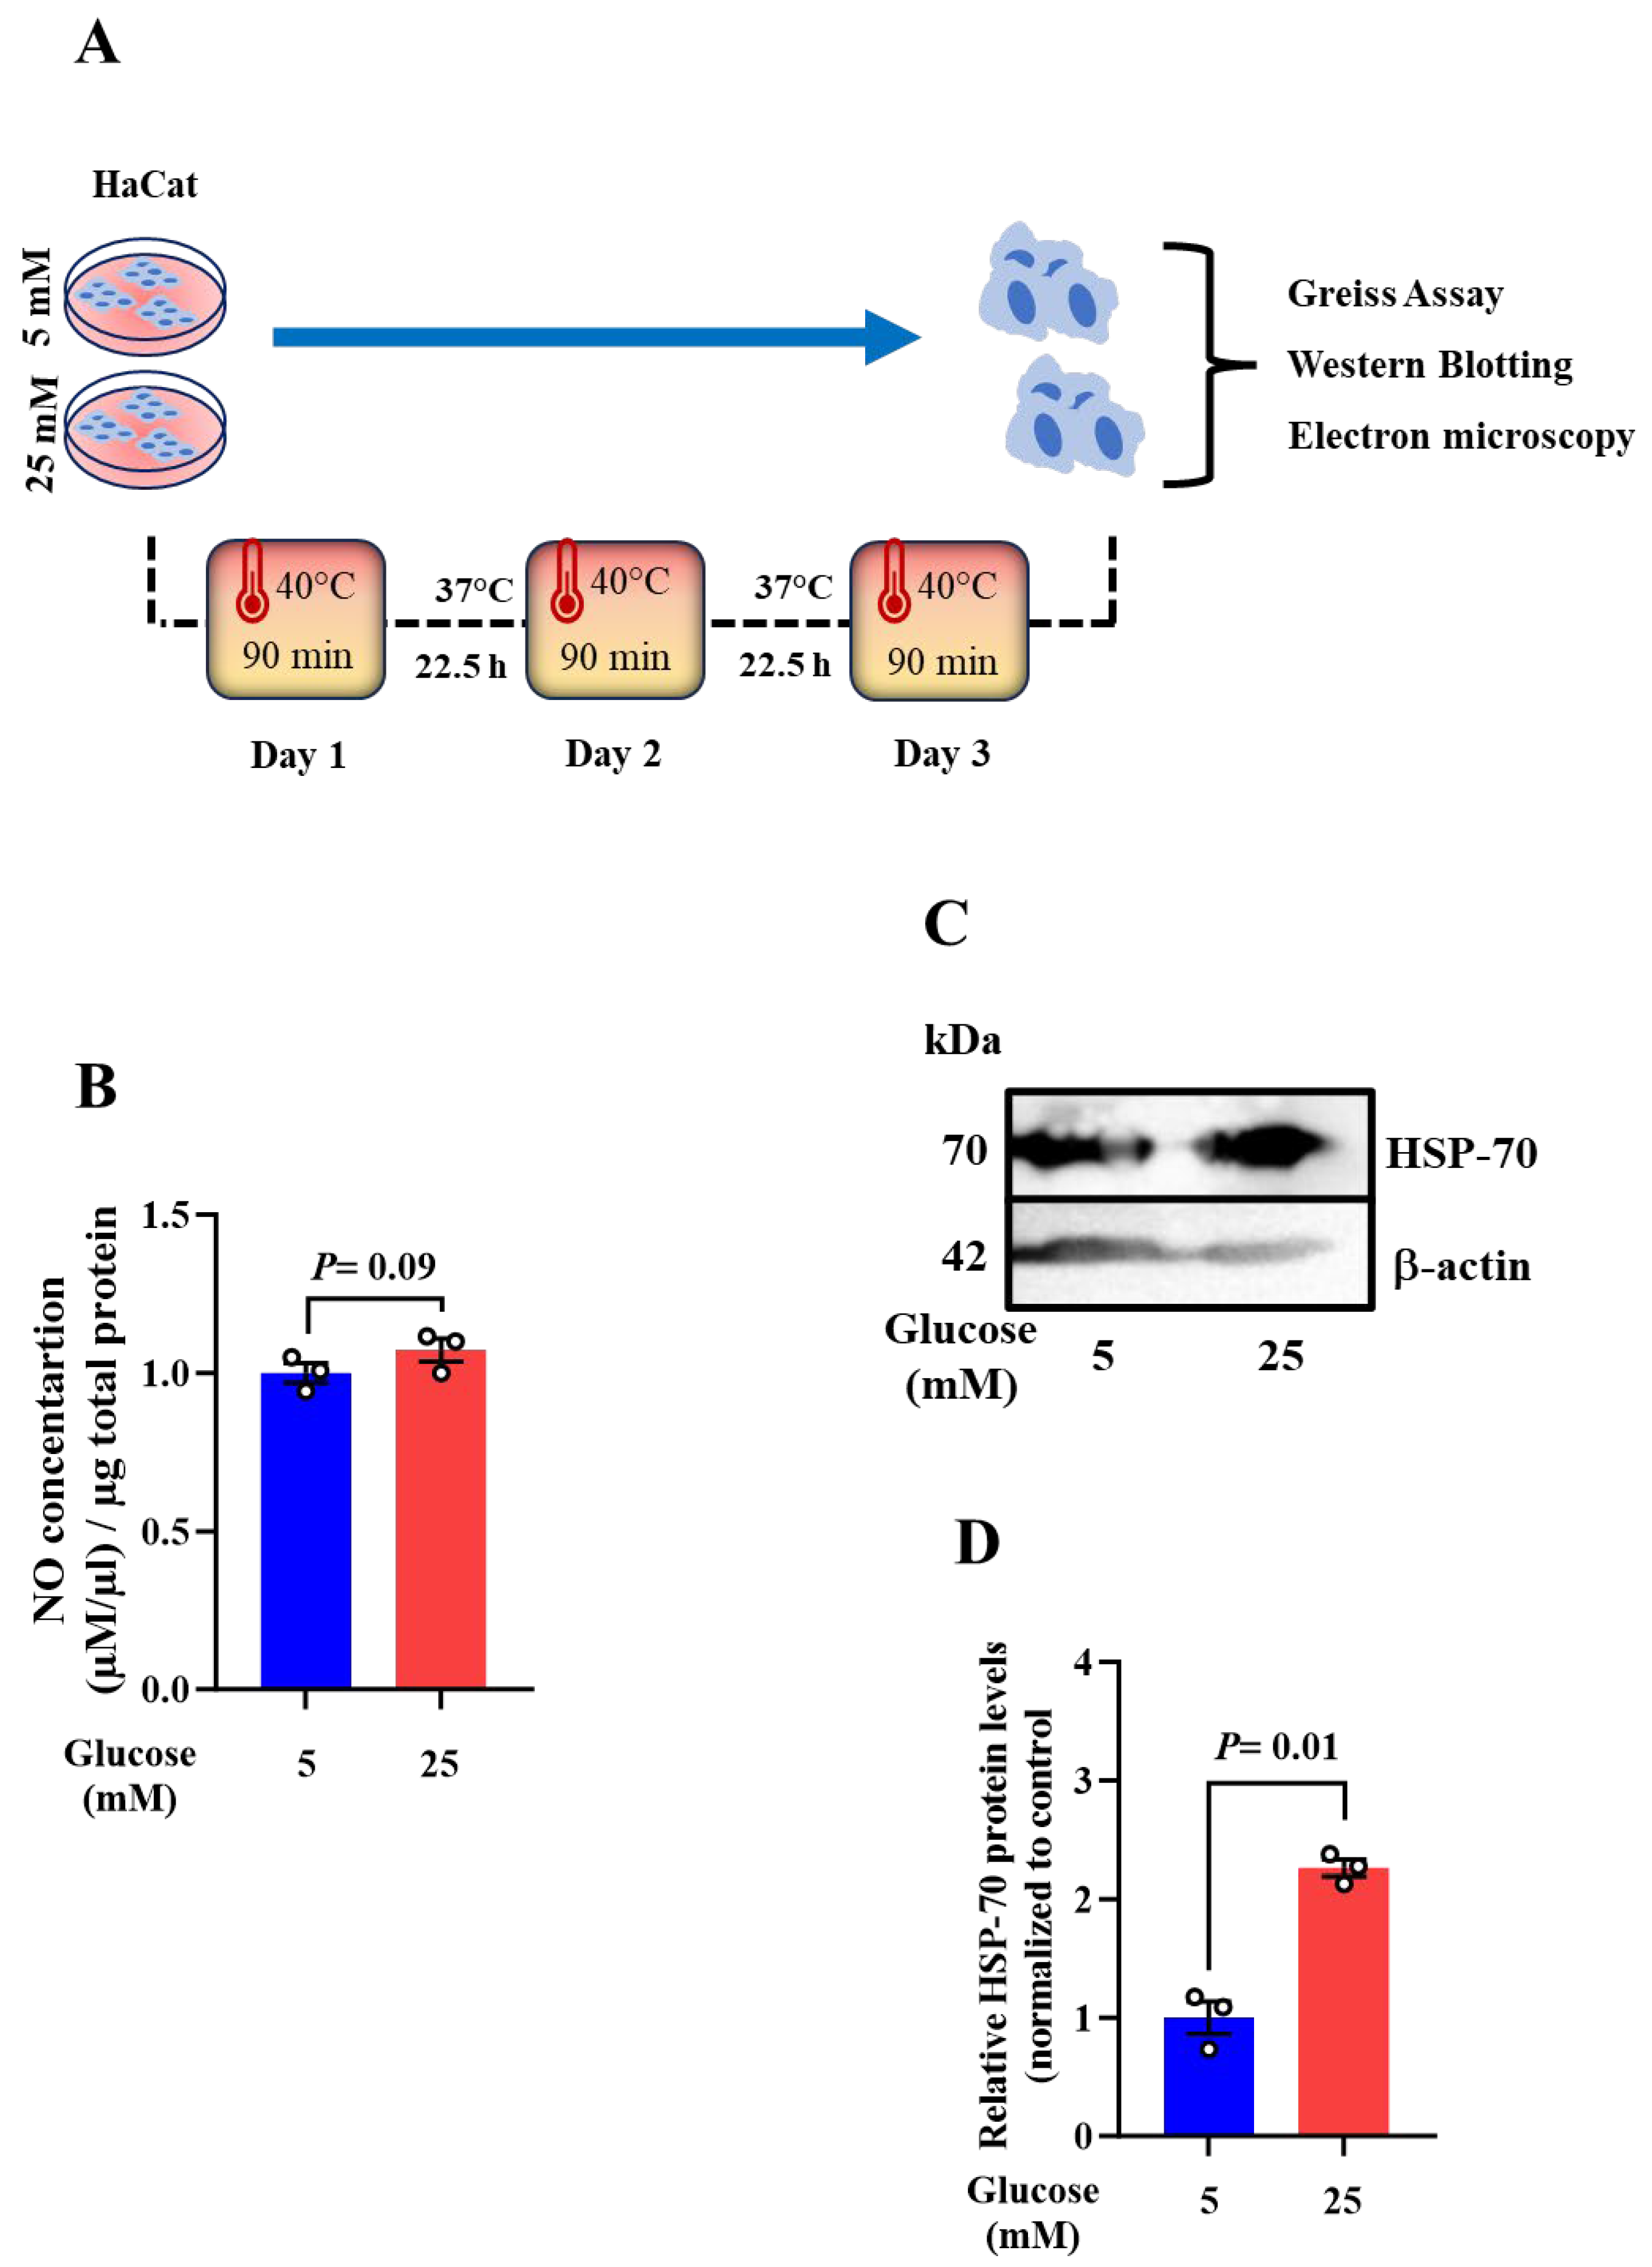
Figure 6.
Keratinocytes exhibit a specific mitochondrial phenotype upon repetitive heat exposure. Repetitive heat exposure leads to an abnormal mitochondrial phenotype (swollen and enormous, round in shape, disarrangement of the cristae accompanied by partially or totally electron-lucent matrix) (black dotted rectangle) in both 5- and 25mM maintained cells. Scale bar = 500 µm.
Disclaimer/Publisher’s Note: The statements, opinions and data contained in all publications are solely those of the individual author(s) and contributor(s) and not of MDPI and/or the editor(s). MDPI and/or the editor(s) disclaim responsibility for any injury to people or property resulting from any ideas, methods, instructions or products referred to in the content. |
© 2024 by the authors. Licensee MDPI, Basel, Switzerland. This article is an open access article distributed under the terms and conditions of the Creative Commons Attribution (CC BY) license (http://creativecommons.org/licenses/by/4.0/).
Copyright: This open access article is published under a Creative Commons CC BY 4.0 license, which permit the free download, distribution, and reuse, provided that the author and preprint are cited in any reuse.


