
Submitted:
30 May 2024
Posted:
31 May 2024
You are already at the latest version
Abstract
In this work, we introduce the design a 16-channel in-pixel neural analog front-end which employs a current-based summing approach to establish a common-mode feedback loop. The primary aim of this novel structure is to enhance both the system common-mode rejection ratio (SCMRR) and the common-mode interference (CMI) range. Compared to more conventional designs, the hereby proposed front-end utilizes DC-coupled inverter-based main amplifiers, which significantly reduce the occupied on-chip area. Additionally, the current-based implementation of the CMFB loop obviates the need for voltage buffers, replacing them with simple common-gate transistors and in turn decreasing both area occupancy and power consumption. The proposed architecture is further examined from an analytical standpoint, providing a comprehensive evaluation through design equations of its performance in terms of gain, common-mode rejection and noise power. A 50μm×65μm compact layout of the pixel amplifiers that make up the recording channels of the front-end was designd in a 180 nm CMOS process. Simulations conducted in Cadence Virtuoso reveal an SCMRR of 80.5 dB and a PSRR of 72.58 dB, with a differential gain of 44 dB and a bandwidth that fully encompasses the frequency range of the bio-signals that can be theoretically captured by the neural probe. The noise integrated in the range between 1 Hz and 7.5 kHz results in an IRN of 4.04 μVrms. Power consumption is also tested, with a measured value of 3.77 μW per channel, corresponding to an overall consumpution of about 60 μW. To test its robustness with respect to PVT and mismatch variations, the front-end is evaluated by means of extensive parametric simulations and Monte Carlo simulations, revealing favorable results.
Keywords:
Front-end
; Neural Recording
; System Common-Mode Rejection Ratio
1. Introduction
Understanding the intricate correlation between individual neuron activities is pivotal for advancing the development of numerous applications within the realm of neuroscience [1,2]. Among these, a notable area of research focuses on investigating the mechanisms underlying the effects of neurodegenerative diseases such as Parkinson’s or Alzheimer’s, in light of their increasing global spread and the corresponding rise in treatment costs [3,4,5,6]. Additionally, ongoing research endeavors center around the development of efficient brain-machine interfaces (BMIs) for diagnostic and neuro-prosthetic purposes [7,8,9].
However, to achieve breakthroughs in these and other areas of neuroscientific research, reliance solely on non-invasive methods of neural recording (i.e. EEG, fMRI) has proven to be insufficient. Though affordable and safe to perform, such techniques are hampered by limited spatial and temporal resolution and exhibit a low signal-to-noise ratio (SNR) due to the filtering effect of the intermediate layers between the scalp and the source of the bio-signals [10,11]. Invasive neural recording through implantable neural probes, on the other hand, allows to isolate spike events from single neurons with sub-millisecond time precision by recording the neuronal activity directly from the extracellular space of the membrane [12].
Multi-channel neural probes can be fabricated using a variety of techniques and materials. Most notably, silicon is widely favored on account of its cost-effectiveness, compatibility with standard fabrication processes, and the ability to integrate CMOS circuits on the same substrate [13,14]. Taking advantage of this aspect, recently introduced active neural probes have been a key factor in contributing to the gradual increase in the density of recording channels that can be implemented in a single probe’s shank. In turn, the number of individual neurons that can be simultaneously recorded has also experienced a steady rise [15]. At the forefront of neural recording, devices such as Neuropixels 2.0, Neuroseeker, and SiNAPS have produced groundbreaking results when applied to small mammals and non-humane primates [16,17,18,19,20].
Designing CMOS neural probes presents a multifaceted challenge, involving various disciplines such as electronics, material science, and biology [21,22,23]. While implanted micro-electrodes provide superior access to fine-grained neural activity, they inherently cover a smaller volume of brain tissue compared to standard non-invasive methods. Thus, future advancements must prioritize increasing the density and number of integrated recording sites to achieve large-scale brain coverage. Moreover, reducing the area occupied by neural probes can significantly decrease their invasiveness, a critical factor given its contribution to the foreign body response of the brain under chronic recording conditions [24,25,26]. It is worth noting that down-scaling the technology to achieve a smaller area introduces short-channel effects of the MOS transistors, resulting in a reduction in transconductance and an increase in gate leakage current, flicker, and thermal noise power [27].
Furthermore, optimizing power consumption in neural recording devices, and thus managing potential heat generation through dissipation, is a critical parameter [28,29]. Recent studies have shown that power consumption exceeding 40 mW leads to a temperature increase of over 2°C, which in turn triggers neural cell death within a few days [30].
Another important aspect to be considered in designing neural probes is the ability of the circuit to effectively reject interferences, that is, the common-mode rejection ratio (CMRR) and the power supply rejection ratio (PSRR). To preserve the integrity of the acquired bio-signals and keep a high SNR, both the common-mode signals, typically fed through the micro-electrodes, and the power supply noise, such as the wall-mounted 50/60 Hz interference, should be rejected accordingly [31]. Although various methods have been employed to ensure a high CMRR for the amplifiers employed in multi-channel neural probes, few studies have been centered around the system CMRR in analog front-ends [32,33,34]. Typically, the SCMRR in systems with a high channel count N decreases as N itself increases, and is also dependent on the mismatch between the impedance of the reference electrode and the impedance of the signal acquiring electrode.
In this regard, the novel approach introduced in [34] aims to raise the SCMRR and the common-mode interference (CMI) of a DC-coupled neural recording front-end through the implementation of a shared voltage averaging circuit (VAC) and a floating-rail common-mode feedback loop (CMFB). The latter employs an error amplifier with an open loop gain of 45 dB that accepts as an input the mean of the voltage outputs of the multiple input amplifiers and produces in turn a feedback voltage, used to retroactively cancel out any common-mode interference.
Similarly, in this work we introduce the architecture of a DC-coupled analog front-end designed for high-channel count in-pixel neural recording systems. The described structure features 15 recording channels alongside a single reference channel. It incorporates a CMFB loop, which operates on the sum of individual channel currents to enhance both the SCMRR and the CMI range. In addition, the proposed design focuses on minimizing the on-chip area footprint of the front-end, aligning with the demand for compact and efficient neural recording devices set by the state of the art.
The remainder of this paper is organized as follows: Section 2 delves into the architecture of the front-end, highlighting its innovative features. The topologies of the various components that make up the front-end are presented in detail in Section 3, while Section 4 concerns the analytical aspects of the circuit’s performance. The results obtained through simulation are subsequently presented in Section 5, along with a final table to compare the results with current state of the art devices. Final conclusions are drawn in Section 6.
2. System Architecture
In order to effectively contextualize the novel contributions brought forth by the analog front-end proposed in this document, it is necessary to first provide a characterization of the fundamental workings of the circuit outlined in [34], thereby establishing a baseline for comparison. In this regard, the circuit depicted in Figure 1 comprises 16 recording channels, 15 of which serve as input channels, while the remaining one acts as a reference channel. For local conditioning of the acquired bio-signals, each front-end channel integrates an in-pixel low-noise neural amplifier with a bandwidth of 7.5 kHz, ensuring coverage of both action potentials and local field potentials recorded in the extracellular space. In a conventional IC multi-channel recording system, the total common-mode rejection ratio is dependent on the intrinsic CMRR of the input amplifiers, as well as the number of employed channels, as demonstrated in [33]:
Here, represents the input impedance of the low-noise amplifier, while denotes the impedance of the recording electrode. The term is used to quantify the difference in impedance between the reference electrode and the signal electrode, with a value of one indicating a condition of perfect match. With the goal of improving the SCMRR and, therefore, increasing the CMI range in high channel count systems, the solution presented in [34] employs a common-mode feedback loop based on the average sum of the output voltages of the input amplifiers.
The CMFB consists of a voltage averaging circuit and an error amplifier. In relation to the single recording channel, the former is composed of a voltage buffer, necessary to eliminate the loading effect to the main amplifier, and a resistor . Assuming the same value for all of the 16 resistors, the voltage fed to the inverting input of the error amplifier can be expressed as follows:
To complete the CMFB loop, the output of the error amplifier, named , is fed back to the pixel amplifiers. As previously mentioned, the implementation of this kind of common-mode feedback loop enhances the SCMRR. However, it is important to acknowledge that including a voltage buffer for each recording channel results in a substantial increase in on-chip area occupation, which is a critical aspect to consider in the context of neural recording devices.
To address this limitation, we devised a variation of the aforementioned front-end, designed with the aim of significantly reducing its area occupation without compromising the system’s performance. As depicted in the block diagram in Figure 2, this modified version of the front-end maintains the same number of recording channels. Its distinctive feature lies in the operation mode of the CMFB loop: in place of the mean calculation of the output voltages, a sum of the output currents is conducted instead.
Summing the output signals as currents eliminates the need for voltage buffers and resistors, resulting in a significant reduction in on-chip area occupation per recording channel. In particular, for each input amplifier the voltage averaging circuit is replaced by two much smaller transistors, while the current sum is made possible by implementing two common-gate transistors. In doing so, the voltage buffers and the resistors described in Figure 1 are no longer required. As a result, the on-chip area occupation is significantly reduced.
3. Circuit Design
The following section of the paper delves deeper into the topologies of the various stages that compose the proposed multi-channel neural recording front-end, providing an insight into the mechanisms underlying the amplifying stage and the CMFB loop.
3.1. Pixel DC-Coupled Amplifiers
The schematic of the primary low-noise amplifier utilized in each recording channel is depicted in Figure 3. Following the topology proposed in [34], transistors M1 and M2 form the dc-coupled inverter-based amplifier of the system. In contrast to commonly used configurations employing differential amplifiers, the utilization of single-ended amplifiers offers notable benefits, such as reduced area occupancy and power dissipation, albeit at the cost of a decreased system rejection to interfering common-mode signals and power supply variations.
For the i-th channel, the output current produced by the main inverter-based amplifier is duplicated by means of the replicating transistors M8 and M9, which share the same source and gate nodes as the transistors comprising the inverter itself. The magnitude of the duplicated current is determined by the transconductance of M8 and M9. As such, by adjusting the aspect ratios of M8 and M9 to a fraction of the ratios of transistors M1 and M2, it is possible to replicate a scaled current with precision. This is done to ensure a more efficient occupation of on-chip area and a reduction in power consumption.
With reference to the schematic in Figure 3, transistors M3 and M4 provide a way to set the voltages of the floating rails of the input pixel amplifier. Acting as the terminal of the CMFB loop of the system, these transistors are diode-connected to avoid strong variations on the output high-impedance node, which would otherwise require Miller compensation. Additionally, the couples M3-M4 and M1-M2 must be sized equally in order to effectively reject the common-mode interference and also to prevent an increase in the IRN caused by the eventual mismatch.

Table 1.
Transistor sizes for pixel amplifier and CMFB stage.
| MOSFET | Width | Length |
|---|---|---|
| M1-M3 | ||
| M2-M4 | ||
| M8-M11 | ||
| M9-M12 | ||
| M5 | ||
| M6-M7 | ||
| M10 | ||
| M13-M14 | 1 |
Biasing of the amplifier is achieved through the voltages and applied to the gates of transistors M5 and M6-M7 which, respectively, act as a current source and a current sink for the inverter. Concerning the couple M6-M7, in particular, connecting the gate nodes and the body nodes of the two transistors allowed to virtually obtain a transistor with a channel length capable of exceeding the upper limit set by the specific adopted technology [35]. Assuming an identical aspect ratio for both M6 and M7, the resulting composite transistor has an aspect ratio of
3.2. Common-Mode Feedback Stage
The topology of the CMFB stage in the front-end is structured around two common-gate transistors, namely M11 and M12, which are used to establish a low-impedance node for summing the scaled duplicated currents. Referring to the schematic presented in Figure 4, node A serves as the summing node for the currents duplicated by the 16 NMOS replicating transistors, while node B provides the same function for the currents duplicated by the PMOS replicating transistors connected to the main amplifiers.
Transistors M11 and M12 effectively form two folded cascode structures, with the total scaled output current being converted into the input voltage of the error amplifier through the output resistance at their shared drain node. This voltage is subsequently amplified and fed back to the gate of the feedback amplifiers introduced in Section 3.1.
In terms of biasing, transistors M10 and M13-M14 act as current sources and are employed to set the bias current for the branch of the CMFB stage. It must be noted that the couple M13-M14 is designed following the same principle as the pair M6-M7 that made up one of the two current generators used to bias the inverter-based amplifier.
3.3. Error Amplifier
The topology of the error amplifier utilized to implement the CMFB loop is illustrated in Figure 5. Designed to operate in weak inversion mode, the amplifier is comprised of three stages; transistors M15, M16, M17, M18, M19 and M20 form a differential active-load amplifying stage, with the signal coming from the inverting input. Note that a reference voltage is applied to the non-inverting input instead. Transistors M19 and M20 ensure the correct biasing of the stage and are driven by a voltage applied to the shared gate node.
The second stage of the amplifier is made up of a common-source transistor, M21, biased through the composite transistor M22-M23. A compensation feedback capacitor is connected between the drain and the gate of M21 to ensure the stability of the amplifier, as well as to provide a sufficient gain bandwidth product according to the following formula [36]:
The final class AB stage, implemented by means of M24-M25, guarantees a rail-to-rail output swing, which in turn allows for the overall front-end to achieve a high value of CMI.
4. Circuit Analysis
The following section aims to provide an analytical overview of the circuit’s small-signal performance. Mainly, the proposed design equations focus on parameters such as the differential gain, the common-mode gain, and the SCMRR. Additionally, the circuit’s noise performance is evaluated.
4.1. Gain and SCMRR
Despite being classified as a single-ended amplifier, the pixel amplifier effectively operates with an inverting input for the acquired signal and a non-inverting input for the feedback voltage, due to the diode-connected pair of transistors that closes the CMFB loop. For the k-th recording channel, the gain of the former is , while the gain of the latter is defined as . Therefore, the output voltage of the amplifier can be expressed as
with and assumed to be approximately equal to each other. Referring to the small-signal model of the pixel amplifier (Fig. 6), the gain can be computed as
where corresponds to
and and are defined as
It is important to note that the expressions presented here are based on several approximations. Firstly, to simplify calculations, the parameters of the NMOS and PMOS transistors are assumed to be identical to each other. As such, small signal parameters and are equivalent to and , respectively. Furthermore, the computation of assumes the output of the system to be an open circuit, while the capacitance has been disregarded in the node equations of the first stage.
By applying Norton’s theorem, the output current of the equivalent circuit is found to be equal to
with the equivalent Norton’s admittance being denoted as
where
is smaller than . The small signal-model of the second stage of the circuit is presented in Figure 7. The output voltage can be derived to be
The gain is computed as follows:
In this case, N indicates the number of recording channels that make up the front-end. Coefficients , , and can be expressed as
Voltage is subsequently fed to the inverting input of the error amplifier. We may assume for the small-signal analysis. The resulting feedback voltage is equal to
The single-pole error amplifier is characterized by a gain that can be denoted with the following expression:
Particularly, the loop gain is equivalent to
Under the hypothesis that the pole is dominant, and that , the expression for the loop gain can be further simplified. As a result, can be expressed as
where and . Considering an input voltage , where , the output voltage as defined in (5) becomes
By setting , the common-mode gain of the system can be evaluated accordingly. From (20), it is found that can be computed as
It is evident from Equation (21) that the common-mode gain presents a zero in , which is set by the error amplifier employed in the CMFB loop. In order to compute the SCMRR of the front-end, the expression for the single channel gain must be derived as well. By imposing in (5), we obtain the following:
According to (23), the SCMRR’s behavior in frequency is dependent on the error amplifier, with a pole in .
4.2. Noise Analysis
For the purpose of noise analysis, each transistor has been modelled by a single noise current source that encompasses both thermal and flicker noise. With reference to the model presented in Figure 8, . Concerning the CMFB stage of the front-end, the noise current generator represents the noise of as well as the noise of the other channels.
The equilbrium equation at results in
with . Hence, the outout admittance and the output current can be expressed as
Regarding the expression in (25), specifically, the output current’s terms are defined as follows:
where . Noise sources make it so that , which in turns causes . This affects the channel under consideration and the other recording channels (whose affects ). The analysis of the second stage provides
Considering that , and therefore that , voltage can be derived as
By substituting in Equation (24), and considering , the output noise voltage is computed as
By looking at Equation (32) it is apparent that the contribution of to the input referred noise is negligible, as its coefficient is much lower than one. Additionally, it can be noticed that , and contribute to the overall input noise, due to the presence of the CMFB loop. Other recording channels affect , through the term .
5. Simulation Results
The proposed analog front-end has been designed and simulated referring to the 180 nm CMOS process from TSMC. This section delves into the layout design aspects of the dc-coupled pixel input amplifiers and provides sizing information concerning the various components. Additionally, it showcases results obtained through extensive simulations.
5.1. Layout and Transistor Sizing
The layout of the inverter-based amplifier is reported in Figure 9, showing an area of . Utilizing four metal layers, this layout encompasses all the transistors described in detail in Section 3.1. Notably, the smaller transistors (M8-M9 in Figure 3), responsible for replicating the scaled currents, are surrounded by the transistors of the inverter and the feedback transistors to mitigate potential mismatch between the devices.
With reference to Figure 3 and 4, table 1 summarizes the size parameters of the MOS transistors used both in the pixel amplifier and in the CMFB stage that makes up the closed loop. As stated before, the transistors that make up the inverter and the feedback transistors are sized equally by design. In order to accurately scale the currents of the main amplifiers, feedback transistors M8 and M9 are sized to have a width scaled by a factor 4. Transistors M5 and M6-M7 are sized with the intent of producing a bias current of 2.5 for the main amplifying branch. Regarding the common-gate transistors implemented in the current-summing branch of the front-end, sizes have been chosen to be equal to the replicating transistors to minimize area occupation. For biasing purposes, the W and L parameters of transistors M10 and M13-M14 have been chosen to generate a current at least equal to the sum of the scaled, replicated currents.
Table 2 displays the sizing choices made with respect to the error amplifier. In this case, the parameters of the transistors have been set with the aim of obtaining a high open-loop gain for the amplifier, of at least 80 dB, with a phase margin 60°.
Table 2.
Transistor sizes for error amplifier.
| MOSFET | Width | Length |
|---|---|---|
| M15-M16 | ||
| M17-M18 | ||
| M19-M20 | ||
| M21 | ||
| M22-M23 | ||
| M24 | ||
| M25 | 1 |
5.2. Circuit Simulations
The proposed front-end’s nominal behavior was simulated within the Cadence Virtuoso environment. To achieve results that closely resemble the actual implementation of the neural recording system, simulations were conducted by using the post-layout netlist with extracted parasitics. The circuit is biased with a dual voltage supply (=-=0.5 V), while the total current used to bias a single channel is set at 3.5 .
Figure 10 shows that the inverter-based pixel amplifiers integrated in each recording channel boast a differential gain of 44.16 dB, alongside a high cut-off frequency exceeding 100 kHz. These metrics highlight the amplifiers’ ability to capture and amplify neural signals across the entire frequency spectrum that encompasses both local field potentials and action potentials as measured from the extracellular space.
As shown in Figure 11, further simulations have revealed a favorable SCMRR of 80.5 dB at low frequencies. Particularly noteworthy is the performance of the front-end within the range comprised between 0.1 Hz and 100 Hz, where the SCMRR maintains a value of at least 80 dB. A moderately high level of rejection is kept at higher frequencies, with the SCMRR exceeding 60 dB up to the frequency of 2 kHz.
The PSRR of the front-end, as indicated in Figure 12, shows a value of 72.55 dB at frequencies in the range that spans from 0.1 Hz to 100 Hz. For higher frequencies, the measured PSRR exhibits a similar behavior to the SCMRR, maintaining a level above 60 dB up until 2 kHz.
The input-referred noise spectrum of the input amplifier is presented in Figure 13, showing a noise level of 100 at 100 Hz and a value of 50 at 1 kHz. By integrating the noise spectrum across various frequency intervals, the noise performance of the amplifier was evaluated in terms of input referred noise (IRN). The achieved results are compiled in table 3.
Table 3.
IRN values measured in different frequency intervals.
| Bandwidth | Integrated Value | |
|---|---|---|
A widely used figure of merit that allows to relate the noise performance of the circuit with its power consumption and bandwidth is the noise efficiency factor (NEF) [37], expressed as follows:
where is the thermal volta, is the total supply current of the amplifier, and is the amplifier’s bandwidth (in Hz). By replacing in (33) the values of the total current required to bias the individual recording channel, the IRN and the bandwidth, we obtain
In addition, the power efficiency factor (PEF) can be computed as
5.3. Process and Mismatch Simulations
To assess the robustness of the front-end against PVT (Process, Voltage, and Temperature) and mismatch variations, the system underwent comprehensive testing via multiple simulations. Specifically, a Monte Carlo simulation comprising 200 iterations was conducted. The outcomes of these simulations are outlined in Table 4.
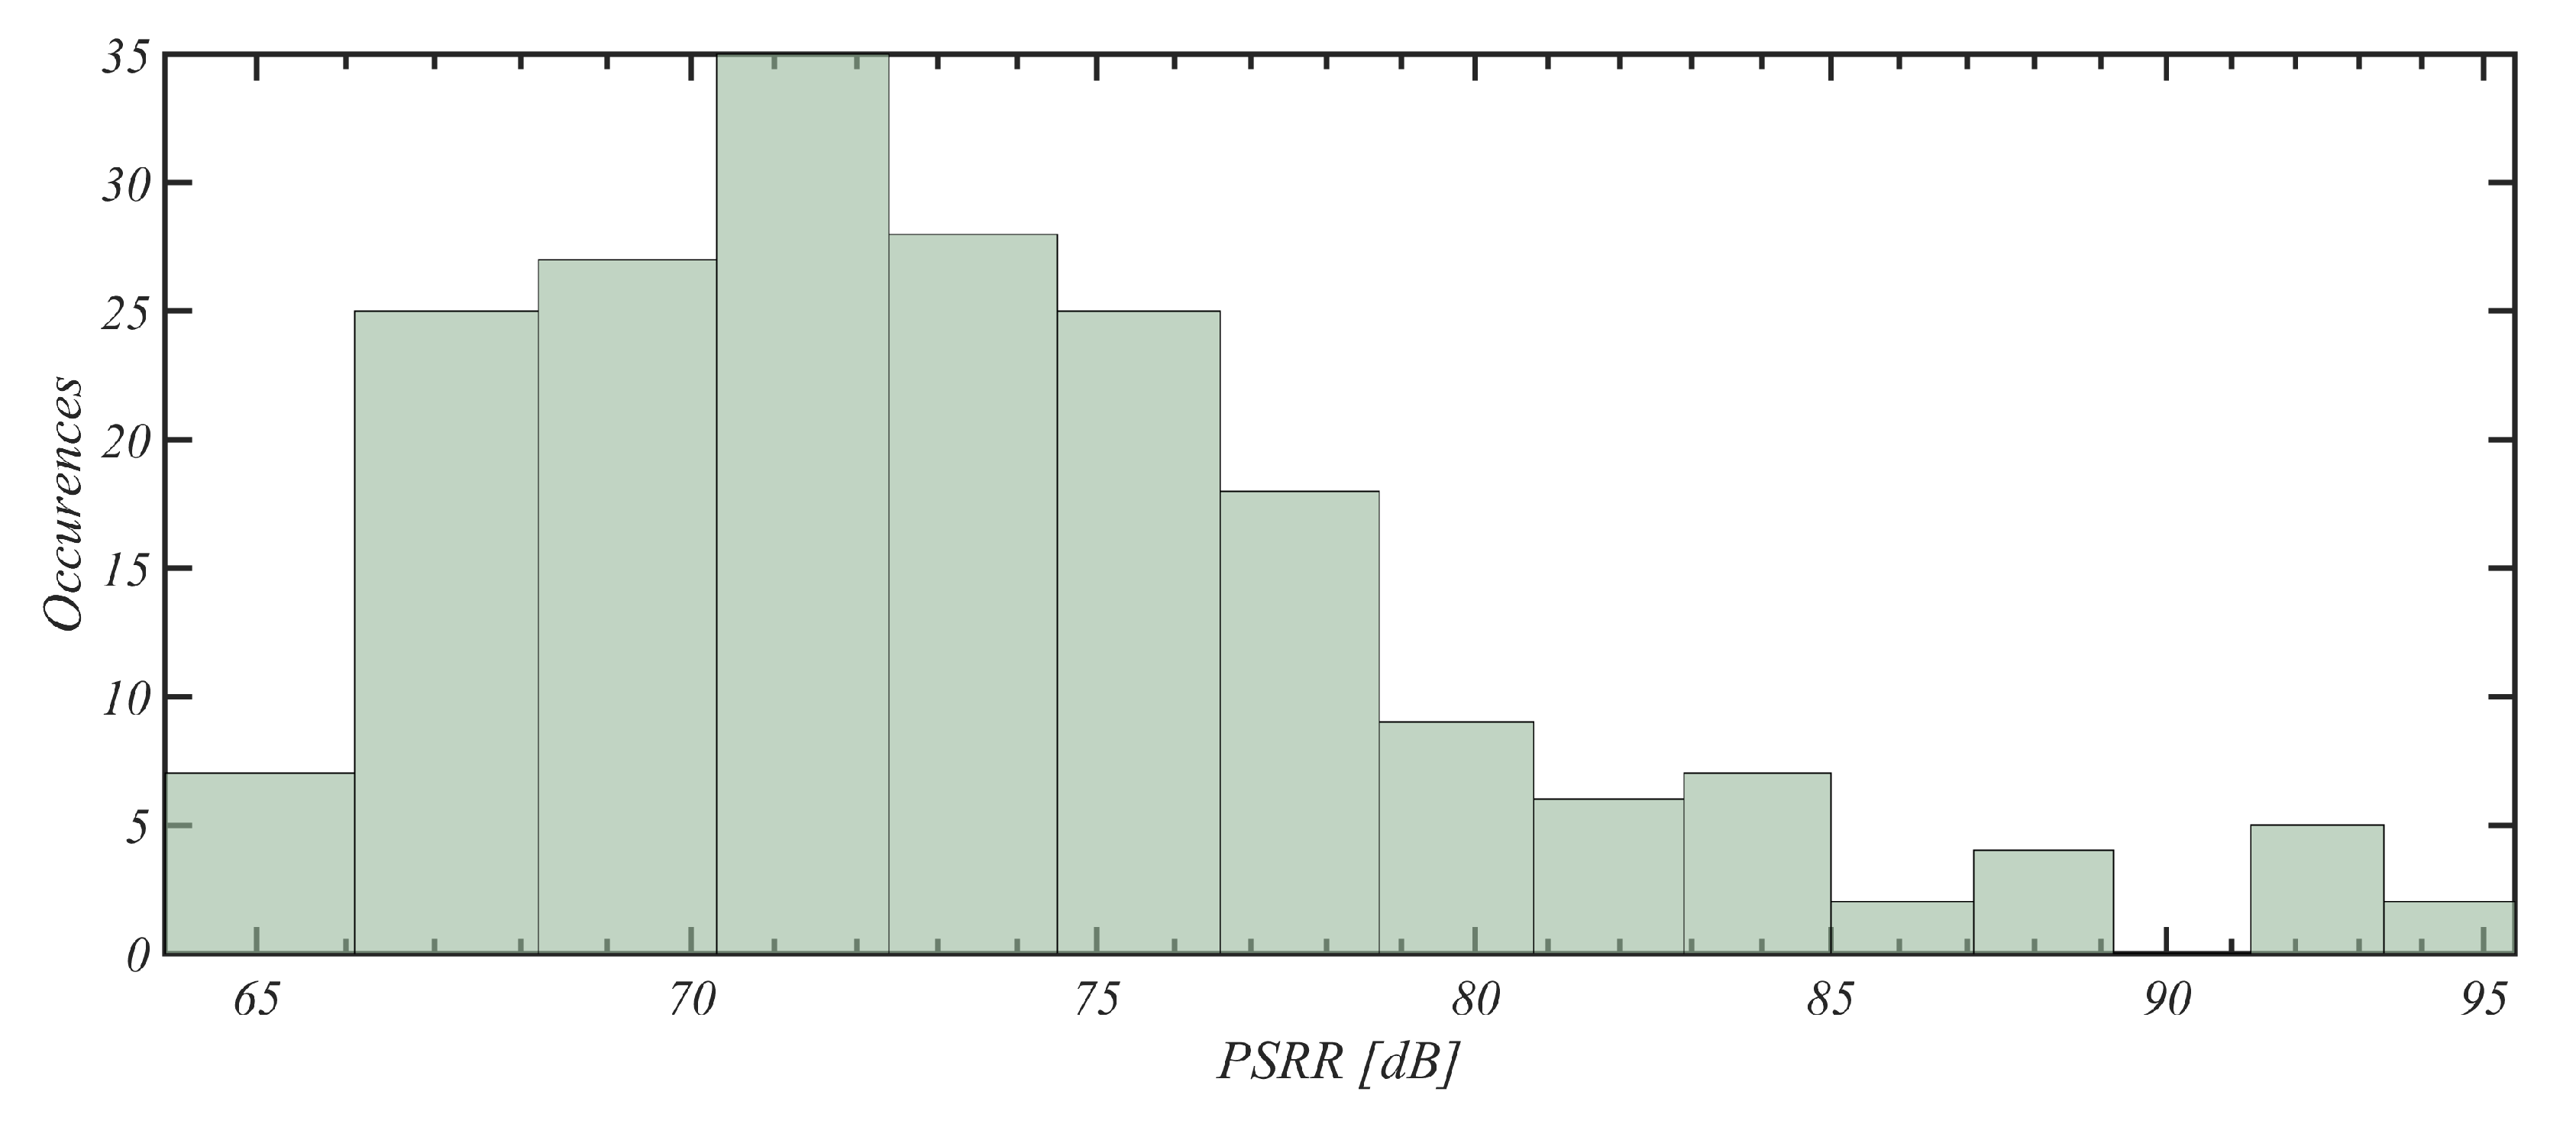
It must be noted that both the differential gain and the common-mode gain of the front-end demonstrate standard deviations within a 2 dB interval, consequently maintaining a similarly constrained SCMRR. Particularly, the differential gain exhibits minimal fluctuations around its mean value of 44.16 dB. Although the PSRR (Power Supply Rejection Ratio) variance is marginally higher, it remains moderately limited, with a mean of 74.11 dB and a variance of 6.30 dB. In both instances, the tested performance metrics yield favorable results, with both figure of merits exceeding 70 dB on average.
Table 4.
Performance under mismatch variations.
| Parameter | Min | Max | Mean | Std. Dev. |
|---|---|---|---|---|
Concerning the SCMRR and the PSRR, histograms related to the distribution of results over the 200 Monte Carlo iterations are presented in Figure 14 and 15.
To further test the robustness of the proposed front-end, a parametric simulation focusing on temperature variations was conducted. By gradually varying the operating temperature within the range [0 °C – 50 °C], the front-end’s gain and noise parameters, along with the rejection parameters, were evaluated accordingly (Tab. 5).
Regarding the differential gain of the input amplifiers, minimal fluctuations were observed; differently, the common-mode gain of the system exhibits a gradual decrease in value as the test temperature rises. Consequently, the SCMRR displays an increasing trend with growing temperatures, reaching a maximum value of 86.72 dB for 50 °C.
Conversely, the PSRR of the system tends to decrease in value with rising temperatures. In the range corresponding to the physiological conditions of the brain [38 °C – 41 °C], both PSRR and SCMRR are characterized by relatively minor variations, with values that manage to stay steady around 70 dB and 80 dB, respectively. When examining the noise performance of the front-end amidst temperature variations, it’s expected for the IRN of the system to experience a gradual rise. Nevertheless, with 4.23 , considering the total bandwidth [1 Hz – 7.5 kHz], just barely exceeds its nominal value, measured at 27 °C.
Table 5.
Performance under temperature variations.
| Temp (°C) | 0.00 | 10.50 | 21.00 | 31.60 | 42.10 | 50.00 |
|---|---|---|---|---|---|---|
Continuing with the evaluation of the front-end, the following batch of simulations was conducted by varying the power supply voltage of ±10% of its nominal value. By consulting the results displayed in table 6, it emerges that variations in the differential gain were once again minimal. In a similar manner, the common-mode gain of the system varied between a minimum of -39.21 dB for (Vdd - Vss) = 1.1 V, and a maximum of -32.36, corresponding to (Vdd - Vss) = 0.9 V.
Integrating the input noise spectrum in the bandwidths of interest revealed a minor increasing trend in the band related to the local field potentials [1 Hz – 300 Hz] and a minor decreasing trend as it pertains to the band of the action potentials [300 Hz – 7.5 kHz]. Overall, the IRN measured in the total frequency band exhibits a negligible decrease.
Table 6.
Performance under supply voltage variations.
| Vdd-Vss (V) | 0.90 | 0.94 | 0.97 | 1.02 | 1.07 | 1.10 |
|---|---|---|---|---|---|---|
To conclude with the PVT analysis, the results of the simulations under corner variations are compiled in Table 7. Generally, it can be observed that the front-end’s robustness is quite favorable.
Table 8 shows a comparison between the front-end proposed in this work and various analog front-ends that were introduced in recent years. For most parameters, the simulation results presented in this section of the paper are comparable with modern state-of-the-art findings. Of particular importance is the area occupation per recording channel which, for our devised front-end, is reduced by a factor 3 with respect to the front-end introduced in [34], and is approximately equal to a tenth of the area occupied by the work presented in [33]. Additionally, thanks to the implemented closed CMFB loop, the CMI of the front-end hereby described is significantly higher than the ones measured for other devices.
Table 7.
Performance under process variations.
| Temp (°C) | TT | FF | SS | SF | FS |
|---|---|---|---|---|---|
Table 8.
Performance comparison against state-of-the-art front-ends.
| [33] | [38] | [39] | [34] | This Work | |
|---|---|---|---|---|---|
| Year | 2016 | 2018 | 2019 | 2022 | |
| Process | 65 nm | 180 nm | 180 nm | 180 nm | nm |
| N° Channels | 16 | 4 | 4 | 15 | |
| Supply (V) | 1 | ||||
| P/Ch () | |||||
| A/Ch () | |||||
| NEF/PEF | |||||
| SCMRR (dB) | 90 | 76 | 75 | ||
| PSRR (dB) | 78 | 80 | 74 | ||
| CMI () | 220 | – | – | 300 | |
| IRN ( ) | |||||
| THD (%(@ )) | – | – |
6. Conclusions
In this work, we have presented a 16-channel in-pixel neural front-end architecture utilizing a common-mode feedback loop to enhance the SCMRR and the CMI range. The closed loop was achieved by scaling and summing the input currents of DC-coupled inverter-based amplifiers on low impedance nodes provided by common-gate transistors. Designed using a 180 nm CMOS process from TSMC, post layout simulations have demonstrated a DC gain of 44.16 dB, with nominal values for the SCMRR and PSRR measured at 80.50 dB and 72.55 dB, respectively. The front-end was shown to consume 3.77 W per recording channel, totaling about 60 W. Noise analysis indicated an IRN of 4.06 in the frequency range [1 Hz - 7.5 kHz]. Further simulations have confirmed the system’s robustness against PVT and mismatch variations. Overall, the front-end exhibited comparable results with other state-of-the-art devices in terms of rejection, noise, and power consumption. Thanks to the implementation of DC-coupled amplifiers and a current-based CMFB loop, the occupied area per channel was minimized to 0.004 .
Author Contributions
Conceptualization, G.S., A.F., G.N.; methodology, G.N, A.F.; software, G.N.; validation, G.N, A-F; formal analysis, F.C.; investigation, G.N, F.C.; resources, G.S.; data curation, G.N.; writing—original draft preparation, G.N., A.F., F.C.; writing—review and editing, G.S., F.C., G.N; visualization, G.N.; supervision, G.S.; project administration, G.S.; All authors have read and agreed to the published version of the manuscript.”.
Funding
This research received no external funding.
Conflicts of Interest
The authors declare no conflicts of interest.
References
- Stevenson, I.H.; Kording, K.P. How advances in neural recording affect data analysis. Nat Neurosci. 2011, 14(2), 139–42. [Google Scholar] [CrossRef] [PubMed]
- Lopez, C.M. Unraveling the Brain with High-Density CMOS Neural Probes: Tackling the Challenges of Neural Interfacing. IEEE Solid-State Circuits Magazine, 2019; 11, 4, 43–50. [Google Scholar]
- Duraivel, S.; Rahimpour, S.; Chiang, C.H.; et al. High-resolution neural recordings improve the accuracy of speech decoding. Nat Commun. 2023, 14. [Google Scholar] [CrossRef]
- Wang, D.D.; de Hemptinne, C.; Miocinovic, S.; Qasim, S.E.; Miller, A.M.; Ostrem, J.L.; et al. Subthalamic local field potentials in Parkinson’s disease and isolated dystonia: An evaluation of potential biomarkers. Neurobiol Dis. 2016, 213, 22–89. [Google Scholar] [CrossRef] [PubMed]
- Benabid, A.L.; Chabardes, S.; Mitrofanis, J.; Pollak, P. Deep brain stimulation of the subthalamic nucleus for the treatment of Parkinson’s disease. Lancet Neurol. 2009, 1, 67–81. [Google Scholar] [CrossRef] [PubMed]
- Ning, S.; Jorfi, M.; Patel, S.R.; Kim, D.Y.; Tanzi, R.E. Neurotechnological Approaches to the Diagnosis and Treatment of Alzheimer’s Disease. Front Neurosci. 2022. [Google Scholar] [CrossRef] [PubMed]
- Hochberg, L.R.; Bacher, D.; Jarosiewicz, B.; Masse, N.Y.; Simeral, J.D.; Vogel, J.; et al. Reach and grasp by people with tetraplegia using a neurally controlled robotic arm. Nature 2012, 485, 372. [Google Scholar] [CrossRef] [PubMed]
- Fetz, E.E. Restoring motor function with bidirectional neural interfaces. Prog Brain Res. 2015, 52, 218–241. [Google Scholar]
- Choi, J.R.; Kim, S.M.; Ryu, R.H.; Kim, S.P.; Sohn, J.W. Implantable Neural Probes for Brain-Machine Interfaces - Current Developments and Future Prospects. Exp Neurobiol. 2018, 27(6), 453–471. [Google Scholar] [CrossRef] [PubMed]
- Zhang, M.; Tang, Z.; Liu, X.; Van der Spiegel, J. Electronic neural interfaces. Nat Electron. 2020, 3, 191–200. [Google Scholar] [CrossRef]
- Pesaran, B.; Vinck, M.; Einevoll, G.T.; Sirota, A.; Fries, P.; Siegel, M.; et al. Investigating large-scale brain dynamics using field potential recordings: Analysis and interpretation. Nat Neurosci. 2018, 21, 903–919. [Google Scholar] [CrossRef] [PubMed]
- Buzsáki, G.; Anastassiou, C.A.; Koch, C. The origin of extracellular fields and currents–EEG, ECoG, LFP and spikes. Nat Rev Neurosci. 2012, 13(6), 407–20. [Google Scholar] [CrossRef] [PubMed]
- Wang, S.; Garakoui, S.K.; Chun, H.; Gomez Salinas, D.; Sijbers, W.; Putzeys, J. A compact quad-shank CMOS neural probe with 5,120 addressable recording sites and 384 fully differential parallel channels. IEEE Trans. Biomed. Circuits Syst. 2019, 13(6), 1625–1634. [Google Scholar] [CrossRef] [PubMed]
- Lopez., C.M.; Andrei, A.; Mitra, S.; Welkenhuysen, M.; Eberle, W.; Bartic, C. Lopez. C.M.; Andrei, A.; Mitra, S.; Welkenhuysen, M.; Eberle, W.; Bartic, C.; et al. An implantable 455-active-electrode 52-channel CMOS neural probe. IEEE J. Solid State Circuits, 2014; 49, 1, 248–261. [Google Scholar]
- Urai, A.E.; Doiron, B.; Leifer, A.M.; Churchland, A.K. Large-scale neural recordings call for new insights to link brain and behavior. Nat Neurosci. 2022, 25(1), 11–9. [Google Scholar] [CrossRef] [PubMed]
- Raducanu, B.C.; Yazicioglu, R.F.; Lopez, C.M.; Ballini, M.; Putzeys, J.; Wang, S.; et al. Time Multiplexed Active Neural Probe with 1356 Parallel Recording Sites. Sensors 2017, 17, 2388. [Google Scholar] [CrossRef] [PubMed]
- Steinmetz, N.A.; Aydin, C.; Lebedeva, A.; Okun, M.; Pachitariu, M.; Bauza, M.; et, al. Neuropixels 2.0: A miniaturized high-density probe for stable, long-term brain recordings. Science 2021, 372(6539). [Google Scholar] [CrossRef] [PubMed]
- Trautmann, E.M.; Hesse, J.K.; Stine, G.M.; Xia, R.; Zhu, S.; O’Shea, D.J.; et al. Large-scale high-density brain-wide neural recording in nonhuman primates. bioRxiv 2023. [Google Scholar]
- Angotzi, G.N.; Boi, F.; Lecomte, A.; Miele, E.; Malerba, M.; et al. SiNAPS: An implantable active pixel sensor CMOS-probe for simultaneous large-scale neural recordings. Biosens Bioelectron. 2019, 126, 355–364. [Google Scholar] [CrossRef] [PubMed]
- Boi, F.; Perentos, N.; Lecomte, A.; Schwesig, G.; Zordan, S.; Sirota, A. Multi-shanks SiNAPS Active Pixel Sensor CMOSprobe: 1024 simultaneously recording channels for highdensity intracortical brain mapping. bioRxiv 2020. [Google Scholar]
- Marblestone, A.H.; Zamft, B.M.; Maguire, Y.G.; Shapiro, M.G.; Cybulski, T.R.; Glaser, J.I.; et al. Physical principles for scalable neural recording. Front Comput Neurosci. 2013, 7, 137. [Google Scholar] [CrossRef] [PubMed]
- Yang, W.; Gong, Y.; Li, W. A Review: Electrode and Packaging Materials for Neurophysiology Recording Implants. Front Bioeng Biotechnol. 2021, 8, 622923. [Google Scholar] [CrossRef] [PubMed]
- Fattahi, P.; Yang, G.; Kim, G.; Abidian, M.R. A review of organic and inorganic biomaterials for neural interfaces. Adv Mater. 2014, 26(12), 1846–85. [Google Scholar] [CrossRef] [PubMed]
- Perna, A.; Angotzi, G.N.; Berdondini, L.; Ribeiro, J.F. Advancing the interfacing performances of chronically implantable neural probes in the era of CMOS neuroelectronics. Front Neurosci. 2023, 17, 1275908. [Google Scholar] [CrossRef] [PubMed]
- Kook, G.; Lee, S.W.; Lee, H.C.; Cho, I.J.; Lee, H.J. Neural Probes for Chronic Applications. Micromachines 2016, 7(10), 179. [Google Scholar] [CrossRef] [PubMed]
- Polikov, V.S.; Tresco, P.A.; Reichert, W.M. Response of brain tissue to chronically implanted neural electrodes. J Neurosci Methods 2005, 148(1), 1–18. [Google Scholar] [CrossRef] [PubMed]
- Hashemi Noshahr, F.; Nabavi, M.; Sawan, M. Multi-Channel Neural Recording Implants: A Review. Sensors 2020, 20(3), 904. [Google Scholar] [CrossRef] [PubMed]
- Kim, S.; Tathireddy, P.; Normann, R.A.; Solzbacher, F. Thermal impact of an active 3-D microelectrode array implanted in the brain. IEEE Trans-Neural Syst Rehabil Eng. 2007, 15, 493–501. [Google Scholar] [CrossRef] [PubMed]
- De Dorigo, D.; Moranz, C.; Graf, H.; Marx, M.; Wendler, D.; Shui, B.; et al. Fully immersible subcortical neural probes with modular architecture and a deltasigma ADC integrated under each electrode for parallel readout of 144 recording sites. IEEE J. Solid State Circ. 2018, 53, 3111–3125. [Google Scholar] [CrossRef]
- Lopez, C.M.; Putzeys, J.; Raducanu, B.C.; Ballini, M.; Wang, S.; Andrei, A.; et al. A neural probe with up to 966 electrodes and up to 384 configurable channels in 0.13 µm SOI CMOS. IEEE Trans. Biomed. Circ. Syst. 2017, 11, 510–522. [Google Scholar] [CrossRef] [PubMed]
- Lee, H.S.; Eom, K.; Park, M.; Ku, S.B.; Lee, K.; Lee, H.M. High-density neural recording system design. Biomed Eng Lett. 2022, 12(3), 251–261. [Google Scholar] [CrossRef] [PubMed]
- Tang, T.; Goh, W.L.; Yao, L.; Cheong, J.H.; Gao, Y. An integrated multichannel neural recording analog front-end ASIC with area-efficient driven right leg circuit. In Proceedings of the 39th Annual International Conference of the IEEE Engineering in Medicine and Biology Society (EMBC), Jeju, Korea (South), 2017; pp. 217–220.
- Ng, K.A.; Xu, Y.P. A Low-Power, High CMRR Neural Amplifier System Employing CMOS Inverter-Based OTAs With CMFB Through Supply Rails. IEEE Journal of Solid-State Circuits 2016, 51(3), 724–737. [Google Scholar]
- Wang, Q.; You, C.; Xue, N.; Zhang, X.; Feng, C.; Zhao, Z.; et al. A DC-coupled 1.2µW 0.012 mm2 per channel neural amplifiers array with 75 dB system common mode rejection ratio and 300 mV common mode interference. Elettronic Letters 2022, 58(23), 876–878. [Google Scholar] [CrossRef]
- Rodovalho, L.H.; Orazio, A.; Ramos Rodrigues, C. Ultra-Low-Voltage Inverter-Based Operational Transconductance Amplifiers with Voltage Gain Enhancement by Improved Composite Transistors. Electronics 2020, 9, 1410. [Google Scholar] [CrossRef]
- Magnelli, L.; Amoroso, F.A.; Crupi, F.; Cappuccino, G.; Iannaccone, G. Design of a 75-nW, 0.5-V subthreshold complementary metal–oxide–semiconductor operational amplifier. International J, of Circuit Theory and Applications 2013, 42(9), 967–977. [Google Scholar] [CrossRef]
- Steyaert, M.S.; Sansen, W.M. A micropower low-noise monolithic instrumentation amplifier for medical purposes. IEEE J. Solid-State Circuits 1987, 22(6), 1163–1168. [Google Scholar] [CrossRef]
- Rezaei, M.; Maghsoudloo, E.; Bories, C.; De Koninck, Y.; Gosselin, B. A Low-Power Current-Reuse Analog Front-End for High-Density Neural Recording Implants. IEEE Transactions on Biomedical Circuits and Systems 2018, 12(2), 271–280. [Google Scholar] [CrossRef] [PubMed]
- Jomehei, M.G.; Sheikhaei, S. A low-power low-noise CMOS bio-potential amplifier for multi-channel neural recording with active DC-rejection and current sharing. Microelectronics Journal 2019, 83, 197–211. [Google Scholar] [CrossRef]
Figure 1.
Block diagram of DC-coupled front-end with voltage-based CMFB loop.
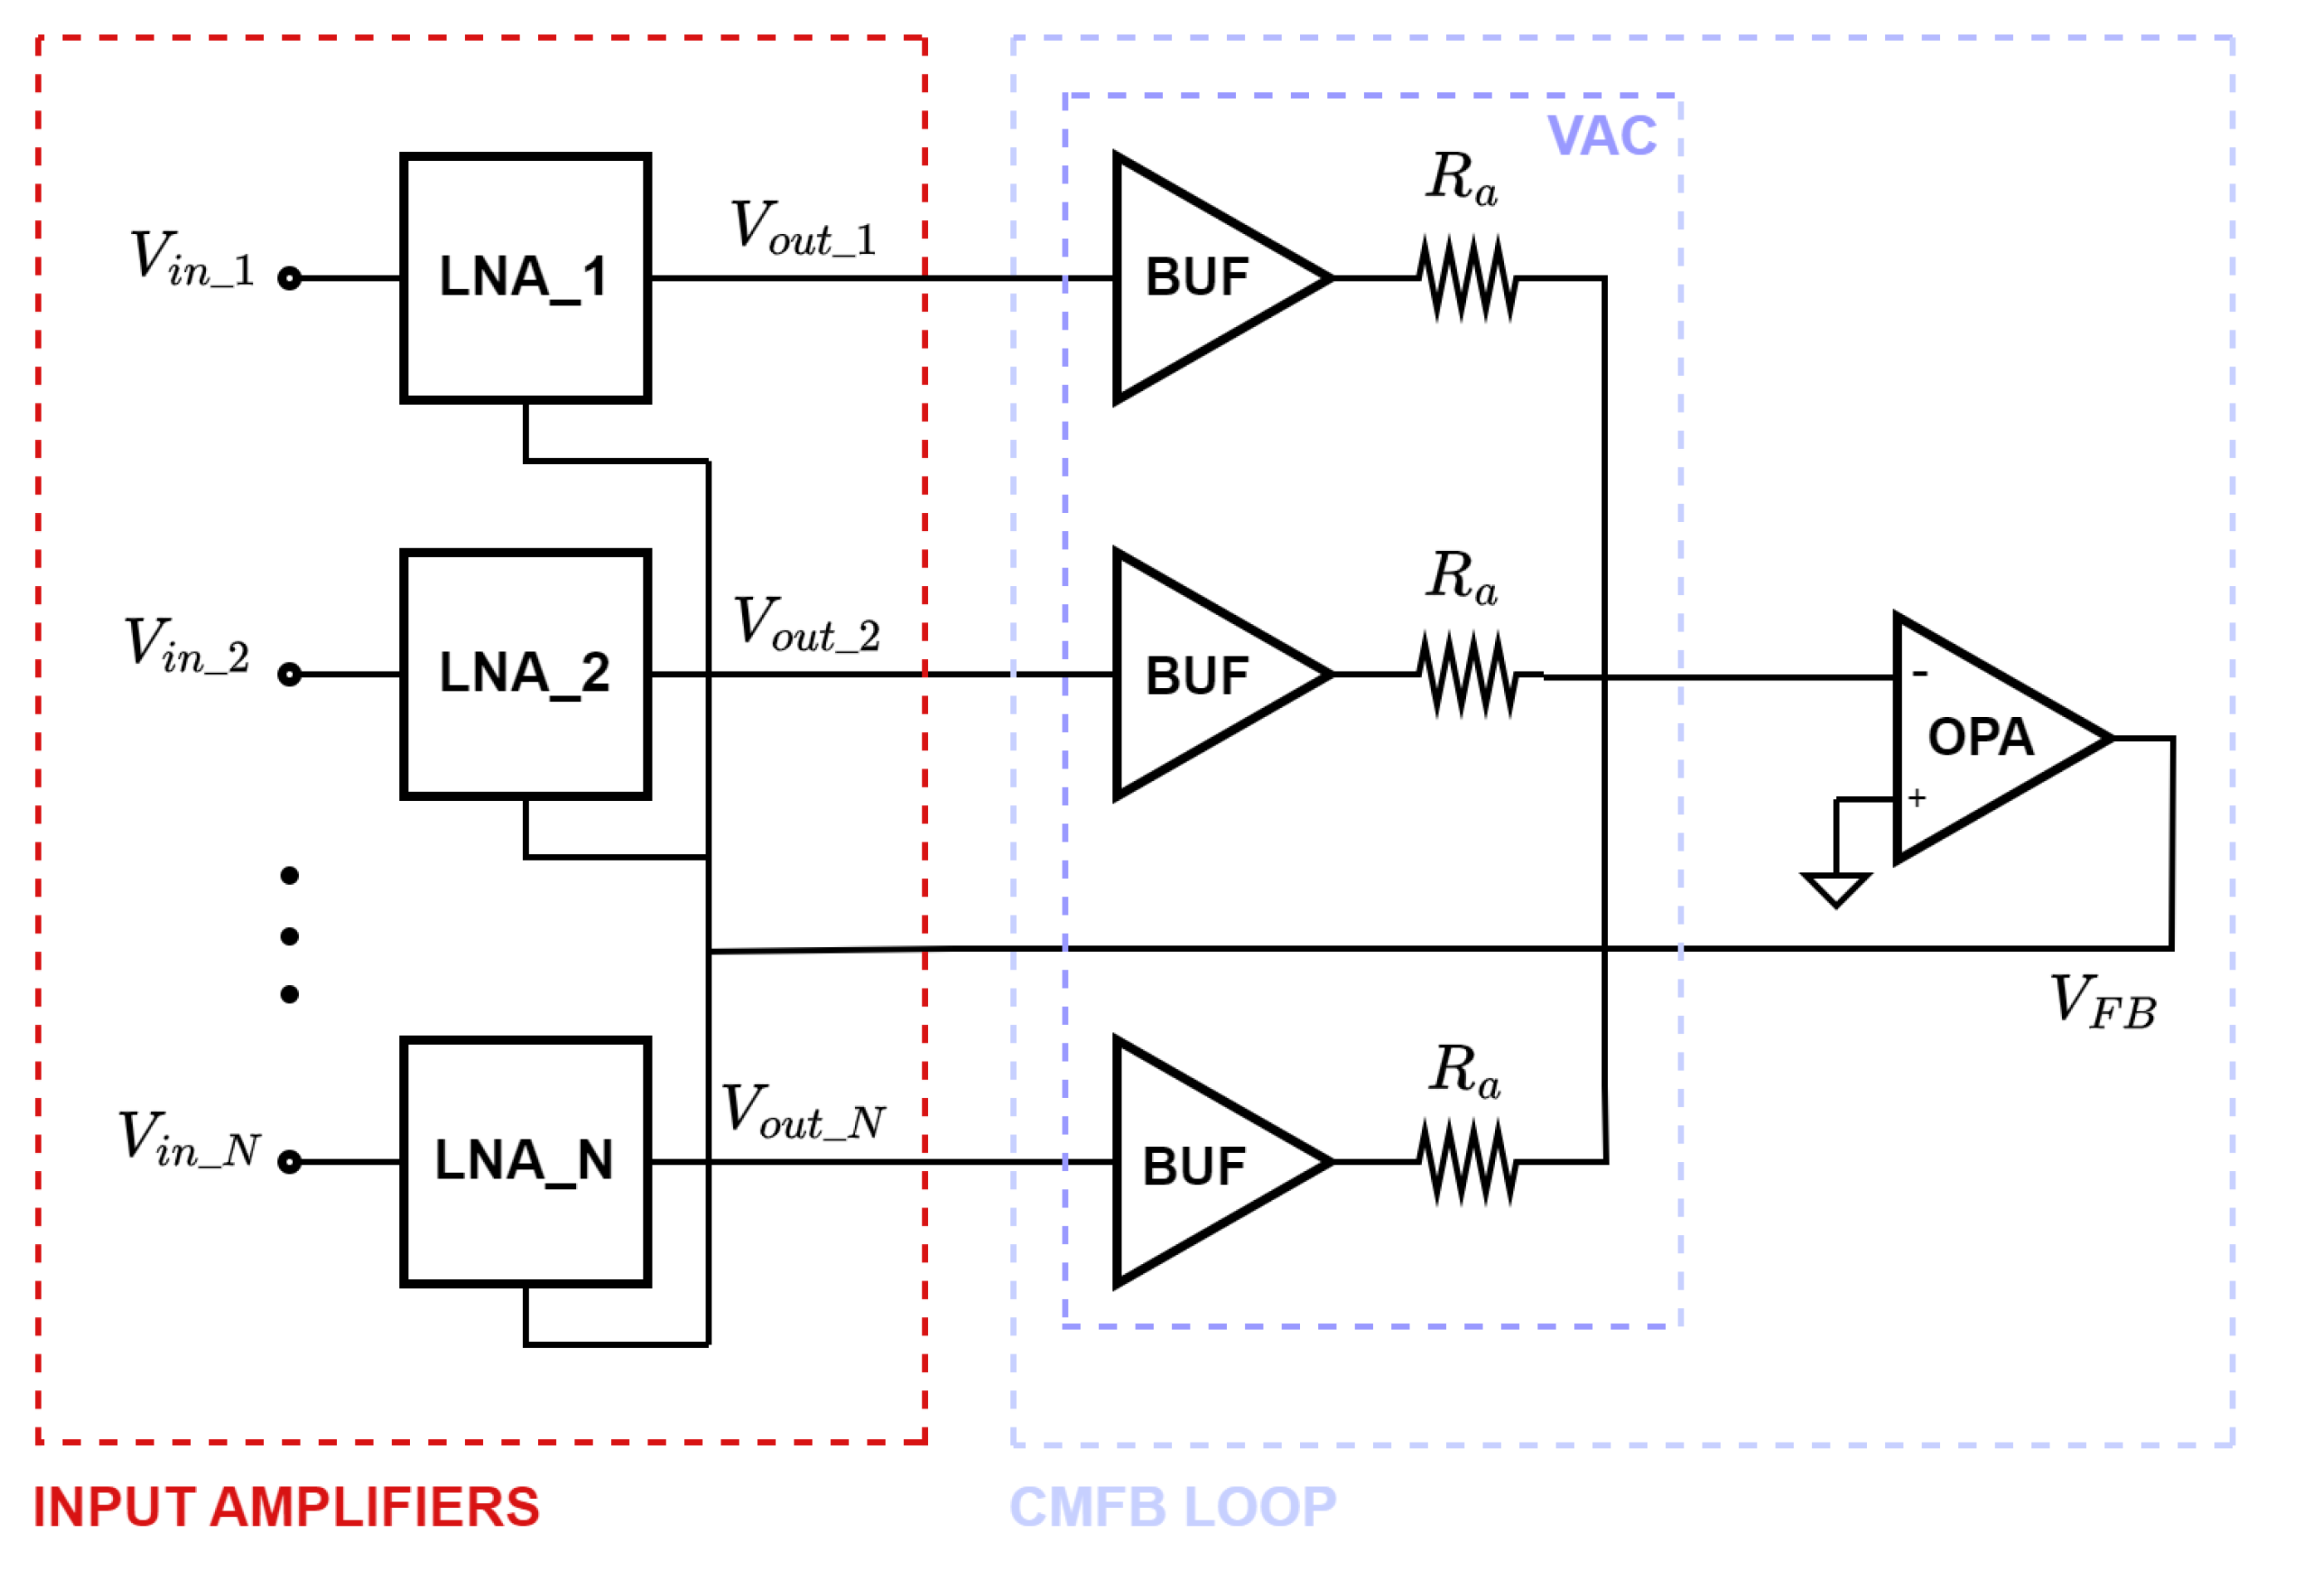
Figure 2.
Block diagram of DC-coupled front-end with current-based CMFB loop.
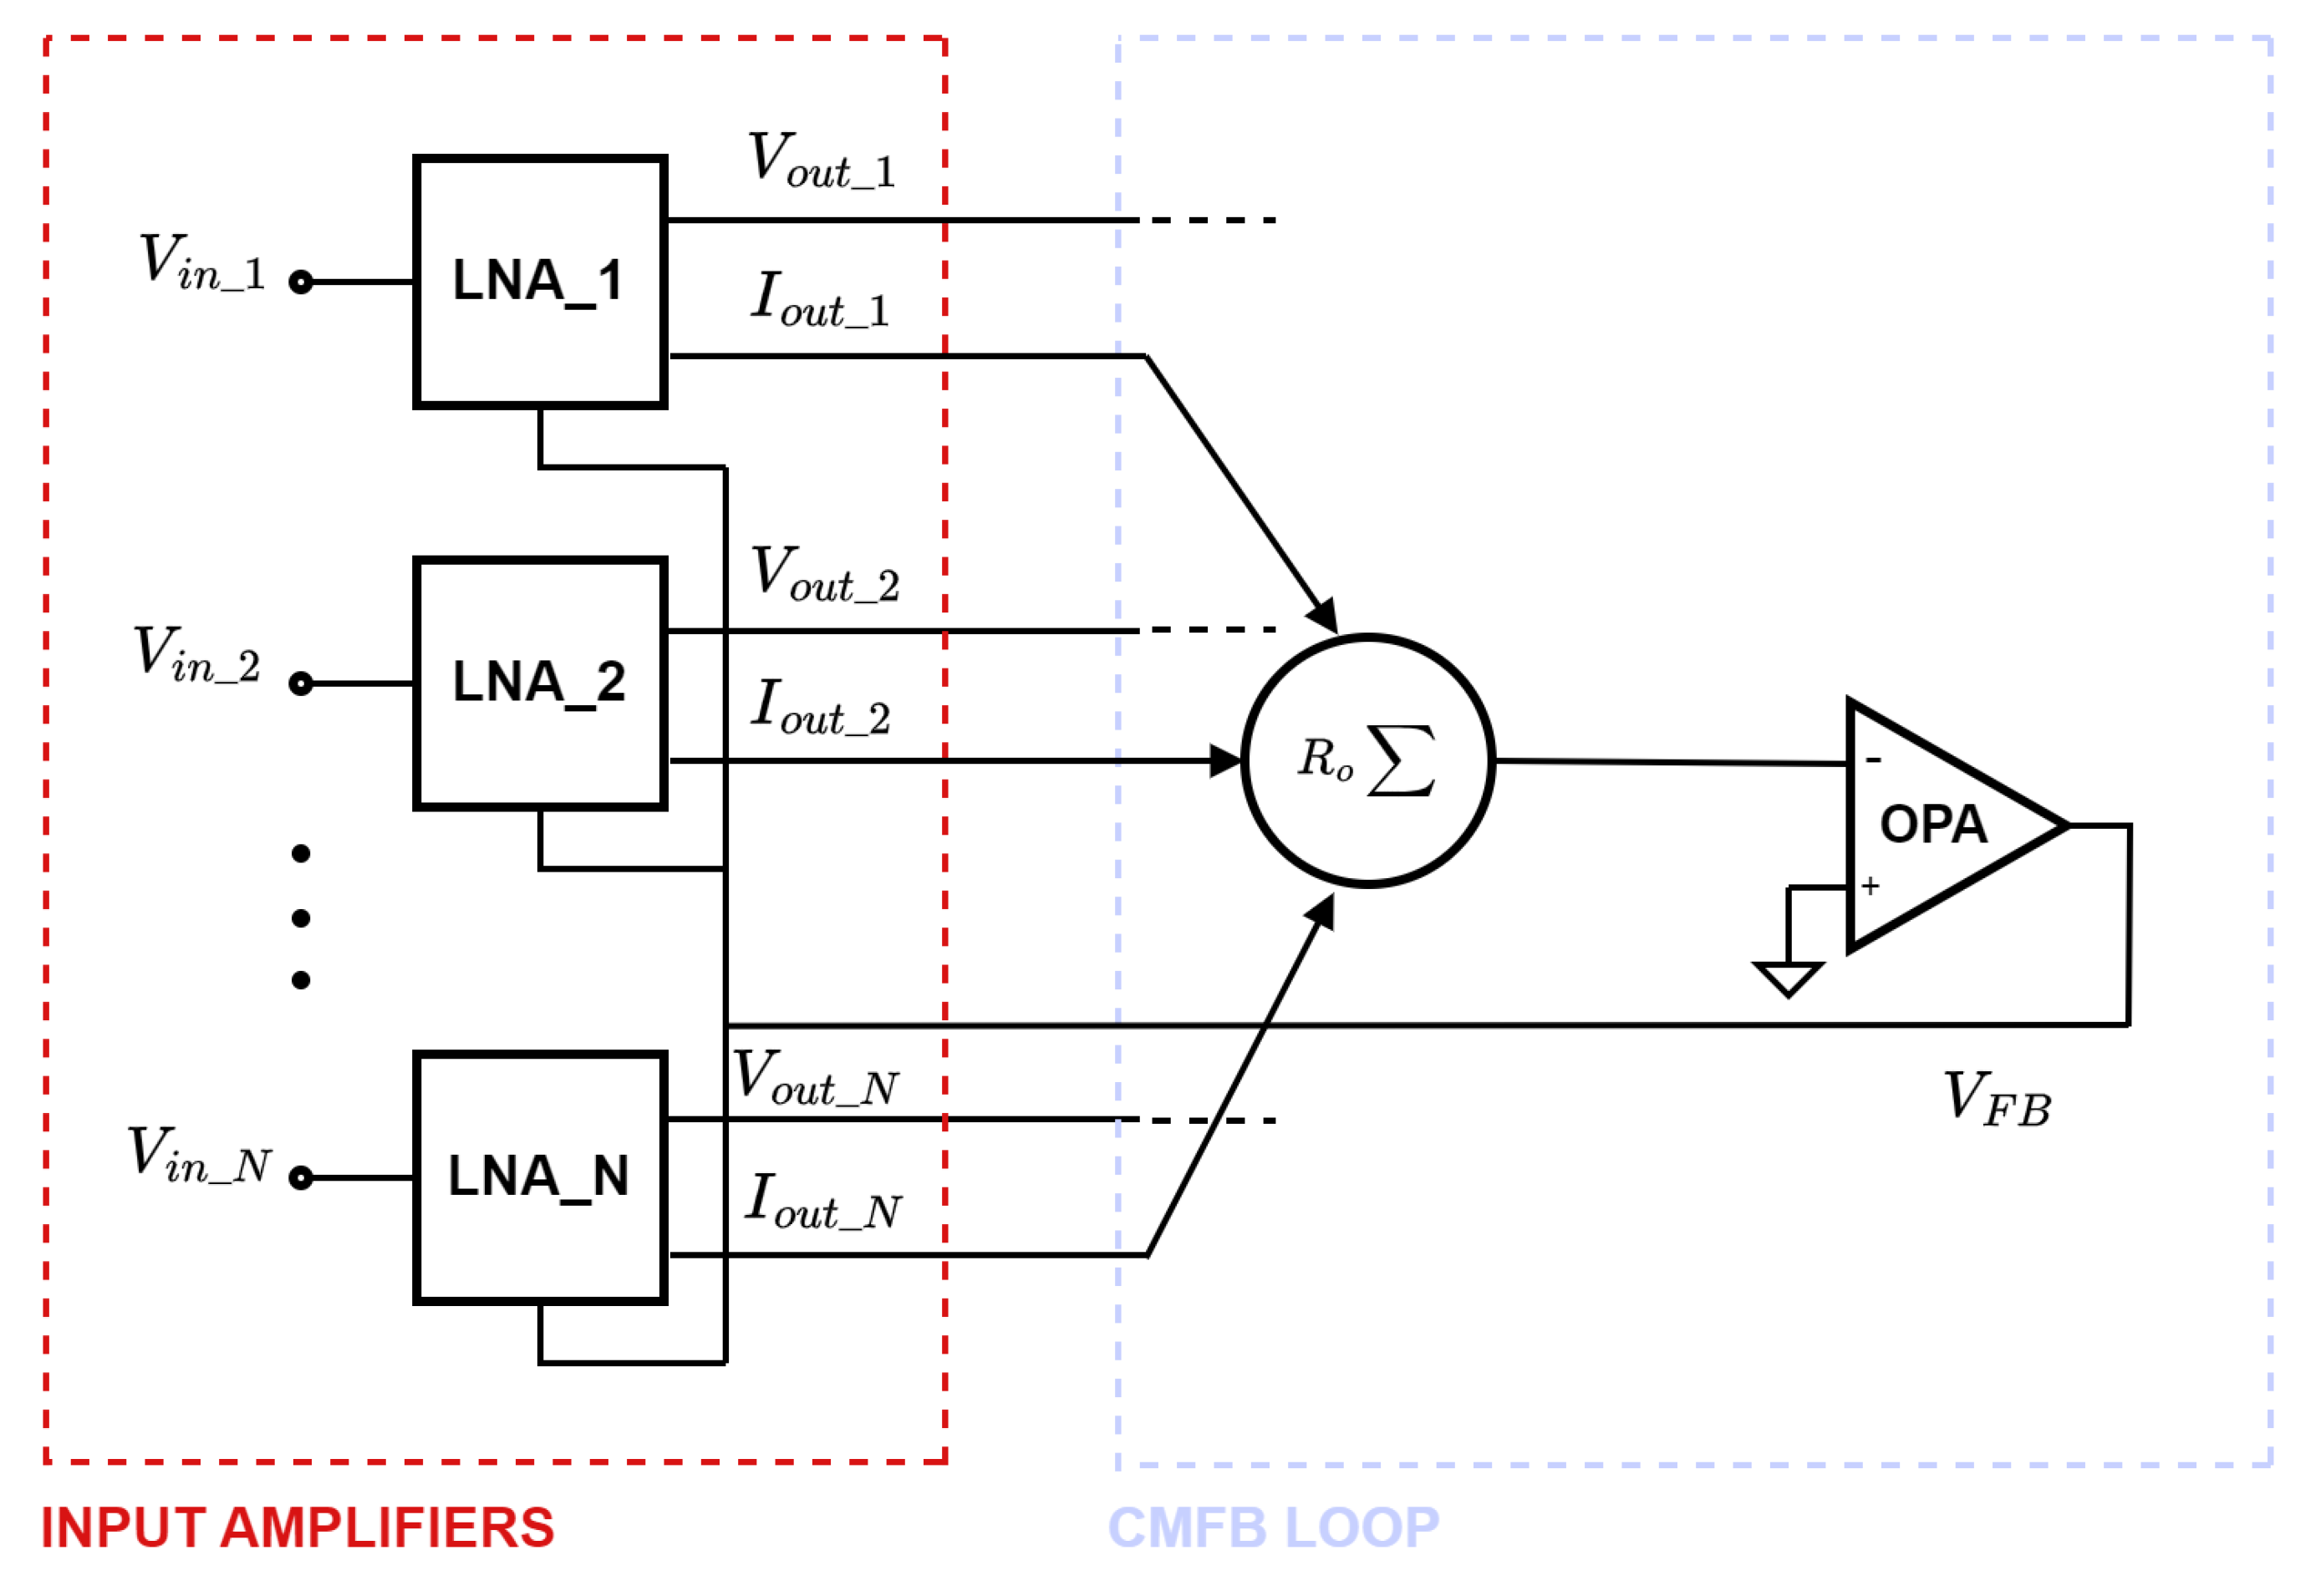
Figure 3.
Schematic of the input pixel amplifier employed in the multi-channel analog front-end.
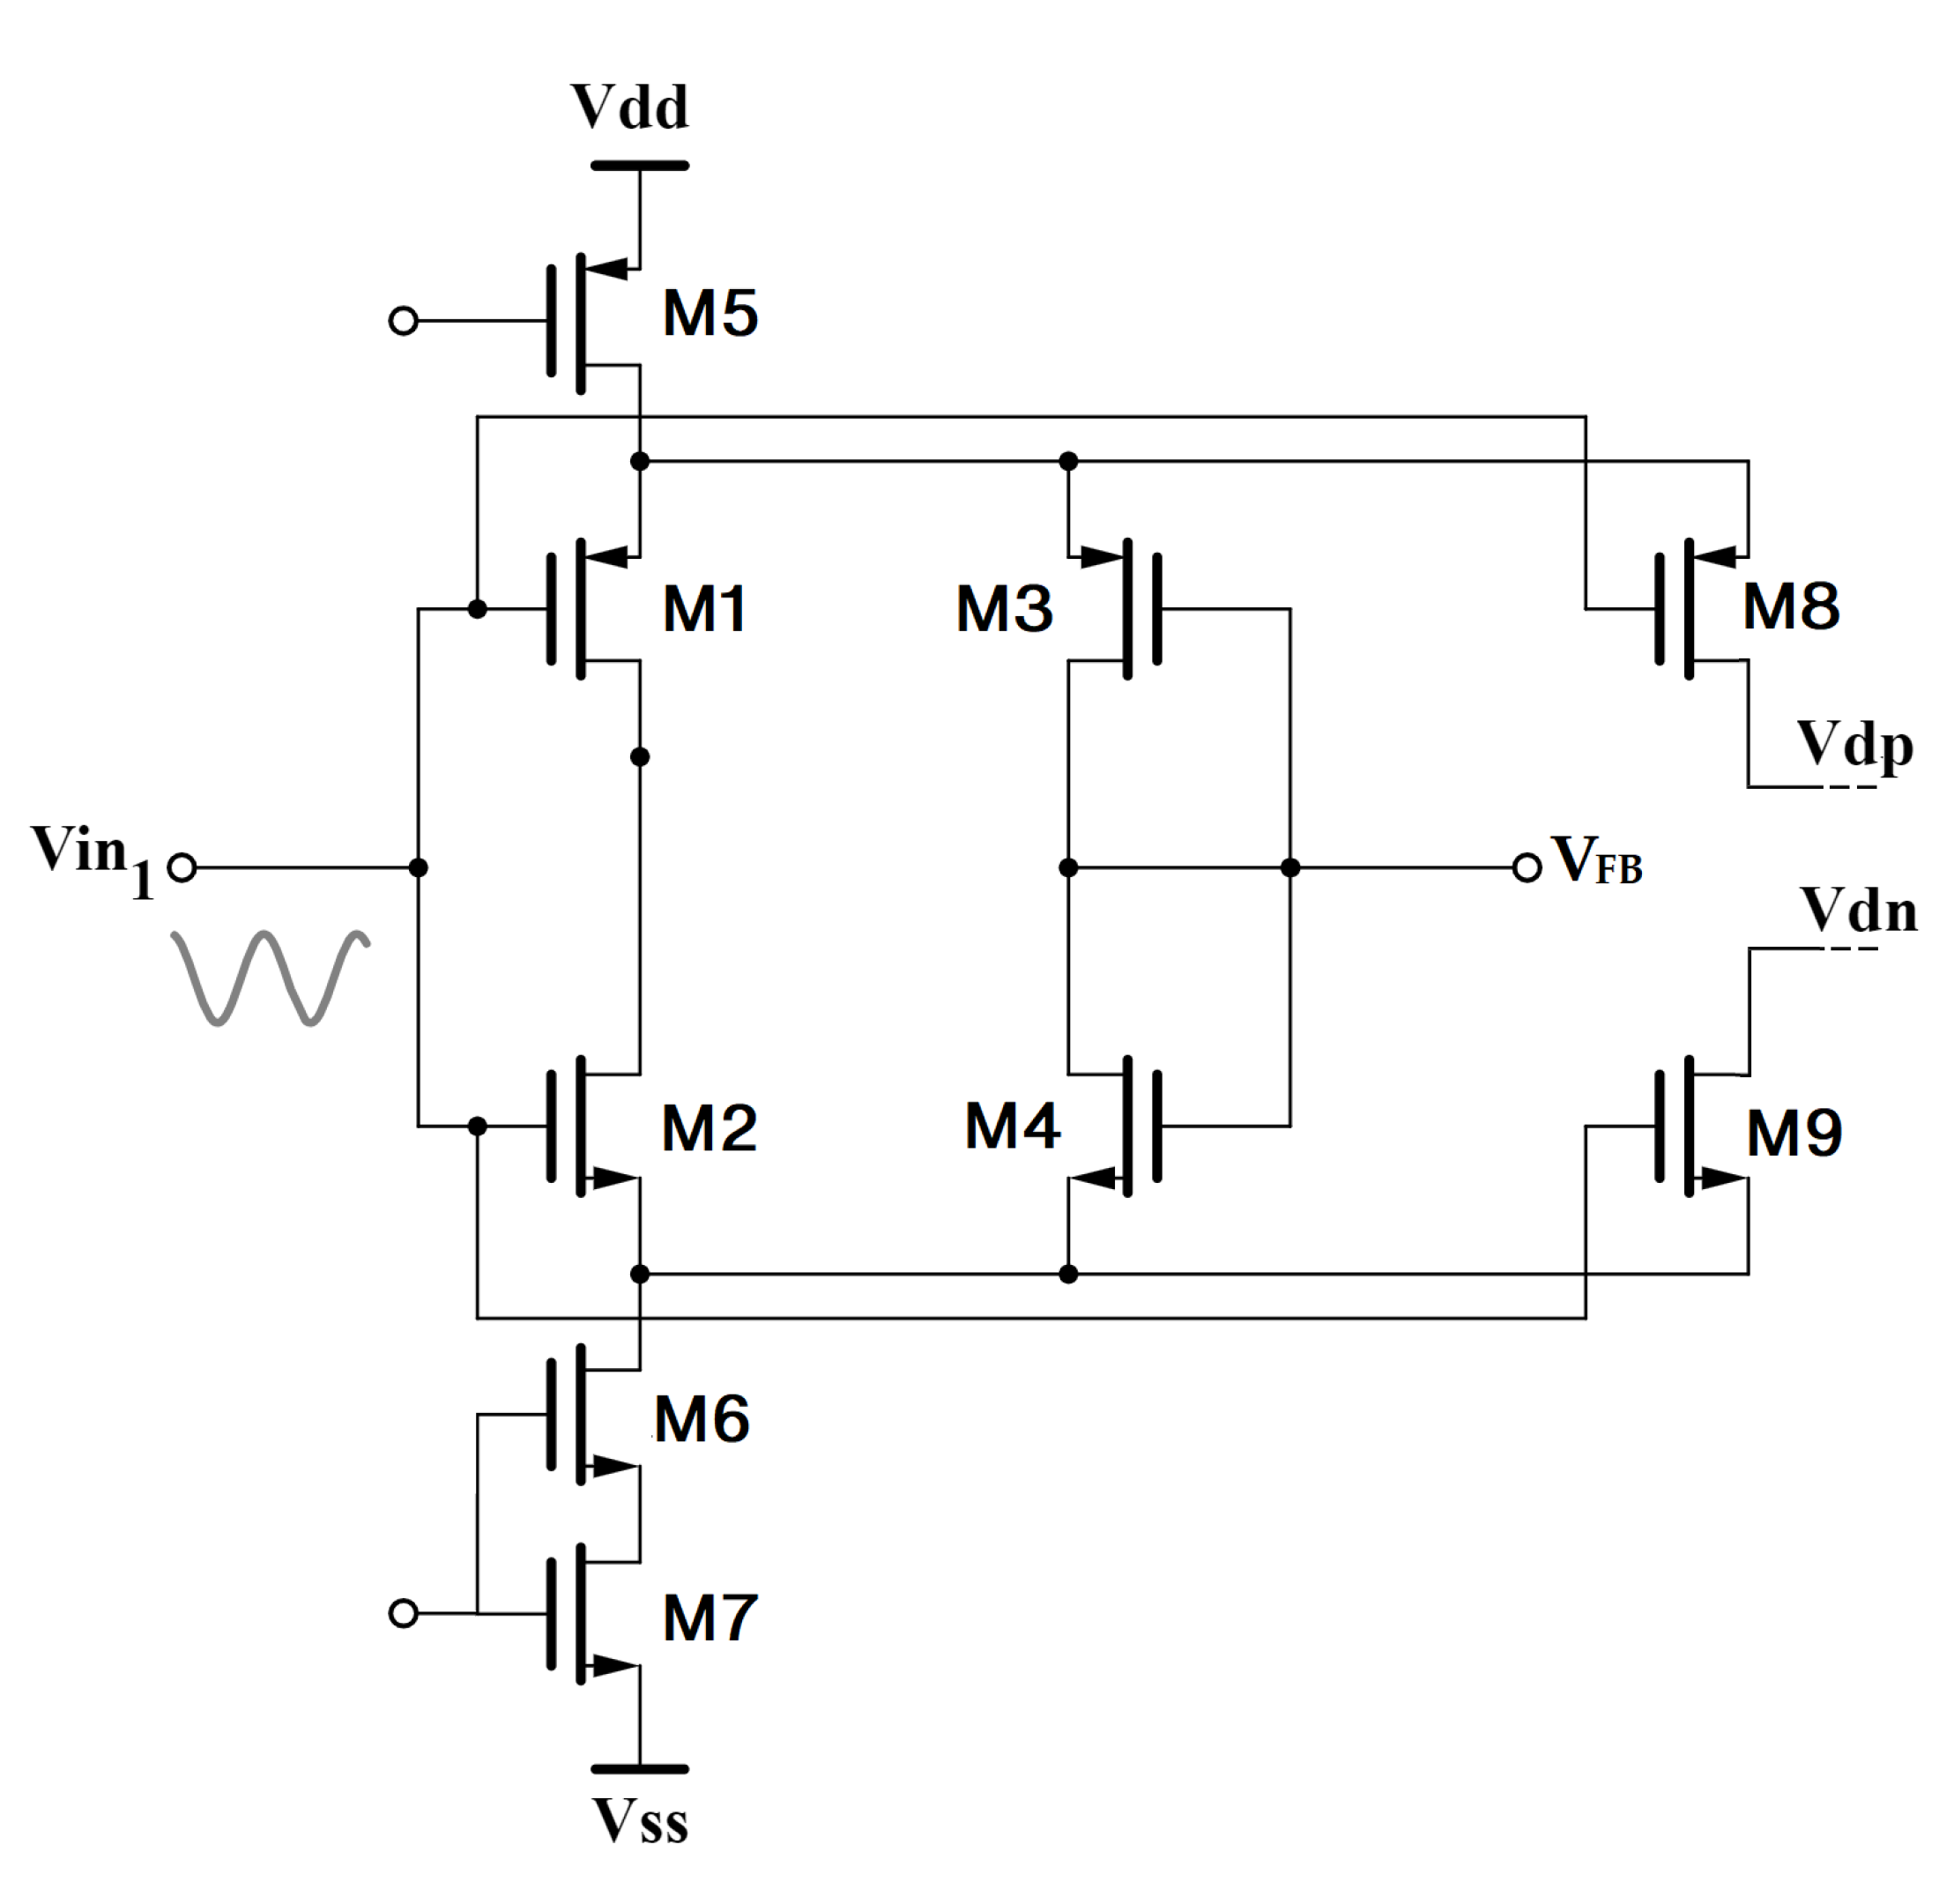
Figure 4.
Schematic of the current summing stage of the CMFB loop.
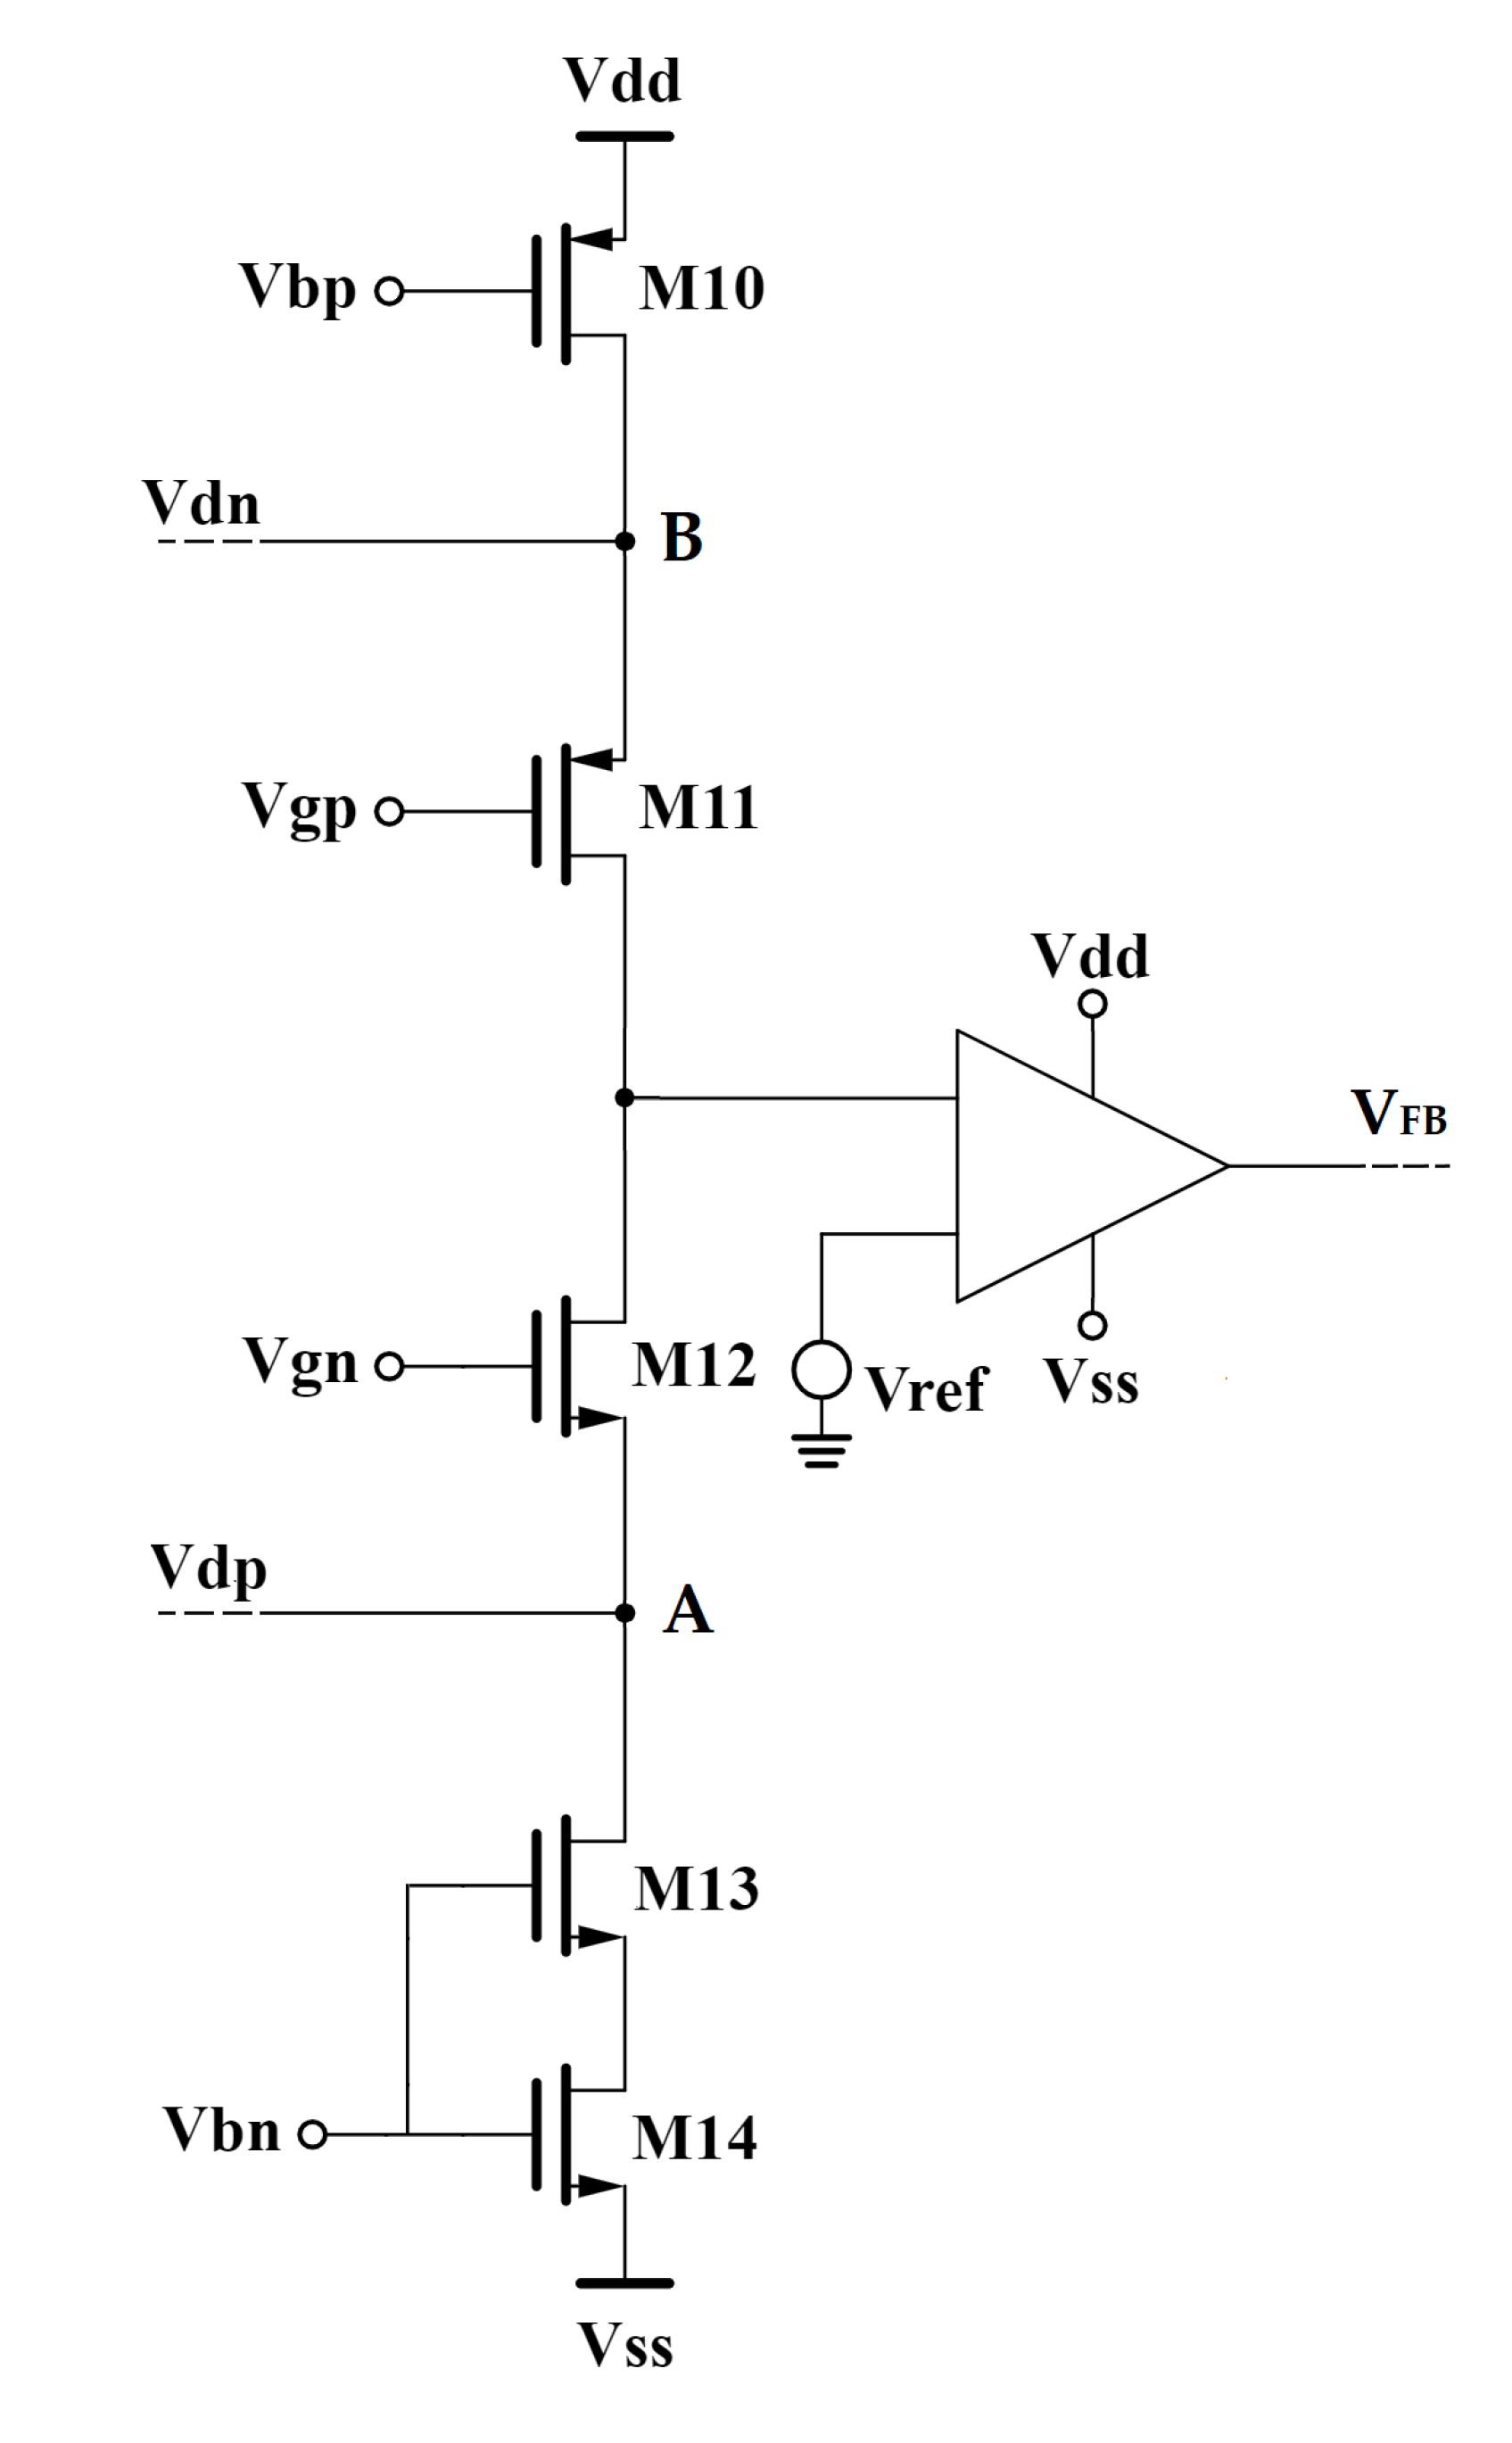
Figure 5.
Schematic of error amplifier.
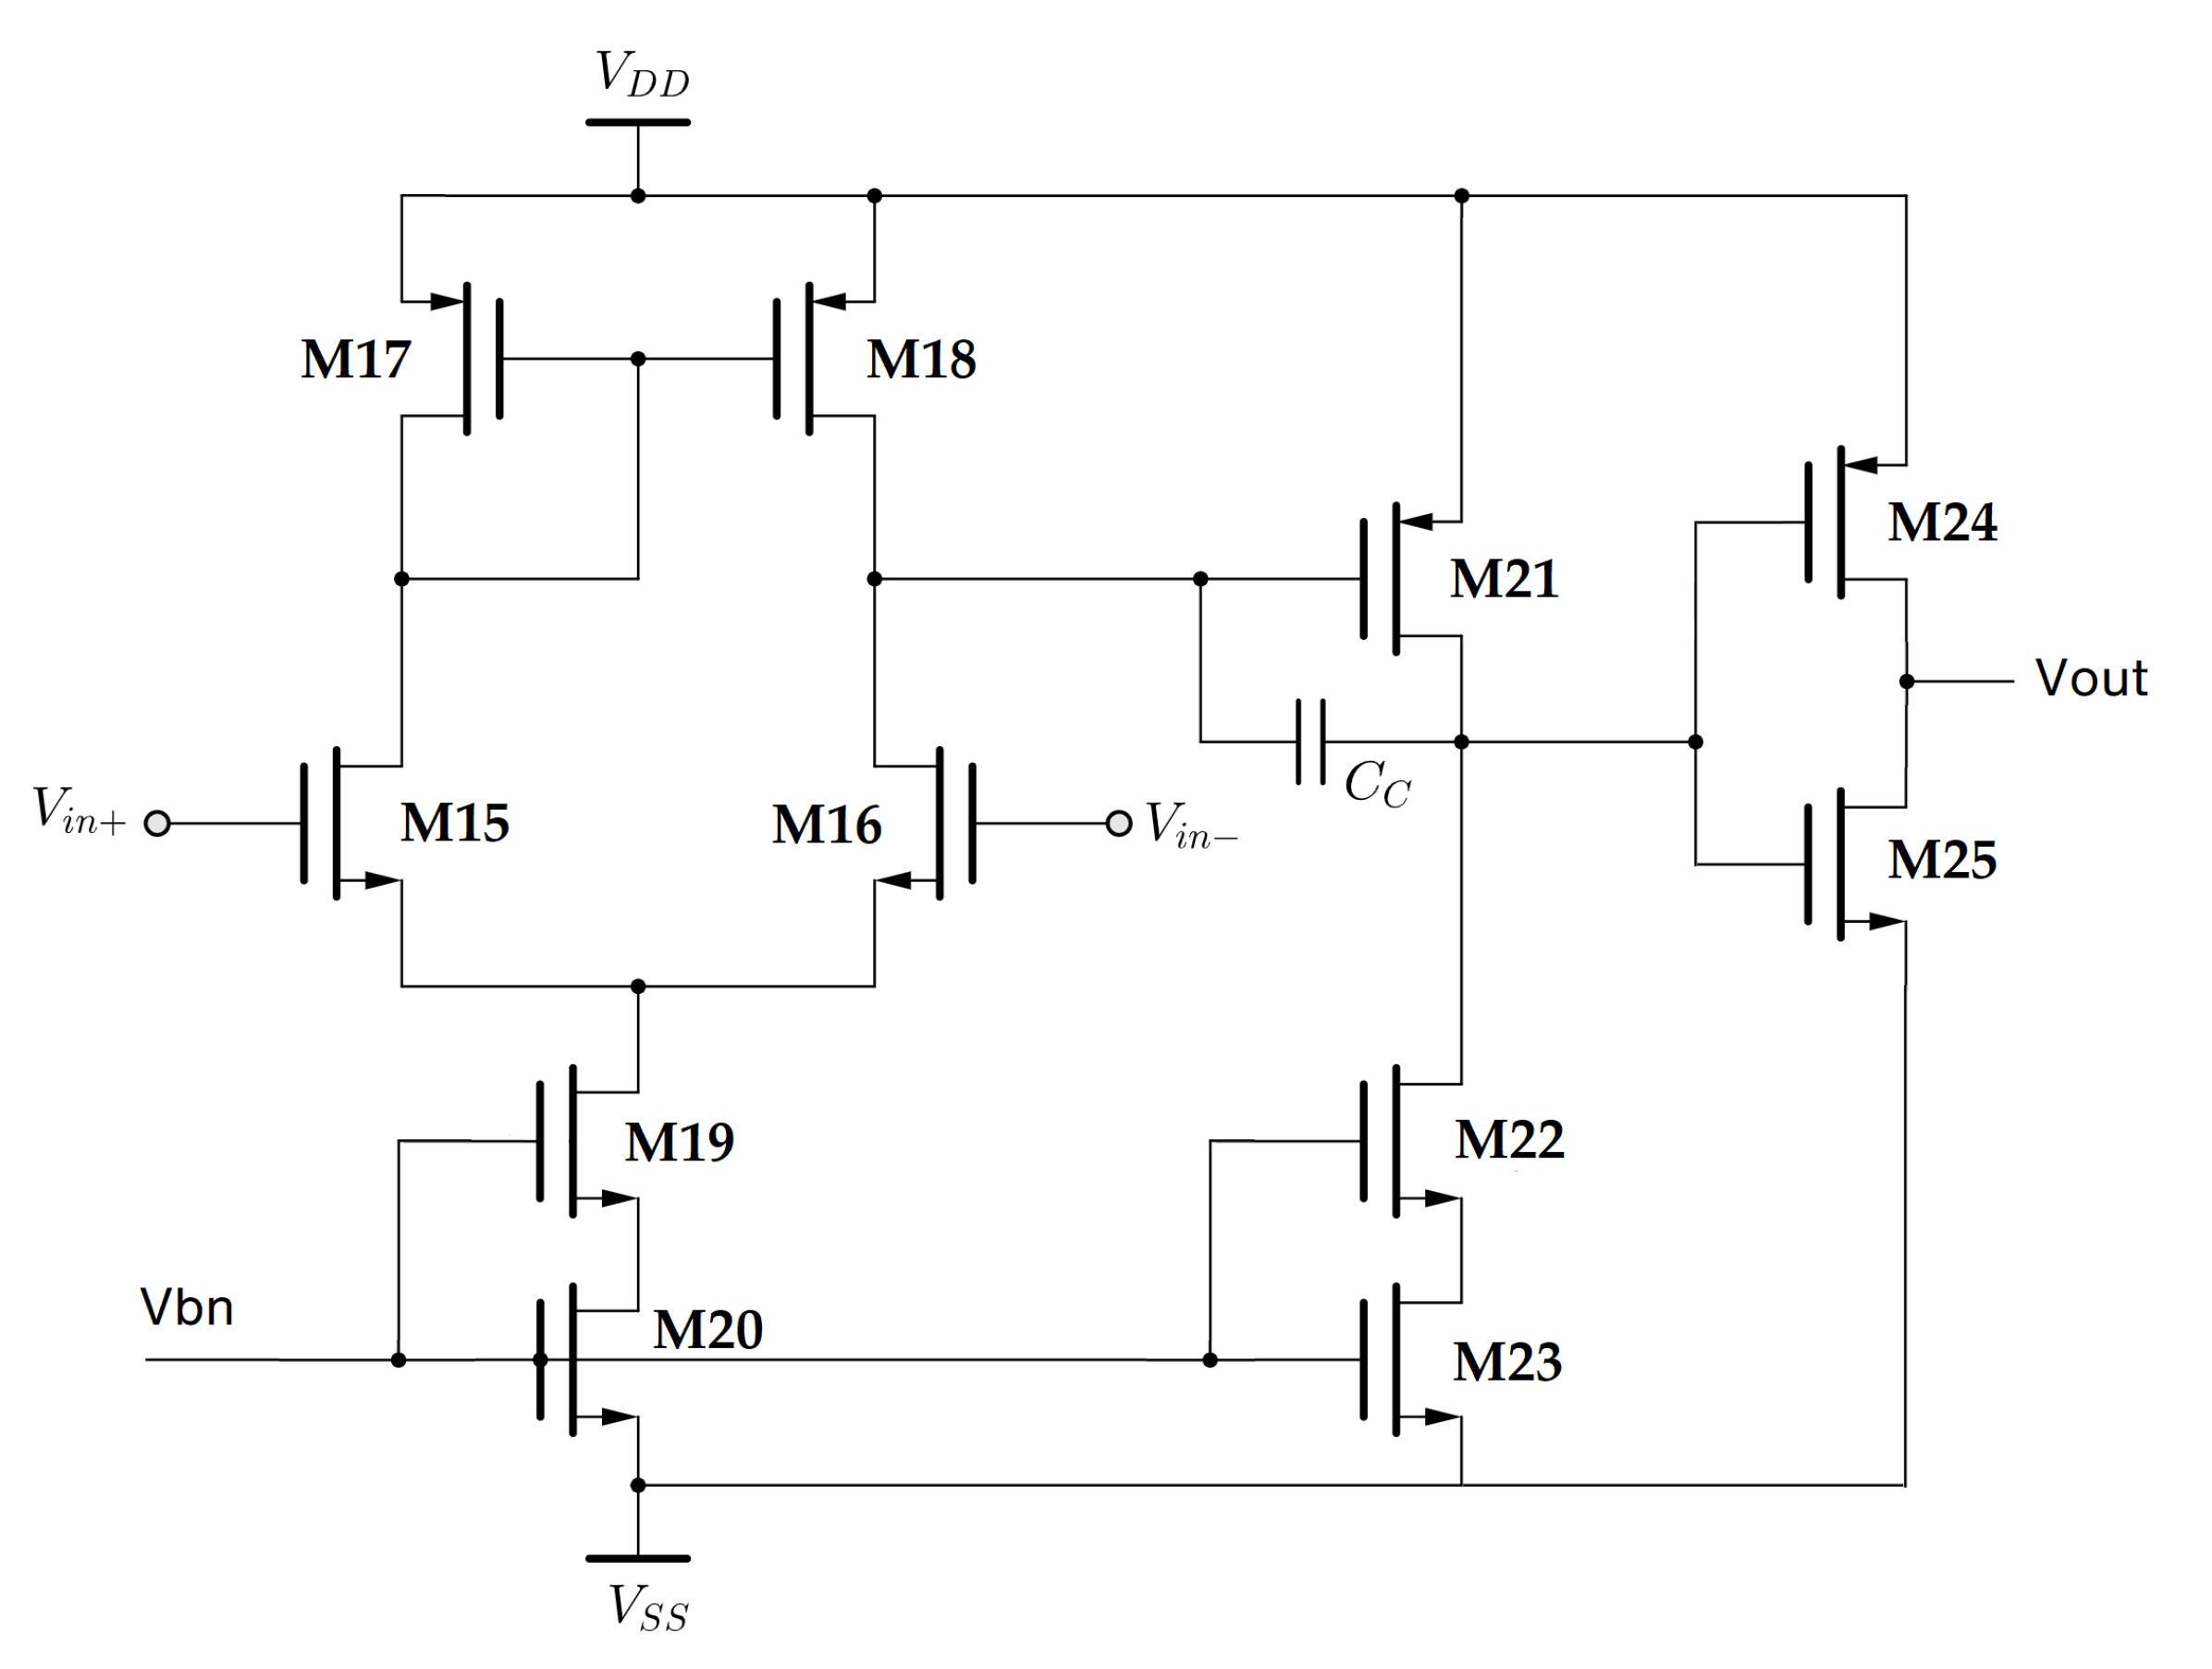
Figure 6.
Small-signal model of the k-th pixel amplifier stage of the front-end.
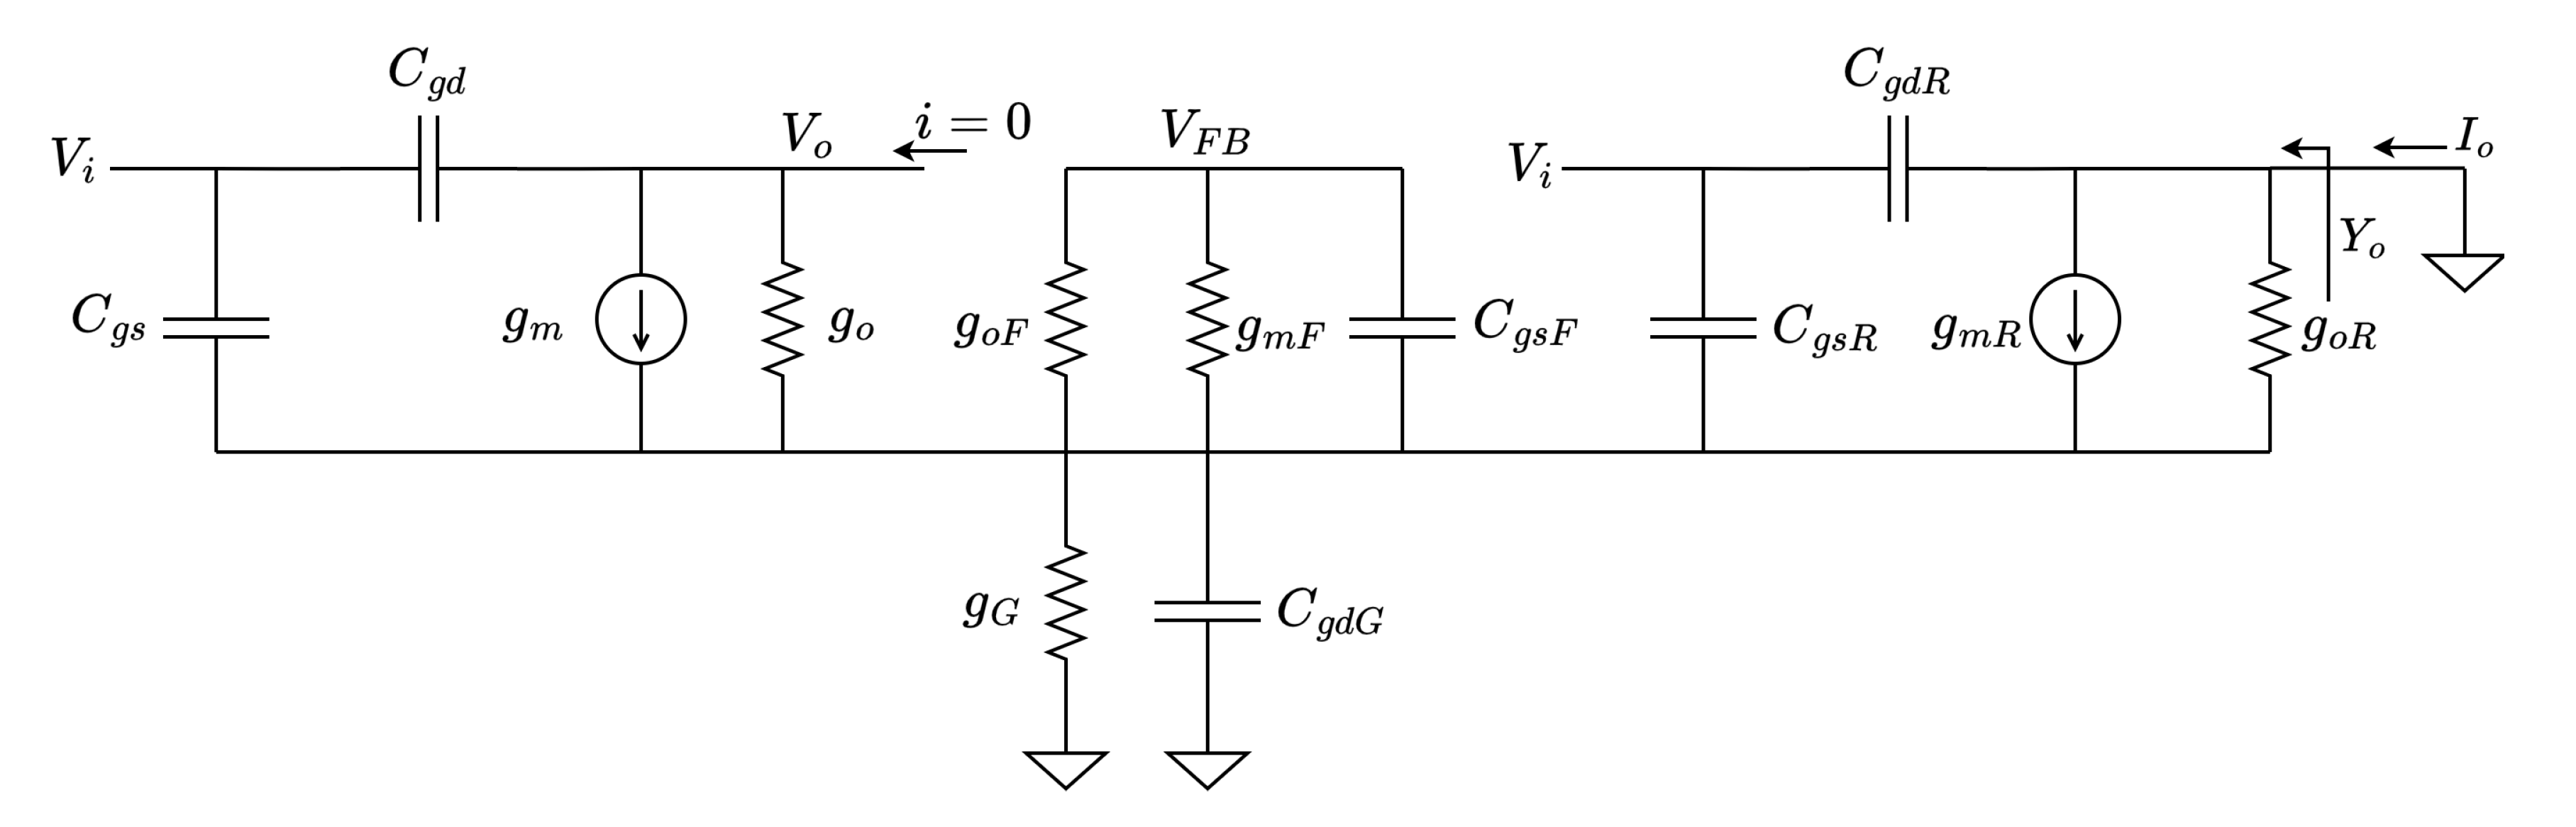
Figure 7.
Small-signal model of the CMFB stage of the front-end.
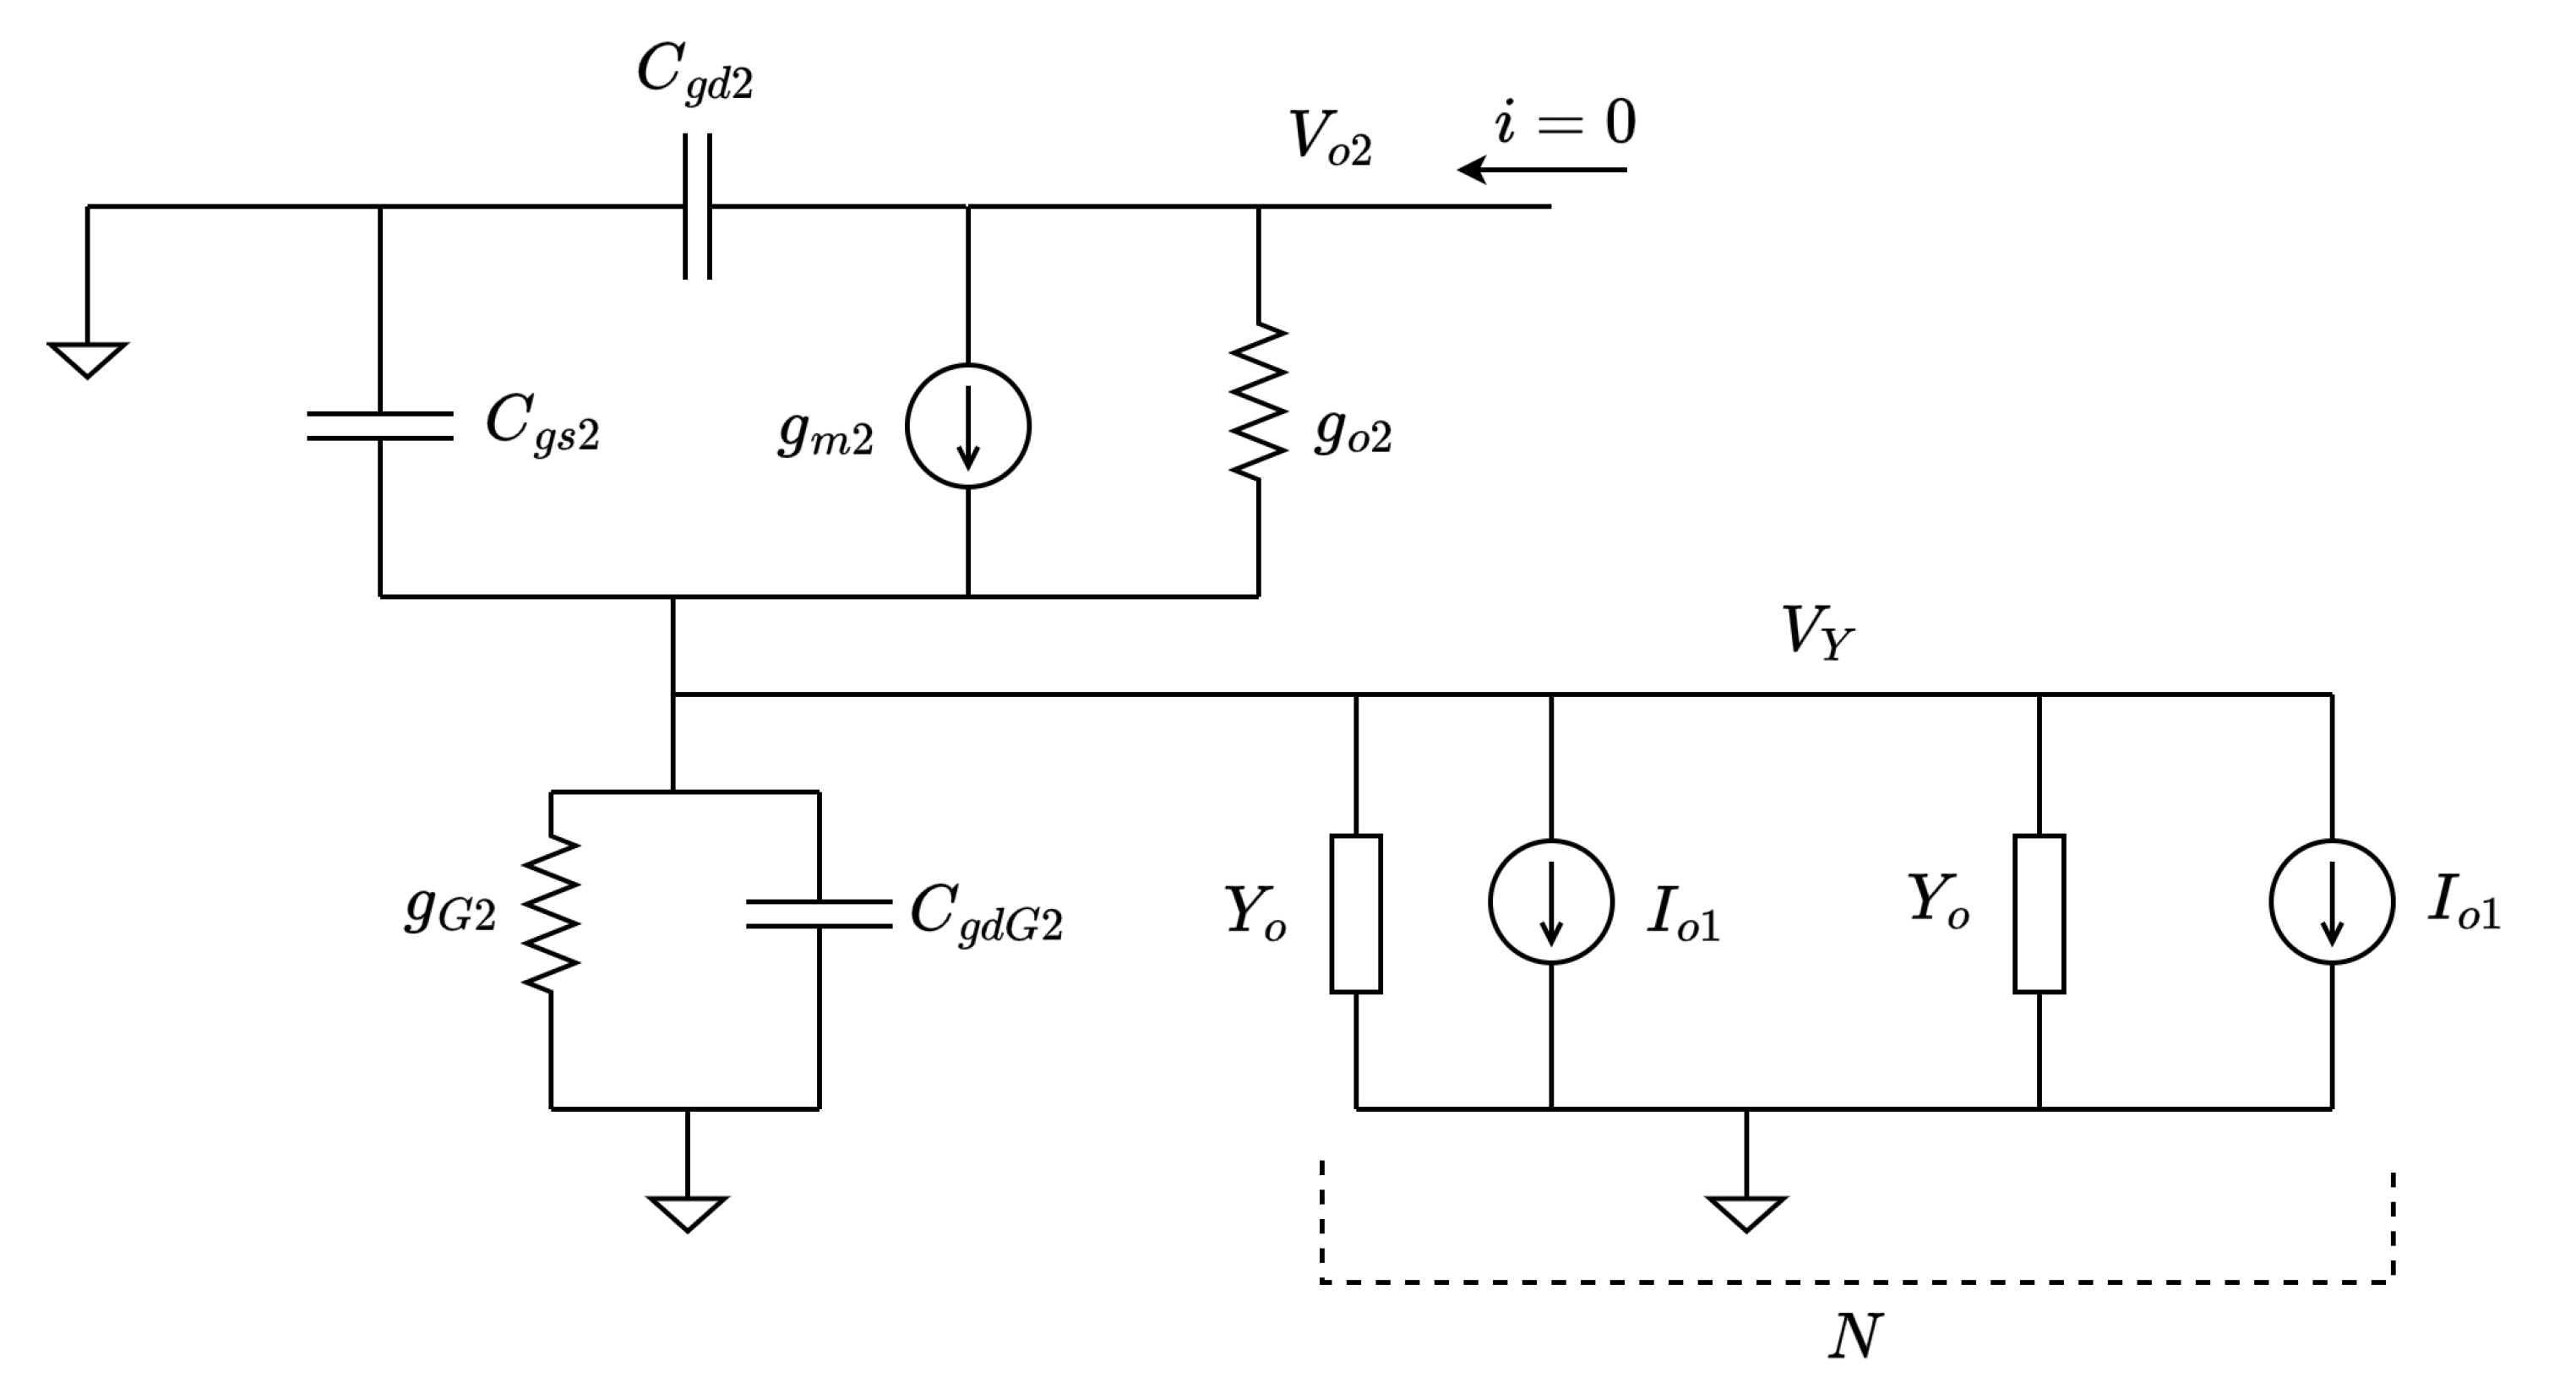
Figure 8.
(a) Noise model of the first stage. (b) Noise model of the CMFB stage.
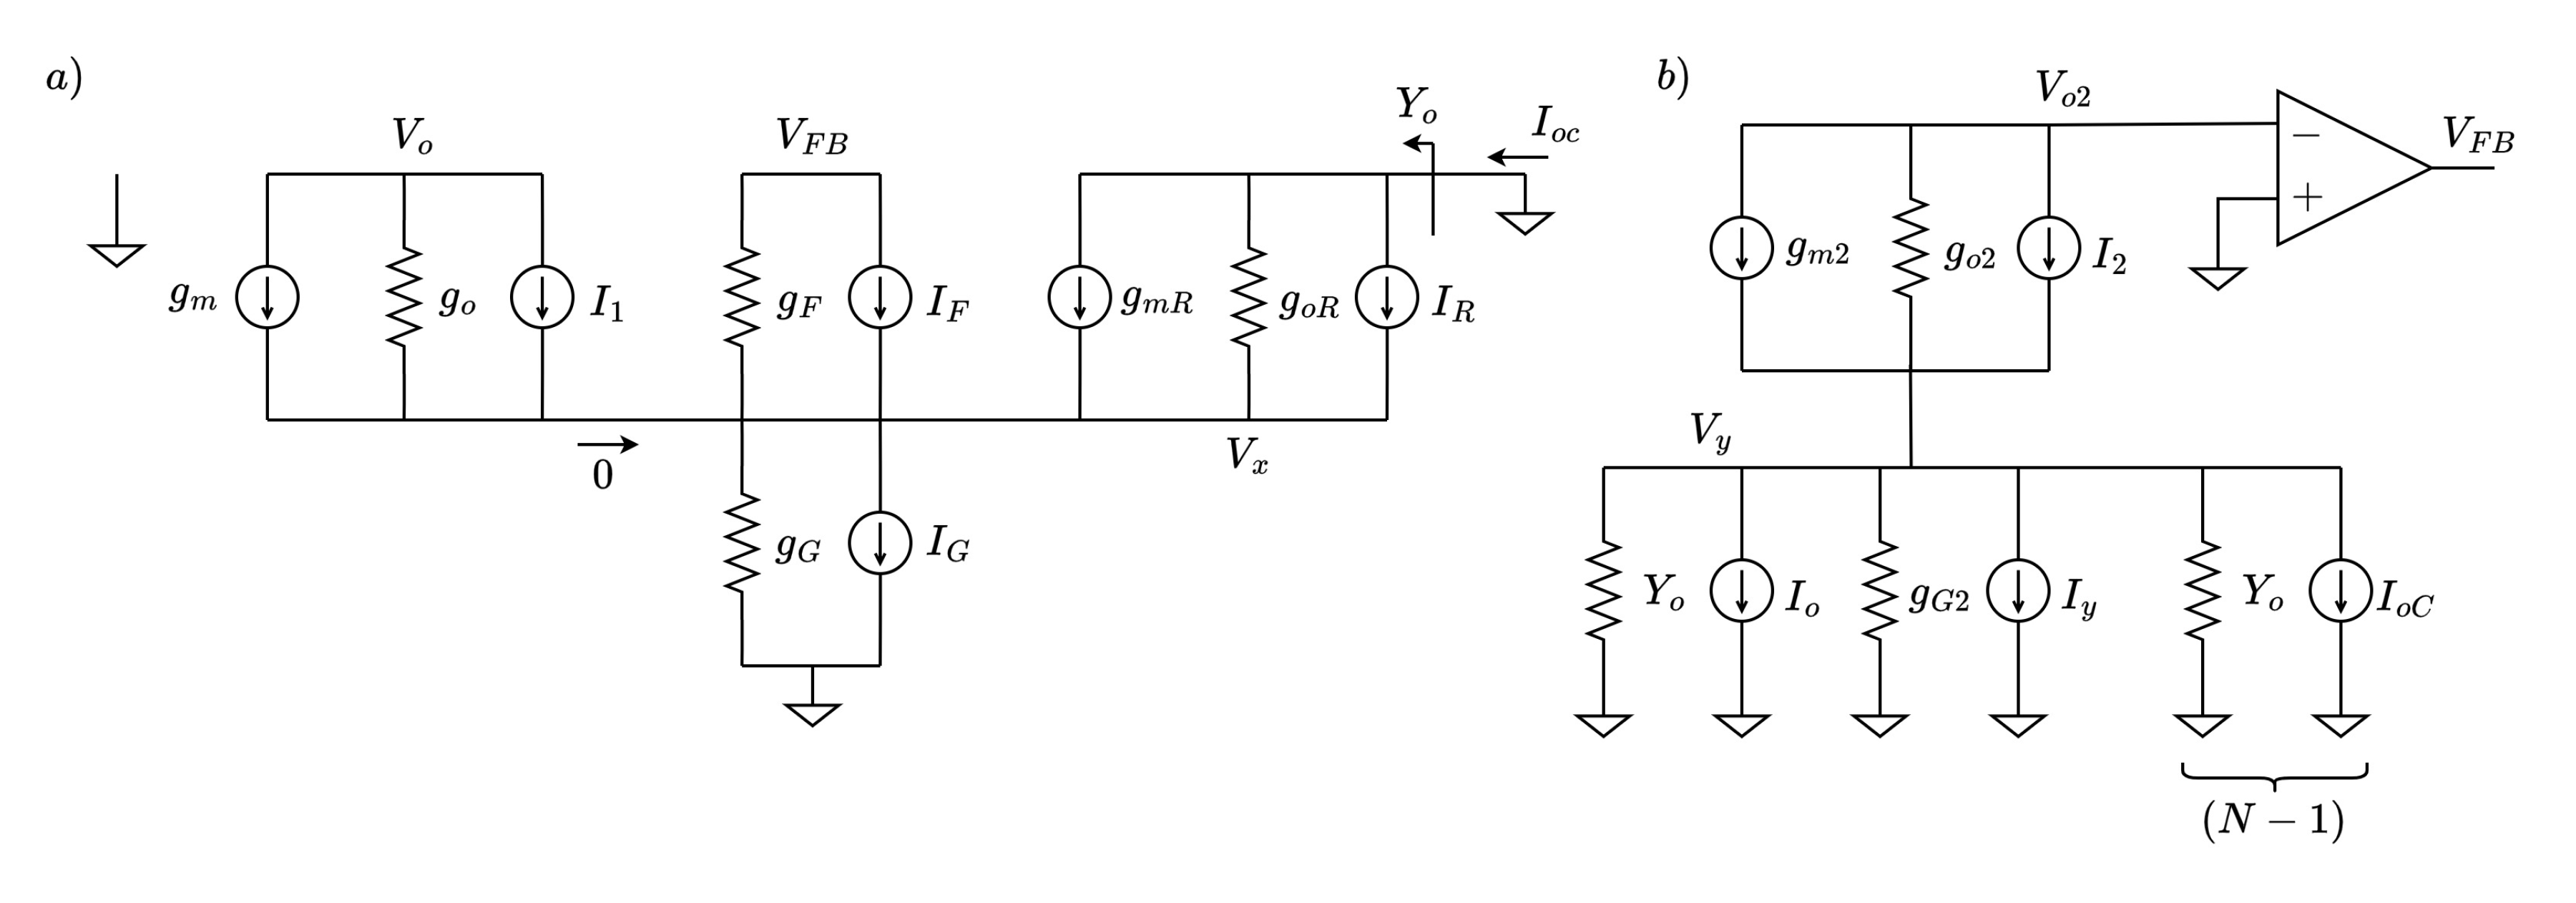
Figure 9.
Layout of the pixel amplifier.
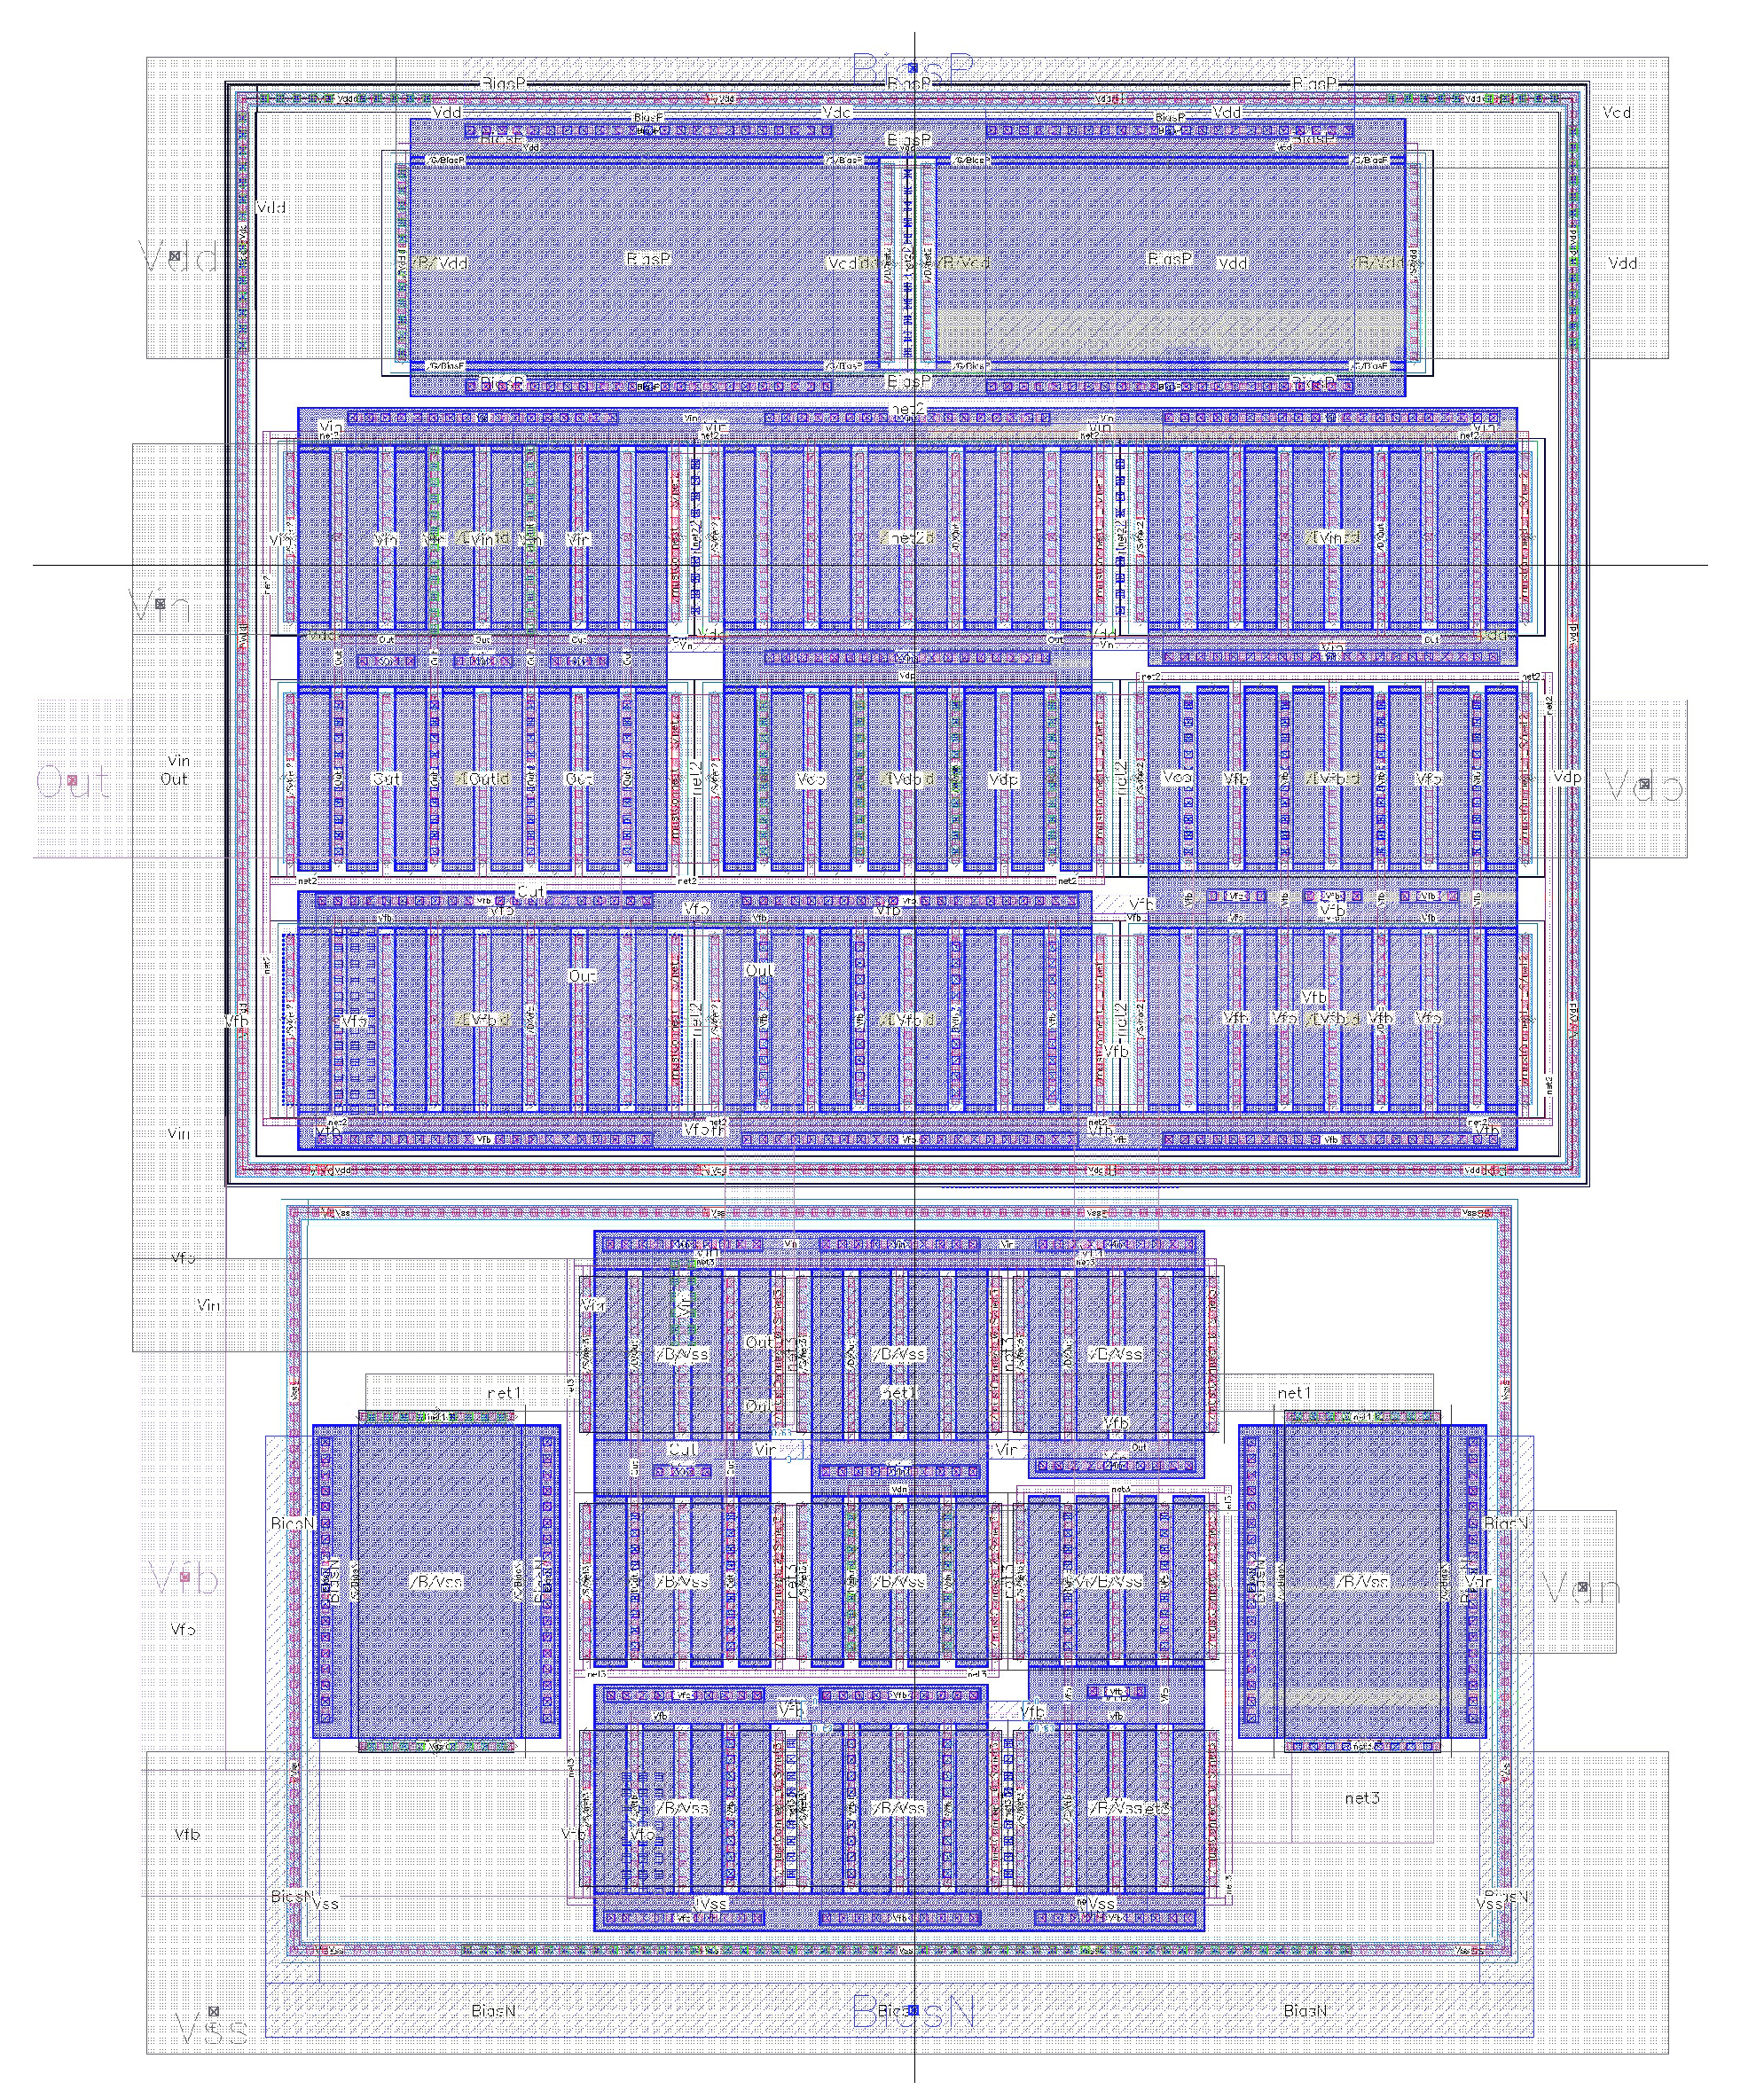
Figure 10.
Differential gain of the main amplifier within the proposed front-end.
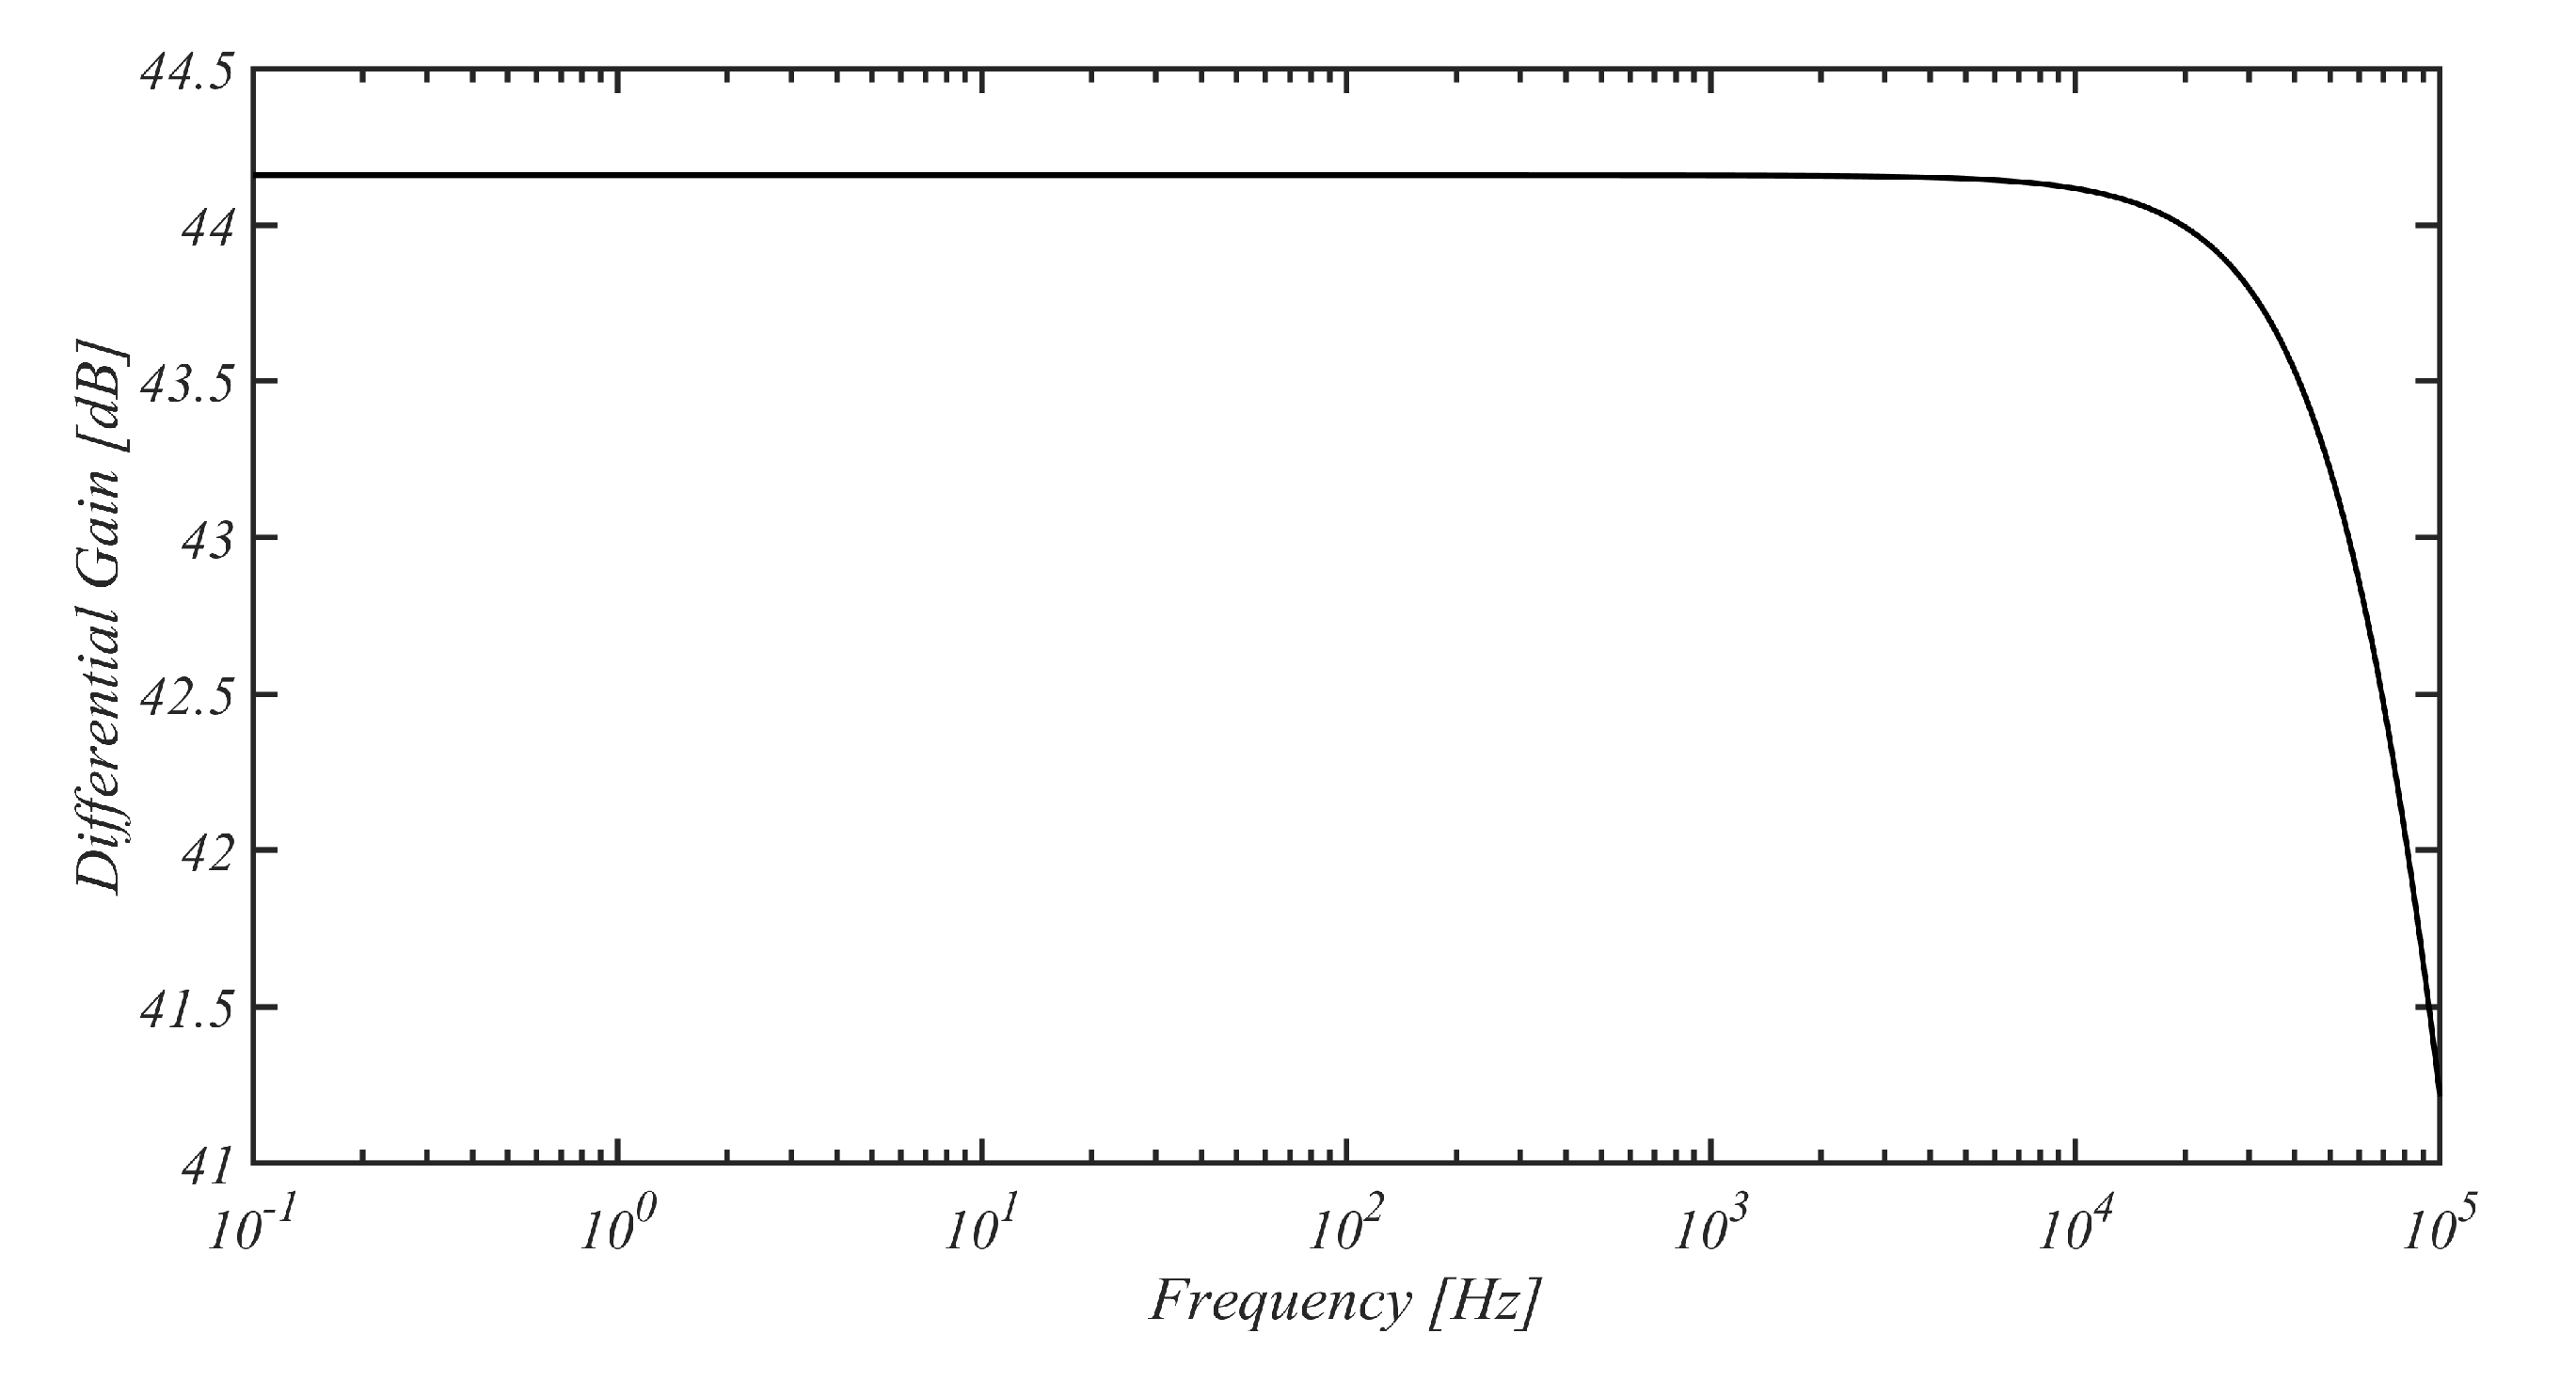
Figure 11.
SCMRR of the proposed front-end.
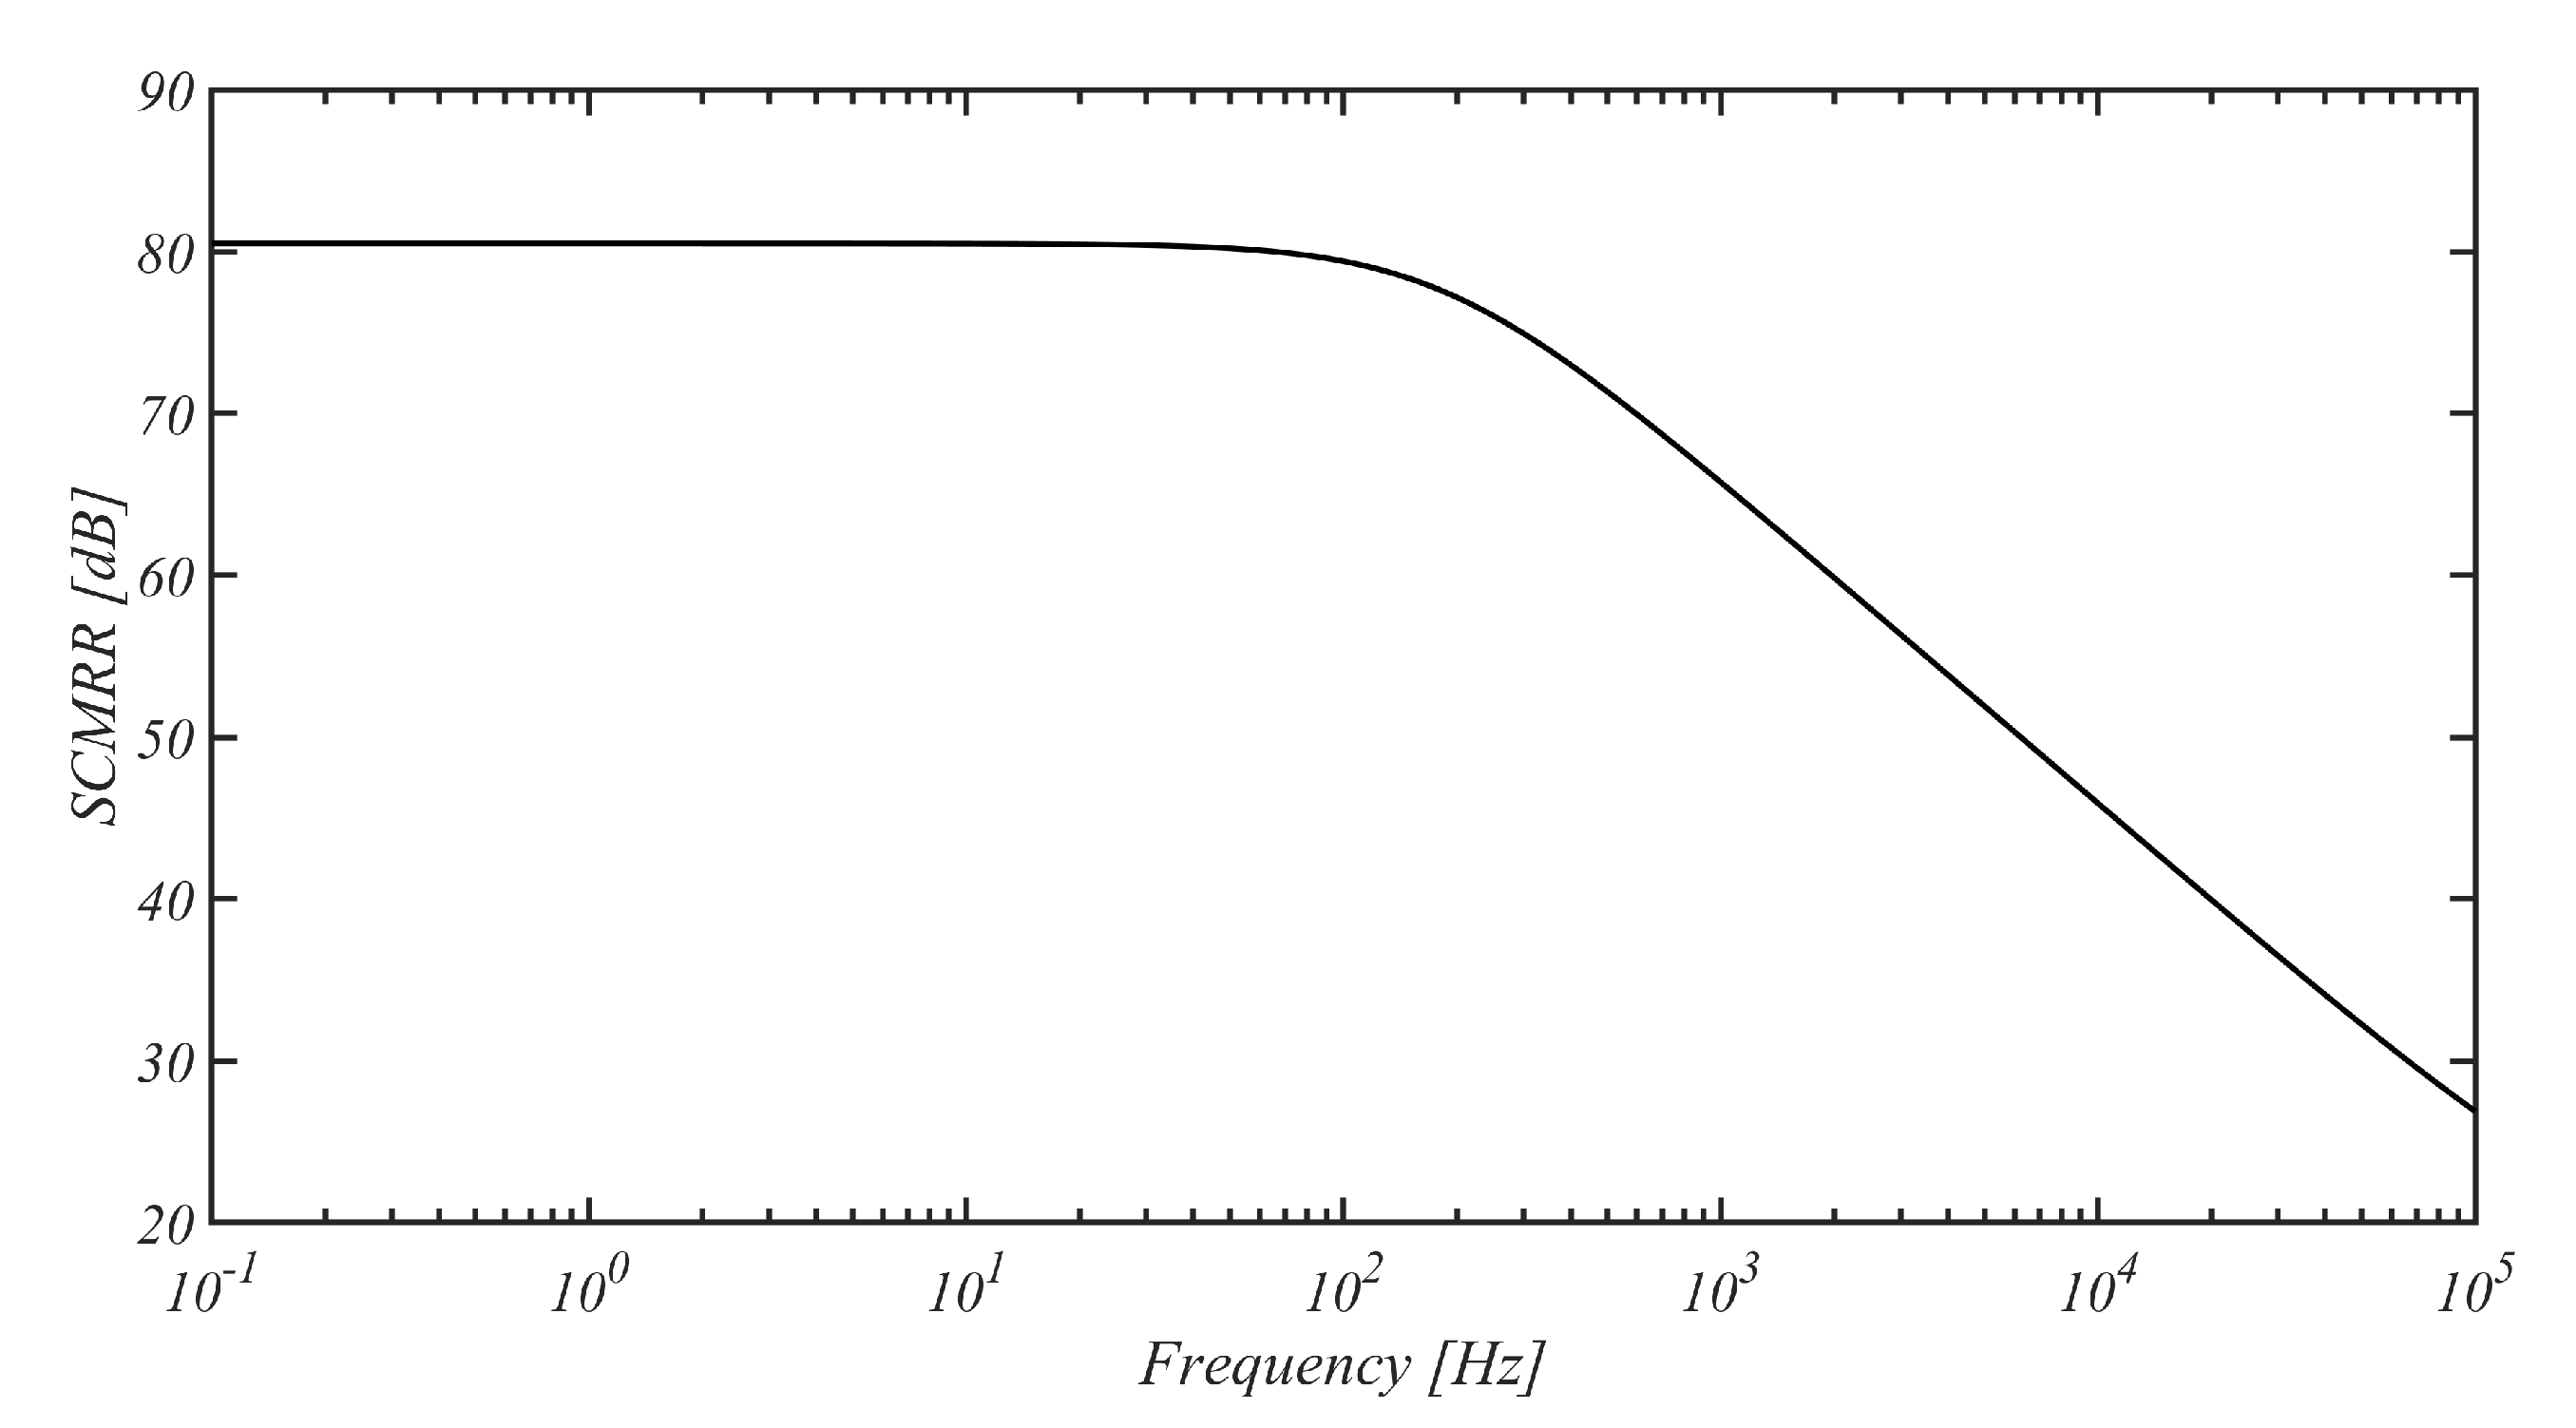
Figure 12.
PSRR of the proposed front-end.
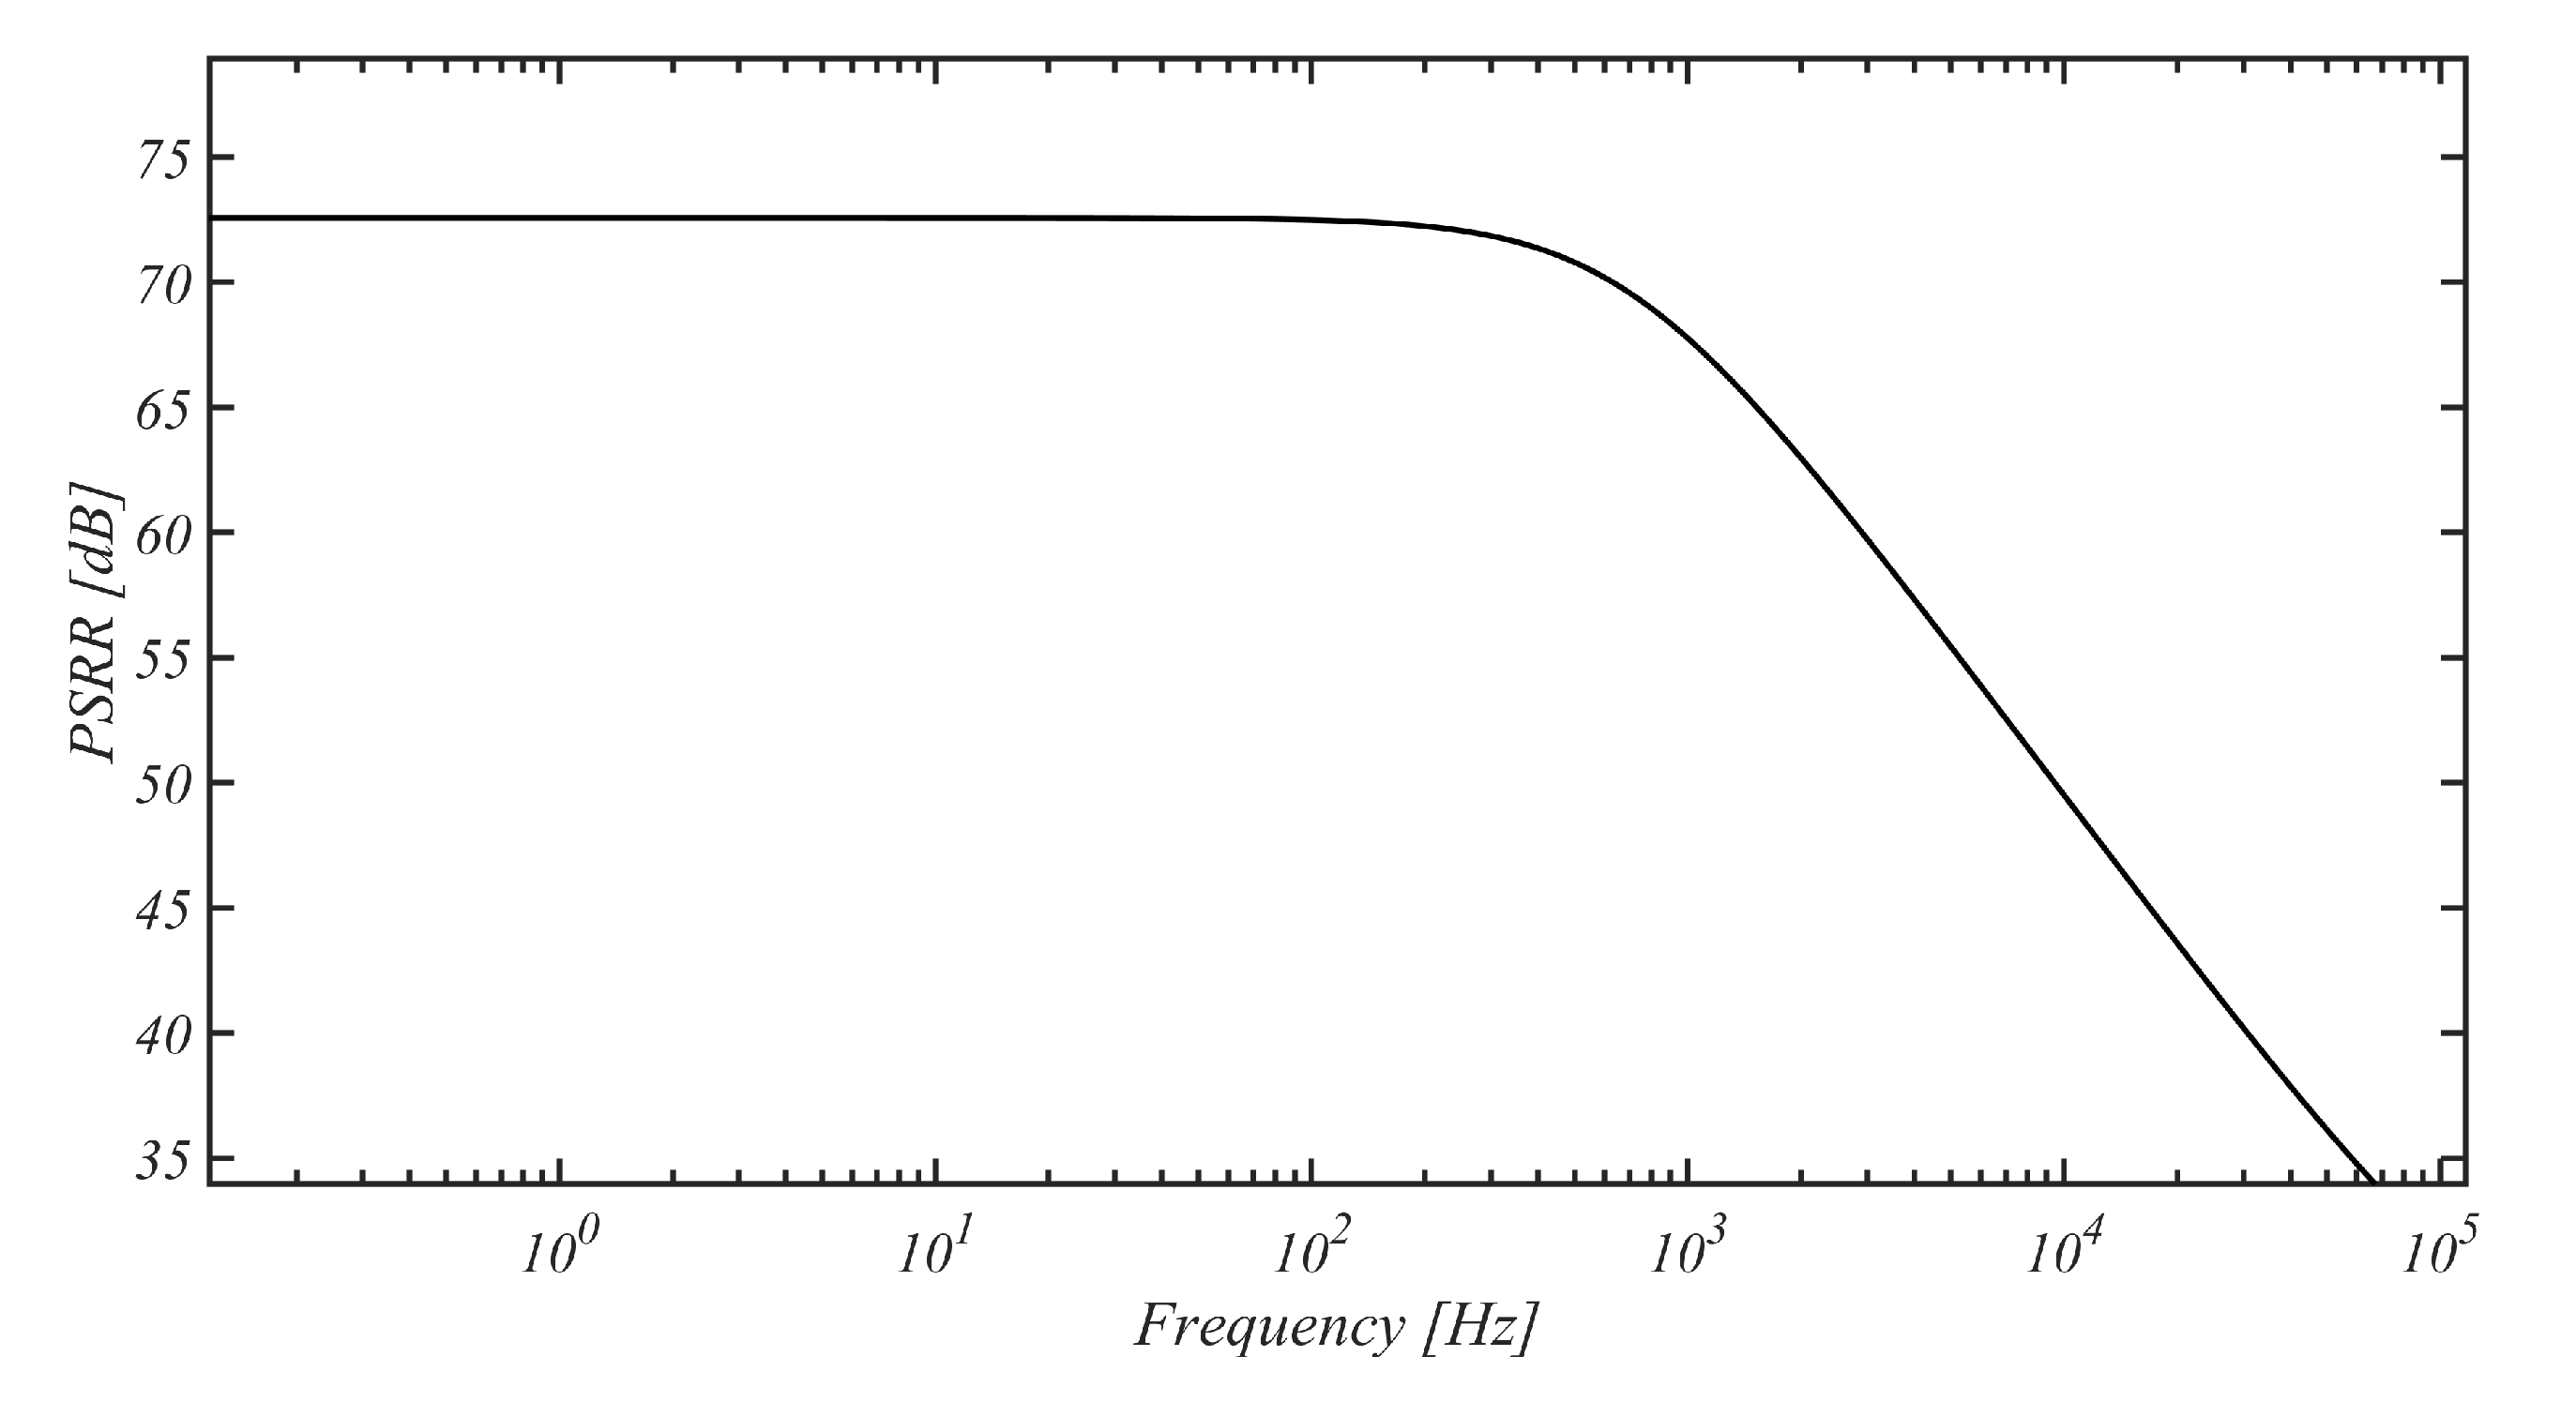
Figure 13.
Equivalent input noise of the i-th recording channel.
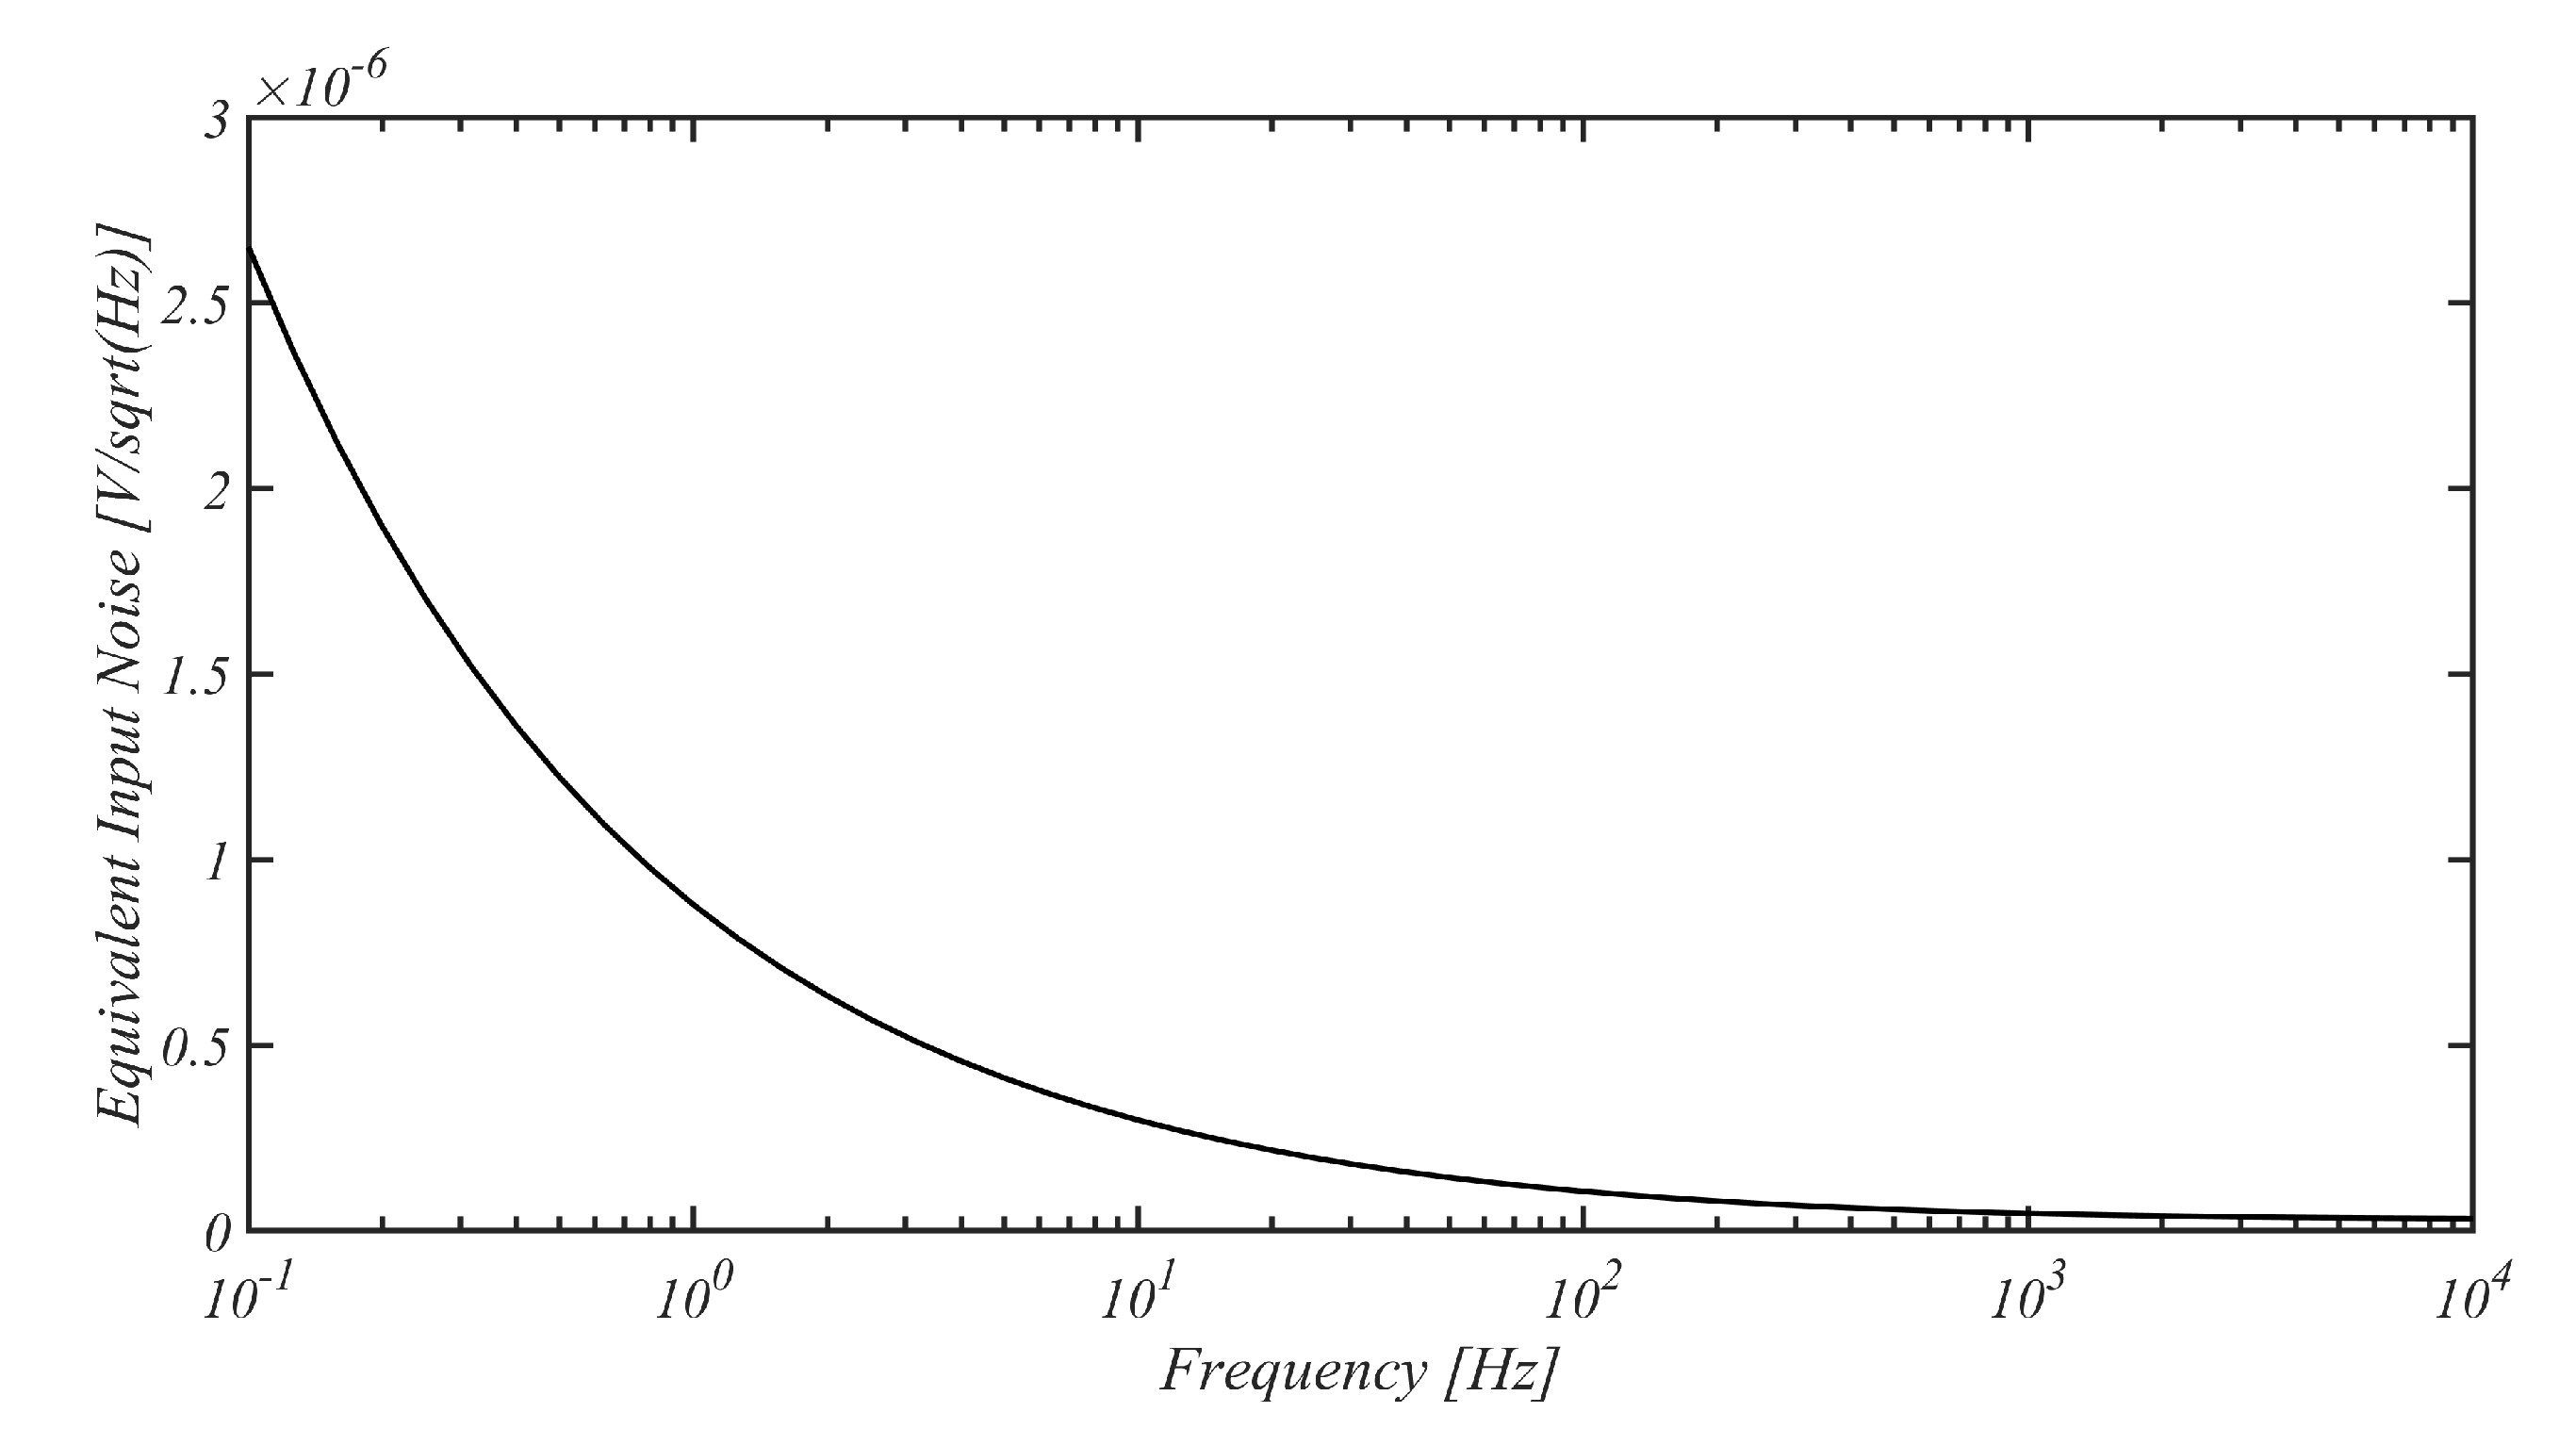
Figure 14.
Histogram of the SCMRR of the proposed front-end for 200 Monte Carlo mismatch iterations.
Figure 14.
Histogram of the SCMRR of the proposed front-end for 200 Monte Carlo mismatch iterations.
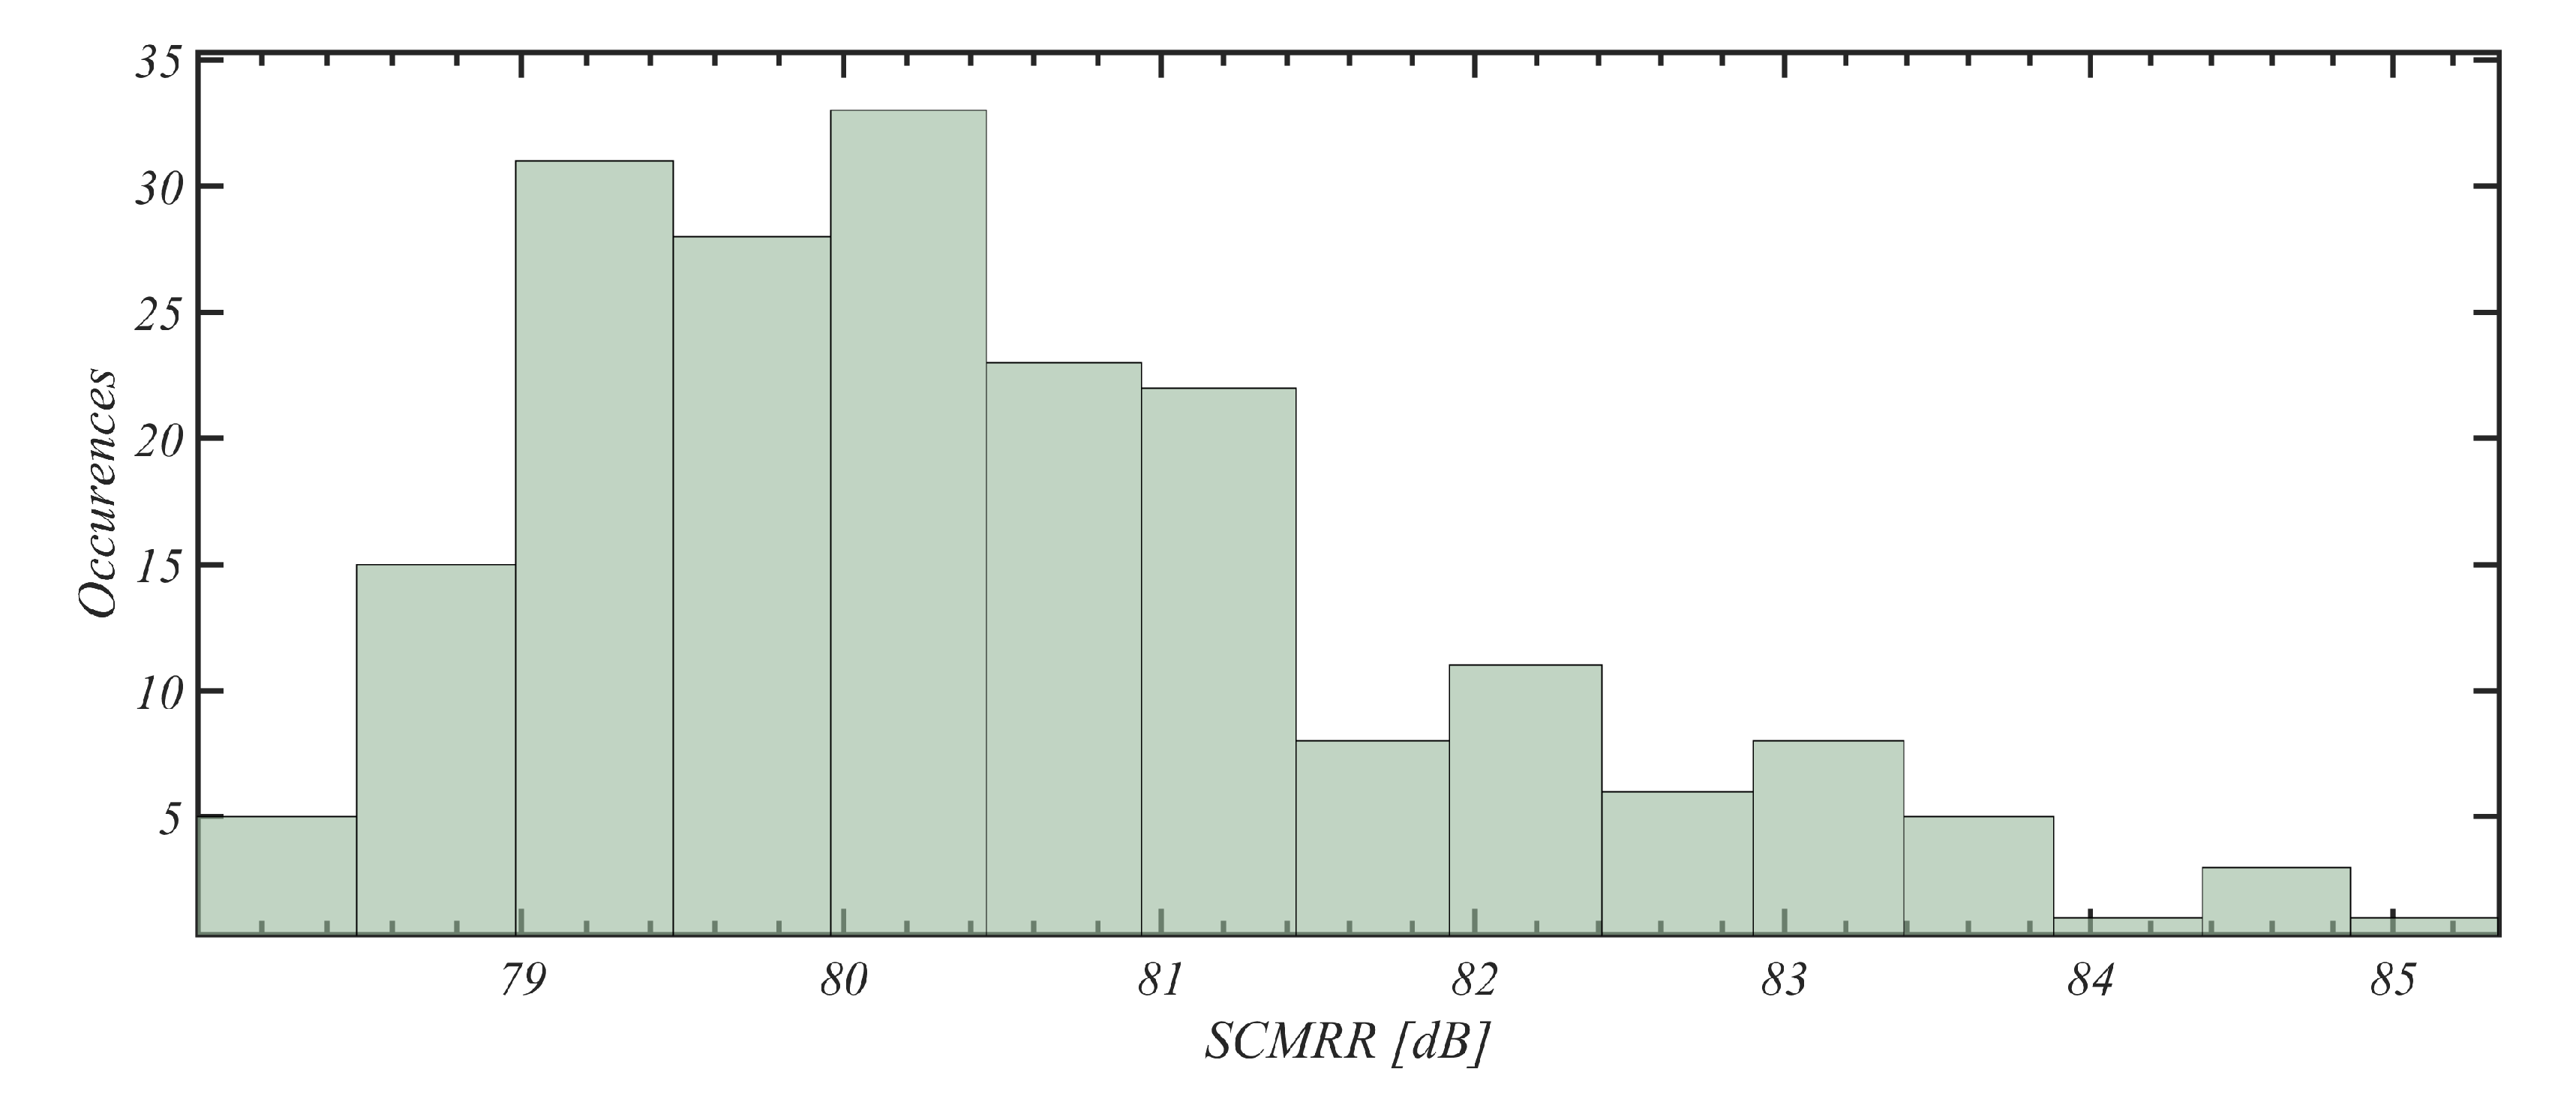
Figure 15.
Histogram of the PSMRR of the proposed front-end for 200 Monte Carlo mismatch iterations.
Figure 15.
Histogram of the PSMRR of the proposed front-end for 200 Monte Carlo mismatch iterations.
Disclaimer/Publisher’s Note: The statements, opinions and data contained in all publications are solely those of the individual author(s) and contributor(s) and not of MDPI and/or the editor(s). MDPI and/or the editor(s) disclaim responsibility for any injury to people or property resulting from any ideas, methods, instructions or products referred to in the content. |
© 2024 by the authors. Licensee MDPI, Basel, Switzerland. This article is an open access article distributed under the terms and conditions of the Creative Commons Attribution (CC BY) license (http://creativecommons.org/licenses/by/4.0/).
Copyright: This open access article is published under a Creative Commons CC BY 4.0 license, which permit the free download, distribution, and reuse, provided that the author and preprint are cited in any reuse.


