Submitted:
29 May 2024
Posted:
30 May 2024
You are already at the latest version
Abstract
Renal cell carcinoma (RCC) accounts for approximately 90-95% of all kidney cancers in adults, with the clear cell RCC (ccRCC) the most frequently identified subtype. RCC is known for its responsiveness to immunotherapy, making it an area of significant research interest. Immune checkpoint (IC) molecules, which regulate immune surveillance, are established therapeutic targets in RCC. The aim of this study was to analyze the influence of polymorphisms in genes HVEM and CD160 on susceptibility to ccRCC and patient overall survival (OS) with over a ten-year period of observation. We genotyped three HVEM single nucleotide polymorphisms (SNPs): rs1886730, rs2234167, and rs8725, and two CD160 SNPs: rs744877 and rs2231375, in 238 ccRCC patients and 521 controls. Our findings indicated that heterozygosity within rs2231375 and/or rs2234167 increases ccRCC risk. Furthermore, in women, heterozygosity within additional HVEM SNPs, rs8725 and rs1886730, is associated with an increased ccRCC risk. The presence of a minor allele for rs1886730, rs2234167, rs8725, and rs2231375 was also correlated with certain clinical features of the disease. Moreover, the rs1886730 SNP was found to be associated with patients' OS. In conclusion, our study highlights an association between HVEM and CD160 polymorphisms and the risk of developing ccRCC as well as patient’s OS.
Keywords:
HVEM
; CD160
; clear cell renal cell carcinoma (ccRCC)
; single nucleotide gene polymorphism (SNP)
; immunological checkpoint
; disease risk
; overall survival
1. Introduction
Clear cell renal carcinoma (ccRCC) is the most common subtype of renal cell carcinoma (RCC) in adults, accounting for around 80% of all RCC cases [1]. Named for its characteristic clear cytoplasm visible under microscopic examination, ccRCC typically originates from the epithelial cells of the proximal tubule in the renal cortex [2]. This subtype is known for its rapid and expansive growth, often resulting in an advanced stage at diagnosis. The elevated mortality rate associated with ccRCC can be attributed, in part, to its asymptomatic nature during the early stages of the disease, often leading to the diagnosis of metastatic tumors [1]. In 2022 alone, ccRCC contributed to 155,700 deaths, underscoring its substantial impact on mortality rates in genitourinary cancers [3]. Given the absence of dependable early diagnostic markers for ccRCC, it is still necessary to discover new diagnostic and prognostic indicators for this condition.
Immune checkpoints (ICs) are pivotal regulators, maintaining immune equilibrium by fine-tuning the strength and duration of immune responses. Cancer cells exploit the checkpoints' ability to downregulate the immune response by overexpressing them on the cell surface, enabling evasion of immune surveillance [4]. Harnessing this knowledge has led to the development of immunotherapies, like immune checkpoint inhibitors, which enhance the body's ability to recognize and eliminate cancer cells, revolutionizing cancer treatment approaches [5]. Among them, the herpesvirus entry mediator (HVEM) and CD160 are important immune checkpoints, orchestrating complex regulatory roles in immune responses [6].
HVEM, a member of the tumor necrosis factor (TNF) receptor superfamily, plays a dual role in immune modulation. HVEM is present on the surface of various immune cells, including T cells, B cells, NK cells, and DC, as well as endothelial cells. Interacting with multiple ligands, including LIGHT (lympho-toxin-like, exhibits inducible expression, and competes with herpes simplex virus glycoprotein D for HVEM, a receptor expressed by T lymphocytes), LTα (Lymphotoxin-alpha), BTLA (B- and T-lymphocyte attenuator), and CD160, HVEM provides stimulatory or inhibitory signaling [7,8]. CD160 is a glycoprotein, a member of the immunoglobulin superfamily (IgSF), expressed on the surface of various immune cells, including T cells, NK cells, and some B cells. CD160 has a dual role, acting as a co-stimulatory molecule, binding to major histocompatibility complex class I (MHC I), and a co-inhibitory molecule, binding to HVEM, impacting the intensity of immune responses. The HVEM-CD160 interaction is a rare example of the direct interaction between the two different superfamilies, IgSF and TNFSF. HVEM interacting with CD160 contributes to the complex network of immune checkpoint regulation, negatively affecting the activation, proliferation, and cytokine production of different immune cell types [6]. The intricate interplay between HVEM and CD160 underscores the complexity of immune regulation. Aberrant expression of HVEM has been observed in cancer, occurring on either tumor-infiltrating lymphocytes (TILs) or tumor cells, thereby suppressing immune responses and promoting immune evasion [9,10,11]. Similarly, CD160 expression has been identified in specific cancer types, including hematological malignancies and solid tumors. Numerous studies propose its role in tumor progression, immune evasion, and potential implications for cancer therapy [12,13,14]. Those findings underscore the significance of HVEM and CD160 in cancer biology.
Given the above-mentioned literature data, it can be hypothesized that ccRCC risk, as well as the clinical course of the disease, depends on the expression level of ICs, inter alia members of the HVEM/CD160 axis. It is well established that the mRNA and protein expression level can be regulated, among others, by genetic variations that can affect epigenetic modifications (methylation, microRNA binding), transcription factors binding sites, and the formation of protein isoforms. Therefore, we put forward the hypothesis that single nucleotide polymorphisms (SNPs) located within genes encoding HVEM and CD160 molecules, as well as SNP-SNP interactions (between variations in genes encoding receptor and ligand), are associated with ccRCC risk and outcomes.
To date, only a limited number of studies have investigated the implications of HVEM polymorphisms in the context of cancer [15,16]. The understanding of the potential roles and associations of HVEM genetic variations in malignancies remains unclear. Furthermore, there is a notable lack of exploration regarding CD160 gene variation and its potential relevance to cancer. Addressing the aforementioned gap in knowledge, our study specifically delved into examining the correlation between specific variants of HVEM and CD160 genes and their potential influence on susceptibility to ccRCCas well as ccRCC patients’ overall survival (OS).
2. Results
2.1. Correlation of HVEM and CD160 Gene SNPs with ccRCC Susceptibility
The genotype distribution of all SNPs was under the Hardy-Weinberg equilibrium (HWE) in the control group, however, in the patient's group, a deviation from the HWE has been observed for CD160 rs2231375 (f=-0.1535; p=0.018).
Table 1 presents the frequencies of genotypes of all studied SNPs in the HVEM and CD160 genes for ccRCC patients and healthy controls (HC). In the overall analysis, we found that rs2234167 (HVEM) and rs2231375 (CD160) might be associated with susceptibility to ccRCC. For investigated HVEM SNPs, we noticed that the overall genotype distribution of rs2234167 tends to differ between patients and HC (p=0.057). Moreover, analyzing the particular genotypes, we noted that the frequency of the carriers of the A allele (AG and AA genotypes) is significantly higher in patients compared to HC and that those patients had around 1.5 times higher risk of ccRCC as compared to the GG individuals (OR=1.47; 95% CI 1.04-2.07; p=0.029). We also noticed a statistically higher frequency of the rs2234167 AG heterozygotes among patients (28.57% vs. 20.73%), and the individuals bearing that genotype were 1.5 times more prone to develop ccRCC as compared to homozygous individuals. (AG vs. GG, OR=1.5296; 95% CI 1.0757-2.1752; p=0.0180). Additionally, we observed a tendency to overrepresentation of the ccRCC patients carrying the T allele (CT and TT genotypes) in rs1886730 (OR=1.41; 95% CI 0.98-2.04; p=0.063) as well as patients carrying the A allele (AG and GG genotypes) in rs8725 (OR=1.37; 95% CI 0.96-1.97, p=0.081).
For CD160 SNPs, we documented that the genotype distribution of rs2231375 significantly differs between cases and HC (p=0.03). Interestingly, only heterozygotes CT were markedly overrepresented among patients (55.08% vs. 49.52%), but not recessive homozygotes TT. Hence, the CT genotype increased the risk of developing ccRCC compared to subjects with the CC and TT genotypes (CT vs. CC, OR= 1.47; 95% CI 1.05-2.06; p=0.024, CT vs. TT, OR=1.36; 95% CI 0.86-2.14; p=0.05). For the rs744877 SNP, we did not observe any association with susceptibility to ccRCC in the overall analysis.
The Svejgaard and Ryder method was employed to assess the significance of the potential influence of the two genetic factors that were observed to be associated with ccRCC risk. The following factors were considered: factor A - heterozygosity of HVEM rs2243167 [AG]; factor B – heterozygosity of CD160 rs2231375 [CT]. The results of that analysis are presented in Table 2. The frequency of the carriers of susceptibility genotypes for both SNPs (factor A and factor B) was significantly higher in the ccRCC patients as compared to the individuals lacking factor A and B (test [h]) and possessing both factors A and B increased the risk of disease two-fold (OR 2.07, 95% CI 1.30-3.35, p=0.003). In addition, we observed the presence of one of the mentioned factors, A [d] or B [f], significantly increased the risk of ccRCC as compared to individuals not carrying susceptible genotypes (OR 1.85, 95% CI 1.09-3.13, p=0.02 and OR 1.56, 95% CI 1.09-2.23, p=0,02, respectively).
2.2. Multifactorial Regression Analysis
Based on univariate analysis regarding the influence of the genetic variations of HVEM and CD160 genes investigated here on ccRCC susceptibility, a multivariate logistic regression model was established. Similar to the results of the univariate analysis (unifactoral model), the results of the multivariate analysis indicated that rs2231375 is an risk factor for ccRCC risk ( OR 1.47, 95% CI 1.08-2.01, p=0.015) (Table 3).
2.3. Haplotype Analysis
The presence of a specific combination of SNPs may be essential for unveiling a distinctive phenotype, hence, the haplotype analysis can aid in identifying such unique SNP compositions. Therefore, the haplotype analysis was conducted on the whole group of patients seeking associations with ccRCC risk. We performed the haplotype analysis for HVEM and CD160 together, where haplotypes with frequencies below 3% were not considered. The results of the analysis are presented in Table 4. The haplotype analysis showed 8 haplotypes with a frequency above 0.03. The global distributions of the haplotypes differed significantly between patients and HC (χ2=20.33; df=7; p=0.005). Moreover, we noticed that the haplotype C A A C T (rs1886730, rs2234167, rs8725, rs744877, rs2231375) was significantly overrepresented in patients (9.4% vs. 4.0%) and increased ccRCC risk by 2.4 times (OR=2.40; 95% CI 1.55-3.73; p=5.78e-005).
2.4. Sex-Dependent Association of HVEM and CD160 Polymorphisms and ccRCC Risk
As shown in Table 5, we observed a significant association between all except one (rs744877) of the SNPs investigated here and ccRCC risk in females. Heterozygosity and/or possession of mutant alleles for rs1886730, rs2234167, rs8725, and rs2231375 increased the disease risk compared to WT homozygotes. What’s important is that the increase was about 2.5-fold in the case of rs2234167 and rs8725 (p=0.001; p=0.01, respectively) and about 2-fold in the case of rs1886730 and rs2231375 (p=0.02; p=0.05, respectively).
2.5. Association of HVEM and CD160 Polymorphisms with Clinical Features of ccRCC
Based on the available clinicopathological features, we subsequently conducted a stratified analysis relying on 1) cancer clinical stage, 2) presence of metastasis, 3) presence of necrosis, 4) patient age at diagnosis, and 5) size of the tumor.
We observed an association of heterozygosity of all except one (rs744877) SNPs with the clinical course of the disease (Table S1-S5). In particular, we noticed that individuals possessing heterogeneous genotypes are more prone to develop ccRCC, but this association is restricted to early stages of disease (stage I or II) (for rs2234167, this association did not reach statistical significance). The same genotypes are related to a higher risk of developing tumors smaller than 7 cm. However, these associations are not valid for bigger tumors and more advanced stages of disease. In addition, in a group of patients younger than 63, individuals carrying the CT genotype for rs2231375 (CD160) are more prone to develop ccRCC.

Table 5.
The analysis between rs1886730, rs2234167, rs8725 (HVEM) and rs2231375 (CD160) and ccRCC risk in females.
Table 5.
The analysis between rs1886730, rs2234167, rs8725 (HVEM) and rs2231375 (CD160) and ccRCC risk in females.
| N (case/control) | OR (95% CI); p value | |||||||||||
|---|---|---|---|---|---|---|---|---|---|---|---|---|
| rs1886730 | TT | CT | CC | CT+CC vs TT | CT+TT vs CC | CT vs TT | CT vs TT+ CC | |||||
| 15/50 | 46/77 | 25/44 | 1.92 (1.01-3.64); | 0.04 | 0.84 (0.47-1.49); | 0.57 | 1.95 (0.99-3.84); | 0.05 | 1.40 (0.83-2.36); | 0.20 | ||
| rs2234167 | GG | AG | AA | AG+AA vs GG | GG+AG vs AA | AG vs GG | AG vs GG+AA | |||||
| 55/142 | 37/80 | 1/2 | 2.63 (1.46-4.73); | 0.001 | 0.84 (0.11-6.47); | 1.00 | 2.73 (1.50-4.96); | 0.001 | 2.76 (1.51-5.02); | 0.001 | ||
| rs8725 | GG | AG | AA | AG+AA vs GG | GG+AG vs AA | AG vs GG | AG vs GG+AA | |||||
| 14/56 | 47/74 | 25/41 | 2.45 (1.28-4.67); | 0.01 | 0.77 (0.43-1.37); | 0.38 | 2.48 (1.26-4.91); | 0.01 | 1.58 (0.94-2.66); | 0.09 | ||
| rs2231375 | CC | CT | TT | TT+CT vs CC | CC+CT vs TT | CT vs CC | CT vs CC+ TT | |||||
| 28/77 | 47/65 | 10/28 | 1.67 (0.97-2.87); | 0.06 | 1.44 (0.67-3.08); | 0.32 | 1.97 (1.12-3.48); | 0.02 | 2.00 (1.18-3.39); | 0.01 | ||
2.6. Analysis of Patients' Survival in Context to Clinical Parameters as well as HVEM and CD160 Gene Polymorphisms
Polymorphisms in the HVEM and CD160 genes, along with gender, age, disease stage, tumor size, and the presence of metastasis or necrosis, were incorporated into the overall survival (OS) analysis. The outcomes of the OS analysis confirmed the impact of well-established risk factors like gender, disease stage, age at diagnosis, tumor size, and the presence of metastasis or necrosis on OS within our patient group (Table S6). In addition to these known risk factors, we observed that carriers of the C allele for rs1886730 (CT and CC genotypes) lived nearly twice as long as their counterparts (Table S7), and this difference approached significance (p=0.056). This influence of the rs1886730 variant was even more pronounced when considering the patient’s gender. Among males, the presence of the C allele in rs1886730 (CT and CC genotypes) significantly extended OS on average by 42 months (p=0.016) (Figure 1 and Table S8). However, in female patients, rs1886730 did not impact their OS (Table S9). The results of the multivariate Cox proportional hazards model confirmed associations of presence necrosis, metastasis, and rs1886730 TT genotype with poor prognosis for ccRCC patients.
3. Discussion
In recent years, there has been significant progress in identifying genetic risk factors for cancer, shedding light on specific gene mutations and variations associated with an increased susceptibility to various cancer types. Thanks to the result of the Human Genome Project, understanding of genetic factors lying behind familial cancers (which account for 10–30% of cancers) susceptibility increased significantly. About 100 genes (corresponding to 0.5% of all genes in the human genome) have highly or moderately penetrant mutations that underlie hereditary cancer syndromes. These include the major DNA mismatch repair (MMR) genes MLH1 and MSH2 underlying Lynch syndrome (LS), the adenomatous polyposis coli (APC) gene prompting familial adenomatous polyposis (FAP), and the BRCA1 and BRCA2 genes tightly associated with hereditary breast and ovarian cancer syndromes [17]. However, in patients with sporadic disease, multiple common alleles may increase cancer risk, each having only a weak effect [18].
Understanding the genetic basis of cancer susceptibility is crucial for identifying individuals at higher risk, implementing preventive measures, and developing targeted interventions. Although mutation in a proto-oncogene, suppressor genes, and DNA repair genes are crucial for carcinogenesis, somatic mutations, as well as inherited variations in genes encoding molecules responsible for immunosurveillance, especially immune checkpoints, might be associated with cancer risk [7,19,20,21]. The IC receptor/ligand interaction in the tumor microenvironment is directly responsible for the impaired immune response against cancer and tumor cells' evasion of immune surveillance. To prevent this process, in recent years, highly efficacious IC inhibitors (anti-CTLA-4 and anti-PD-1, alone or in combination), whose role is to enhance the immune response against cancer cells, were introduced into clinical practice, and they revolutionized cancer immunotherapy [22].
Inherited genetic variants present in the regulatory regions of the IC genes may be one of many factors responsible for the observed inter-individual differences in expression levels of ICs on immune cells. In addition, SNPs located in exons can introduce changes in the amino acid sequences of ICs, potentially affecting the functional properties of these molecules. Since genetic variants can affect both the expression and structure of ICs, they are considered factors associated with cancer risk as well as cancer progression [23].
One of the tumors that has long been categorized as “immunotherapy-responsive” is renal cell carcinoma (RCC) [24]. RCC is a common and deadly disease. In 2020, there were an estimated 431,288 new cases of RCC globally, of which 138,611 were in Europe, while worldwide mortality from RCC was 179,368 deaths (115,600 men and 63,768 women) [25]. We showed in several previous studies [20,26,27,28] that variations in genes encoding the IC molecules are associated with the risk of developing ccRCC. In the present work context, the most interesting is that polymorphisms in the gene encoding BTLA, another receptor that binds the HVEM molecule and attenuates immune response, are associated with disease risk and progression. In particular, we showed that the rs1982809 SNP located within the 3’ intragenic region is associated with ccRCC risk [21]. Moreover, we showed that the polymorphism rs1844089 located in the promoter region of influences the overall survival of ccRCC patients [26].
In the present study, we focused on BTLA ligand HVEM and its other counterpart, CD160. HVEM acts as a bidirectional molecular switch between activating (LIGHT and lymphotoxin LT-α) and inhibitory (BTLA) pathways, depending on the interacting receptor used. Upon binding, HVEM provides pro-survival and proliferative signals by activating nuclear transcription factor κB (NF-κB) and AKT transcriptional pathways, whereas BTLA attenuates T cell-mediated responses [7,8]. CD160 competes with BTLA for the same binding site within the complementarity-determining region (CDR) 1 of HVEM, while LIGHT binds to the opposite side of HVEM within CRD2/CRD3 regions. Therefore, inhibitory and stimulatory ligands of HVEM bind at distinct sites [29,30]. Like HVEM, CD160 is a dual-functioning signaling molecule, and the CD160:HVEM interaction induces different functions in different cell types. In T lymphocytes, HVEM and CD160 binging in a trans manner result in a coinhibitory signal that suppresses CD4+ T cell proliferation and IFN-γ production [31]. In contrast, in NK cells, the CD160:HVEM engagement delivers costimulatory signals that boost cytokine production and promote lytic activity, possibly via phosphorylation of AKT and ERK1/2[32,33]. Considering that CD160 and HVEM are important regulators exhibiting multiple functional outcomes, which are sensitive to many variables, including the competing engagement of different ligands, expression patterns on different cell types, cis versus trans interactions, and the context-dependent direction of the signaling [34].
In the present work, we investigated the potential association between selected SNPs within HVEM and CD160 genes and ccRCC risk and the clinical course of the disease. Analyzing the results for HWE, we noticed that for rs2231375 within the CD160 gene, the distribution of genotypes is not in accordance with HWE, but at the same time, the frequency of genotypes in the control group is in complete HWE. This fact may indicate the association between rs2231375 and ccRCC risk since, according to Lee et al [35], in the presence of an association with disease, cases do not need to be in HWE, and deviation from HWE of data sets of the affected individuals is sufficient to discover the relationship with disease. In fact, we observed statistically significant differences in genotype distribution for rs2231375 between ccRCC patients and control individuals with overrepresentation of the heterozygotes in ccRCC. For all other SNPs, no deviation of HWE, both in patients and controls, was observed. When analyzing the distribution of genotypes for the other SNPs investigated here, we noticed that heterozygosity within rs2234167 or possessing of a minor allele was associated with increased disease risk. Applying the Svejgaard and Ryder analysis, we noticed that heterozygosity of rs2234167 (HVEM) and rs2231375 (CD160) increased the risk of ccRCC two times. That analysis also confirmed the independent association of both SNPs with ccRCC risk. However, the multifactorial analysis indicated a stronger association for rs2231375 (CD160).
Interestingly, when considering the associations of HVEM and CD160 SNPs with ccRCC risk in relation to gender, we noticed that heterozygosity and/or presence of a minor allele not only in previously mentioned SNPs but also in two others, rs1886730, and rs8725, located within HVEM, was significantly associated with ccRCC risk in women. Neoplasms tend to be more prevalent in males, as evidenced by data from GLOBOCAN. This pattern is also observed in RCC, where there are 1.5 times as many cases in males compared to females. This discrepancy may be attributed to the higher occurrence of lifestyle habits that promote carcinogenesis among men. The comprehensive VITamin and Lifestyle (VITAL) study conducted in the U.S. revealed that lifestyle factors such as obesity, hypertension, and smoking elevate the likelihood of RCC development. Furthermore, European findings indicate that high obesity, hypertension, and hyperglycemia levels in men, as well as high body mass index (BMI) in women, contribute to an increased risk of RCC [36]. Unfortunately, we lack lifestyle data for our patient group, so it was impossible to relate our results to smoking status, hypertension, and obesity, which could at least partially explain the different associations observed in men and women.
Also of interest was the observed association between a higher risk of ccRCC in heterozygotes (rs1886730, rs2234167, rs8725, rs2231375) and/or presence of a minor allele, however, it was observed only for early stages of the disease, smaller tumor size, and in the individuals below 63 years of age. Such observation could indicate the impact of an aberrant HVEM/CD160 interaction (caused by gene variations) at the early stages of disease development. In contrast, at a later stage, the role of this pathway in regulating the immune response loses its significance.
Haplotype analysis also indicated that the presence of a minor allele increased the risk of ccRCC since the C A A C T haplotype (rs1886730, rs2234167, rs8725, rs744877, rs2231375) consisting of all minor alleles increased the risk of ccRCC more than 2-times.
Very little is known about the functional relevance of the polymorphisms investigated here and their associations with cancer susceptibility. The presence of the rs2234167 SNP in the exon of the HVEM gene leads to amino acid substitution from isoleucine (A) to valine (G), but the biological consequence of that change is not described. So far, the rs2234167 polymorphism has been investigated in relation to esophageal squamous cell carcinoma (ESCC) risk in a relatively large group of Chinese patients (721 ESCC cases and 1208 controls). However, the authors found no association when analyzing the entire patient group, nor in the subgroup analyses based on stage, sex, age, BMI, smoking status, and alcohol consumption [16].
In earlier work by Li et al. [15], the association between six HVEM SNPs (rs2281852, rs1886730, rs2234163, rs11573979, rs2234165, and rs2234167) and sporadic breast cancer was investigated. Contrary to our results, the authors showed a lower frequency of heterozygotes of rs2234167 in the breast cancer cases than in the control group. Also, opposite results were found for the rs1886730 SNP [15]. It is difficult to explain such different results, especially for women. However, as numerous metanalyses indicate, the association of SNPs with cancer susceptibility varies in relation to ethnicity as well as cancer origin [37,38].
In our study, we also found the association of rs1886730 with the overall survival of ccRCC patients. What is interesting is that the presence of a minor allele significantly increased the susceptibility to ccRCC in women, while in men, it is associated with prolonged survival. Introns have been found to play various functional roles, thus intron variations can have significant functional consequences. Variations within introns can affect the splicing process by altering splice site recognition or by modulating the binding of splicing regulatory proteins. This can result in the production of multiple mRNA isoforms from a single gene, leading to protein diversity. Moreover, variations within introns can impact the binding affinity of transcription factors or other regulatory proteins and harbor microRNA binding sites, thereby influencing the level of gene expression. Since introns can contain repetitive elements or sequences prone to genomic instability and recombination events, variations within these sequences can affect genomic stability and lead to structural variations, including insertions, deletions, or chromosomal rearrangements. Consequently, variations within introns have been associated with susceptibility to various diseases, including cancer, neurological disorders, and metabolic diseases. These variations may affect gene expression, splicing patterns, or other regulatory processes implicated in disease pathogenesis [39]. Since little is known about that intronic variant of the HVEM gene, it is hard to speculate about its function in terms of explaining the phenomena observed here.
HVEM/LIGHT/BTLA/CD160 polymorphisms were also investigated in the context of the occurrence of antibody-mediate rejection (ABMR) in renal transplant recipients [40]. The authors investigated 17 SNPs within the HVEM gene (among others rs2234167, rs8725), 17 SNPs within the LIGHT gene, and 6 SNPs within the CD160 gene (including rs2231375). The results of that study showed that none of the studied 41 HVEM/LIGHT/BTLA/CD160 gene polymorphisms were associated with ABMR.
As we stated earlier, very limited data regarding CD160 SNPs are available. Except for the above-mentioned publication related to rejection in renal transplant, only one work was devoted to the association between CD160 rs744877 and rs3766526 SNPs and autoimmune thyroid disease AITD [41]. The authors noticed a significant association between rs744877 and AITD. However, in our study, we did not find any association of that polymorphism in the risk analysis in the whole group and subgroups, nor association with patients' overall survival.
A limitation of our study is that our patients were recruited from a single center, and therefore, our treatment results are representative of a tertiary cancer center. Consequently, there is an overrepresentation of stage IV patients in our population, which is also characteristic of tertiary cancer centers. Moreover, data about other RCC risk factors like smoking status, and alcohol consumption, as well as the same data for controls, were unavailable and were not included in multivariant analysis. Another limitation is the mismatched age of patients and controls. We realize that healthy individuals could develop cancer in the future. However, the incidence of renal cell cancer is about 1 per 10000 cases (different in men and women). Given this, the chance that there would be a number of people in the control group at a later age that would distort the obtained results is small. Another limitation was the inability to discuss our results regarding their functional role on mRNA stability, expression, epigenetic control, and protein expression. However, the current knowledge on that subject is very limited, and we do not have arguments for such a discussion. Additional research into the underlying mechanisms influenced by specific SNPs must be elicited to confirm our findings. Finally, a study on a larger group of patients and other populations is needed.
4. Materials and Methods
4.1. Patients
The study comprised 238 ccRCC patients diagnosed at the Department of Urology and Oncologic Urology at Wroclaw Medical University. These patients were diagnosed between 2009 and 2012, samples were collected from 2010 to 2012. The research involving human participants underwent thorough review and approval by the Bioethical Committee of Wroclaw Medical University. The DNA utilized in this study was isolated from patients initially recruited for a prior project approved by the Ethics Committee of Wroclaw Medical University (KB 55/2010). Subsequently, for the current study and the reuse of materials, additional approvals were obtained from the Ethics Committee (KB 587/2020 and KB 755/2022). Overall survival was evaluated from the surgery date to the date of death from any cause or up to January 24, 2020, the completion date for data collection.
Table 6.
Patient characteristics.
| Variable | All N=238 | Male N=151 | Female N=86 |
|---|---|---|---|
| Age at diagnosis | |||
| Median | 62 | 61 | 63 |
| Mean | 62.61 | 62.01 | 63.67 |
| Q1-Q3 | 56-70 | 56-68 | 58-71 |
| Min, Max | 21, 85 | 21, 85 | 24, 85 |
| BMI | |||
| Median | 27.70 | 27.70 | 27.75 |
| Mean | 28.29 | 28.26 | 28.33 |
| Q1-Q3 | 24.6-31.5 | 25.1-30.7 | 23.85-31.2 |
| Min, Max | 19.1, 43.8 | 19.7, 43.8 | 19.1, 43.8 |
| Stage of disease | N (%) | N (%) | N (%) |
| I | 108 (45.57) | 63 (41.72) | 45 (52.33) |
| II | 26 (10.97) | 20 (13.25) | 6 (6.98) |
| III | 26 (10.97) | 16 (10.60) | 10 (11.63) |
| IV | 76 (32.07) | 51 (33.77) | 25 (29.07) |
| Unknown | 1 (0.42) | 1 (0.66) | 0 (0) |
| Metastasis | |||
| No | 165 (69.62) | 101 (66.89) | 64 (74.42) |
| Present | 53 (22.36) | 35 (23.18) | 18 (20.93) |
| Unknown | 19 (8.02) | 15 (9.93) | 4 (4.65) |
| Necrosis | |||
| No | 118 (59.00) | 71 (55.47) | 47 (65.28) |
| Present | 82 (41.00) | 57 (44.53) | 25 (34.72) |
| Unknown | 0 (0) | 0 (0) | 0 (0) |
| Tumor size | |||
| < 70 mm | 143 (60.34) | 87 (57.61) | 56 (65.12) |
| > 70 mm | 65 (27.42) | 48 (31.79) | 17 (19.77) |
| Unknown | 29 (12.24) | 16 (10.60) | 13 (15.11) |
4.2. Controls
The control group included 521 individuals (349 males and 172 females) selected from the identical geographic region as ccRCC patients. Blood samples from the healthy subjects were obtained either from the Wroclaw Blood Bank or through donations from employees of the Ludwik Hirszfeld Institute of Immunology and Experimental Therapy. The research involving human participants underwent thorough review and received approval from the Bioethical Committee of Wroclaw Medical University in Wroclaw, Poland (as mentioned above). All participants in the study provided written informed consent to participate.
4.3. Selection of SNPs
Among the five selected single nucleotide polymorphisms (SNPs), two, namely rs1886730 (HVEM) and rs2234167 (HVEM), have been investigated in a previous study focusing on cancer susceptibility. Another SNP, rs744877 (CD160), has been examined in the context of autoimmune thyroid disease and the risk of rheumatoid arthritis. Additionally, for this study, we identified and included two new SNPs that had not been previously studied: rs8725 (HVEM) (located in 3’ UTR) and rs2231375 (CD160) (intron variant/3’UTR variant), utilizing the UCSC database, accessible at https://genome.ucsc.edu/index.html. Comprehensive details regarding the localization and additional information for each SNP are outlined in the provided Table S10.
4.4. DNA Isolation and SNP Genotyping
Genomic DNA was isolated from refrozen blood samples by GeneMATRIX Quick Blood DNA Purification Kit (EURX, Poland) according to the manufacturer’s instructions. SNPs were genotyped using Probe qPCR Master Mix (2x) plus ROX solution (EURX, Poland) and TaqMan assays; rs1886730 (HVEM) C__11448257_10, rs2234167 (HVEM) C__16181162_10, rs8725 (HVEM) C__8861318_10, rs744877 (CD160) C__1862234_10, and rs2231375 (CD160) C__15854941_10. All reactions were run on the ViiA7 Re-al-Time PCR system (Applied Biosystems, Singapore).
4.5. Statistical Analysis
Statistical analysis was conducted utilizing SigmaPlot 11.0 software (Systat Software, San Jose, CA). For measurable variables, means, medians and standard deviations were calculated. The Hardy-Weinberg equilibrium (HWE) for all genotyped HVEM and CD160 SNPs was evaluated independently for both ccRCC patients and healthy controls. This evaluation was done by comparing observed and expected genotype frequencies using the χ2 test. The χ2 test was also used to compare categorical data between ccRCC patients and controls. To assess the relationship between the studied polymorphisms and susceptibility to ccRCC, odds ratios (OR) and 95% confidence intervals (95% CI) were calculated using the binary logistics regression model. To assess the significance of the potential influence of observed two genetic factors associated with ccRCC risk, Svejgaard and Ryder test was implemented [42].
Haplotype frequencies for pairs of alleles were determined using the online software SHEsis, excluding haplotypes with frequencies below 0.01. Survival analysis (OS) was conducted utilizing the Kaplan-Meier estimator with SigmaPlot 11.0 software (Systat Software, San Jose, CA). Patient survival was compared against selected clinical variables using the log-rank test. Statistical significance was considered for differences between groups if p<0.05.
The impact of selected factors on the occurrence of change was analyzed using logistic regression (a unifactorial model of predictors included in the analysis). Odds ratios and confidence intervals were determined. The next step involved constructing a multifactorial model, considering the following variables where the p-value did not exceed 0.30. The model was evaluated using a set of standard goodness-of-fit measures (AIC, BIC, Hosmer-Lemeshow test).
To assess the impact of qualitative or quantitative variables on survival, the Cox proportional hazards model was used. The model-building process was conducted using a stepwise method, and the model evaluation employed a set of standard goodness-of-fit measures (AIC, R2). Results were considered statistically significant at p < 0.05.
5. Conclusions
In conclusion, our study showed an association of HVEM and CD160 polymorphisms with ccRCC risk and overall survival. This association was noticed especially when considering the receptor/ligand SNP combination rs2234167 within HVEM and rs2231375 in CD160. Moreover, rs1886730, rs2234167, rs8725, and rs2231375 were associated with ccRCC risk in women. Additionally, rs1886730 variations were associated with ccRCC patients’ overall survival, especially in male patients. Nevertheless, studies with larger patient groups and functional evaluation of studied HVEM and CD160 polymorphisms are needed to confirm our findings.
Supplementary Materials
The following supporting information can be downloaded at the website of this paper posted on Preprints.org. Table S1: Stratified analysis between rs1886730 (HVEM) and ccRCC risk by stage, age, and tumor size; Table S2: Stratified analysis between rs2234167 (HVEM) and ccRCC risk by stage, age, and tumor size; Table S3: Stratified analysis between rs8725 (HVEM) and ccRCC risk by stage, age, and tumor size; Table S4: Stratified analysis between rs2231375 (CD160) and ccRCC risk by stage, age, and tumor size; Table S5: Stratified analysis between rs744877 (CD160) and ccRCC risk by stage, age, and tumor size; Table S6: Probability of survival in relation to clinical features; Table S7: Probability of survival in relation to the HVEM and CD160 gene polymorphisms in the whole group of patients; Table S8: Probability of survival in relation to the HVEM and CD160 gene polymorphisms in male patients; Table S9: Probability of survival in relation to the HVEM and CD160 gene polymorphisms in female patients; Table S10: Characteristics of HVEM and CD160 polymorphisms;
Author Contributions
Conceptualization, A.A. and L.K.; methodology, A.A. and L.K.; formal analysis, A.A., K.P. and L.K.; investigation, A.A.; writing—original draft preparation, A.A., and L.K.; visualization, A.A.; patients’ recruitment and clinical characteristics, K.T., B.M. and T.S.; supervision L.K.; project administration, L.K.; funding, L.K., B.M., and T.S., writing- reviewing and editing LK, BM, KT, T.S. All authors have read and agreed to the published version of the manuscript.
Funding
This research was funded by the grant from the Foundation of Count Jakub Potocki (Fundacja im. hr. Jakuba Potockiego) on the basis of the decision taken by Foundation Board on 16.12.2019, statutory funds from Hirszfeld Institute of Immunology and Experimental Therapy and research grants from Wroclaw Medical University SUBZ.C090.23.080 and SUBZ.C090.24.089. The funding institution had no role in the study's design, data collection, analysis, interpretation, or manuscript writing.
Institutional Review Board Statement
Samples from patients were collected between 2009 and 2012. The Bioethical Committee of Wroclaw Medical University reviewed and approved the studies involving human participants. The DNA utilized in this study was isolated from individuals originally recruited in a prior project, which received approval from the Ethics Committee of Wroclaw Medical University (KB 55/2010). For the specific purpose of this study, involving the reuse of materials, additional approvals were obtained from the Ethics Committee of Wroclaw Medical University (KB 587/2020 and KB 755/2022).
Informed Consent Statement
Informed consent was obtained from all subjects involved in the study.
Data Availability Statement
The original results are presented in the article and supplementary materials. Additional data are available upon reasonable request from the corresponding author.
Acknowledgments
The authors want to thank all patients and healthy volunteers for agreeing to participate in this study and donating their blood.
Conflicts of Interest
The authors declare no conflict of interest.
References
- Padala SA, Barsouk A, Thandra KC, Saginala K, Mohammed A, Vakiti A, et al. Epidemiology of Renal Cell Carcinoma. World J Oncol 2020;11:79–87. [CrossRef]
- Muglia VF, Prando A. Renal cell carcinoma: histological classification and correlation with imaging findings. Radiol Bras 2015;48:166–74. [CrossRef]
- Cancer Today, Global Cancer Observatory. Available at: https://gco.iarc.fr/today/home (Accessed: 02 February 2024). n.d.
- Dyck L, Mills KHG. Immune checkpoints and their inhibition in cancer and infectious diseases. Eur J Immunol 2017;47:765–79. [CrossRef]
- Topalian SL, Taube JM, Anders RA, Pardoll DM. Mechanism-driven biomarkers to guide immune checkpoint blockade in cancer therapy. Nat Rev Cancer 2016;16:275–87. [CrossRef]
- Del Rio ML, Lucas CL, Buhler L, Rayat G, Rodriguez-Barbosa JI. HVEM/LIGHT/BTLA/CD160 cosignaling pathways as targets for immune regulation. J Leukoc Biol 2009;87:223–35. [CrossRef]
- Andrzejczak A, Karabon L. BTLA biology in cancer: from bench discoveries to clinical potentials. Biomark Res 2024;12:8. [CrossRef]
- Murphy KM, Nelson CA, Šedý JR. Balancing co-stimulation and inhibition with BTLA and HVEM. Nat Rev Immunol 2006;6:671–81. [CrossRef]
- Lan X, Li S, Gao H, Nanding A, Quan L, Yang C, et al. Increased BTLA and HVEM in gastric cancer are associated with progression and poor prognosis. Onco Targets Ther 2017;10:919–26. [CrossRef]
- Ren S, Tian Q, Amar N, Yu H, Rivard CJ, Caldwell C, et al. The immune checkpoint, HVEM may contribute to immune escape in non-small cell lung cancer lacking PD-L1 expression. Lung Cancer 2018;125:115–20. [CrossRef]
- Malissen N, Macagno N, Granjeaud S, Granier C, Moutardier V, Gaudy-Marqueste C, et al. HVEM has a broader expression than PD-L1 and constitutes a negative prognostic marker and potential treatment target for melanoma. OncoImmunology 2019;8:e1665976. [CrossRef]
- Liu F-T, Giustiniani J, Farren T, Jia L, Bensussan A, Gribben JG, et al. CD160 signaling mediates PI3K-dependent survival and growth signals in chronic lymphocytic leukemia. Blood 2010;115:3079–88. [CrossRef]
- Gauci M-L, Giustiniani J, Lepelletier C, Garbar C, Thonnart N, Dumaz N, et al. The soluble form of CD160 acts as a tumor mediator of immune escape in melanoma. Cancer Immunol Immunother 2022;71:2731–42. [CrossRef]
- Farren TW, Giustiniani J, Liu F-T, Tsitsikas DA, Macey MG, Cavenagh JD, et al. Differential and tumor-specific expression of CD160 in B-cell malignancies. Blood 2011;118:2174–83. [CrossRef]
- Li D, Fu Z, Chen S, Yuan W, Liu Y, Li L, et al. HVEM Gene Polymorphisms Are Associated with Sporadic Breast Cancer in Chinese Women. PLoS ONE 2013;8:e71040. [CrossRef]
- Chen S, Cao R, Liu C, Tang W, Kang M. Investigation of IL-4, IL-10 , and HVEM polymorphisms with esophageal squamous cell carcinoma: a case–control study involving 1929 participants. Biosci Rep 2020;40:BSR20193895. [CrossRef]
- Peltomäki P. Mutations and epimutations in the origin of cancer. Exp Cell Res 2012;318:299–310. [CrossRef]
- Foulkes WD. Inherited Susceptibility to Common Cancers. N Engl J Med 2008;359:2143–53. [CrossRef]
- Andrzejczak A, Partyka A, Wiśniewski A, Porębska I, Pawełczyk K, Ptaszkowski K, et al. The association of BTLA gene polymorphisms with non-small lung cancer risk in smokers and never-smokers. Front Immunol 2023;13:1006639. [CrossRef]
- Andrzejczak A, Tupikowski K, Tomkiewicz A, Małkiewicz B, Ptaszkowski K, Domin A, et al. The Variations’ in Genes Encoding TIM-3 and Its Ligand, Galectin-9, Influence on ccRCC Risk and Prognosis. Int J Mol Sci 2023;24:2042. [CrossRef]
- Partyka A, Tupikowski K, Kolodziej A, Zdrojowy R, Halon A, Malkiewicz B, et al. Association of 3′ nearby gene BTLA polymorphisms with the risk of renal cell carcinoma in the Polish population. Urol Oncol Semin Orig Investig 2016;34:419.e13-419.e19. [CrossRef]
- Darvin P, Toor SM, Sasidharan Nair V, Elkord E. Immune checkpoint inhibitors: recent progress and potential biomarkers. Exp Mol Med 2018;50:1–11. [CrossRef]
- Wagner M, Jasek M, Karabon L. Immune checkpoint molecules—inherited variations as markers for cancer risk. Front Immunol 2021;11:606721. [CrossRef]
- Vuong L, Kotecha RR, Voss MH, Hakimi AA. Tumor microenvironment dynamics in clear-cell renal cell carcinoma. Cancer Discov 2019;9:1349–57. [CrossRef]
- Bukavina L, Bensalah K, Bray F, Carlo M, Challacombe B, Karam JA, et al. Epidemiology of renal cell carcinoma: 2022 update. Eur Urol 2022;82:529–42. [CrossRef]
- Tupikowski K, Partyka A, Pawlak EA, Ptaszkowski K, Zdrojowy R, Frydecka I, et al. Variation in the gene encoding the co-inhibitory molecule BTLA is associated with survival in patients treated for clear cell renal carcinoma – results of a prospective cohort study. Arch Med Sci 2023;19:1454–62. [CrossRef]
- Wagner M, Tupikowski K, Jasek M, Tomkiewicz A, Witkowicz A, Ptaszkowski K, et al. SNP-SNP interaction in genes encoding PD-1/PD-L1 axis as a potential risk factor for clear cell renal cell carcinoma. Cancers 2020;12:3521. [CrossRef]
- Tupikowski K, Partyka A, Kolodziej A, Dembowski J, Debinski P, Halon A, et al. CTLA-4 and CD28 genes’ polymorphisms and renal cell carcinoma susceptibility in the Polish population -a prospective study. Tissue Antigens 2015;86:353–61. [CrossRef]
- Cheung TC, Oborne LM, Steinberg MW, Macauley MG, Fukuyama S, Sanjo H, et al. T cell intrinsic heterodimeric complexes between HVEM and BTLA determine receptivity to the surrounding microenvironment. J Immunol 2009;183:7286–96. [CrossRef]
- Shrestha R, Garrett-Thomson SC, Liu W, Almo SC, Fiser A. Redesigning HVEM interface for selective binding to LIGHT, BTLA, and CD160. Structure 2020;28:1197-1205.e2. [CrossRef]
- Cai G, Freeman GJ. The CD160, BTLA, LIGHT/HVEM pathway: a bidirectional switch regulating T-cell activation. Immunol Rev 2009;229:244–58. [CrossRef]
- Tu TC, Brown NK, Kim T-J, Wroblewska J, Yang X, Guo X, et al. CD160 is essential for NK-mediated IFN-γ production. J Exp Med 2015;212:415–29. [CrossRef]
- Šedý JR, Bjordahl RL, Bekiaris V, Macauley MG, Ware BC, Norris PS, et al. CD160 activation by herpesvirus entry mediator augments inflammatory cytokine production and cytolytic function by NK cells. J Immunol 2013;191:828–36. [CrossRef]
- Liu W, Garrett SC, Fedorov EV, Ramagopal UA, Garforth SJ, Bonanno JB, et al. Structural basis of CD160:HVEM recognition. Structure 2019;27:1286-1295.e4. [CrossRef]
- Lee W-C. Searching for disease-susceptibility loci by testing for Hardy-Weinberg disequilibrium in a gene bank of affected individuals. Am J Epidemiol 2003;158:397–400. [CrossRef]
- Makino T, Kadomoto S, Izumi K, Mizokami A. Epidemiology and prevention of renal cell carcinoma. Cancers 2022;14:4059. [CrossRef]
- Fang M, Huang W, Mo D, Zhao W, Huang R. Association of five snps in cytotoxic T-lymphocyte antigen 4 and cancer susceptibility: evidence from 67 studies. Cell Physiol Biochem 2018;47:414–27. [CrossRef]
- Yang M, Liu Y, Zheng S, Geng P, He T, Lu L, et al. Associations of PD-1 and PD-L1 gene polymorphisms with cancer risk: a meta-analysis based on 50 studies. Aging 2024. [CrossRef]
- Jo B-S, Choi SS. Introns: the functional benefits of introns in genomes. Genomics Inform 2015;13:112. [CrossRef]
- Wang Z, Wang K, Yang H, Han Z, Tao J, Chen H, et al. Associations between HVEM/LIGHT/BTLA/CD160 polymorphisms and the occurrence of antibody-mediate rejection in renal transplant recipients. Oncotarget 2017;8:100079–94. [CrossRef]
- He W, Zhao J, Liu X, Li S, Mu K, Zhang J, et al. Associations between CD160 polymorphisms and autoimmune thyroid disease: a case-control study. BMC Endocr Disord 2021;21:148. [CrossRef]
- Svejgaard A, Ryder LP. HLA and disease associations: Detecting the strongest association. Tissue Antigens 1994;43:18–27. [CrossRef]
Figure 1.
The rs1886730 variant of the HVEM gene predicts the overall survival of male ccRCC patients.
Figure 1.
The rs1886730 variant of the HVEM gene predicts the overall survival of male ccRCC patients.
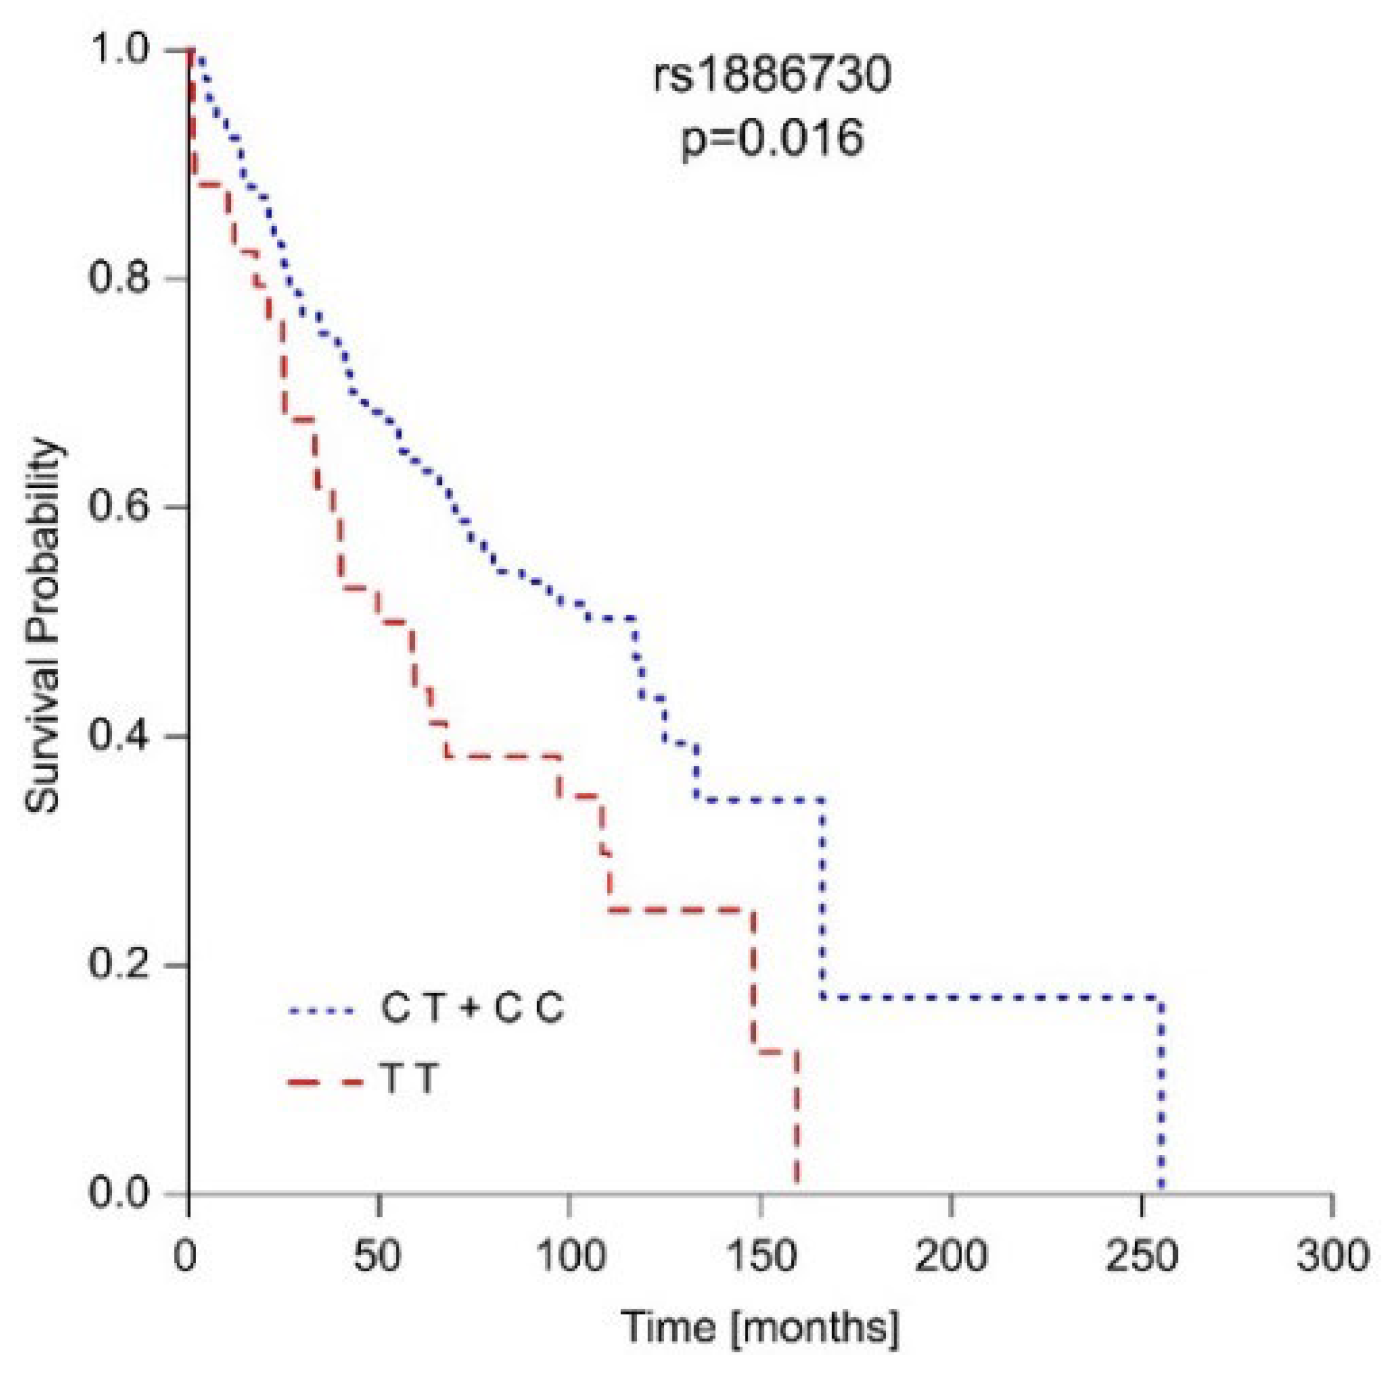
Table 1.
Genotype frequencies of HVEM and CD160 polymorphisms and their associations with ccRCC risk.
Table 1.
Genotype frequencies of HVEM and CD160 polymorphisms and their associations with ccRCC risk.
| SNP | Genotype | Case | Control | OR (95% CI) | p value | ||
|---|---|---|---|---|---|---|---|
| N | % | N | % | ||||
| rs1886730 | TT | 49 | 20.59 | 140 | 26.87 | 1 | 0.169 |
| CT | 130 | 54.62 | 257 | 49.33 | 1.44 (0.98-2.12) | ||
| CC | 59 | 24.79 | 124 | 23.80 | 1.36 (0.87-2.12) | ||
| CT+CC | 189 | 79.41 | 381 | 73.13 | 1.41 (0.98-2.04) | 0.063 | |
| TT+CT | 179 | 75.21 | 397 | 76.20 | 0.94 (0.66-1.35) | 0.768 | |
| rs2234167 | GG | 167 | 70.17 | 404 | 77.54 | 1 | 0.057 |
| AG | 68 | 28.57 | 108 | 20.73 | 1.52 (1.07-2.17) | ||
| AA | 3 | 1.26 | 9 | 1.73 | 0.89 (0.26-3.07) | ||
| AG+AA | 71 | 29.83 | 117 | 22.46 | 1.47 (1.04-2.07) | 0.029 | |
| GG+AG | 235 | 98.74 | 512 | 98.27 | 1.25 (0.36-4.29) | 0.633 | |
| rs8725 | GG | 52 | 21.85 | 145 | 27.83 | 1 | 0.218 |
| AG | 125 | 52.52 | 252 | 48.37 | 1.38 (0.94-2.02) | ||
| AA | 61 | 25.63 | 124 | 23.80 | 1.37 (0.88-2.12) | ||
| AG+AA | 186 | 78.15 | 376 | 72.17 | 1.37 (0.96-1.97) | 0.081 | |
| GG+AG | 177 | 74.37 | 397 | 76.20 | 0.90 (0.64-1.29) | 0.586 | |
| rs744877 | CC | 77 | 32.35 | 173 | 33.21 | 1 | 0.954 |
| AC | 118 | 49.58 | 258 | 49.52 | 1.03 (0.73-1.45) | ||
| AA | 43 | 18.07 | 90 | 17.27 | 1.08 (0.69-1.69) | ||
| AC+AA | 161 | 67.65 | 348 | 66.79 | 1.04 (0.75-1.44) | 0.817 | |
| CC+AC | 195 | 81.93 | 431 | 82.73 | 0.94 (0.63-1.40) | 0.790 | |
| rs2231375 | CC | 78 | 33.05 | 206 | 39.62 | 1 | 0.030 |
| CT | 130 | 55.08 | 233 | 44.81 | 1.47 (1.05-2.06) | ||
| TT | 28 | 11.86 | 81 | 15.58 | 0.92 (0.56-1.52) | ||
| CT+TT | 158 | 66.95 | 314 | 60.38 | 1.33 (0.96-1.83) | 0.084 | |
| CC+CT | 208 | 88.14 | 439 | 84.42 | 1.36 (0.86-2.14) | 0.178 | |
Table 2.
Analysis of the associations between two genetic factor carriers of the HVEM rs2243167 [AG] genotype and the CD160 2231375 [CT] genotype with ccRCC risk using the Svejgaard and Ryder method.
Table 2.
Analysis of the associations between two genetic factor carriers of the HVEM rs2243167 [AG] genotype and the CD160 2231375 [CT] genotype with ccRCC risk using the Svejgaard and Ryder method.
| ccRCC (n=238) | Control (n=521) | ||||
| A+, B+ | 39 | 57 | |||
| A+, B- | 28 | 51 | |||
| A-, B+ | 91 | 177 | |||
| A-, B- | 78 | 236 | |||
| Test | OR | P value | 95% CI | Comparison | Individual association |
| (a) A | 1.53 | 0.02 | 1.08-2.18 | ||
| (b) B | 1.58 | 0.04 | 1.16-2.15 | ||
| (c) + + vs - + | 1.33 | 0.24 | 0.82-2.15 | A in B positive | A association |
| (d) + - vs - - | 1.85 | 0.02 | 1.09-3.13 | A in B negative | |
| (e) + + vs + - | 1.25 | 0.48 | 0.67-2.31 | B in A positive | B association |
| (f) - + vs - - | 1.56 | 0.02 | 1.09-2.23 | B in A negative | |
| (g) + - vs - + | 1.07 | 0.81 | 0.63-1.81 | Differences between A and B | |
| (h) + + vs - - | 2.07 | 0.003 | 1.30-3.35 | Combined association | |
Table 3.
Unifactorial and multifactorial logistic regression analysis of an association of HVEM and CD160 gene variations with ccRCC risk.
Table 3.
Unifactorial and multifactorial logistic regression analysis of an association of HVEM and CD160 gene variations with ccRCC risk.
| Logistic Regression | Regression Coefficient | Standard Error | p-value | OR | CI 95% | |
|---|---|---|---|---|---|---|
| Unifactorial Model | ||||||
| rs2234167 | AA+AG | 0.38 | 0.18 | 0.029 | 1.47 | 1.04-2.07 |
| rs8725 | G G | -0.32 | 0.18 | 0.082 | 0.72 | 0.50-1.04 |
| rs1886730 | T T | -0.35 | 0.19 | 0.064 | 0.71 | 0.49-1.02 |
| rs2231375 | C T | 0.41 | 0.16 | 0.010 | 1.50 | 1.10-2.05 |
| Multifactorial Model | ||||||
| rs2234167 | AA +AG | 0.26 | 0.19 | 0.16 | 1.30 | 0.90-1.88 |
| rs8725 | G G | -0.09 | 0.33 | 0.80 | 0.92 | 0.48-1.75 |
| rs1886730 | T T | -0.18 | 0.34 | 0.60 | 0.84 | 0.43-1.62 |
| rs2231375 | C T | 0.39 | 0.16 | 0.015 | 1.47 | 1.08-2.01 |
Table 4.
The haplotype distribution of studied SNPs between ccRCC patients and controls.
| Haplotype* | Case (%) | Control (%) | Odds Ratio [95% CI] | p value |
|---|---|---|---|---|
| C A A A C | 15.23 (0.032) | 41.05 (0.039) | 0.79 [0.434~1.438] | 0.44 |
| C A A C T | 44.30 (0.094) | 42.11 (0.040) | 2.41 [1.55~3.73] | 5.78e-5 |
| C G A A C | 79.55 (0.179) | 156.46 (0.150) | 1.11 [0.83~1.50] | 0.48 |
| C G A C C | 29.73 (0.063) | 83.12 (0.080) | 0.75 [0.49~1.16] | 0.20 |
| C G A C T | 50.36 (0.107) | 111.32 (0.107) | 0.97 [0.68~1.38] | 0.86 |
| T G G A C | 92.68 (0.196) | 189.24 (0.182) | 1.07 [0.81~1.41] | 0.65 |
| T G G C C | 39.02 (0.083) | 102.89 (0.099) | 0.80 [0.54~1.17] | 0.25 |
| T G G C T | 80.71 (0.171) | 201.04 (0.193) | 0.83 [0.62~1.11] | 0.21 |
| Global χ2=20.33, df=7, p=0.005 | ||||
| * rs1886730, rs2234167, rs8725, rs744877, rs2231375 | ||||
Disclaimer/Publisher’s Note: The statements, opinions and data contained in all publications are solely those of the individual author(s) and contributor(s) and not of MDPI and/or the editor(s). MDPI and/or the editor(s) disclaim responsibility for any injury to people or property resulting from any ideas, methods, instructions or products referred to in the content. |
© 2024 by the authors. Licensee MDPI, Basel, Switzerland. This article is an open access article distributed under the terms and conditions of the Creative Commons Attribution (CC BY) license (http://creativecommons.org/licenses/by/4.0/).
Copyright: This open access article is published under a Creative Commons CC BY 4.0 license, which permit the free download, distribution, and reuse, provided that the author and preprint are cited in any reuse.


