
Submitted:
29 May 2024
Posted:
29 May 2024
You are already at the latest version
Abstract
Identifying the primary site of origin of metastatic cancer is vital for guiding treatment decisions, especially for patients with cancer of unknown primary (CUP). Despite advanced diagnostic techniques, CUP remains difficult to pinpoint and is responsible for a considerable number of cancer-related fatalities. Understanding its origin is crucial for effective management and potentially improving patient outcomes.
This study introduces a machine learning framework ONCOfind-AI that leverages transcriptome-based gene set features to enhance the accuracy of predicting the origin of metastatic cancers. By ensuring compatibility between RNA-sequencing and micro-array data, we were able to construct a more comprehensive training dataset. Integrating data from different platforms improved the accuracy of our machine learning models for predicting cancer origins. Our method was validated using external data from clinical samples collected through Kangbuk Samsung Medical Center and the Gene Expression Omnibus. The external validation results demonstrated a top-1 accuracy ranging from 0.80 to 0.86, with a top-2 accuracy of 0.90. This study highlights that incorporating biological knowledge through curated gene sets can merge gene expression data from different platforms, enhancing the compatibility needed for more effective machine learning prediction models.
Keywords:
Cancer of Unknown Primary
; Metastatic Cancer
; Machine Learning
; Gene Expression
; Transcriptome
Finding the primary site of cancer is important for determining the treatment regimen for the cancer. Cancer of unknown primary (CUP) describes the diagnosis of metastatic cancer where the primary site of origin eludes detection despite comprehensive diagnostic evaluations [1]. CUP remains a perplexing challenge in oncology, representing approximately 3-5% of all malignancies a decade ago, compared to 2-4% in recent years [1,2]. Nevertheless, CUP ranks as the third to fourth leading cause of cancer-related mortality [3]. CUP patients also exhibit greater levels of anxiety, and depression, along with impaired physical, mental, and social relationships than patients with known primary cancer and non-metastatic known primary cancer [4]. Certainly, the majority of patients(80-90%) diagnosed with CUPs belong to an unfavorable group, where their median overall survival(OS) spans from 3 to 11 months, with only a 1-year OS of 25-40% [5].
Identification of primary cancer site characteristics and associated expression targets enables the utilization of targeted anticancer drugs, enhancing prognosis over broad chemotherapy [3,6,7].Ding et al. performed a meta-analysis, and determined that Identifying the tumor of origin and administering targeted therapy are efficacious, particularly for CUP patients with receptive tumor types [8]. However, traditional pathology methods, while considered the gold standard, often face limitations in exhaustively identifying the primary site due to tissue constraints and the complexity of diagnostic stains. Recent studies have demonstrated the potential of ML algorithms, trained on diverse tumor and normal tissue datasets, to discern tissue-specific and tumor-specific patterns from high-resolution molecular data. Molecular diagnostic methodologies, exemplified by genome screening, have the potential to facilitate the identification of elusive origins in CUP cases [9,10]. These approaches have shown promise in surpassing traditional pathology workflows in cancer diagnosis by capitalizing on transcriptome-wide profiling. By utilizing gene expression data and employing sophisticated ML techniques, researchers have achieved notable success in improving the diagnostic accuracy for various cancers [11,12]. Using gene expression profiling (GEP) analysis, classical statistics and machine learning classification techniques can be used to predict primary cancers [13,14]. Researchers used public transcriptome data to develop deep learning models to identify genetic markers of primary and metastatic cancers and they validated the model using newly acquired clinical samples [15,16]. Moon et al. developed OncoNPC, a machine-learning classifier based on next-generation sequencing, which identified distinct subgroups within CUP and improved treatment outcomes through genomically guided therapies [17].
With the increase in the amount of tumor sample transcriptome data obtained through RNA-sequencing, the amount of data available for learning is steadily increasing. However, a significant volume of cancer transcriptome data has been generated using micro-arrays, and to utilize both platforms’ data, compatibility must be ensured. This inter-platform compatibility can be achieved through featurization using gene set information that reflects biological knowledge [18]. By employing this approach, it is possible to construct a more extensive dataset for training, which, is expected to improve accuracy. In this manner, our model was able to train more data than previous studies and can make predictions for both micro-array and RNA sequencing data.
In this study, we used transcriptome data for 17 solid tumors from the TCGA [19] and Oncopression (OCP) datasets [20], and utilized training data featurized into gene set enrichment scores. We then trained a classification machine learning ensemble model by combining logistic regression, LightGBM, and SVM through a voting method (Figure 1). Furthermore, we conducted external validation using clinical samples collected from metastatic sites.
1. Methods
1.1. Data Source
The data sources for training included transcriptome data for primary cancer collected from the OCP and TCGA databases. OCP data were created via micro-array with normalization [20], whereas the TCGA data, downloaded from Firehose (gdac.broadinstitute.org), were created via RNA-Seq and normalized to RNA-Seq by expectation-maximization (RSEM). Total 27,941 samples for 17 cancer tissue type were selected for training (Table 1). For external validation, 103 formalin-fixed paraffin-embedded (FFPE) tissue samples from patients collected by Kangbuk Samsung Medical Center (KBSMC) from 2018 to 2022. Patient samples were collected after informed consent was obtained, and the study followed the guidelines of the Declaration of Helsinki, and received approval from the Institutional Review Board (KBSMC 2022-11-018). Additionally, public datasets comprising 107 samples across 7 cohorts were obtained from the Gene Expression Omnibus (GEO) to further validate our findings (Table 2).
1.1.1. RNA Sequencing and Gene Expression Profiling
mRNA was extracted from FFPE tissue samples from patients using an RNeasy FFPE Kit (Qiagen, Hilden, Germany), according to the manufacturer’s instruction. In summary, FFPE tissue sections were deparaffinized by treatment with deparaffinization solution and lysed by proteinase K digestion followed by heat treatment. Next, the supernatants treated with DNase were added to Buffer RBC and ethanol to adjust binding conditions for RNA. The samples were applied to the RNeasy MinElute spin column, where the total RNA bound to the membrane and contaminants were efficiently washed away. RNA is then eluted in RNase-free water. The RNA concentration was determined using a NanoDrop (Thermo Fisher Scientific, MA, USA). Subsequently, RNA-seq was performed by Macrogen (Seoul, Korea) on the Illumina (CA, USA) RNA-Seq platform for paired-end sequencing, employing the SureSelectXT RNA Direct Reagent Kit (Agilent, CA, USA). The raw FASTQ RNA-Seq data were trimmed using the Trimmomatic-0.39-1 tool [21]. Alignment and quantification were performed using STAR 2.7.8a and RSEM 1.3.3 with the GRCh38.105 genome reference [22,23].
1.2. Featurization and Feature Selection
Figure 2A shows that the average expression levels of each gene between the TCGA and OCP groups for breast cancer are different in both range and distribution pattern. To integrate the different characteristics of these data, we converted the gene-wise information of the transcriptome to the gene set dimension. We created the gene set enrichment scores for all samples, and statistical values were extracted using the Kolmogorov-Smirnov test with 8,300 gene sets from the "Hallmarker gene sets", "C2 curated gene sets", "C6 oncogenic signature gene sets", and "C8 cell type signature gene sets" obtained from MsigDB (www.gsea-msigdb.org, v2023.2) [24,25,26,27,28,29,30,31,32,33]. Positive or negative signs were assigned based on the directionality of the expression difference.
After computing the 8,300 gene set scores, we investigated which of these could provide a comprehensive representation of the OCP and TCGA data. In feature selection, the receiver operating characteristic (ROC) based feature selection approach can be used effectively as a tool to evaluate individual features [34,35]. In particular, for the binary-class problem, the single feature classifier constructed from feature can establish an appropriate threshold . If , x is classified as the TCGA class. And , x is classified as the OCP class. If one feature has an area under the ROC curve (AUC) value for a single-feature classifier farther from 0.5 than another feature , we can say that is more discriminative than in the two classes [34]. We calculated AUC for each gene set feature to discriminate between the OCP cohort and TCGA cohort. The Figure 2B shows a histogram of the AUC values calculated for each gene set feature. An AUC of 0.5 means that the classifier has no discriminative capacity at all, which means that OCP and TCGA can be used comprehensively when using features around 0.5. Therefore, feature selection was performed at intervals of ± 0.05 around a baseline of AUC 0.5, and these selected feature groups were used for modeling.
We found that simply converting to gene set scores significantly normalized the ranges and distribution patterns of the OCP and TCGA cohorts. The Figure 2C-1) shows all 8300 gene sets used, and shows that TCGA and OCP data are more highly correlated than at the gene level. Moreover, filtering gene sets that show differences between groups by AUC range can achieve a greater correlation (Figure 2C-2). To examine the distribution through T-SNE clustering for major cancer types such as lung, stomach, and breast cancer, compatibility between TCGA and OCP can be observed (Figure 2D). The dimension reduction for features was performed using T-SNE from Scikit-learn to visualize the distribution of samples and groups in a 2-dimensional space, further aiding in the understanding and optimization of the model. The Figure 2D-1 is when all 8300 gene sets are used, and D-2 is when 1249 gene sets from the AUC range of 0.45-0.55 are used. In Figure 2D-2, using only 1249 features selected by AUC, we can see that the features are more focused on the characteristics of the cancer type than the data type.
1.3. Cancer Primary Site Classification Model
To create a classification ensemble model based on machine learning, logistic regression, LightGBM, and support vector machine (SVM) were modeled using a soft voting classification approach. For this algorithm, the Python packages Scikit-learn (version 0.22.1) and LightGBM (version 3.1.1) were used. LightGBM is renowned for its high efficiency and low memory usage, which make it particularly effective for handling large datasets with high dimensionality. It also excels in terms of speed and accuracy. Additionally, SVM is advantageous for its effectiveness in high-dimensional spaces and its versatility through the use of different kernel functions, enabling it to model non-linear boundaries. The ensemble approach, which combines these powerful classifiers, leverages their individual strengths to enhance the predictive performance and achieve significant results and parameters were set via a grid search.
1.4. External Validation
For external validation in metastatic cancer, predictions were made through the model using KBSMC and GEO data, and a ranking was created based on the probability. To further validate the model in the real world, we trained the model on public data and then evaluated it on a prospectively collected sample of cancer patients from the hospital. Through this process, the top-1 prediction accuracy was calculated.
2. Results and Discussion
We demonstrate that the more integrated the data are, the better the prediction performance for datasets that from real-world clinical data, and show how to integrate the two largest sources of transcriptomic data, micro-arrays and RNA sequencing, and use them as features in machine learning model. The Figure 3A shows the average F1 scores for each model with features in the range of AUC values shown in B of Figure 2. In this case, the average F1 score is the average of the predictions across the 17 cancer primary organs. The model was trained with TCGA and then tested with cancer types from OCP data, and conversely, the model was trained with OCP data and then tested with TCGA cancer types. Overall line does not shown as medians because it has a greater number of OCP data, 19541, than TCGA, 8400 (Table 1). We found that AUC 0.5 ± 0.1 to 0.3 was associated with an average F1 score of 0.9 or higher (Figure 3A). Therefore, we selected features from this range to build our model and conduct external data validation (Figure 3B).
Models trained on TCGA data, OCP data, and a combination of both TCGA and OCP were validated using external data. The best scores for the validation sets in each model are shown in Figure 3B and Table 3. Notably, models trained on TCGA data generated through RNA sequencing exhibited significantly lower performance when validated with KBSMC data, which were also produced through RNA sequencing. However, we showed a significant improvement in performance when micro-array data from OCP were included in the training with our feature integration method. The models trained on the combined TCGA+OCP dataset demonstrated an accuracy range of approximately 0.80 to 0.86, depending on the range of feature selection (Figure 3B, Table 3). In Figure 3, C and D are the confusion matrix for the top-1 prediction of the external validation set. The AUC of the feature selection group adopted in the evaluation model ranged from 0.5 ± 0.25. Most of the answers matched the actual primary site, and for those that were incorrect, the most likely answer was a neighboring organ. For example, when the bile duct is the correct answer, the incorrect answers are for the pancreas and colorectum, and the incorrect answers for uterus are ovary and kidney. In particular, the prostate, uterus, bile duct, and pancreas, which have a relatively high incorrect answer rates, have fewer than 10 data points, making it difficult to perform sufficient validation. Our model had an average accuracy of 0.9 when calculating the accuracy for KBSMC+GEO data up to the prediction of the top-2 (Table 4).
3. Conclusion
In this study, we demonstrated the feasibility of using gene set scores for the featurization of transcriptome data generated from different platforms, facilitating the integration of such data for training purposes. This approach enabled us to achieve higher performance, underscoring the potential of integrated datasets to enhance the predictive accuracy of our models. By converting gene expression data into gene set scores, we could mitigate the variability and noise often associated with data from heterogeneous sources, thereby improving the robustness and reliability of our predictions.
Our model was validated on samples of metastatic cancer patients collected from hospitals, and while the model trained on a single of public database did not predict real-world clinical data well, our method predicted the primary site with an accuracy of better than 0.8. While the top-1 accuracy achieved in this study remained in the 0.8 range, extending the metric to include top-2 accuracy revealed a performance level of approximately 0.9(Table 4). Furthermore, our model can learn the tissue characteristics of the primary site because the answers that missed the top-1 prediction also said organs similar to the correct answer. This suggests that with more comprehensive feature selection based on the featurization approach outlined in our research, and as the volume of data across all cancer types increases, we can anticipate even greater performance. In future research, we will validate whether our model could perform as well for other non-Asian ethnicities. Cancer genomic variation varies significantly by race, and in the public database TCGA, only 672 out of 11,122 patients are Asian [19], therefore we expect our model to perform better for Americans.
Acknowledgments
This research was supported by Seoul R&BD Program(BT220252) through the Seoul Business Agency(SBA) funded by The Seoul Metropolitan Government.
Conflicts of Interest
The authors declare no conflicts of interest.
References
- Pavlidis, N.; Pentheroudakis, G. Cancer of unknown primary site. The Lancet 2012, 379, 1428–1435. [Google Scholar] [CrossRef] [PubMed]
- Varadhachary, G.; Abbruzzese, J.L. Carcinoma of unknown primary. In Abeloff’s Clinical oncology; Elsevier, 2020; pp. 1694–1702.
- Qaseem, A.; Usman, N.; Jayaraj, J.S.; Janapala, R.N.; Kashif, T. Cancer of unknown primary: a review on clinical guidelines in the development and targeted management of patients with the unknown primary site. Cureus 2019, 11. [Google Scholar] [CrossRef]
- Hyphantis, T.; Papadimitriou, I.; Petrakis, D.; Fountzilas, G.; Repana, D.; Assimakopoulos, K.; Carvalho, A.F.; Pavlidis, N. Psychiatric manifestations, personality traits and health-related quality of life in cancer of unknown primary site. Psycho-Oncology 2013, 22, 2009–2015. [Google Scholar] [CrossRef] [PubMed]
- Ma, W.; Wu, H.; Chen, Y.; Xu, H.; Jiang, J.; Du, B.; Wan, M.; Ma, X.; Chen, X.; Lin, L.; et al. New techniques to identify the tissue of origin for cancer of unknown primary in the era of precision medicine: progress and challenges. Briefings in Bioinformatics 2024, 25, bbae028. [Google Scholar] [CrossRef]
- Rassy, E.; Pavlidis, N. Progress in refining the clinical management of cancer of unknown primary in the molecular era. Nature reviews Clinical oncology 2020, 17, 541–554. [Google Scholar] [CrossRef]
- Shuel, S.L. Targeted cancer therapies: Clinical pearls for primary care. Canadian Family Physician 2022, 68, 515. [Google Scholar] [CrossRef]
- Ding, Y.; Jiang, J.; Xu, J.; Chen, Y.; Zheng, Y.; Jiang, W.; Mao, C.; Jiang, H.; Bao, X.; Shen, Y.; et al. Site-specific therapy in cancers of unknown primary site: a systematic review and meta-analysis. ESMO open 2022, 7, 100407. [Google Scholar] [CrossRef] [PubMed]
- Massard, C.; Loriot, Y.; Fizazi, K. Carcinomas of an unknown primary origin—diagnosis and treatment. Nature reviews Clinical oncology 2011, 8, 701–710. [Google Scholar] [CrossRef]
- Varghese, A.; Arora, A.; Capanu, M.; Camacho, N.; Won, H.; Zehir, A.; Gao, J.; Chakravarty, D.; Schultz, N.; Klimstra, D.; et al. Clinical and molecular characterization of patients with cancer of unknown primary in the modern era. Annals of Oncology 2017, 28, 3015–3021. [Google Scholar] [CrossRef]
- Petinrin, O.O.; Saeed, F.; Toseef, M.; Liu, Z.; Basurra, S.; Muyide, I.O.; Li, X.; Lin, Q.; Wong, K.C. Machine learning in metastatic cancer research: Potentials, possibilities, and prospects. Computational and Structural Biotechnology Journal 2023. [Google Scholar] [CrossRef]
- Divate, M.; Tyagi, A.; Richard, D.J.; Prasad, P.A.; Gowda, H.; Nagaraj, S.H. Deep learning-based pan-cancer classification model reveals tissue-of-origin specific gene expression signatures. Cancers 2022, 14, 1185. [Google Scholar] [CrossRef] [PubMed]
- Zheng, Y.; Ding, Y.; Wang, Q.; Sun, Y.; Teng, X.; Gao, Q.; Zhong, W.; Lou, X.; Xiao, C.; Chen, C.; et al. 90-gene signature assay for tissue origin diagnosis of brain metastases. Journal of translational medicine 2019, 17, 1–9. [Google Scholar] [CrossRef]
- Jiang, W.; Shen, Y.; Ding, Y.; Ye, C.; Zheng, Y.; Zhao, P.; Liu, L.; Tong, Z.; Zhou, L.; Sun, S.; et al. A naive Bayes algorithm for tissue origin diagnosis (TOD-Bayes) of synchronous multifocal tumors in the hepatobiliary and pancreatic system. International journal of cancer 2018, 142, 357–368. [Google Scholar] [CrossRef]
- Grewal, J.K.; Tessier-Cloutier, B.; Jones, M.; Gakkhar, S.; Ma, Y.; Moore, R.; Mungall, A.J.; Zhao, Y.; Taylor, M.D.; Gelmon, K.; et al. Application of a neural network whole transcriptome–based pan-cancer method for diagnosis of primary and metastatic cancers. JAMA network open 2019, 2, e192597–e192597. [Google Scholar] [CrossRef]
- Zhao, Y.; Pan, Z.; Namburi, S.; Pattison, A.; Posner, A.; Balachander, S.; Paisie, C.A.; Reddi, H.V.; Rueter, J.; Gill, A.J.; et al. CUP-AI-Dx: A tool for inferring cancer tissue of origin and molecular subtype using RNA gene-expression data and artificial intelligence. EBioMedicine 2020, 61. [Google Scholar] [CrossRef] [PubMed]
- Moon, I.; LoPiccolo, J.; Baca, S.C.; Sholl, L.M.; Kehl, K.L.; Hassett, M.J.; Liu, D.; Schrag, D.; Gusev, A. Machine learning for genetics-based classification and treatment response prediction in cancer of unknown primary. Nature Medicine 2023, 29, 2057–2067. [Google Scholar] [CrossRef] [PubMed]
- van der Kloet, F.M.; Buurmans, J.; Jonker, M.J.; Smilde, A.K.; Westerhuis, J.A. Increased comparability between RNA-Seq and microarray data by utilization of gene sets. PLoS computational biology 2020, 16, e1008295. [Google Scholar] [CrossRef]
- Yuan, J.; Hu, Z.; Mahal, B.A.; Zhao, S.D.; Kensler, K.H.; Pi, J.; Hu, X.; Zhang, Y.; Wang, Y.; Jiang, J.; et al. Integrated analysis of genetic ancestry and genomic alterations across cancers. Cancer cell 2018, 34, 549–560. [Google Scholar] [CrossRef]
- Lee, J.; Choi, C. Oncopression: gene expression compendium for cancer with matched normal tissues. Bioinformatics 2017, 33, 2068–2070. [Google Scholar] [CrossRef]
- Bolger, A.M.; Lohse, M.; Usadel, B. Trimmomatic: a flexible trimmer for Illumina sequence data. Bioinformatics 2014, 30, 2114–2120. [Google Scholar] [CrossRef]
- Dobin, A.; Davis, C.A.; Schlesinger, F.; Drenkow, J.; Zaleski, C.; Jha, S.; Batut, P.; Chaisson, M.; Gingeras, T.R. STAR: ultrafast universal RNA-seq aligner. Bioinformatics 2013, 29, 15–21. [Google Scholar] [CrossRef] [PubMed]
- Li, B.; Dewey, C.N. RSEM: accurate transcript quantification from RNA-Seq data with or without a reference genome. BMC bioinformatics 2011, 12, 1–16. [Google Scholar] [CrossRef] [PubMed]
- Subramanian, A.; Tamayo, P.; Mootha, V.K.; Mukherjee, S.; Ebert, B.L.; Gillette, M.A.; Paulovich, A.; Pomeroy, S.L.; Golub, T.R.; Lander, E.S.; et al. Gene set enrichment analysis: a knowledge-based approach for interpreting genome-wide expression profiles. Proceedings of the National Academy of Sciences 2005, 102, 15545–15550. [Google Scholar] [CrossRef] [PubMed]
- Liberzon, A.; Birger, C.; Thorvaldsdóttir, H.; Ghandi, M.; Mesirov, J.P.; Tamayo, P. The molecular signatures database hallmark gene set collection. Cell systems 2015, 1, 417–425. [Google Scholar] [CrossRef] [PubMed]
- Shao, X.; Gomez, C.D.; Kapoor, N.; Considine, J.M.; Grams, C.; Gao, Y.; Naba, A. MatrisomeDB 2.0: 2023 updates to the ECM-protein knowledge database. Nucleic acids research 2023, 51, D1519–D1530. [Google Scholar] [CrossRef] [PubMed]
- Newman, J.C.; Weiner, A.M. L2L: a simple tool for discovering the hidden significance in microarray expression data. Genome biology 2005, 6, 1–18. [Google Scholar] [CrossRef] [PubMed]
- Zeller, K.I.; Jegga, A.G.; Aronow, B.J.; O’Donnell, K.A.; Dang, C.V. An integrated database of genes responsive to the Myc oncogenic transcription factor: identification of direct genomic targets. Genome biology 2003, 4, 1–10. [Google Scholar] [CrossRef] [PubMed]
- Nishimura, D. BioCarta. Biotech Software & Internet Report: The Computer Software Journal for Scient 2001, 2, 117–120. [Google Scholar]
- Kanehisa, M.; Goto, S.; Furumichi, M.; Tanabe, M.; Hirakawa, M. KEGG for representation and analysis of molecular networks involving diseases and drugs. Nucleic acids research 2010, 38, D355–D360. [Google Scholar] [CrossRef]
- Schaefer, C.F.; Anthony, K.; Krupa, S.; Buchoff, J.; Day, M.; Hannay, T.; Buetow, K.H. PID: the pathway interaction database. Nucleic acids research 2009, 37, D674–D679. [Google Scholar] [CrossRef]
- Jassal, B.; Matthews, L.; Viteri, G.; Gong, C.; Lorente, P.; Fabregat, A.; Sidiropoulos, K.; Cook, J.; Gillespie, M.; Haw, R.; et al. The reactome pathway knowledgebase. Nucleic acids research 2020, 48, D498–D503. [Google Scholar] [CrossRef] [PubMed]
- Pico, A.R.; Kelder, T.; Van Iersel, M.P.; Hanspers, K.; Conklin, B.R.; Evelo, C. WikiPathways: pathway editing for the people. PLoS biology 2008, 6, e184. [Google Scholar] [CrossRef] [PubMed]
- Sun, L.; Wang, J.; Wei, J. AVC: Selecting discriminative features on basis of AUC by maximizing variable complementarity. BMC bioinformatics 2017, 18, 73–89. [Google Scholar] [CrossRef] [PubMed]
- Fawcett, T. An introduction to ROC analysis. Pattern recognition letters 2006, 27, 861–874. [Google Scholar] [CrossRef]
Figure 1.
The figure presents the scheme of modeling process.RNA sequencing and micro-array data were collected from TCGA and Oncopression, respectively, and featurization using gene sets that can represent the characteristics of each tissue and organ. Using this feature scores, we developed a model to predict the primary site among 17 organs.
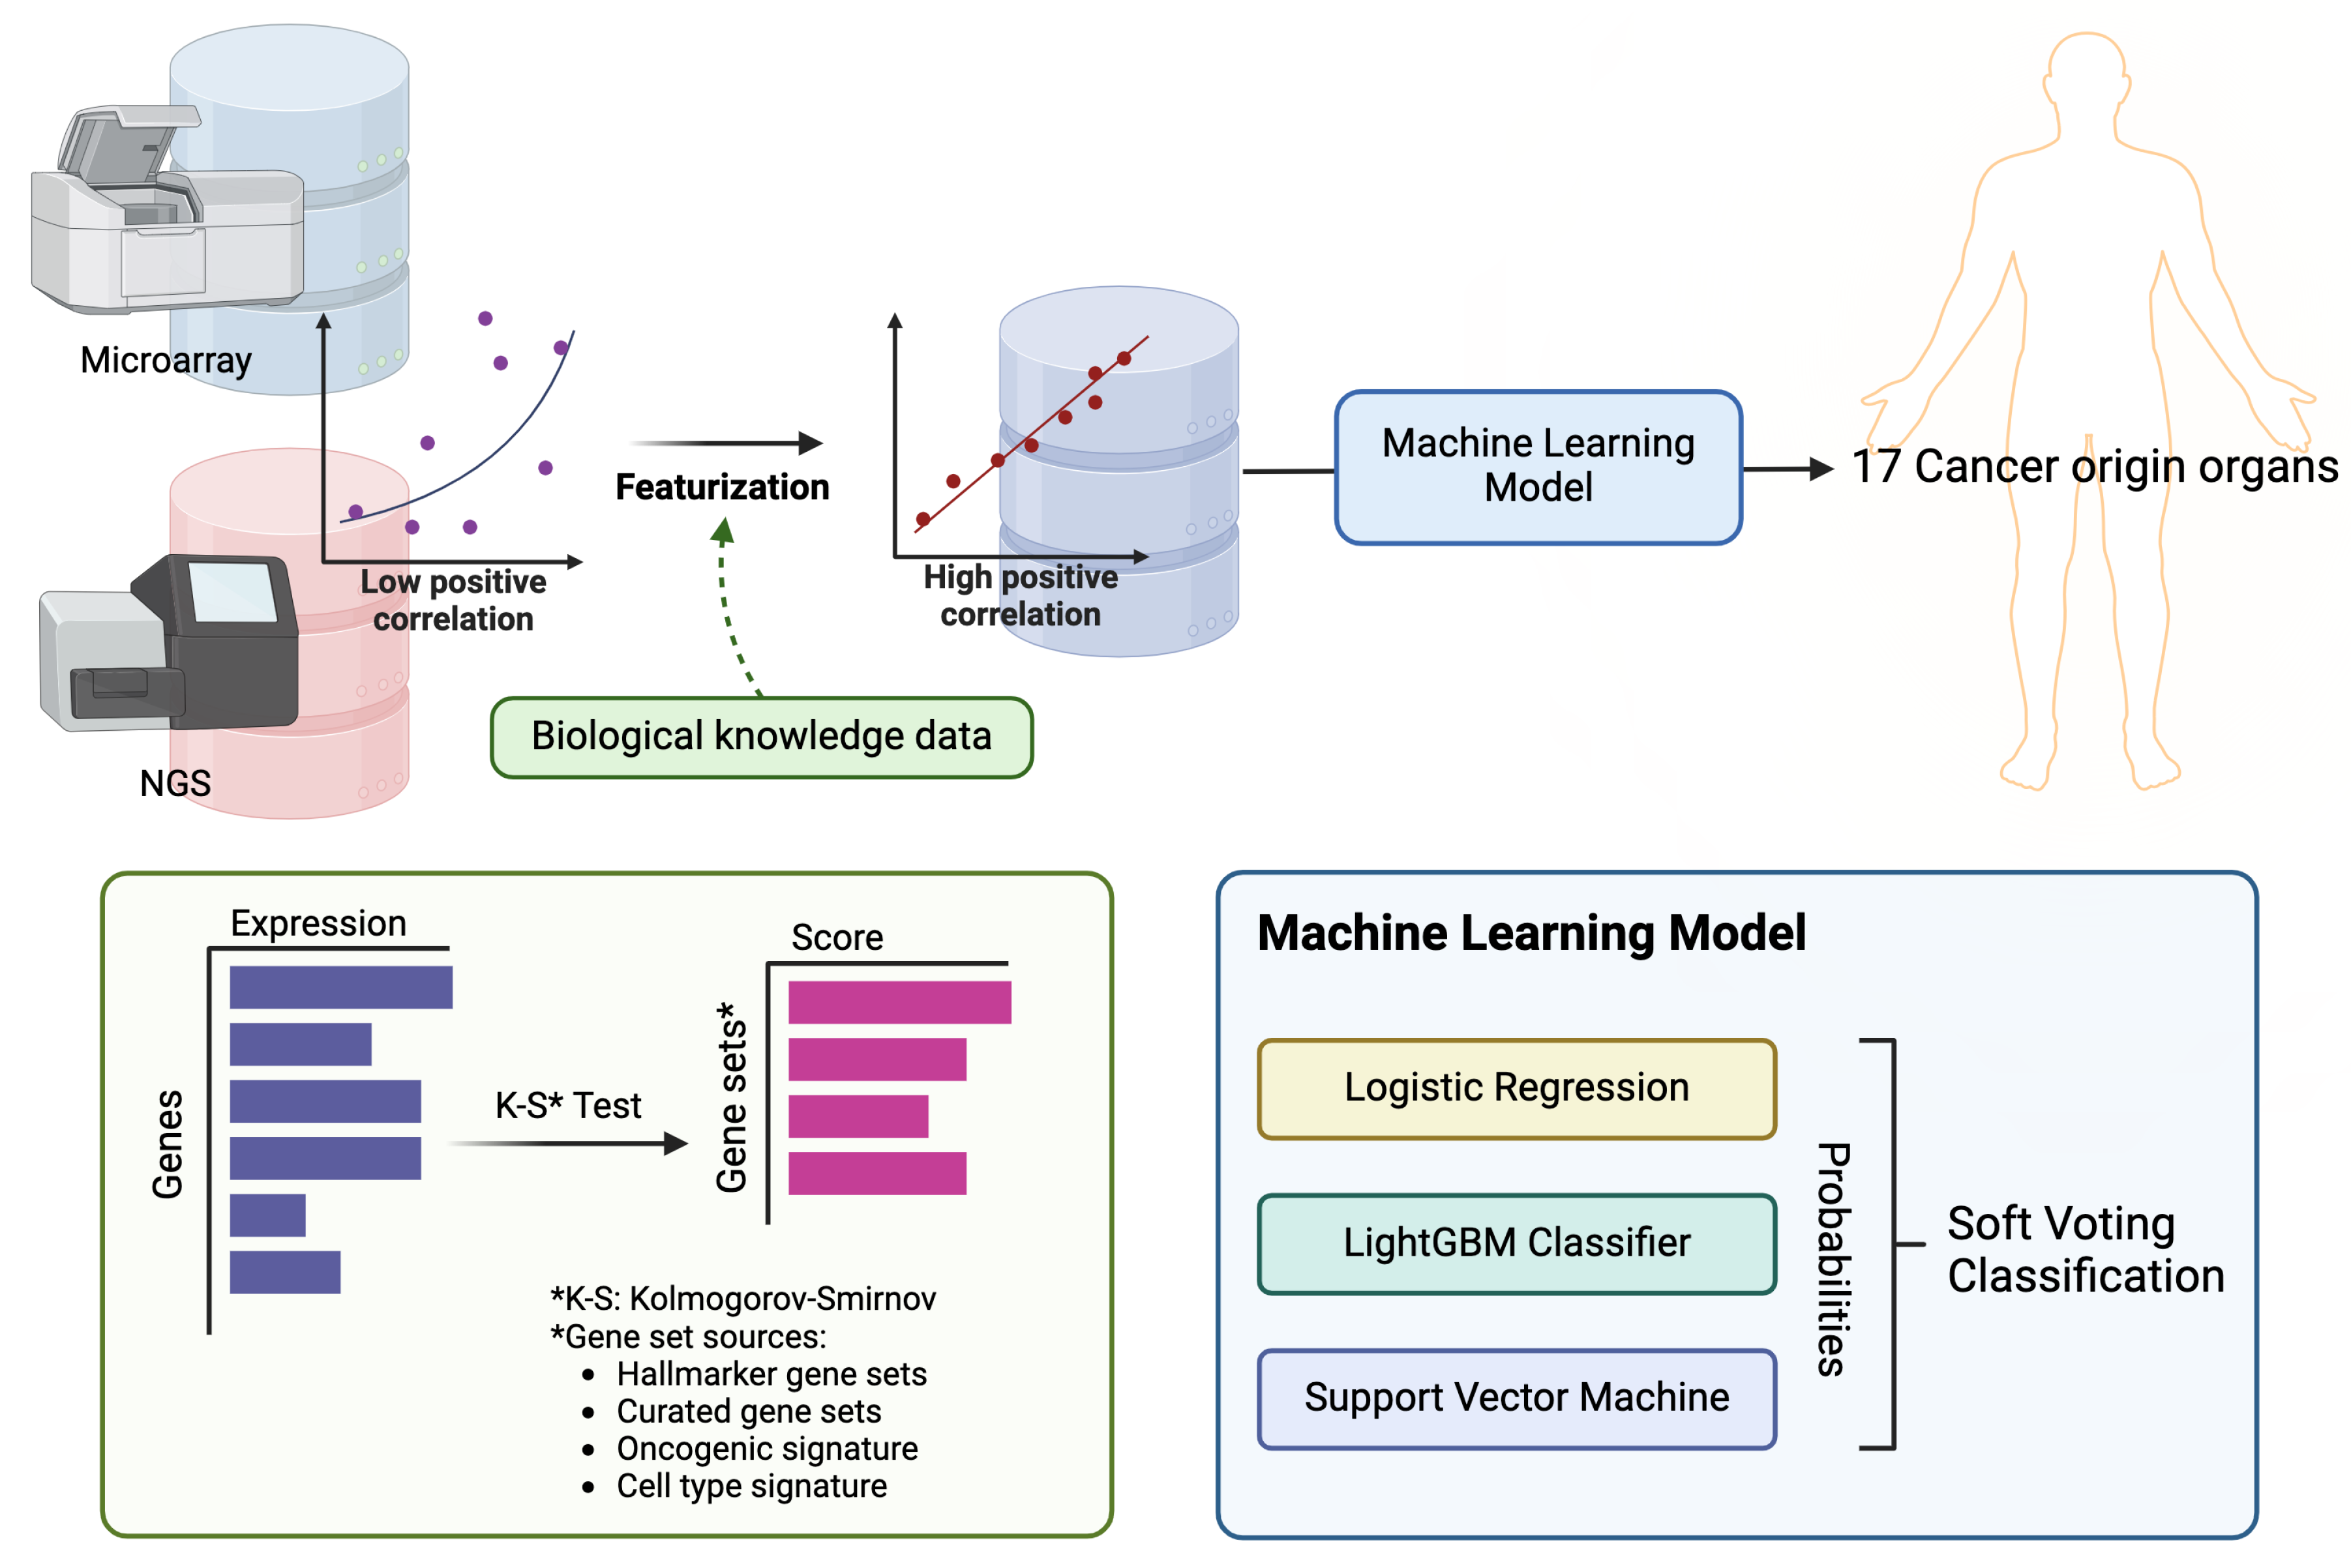
Figure 2.
Featurization and feature selection. (A) Average expression of each genes by groups from breast cancer (BRCA). (B) Histogram of TCGA-OCP distinguishing AUC value by gene sets. (C) Average Enrichment Score of each gene sets by groups from BRCA. (D) Distribution of samples by T-SNE. C-1 ,D-1 are when all 8300 gene sets are used. C-2, D-2 are when 1249 gene sets from AUC range 0.45-0.55 are used.
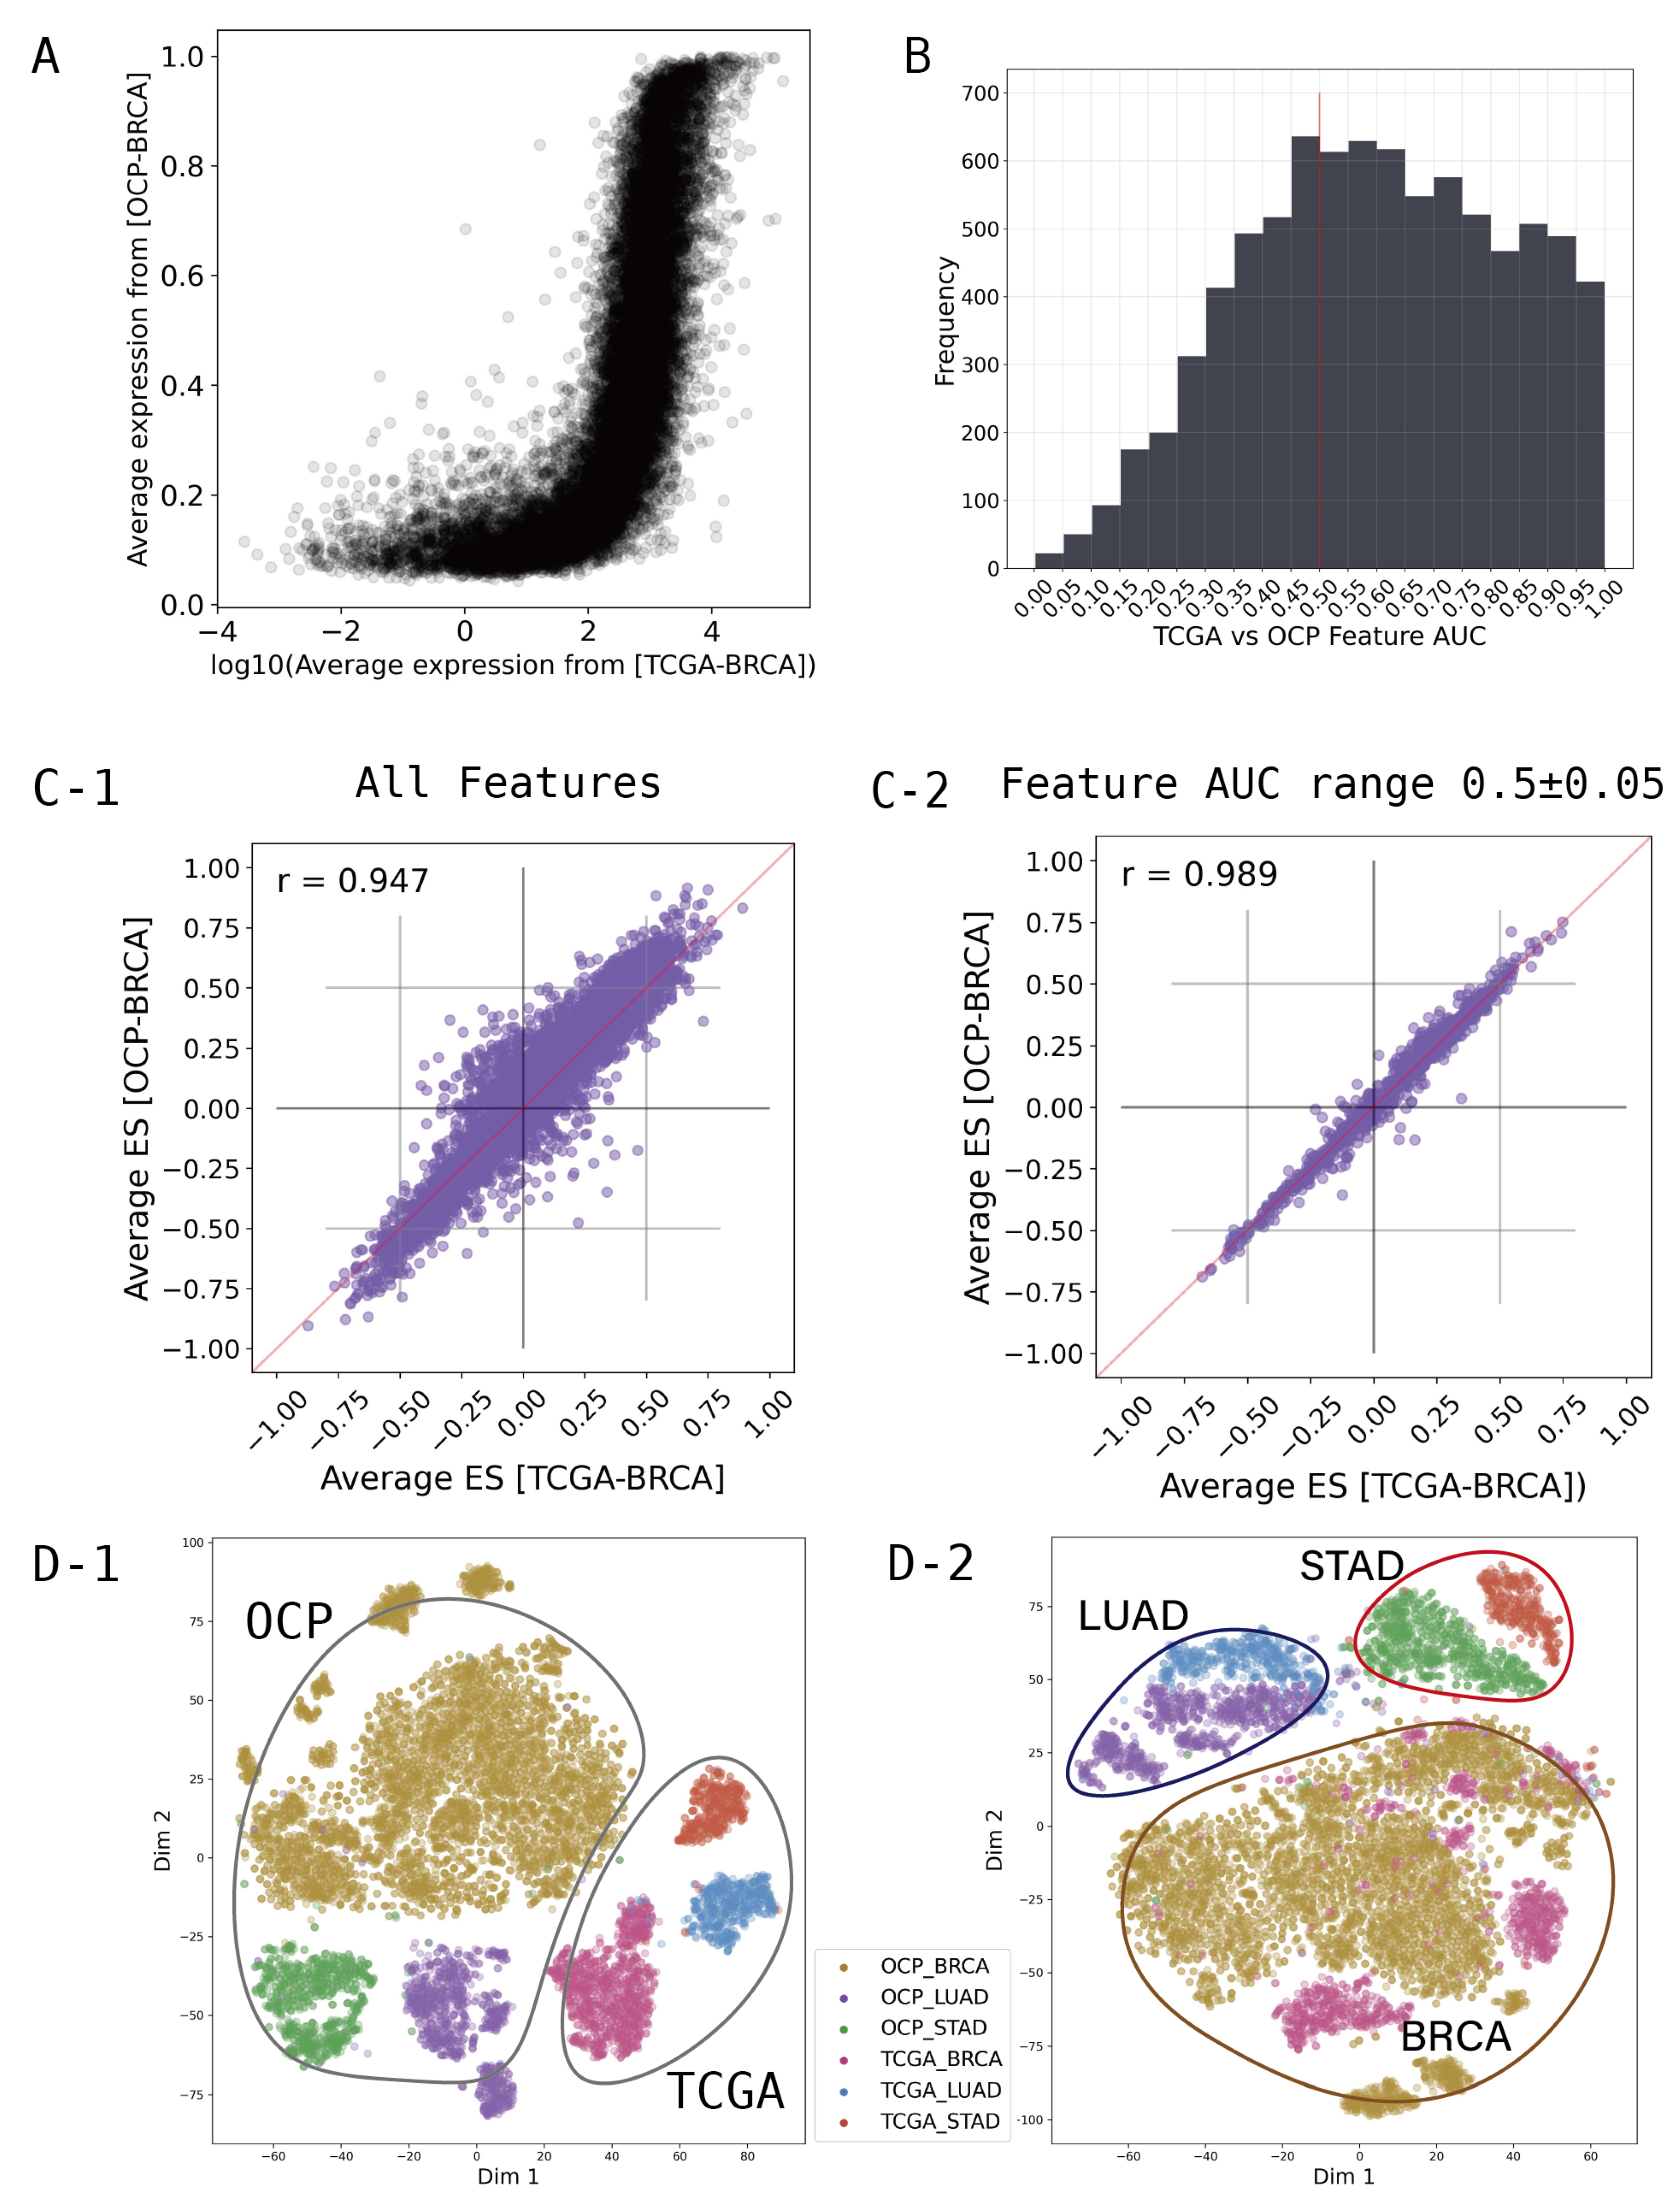
Figure 3.
(A) TCGA vs OCP cross validation. (B) Accuracy of external validation by feature selection groups. (C) Confusion matrix of external validation for KBSMC and GEO data. (D) Confusion matrix of external validation for only KBSMC data.
Figure 3.
(A) TCGA vs OCP cross validation. (B) Accuracy of external validation by feature selection groups. (C) Confusion matrix of external validation for KBSMC and GEO data. (D) Confusion matrix of external validation for only KBSMC data.
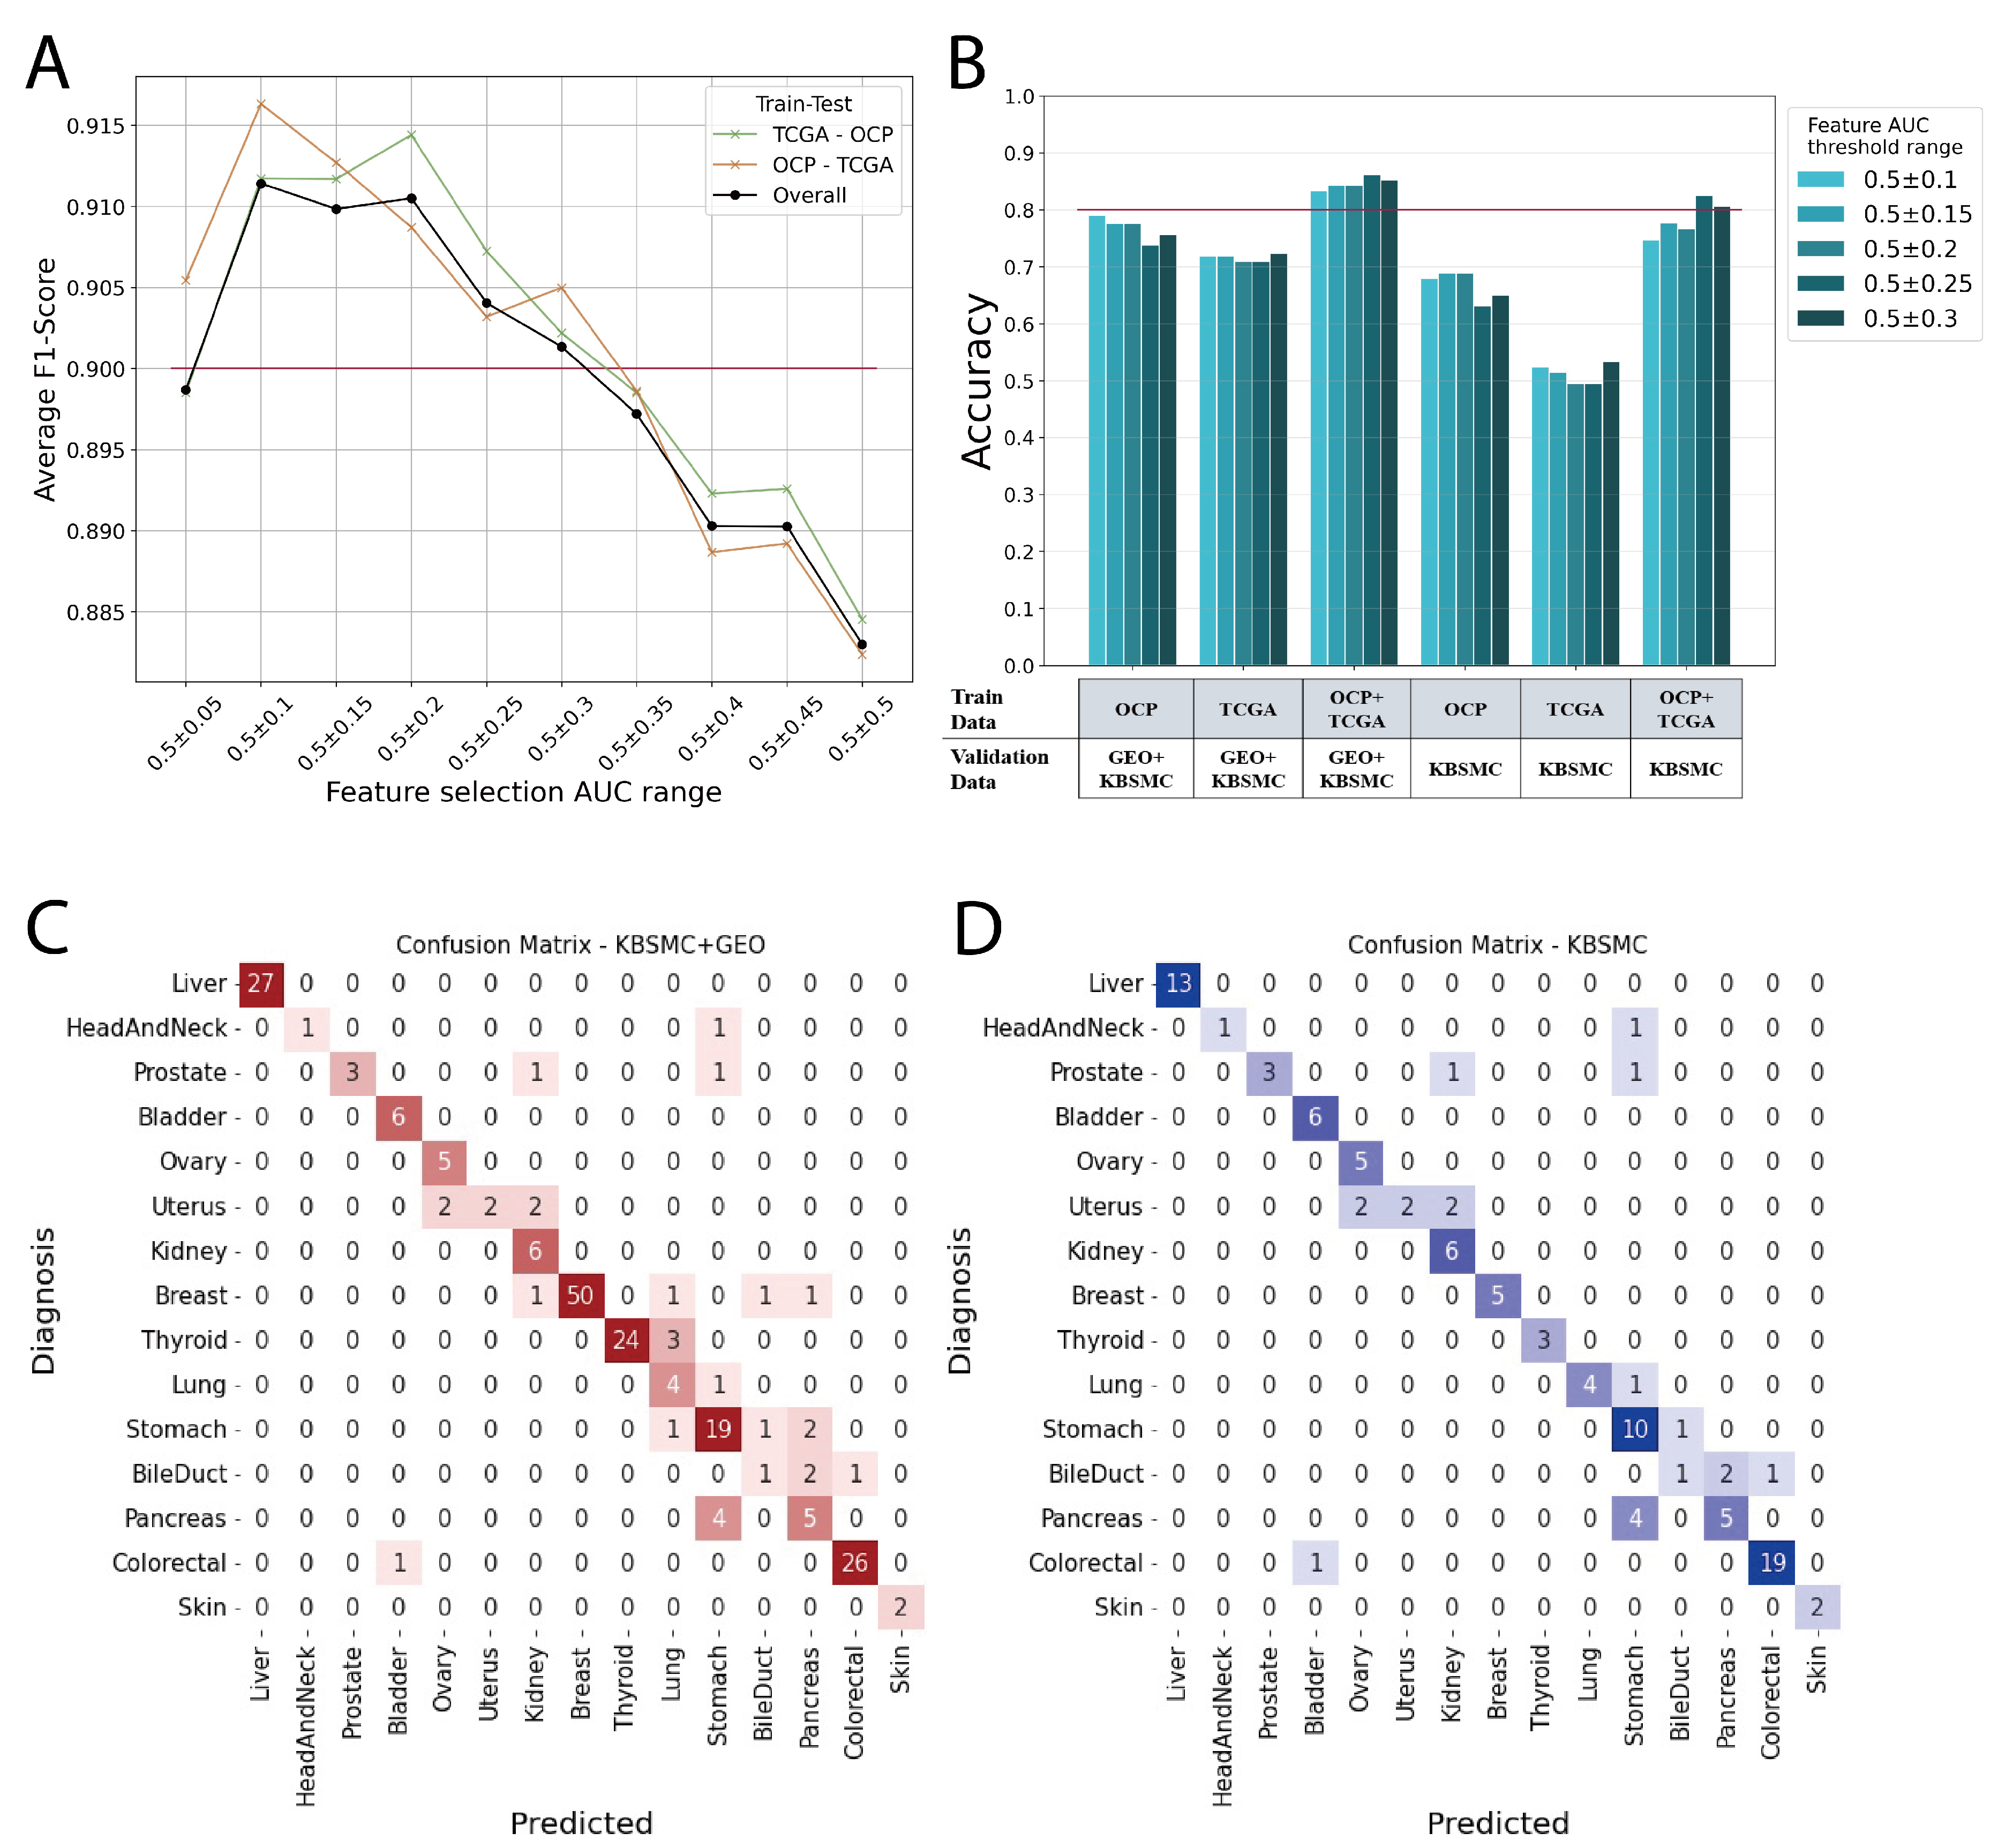

Table 1.
Train Data Sets
| Cancer Type | Data Source | Sample No. |
|---|---|---|
| Adrenal Gland | OCP | 311 |
| TCGA | 261 | |
| Bile Duct | OCP | 184 |
| TCGA | 36 | |
| Bladder | OCP | 310 |
| TCGA | 408 | |
| Brain | OCP | 3,054 |
| TCGA | 696 | |
| Breast | OCP | 5,543 |
| TCGA | 1,093 | |
| Colorectal | OCP | 3,074 |
| TCGA | 381 | |
| Head And Neck | OCP | 622 |
| TCGA | 520 | |
| Kidney | OCP | 356 |
| TCGA | 891 | |
| Liver | OCP | 413 |
| TCGA | 373 | |
| Lung | OCP | 2,243 |
| TCGA | 1,018 | |
| Ovary | OCP | 1,143 |
| TCGA | 307 | |
| Pancreas | OCP | 207 |
| TCGA | 178 | |
| Prostate | OCP | 247 |
| TCGA | 497 | |
| Skin | OCP | 294 |
| TCGA | 103 | |
| Stomach | OCP | 920 |
| TCGA | 599 | |
| Thyroid | OCP | 298 |
| TCGA | 501 | |
| Uterus | OCP | 322 |
| TCGA | 538 | |
| Total | OCP | 19,541 |
| TCGA | 8,400 | |
| OCP+TCGA | 27,941 |
Table 2.
Validation Data Sets
| Cancer | Data Source | Sample No. |
|---|---|---|
| Bile Duct | KBSMC | 4 |
| Bladder | KBSMC | 6 |
| Breast | GSE14017 | 29 |
| GSE147995 | 13 | |
| GSE191230 | 7 | |
| KBSMC | 5 | |
| Colorectal | KBSMC | 20 |
| GSE40367 | 7 | |
| Head And Neck | KBSMC | 2 |
| Kidney | KBSMC | 6 |
| Liver | GSE40367 | 15 |
| KBSMC | 13 | |
| Lung | KBSMC | 5 |
| Ovary | KBSMC | 5 |
| Pancreas | KBSMC | 10 |
| Prostate | KBSMC | 5 |
| Skin | KBSMC | 2 |
| Stomach | KBSMC | 11 |
| GSE246963 | 8 | |
| GSE191139 | 4 | |
| Thyroid | GSE60542 | 24 |
| KBSMC | 3 | |
| Uterus | KBSMC | 6 |
| Total | KBSMC | 103 |
| GEO | 107 | |
| Total | 210 |
Table 3.
Validation Results
| Training data | Test data | Feature AUC range 0.5 ± | Weighted Accuracy |
|---|---|---|---|
| OCP+TCGA | GEO+KBSMC | 0.25 | 0.862 |
| OCP+TCGA | GEO+KBSMC | 0.3 | 0.852 |
| OCP+TCGA | GEO+KBSMC | 0.15 | 0.843 |
| OCP+TCGA | GEO+KBSMC | 0.2 | 0.843 |
| OCP+TCGA | GEO+KBSMC | 0.1 | 0.833 |
| OCP+TCGA | KBSMC | 0.25 | 0.825 |
| OCP+TCGA | KBSMC | 0.3 | 0.806 |
| OCP | GEO+KBSMC | 0.1 | 0.79 |
| OCP+TCGA | KBSMC | 0.15 | 0.777 |
| OCP | GEO+KBSMC | 0.2 | 0.776 |
| OCP | GEO+KBSMC | 0.15 | 0.776 |
| OCP+TCGA | KBSMC | 0.2 | 0.767 |
| OCP | GEO+KBSMC | 0.3 | 0.757 |
| OCP+TCGA | KBSMC | 0.1 | 0.748 |
| OCP | GEO+KBSMC | 0.25 | 0.738 |
| TCGA | GEO+KBSMC | 0.3 | 0.724 |
| TCGA | GEO+KBSMC | 0.15 | 0.719 |
| TCGA | GEO+KBSMC | 0.1 | 0.719 |
| TCGA | GEO+KBSMC | 0.2 | 0.71 |
| TCGA | GEO+KBSMC | 0.25 | 0.71 |
| OCP | KBSMC | 0.15 | 0.689 |
| OCP | KBSMC | 0.2 | 0.689 |
| OCP | KBSMC | 0.1 | 0.68 |
| OCP | KBSMC | 0.3 | 0.65 |
| OCP | KBSMC | 0.25 | 0.631 |
| TCGA | KBSMC | 0.3 | 0.534 |
| TCGA | KBSMC | 0.1 | 0.524 |
| TCGA | KBSMC | 0.15 | 0.515 |
| TCGA | KBSMC | 0.25 | 0.495 |
| TCGA | KBSMC | 0.2 | 0.495 |
Table 4.
Top-2 Accuracy
| Cancer Type | Top-2 Accuracy for GEO+KBSMC validation |
|---|---|
| BileDuct | 0.250 |
| Bladder | 1.000 |
| Breast | 0.926 |
| Colorectal | 0.963 |
| HeadAndNeck | 0.500 |
| Kidney | 1.000 |
| Liver | 0.964 |
| Lung | 0.800 |
| Ovary | 1.000 |
| Pancreas | 0.900 |
| Prostate | 0.800 |
| Skin | 1.000 |
| Stomach | 0.870 |
| Thyroid | 0.889 |
| Uterus | 0.667 |
| Weighted Average | 0.900 |
Disclaimer/Publisher’s Note: The statements, opinions and data contained in all publications are solely those of the individual author(s) and contributor(s) and not of MDPI and/or the editor(s). MDPI and/or the editor(s) disclaim responsibility for any injury to people or property resulting from any ideas, methods, instructions or products referred to in the content. |
© 2024 by the authors. Licensee MDPI, Basel, Switzerland. This article is an open access article distributed under the terms and conditions of the Creative Commons Attribution (CC BY) license (http://creativecommons.org/licenses/by/4.0/).
Copyright: This open access article is published under a Creative Commons CC BY 4.0 license, which permit the free download, distribution, and reuse, provided that the author and preprint are cited in any reuse.


