Submitted:
27 May 2024
Posted:
29 May 2024
You are already at the latest version
Abstract
The amino acid proline accumulates in plants during abiotic stresses such as drought and salinity and is considered a reliable marker of environmental stress. While its accumulation is well established, its precise role in stress tolerance and its underlying molecular mechanism remain less clear. To address these issues, we performed a meta-analysis - a robust statistical technique that synthesizes results from multiple independent studies while accounting for experimental differences. We focused on 16 physiological and morphological parameters affected by drought and salt stress in transgenic plants expressing proline metabolic genes. For each parameter, we calculated the effect size as the response ratio (RR), which represents the logarithm of the mean value in the transgenic group over the mean value of the control group (lnRR). Under stress, most parameters exhibited significantly higher response ratios in the transgenic group, confirming the beneficial effects of proline during drought and salt stress. Surprisingly, under non-stressed conditions, most stress markers showed no significant differences between transgenic and non-transgenic plants, despite elevated proline levels in the former. These results suggest that the benefits of proline may be related to proline catabolism or may only become apparent during stress, possibly due to interactions with reactive oxygen species (ROS), which accumulate predominantly under stress conditions.
Keywords:
proline metabolism genes
; drought tolerance
; salinity tolerance
; transgenic plants
; meta-analysis
1. Introduction
Because of global warming and its associated rapid and extreme climatic changes, the development of drought- or salt-tolerant crops has become a major objective of plant scientists worldwide. Proline accumulation upon environmental stress, especially drought and salt stress, is one of the most widespread responses among plant species suggesting that proline may contribute to drought and salinity tolerance [1,2]. Accordingly, several transgenic plants for proline metabolism genes have been generated over the last decades to increase plant tolerance to abiotic stresses by increasing their proline levels. In higher plants proline metabolism uses short pathways that are easily modified by genetic engineering. Proline synthesis takes place in the cytosol and can start from either glutamate or ornithine, which are reduced to -pyrroline-5-carboxylate (P5C) by 1-pyrroline-5-carboxylate synthetase (P5CS) and ornithine aminotransferase (OAT), respectively. P5C spontaneously cyclizes to glutamate-5- semialdehyde (GSA), which is further reduced to proline by -pyrroline-5-carboxylate reductase (P5CR). Proline catabolism occurs in the mitocondrium where proline is oxidized back to GSA and glutamate by the sequential action of proline dehydrogenase (ProDH) and -pyrroline-5-carboxylate dehydrogenase (P5CDH) [3,4]. Several studies have demonstrated that transgenic plants engineered with proline synthesis genes exhibit increased proline production performing better than non-transgenic controls under a range of different environmental stresses [1]. However, while most of the studies share the conclusion that proline is a reliable marker of stress, its role in stress tolerance, and the underlying mechanisms of proline’s protective effects remain controversial. Some authors argue that proline’s accumulation may simply be a byproduct of the plant’s stress response mechanisms, rather than an active contributor to tolerance [5,6,7]. Another controversial topic about proline biology is around the mechanism responsible for stress tolerance. Due to its properties as a compatible osmolyte, capable of accumulating in cells without damaging cellular metabolism, the protective role of proline against water stress was thought to depended on the intracellular increase in osmotic pressure. However, while this mechanism can hold in some cases, many other functions attributed to proline, such as kosmotropic agent, redox buffer, ROS scavenger, and signaling molecule [3], could also explain the positive effects of proline on water stress, leaving the question of proline’s mechanism of action unresolved. Similarly, the question whether proline or its metabolism is involved in stress tolerance remains an open problem [3,6,8]. Last but not least, it is unclear the trade-off between stress resistance and productivity. Different plant species transgenic for proline metabolic genes are described in the literature with increased levels of proline and improved stress tolerance. However, the interplay between proline metabolism and plant productivity under both stress and non-stress conditions is not well understood, leaving open questions about the practical implications of proline metabolic gene alteration in crops [9]. In light of these uncertainties, we adopted a meta-analytical approach to integrate results from multiple studies and quantitatively evaluate the effect of proline on drought and salinity tolerance in plants. Through this robust statistical analysis, we measured the effects of proline overexpression on 16 physiological and morphological parameters, to clarify the role of proline in enhancing stress tolerance.
2. Results
2.1. Summary Effects
The natural logs of the means of transgenic plants for proline metabolism genes over those of non-transgenic plants () are shown in the forest plots of Figure 1 and Figure 2 for 16 morphological and physiological factors under stressed (Figure 1) and non-stressed (Figure 2) conditions, respectively. The physiological factors have been chosen because they are affected by drought and salt stress and represent reliable indicators of stress tolerance. Values of greater than 0 indicate that the transgenic plants for proline metabolism genes have a positive effect on stress tolerance, while negative values indicate an adverse effect. In the case of MDA and Rec, however, negative values indicate a positive effect and positive values indicate a negative outcome. Our meta-analysis covers 199 studies from 47 papers (File S1) and includes 100 dicots and 99 monocot species belonging to 7 families (Brassicaceae, Convolvulaceae, Poaceae, Solanaceae, Fabaceae, Rosaceae, and Rutaceae). Tobacco (Nicotiana tabacum, and Nicotiana plumbaginifolia), belonging to the Solanaceae family, was the most represented dicot (54 studies), and rice (Oryza sativa), belonging to the Poaceae family, was the most represented monocot (44 studies). The CaMV35S was the most used promoter (133 studies), and P5CS was the most represented donor gene (121 studies). As shown in Figure 1, under stress conditions, most of the parameters (13 out of 16) showed a response ratio significantly higher in the transgenic group than in non-transgenic one, and another parameter, MDA, was significantly lower in transgenic plants. Overall, 14 out of 16 parameters were indicative of a positive effect of proline on drought and salt stress tolerance, and only two effect sizes (SOD, and Rec) were not significant. Under non-stressed conditions, in contrast (Figure 2), nearly all the parameters showed no differences between transgenic and non-transgenic plants (13 out of 16), with the notable exception of proline, and root length, which showed significantly increments of 64%, and 11%, respectively, and of catalase activity, which showed a non-significant increment of 15%. The parameters with the most significative effect sizes ( p < 0.001) under stress conditions were proline content, plant height, seed weight, chlorophyll content, root length, peroxidase activity, malondialdehyde activity, relative electrical conductivity, and plant survival. Among these, the ones with the largest difference between transgenic and non-transgenic plants were plant survival, proline content, root weight, and root length, with values 139%, 94%, 80%, and 56% higher in transgenic than in non-transgenic plants. Four parameters (plant weight, CAT, APX, and RWC ) were significant with a p-value less than 0.1, and a parameter (stomatal aperture) was significative with p<0.05. For ease of interpretation, in the last column of Tables 1 and 2 we reported the fold variations under stress (Table 1) and non-stress (Table 2) conditions, respectively, in exponentiated form.
2.2. Heterogeneity and Moderation Analysis under Drought and Salinity Stress
The effect sizes for parameters under stress conditions (Table 1) show highly significant Q statistic p-values (p < 0.001), indicating heterogeneity primarily due to study differences, as evidenced by the statistics. Therefore, we performed a moderation analysis to investigate the causes of this heterogeneity and identify potential moderators capable of influencing the effect sizes. Because of the relatively small number of studies of our meta-analysis, we used the method of Hunter and Schmidt [10] to calculate and estimate the amount of heterogeneity. This method is often used in meta-analysis with small number of studies because does not assume a specific distribution for the effect sizes, and is more sensitive to heterogeneity. The default REML method used by metafor, on the contrary, is based on large sample theory under the assumption that the parameter estimates are asymptotically normally distributed and can be biased by incorrect asymptotic approximations, especially when the sample size is small. Furthermore, to increase the robustness of our analysis, we also performed a permutation test [11]. This test randomly rearranges the rows of the model matrix to evaluate all possible intercepts and compares the resulting p-value against the distribution of possible p-values.
2.3. Detailed Moderation Effect Analysis
Following our investigation into the heterogeneity of effect sizes under drought and salinity stress, we now present a detailed moderation effect analysis for each of the 16 parameters studied.
Proline: Transgenic plants with proline metabolism genes consistently produced more proline than non-transgenic controls (Figure 2). The type of promoter and the recipient species, however, significantly influenced proline accumulation, explaining 29.31% and 26.26% of the total heterogeneity, respectively. This was confirmed by a significant omnibus test for moderation (*** for promoter and * for recipient species) and permutation tests (Table S3.1 and Figure S1).
Plant Height: All moderators, except treatment, impacted plant height to some degree, with soil cultivation having the most positive effect (Table S3.2 and Figure S2). Conversely, seed number was unaffected by any moderator except treatment, which accounted for 85.34% of the total variability (QM p-value = 0.0008) (Table S3.3 and Figure S3).
Seed Weight and Chlorophyll: Seed weight was influenced by all moderators, with treatment being a consistent factor (Table S3.4 and Figure S4). Chlorophyll content was significantly modulated by the donor gene type ( = 48.75%; QM p-value < .0001; permutation test=*) and treatment type ( = 57.81%; QM p-value = 0.0005) (Table S3.5 and Figure S5).
Root Length and Plant Weight: The severity of treatment (mild, moderate, severe) notably affected root length and plant weight, explaining 70.48% and 67.35% of the total heterogeneity, respectively, with significant QM values (0.0011 for root length, which did not pass permutation testing; < .0001 for plant weight) (Table S3.6 and S3.7 and Figure S6 and S7).
Peroxidase (POD), Superoxide dismutase (SOD), Malondialdehyde (MDA), catalase (CAT), and Ascorbate peroxidase (APX): Because of the low number of studies it is difficult to safely assess if and how different moderators can affect the peroxidase activity of transgenic plants, although the type of treatment, particularly if moderate, seems to have a strong effect on POD activity (Table S3.8 and Figure S8). Superoxide dismutase activity was affected by the type of donor gene, the type of recipient species, the medium type and the generation, with the latter exerting the strongest moderation effect explaining 86.64% of total heterogeneity with a highly significant omnibus test for moderation (<.0001) confirmed by the permutation test (Table S3.9 and Figure S9). The activity of malondialdehyde (MDA), a lipid peroxidation marker considered a reliable indicator of oxidative stress, was mainly affected by the donor gene, recipient species and to a lesser extent promoter type (Table S3.10 and Figure S10). Intriguingly, the type of treatment showed no effect on MDA activity. Catalase activity, on the contrary, was strongly affected by the type of treatment, as well as by generation and recipient type, but not by the medium nor the donor gene (Table S3.11 and Figure S11). Ascorbate peroxidase (APX) activity appeared mainly moderated by the donor genes, especially by P5CS, by the recipient species, particularly belonging to the Solanaceae family, and, to some extent, by being in the T1 generation (Table S3.12 and Figure S12).
Relative water content (RWC): All moderators, except treatment, affected RWC, particularly the donor gene, which explained 67.41% of the total variability (QM p-value = < .0001, permutation test=**), and the recipient group, which accounted for 67.41% of the total variability (QM p-value = < .0001, permutation test=**)(Table S13 and Figure S13).
Stomatal conductance, Relative electric conductance and Survival: No moderators seem to modulate significantly, either stomatal aperture (Sto) or relative electric conductivity (Rec). However, the low number of studies suggests taking these conclusions with care. Survival, on the contrary, might be influenced by all moderators and particularly by treatment, but the low number of studies renders these conclusions less reliable (Table S13, S15, and S16 and Figure S14, S15, and S16).
2.4. Heterogeneity and Moderation Analysis under Non Stress Conditions
Although under non-stressed conditions the majority of stress markers (14 out of 16) showed comparable responses in transgenic and non-transgenic plants, with the notable exceptions of proline and root length, 12 out of 16 moderators displayed significant between-study heterogeneity justifying a moderation analysis (shown in Table S4 and Figure S2). It is important to note that the results of this analysis should be taken with extreme caution since the number of studies under non-stress conditions is particularly low. As in the case of moderation under stress, the results tend to be moderator and level specific. Overall, generation and, to a lesser extent, medium were the least influential moderators, while promoter and, to a lesser extent, donor gene and recipient species were the most influential moderators (Table S4 and Figure S2).
3. Discussion
Our meta-analysis has investigated the complex interplay between proline metabolism and plant stress tolerance. By analyzing 199 studies across 47 publications with an emphasis on 16 morphological and physiological parameters, we have dissected the impact of genetically modified proline pathways in plants. Although the use of transgenic plants to increase proline accumulation has been largely superseded by less problematic, non-transgenic techniques, such as precision breeding, TILLING or gene editing [12], the results of these works represent a rich source of information that deserves to be meta-analyzed to improve our knowledge on the role of proline in stress resistance, and unveil its underlying mechanism. Under drought and salt stress conditions, the pronounced increment in response ratios for most parameters in transgenic plants compared to non-transgenic ones consolidates the hypothesis that proline confers a protective advantage in stressful environments. Indeed, almost all the physiological and morphological traits chosen as stress markers, including important agronomic traits such as plant survival, seed weight, and root length, exhibited significant enhancements in transgenic plants highlighting the potential of exploiting proline metabolism genes to fortify crops against drought and salinity stresses. Since under non-stressed conditions, the manipulation of proline metabolism does not detrimentally affect plant growth, these results are particularly encouraging and reinforce the strategy of modifying proline pathways to mitigate the effects of drought and salt stress. It is interesting to note that in non-stressful conditions, there are no significant differences between transgenic and non-transgenic plants, at least relative to the parameters analyzed in this work, with the exclusion of proline content and root length. Intriguingly, root length and catalase activity have been reported by Baudin et al (2022) to be modulated by proline metabolism under normal developmental conditions, supporting the role of proline in root development [8]. This indication, however, must be taken with caution because of the small number of studies scrutinized in this meta-analysis in support of this hypothesis. The fact that, despite the high proline levels produced by the transgenic variants, almost all the stress markers exhibited similar values under non-stressed conditions suggests that the protective benefits of proline do not depend on proline synthesis and accumulation within the plant cells but rather on its catabolism. Alternatively, the beneficial effects of proline may manifest primarily under stress conditions because of proline’s capacity to interact with and neutralize reactive oxygen species (ROS), which are known to rise under stressful conditions. This alternative hypothesis is corroborated by the increase (or decrease in the case of MDA) of four ROS scavengers (peroxidase, malondialdehyde, catalase, and ascorbate peroxidase) suggesting a possible interplay between proline accumulation and ROS metabolism, as reported by different authors [12,13,14,15,16]. Surprisingly, the average SOD activity, which catalyzes the quick dismutation of superoxide to hydrogen peroxide, displays similar values both in transgenic and non-transgenic plants suggesting that proline metabolism specifically affects certain ROS detoxification pathways, but not the superoxide dismutation pathway. We cannot rule out, however, the possibility that compensatory mechanisms are activated to maintain stable SOD levels despite the overexpression of proline. With regard to the putative osmoprotective role of proline, the results of this meta-analysis tend to minimize its importance, in agreement with the reports of Bhaskara et al. 2015; Forlani et al. 2019; Kavi Kishor and Sreenivasulu 2014; Ben Rejeb et al. 2014; Sharma et al. 2011; Signorelli 2016 [3,5,6,7,13,17]. Although statistically significant, the effect size of RWC shows a modest decrease of 1%, which seems insufficient to prevent dehydration and sustain drought or salt stress tolerance. Regarding the relationship between stress tolerance and productivity, drawing firm conclusions remains challenging. However, despite the limitations of this research, the data suggests that plants genetically modified to enhance proline metabolism demonstrate increased productivity under stress conditions. In this context, it is crucial to recognise the inherent limitations associated with meta-analytic methods, especially when conducted with a relatively limited number of studies. To mitigate this concern, we implemented the approach developed by Hunter and Schmidt, which was specifically tailored to improve the analysis of small study datasets. However, cautious interpretation of our results remains essential. Another point to take into account is the high heterogeneity, which, as indicated by the Q statistic and the statistic, is largely based on real differences between studies. Although the moderation analysis highlighted the importance of some moderators in specific parameters, it failed to isolate a common pattern, although based on the rigorous permutation test, medium, generation and treatment seem to have more influence than donor gene, recipient species and promoter. In conclusion, our data confirm the positive role of proline metabolism in improving plant tolerance under stress conditions, with no negative effects under non-stress conditions. The latter condition increases the potential of a proline-based strategy to combat drought and salt stress, while suggesting that it is proline metabolism and not proline accumulation that enhances plant tolerance under stress conditions. Based on our data, a model based on interactions between proline and ROS seems possible and even more likely than a model based on the osmolite-compatible properties of proline. In practical terms, however, due to the high levels of true variability , only partially explained by moderators, a case-by-case strategy is suggested for optimizing proline-related interventions, and tailor specific conditions to maximize proline’s positive effects in different plant contexts.
4. Materials and Methods
4.1. Data Collection
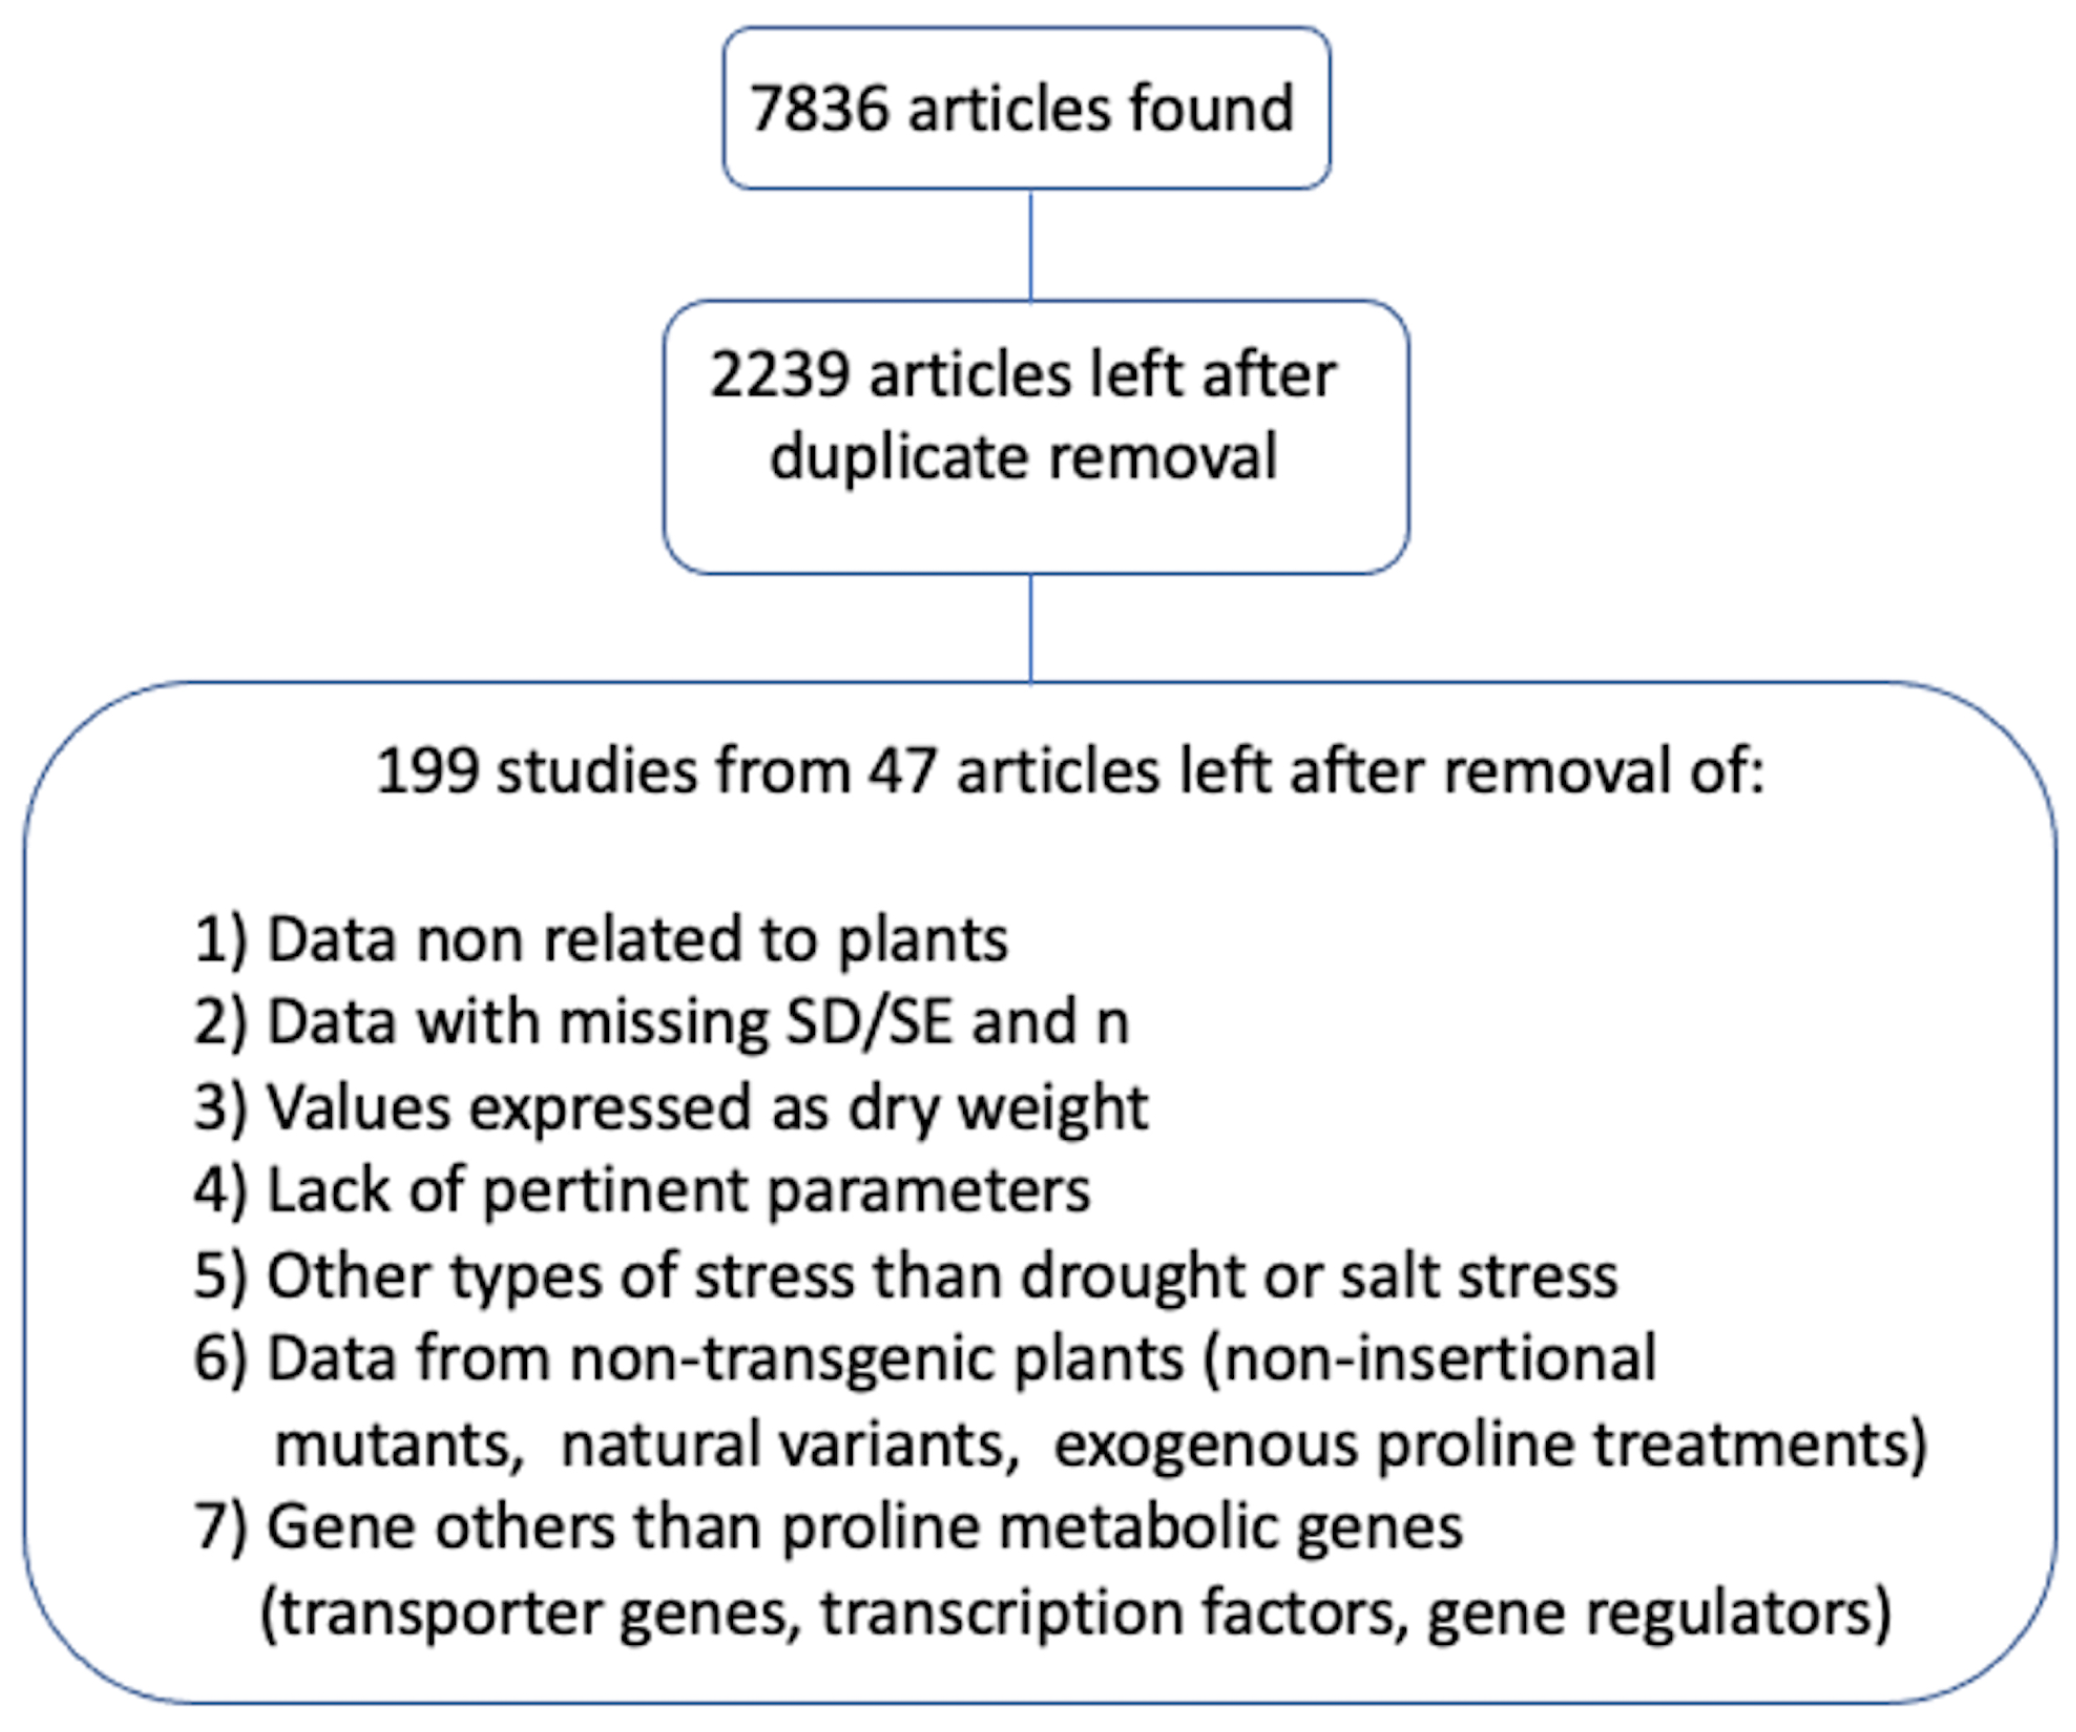
To collect tha data we scrutinized the scientific literature by searching the electronic databases Scopus, PubMed, and Google Scholar for a combination of terms such as "proline", "P5CS*", " *pyrrolyne-5-carboxylate", "P5CR", "ProDH", " Orni-thine-delta-aminotransferase", "OAT", "transgen*", “drought ", “salt “, "salinity", and "plants". To refine the search, we manually analyzed the cited literature to discover relevant documents missed from, or absent in the electronic databases. The search was carried out up to December 2022. The inclusion criteria/exclusion were as following (Figure 3):
- a)
- Only transgenic plants of any plant species, including insertional mutants;
- b)
- Only drought or salinity stress;
- c)
- Only proline metabolic genes (both anabolic and catabolic);
- d)
- No exogenous proline treatments;
- e)
- No mutants or allelic variant;
- f)
- All the measures are expressed as fresh weight.
Overall, we collected a total of 199 studies extracted from 47 articles. Multiple treatments belonging to single articles were treated as independent observations, as commonly used in plant meta-analysis [18,19,20,21]. Furthermore, we calculated effect sizes taking into account non-independent observations with the "robust" function of the "metafor" package [22,23,24] and found no significant differences compared to the effect sizes calculated without correction for the non-independence of the studies. Means, sample sizes, and variances were obtained, whenever possible, from the original studies, otherwise they were extracted from the articles’ figures using the free open-source application ImageJ [25].
Figure 3.
Study selection diagram showing the workflow and the inclusion/exclusion criteria used in this meta-analysis.
Figure 3.
Study selection diagram showing the workflow and the inclusion/exclusion criteria used in this meta-analysis.
4.2. Effect Size and Moderation Analysis
In this study, a meta-analysis was conducted with the R "metafor" package [24] to synthesize the effects of transgenic plants for proline metabolism genes on 16 physiological and morphological parameters regarded as stress markers. We used the natural logarithm of the response ratio () as an effect size, where Rt is the mean of transgenic plants, and Rc is the mean of non-transgenic control plants. The response ratio is frequently used in plant biology because, being a dimensionless measure, can be used across different studies and with different measure units [26,27,28]. Moreover, the natural logarithm of the response ratio allows for symmetrical distribution and ease of interpretation, with values greater than zero indicating a positive effect, values less than zero indicating a negative effect, and a value of zero indicating no effect [29]. It is important to note that, in the case of malondialdehyde activity (MDA) and relative electrical conductivity (Rec), negative values represent positive outcomes and are indicative of stress tolerance. Because of the high levels of heterogeneity due to among-studies variations, we utilized the metafor package to compute the weighted mean effect size across studies using the DerSimonian and Laird random-effects model. All the analyses were conducted using R (version 4.2.3) [30]. To investigate the cause of the among-studies heterogeneity and identify possible modulators of the effect sizes, we carried out a moderation analysis. The moderator variables included in the model were donor (trans)genes, promoter types, family of the recipient species, taxonomic group of the recipient species (dicot or monocot), growth medium, transgene generation, and treatment type. Consistent with the aim of the work, we focused on the effect sizes estimated under stress conditions. To reduce bias and errors caused by a limited number of studies, when possible, we grouped studies into larger groups, for example classifying species into families and grouping treatments into three groups according to severity (mild, moderate and severe).
4.3. Meta-Analysis
The meta-analysis was carried out using the Response Ratio as the outcome measure and fitting the data with a random-effects model. The amount of heterogeneity (i.e., ) was estimated using the Hunter-Schmidt estimator [10,31]. In addition to the estimate of , the Q-test for heterogeneity [32], the statistic [33], and the prediction intervals are reported in Table 1 and Table 2 for stress and non-stress conditions, respectively. To identify potential outliers, we employed a conservative strategy combining Studentized residuals, Cook’s distances and visual inspection of forest plots to ensure the robustness of our findings [34]. In the absence of obvious errors, we decided to remove only the most extreme outliers without recalculating the effect sizes on the modified datasets. Studies with a Studentized residual of 2.5 standard deviations away from the predicted value were considered potential outliers and removed from the dataset. Studies with a Cook’s distance larger than the median plus six times the interquartile range of the Cook’s distances are considered to be potentially influential were also removed. Finally, we visually examined the forest plots to make a further assessment of the distribution and confidence intervals of the error sizes. To correct for possible artifacts and biases that can occur when the number of studies is small, we used the Hunter and Schmidt method [10] to estimate . This method uses an adjusted method to calculate the sample variances of the correlation coefficients, the sample sizes as weights in the analysis, and the Hunter and Schmidt estimator to calculate the amount of heterogeneity [10]. The analysis was carried out using R (version 4.2.3) [30] and the metafor package (version 4.2.3) [24].
Author Contributions
Conceptualization, and methodology, M.T; formal analysis, M.T., and E.B. writing—original draft preparation, M.T.; writing—review and editing, M.T., M.R., and E.B.; figures preparation, M.R. supervision and funding acquisition, M.T. All authors have read and agreed to the published version of the manuscript.
Funding
This work was funded by Sapienza University of Rome.
Data Availability Statement
All the datasets used for this work is in the supplementary data. All R codes used in this paper are available upon request to the corresponding author.
Conflicts of Interest
The authors declare no conflict of interest.
Abbreviations
The following abbreviations are used in this manuscript:
| ROS | Reactive oxygen species |
| P5C | -pyrroline-5-carboxylate |
| P5CS | 1-pyrroline-5-carboxylate synthetase |
| OAT | Ornithine aminotransferase |
| GSA | Glutamate-5-semialdehyde |
| P5CR | -pyrroline-5-carboxylate reductase |
| ProDH | Proline dehydrogenase |
| P5CDH | -pyrroline-5-carboxylate dehydrogenase |
| CaMV35S | Cauliflower Mosaic Virus 35S promoter |
| ACT | ACT constitutive promoter |
| AIPC | ABA inducible promoter complex |
| POD | Peroxidase |
| SOD | Superoxide dismutase |
| CAT | Catalase |
| APX | Ascorbate peroxidase |
| RWC | Relative water content |
| Rec | Relative electric conductivity |
References
- Trovato, M.; Mattioli, R.; Costantino, P. Multiple roles of proline in plant stress tolerance and development. Rendiconti Lincei 2008, 19, 325–346. [Google Scholar] [CrossRef]
- Verbruggen, N.; Hermans, C. Proline accumulation in plants: a review. Amino acids 2008, 35, 753–759. [Google Scholar] [CrossRef] [PubMed]
- Forlani, G.; Trovato, M.; Funck, D.; Signorelli, S. Regulation of proline accumulation and its molecular and physiological functions in stress defence. Osmoprotectant-mediated abiotic stress tolerance in plants: recent advances and future perspectives 2019, pp. 73–97.
- Trovato, M.; Forlani, G.; Signorelli, S.; Funck, D. Proline metabolism and its functions in development and stress tolerance. Osmoprotectant-mediated abiotic stress tolerance in plants: recent advances and future perspectives 2019, pp. 41–72.
- Signorelli, S. The fermentation analogy: a point of view for understanding the intriguing role of proline accumulation in stressed plants. Frontiers in Plant Science 2016, 7, 213126. [Google Scholar] [CrossRef] [PubMed]
- Bhaskara, G.B.; Yang, T.H.; Verslues, P.E. Dynamic proline metabolism: importance and regulation in water limited environments. Frontiers in Plant Science 2015, 6, 147002. [Google Scholar] [CrossRef] [PubMed]
- KAVI KISHOR, P.B.; Sreenivasulu, N. Is proline accumulation per se correlated with stress tolerance or is proline homeostasis a more critical issue? Plant, cell & environment 2014, 37, 300–311. [Google Scholar]
- Bauduin, S.; Latini, M.; Belleggia, I.; Migliore, M.; Biancucci, M.; Mattioli, R.; Francioso, A.; Mosca, L.; Funck, D.; Trovato, M. Interplay between proline metabolism and ROS in the fine tuning of root-meristem size in arabidopsis. Plants 2022, 11, 1512. [Google Scholar] [CrossRef]
- Mattioli, R.; Palombi, N.; Funck, D.; Trovato, M. Proline accumulation in pollen grains as potential target for improved yield stability under salt stress. Frontiers in plant science 2020, 11, 582877. [Google Scholar] [CrossRef]
- Hunter, J.E.; Schmidt, F.L. Methods of meta-analysis: Correcting error and bias in research findings; Sage, 2004.
- Higgins, J.P.; Thompson, S.G. Controlling the risk of spurious findings from meta-regression. Statistics in medicine 2004, 23, 1663–1682. [Google Scholar] [CrossRef]
- Trovato, M.; Brini, F.; Mseddi, K.; Rhizopoulou, S.; Jones, M.A. A holistic and sustainable approach linked to drought tolerance of Mediterranean crops. Frontiers in Plant Science 2023, 14, 1167376. [Google Scholar] [CrossRef]
- Rejeb, K.B.; Abdelly, C.; Savouré, A. How reactive oxygen species and proline face stress together. Plant Physiology and Biochemistry 2014, 80, 278–284. [Google Scholar] [CrossRef]
- Alia.; Mohanty, P.; Matysik, J. Effect of proline on the production of singlet oxygen. Amino acids 2001, 21, 195–200. [CrossRef] [PubMed]
- Smirnoff, N.; Cumbes, Q.J. Hydroxyl radical scavenging activity of compatible solutes. Phytochemistry 1989, 28, 1057–1060. [Google Scholar] [CrossRef]
- Fabro, G.; Kovács, I.; Pavet, V.; Szabados, L.; Alvarez, M.E. Proline accumulation and AtP5CS2 gene activation are induced by plant-pathogen incompatible interactions in Arabidopsis. Molecular Plant-Microbe Interactions 2004, 17, 343–350. [Google Scholar] [CrossRef] [PubMed]
- Sharma, S.; Villamor, J.G.; Verslues, P.E. Essential role of tissue-specific proline synthesis and catabolism in growth and redox balance at low water potential. Plant physiology 2011, 157, 292–304. [Google Scholar] [CrossRef]
- Klümper, W.; Qaim, M. A meta-analysis of the impacts of genetically modified crops. PloS one 2014, 9, e111629. [Google Scholar] [CrossRef] [PubMed]
- Lehmann, A.; Veresoglou, S.D.; Leifheit, E.F.; Rillig, M.C. Arbuscular mycorrhizal influence on zinc nutrition in crop plants–a meta-analysis. Soil Biology and Biochemistry 2014, 69, 123–131. [Google Scholar] [CrossRef]
- Lehmann, A.; Rillig, M.C. Understanding mechanisms of soil biota involvement in soil aggregation: A way forward with saprobic fungi? Soil Biology and Biochemistry 2015, 88, 298–302. [Google Scholar] [CrossRef]
- Wujeska, A.; Bossinger, G.; Tausz, M. Responses of foliar antioxidative and photoprotective defence systems of trees to drought: a meta-analysis. Tree physiology 2013, 33, 1018–1029. [Google Scholar] [CrossRef] [PubMed]
- White, H. A heteroskedasticity-consistent covariance matrix estimator and a direct test for heteroskedasticity. Econometrica: journal of the Econometric Society 1980, pp. 817–838.
- Williams, R.L. A note on robust variance estimation for cluster-correlated data. Biometrics 2000, 56, 645–646. [Google Scholar] [CrossRef]
- Viechtbauer, W. Conducting meta-analyses in R with the metafor package. Journal of statistical software 2010, 36, 1–48. [Google Scholar] [CrossRef]
- Schneider, C.A.; Rasband, W.S.; Eliceiri, K.W. NIH Image to ImageJ: 25 years of image analysis. Nature methods 2012, 9, 671–675. [Google Scholar] [CrossRef] [PubMed]
- Han, Z.; Shang, X.; Shao, L.; Wang, Y.; Zhu, X.; Fang, W.; Ma, Y. Meta-analysis of the effect of expression of MYB transcription factor genes on abiotic stress. PeerJ 2021, 9, e11268. [Google Scholar] [CrossRef] [PubMed]
- Guo, Y.; Ping, W.; Chen, J.; Zhu, L.; Zhao, Y.; Guo, J.; Huang, Y. Meta-analysis of the effects of overexpression of WRKY transcription factors on plant responses to drought stress. BMC genetics 2019, 20, 1–14. [Google Scholar] [CrossRef]
- Dong, C.; Ma, Y.; Zheng, D.; Wisniewski, M.; Cheng, Z.M. Meta-analysis of the effect of overexpression of dehydration-responsive element binding family genes on temperature stress tolerance and related responses. Frontiers in Plant Science 2018, 9, 365405. [Google Scholar] [CrossRef]
- Hedges, L.V.; Gurevitch, J.; Curtis, P.S. The meta-analysis of response ratios in experimental ecology. Ecology 1999, 80, 1150–1156. [Google Scholar] [CrossRef]
- R Core Team. R: A Language and Environment for Statistical Computing. R Foundation for Statistical Computing, Vienna, Austria, 2023.
- Viechtbauer, W. Bias and efficiency of meta-analytic variance estimators in the random-effects model. Journal of Educational and Behavioral Statistics 2005, 30, 261–293. [Google Scholar] [CrossRef]
- Cochran, W.G. The combination of estimates from different experiments. Biometrics 1954, 10, 101–129. [Google Scholar] [CrossRef]
- Higgins, J.P.; Thompson, S.G. Quantifying heterogeneity in a meta-analysis. Statistics in medicine 2002, 21, 1539–1558. [Google Scholar] [CrossRef]
- Viechtbauer, W.; Cheung, M.W.L. Outlier and influence diagnostics for meta-analysis. Research synthesis methods 2010, 1, 112–125. [Google Scholar] [CrossRef]
Figure 1.
Forest plot showing the effect size () on several stress-related physiological parameteres of transgenic plants for proline synthesis genes compared to non-transgenic plants under drought and salt stress. POD = Peroxidase activity; SOD = Superoxide dismutase activity; MDA = Malondialdehyde activity; CAT= Catalase activity; APX= Ascorbate peroxidase activity; RWC= Relative water content; Sto= Stomatal conductance; Rec= Relative electric conductivity; Sur= Survival rate.
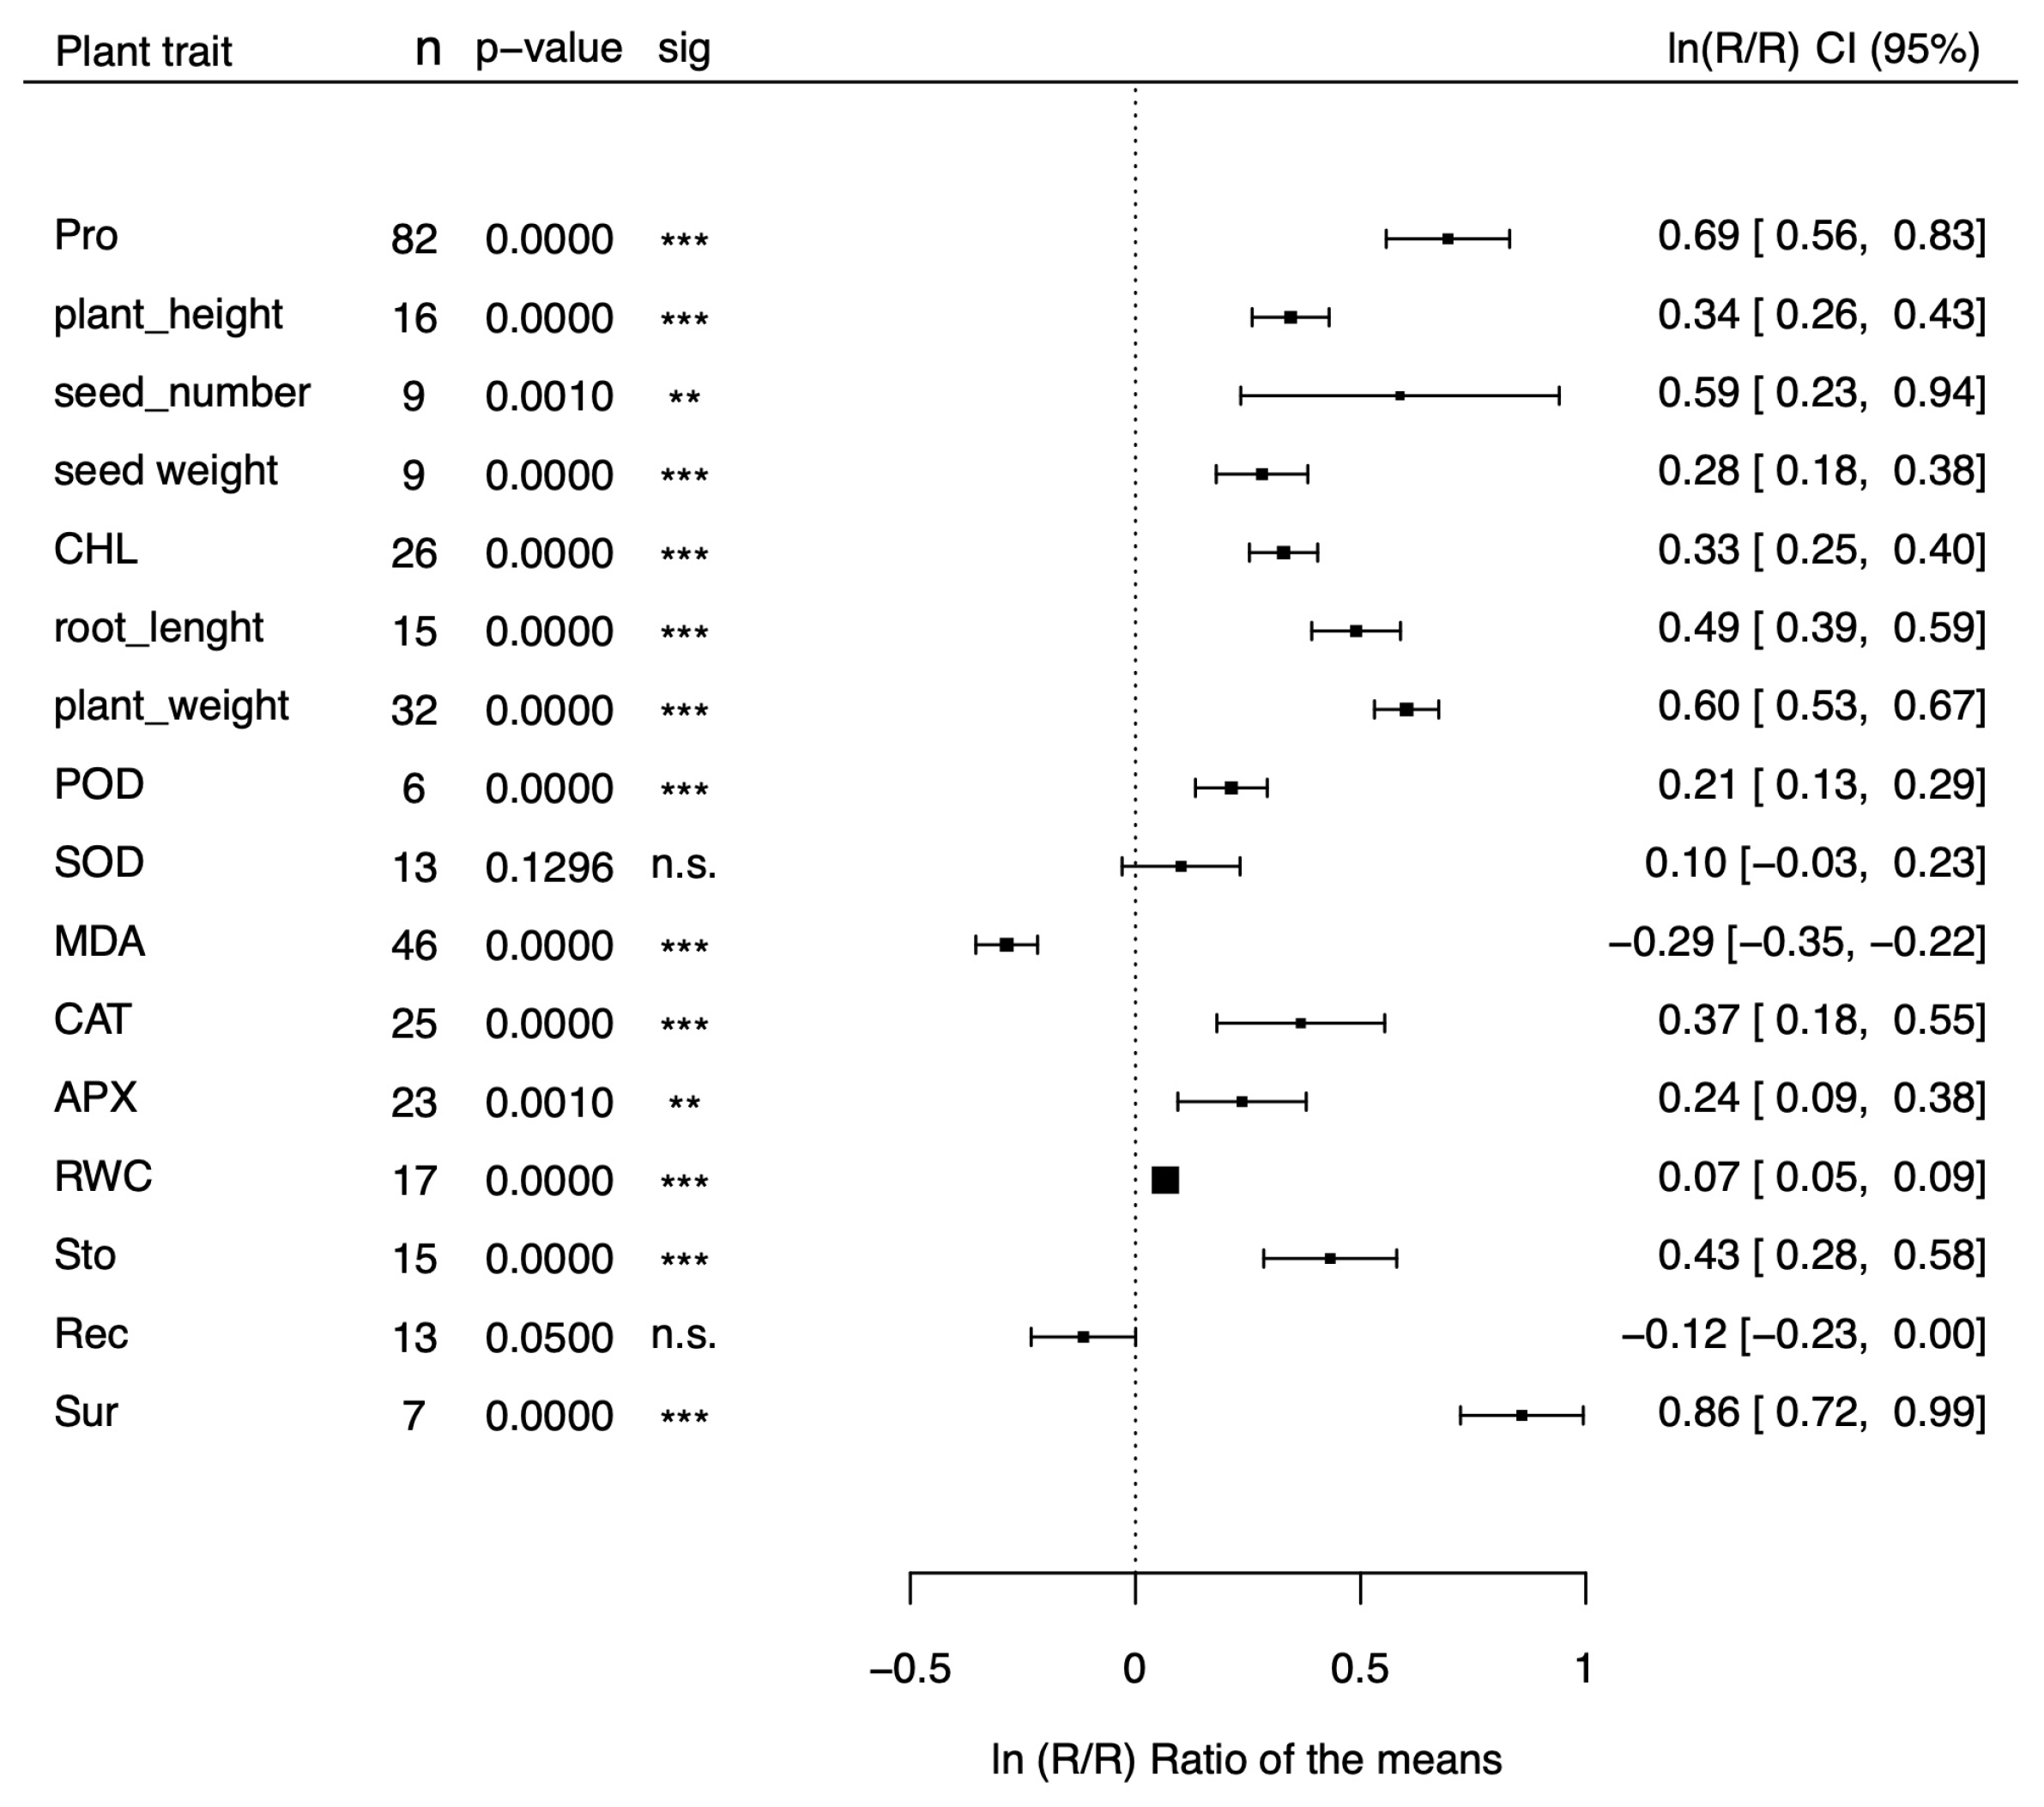
Figure 2.
Forest plot showing the effect size () on several stress-related physiological parameteres of transgenic plants for proline synthesis genes compared to non-transgenic plants under non-stressed conditions. POD = Peroxidase activity; SOD = Superoxide dismutase activity; MDA = Malondialdehyde activity; CAT= Catalase activity; APX= Ascorbate peroxidase activity; RWC= Relative water content; Sto= Stomatal conductance; Rec= Relative electric conductivity; Sur= Survival rate.
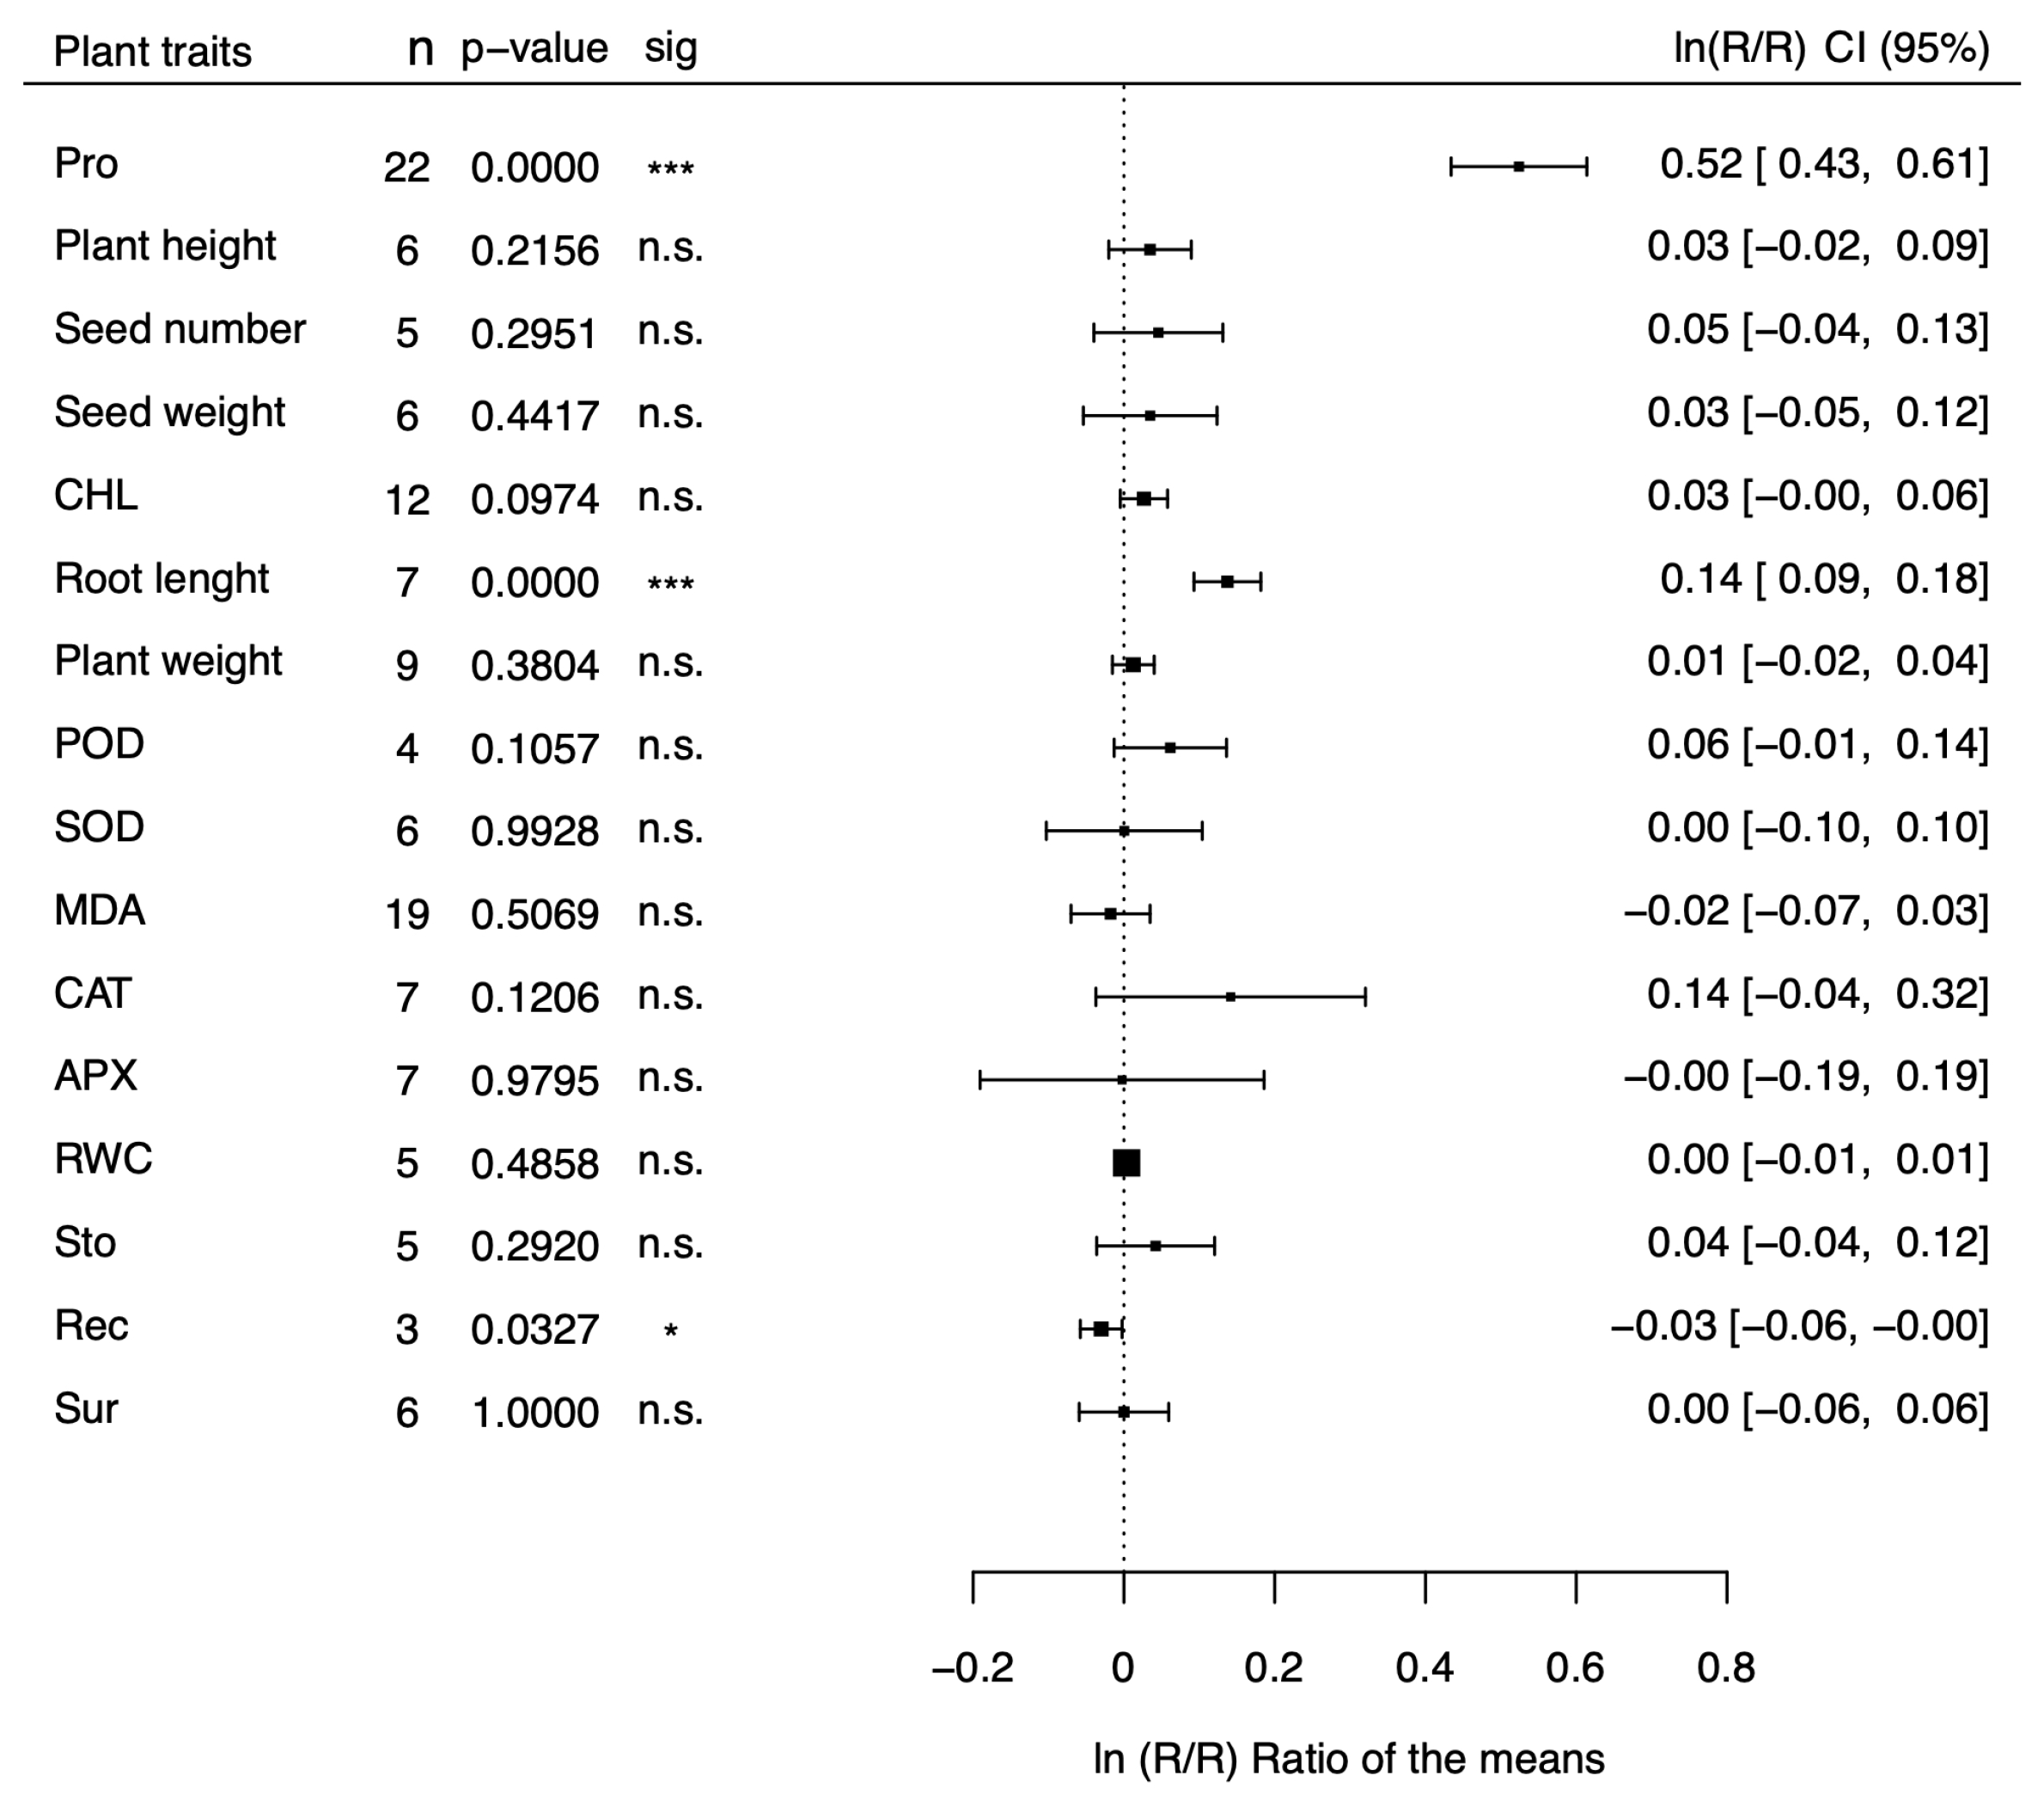

Table 1.
Heterogeneity statistics and fold change under drought and salt stress. POD = Peroxidase activity; SOD = Superoxide dismutase activity; CAT= Catalase activity; APX= Ascorbate peroxidase activity; RWC= Relative water content. Q test= p-value of the Q statistic (which measures heterogeneity) under the null hypothesis that there is no true heterogeneity among the studies. PI= Prediction interval; = Response Ratio effect size; exp= to make the data more intuitive we have exponentiated the effect size with the formula: ; % change = percentage fold change obtained with the formula: (exp-1)* 100.
| Parameter | Q test | PI | Exp | % change | |||
|---|---|---|---|---|---|---|---|
| Proline | 0.3906 | 0.0000 | 99.53% | 0.53 / 1.92 | 0.6939 | 2.00 | 100% |
| Plant height | 0.0234 | 0.0000 | 97.63% | 0.03 / 0.65 | 0.3445 | 1.44 | 44% |
| Seed number | 0.2817 | 0.0000 | 99.33% | 0.60 / 5.40 | 0.5874 | 1.80 | 80% |
| Seed weight | 0.0155 | 0.0000 | 81.21% | 1.02 / 1.73 | 0.2810 | 1.32 | 32% |
| Chlorophyll | 0.0250 | 0.0000 | 83.54% | 1.01 / 1.91 | 0.3289 | 1.39 | 39% |
| Root length | 0.0279 | 0.0000 | 98.74% | 0.15 / 0.83 | 0.4400 | 1.63 | 63% |
| Plant weight | 0.0264 | 0.0000 | 96.37% | 1.32 / 2.53 | 0.6021 | 1.83 | 83% |
| POD activity | 0.0074 | 0.0000 | 92.00% | 1.03 / 1.49 | 0.2129 | 1.24 | 24% |
| SOD activity | 0.0550 | 0.0000 | 98.43% | 0.69 / 1.78 | 0.1013 | 1.11 | 11% |
| MDA activity | 0.0434 | 0.0000 | 92.84% | -0.50 / -1.14 | -0.2860 | 0.75 | -25% |
| CAT activity | 0.2044 | 0.0000 | 96.39% | 0.58 / 3.57 | 0.3671 | 1.44 | 44% |
| APX activity | 0.0909 | 0.0000 | 92.36% | -0.37 / 0.84 | 0.2366 | 1.26 | 26% |
| RWC | 0.0012 | 0.0000 | 83.68% | 1.00 / 1.15 | 0.0665 | 1.07 | 7% |
| Stomatal conductance | 0.0461 | 0.0000 | 81.12% | 0.01 / 0.87 | 0.4325 | 1.54 | 54% |
| Electric conductivity | 0.0365 | 0.0000 | 97.28% | 0.94 / 1.00 | -0.1156 | 0.89 | -11% |
| Survival | 0.0177 | 0.0000 | 74.90% | 1.76 / 3.17 | 0.8582 | 2.36 | 136% |
Table 2.
Heterogeneity statistics and fold change under non stress conditions. POD = Peroxidase activity; SOD = Superoxide dismutase activity; CAT= Catalase activity; APX= Ascorbate peroxidase activity; RWC= Relative water content. Q test= p-value of the Q statistic (which measures heterogeneity) under the null hypothesis that there is no true heterogeneity among the studies. PI= Prediction interval; = Response Ratio effect size; exp= to make the data more intuitive we have exponentiated the effect size with the formula: ; % change = percentage fold change obtained with the formula: (exp-1)* 100.
| Parameter | Q test | PI | Exp | % change | |||
|---|---|---|---|---|---|---|---|
| Proline | 0.0218 | 0.0000 | 71.60% | 1.25 / 2.29 | 0.5241 | 1.64 | 64% |
| Plant height | 0.0027 | 0.0000 | 68.79% | 0.92 / 1.16 | 0.0346 | 1.04 | 4% |
| Seed number | 0.0063 | 0.0000 | 73.94% | 0.88 / 1.25 | 0.0457 | 1.05 | 5% |
| Seed weight | 0.0038 | 0.0343 | 32.26% | 0.89 / 1.20 | 0.0348 | 1.04 | 4% |
| Chlorophyll | 0.0012 | 0.0025 | 54.37% | 0.95 / 1.11 | 0.0265 | 1.03 | 3% |
| Root length | 0.0019 | 0.0000 | 0.68% | 1.09 / 1.12 | 0.1032 | 1.11 | 11% |
| Plant weight | 0.0005 | 0.0000 | 62.94% | 0.96 / 1.07 | 0.0124 | 1.01 | 1% |
| POD activity | 0.0000 | 0.6647 | 0.00% | 0.99 / 1.15 | 0.0615 | 1.06 | 6% |
| SOD activity | 0.0127 | 0.0000 | 83.16% | -0.24 / 0.24 | 0.0005 | 1.00 | 0% |
| MDA activity | 0.0055 | 0.0000 | 80.07% | 0.84 / 1.09 | -0.0468 | 0.95 | -5% |
| CAT activity | 0.0396 | 0.0000 | 74.29% | -0.29 / 0.67 | 0.1416 | 1.15 | 15% |
| APX activity | 0.0434 | 0.0000 | 84.32% | 0.91 / 1.34 | 0.0980 | 1.10 | 10% |
| RWC | 0.0000 | 0.9893 | 0.00% | 0.97 / 1.01 | -0.0060 | 0.99 | -1% |
| Stomatal conductance | 0.0032 | 0.0204 | 48.52% | 0.91 / 1.20 | 0.0421 | 1.04 | 4% |
| Electric conductivity | 0.0000 | 0.9583 | 0.00% | 0.94 / 1.00 | -0.0302 | 0.97 | -3% |
| Survival | 0.0000 | 1.0000 | 0.00% | 0.94 / 1.06 | 0.0000 | 1.00 | 0% |
Disclaimer/Publisher’s Note: The statements, opinions and data contained in all publications are solely those of the individual author(s) and contributor(s) and not of MDPI and/or the editor(s). MDPI and/or the editor(s) disclaim responsibility for any injury to people or property resulting from any ideas, methods, instructions or products referred to in the content. |
© 2024 by the authors. Licensee MDPI, Basel, Switzerland. This article is an open access article distributed under the terms and conditions of the Creative Commons Attribution (CC BY) license (http://creativecommons.org/licenses/by/4.0/).
Copyright: This open access article is published under a Creative Commons CC BY 4.0 license, which permit the free download, distribution, and reuse, provided that the author and preprint are cited in any reuse.


