Submitted:
27 May 2024
Posted:
28 May 2024
You are already at the latest version
Abstract
Air pollution knows no boundaries, which means for a city or a region to attain clean air standards, must not only look at the emission sources within its own administrative boundary, but also at sources in the immediate vicinity and those originating from long-range transport. And there is a limit to how much area can be explored to evaluate, govern, and manage as designated airsheds for cities and larger regions. This paper discusses the need from an official airshed framework for India’s air quality management, urban airsheds designated for India’s 131 non-attainment cities under the national clean air programme, and proposes climatically and geographically appropriate regional airsheds to support long-term planning. Between 28 states, eight union territories, 36 meteorological sub-regional divisions, and six regional meteorological departments, establishing the proposed 15 regional airsheds for integrated and collaborative air quality management across India is a unique opportunity.
Keywords:
India
; NCAP
; Air Quality Management
; Airsheds
; Regional Air Quality
; Urban Air Quality
1. Introduction
How much of a city or a region’s air pollution is locally generated and how much is from long-range transport are important questions for air quality management (AQM). The first step to AQM is setting a non-administrative boundary for the region, followed by a series of analytical works to determine these contributions. This is accomplished via emissions and chemical transport modeling and the results are used to prepare a clean air action plan to address not only the local sources, but also finding ways to coordinate with the long-range contributors to reduce their emissions [1,2]. The area covered within this study boundary is referred to as “airshed” and in general terms a “study domain”.
Khan et al. (2024) [3] reviewed air quality studies conducted across the globe using the airshed concept. While confusing, there is no set definition for how big or small can an airshed be. If an emissions or pollution analysis is conducted for an area, then the boundary of the grids covering that area is the defined airshed. Often its size is determined by the objective of the study. For example: (1) to study how air pollution travels between continents, the airshed was as big as the Pacific Ocean to understand the contributions and the evolution of pollutants originating from Asia and reaching the west coast of North America [4,5]. (2) to study emission intensities and enforce regulations at state(s) level or multiple provincial level, the examples of the establishment of the California Air Resources Board in the United States and Beijing-Tianjin-Hebei region airshed in China, involved as assessment of resource allocations and knowledge sharing mechanisms among multiple stakeholders crossing administrative boundaries [6,7]. (3) to study the impact of local emissions and evaluate the boundary contributions via chemical transport modeling, urban airsheds were defined for 20 Indian cities [8]. (4) Singapore, a country and a city, has to work in a nested airshed environment – a smaller airshed to study the contributions of the local emission sources at great detail and a larger airshed covering the neighboring countries Malaysia and Indonesia, which account for a large portion of Singapore’s pollution during the open fire season [9]. In all the examples, the airshed concept is utilized over varying degrees of spatial, temporal, judicial scales.
While the concept of defining airsheds and conducting air pollution analysis are officially in practice in the United States and the European Union, the concept is still in its nascent stage for the low- and middle- income countries (LMIC) [3]. To date, most of the air quality management studies in LMIC are limited to the administrative boundaries, such as ambient monitoring campaigns [10]. The limitation is primarily because of the difficulty in officially estimating the contribution of pollution from one region to the other and using that information to drive policy dialogues. This stage also involves navigating the blame-game negotiations. This effort is beyond just defining an airshed and requires a centrally coordinated effort to build a reliable emissions inventory at representative spatial and temporal scales and conducting chemical transport modeling in a multi-pollutant environment [1,2,10].
Indian cities continue to top the rankings of the most polluted cities in the world (https://iqair.com). In 2023, more than 80 cities were listed in the top 100 and Delhi is again ranked the most polluted capital city in the world. In 2019, India announced the National Clean Air Programme (NCAP) and designated 131 cities as non-attainment, based on the past records of PM2.5 and PM10 (particulate matter with aerodynamic diameter less than 2.5μm and 10μm respectively) pollution levels [11]. These cities are required to reduce at least 40% of the PM10 pollution by 2026, compared to the averages recorded in 2017. Under NCAP, these cities are required to document pollution trends, emission inventories, and source contributions, and prepare an action plan to target the most contributing sources. One missing component is official designation of the city airshed sizes to address sources inside and in the immediate vicinity and regional airshed sizes to coordinate between the cities, districts, and states to address the long-range contributions.
This paper is an attempt to designate a regional airshed framework for all-India, using examples from other sectors; and to present an analysis of the air quality data for the proposed framework for way forward. The discussions are limited to arriving at a feasible regional airsheds framework for India and do not include any notes on the operational, and legal aspects of such a framework. While the discussion is focused on supporting an Indian audience, the guidelines and the methodologies are equally applicable for other regions.
2. Methods and Materials
The primary objective of designating an airshed is to aid the framework for emissions and pollution management. While the initial calculations are conducted at the administrative boundary scales (for governance purposes), the eventual emissions and pollution modeling will require the air quality managers and the practitioners to set the airshed beyond the administrative boundaries (for source apportionment purposes). In LMIC’s, the final call on the airshed size often depends on the computational and technical capacity of the professional teams. Conversely, the capacity can be scaled to the required levels.
The urban airsheds discussion is based on the material presented in [12] using geographical maps, meteorological records, and emission inventory information for the cities. For regional airsheds, the decision on the size is based on the governance feasibility between the engaging districts, states, and stakeholders. Examples from administrative, power generation and transmission, meteorology, and agricultural sectors are used to arrive at a framework for regional airsheds. All the geospatial information (GIS) databases used are open-access fields, included in the Supplementary Material (SI).
3. Results and Discussion
3.1. Designating Urban Airsheds
Airsheds were designated for 131 cities under NCAP to determine the area with influential emission sources which can immediately effect the urban air quality [12]. Given the proximity of some cities in the densely populated regions of the Indo-Gangetic Plains (IGP), the total number of airsheds was reduced to 104. The two guidelines utilized in defining the urban airsheds are: (1) Airshed must include any of the surroundings that influence the city’s air quality -- large settlements like satellite cities, large point sources like power plants, cement plants, brick kiln clusters, etc. A clear understanding of the city’s geography and the emission strengths (via an inventory) of various sources inside and outside the city limits is necessary. (2) Keeping the airshed size to mathematically manageable number for final emissions and pollution modeling. For urban-scale studies, typical grid-size is 1-km (approximately 0.01º near the Equator) and typical airshed size is 30 x 30 grids for small cities to 80 x 80 grids for big cities, in north-south and east-west directions. It is good practice to set a rounded number of grids to support parallel processing and other state-of-the-art computational configurations.
Airshed examples in Figure 1 are from two small airsheds – Kurnool and Meerut and two large airsheds - Delhi and Indore. Following the guidelines, urban airsheds were determined using the geographical and commercial activity information for the cities. Of the 104 airsheds, 73 contain only one city; 18 contain two cities, and nine contain three cities. Four airsheds – Delhi, Mumbai, Indore, and Chandigarh contain 10, 8, 5, and 5 cities respectively. An additional 33 cities, not on the NCAP list are also part of these 104 airsheds.
For smaller Tier 2 and Tier 3 cities, with no large settlements in the immediate vicinity of the administrative boundary, decision making for an airshed is fast. For both Kurnool (in South India, 15.8°N, 78.0°E) and Meerut (in North India, 29.0°N, 77.7°E) airshed size of 30 x 30 grids was finalized (Figure 1a,b). Any of the contributions from outside these limits can be accounted for via boundary conditions in the chemical transport modeling. Given the proximity of Meerut city to Delhi (80km), a question remains if this should be included in Delhi’s airshed.
For Tier 1 cities, the presence of satellite cities in the immediate vicinity makes it difficult to limit the airshed sizes to their administrative boundaries. Among the 104 designated airsheds, Delhi is the largest with 100 x 100 grids and includes 9 other cities, all with active sharing of transport and commercial amenities (Figure 1c). In this case, increasing the size further north to also include Meerut poses a mathematical and computational problem. Any increase in the number of grids increases the computing and storage needs exponentially, especially for chemical transport modeling at the fine resolutions of 0.01º. A line is drawn to account for any outside perturbations in the boundary conditions. For Meerut, it is expected that the boundary contributions will be higher, compared to an airshed like Kurnool, and this is the case for most of the cities on IGP. Delhi’s case is like Singapore’s case study, which can also use a nested airshed concept with a smaller domain over the extended main city and a larger domain with lower resolution to account for contributions from more satellite cities. This also reduces computational burden and can explored as a solution following validation of the modeling outputs from both the setups.
In the case of Indore (Figure 1d), also a large airshed with 80 x 80 grids, the three cities could be designated as smaller airsheds, especially Indore. However, since the passenger and commercial freight movement activity between the three cities is co-dependent, a combined airshed was finalized.
3.2. Designating Regional Airsheds
The airshed concept in India is not new in sectors other than air quality. For example, watershed and river basin management is a common practice. However, a similar framework was never formalized for air quality management where large regions or a conglomerate of states take joint decisions to manage urban and regional air quality problems. Only in the case of Delhi, the National Capital Region (NCR) exists with its own regional pollution control board to address the air pollution problems of Delhi and its surrounding states (NCR was not formed for managing air pollution). Despite this central effort, most of the management and regulatory decisions were left to the local bodies or the respective state authorities [13,14]. Important to note that unlike an urban airshed where most of the analytical work is conducted at a local scale, for regional airsheds, a centrally coordinated national level analytical works are key for furthering inter-state, inter-regional, and inter-airshed assessments and cooperation.
Examples of airshed like frameworks relevant to the discussion and proposal are the following:
- State administrative boundaries: There are 28 states and 8 union territories (UTs) in India (Figure 2a), covering a total of 755 districts (as of December 2023). The district boundaries are not considered in this discussion as it becomes cumbersome to govern so many airsheds. All the states operate a pollution control board (PCB) and union territories operate a pollution control committee, under a central governing body - the Central Pollution Control Board (CPCB, New Delhi, India). If there is no need to revamp the coordination program, each of the states can be an airshed, capable of monitoring, auditing, and evaluating the air pollution trends and formulating clean air action plans. In this case, the states can prepare individual implementation plans (SIPs) including not only the emission intensities within the state administrative boundary, but also the contributions of the neighboring states. Excluding the (UTs) which are small and can be absorbed into the neighboring states, this framework will result in 28 regional airsheds under the existing governing setup.
- Power load dispatch centers: At the end of FY 2023-24, India’s installed power generation capacity is 440GW and split between fossil and renewables at 55% and 45%, respectively. Data on fuel use, power generation, and power transmission from all the power plants is recorded and uploaded to national power portal (https://npp.gov.in). The data on the transmissions is also maintained at sub-grid and sub-regional level by five load dispatch centers (LDCs) (Figure 2b) – Northern, Northeastern, Eastern, Western, and Southern. This is a good example of seamless regional coordination for data collation from power plants and consumer grids, which is an important barrier for air quality management [10]. However, only five divisions to share the workload across the country, to coordinate big states and large emission producers looks daunting.
- Meteorological sub-regional and regional divisions: This is an ideal framework for air quality management since the sub-regional divisions are based on long-term weather patterns and the system comes with an operational modeling framework for meteorology for all of India, extending to the Indian Subcontinent. The meteorological systems, under the auspices of Indian Meteorological Department (IMD) can be further extended to also include air quality modeling systems at various spatial and temporal scales. The framework includes 36 sub-regional divisions and 6 regional divisions (Figure 2c). A major barrier to this merger is likely the seamless integration of independent departments under two different ministries – PCBs under the Ministry of Environment, Forests, and Climate Change and IMD under the Ministry of Earth Science. like LDCs, only six regional airsheds is a smaller number and 36 is larger than the number of states to coordinate.
- Agro-climatic zones: These zones are based on soil types, rainfall intensity, temperature variations, and ground and rain-fed water availability for agriculture. This is the most ideal framework, in terms of the number of regional airsheds, the size of the individual airsheds, geographical commonality in the airsheds, and weather patterns. More on this is discussed in the following section.
- Other example frameworks include ten biogeographic zones, 20 water basins and 24 land-use categories. The last category is too fragmented to define clear airsheds.
Figure 2.
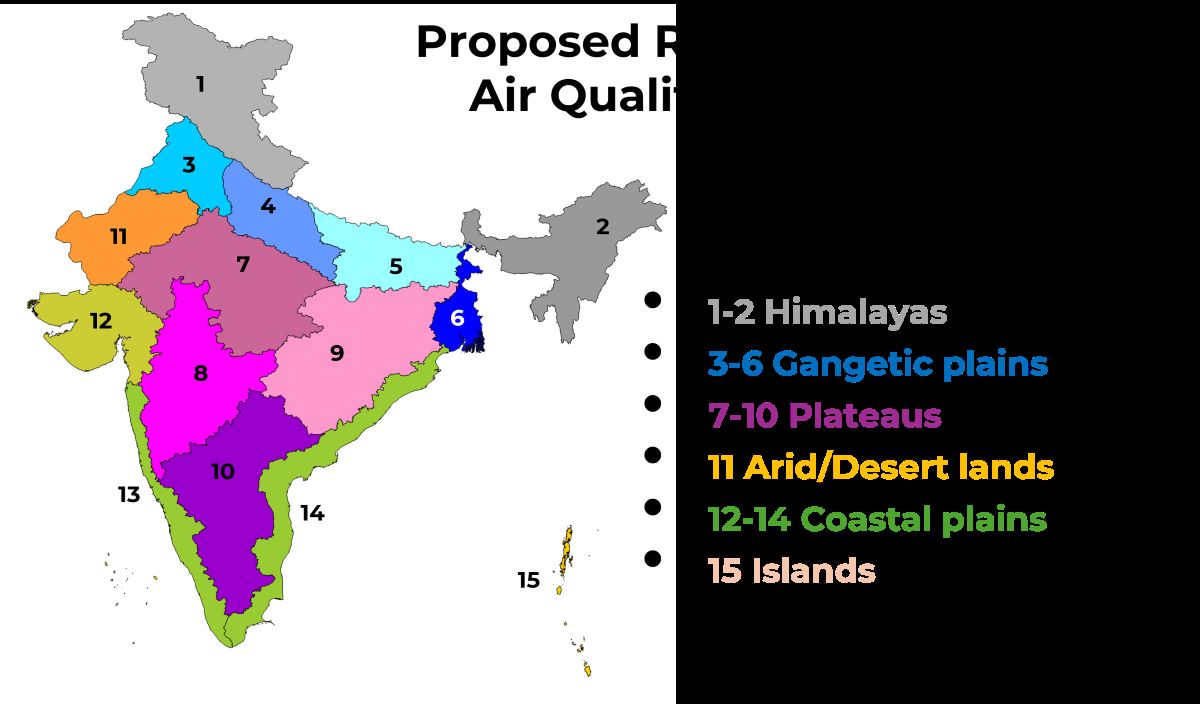
Examples of airshed like operational frameworks from other sectors in India (a) state administrative boundary – 28 pollution control boards (b) power load dispatch centers – 5 regional centers (along with location of the regional headquarters) (c) meteorology data assimilation centers – 36 sub-regional divisions and 6 regional centers (along with location of the regional headquarters) (d) agro-climatic zones – 15 divisions.
Figure 2.
Examples of airshed like operational frameworks from other sectors in India (a) state administrative boundary – 28 pollution control boards (b) power load dispatch centers – 5 regional centers (along with location of the regional headquarters) (c) meteorology data assimilation centers – 36 sub-regional divisions and 6 regional centers (along with location of the regional headquarters) (d) agro-climatic zones – 15 divisions.


3.3. Proposed Regional Airshed Framework for India
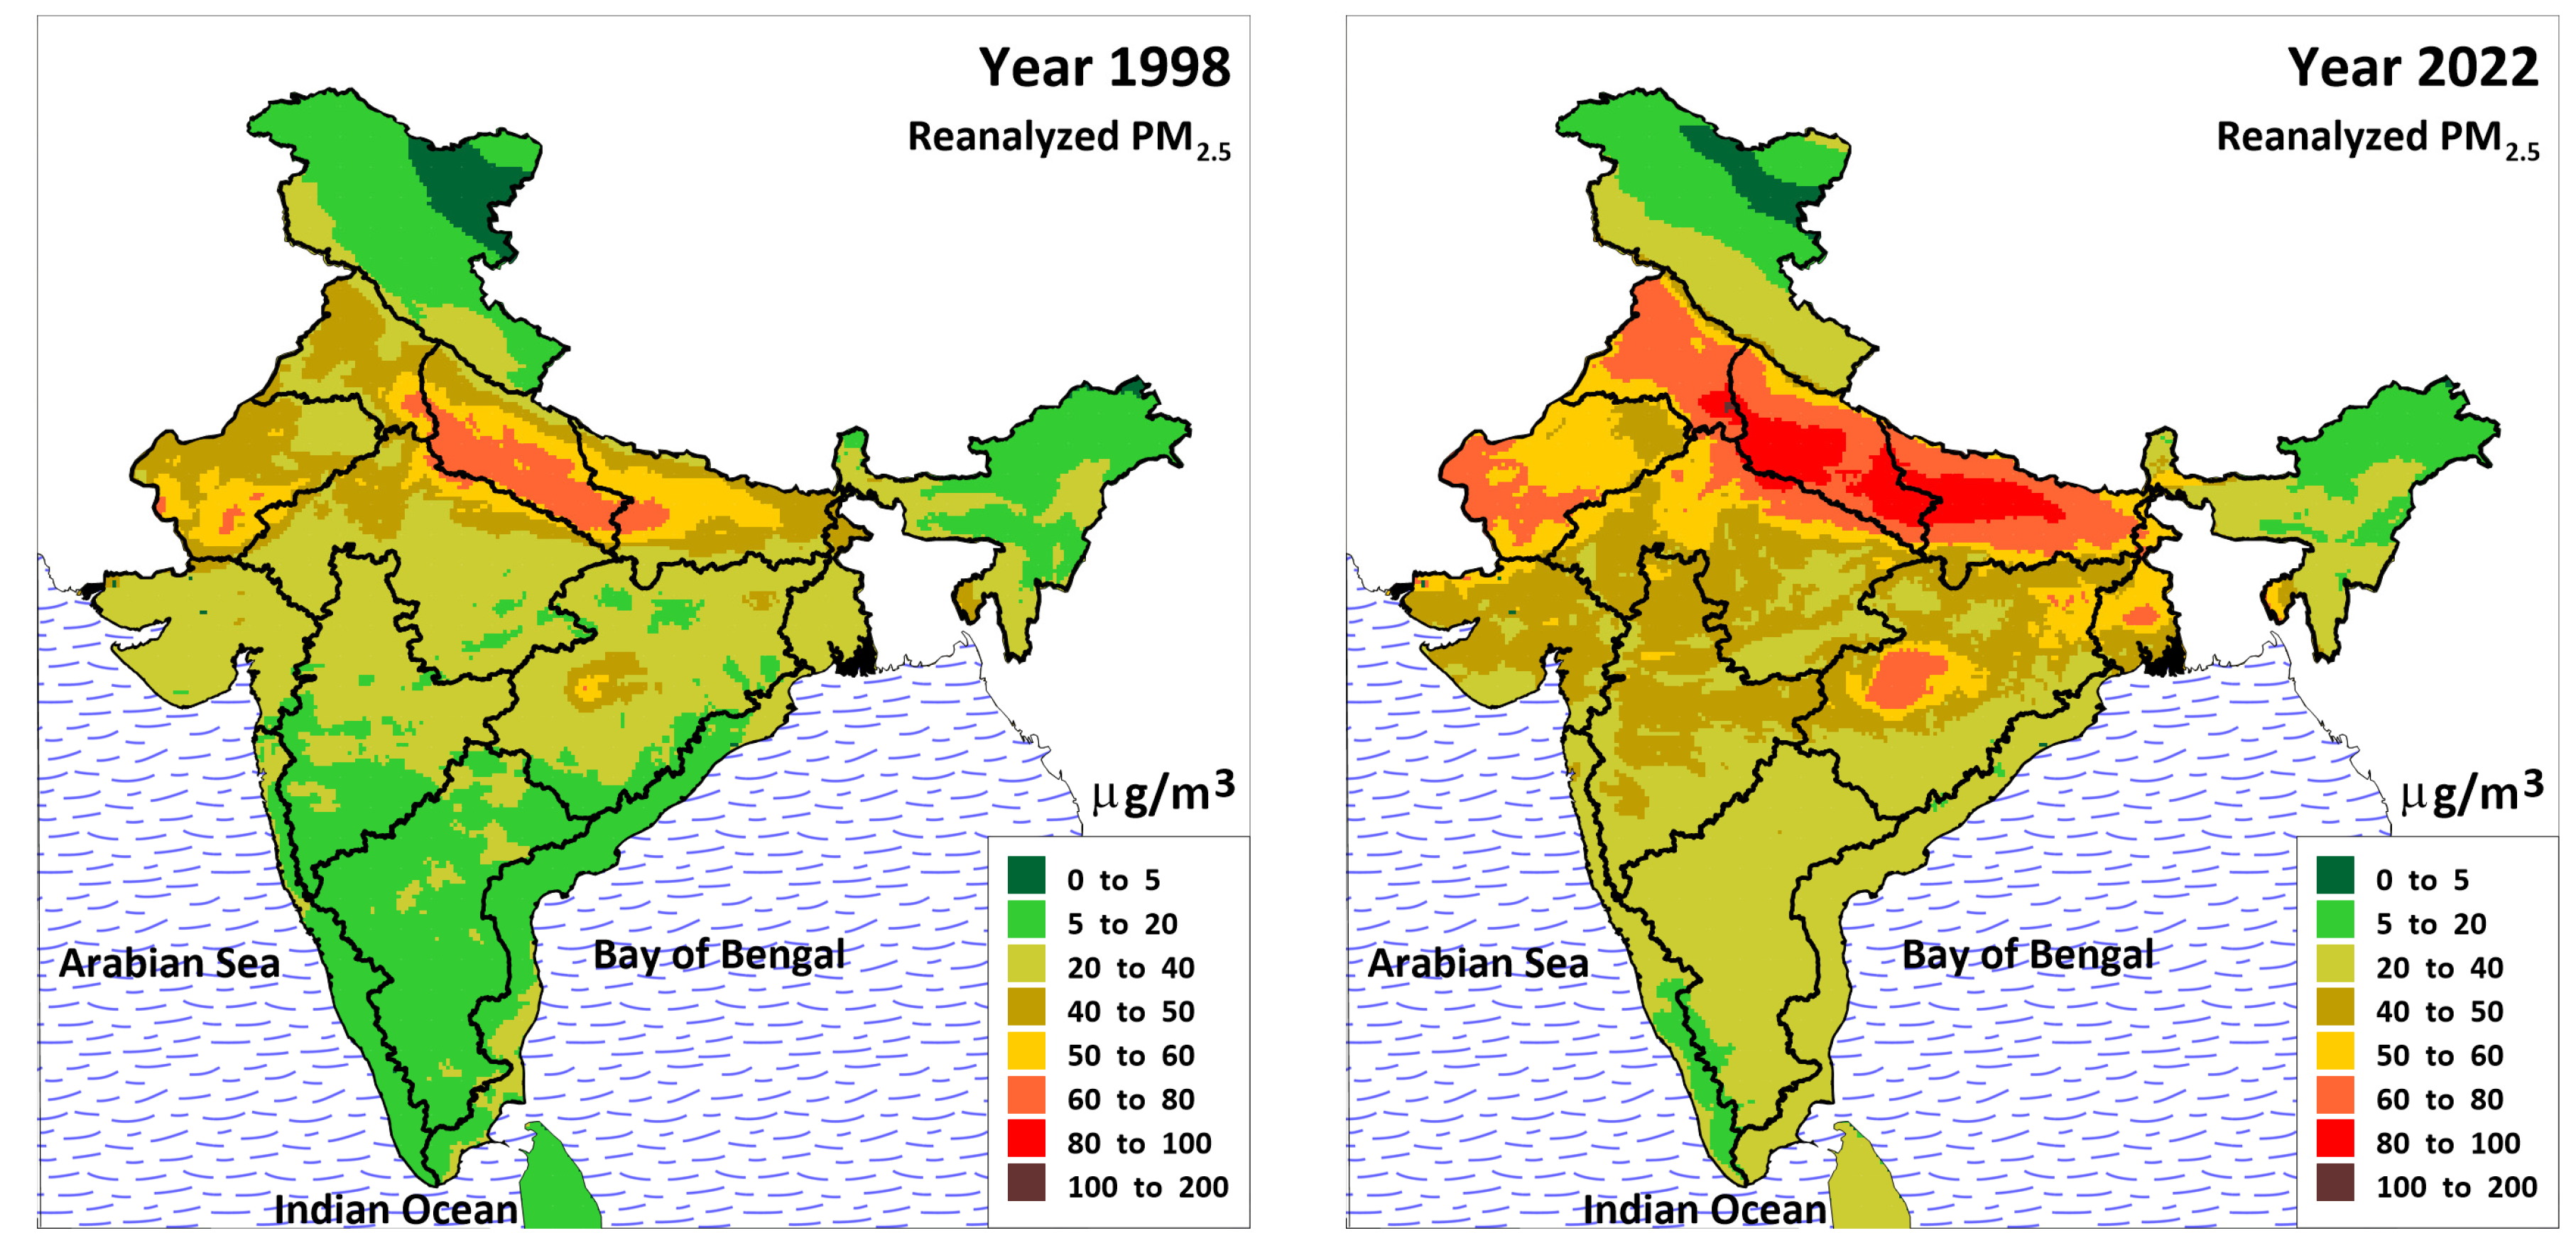
The proposed 15 regional airsheds framework is an ideal setup for air quality management in India. These airsheds are unique not only because of their climatological conditions, but also in pollution characteristics, summarized in Table 1. A representation of PM2.5 pollution levels in 1998 and 2022 from the global reanalysis fields [15] is shown in Figure 3 with an overlay of these airsheds. As large land fractions, there are six blocks - the Himalayas (2 airsheds), Gangetic plain (4 airsheds), Plateau (4 airsheds), arid/desert land (1 airshed), coast plans (3 airsheds) and the islands. Within the blocks, the airsheds share approximately equal sizes (presented as shares to total India’s landmass). The largest block is the Plateaus covering approximately 40% of the landmass and hosts 36% of the total population. IGP occupies 16% of the landmass and hosts 41% of the total population.

Table 1.
Characteristics of the proposed 15 regional airsheds (Figure 2d) to support air quality management in India. Population totals are from gridded database from landscan program [16]. Annual average PM2.5 concentrations are from global reanalysis fields [15,17].
| Airshed | Airshed | Major | Percent | Percent | PM2.5 Average (μg/m3) | ||
|---|---|---|---|---|---|---|---|
| Code | Name | Urban Center | Landmass | Pop 2021 | 1998 | 2022 | %increase |
| 1 | Western Himalayas | Dehradun | 11.0% | 2.9% | 12.3 | 16.6 | 35% |
| 2 | Eastern Himalayas | Guwahati | 9.1% | 4.9% | 17.9 | 22.1 | 24% |
| 3 | Trans Gangetic Plain | Delhi | 4.0% | 7.3% | 42.3 | 63.8 | 51% |
| 4 | Upper Gangetic Plain | Kanpur | 4.1% | 10.0% | 56.1 | 75.8 | 35% |
| 5 | Middle Gangetic Plain | Patna | 5.5% | 15.7% | 46.4 | 68.5 | 48% |
| 6 | Lower Gangetic Plain | Kolkata | 2.4% | 7.5% | 32.9 | 51.0 | 55% |
| 7 | Central Plateau | Indore | 11.3% | 10.0% | 33.6 | 47.9 | 42% |
| 8 | Western Plateau | Nagpur | 9.1% | 7.7% | 21.4 | 40.0 | 87% |
| 9 | Eastern Plateau | Raipur | 11.3% | 9.2% | 27.2 | 43.0 | 58% |
| 10 | Southern Plateau | Bengaluru | 10.0% | 9.6% | 16.4 | 27.5 | 68% |
| 11 | Arid Desert | Jaipur | 5.2% | 2.9% | 45.5 | 57.0 | 25% |
| 12 | Gujarat Coast & Plains | Ahmedabad | 5.6% | 5.4% | 31.0 | 42.2 | 36% |
| 13 | West Coast | Mumbai | 3.8% | 4.2% | 13.0 | 23.7 | 83% |
| 14 | East Coast | Chennai | 6.8% | 2.9% | 17.2 | 26.4 | 53% |
| 15 | Islands | -- | 0.7% | 0.001% | 8.3 | 9.1 | 9% |
A detailed analysis of the evolution of PM2.5 pollution between 1998 and 2020, along with fuel consumption patterns, energy demand, and emission trends at the state level are discussed in [18]. The reanalysis fields summarized for the proposed airsheds in Table 1 are updated to 2022, are extracted from a global modeling system which combines ground-level PM2.5 measurements, Aerosol Optical Depth (AOD) retrievals from NASA’s and ESA’s instruments with the GEOS-Chem chemical transport model using gridded emission inventories [15,17]. In 1998, there were four airsheds with an annual average more than 40 μg/m3 – India’s annual ambient standard and in 2022, excluding the islands, only four airsheds are complying with this standard. Of the 15, eleven airsheds are crucial for overall air quality management in India and requires deeper and coordinated assessments.
- Gangetic Plains continue to be the most polluted. IGP is the most populated region of India (and the Indian Subcontinent) also representing a large emission footprint from residential cooking and heating (especially during the winter months), power plants and other large point sources, a large cluster of brick kilns (to meet the growing construction demand), open waste burning, dust, and vehicles supporting passenger and freight movement.
- The Plateau region between the Eastern and the Western Ghats (mountain ranges), the second most populated block in India, experienced the largest increase in the annual PM2.5 pollution averages. This is an indication of the growing urbanization and delated demand for transport, industrial, and commercial amenities.
- The Coastal block is crucial for industrial economy and an increase in the annual averages here, despite the benefits of land-sea breeze, is an indication of growing shipping emissions and overall growth in the emissions and pollution levels at most of the coastal cities – Mundra, Surat, Mumbai, Goa, Mangalore, Kochi, Thiruvananthapuram, Chennai, Visakhapatnam, Paradip, and Haldia.
- The Arid/Desert region’s high annual averages for PM pollution is due to wind erosion, a natural emission zone.
- The Himalayan block and islands are the cleanest, compared to the national standard, only as an average. The urban settlements like Jammu, Dehradun, Guwahati, and other state capital cities, experience averages above the standards.
Figure 3.
Reanalyzed PM2.5 concentrations for years 1998 and 2022 with the map of proposed 15 regional airsheds [15]. Source contributions averaged for all the grids covering the airsheds, estimated from the same global reanalysis system [19,20]. Aggregated source definitions are DUST = Anthropogenic dust; WINDUST = Wind erosion (dust storms); WASTE = Waste burning; RESI = All commercial and residential cooking, lighting, and heating; TRANS = All transport (excluding aviation and shipping); POWER = Energy generation; INDUS = All industries and product use (including solvents); BIOB = Biomass burning, including forest fires and agricultural waste burning; AGR = Agricultural activities (excluding agricultural waste burning); OTHER = All others.
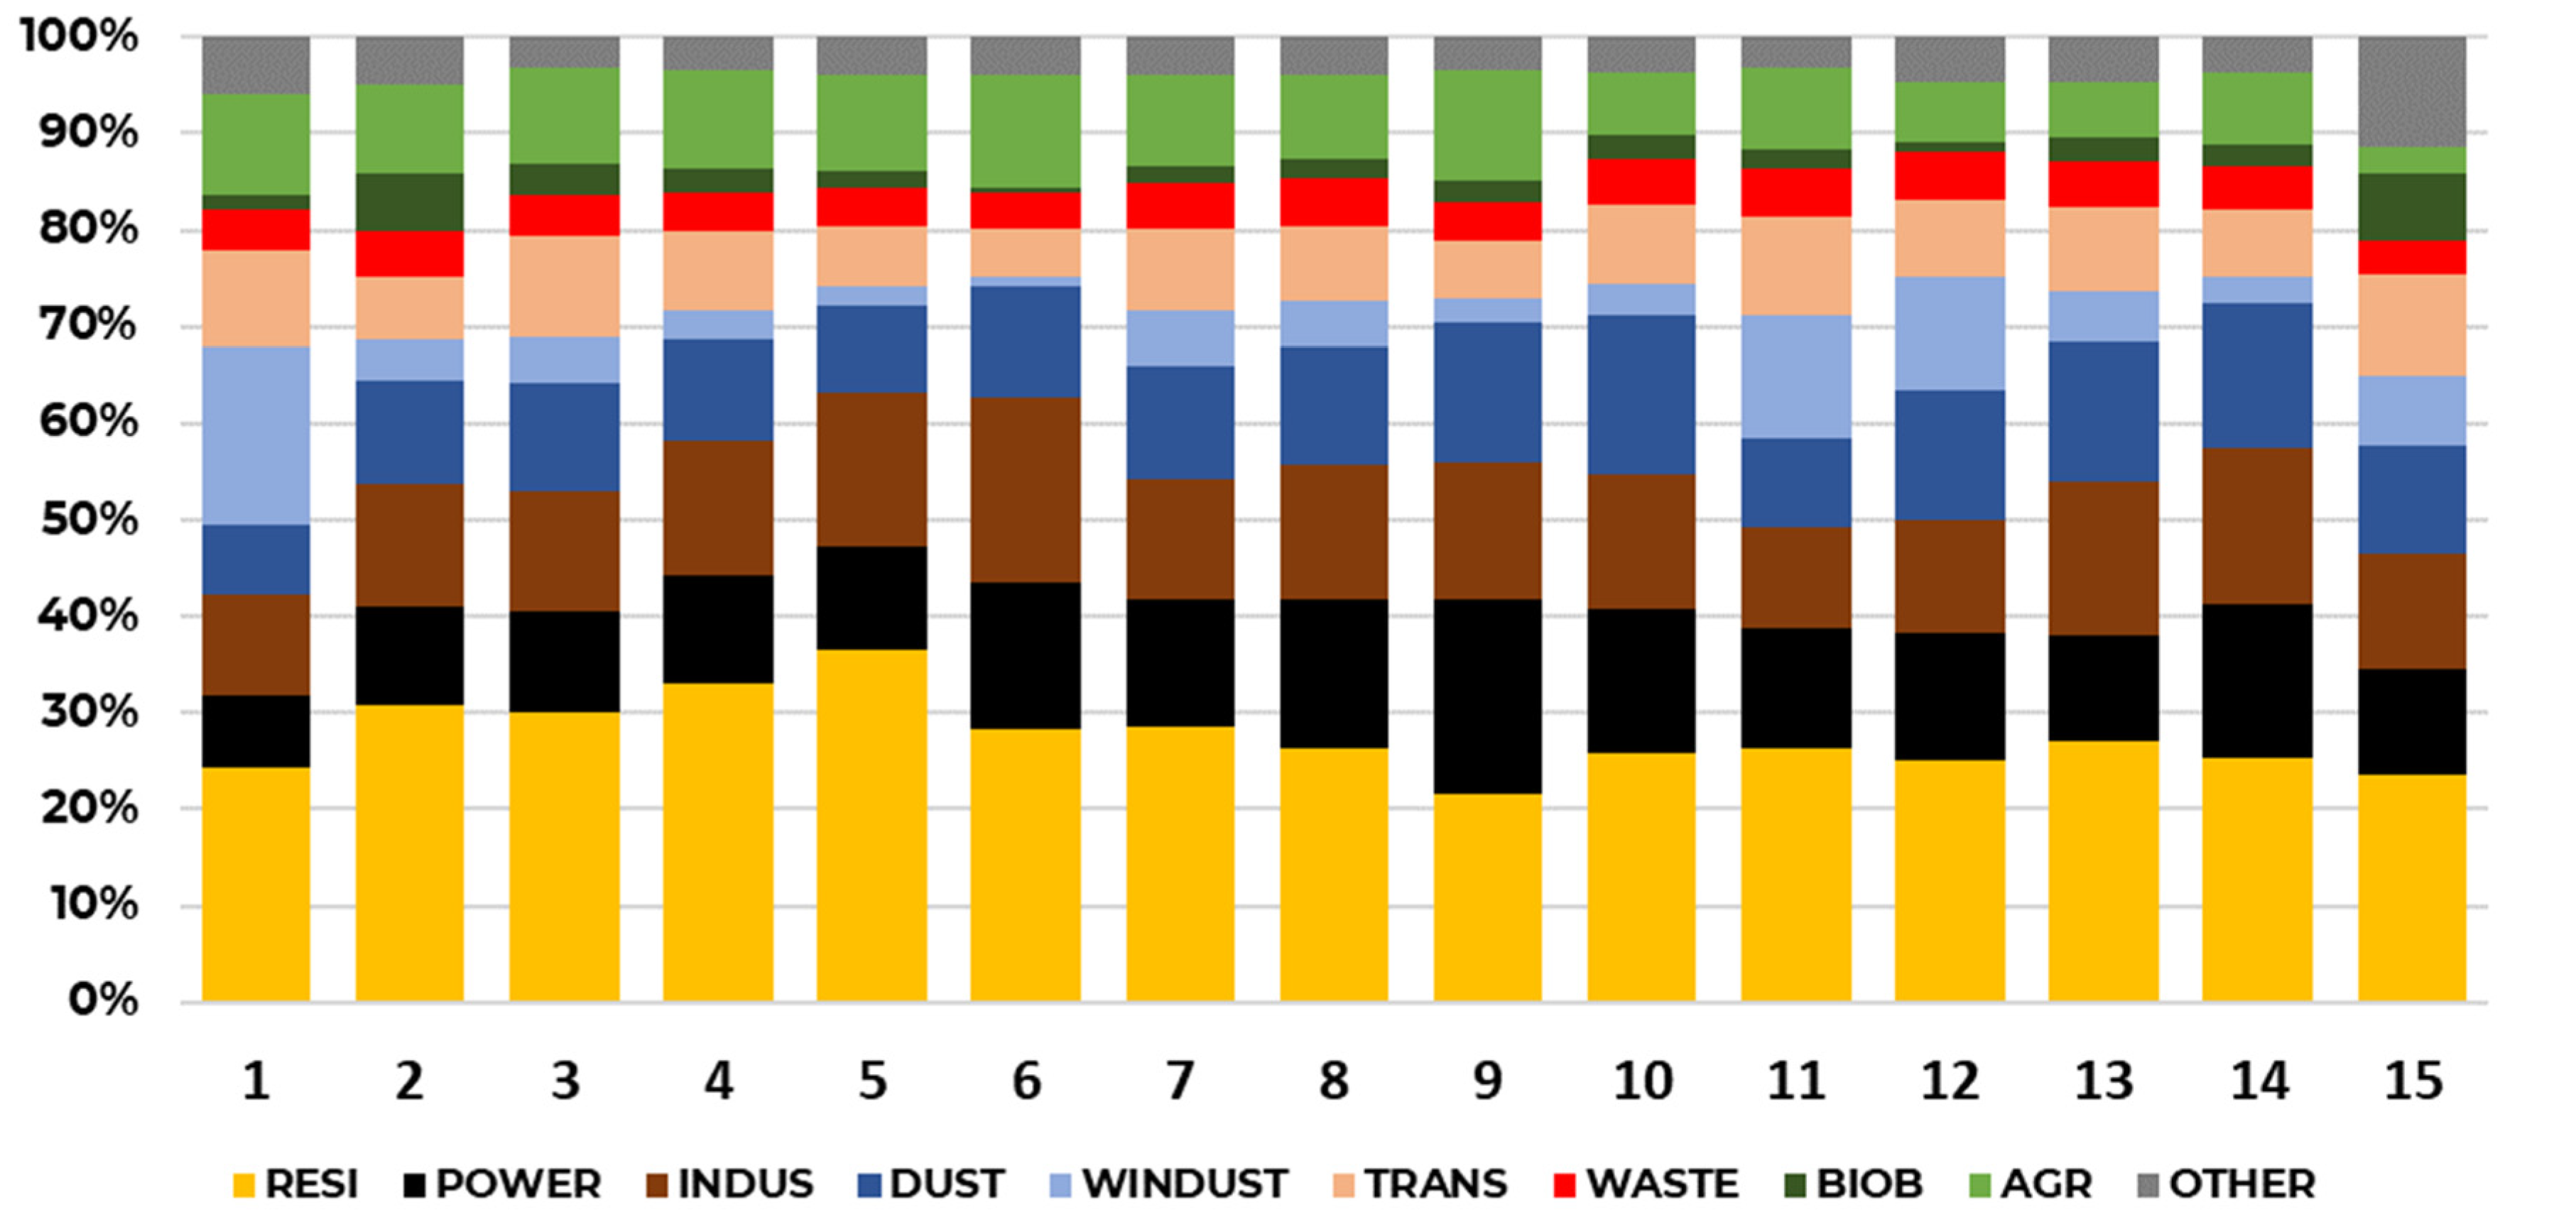
Summary of PM2.5 source apportionment results (Figure 3) for the proposed airsheds highlight distinct emission characteristics. Important to note that these results are averaged over all the grids covering the airsheds and extracted from a global model, which inherently masks some urban features because of the model grid resolution. Possible regional centers for these can be housed in major cities. Some of the highlights include: (1) highest share of the power generation is present in the Eastern Plateau (airshed#9), which includes a large cluster of coal-fired thermal power plants of Chhattisgarh, Northern Madhya Pradesh, and Odisha. (2) Residential cooking and heating, power generation, and all other industries together are responsible for 40-60% of the PM2.5 pollution in all the airsheds and approximately 80% of the pollution comes from fossil fuel burning sources. (3) Windblown dust share is the highest in airsheds 11 and 12, which are natural desert dust regions. (4) On an annual scale, biomass burning activities, including post-harvest crop residue burning activities contribute less than 3%. The same on a seasonal basis will present a different share. (5) All transport contribution is consistently between 5-10% in all the airsheds. The same from a modeling system at a higher resolution and focused on urban airsheds will yield a different share. Overall, the size of the proposed airsheds can capture the source and seasonal trends representative of the regional emission sources and their intensities. Combined with nesting simulations for urban airsheds, the results can aid clean air action plans.
4. Way Forward
Designating airsheds for the cities or for all-India is only the first step towards AQM. Between 28 states, eight UTs, 36 meteorological sub-regional divisions, and six regional meteorological departments, establishing the 13 regional airsheds for integrating AQM efforts across India is a unique opportunity (excluding the Arid/Desert land and the islands, clubbed into one of the neighboring airsheds). The regional centers can be housed in one of the major cities in each of the airsheds (example list in Table 1).
4.1. Need for a Centralized National (Indian Subcontinent) Scale Assessment System
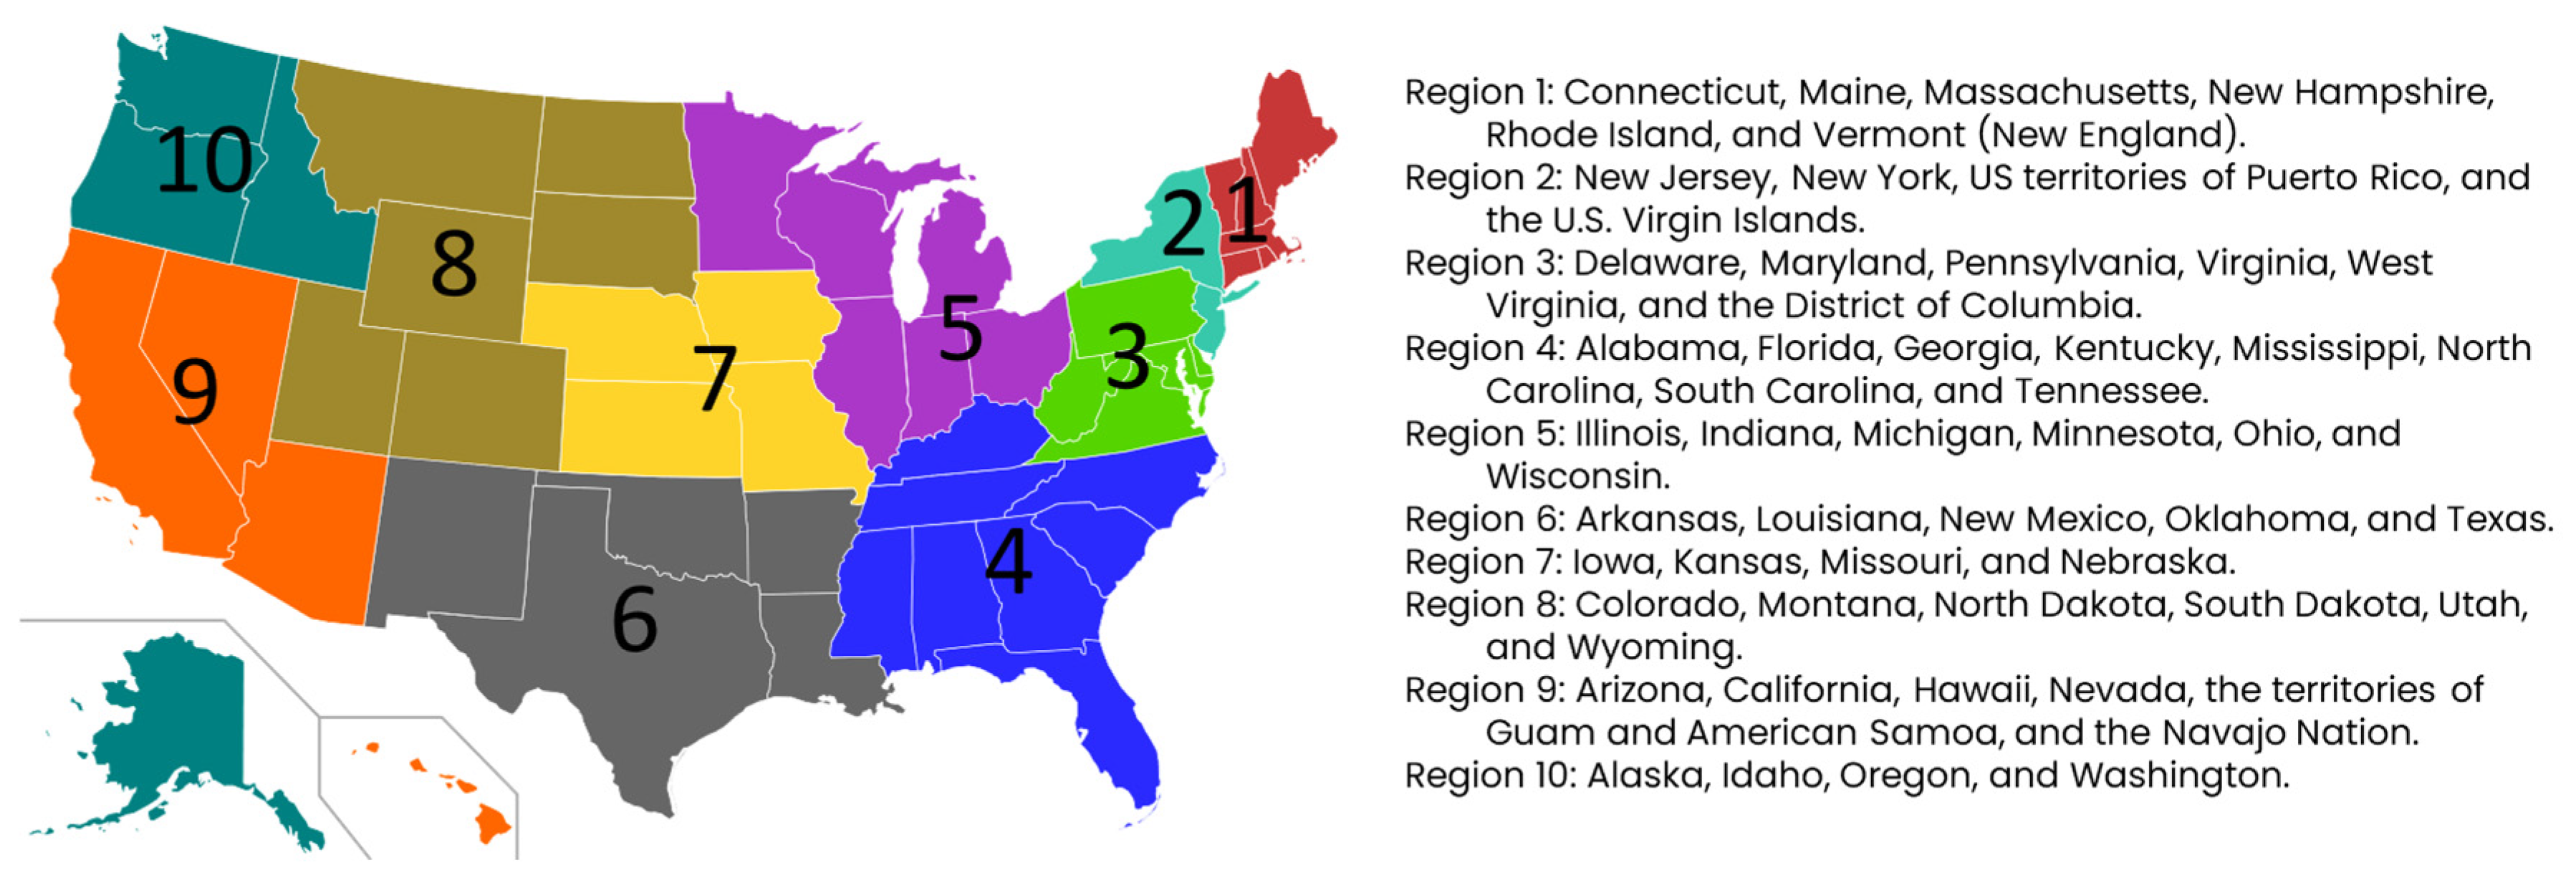
The urban or regional airsheds are defined to account for the contributions of various sectors or various regions and be in a decision-making position to hold the sectors or the regions accountable. Eventually, this is a modeling exercise, starting with an emissions inventory, followed by chemical transport modeling at the desired spatial and temporal resolutions. This evaluation will highlight the importance of the sectors and the regions, and even rank the contributors to prioritize action. To achieve this, irrespective of the number of regional airsheds, a centralized national scale assessment system is a must, which will unify independent urban and regional emission inventories, chemical transport modeling systems, source apportionment assessments, and evaluation methods under one umbrella. The framework can be like the United States Environmental Protection Agency (US EPA) which designated the US states and territories into 10 operational regional airsheds (Figure 4). The regional offices are responsible for coordinating with its states for implementing the US EPA programs, except for those programs that are specifically delegated to states, and the US EPA remains the federal agency for all statutory purposes.
Since India is not alone in the region, the system will have to include the neighboring countries and make it a Subcontinent level effort with Bangladesh, Bhutan, Nepal, Pakistan, and Sri Lanka, to support intergovernmental efforts to evaluate source contributions and share knowledge. This will be a step above the proposed 15 regional airsheds for India.
4.2. Who Is Involved in Managing Urban and Regional Airsheds?
In an urban airshed, covering the main city administrative boundary and the neighboring satellite cities, most of the jurisdictional authority to act against the emission sources will be with the urban local bodies (ULBs), local ministries, some state authorities, and local operators. For example: if open waste burning is a major contributor, the ULBs can be held accountable; if there is a decision to aggressively promote bus usage against cars and motorcycles, the local transport authorities can take immediate charge. This makes coordination between the acting members easier and always confined by geography and regulations.
In a regional airshed, the participating members are from a broader institutional setup like states and sectoral ministries and most of the analytical work will be at a macro level (a resolution lower than urban analytical works). The main advantage here is the option to coordinate regionally, address the issue of long-range transport of pollution at a more granular level. For example: The proposed Eastern Plateau airshed hosts a large portion of the coal-fired thermal power plants, and these emissions have the tendency to travel distances farther than the airshed size [21,22]. These contributions can also be evaluated and officially notified at regional scales, with a higher chance of regional coordination. Within the regional airsheds, further analysis can distribute these contributions to urban airsheds for local actions.
4.3. What Is the Target Pollutant?
The spatial extent of the airshed and the grid sizes are also determined by the target pollutant. For example: if the PM is the main pollutant of concern, a pollutant which often exceeds the ambient standard in Indian cities, conducting analysis at urban scales is recommended. When all the cities control PM2.5 pollution, either by addressing the local contributors or coordinating efforts with sources outside the city limits, the overall reductions in PM pollution will be aggregated at the regional and national level. However, if the pollutant of concern is CO or ozone, both regional pollutants with more uniformity in the spatial patterns over long distances, conducting emissions and pollution analysis at regional scale is recommended.
Funding
This study received no external funding.
Supplementary Materials and Data Availability Statement
All the GIS and pollution databases discussed in this manuscript are available for open use at https://doi.org/10.5281/zenodo.11332107. This resource includes (a) ESRI shapefiles for India states, districts, meteorological sub-divisions, agro-climatic zones, and 0.1 degree resolution mesh (b) PM2.5 annual and monthly average concentrations at 0.1 degree resolution from WUSTL global reanalysis model for 1998 to 2022 (c) Population density at 0.1 degree resolution for 2021.
Acknowledgments
The analysis and conclusions presented herein are exclusively those of the author and do not represent the supporting organizations or the educational departments. Author thanks the anonymous reviewers for their timely and constructive comments and suggestions.
Conflicts of Interest
Author declares no conflict of interest.
References
- Fowler, D.; Brimblecombe, P.; Burrows, J.; Heal, M.R.; Grennfelt, P.; Stevenson, D.S.; Jowett, A.; Nemitz, E.; Coyle, M.; Liu, X.; et al. A chronology of global air quality. Philosophical Transactions of the Royal Society A: Mathematical, Physical and Engineering Sciences 2020, 378, 20190314. [Google Scholar] [CrossRef] [PubMed]
- Sokhi, R.S.; Moussiopoulos, N.; Baklanov, A.; Bartzis, J.; Coll, I.; Finardi, S.; Friedrich, R.; Geels, C.; Grönholm, T.; Halenka, T. Advances in air quality research–current and emerging challenges. Atmospheric Chemistry and Physics Discussions 2021, 2021, 1–133. [Google Scholar] [CrossRef]
- Khan, A.A.; Kumar, P.; Gulia, S.; Khare, M. A critical review of managing air pollution through airshed approach. Sustainable Horizons 2024, 9, 100090. [Google Scholar] [CrossRef]
- Carmichael, G.R.; Tang, Y.; Kurata, G.; Uno, I.; Streets, D.; Woo, J.-H.; Huang, H.; Yienger, J.; Lefer, B.; Shetter, R.; et al. Regional-scale chemical transport modeling in support of the analysis of observations obtained during the TRACE-P experiment. Journal of Geophysical Research: Atmospheres 2003, 108. [Google Scholar] [CrossRef]
- Jacob, D.J.; Crawford, J.H.; Kleb, M.M.; Connors, V.S.; Bendura, R.J.; Raper, J.L.; Sachse, G.W.; Gille, J.C.; Emmons, L.; Heald, C.L. Transport and Chemical Evolution over the Pacific (TRACE-P) aircraft mission: Design, execution, and first results. Journal of Geophysical Research: Atmospheres 2003, 108. [Google Scholar] [CrossRef]
- Wang, L.; Zhang, F.; Pilot, E.; Yu, J.; Nie, C.; Holdaway, J.; Yang, L.; Li, Y.; Wang, W.; Vardoulakis, S.; et al. Taking Action on Air Pollution Control in the Beijing-Tianjin-Hebei (BTH) Region: Progress, Challenges and Opportunities. International Journal of Environmental Research and Public Health 2018, 15, 306. [Google Scholar] [CrossRef] [PubMed]
- Gardiner, B. Choked: life and breath in the age of air pollution; University of Chicago Press: 2019.
- Guttikunda, S.K.; Nishadh, K.A.; Jawahar, P. Air pollution knowledge assessments (APnA) for 20 Indian cities. Urban Climate 2019, 27, 124–141. [Google Scholar] [CrossRef]
- Gu, Y.; Fang, T.; Yim, S.H.L. Source emission contributions to particulate matter and ozone, and their health impacts in Southeast Asia. Environment International 2024, 186, 108578. [Google Scholar] [CrossRef] [PubMed]
- Gani, S.; Pant, P.; Sarkar, S.; Sharma, N.; Dey, S.; Guttikunda, S.K.; AchutaRao, K.M.; Nygard, J.; Sagar, A.D. Systematizing the approach to air quality measurement and analysis in low and middle income countries. Environmental Research Letters 2022, 17, 021004. [Google Scholar] [CrossRef]
- Ganguly, T.; Selvaraj, K.L.; Guttikunda, S.K. National Clean Air Programme (NCAP) for Indian cities: Review and outlook of clean air action plans. Atmospheric Environment: X 2020, 8, 100096. [Google Scholar] [CrossRef]
- Guttikunda, S.; Ka, N.; Ganguly, T.; Jawahar, P. Plugging the ambient air monitoring gaps in India’s national clean air programme (NCAP) airsheds. Atmospheric Environment 2023, 301, 119712. [Google Scholar] [CrossRef]
- Guttikunda, S.K.; Dammalapati, S.K.; Pradhan, G.; Krishna, B.; Jethwa, H.T.; Jawahar, P. What Is Polluting Delhi’s Air? A Review from 1990 to 2022. Sustainability 2023, 15, 4209. [Google Scholar] [CrossRef]
- Dutta, R. Twenty Years of EPCA: Lessons for the New EPCA; Legal Initiative for Forests and Environment, New Delhi, India, 2018.
- van Donkelaar, A.; Hammer, M.S.; Bindle, L.; Brauer, M.; Brook, J.R.; Garay, M.J.; Hsu, N.C.; Kalashnikova, O.V.; Kahn, R.A.; Lee, C.; et al. Monthly Global Estimates of Fine Particulate Matter and Their Uncertainty. Environmental Science & Technology 2021, 55, 15287–15300. [Google Scholar] [CrossRef] [PubMed]
- Rose, A.N.; McKee, J.J.; Urban, M.L.; Bright, E.A.; Sims, K.M. LandScan 2018. 2019.
- Hammer, M.S.; van Donkelaar, A.; Li, C.; Lyapustin, A.; Sayer, A.M.; Hsu, N.C.; Levy, R.C.; Garay, M.J.; Kalashnikova, O.V.; Kahn, R.A.; et al. Global Estimates and Long-Term Trends of Fine Particulate Matter Concentrations (1998–2018). Environmental Science & Technology 2020, 54, 7879–7890. [Google Scholar] [CrossRef] [PubMed]
- Guttikunda, S.; Ka, N. Evolution of India’s PM2.5 pollution between 1998 and 2020 using global reanalysis fields coupled with satellite observations and fuel consumption patterns. Environmental Science: Atmospheres 2022. [Google Scholar] [CrossRef]
- Chatterjee, D.; McDuffie, E.E.; Smith, S.J.; Bindle, L.; van Donkelaar, A.; Hammer, M.S.; Venkataraman, C.; Brauer, M.; Martin, R.V. Source Contributions to Fine Particulate Matter and Attributable Mortality in India and the Surrounding Region. Environmental Science & Technology 2023, 57, 10263–10275. [Google Scholar] [CrossRef] [PubMed]
- McDuffie, E.E.; Martin, R.V.; Spadaro, J.V.; Burnett, R.; Smith, S.J.; O’Rourke, P.; Hammer, M.S.; van Donkelaar, A.; Bindle, L.; Shah, V.; et al. Source sector and fuel contributions to ambient PM2.5 and attributable mortality across multiple spatial scales. Nature Communications 2021, 12, 3594. [Google Scholar] [CrossRef] [PubMed]
- Cropper, M.; Cui, R.; Guttikunda, S.; Hultman, N.; Jawahar, P.; Park, Y.; Yao, X.; Song, X.-P. The mortality impacts of current and planned coal-fired power plants in India. Proceedings of the National Academy of Sciences 2021, 118, e2017936118. [Google Scholar] [CrossRef] [PubMed]
- Guttikunda, S.K.; Jawahar, P. Atmospheric emissions and pollution from the coal-fired thermal power plants in India. Atmospheric Environment 2014, 92, 449–460. [Google Scholar] [CrossRef]
Figure 1.
Four example urban airsheds (a) Kurnool from South India (b-c) Meerut and Delhi from North India and (d) Indore from Central India. The dark lines represent the total road network and purple lines represent the major roads, extracted from the OpenStreetMap database.
Figure 1.
Four example urban airsheds (a) Kurnool from South India (b-c) Meerut and Delhi from North India and (d) Indore from Central India. The dark lines represent the total road network and purple lines represent the major roads, extracted from the OpenStreetMap database.
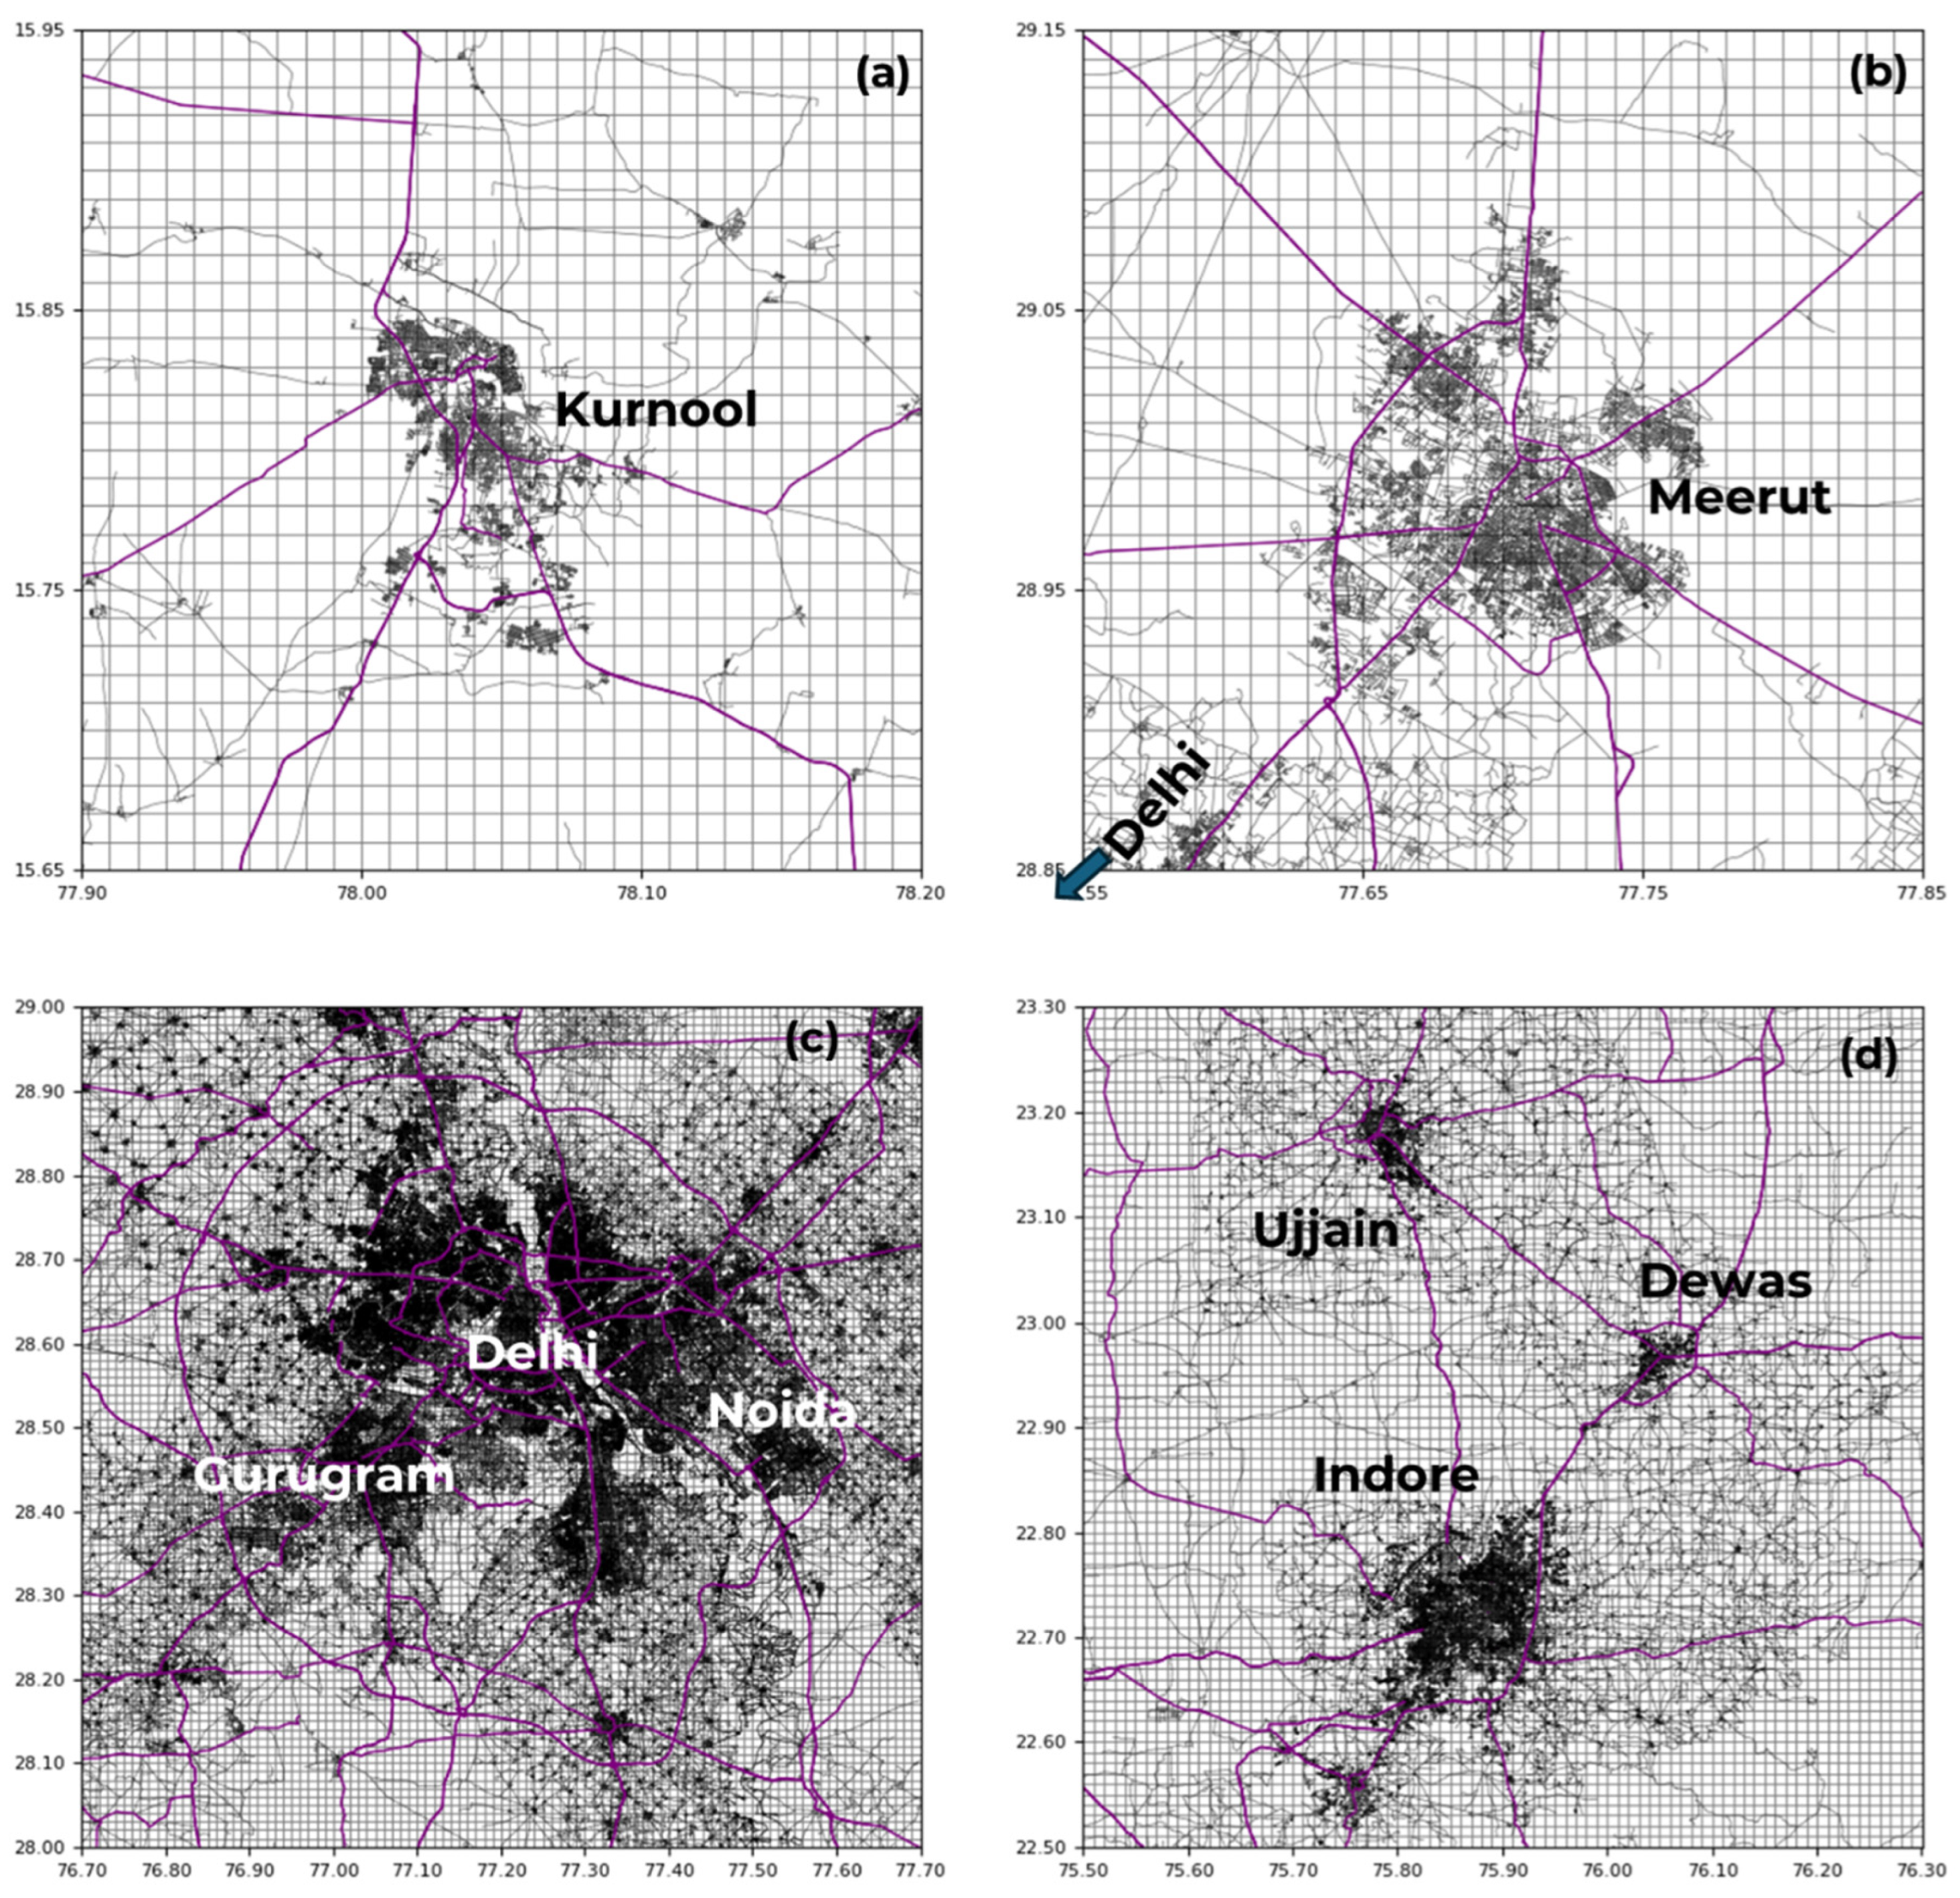
Figure 4.
Designated regional airsheds under the United States Environmental Protection Agency.
Disclaimer/Publisher’s Note: The statements, opinions and data contained in all publications are solely those of the individual author(s) and contributor(s) and not of MDPI and/or the editor(s). MDPI and/or the editor(s) disclaim responsibility for any injury to people or property resulting from any ideas, methods, instructions or products referred to in the content. |
© 2024 by the author. Licensee MDPI, Basel, Switzerland. This article is an open access article distributed under the terms and conditions of the Creative Commons Attribution (CC BY) license (https://creativecommons.org/licenses/by/4.0/).
Copyright: This open access article is published under a Creative Commons CC BY 4.0 license, which permit the free download, distribution, and reuse, provided that the author and preprint are cited in any reuse.


