
Submitted:
20 May 2024
Posted:
21 May 2024
You are already at the latest version
Abstract
Protected areas serve as an effective mechanism usually supported by a statute to conserve and protect wildlife-rich areas worldwide. Such extensive external management needs elaborate planning, regular monitoring, and periodic assessment of results. Thus, management effective evaluation (MEE) has emerged as one of the major tools for quantifying the performance of any protected area, globally since 2006. India has successfully conducted a complete round of management effectiveness evaluation of all its terrestrial protected areas (except conservation reserves and community reserves), with 25 such areas already undergoing a repeat assessment. Simultaneously, India biennially carries out a country-wide status of forest cover in all its states and union territories. This study has correlated the trend in change of forest cover for the states that contain those 25 repeat evaluated protected areas with their change in MEE scores over the same period. Our study found a positive correlation between the change in forest cover and the change in management effectiveness score from 2005-06 to 2018-19. Owing to increased protection regimes in the PAs including the degraded areas if they make part of such areas, the habitat often shows recovery. Effective habitat conservation is thus intertwined with the monitoring and preserving the wildlife populations in the protected areas, thereby, reduction in forest cover equally impacts the management scores. However, in states where the loss in forest cover has been reported, more protected areas need to be assessed to plan complementary strategies for both habitat and species conservation.
Keywords:
Protected areas
; management effective evaluation
; forest cover
Introduction
India, a mega biodiverse country with only 2.4% of the world's land area, accounts for 11.2 % of the world’s floral and 6.7% of known faunal species, which includes over 48,655 species of plants and 1,00,693 species of animals [1]. A biogeographically representative and effectively managed Protected Area (PA) network is considered the most important means of in situ conservation of this unique biodiversity and in India it is spread over 10 biogeographic zones of the country [2]. The country has one of the world’s most extensive networks of officially recognized PAs. Protected Areas (PAs) play a multifaceted role of conserving biodiversity, implementing various environmental agreements [3,4], and also providing ecosystem services like climate change mitigation, protection against natural disasters and lastly, are inherently correlated with indigenous communities, in terms of both livelihood and cultures [5,6]. India is developing rapidly and presently is one of the topmost densely populated countries globally; understandably, creating Protected Areas (PA), which have legally established inviolate status is no mean feat. The PAs are facing challenges from the shrinkage of natural resources and anthropogenic pressures at a non-stop pace [7]. Such havoc challenges inevitably lead to changes in ecology, animal behaviour, and conservation status of several species, which need critical assessment and regular monitoring. After such assessment and monitoring, the main task befalls on the management aspect, interventions like reducing the anthropogenic pressures and implementing effective protection need planning ahead of time. Thereby, the management practices require periodic evaluation to see their applicability to changing resource use patterns and ensure support of local communities in conservation programmes.
Adequate protection of an area is not ensured simply by declaring it a PA; globally there is growing concern that many protected areas are not achieving their objectives and are unable to implement actions that are required to improve their effectiveness [8]. An ideal PA management is inclusive of periodic assessment of effectiveness and modifying the inputs accordingly. Assessment is a platform that brings local communities and government machinery together, helping to better resource partitioning and appropriate threat response [9].
A regular monitoring of improvement in PA management over time and the associated issues of on-ground management is a crucial benchmark for Aichi Target 2020 and the overall delivery of the Convention on Biological Diversity (CBD) Strategic Plan, along with the post-2020 Global Biodiversity Framework. Under the CBD, along with Aichi Target 11, member countries are implementing the Program of Work for Protected Areas (PoWPA), which includes 16 goals under 4 program elements. India submitted its Action Plan on PoWPA to the CBD secretariat in 2012. In similar line with 20 Global Aichi Targets, India has developed 12 National Biodiversity Targets (NBTs). The NBT6 is about PA management, which is governed by the Wildlife (Protection) Act, 1972.
Management Effectiveness Evaluation (MEE) is being used as a tool globally to evaluate the performance of PAs. The growing interest in the effectiveness of management of protected areas can be traced through the emergence of the topic at the decadal World Parks Congresses, after the fourth World Parks Congress in Caracas in 1992 [10], several methodologies for assessing the management effectiveness of protected areas were developed, primarily in Central and South America [11,12,13] and Australia [14]. In 1996, the IUCN World Commission on Protected Areas (WCPA) commenced work on a framework and guidelines for assessing the management effectiveness of protected areas, which led to the first edition of the IUCN guidelines for Evaluating Effectiveness, a framework consisting of 6 elements designed for assessing the management of protected areas [15], first designed in 2000 (Figure 1), with a revision in 2006 [9] and has since formed the foundation for most of the protected area evaluation systems developed and applied around the world.
According to the global database of PAME (Protected Area Management Effectiveness) of the CBD Programme of Work on PAs, only 42 countries have implemented MEEs in at least 60% of their PAs (21,743 PAs), and the results indicate that the average PAME score, for all assessed PAs, is 52% [16,17]. Management effectiveness assessments have been conducted across 18.29% of the area covered by protected areas globally, which is much below the 60% target set by the CBD [6].
Protected area management effectiveness is also a requirement of the convention on biological diversity (Goal 4.2: To evaluate and improve the effectiveness of protected area management). In the last two decades, India has adopted the MEE framework and has made significant efforts to institutionalize the process of MEE of PAs. The process of evaluation of National Parks (NPs) and Wildlife Sanctuaries (WLSs) through MEE was initiated in 2006 and is continuing to date, with the latest cycle report published in 2021 [18].
Biodiversity conservation in India has been governed and managed by two major wings of the forest department under the state Governments, the territorial forest wing and the wildlife wing. Indian Forest Act (1927) provides the major legal backing for the protection and management of forests in terms of Reserve Forest, Protected Forest, and Village Forest, whereas the Wildlife (Protection) Act, 1972 is the legislation for the conservation and management of wildlife-rich areas through the declaration of Protected Areas in terms of National Parks, Wildlife Sanctuaries, Conservation Reserves and Community Reserves. PAs in India are mostly managed through plans prepared as per guidelines [19], though the same has not been officially adopted by the Government. The biennial forest cover analysis does not take account of individual PAs, rather it accounts for total forest cover in the region (in this case the states of the country). In India, every alternate year, the State of Forest Report is released by the Government of India, which depicts a holistic picture of change in forest cover across the country, both inside and outside recognized forest areas. The present study evaluates whether the shift in management effectiveness of any PA is related to change in the status of forest cover in the region, in the equivalent period of time.
Indian Protected Areas:
The PA network of India covers 5.26% of the geographic area of the country. The network of PAs represents all the country’s 10 biogeographic zones (Rodgers et al 2002). Legally, India has designated four categories of PAs: National Parks, Wildlife Sanctuary, Conservation Reserve and Community Reserve. As of 1 January 2023, a total of 998 protected areas have been established in India which include 106 national parks, 567 wildlife sanctuaries, 105 conservation reserves, and 220 community reserves (MoEFCC-ENVIS database-2023)
The protected areas can be broadly divided into two subcategories of strict protection with complete prohibition of any unpermitted activities vs. conservation through sustainable use of resources, for community subsistence. The management of the first category is fully government-controlled, whereas the management of the second category is largely through the involvement of the local community. National Parks and Wildlife Sanctuaries fall under the first category, whereas Conservation Reserves and Community Reserves fall under the second category. Both these categories can therefore be compared to IUCN categories as elaborated in Table 1. By 2019-20, the MEE exercise had been completed for all PAs of the first category i.e. National Parks and Sanctuaries, except coastal/ marine National Parks and Sanctuaries of Andaman & Nicobar Islands. The tiger reserves, where core areas are usually legally notified PAs, are evaluated through a separate MEE exercise, and a pilot study of MEE of coastal/ marine PAs has been initiated in 2021-22 in India.
Management Effectiveness and State of Forest
MEE has been conducted only in NP and WLS out of the 4 PA categories in India. The MEE process was initiated by the Government of India in 2006 and has completed evaluation of 442 National Parks and Wildlife Sanctuaries from 2006 to 2019 in 4 phases, excluding the Conservation Reserves, Community Reserves, Coastal and Marine parks of Andaman & Nicobar Islands and parks/wildlife sanctuaries falling under Tiger Reserves of the country (as detailed in Table 2). The IUCN-World Commission on Protected Areas (WCPA) framework of MEE has been used in the MEE exercise with appropriate modifications. All 6 indicators (context, planning, inputs, processes, output, and outcomes) are used with a series of specific questions pertaining to each category.
Therefore, it can be seen that all territorial PAs have already been covered once under the MEE exercise. After the completion of the evaluation of all PAs in four phases, a repeat cycle of evaluation was taken up in 2018-19 for 25 such PAs which were evaluated initially in 2005-2006. The change in MEE score was analyzed linearly between the two cycles (Table 3). In the states of Manipur, Meghalaya, and Tripura only a single PA was there in 2005, which was re-evaluated in 2019. Thereby these 3 PAs represent solely their state, whereas in the case of other PAs, they represent all the other PAs as well, for the sake of this study.
As stated before, individual PA is not assessed for forest cover or tree outside forest cover in India in the biennial assessment of forest cover. The assessments are carried out at the state level, and each state has multiple PAs within its territorial jurisdiction. Thereby the forest cover change of 21 states covering the 25 repeat cycle PAs has been analyzed in this study. The forest cover between 2006 and 2019 (Table 3) has been picked up for this purpose. The state of Andhra Pradesh was bifurcated in 2014 into two states, Andhra Pradesh and Telangana. Thereby, the 2019 forest cover has been taken by combining data from both states, as the 2005 data represented the unified state data.
Simultaneously respective average scores of the 6 elements of the MEE process were compared and analyzed for all the 25 repeat PAs (Table 3). This was done to understand the priority sector of field-level conservation from the PA managers’ perspective and whether the elements themselves have any intercorrelation.
The change in forest cover was categorized into 3 sections, high increase in forest cover (> 1000 sq. km.), low increase in forest cover (< 1000 sq. km.), and decrease in forest cover. The Kruskal-Wallis test was run to understand the effect of the change of forest cover on each element of the MEE repeat cycle, for all the 25 PAs.
All analytical processes were performed using the R software.

Table 5.
Comparative analysis of the score of the indicators in the 2018-19 MEE cycle.
| State | Name of PAs | Context (out of 30, 3 Q * 10 each) |
Planning (out of 80, 8 Q * 10 each) |
Inputs (out of 60, 6 Q * 10 each) |
Process (out of 40, 4 Q * 10 each) |
Outputs (out of 30, 4 Q * 10 each) |
Outcomes (out of 50, 5 Q * 10 each) |
|---|---|---|---|---|---|---|---|
| Himachal Pradesh | Great Himalayan NP | 27.5 | 62.5 | 52.5 | 32.5 | 35 | 42.5 |
| Jammu & Kashmir | Kishtwar NP | 15 | 50 | 40 | 22.5 | 15 | 25 |
| Uttar Pradesh | National Chambal WLS | 22.5 | 52.5 | 27.5 | 15 | 20 | 40 |
| Uttar Pradesh | Sohelwa WLS | 12.5 | 40 | 20 | 17.5 | 12.5 | 22.5 |
| Uttarakhand | Govind NP | 20 | 55 | 17.5 | 15 | 10 | 27.5 |
| Andhra Pradesh | Papikonda NP | 17.5 | 45 | 40 | 20 | 25 | 32.5 |
| Kerala | Wayanad WLS | 20 | 60 | 35 | 27.5 | 25 | 32.5 |
| Tamil Nadu | Gulf of Mannar Marine NP | 27.5 | 72.5 | 42.5 | 30 | 30 | 35 |
| Jharkhand | Mahuadanr Wolf WLS | 20 | 50 | 35 | 22.5 | 20 | 32.5 |
| Odisha | Bhitarkanika WLS | 20 | 55 | 42.5 | 25 | 30 | 37.5 |
| Odisha | Sunabeda WLS | 20 | 57.5 | 37.5 | 20 | 25 | 25 |
| West Bengal | Jaldapara NP | 22.5 | 70 | 42.5 | 32.5 | 32.5 | 42.5 |
| West Bengal | Mahananda WLS | 25 | 60 | 45 | 30 | 27.5. | 27.5 |
| Gujarat | Barda WLS | 20 | 55 | 30 | 25 | 22.5 | 30 |
| Madhya Pradesh | Kuno WLS | 25 | 70 | 52.5 | 30 | 27.5 | 35 |
| Madhya Pradesh | Madhav NP | 22.5 | 60 | 47.5 | 30 | 30 | 37.5 |
| Maharashtra | Sanjay Gandhi NP | 25 | 57.5 | 52.5 | 22.5 | 27.5 | 35 |
| Rajasthan | Keoladeo Ghana NP | 27.5 | 65 | 40 | 22.5 | 25 | 37.5 |
| Arunachal Pradesh | Sessa Orchid WLS | 20 | 55 | 15 | 25 | 15 | 27.5 |
| Assam | Pabitora WLS | 25 | 52.5 | 42.5 | 32.5 | 27.5 | 42.5 |
| Manipur | Keibul-Lamjao NP | 27.5 | 65 | 40 | 25 | 27.5 | 35 |
| Meghalaya | Nongkhyllem WLS | 22.5 | 75 | 42.5 | 30 | 27.5 | 40 |
| Sikkim | Khangchendzonga NP | 27.5 | 70 | 45 | 30 | 25 | 27.5 |
| Tripura | Sepahijala WLS | 22.5 | 52.5 | 40 | 32.5 | 27.5 | 32.5 |
| Haryana | Sultanpur NP | 22.5 | 45 | 30 | 27.5 | 30 | 37.5 |
| Average for PAs lying in States with a high increase in forest cover | 22.12 | 59.23 | 43.46 | 26.54 | 26.88 | 33.85 | |
| Average for PAs lying in States having a low increase in forest cover | 22.50 | 56.88 | 34.69 | 25.00 | 23.75 | 34.69 | |
| Average for PAs lying in States having loss in forest cover | 22.50 | 56.88 | 28.13 | 24.38 | 20.00 | 30.63 | |
Results
Out of a total of 25 of the repeat PAs, 18 PAs showed considerable performance improvements, 5 PAs showed a negative trend and 2 PAs showed no change in score. A linear Pearson correlation test was performed to check the relationship between pairs of indicators and one-way ANOVA to check the significance of the difference between the overall score of two cycles of evaluation. One-way ANOVA suggested a significant difference (p < 0.05) between cycles of evaluation as p= 0.04517.
On the next level, the change in MEE score has been analyzed against the change in forest cover between 2005 and 2019. In 2019 the PA network covered 5.26% of India’s geographical area, whereas the recorded forest area was 23.58%. Therefore, assuming that all the PAs are in forested areas, the PA covers only 22.30% of the total forested area of India. A simple correlation plot highlighted the fact that there is a considerable correlation (R= 0.43) between the change in MEE scores with the change in forest cover of the concerned region (Figure 2).
While analyzing the respective average scores of the 6 elements of the MEE process for all the 25 repeat PAs, we found that in general the highest score was received by planning, followed by inputs (Figure 3).
While analyzing the scores, it was also found that overall planning and input have a positive correlation (R=0.5), whereas input and output have an insignificant correlation (R=0.1).
Subsequently, we analyzed whether each element's performance can be linked to the change in forest cover. It was found that Inputs are better correlated with change in forest cover (r=0.4), than planning (r=0.06) and process (r=.04), with very insignificant values (Figure 4 a, b, c).
It was found that the overall MEE score after the repeat cycle is not significantly different for the 3 categories of forest cover change, analyzed by the Bonferroni-Holm posthoc test, with P=0.22. High forest cover change states have an average of 66.35% (SD = 20.82), low forest cover change states have an average of 66.47% (SD = 12.48); however, states having a decrease in forest cover have an average of 62.06% (SD = 13.56) MEE score in 2019 cycle. In the last category however 2 PAs have got a reduction in MEE score from the 2005 score, one PA has score unchanged and one PA has increase in MEE score from the 2005 score. Thereby a 50% reduction in MEE score has been witnessed in case there is a reduction in forest cover. In the other two cases, it was the two states Manipur and Tripura, where only one PA each from the state had been evaluated, unlike others. Thereby there can be a chance of reduction of MEE score in these cases as well, based on more PAs getting evaluated.
Considering the individual elements of the MEE process and the three categories of change in forest cover, statistically significant differences were not found, with the highest difference found in the element input, the Kruskal-Walis test result is H=0.78 with p value 0.67 (Figure 5).
Discussion
In the MEE process, the scoring was made based on the field observations and evidence provided by the PA management authorities.
The analyzed PAs have a large range of management effectiveness, considering their MEE scores are spread over from the lowest 43.33 to the highest 84.17. Thereby, this group of PAs is a well-represented sample to understand the field level management variation and also concerning the change in forest cover of the respective states. Change in forest cover is influenced by many territorial forest areas owing to various management practices and anthropogenic pressures viz. dependencies, and infrastructural development. External factors like the conversion of forest land can have a considerable impact on forest cover. This practical view has been kept in mind while interpreting the data as well.
In the result, we have seen that among the six elements planning process in total gets the comparative highest score in MEE, however, the actual input is correlated more with the change in forest cover. This fact needs to be taken into consideration, as it indicates that the MEE process is putting more focus on documentary evaluation (which portrays the planning part) than complete field inspection (i.e. the input part). Many times field managers take instant decisions to deal with a situation within their discretionary powers, which may not be later documented on paper, thereby actual actions are getting shadowed by documents which is the main item getting evaluated in the MEE. Also, the field observations can only help to evaluate the result, that is output and outcomes, but the cause of the result, i.e. the input is not being given due importance as evident from the scores. However, it is also a fact that assessing the planning is easier, because of the readily available documents, whereas annual prescriptions and inputs based on the local condition are mostly not documented and therefore harder to assess optimally thus bringing in subjectivity.
The results have also shown that MEE scores improved when there is an increase in forest cover, it can thereby be stated safely that the betterment in MEE score is influenced by better forest management holistically. Thus, the overall quality of natural resource management in a state is reflected both in the forest cover as well as in PA management.
Holistically the study has shown a positive relationship between management practices and tangible results on the ground. Species conservation is impossible without habitat and forest conservation which is evident from the results obtained. In India, although PA management is considered a separate task from general forest management, the conservation efforts made in any PA finally contribute to the broader conservation gains of an increase in forest cover as shown by our study. This result is also indicative of the effort that PA managers on the field are making, with the concept of forestry management as a whole. The change in forest cover is transcending on the ground with site-specific prescriptions and field action and vice versa. It is also important that the same agency i.e. state Govt. through the forest department is managing the PAs as well as the forests as a whole since the two cannot be separated ecologically and often complement each other. The results of PA management and forest cover change are reflections of the efficiency of the same agency and thus the correlation is expected.
India is a mega biodiversity country; the wide plethora of wildlife cannot be managed in isolation without managing the forest ecosystem in the larger landscape in the ecological continuum. Any change in the forest, be it a decrease in forest cover, or an increase in grassland area has a direct impact on the fauna utilizing that specific habitat. Protected areas are not simple enclosures of any wild animals with set boundaries, they are forest land and forest ecosystem, being specially managed with interventions specific to the key species occupying that area. Any input in wildlife management also involves forest management, and through the results, it is established that all input and planning have changed with changing forest cover. India is conserving and managing its bio-diversity as a whole and not in PAs as islands. Thus conservation is taking effect at the landscape level.
References
- CBD, India’s 6th National Report, 2018.
- Rodgers, W.A., Panwar, H.S. and Mathur, V.B. 2002. Wildlife Protected Areas in India: a Review (Executive Summary). Wildlife Institute of India, Dehradun, 1-51.
- Stoll-Kleemann, S. (2010). Evaluation of management effectiveness in protected areas: Methodologies and results. Basic and Applied Ecology, 11(5), 377-382.
- Bongaarts, J. (2019). IPBES, 2019. Summary for policymakers of the global assessment report on biodiversity and ecosystem services of the Intergovernmental Science-Policy Platform on Biodiversity and Ecosystem Services.
- Hockings, M. (2003). Systems for assessing the effectiveness of management in protected areas. BioScience, 53(9), 823-832.
- UNEP-WCMC, I. U. C. N. (2021). Protected Planet Report 2020. UNEP-WCMC and IUCN: Cambridge UK.
- Mathur, V. B., Ansari, N. A., & Onial, M. (2019). Protected areas management in India: Challenges and way ahead. Special Issue on Environment, 101.
- Borrini-Feyerabend, G., Johnston, J., & Pansky, D. (2012). Governance of protected areas. In managing protected areas (pp. 146-175). Routledge.
- Hockings, M. (2006). Evaluating Effectiveness: A framework for assessing management effectiveness of protected areas. IUCN.
- Hockings, M., Leverington, F., & Cook, C. (2015). Protected area management effectiveness. Protected area governance and management, 889-928.
- Courrau, J. (1999). Strategy for monitoring the management of protected areas in Central America.
- De Faria, H. 1993. Elaboración de un Procedimiento para medir la efectividad de manejo de áreas silvestres protegidas y su aplicación en dos áreas protegidas de Costa Rica. Tesis Mag. Scientiae. CATIE, Turrialba, Costa Rica. 91 p.
- Izurieta, A., Sithole, B., Stacey, N., Hunter-Xenie, H., Campbell, B., Donohoe, P., ... & Wilson, L. (2011). Developing indicators for monitoring and evaluating joint management effectiveness in protected areas in the Northern Territory, Australia. Ecology and Society, 16(3).
- Hockings, M. (1998). Evaluating management of protected areas: integrating planning and evaluation. Environmental Management, 22, 337-345.
- Hockings, M., Stolton, S., & Dudley, N. (2000). Evaluating effectiveness: a framework for assessing the management of protected areas (No. 6). IUCN.
- Coad, L., Leverington, F., Knights, K., Geldmann, J., Eassom, A., Kapos, V., ... & Hockings, M. (2015). Measuring the impact of protected area management interventions: current and future use of the Global Database of Protected Area Management Effectiveness. Philosophical Transactions of the Royal Society B: Biological Sciences, 370(1681), 20140281.
- UNEP-WCMC, I. U. C. N. (2020). NGS. 2021. Protected Planet Live Report 2020. UNEP-WCMC and IUCN: Cambridge UK.
- Mohan, D., Talukdar, G. H., Sen, M., & Ansari, N. A. (2021). Technical Manual for Management Effectiveness Evaluation (MEE) of 210 National Parks and Wildlife Sanctuaries in India during 2020-21. Wildlife Institute of India, Dehradun.
- Sawarkar, V. B. (2005). A guide to planning wildlife management in protected areas & managed landscapes. Natraj Publishers.
Figure 1.
IUCN-WCPA MEE framework (Hockings et al, 2000) .

Figure 2.
Change in MEE score with change in forest cover (sq. km.).
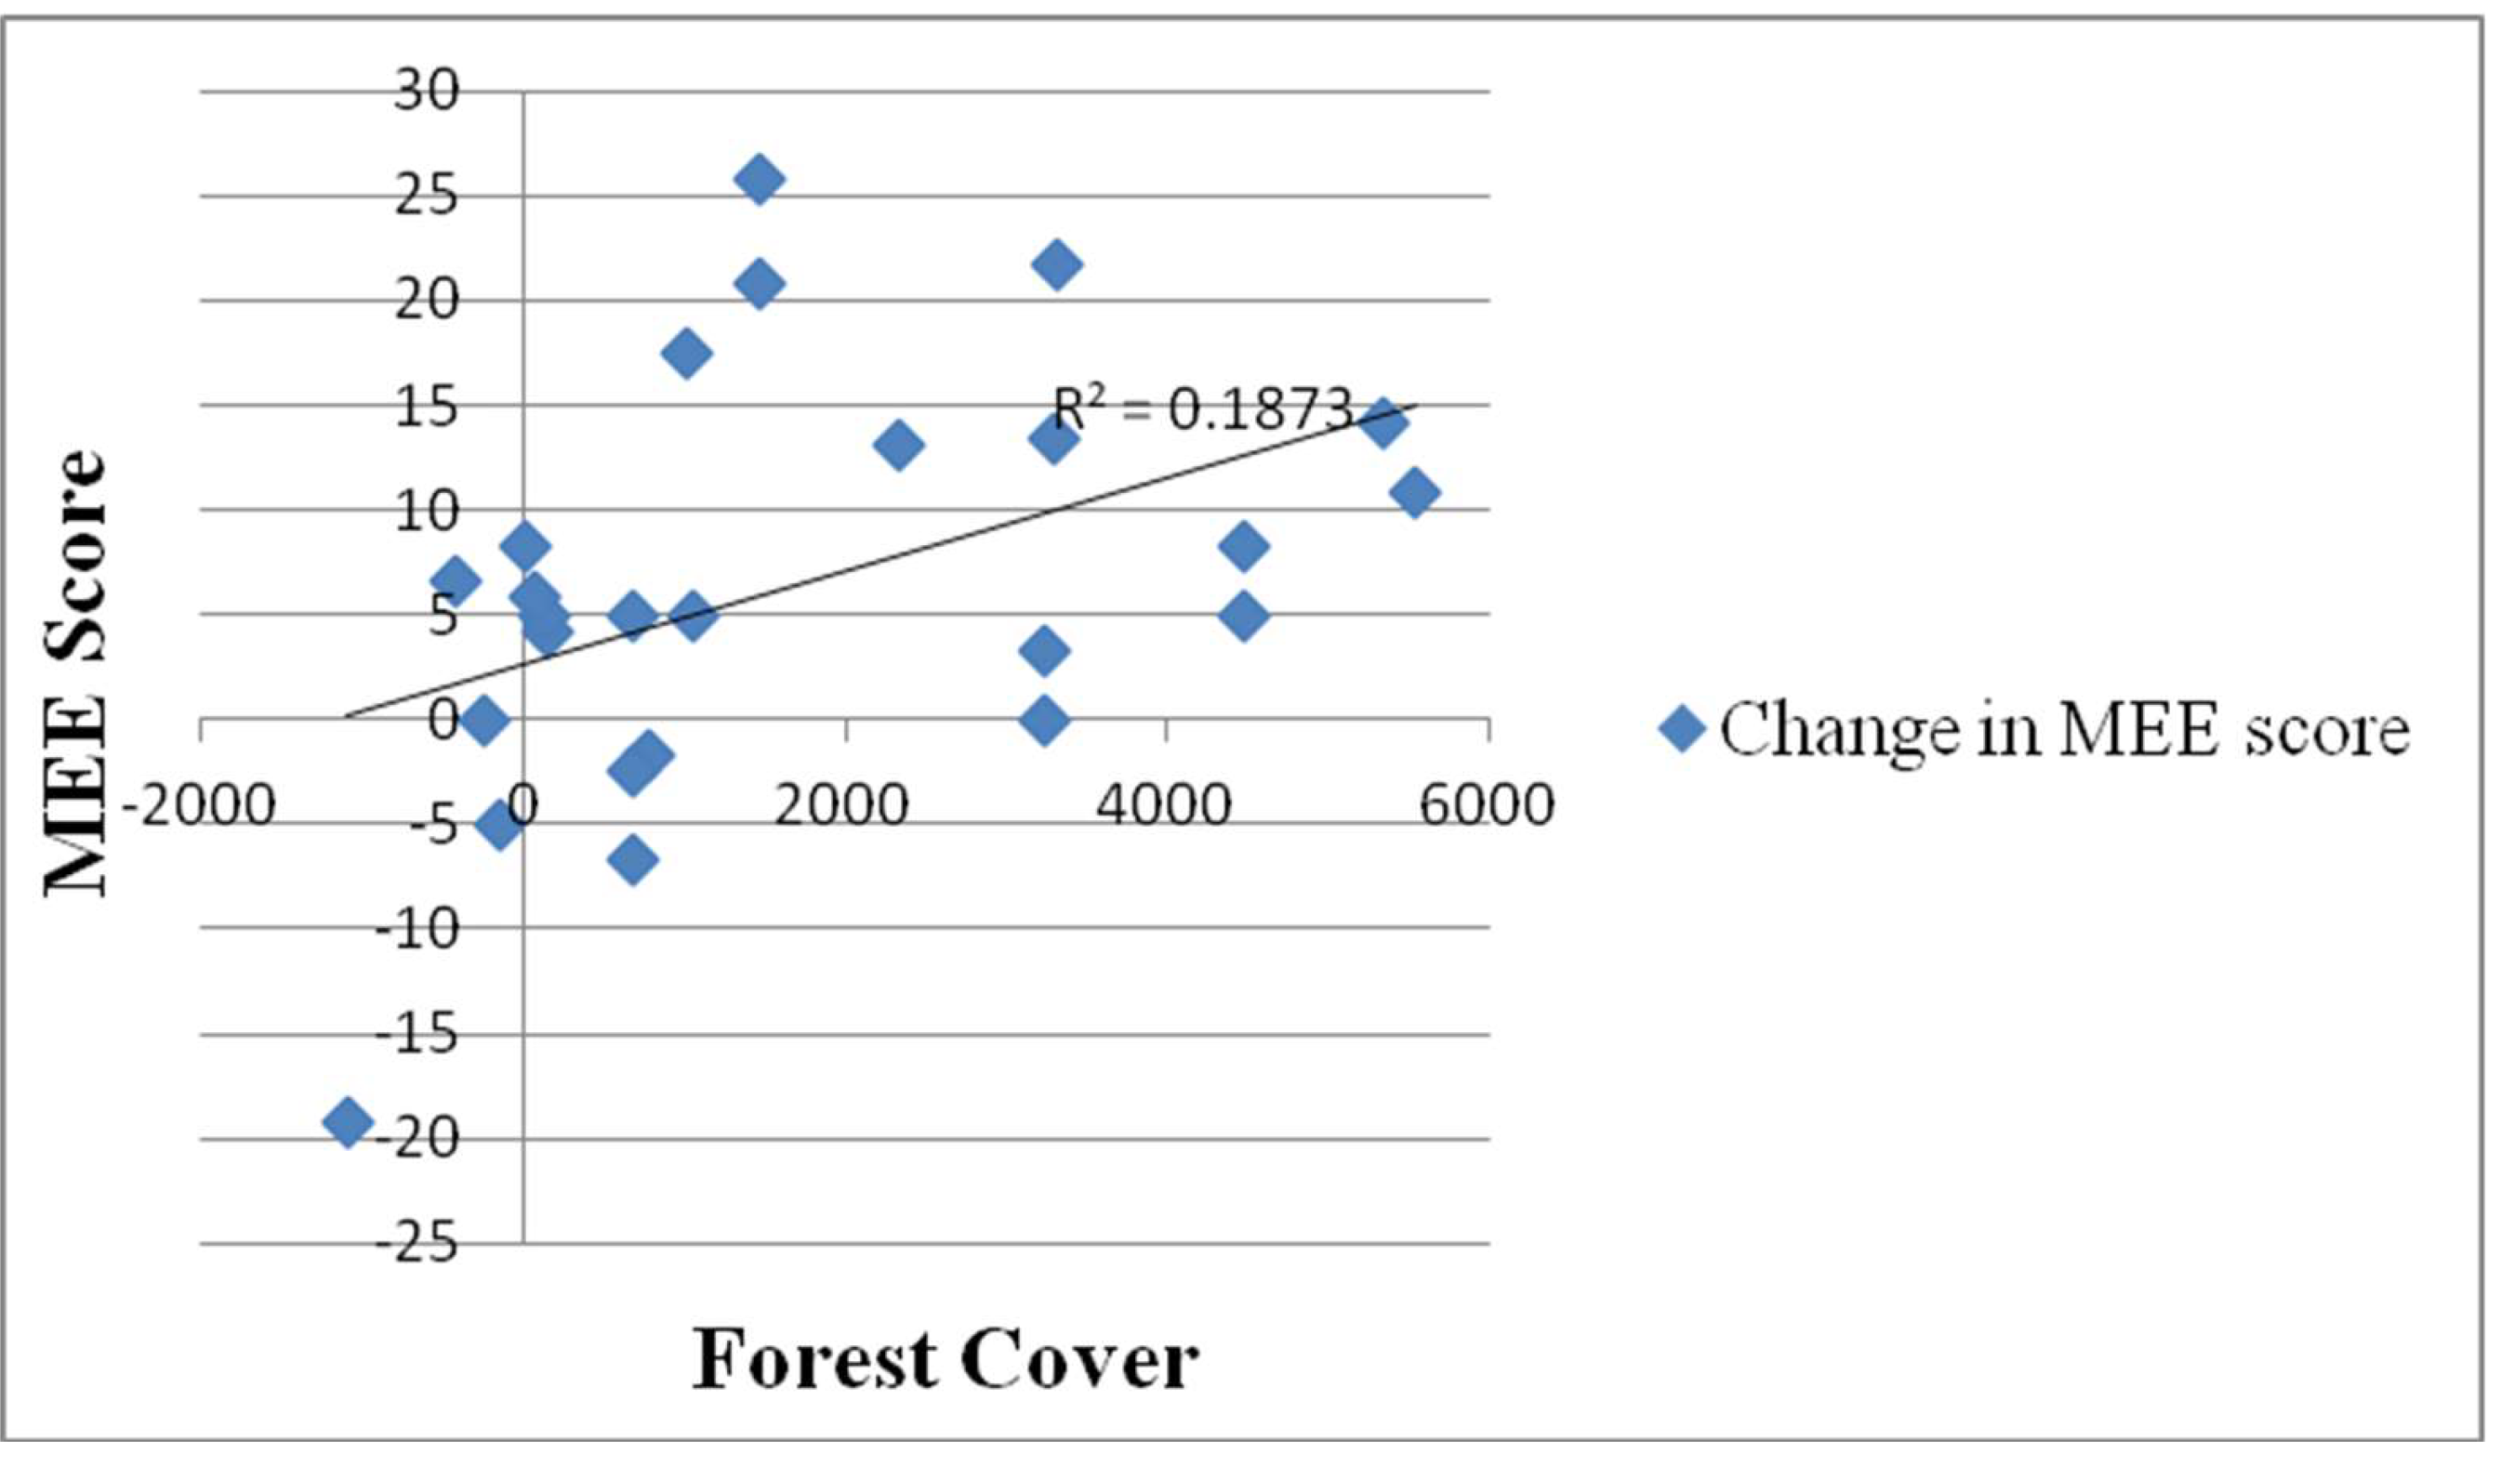
Figure 3.
Average performance analysis of the 6 elements of MEE.
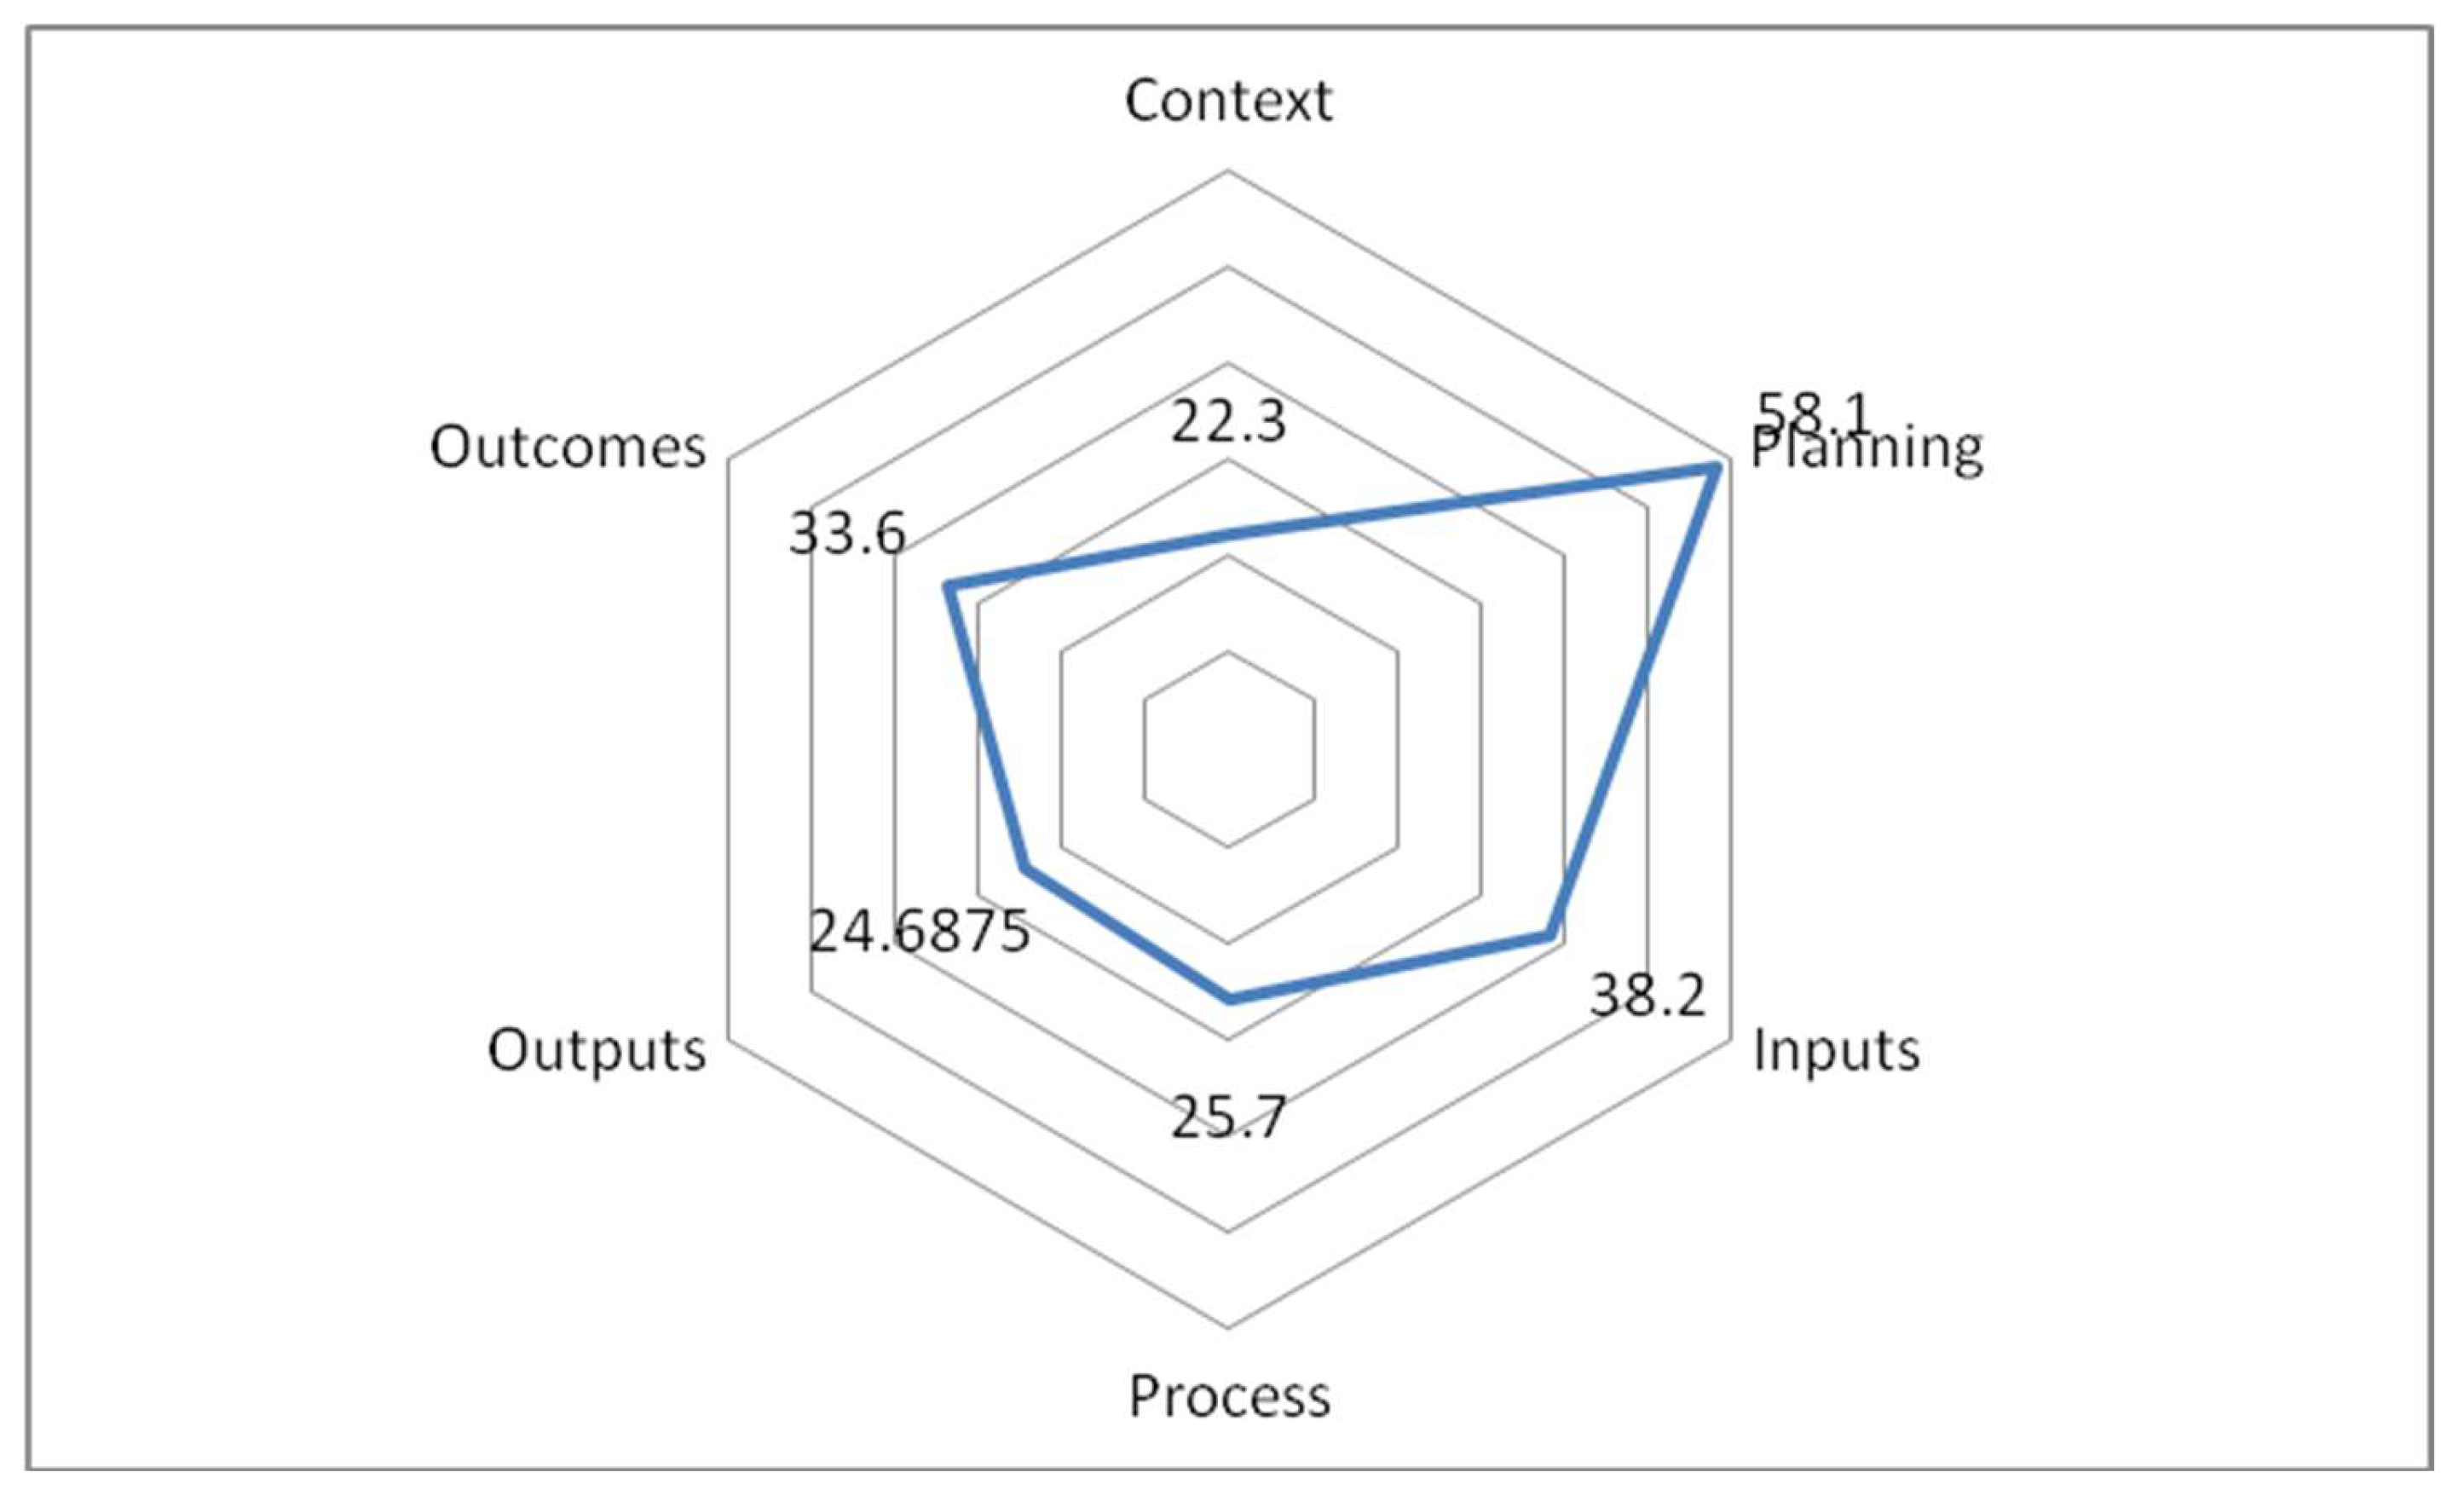
Figure 4.
Correlation of Change in a score of 3 main MEE elements with change in forest cover.
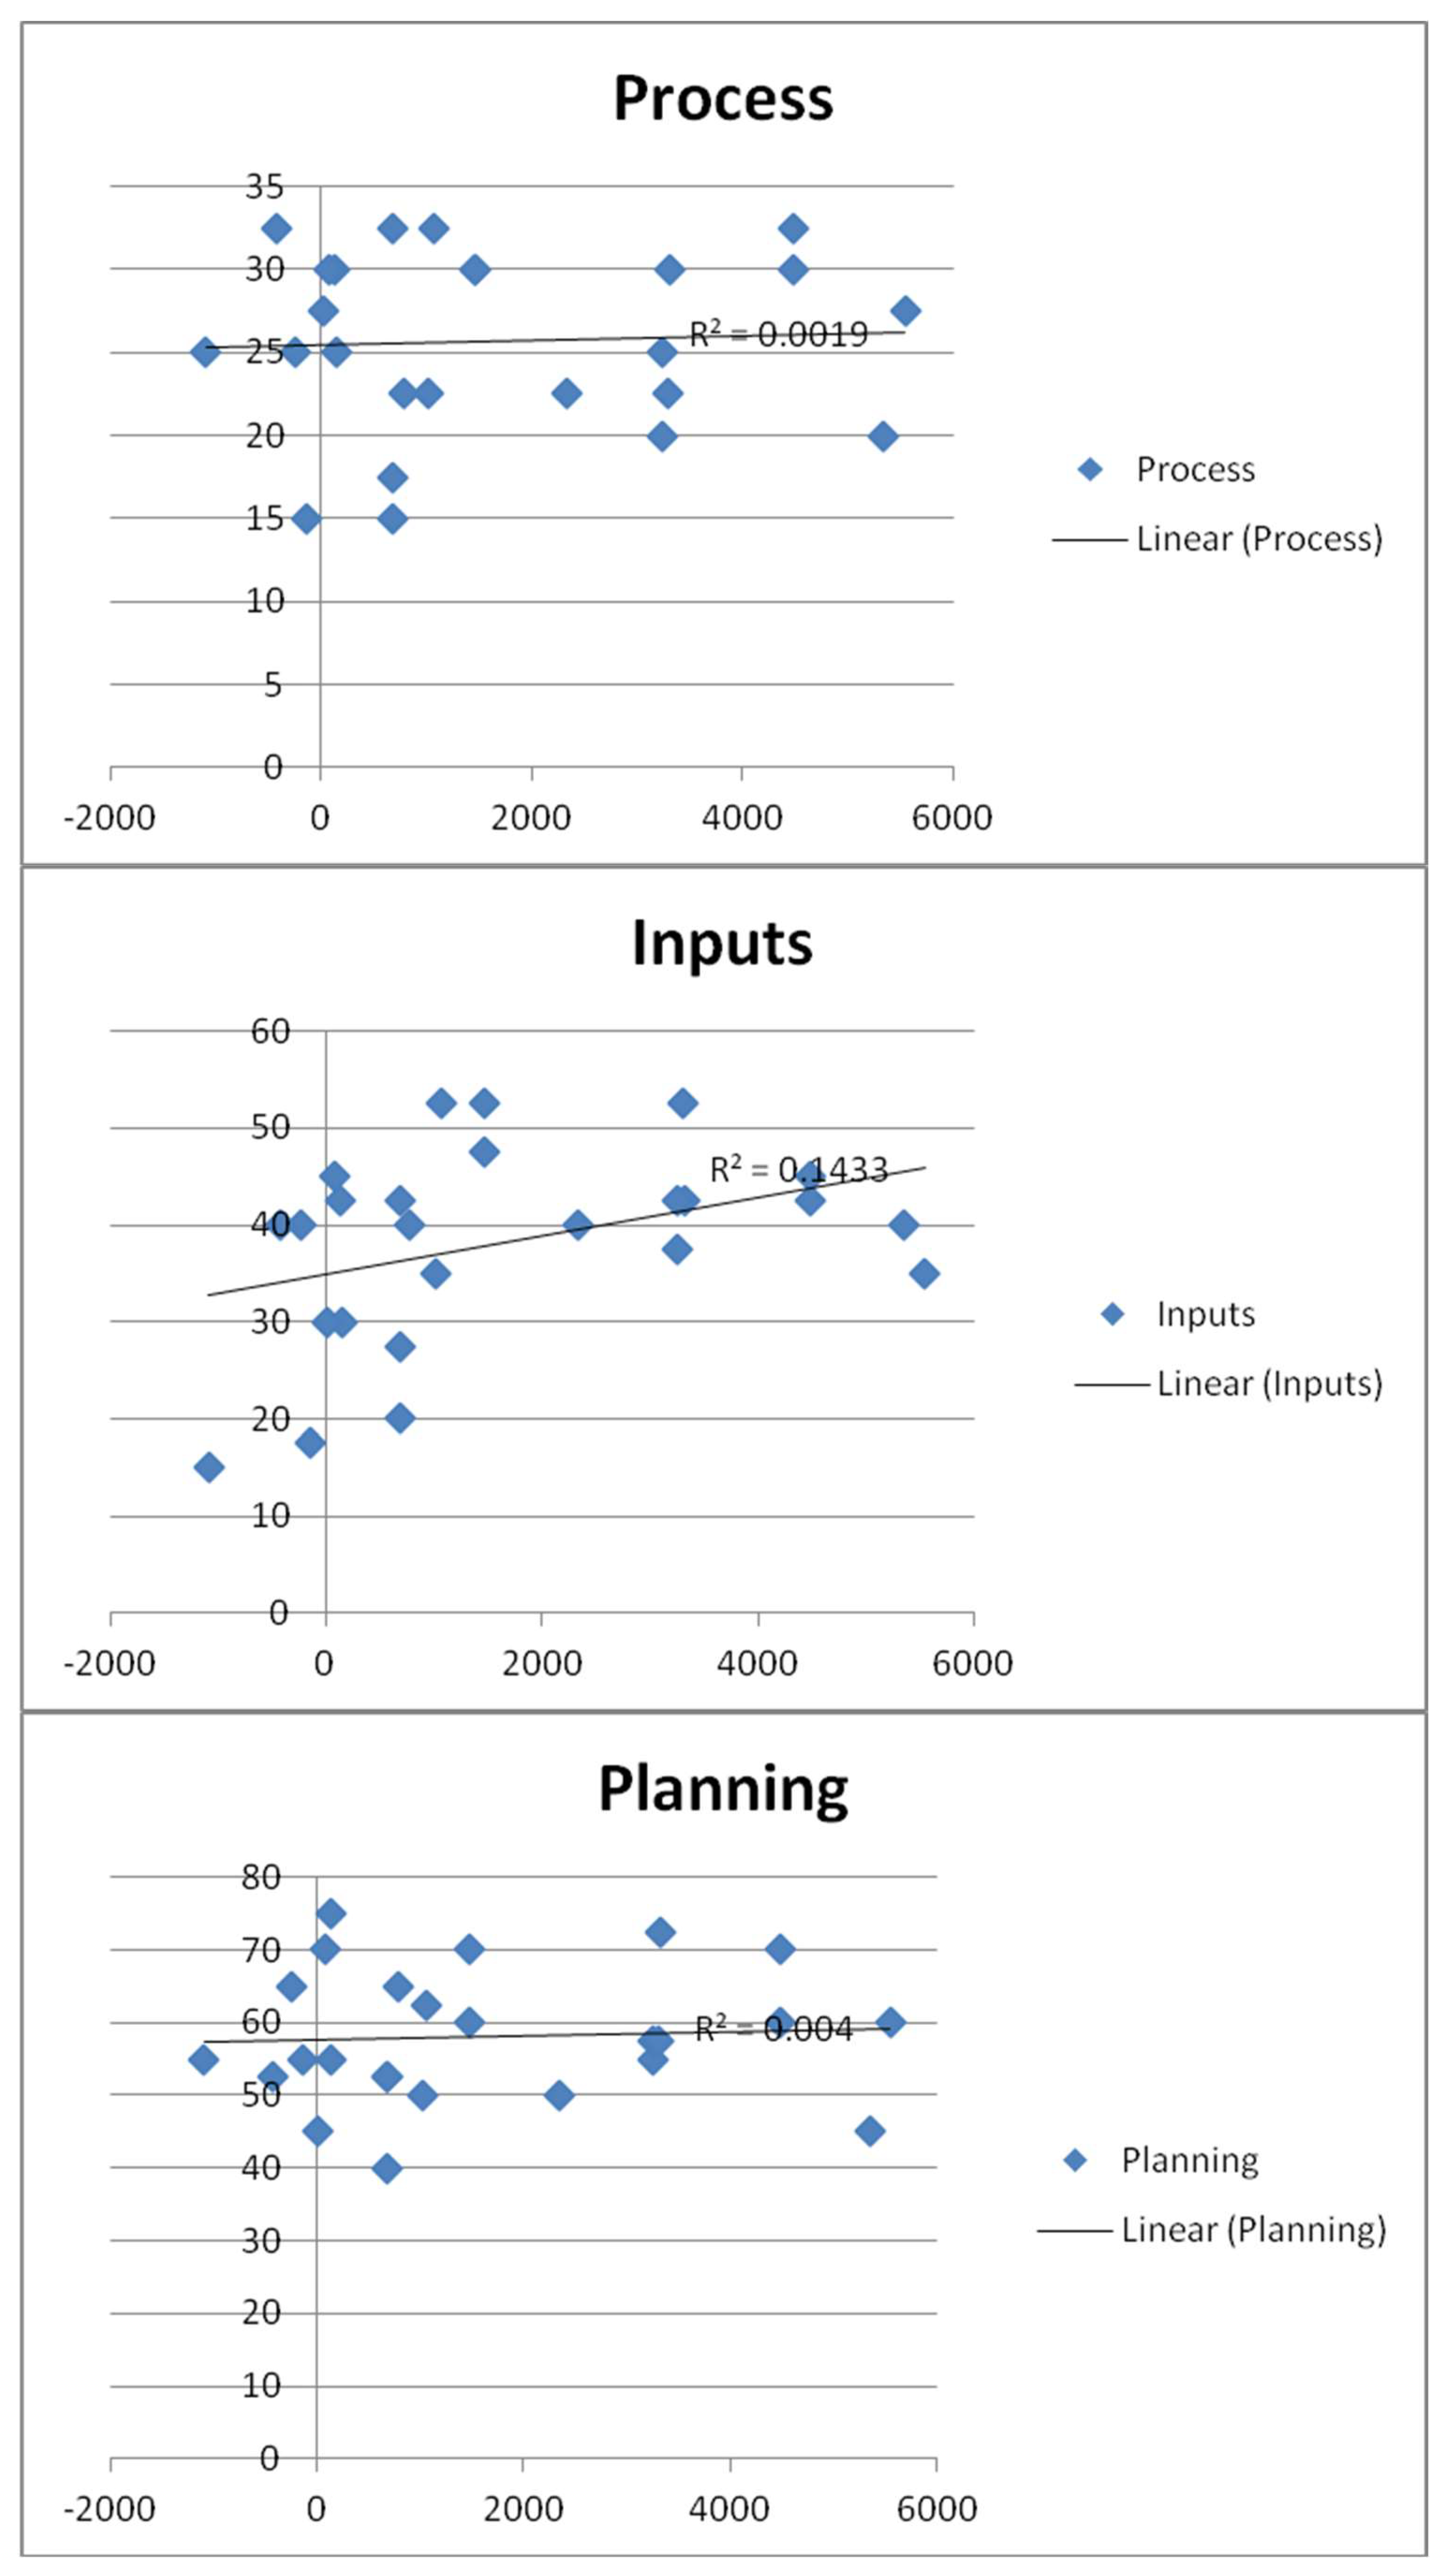
Figure 5.
Results for each MEE element in the forest cover change categories. There is a statistical difference in input between areas having high increases and decreases in forest cover.
Figure 5.
Results for each MEE element in the forest cover change categories. There is a statistical difference in input between areas having high increases and decreases in forest cover.
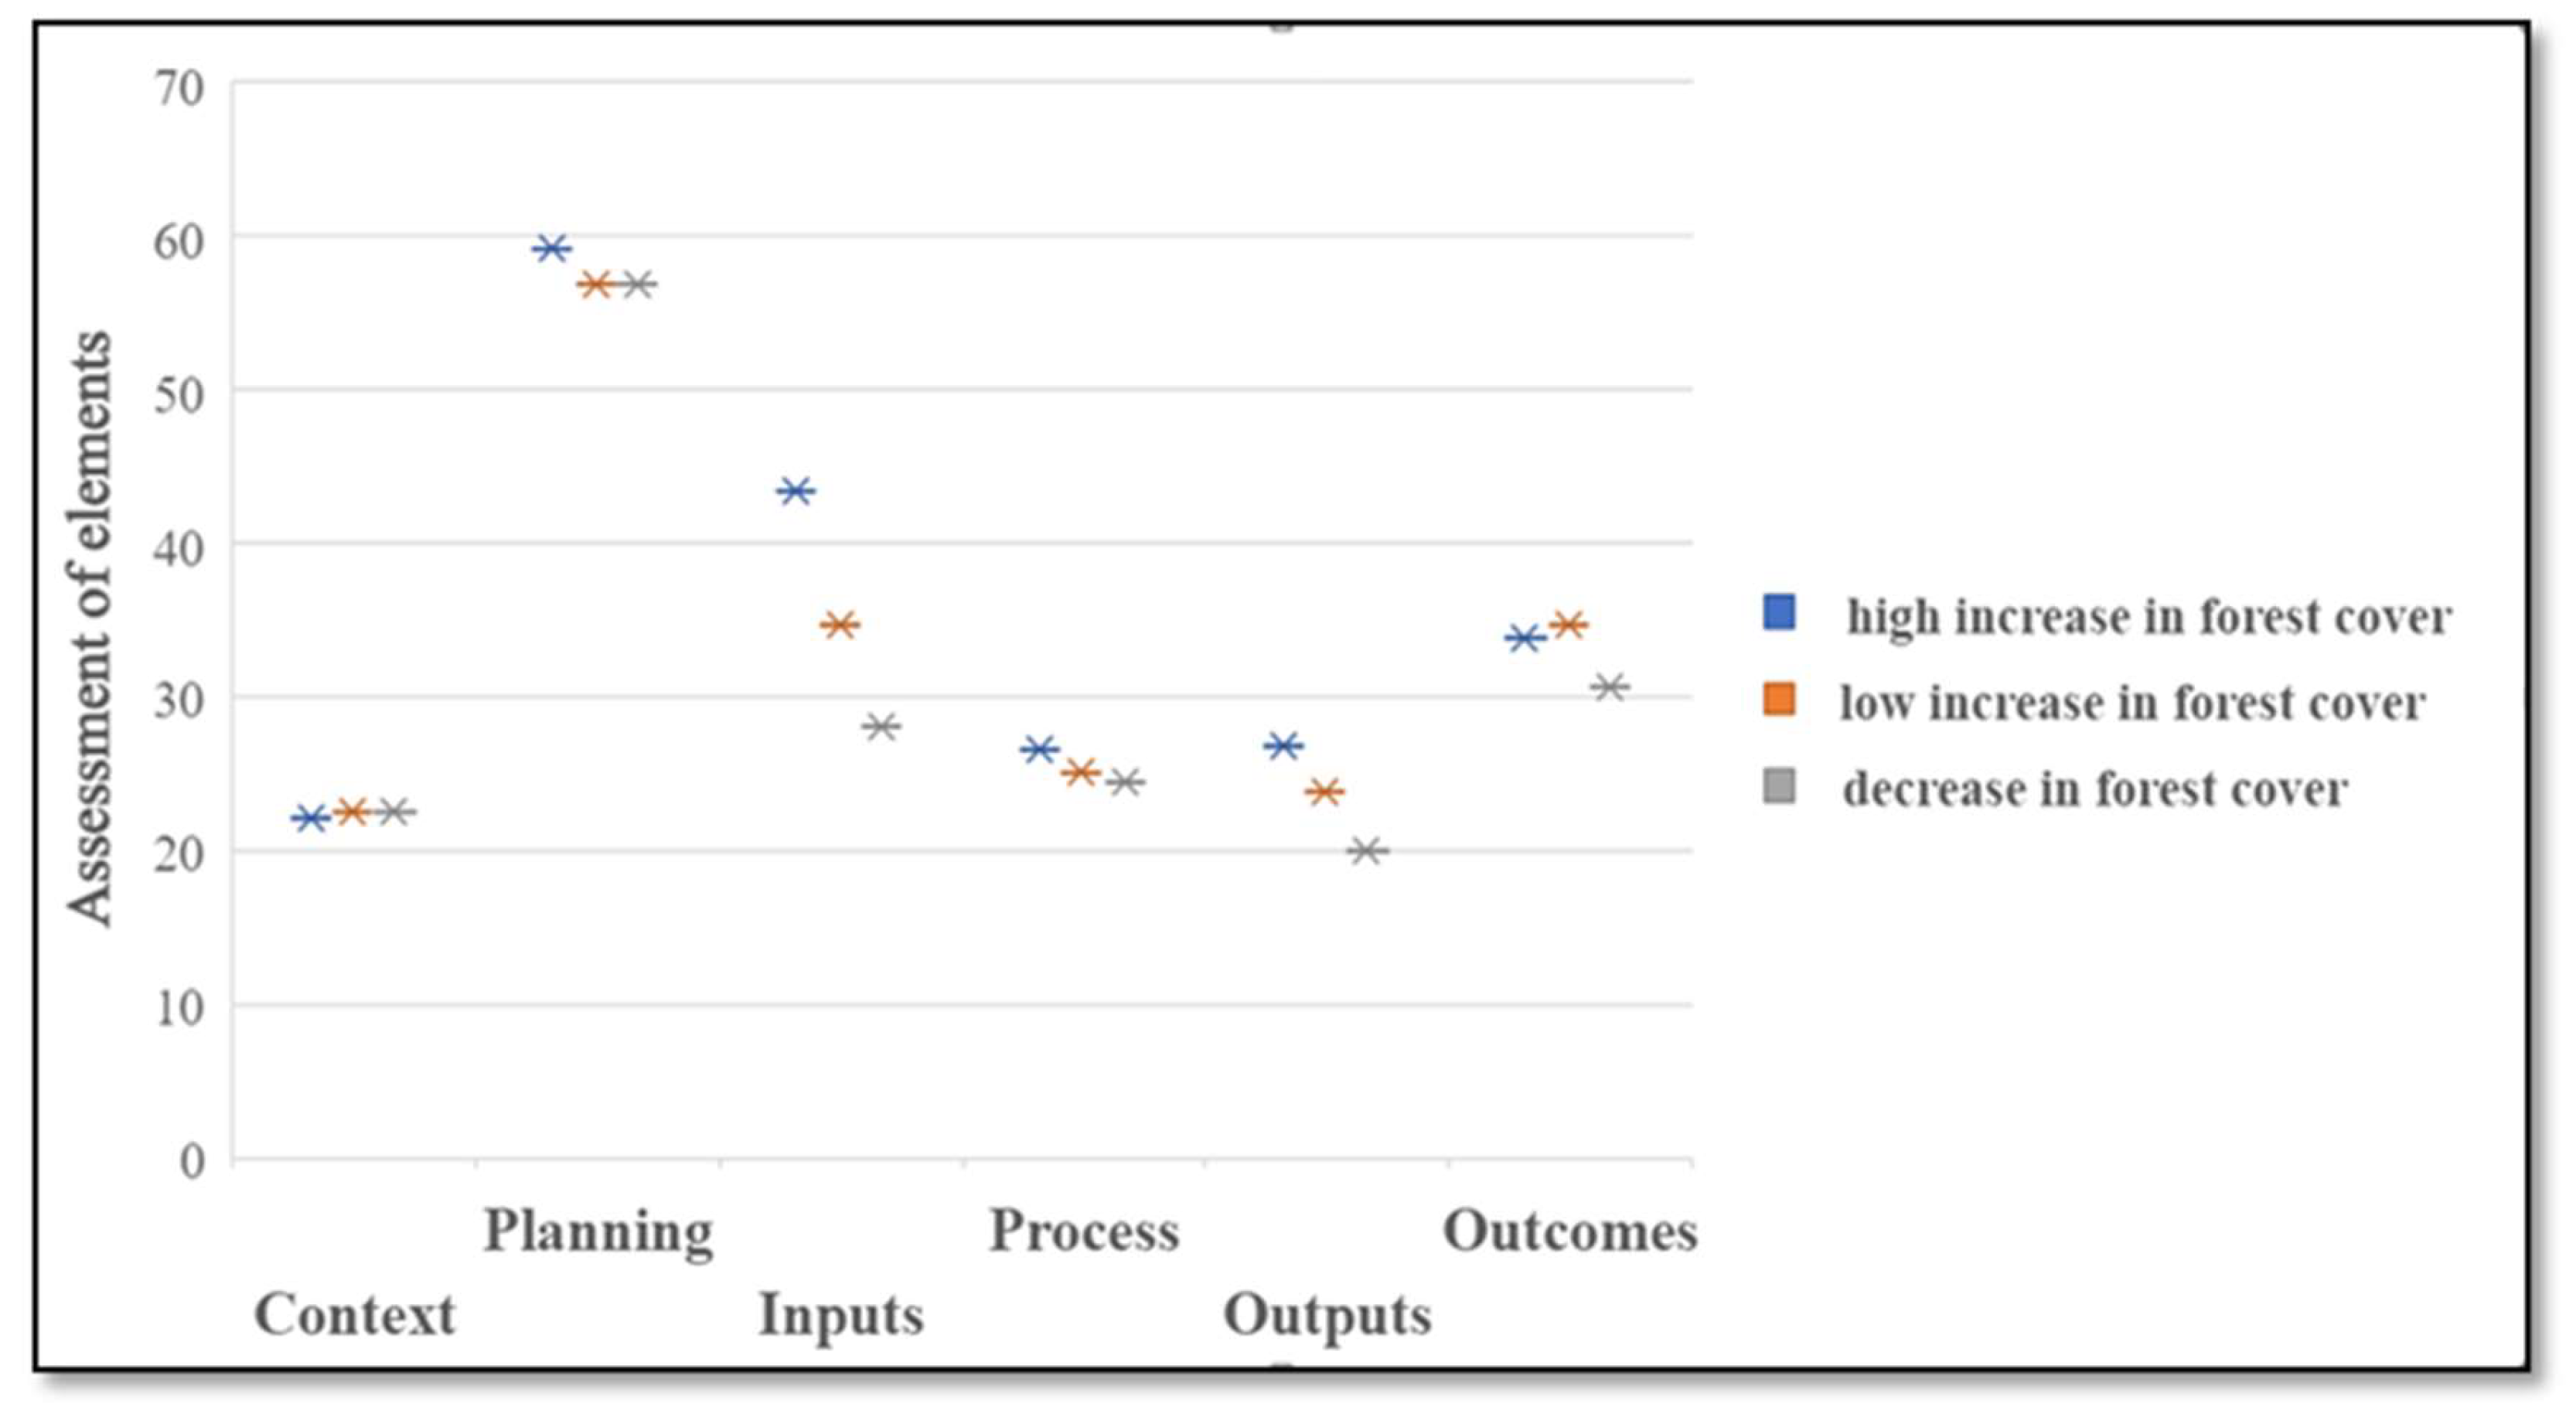
Table 1.
Protected area categories in India.
| Indian PA category | Management type | IUCN category equivalence | Governance type |
|---|---|---|---|
| National Park | Strictly protected with prohibitions imposed | Category Ia, II | Government controlled |
| Wildlife Sanctuary | Protected with certain relaxations to community | Category Ib, IV | Government controlled |
| Conservation Reserve | Conserved with acknowledged community rights | Category V | Mixed control with community involvement |
| Community Reserve | Conservation based on sustainable use of resource | Category VI | Community controlled |
| Indian Wildlife PAs do not have any category similar to IUCN Category III | |||
Table 2.
Total number of Protected Areas evaluated through MEE exercise in India.
| 1 | Total number of PA (NP + WLS) | 670 |
|---|---|---|
| 2 | PAs being managed as parts of Tiger Reserve | 117 |
| 3 | Coastal/ Marine PAs of Andaman & Nicobar Islands | 102 |
| 4 | PAs (NP + WLS) covered under MEE | 451 |
| 5 | Actually evaluated PAs (NP + WLS) in four phases from 2006 to 2019 |
442 |
| 7 | PAs (NP + WLS) having repeat evaluation | 25 |
Table 3.
Comparative performance of management of PAs as per the MEE score from 2006 to 2018-19.
| State | Name of PAs | 2006 Score | 2018-19 Score | Status of change in score |
|---|---|---|---|---|
| Himachal Pradesh | Great Himalayan NP | 79.17 | 84.17 | Increase |
| Jammu & Kashmir | Kishtwar NP | 46.67 | 59.82 | Increase |
| Uttar Pradesh | National Chambal WLS | 54.17 | 59.17 | Increase |
| Uttar Pradesh | Sohelwa WLS | 49.17 | 42.50 | Decrease |
| Uttarakhand | Govind NP | 53.33 | 48.33 | Decrease |
| Andhra Pradesh | Papikonda NP | 45.83 | 60.00 | Increase |
| Kerala | Wayanad WLS | 58.33 | 69.17 | Increase |
| Tamil Nadu | Gulf of Mannar Marine NP | 57.50 | 79.17 | Increase |
| Jharkhand | Mahuadanr Wolf WLS | 43.33 | 60.83 | Increase |
| Odisha | Bhitarkanika WLS | 70.00 | 70.00 | No change |
| Odisha | Sunabeda WLS | 58.33 | 61.67 | Increase |
| West Bengal | Jaldapara NP | 75.83 | 80.83 | Increase |
| West Bengal | Mahananda WLS | 63.33 | 71.67 | Increase |
| Gujarat | Barda WLS | 55.83 | 60.00 | Increase |
| Madhya Pradesh | Kuno WLS | 58.33 | 79.17 | Increase |
| Madhya Pradesh | Madhav NP | 50.83 | 76.67 | Increase |
| Maharashtra | Sanjay Gandhi NP | 62.50 | 75.86 | Increase |
| Rajasthan | Keoladeo Ghana NP | 76.67 | 75.00 | Decrease |
| Arunachal Pradesh | Sessa Orchid WLS | 71.67 | 52.50 | Decrease |
| Assam | Pabitora WLS | 76.67 | 74.17 | Decrease |
| Manipur | Keibul-Lamjao NP | 73.33 | 73.33 | No change |
| Meghalaya | Nongkhyllem WLS | 74.17 | 79.17 | Increase |
| Sikkim | Khangchendzonga NP | 71.67 | 77.59 | Increase |
| Tripura | Sepahijala WLS | 67.50 | 74.11 | Increase |
| Haryana | Sultanpur NP | 55.83 | 64.17 | Increase |
Table 4.
Change in total forest cover in two years.
| State |
Forest Cover in 2006 (sq. km.) |
Forest Cover in 2019 (sq. km.) | Change in Forest Cover (sq. km.) |
|---|---|---|---|
| Himachal Pradesh | 14369 | 15433.52 | 1064.52 |
| Jammu & Kashmir | 21273 | 23611.89 | 2338.89 |
| Uttar Pradesh | 14127 | 14805.65 | 678.65 |
| Uttarakhand | 24442 | 24303.04 | -138.96 |
| Andhra Pradesh | 44372 | 49719.71 | 5347.71 |
| Kerala | 15595 | 21144.29 | 5549.29 |
| Tamil Nadu | 23044 | 26364.02 | 3320.02 |
| Jharkhand | 22591 | 23611.41 | 1020.41 |
| Odisha | 48374 | 51618.51 | 3244.51 |
| West Bengal | 12413 | 16901.51 | 4488.51 |
| Gujarat | 14715 | 14857.33 | 142.33 |
| Madhya Pradesh | 76013 | 77482.49 | 1469.49 |
| Maharashtra | 47476 | 50777.56 | 3301.56 |
| Rajasthan | 15850 | 16629.51 | 779.51 |
| Arunachal Pradesh | 67777 | 66687.78 | -1089.22 |
| Assam | 27645 | 28326.51 | 681.51 |
| Manipur | 17086 | 16846.9 | -239.1 |
| Meghalaya | 16988 | 17118.79 | 130.79 |
| Sikkim | 3262 | 3342.49 | 80.49 |
| Tripura | 8155 | 7725.59 | -429.41 |
| Haryana | 1587 | 1602.44 | 15.44 |
| Total | 688081 | 729719.1 | 41638.1 |
Disclaimer/Publisher’s Note: The statements, opinions and data contained in all publications are solely those of the individual author(s) and contributor(s) and not of MDPI and/or the editor(s). MDPI and/or the editor(s) disclaim responsibility for any injury to people or property resulting from any ideas, methods, instructions or products referred to in the content. |
© 2024 by the authors. Licensee MDPI, Basel, Switzerland. This article is an open access article distributed under the terms and conditions of the Creative Commons Attribution (CC BY) license (http://creativecommons.org/licenses/by/4.0/).
Copyright: This open access article is published under a Creative Commons CC BY 4.0 license, which permit the free download, distribution, and reuse, provided that the author and preprint are cited in any reuse.


