
Submitted:
13 May 2024
Posted:
14 May 2024
You are already at the latest version
Abstract
This study investigates the petroleum potential of the Middle Jurassic Khatatba Formation (Fm) in the Matruh Basin, northwestern Egypt. This formation shows in situ dual source and reservoir characteristics, where alternations of fine and coarse clastics were deposited during semi-arid and semi-humid conditions due to climate changes and Tethyan sea level fluctuations. The organic-rich shales and argillaceous siltstones are fair to very good/excellent (TOCm wt%: 0.91–3.07) source rocks. They are rich in late mature to early postmature mostly gas-prone organic facies C, which sourced the juxtaposing intraformational coarse clastics of the Lower Safa Member with gas and condensates. The source rocks show poor to fair gas generation potential (S2: 0.38–1.96, mg HC/g rock). The middle part of the Lower Safa Member shows excellent organic richness (TOCm wt%: 5.39 and 22.90) of early postmature gas-prone carbonaceous material and coal deposits. These coaly shale layers exhibit fair to excellent wet gas and condensate generation potential (S2: 4.51–27.43, mg HC/g rock). Maturation of the source rocks was related to the Late Jurassic–Early Cretaceous Tethyan rifting. The onset of oil generation occurred in the Early Cretaceous (~ 116 Ma ago), while the onset of gas generation occurred in the Oligocene (~ 24 Ma ago). Shales of the Lower Cretaceous Alam El Bueib Fm are primary sealing rocks, while carbonates and shales of the Khatatba Fm are secondary sealing rocks. Trap types are structural, formed during the Late Jurassic and Early Cretaceous rifting of the Matruh Basin. Sandstones of the Upper Safa Member show upward increases in kaolinite and exhibit low-quality tight sandstone reservoirs. The Lower Safa Member sandstones show better gas reservoir quality with lower shale volumes. Operationally, the Lower Safa sandstone reservoirs in the Imhotep W-1X well are not suitable for gas production because they are ductile and show a high decline in production and pressure. Overall, the petroleum system of the Khatatba Fm shows mainly fair hydrocarbon potential in the study area.
Keywords:
organic/inorganic geochemistry
; organic petrography
; petroleum system
; geomechanics
; burial history
; Khatatba Formation
; Matruh Basin
; Egypt
1. Introduction
The Matruh Basin holds about 23 BBOE of known oil and about 3 TCF of gas reserves [1]. The main Mesozoic source rocks in the Matruh Basin are the Middle Jurassic Khatatba, the Lower Cretaceous Alam El Bueib, and the Upper Cretaceous “G” Member of the Abu Roash formations [2,3,4,5]. The main Mesozoic hydrocarbon reservoir rocks in the Matruh Basin are the sandstones of the Khatatba and Alam El Bueib, the Aptian Alamein Dolomites, sandstones of the Albian Kharita and lower Cenomanian Bahariya, and the “G” Member of the Abu Roash formations [4,6].
The petroleum system of Matruh Basin is proved to generate oil and gas [7,8]. The Imhotep prospect lies on a series of N–NE trending ridges and faults, which is the primary structural trend for the discoveries in this area. [9] studied a thick carbonate section (390 m) with only a few shale horizons of the Khatatba Formation in northeast Matruh Basin through the Abu Tunis-1X well. This formation was found to be a reservoir rock containing migrated hydrocarbons and NSO compounds. [3] studied the hydrocarbon source potential of the Khatatba Formation through the OBA 2-2A well at southern Matruh. They suggested that the intraformational shale and partly calcareous shale units of the Upper Safa Member are active, fair to excellent mature shale gas play with a total thickness of 120 m. [10] modeled the Middle Jurassic Khatatba Formation for hydrocarbon source rock potential in the Matruh Basin using geological and geochemical data from the Apidose-1X well. The constructed models indicate that the Khatatba Formation acts as an effective oil and gas source rocks, where oil generation started in the Early Cretaceous and gas generation started in the Oligocene. They concluded that the Matruh Basin includes all elements of the petroleum system, where the generation, migration, and accumulation began in the Early Cretaceous, with hydrocarbons charging traps occurred during the rifting phases. Moreover, [11] investigated the depositional environment and paleoclimate of the Khatatba Formation in Matruh Field using organic and inorganic data from two wells (Matruh-5 and Matruh-6). [11] studied the provenance and sedimentation conditions responsible for the accumulation of the Middle Jurassic source rock deposits using elemental data. She interpreted the Khatatba Formation source rocks were formed during the sea regression and concluded that the Upper and Lower Safa members are the most significant source rocks in the Matruh Field. It formed during the sea-regression period and resulted in the deposition of shallow marine sediments.
Based on the introduction provided above, it is obvious that the Khatatba Formation contains different important source and reservoir rocks with varying quality and thickness across different parts of the Matruh Basin. This shows the need to carry out more detailed and integrated studies in different hydrocarbon prospect areas before initiating exploration and production activities in unstudied and/or underexplored concession areas. Thus, the objectives of this work are to identify the hydrocarbon potential of the Khatatba Formation in the Imhotep Field, Matruh Basin using multi approach analyses. This is addressed by carrying out integrated organic/inorganic geochemical, organic petrographic, geomechanical, and burial history analyses of the formation under study. To the best of our knowledge, the present work is the first work on the Khatatba Formation source using multi approaches in Imhotep Field.
2. Geological Setting and Lithostratigraphy
The geological history and setting of the northwestern Desert of Egypt, reflect in part the tectonostratigraphic evolution of the Unstable Shelf, which represents the northeastern part of the African Craton (Figure 1). The Western Desert’s hydrocarbon occurrence is closely related to past tectonic and stratigraphic events, which made many source, reservoir, and seal combinations. According to [1], the northern part of Egypt experienced three different tectonic events. The first event made the NW or WNW fault trend during the Paleozoic–Early Mesozoic (Triassic). The second event occurred during the Late Mesozoic (Cretaceous) and formed the ENE Syrian Arc System, which is made of a series of faulted anticlines of different dips and directions. Finally, the third tectonic event developed throughout the Early Cenozoic (late Eocene and early Oligocene) and created the NW Gulf of Suez and NNE Aqaba fault trends. Various geological studies dealt with the tectonic framework, stratigraphy, facies distribution, and development of sedimentary basins in the north-western Desert, e.g., [3,5,12,13,14,15,16,17]
The deposition of the sedimentary succession in the Matruh Basin was governed by the regional tectonics related to the drift of the African plate and rifting of the Tethyan Ocean. This resulted in accumulation of thick sedimentary successions, which are separated into four main depositional sequences “DSQ” (Figure 2). The studied Khatatba Formation in the Imhotep W-1X well is characterized from the base to the top by clastics of the Lower Safa and Upper Safa members, where the carbonates of the Kabrit Member act as a separating thick bed. The carbonates of the Zahra Member represent the uppermost part of the Khatatba Formation.
3. Methodology and Analyses
3.1. Samples
A total number of 14 samples was offered by the Egyptian General Petroleum Corporation (EGPC) for the current study. The source rock intervals are picked from the fine deposits that give high gamma-ray (GR) responses on the electrical log, while the reservoir intervals are picked from coarse deposits that give low GR log responses. To interpret the main lithology of the picked samples, a correction of the depth shift between the electrical and mud logs has been done to allow assessing the source and reservoir potential of the Khatatba Formation. Samples were limited up to 14 samples per well for the studied formation, because they were offered free of charge to academics. The samples were selected at different levels of the Khatatba Formation to be representative of different lithologies (shale, sandstone, carbonates), which reflect the changes in the depositional environment. We were keen to select samples from fine deposits representing potential source rocks and from coarse deposits representing potential reservoir rocks to be able to assess their source/reservoir potential in another research project. In the meantime, palynologically productive samples (not pure sandstones/carbonates) were selected to complement the inorganic geochemical and petrographic analyses with organic petrographic analysis (i.e., based on organic matter) for a better interpretation of the depositional environments.
3.2. Clay Fraction X-Ray Diffraction (XRD) Analysis
The clay fractions extracted from three specific samples (1, 9, and 11) that represent the Lower and Upper Safa members were analyzed using X-ray diffraction (XRD) to accurately determine the mineral composition. The analysis was conducted at the Central Metallurgical Research Institute (CMRDI) Central Laboratory Sector using an automated powder diffractometer system of Philips type Pan Alytica X-pert-pro. The interpretation was conducted with APD and PDF software, which incorporate powder diffraction and PDf-2 Database Sets 1–45. Following [20,21,22]. A detailed procedures of samples preparation for Clay fraction X-Ray diffraction is illustrated in an online supplementary to provide full information of methodology (Appendix 1, p. 1, Online Supplementary).
3.3. Vitrinite Preparation and Organic Petrography under Reflected White Light (RWL) Microscopy
The preparation and measurements of vitrinite reflectance have been conducted on Sample 7 (Depth: 4614.1m) at the Advanced Technology Center, Core Laboratories, located in Houston, TX, United States. Fifty vitrinite reflectance measurements (Ro, r%) were randomly collected on primary vitrinite using a ×50 oil immersion objective with a refractive index (noil) of 1.514 at a temperature of 23 °C. Representative particles were captured by photomicrographs using a digital camera. The categorization of palynomacerals into vitrinite and liptinite macerals using TWL microscopy was conducted according to the ICCP System [23,24]. More details about the sample preparation for vitrinite reflectance measurements are illustrated in the online supplementary Appendix 2.
3.4. TOC Delta log R Calculations from Well Log
[25] described the resistivity-porosity overlay approach used to determine the TOC. The displayed curves are arranged in a manner that results in their alignment in the non-source area. The interval between these curves is often known as the delta log R and is utilized for the identification of intervals rich in organic matter (Figure 3). The calculation of organic richness may be performed by employing a combination of resistivity and one of the porosity logs, such as sonic, density, or neutron. In the present investigation, the baseline value for ΔT was determined to be 77.826 μs/ft, whereas the baseline value for resistivity was established as 5.7148 ohmm. The method of overlaying curves may also be used for neutron and density logs. Nevertheless, the utilization of sonic technology is recommended due to its superior capability for in-depth investigation and its reduced susceptibility to the influence of well conditions. The total organic carbon (TOC) for the well within the depth range of 4305 m to 4786 m was calculated using (Equations. 1, 2, and 3).


The value of constant C was modified to TOC=∆ log Rꭓ 10 (2.297-0.15*9). The three porosity logs, sonic, neutron, density, were tested but in the current study, the resistivity-sonic overlay was used for the computation of TOC as illustrated in (Equation4) as follows:
Where; ∆ log R is function of maturity and TOC as shown in (Equation 5)

Where: ∆ log R is the separation measured in the logarithmic resistivity cycle, R is the resistivity measured in ohm-m by the logging tool, Rbaseline is the resistivity corresponding to the ∆tbaseline values when the curves are base-lined in non-source, clay-rich rocks, as in Zahra Member (Figure 3A) and Lower Safa Member (Figure 3B), and C is the constant (ratio between scales of the resistivity and sonic log) = 0.02. The LOM is the level of maturity calculated from VRo data using the Henderson petrophysics conversion graph, to be 11.2 as illustrated in (Figure 3C).
3.5. Rock Geomechanics
The estimation of rock mechanical characteristics serves to characterize the quality, strength, and occasionally the potential of a certain rock. The estimation of mechanical rock parameters, such as Poisson's ratio (PR) and Young's modulus (YM), is often derived from well logs, which are subsequently calibrated with core data if such data is accessible. Shale brittleness is among the outcomes derived from geomechanical studies. Shale intervals characterized by elevated brittleness levels are optimal locations for identifying hydraulic fracture initiation. The incorporation of the geomechanical model has the potential to enhance the efficacy of brittleness as well as facilitate the optimization of various parameters such as the selection of perforation intervals, fracture pressure, and geometry. To start the geomechanical analysis, the datasets for density, porosity, compressional, slowness (DTC, DTS), and volume of shale were first evaluated and checked for quality. If the DTS log was not available, it is possible to generate a synthetic log by utilizing the equations outlined in the workflow diagram (Figure 4). The vertical P-wave velocity (VP) and vertical S-wave velocity (VS) were determined by calculating the compressional wave velocity (DTC) and shear wave velocity (DTS) accordingly. The VP/VS ratio was computed and denoted as VPVS. The calculation of Poisson's ratio is performed using the equation described in (Figure 4) and the computation of shear and bulk moduli was performed as well. The calculation of Young's modulus involved the utilization of two equations as illustrated in (Figure 4) for the purpose of validation.
According to [27], the concept of brittleness may be understood as a function of two key rock properties: Poisson's ratio (PR) and Young's modulus (YM). The measure of rock brittleness takes into account both PR and YM, providing an indication of the rock's susceptibility to fail. The formation's brittleness increases as the YM value increases and the PR value decreases. As a result, the formation experiences increased fracturing and reduced stress, with a corresponding rise in brittleness. In contrast, the ductile shale intervals exhibit more plasticity and need elevated pressure levels for fracturing to occur. When a rock's ductile behavior is more pronounced than its elastic behavior, it is considered to be ductile because it can absorb a significant amount of energy before rupturing. On the other hand, [28] noted that rocks with brittle characteristics exhibit a wider range of elastic behavior and a narrower range of ductile behavior.
Shale reservoirs often exhibit a large content of organic matter, few holes and gaps, and high capillary pressure, shale acts as a source, a reservoir, and a seal in a shale gas system [29]. Shale gas reservoirs may be deemed suitable for commercial exploitation when they possess a brittleness index, namely a quartz content of over 40%, since this facilitates more effective fracturing [30]. [31] suggested that this gas can stick to both organic matter and mineral grains inside shale formations. This keeps the gas inside the pores, cracks, fissures, and joints of the shale. Hence, it can be observed that wells that achieve success share a common attribute, wherein their gas production is reliant on their capacity to penetrate a structured network of fractures.
3.6. Basin Modelling
The dataset comprises composite logs and electric well logs obtained from the Imhotep W-1X well located in the Matruh Basin. The composite logs were utilized to obtain information on the depths, thicknesses, and nomenclature of the formations under investigation, which were then employed in the development of 1-D burial history models [32]. The electric well logs were used to obtain the bottom hole temperature (BHT) of 291 oF, which was subsequently employed in the computation of geothermal gradient to be (15.8 OF /1000 ft) and the corrected bottom hole temperature to be 309 oF, where the circulation time reached 12 hours. The accumulation of sediments in a basin is the result of the interaction between subsidence rate, sediment influx, and the height of the water column [33]. The sedimentation rate can be calculated by measuring the sedimentary succession, which was deposited over a period of time, taking into consideration the time of erosion and/or non-deposition. Therefore, the temporal deposition of each lithostratigraphic unit was included in order to determine the rate of subsidence and sedimentation throughout the course of the geological timeline (Table 1).
According to earlier studies of [10,13,34,35,36], the vitrinite reflectance measurements and the geothermal gradient calculations for the modeled well are both used to calibrate the assumed heat flow value. Unless uplift and erosion events over the course of the geological timeline have compromised the vitrinite reflectance values, the geothermal gradient values exhibit a consistent pattern of steady rise with increasing depth and burial [37].
4. Results and Interpretations
4.1. Organic Richness
Organic richness, expressed as the weight percentage of total organic carbon (TOCm wt%), is often carried out by elemental analysis or pyrolysis. The aforementioned methodology offers a dependable means of identifying certain components within the examined succession. However, it does not yield continuous data that would enable a comprehensive assessment of the entire succession. In contrast, studies made by [3,25,38,39] demonstrated that the TOC derived from the well log data offers a comprehensive range of TOC information. As a result, geochemical and geophysical methodologies were both used to determine quantitatively the organic abundance. The next sections will interpret the source potential of the Khatatba Formation in the Imhotep W-1X well, its geomechanical properties, and the elements of the petroleum system (Figure 5).
4.2. Organic Geochemistry
4.2.1. Geochemically Measured TOCm Data
According to [40] and [41], the organic richness of the intraformational shale strata in the Lower Safa Member is typically classified as fair to good, with a range of 1.05–1.59 and an average of 1.29 TOC wt%. The data indicates that Sample 4 exhibits a greater level of richness, about 5.39 TOC wt%, whereas Sample 5 demonstrates an extremely high level of richness ~ 22.90 TOC wt%. This observation may be attributed to the presence of coal layers, as seen in (Figure 5). The organic richness of the intraformational shale layers within the Upper Safa Member exhibits a range from fair to very good, with values ranging from 0.91 to 3.07 and an average TOC wt% of 1.90. It is noteworthy to highlight that samples 1–3, 6, 7, 9, 10, 12, and 13 exhibit comparatively lower levels of organic richness (0.91 to 2.01, avg. 1.4 TOC wt %) when compared to the remaining samples from the Lower and Upper Safa members. The dilution of organic matter by carbonate minerals (calcite and siderite) is ruled out here because the TOC analysis was made on acid-digested samples.
Moreover, TOC includes both reactive organic matter (kerogen type I–III) and non-reactive organic matter (kerogen type IV). The S2 parameter is used to measure how pyrolizable organic matter can generate hydrocarbons. Consequently, it serves as a more accurate indicator of the potential of source rocks [42,43]. The S2 data shows that the Lower and Upper Safa members, as well as the Zahra Member have poor petroleum generation potential (0.38 to 1.96 mg HC/g rock). The intermediate section of the Lower Safa Member, namely samples 4 and 5, has a range of petroleum generation potential from fair to excellent (4.51–27.43, avg. 15.97 mg HC/g rock). This can be attributed to the presence of coal layers in this section.
4.2.2. Well Log-Based TOCDLogR Data
Estimating the TOC from wireline logs is very useful in providing a continuous range of TOC data across the subsurface units (Deaf et al., 2022). Practically, [44] studied the Barnett Shale in west Texas and found that the Barnett Shale contains a mixture of different types of kerogen I, II, and III. The variation in the kerogen types suggests a plausible scenario involving changing depositional environments during the 25 Ma of Barnett Shale deposition. The TOC data derived from the DLogR technique showed a week-to-week correlation because of the change in depositional environment and was considered in that study to be unreliable. However, for the Khatatba Formation in the Western Desert of Egypt, using the delta log R technique for estimating TOCDLogR from wireline log was successful and showed somewhat of a 70% consistency with the measured TOC from the analyzed samples. The correlation, as presented [25] study, reveals significant correlation coefficient values for the Lower Safa (0.86) and Upper Safa (0.64) members (refer to Figure 6a). Therefore, the TOC data derived from the DLogR method is considered here to be dependable. The concordance between the geochemically measured total organic carbon (TOCm) data and the geophysically calculated TOC data obtained by the [45] approach is notably consistent just for the shale samples (Figure 6b).
Hence, the subsequent proxy serves as supplementary evidence for the organic abundance, specifically within the shale samples. The shale units of the Lower Safa, the base and top of the Upper Safa members, as shown by both geophysical proxies, have organic richness levels that range from poor to excellent. The organic richness of the shale units in the Zahra Member has a somewhat lower range, varying from fair to very good.
4.3. Kerogen Types
4.3.1. Organic Geochemistry
As with the organic richness, the kerogen types are traditionally determined by the geochemical analysis (Rock-Eval pyrolysis) of the rock samples using a plot of hydrogen index (HI) and oxygen index (OI) data on a modified [46] diagram. This method determines the average kerogen types of mixtures of organic matter deposited in deltaic and inner shelf environments [15,42]. Both OI versus HI and Tmax versus HI plots show that the Lower and Upper Safa and Zahra members of the Khatatba Formation have a gas-prone kerogen type III (Figure 7A,B). The values of the Tmax °C temperature range between 458 and 480 °C and have an average value of 471 °C (Figure 7B). This indicates that the Lower and Upper Safa, Kabrit, and Zahra members of the Khatatba Formation entered the late mature (dry gas-window) to postmature phases according to [40,41]. In terms of coal rank, the coaly Sample 5 showing a high Tmax value of 467 °C is considered to be in the low-volatile bituminous stage of coalification. Thus, this sample is prone to producing mostly dry gas [47,48] and the references therein. The geochemically determined Tmax temperature (°C) is an important indicator of the source rock maturity; however, it is occasionally afflicted by numerous factors. Samples that are organic-lean and/or affected by mineral dilution, contamination by drilling mud additives, and migration of hydrocarbons show relatively unreliable Tmax data. Hence, Tmax data must be calibrated with petrographic maturity indices such as vitrinite reflectance and spore coloration [15,41,42,49].
The relatively high OI values for the Khatatba Formation samples may be attributed to the mineral matrix effect (siderite and calcite). However, there is a weak negative correlation between OI and siderite (R2 = 0.006) and a negative correlation between OI and calcite (R2 = 0.001). This means that neither mineral has any effect on the quality of the kerogen in the Imhotep W-1X well (Figure 8A, B). Furthermore, Lab analysis by Stratochem Labs, Cairo, detects the mineral carbon (i.e., S3) at a temperature of 390 °C, whereas siderite starts to decompose and produce mineral carbon at higher temperatures of 515–519 °C [50]. The Rock-Eval 6 was programmed as a standard method to stop at a temperature of 390 °C, and thus stages at which mineral carbon is produced from siderite (515–519 °C) and calcite (776–850 °C) were not reached to alter OI values.
4.3.2. Organic Petrography
Organic petrography provides succinct identification and detailed description of the kerogen constituents. Therefore, organic petrography was used in this study to confirm and supplement the organic geochemical analysis. The present-day organic facies (OFpd) data of the Khatatba Formation identified from the present-day HIpd and the petrographic characterization of organic matter indicates the prevalence of the gas-prone (kerogen type III–II) organic facies C and less commonly the gas/oil-prone (kerogen type II–III) organic facies BC (Table 2). The TWL quantitative analysis of the kerogen constituents and their plot in the APP ternary diagram of [49] and LVI ternary diagram of [51] also indicates that the Khatatba Formation contains gas-prone kerogen types III and III–II (Figure 9). The samples are prone to producing less wet gas and mostly dry gas. Based on [52] thermal alteration index (TAI), pteridophyte spores in Sample 1 show a dark brown color (Figure 9A). This color corresponds to a TAI value of 4-, which indicates an early postmature phase (dry gas window). A grain of pteridophyte spore in Sample 13 exhibits a brown color (Figure 9B), which corresponds to a TAI value of 3+ and indicates late mature phase (wet gas-window).
4.4. Source Rock Generation Potential
The intraformational shale layers of the Lower Safa, Upper Safa, basal Kabrit, and basal Zahra members have fair to very good/excellent organic richness (TOCm wt%: 0.91–3.07, avg. 1.58 and TOCDLogR wt%: ~ 0.5–18) and poor to fair gas generation potential (S2: 0.38–1.96, avg. 1.02 mg HC/g rock). These shale layers entered the late mature to early postmature stages (Tmax: 458–480 °C, avg. 471 °C, VRo: 1.32%–1.39%, TAI: 4- to 3+) and contain gas-prone organic matter, which is prone to producing wet gas and condensate to dry gas. However, the middle part of the Lower Safa Member (samples 4 and 5) shows excellent organic richness (TOCm wt%: 5.39 and 22.90 and TOCDLog wt%: ~ 5–9) of early postmature (Tmax: 474–476 °C, TAI: 4- ) gas-prone carbonaceous material and coal deposits. These very organic-rich shale layers exhibit fair to excellent wet gas and condensate generation potential (S2: 4.51–27.43, avg. 15.97 mg HC/g rock) in the Imhotep W-1X well. This maturity assessment is consistent with the vitrinite reflectance data (VRo %), which ranges between 1.32% and 1.39%. Figure 10, indicating late mature phase (wet gas-window) to early postmature (dry gas-window) phase (e.g., [47,48] and the references therein.
The RWL petrographic analysis of the kerogen components of the Safa and Zahra members indicates that these members contain numerous and large particles of vitrinite (gas-prone Type III kerogen typically found in coal) in the form of collotelinite (Figure 11A). Inertinite (Type IV kerogen) is rare (Figure 11B).
4.5. Geomechanics Results
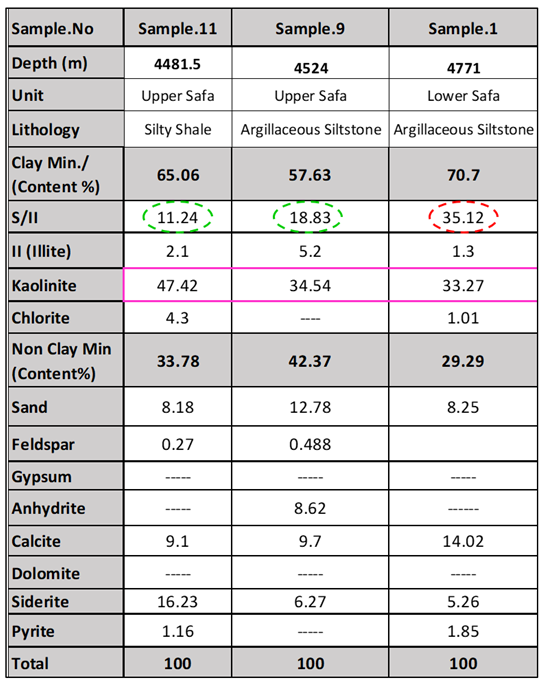
The rock's brittleness increases proportionally with the magnitude of the brittleness index (BI). The analysis of the BI in conjunction with the mineralogy logs along the Imhotep W-1X well reveals that intervals characterized by elevated levels of quartz and calcite are more brittle compared to intervals with higher clay content, which display lower levels of brittleness and higher ductility. Furthermore, it is observed that an increase in the TOC % is directly proportional to an increase in the ductility of the rock. Figure 12 depicted below, illustrates that the TOC level greater than 2 wt% exhibits the highest dominance inside the shale formation of the Upper Safa Member. This observation aligns consistently with a brittleness index beyond 40. The lower TOC content and non-TOC intervals show low GR (<60 API) and high BR (>40). The ductility of the rock increases with an increase in the TOC content. However, most of the Upper Safa shale intervals are silty and contain quartz and carbonates, as confirmed by XRD results (Table 3), which show more ductile behavior. Besides, the high GR shale intervals with high TOC content show ductile behavior, which can be justified because of the clay content. This behavior can also be monitored from the crossplot of Poisson’s ratio versus the Young’s modulus, as illustrated in (Figure 13). Besides, the high GR shale intervals with high TOC content show ductile behaviors, which can be justified because of the clay content. This behavior can also be senn from the crossplot of Poisson’s ratio versus the Young’s modulus, as illustrated in (Figure 13).
The ductile shale shows a high Poisson’s ratio and a low Young’s modulus. The inverse is correct for the brittle shale. The shale of the Lower Safa Member (Figure 13a) shows more brittle behavior than ductile behavior, where the ductile intervals show high Poisson’s ratio and low Young’s modulus, while the brittle intervals show high Young’s modulus and low Poisson’s ratio. In the shale of the Upper Safa member (Figure 13b) the ductile behavior of the shale which correspond to high Passion’s ratio and a low Young’s modulus (R2= 0.8572) is greater than the shale’s brittle behavior (R2= 0.7944).
4.6. Basin Modelling of the Matruh Basin
1D-burial history modelling at the location of the Imhotep W1-X well shows the subsidence history, sedimentation rate, maturation, and time of hydrocarbon generation. It also provides valuable information about the basin's history [10,32]. The utilization of the PetroMod-1D program was employed for the purpose of constructing the burial history and calibrating the model. The highest documented paleowater level, measuring 1986 ft. (605.33 m), occurred near the end of the Cretaceous period around 69.1 million years ago. Conversely, the north Western Desert experienced uplift during the Palaeocene era, resulting in a recorded water depth of zero feet in recent times (see Figure 14a). The estimation of the sediment-water interface temperature (SWIT) is derived from the paleowater depth and the present geographic latitude, namely 30˚ North. The SWIT (Figure 14b) reached its peak at 84.2˚F during the Late Triassic, which occurred around 212 million years ago. Conversely, the lowest documented value of the SWIT was 58.51˚F, observed towards the end of the Cretaceous age, approximately 69.1 million years ago. The heat flow value used in this study ranges between 50 and 60 mW/m2, which is characteristic of most rift basins around the world (Figure 14c). Figures 15a and 15b display the computed profiles of maturity and temperature gradient for the Imhotep W1-X well, respectively. The highest temperature (Tmax °C) reached during the pyrolysis process of Lower Safa, Upper Safa, Kabrit, and Zahra samples was used to determine the vitrinite reflectance (Ro). The VRo% calculated in the Imhotep W-1X well (Figure 15a) matches well with the predicted maturity curve. Also, the calculated temperature gradient matches the one seen from BHT (Figure 15b), which means that the thermal model is well-calibrated. The age and temperature gradient curves exhibit a progressive increase as the depth of burial increases, which plays a significant role in the temporal transformation of organic matter into hydrocarbons [10,53].
4.6.1. Sedimentation and Subsidence Rates
The sedimentation rate model of the Imhotep W-1X well shows four major depositional cycles, each of which ends with a marine transgression. Two maximum sedimentation rates occurred: one in the first cycle (Jurassic rifting) and the other in the third cycle (Early Cretaceous rifting). The maximum sedimentation occurred during rift initiation, where source rocks were accumulated at the base (i.e., Lower Safa, Zahra, and AR-F1 to G members) (Figure 16). The first cycle of the sedimentation rate model initiated with Jurassic rifting and led to the deposition of shales, sandstones, and siltstones of the Safa and Zahra members, with a maximum sedimentation rate of around 300 ft./ma (91.44 m/ma). This high rate of deposition is related to rifting, where the subsidence rate is consequently increasing and shales form the main source rocks at the base of the sedimentary basin, [54]. The deposition of the transgressive marine limestone of the Late Jurassic Masajid Formation marked the end of this cycle [55]. The second cycle started in the Early Cretaceous with the deposition of the Alam El Bueib (AEB) clastics and ended with the deposition of the carbonates of the Alamein Formation during a relative marine transgression. The maximum sedimentation rate recorded in this cycle was around 180 ft/Ma (55 m/Ma), where rifting and subsidence continued with a lower sedimentation rate than the rift initiation (Figure 16). The third cycle was initiated by a major rifting phase in the Late Cretaceous, where the water depth was at its maximum (up to 1880 ft/573 m) and the deep marine shales and limestones of the Abu Roash Formation were deposited.
The maximum sedimentation rate was recorded by the deposition of the Abu Roash “G” and “F” (AR F–G) members to be about up to 580 ft/Ma (177 m/Ma), which were deposited during a recurring rifting episode (Figure 16). The fourth and last sedimentary cycle occurred during the late Paleogene-Early Neogene and deposited limestones and shales of Apollonia and Dabaa formations with the lowest recorded sedimentation rates in the Imhotep W-1X well of up to 45 ft./Ma (14 m/Ma).
4.6.2. Burial and Maturity Histories of the Imhotep W-1X Well in the Matruh Basin
The burial history modelling constructed by PetroMod-1D software used the simple cracking method of [56] to study the tectonic events, petroleum generation, and entrapment in the Matruh Basin. The model indicates two main rifting phases (Figure 17), one occurring in the Middle Jurassic (~ 173–170 Ma ago) and the other occurring in the Late Cretaceous (~ 93–92 Ma ago). The end of the Cretaceous to early Paleogene (~ 60–58 Ma ago) was characterized by a major uplifting phase due to tectonic inversion. During the first phase of tectonic subsidence due to Jurassic rifting, the basin was characterized by a fluvial, near-shore to shallow marine setting (~ water depth 100–200 ft/30.5–61 m), where fluvial sandstones, siltstones, and shallow marine shales and limestones were deposited. This is clearly noted in the shale source rocks of the Lower Safa and Zahra members [3,10] and the sandstone reservoir rocks of the Upper Safa Member (Figure 17). Subsidence continued during the Early Cretaceous and was characterized by the fluvial deposits of the Alam El Bueib Formation (Neocomian Phase) and interbedded by several shallow marine shales and carbonates layers [57,15,10]. This was followed by the deposition of the carbonates of the Aptian Alamein Formation, marine shales, and siltstones of the Dahab Formation, and ended with the fluvio-deltaic sandstones of the Kharita Formation. The end of the Early Cretaceous was characterized by a major unconformity, where argillaceous sandstones and siltstones of the Late Cretaceous (Cenomanian) Bahariya Formation were deposited in nearshore to shallow marine environments. The Late Cretaceous was characterized by a higher rate of subsidence with a deposition in a deep marine setting, where water depth ranged from 1500 to 1880 feet (~ 457–573 m). This led to the deposition of the deep marine limestones and shales of the Abu Roash Formation [10]. The end of the Cretaceous–early Paleogene was characterized by regional unconformity in the northwestern desert of Egypt due to uplift and erosion, followed by the deposition of limestones of the Apollonia Formation, shales of the Dabaa Formation, and sandstones of the Moghra Formation.
The whole cycle ended with the deposition of the great limestone plateau of the Marmarica Formation, which covers most of the northwestern Desert of Egypt [58,59]. These phases of tectonic subsidence and inversion were responsible for the deposition of the main reservoir and source rocks and the structural traps that originated during the Mesozoic period in the Matruh Basin. As a result of deposition and later burial of the Khatatba Formation, the organic-rich deposits were transformed into gas and/or gas-oil [60] Based on the previously constructed burial history model (Figure 17), the onset of oil generation at (VRo% 0.7–1) occurred in the Early Cretaceous period (~ 115–116 Ma ago), while the onset of gas generation at (VRo% 1.3–2) happened in the Oligocene period (~ 22–24 Ma ago). On the other hand, the depth of the main oil-window is located at 9650 ft (2941.32 m), and that of the wet gas-window is located at 15550 ft (4740 m).
4.6.3. The Petroleum System of the Khatatba Formation in the Imhotep Field
The petroleum system includes all elements of petroleum generation and accumulation in a basin [61]. These elements include source rocks, reservoir rocks, seal rocks, geological structures forming petroleum traps, and faults that act as conduits for hydrocarbon migration [40]. The petroleum system events chart of the Imhotep W-1X well is shown in Figure 18. The shale source rocks were deposited during the Middle Jurassic (~ 175–163 Ma ago) and include the Lower and Upper Safa and Zahra members. The sandstone reservoir rocks of the Ras Qattara Formation, Upper Safa, and AEB-6 members were deposited during the Early and Middle Jurassic and Early Cretaceous, respectively (~ 200 to 140 Ma ago). The shales and siltstones of the AEB-5 Member act as the main seal rock and were deposited during the Early Cretaceous (~ 140–135 Ma ago). The carbonates of the Kabrit Member and shale interbeds of the Safa Member act as secondary sealing rocks in the Imhotep W-1X well. The main structural traps were formed in Jurassic–Early Cretaceous time (~ 180–140 Ma ago), and the onset of oil generation, migration, and accumulation started in the Early Cretaceous (~ 116–115 Ma ago). The traps were formed during the Jurassic and Cretaceous rifting phases of the Matruh Basin and were later charged by petroleum through migration and accumulation, which is characteristic of all Mesozoic rift basins in the northwestern Desert of Egypt [62,10,5].
5. Discussion on the Petroleum Potential of the Khatatba Formation in the Imhotep W-1X Well
The findings of investigations made by [11] Ali (2023 11) on the Khatatba Formation deposits in the Matruh-5 and Matruh-6 wells showed that depositional and climatic conditions had a significant impact on their sedimentary facies, organic facies, and organic richness. The Khatatba Formation shows alternations between organic-poor coarse clastics and organic-rich shales and carbonates. The deposition of the organic-rich intraformational shale source rocks in marine prodelta environments of the Lower and Upper Safa members was related to the favorable sedimentological conditions. These were characterized by favorable reducing conditions, fair primary bioproductivity, and relatively low terrigenous influxes brought to the basin during relatively semi-arid conditions. Deposition of the organic-lean coarse clastic reservoirs in tide-dominated brackish delta front and delta channel environments of the Lower Safa and Upper members was related to higher terrigenous inputs associated with a more humid climate and Middle Jurassic Tethyan sea level falls.
Results of the current study indicate that the middle part of the Lower Safa Member (Samples 4 and 5) shows excellent source rock potential due to high enrichment in carbonaceous material and coal deposits accumulated under suboxic–anoxic conditions. This confirms the suggestion that good reducing conditions coupled with humid conditions enhance the source rock richness [15]. This observation is reinforced by a recent study on the Khatatba Formation sedimentary deposits at the Matruh basin, which were interpreted to be deposited in an oxic to suboxic shallow marine deltaic environment in semi-arid conditions [11]. Moreover, the same observation is strengthened by organic-lean deltaic shales and coaly shales from the Tortonian Wakar Formation from the offshore Nile Delta in Egypt, which were deposited in weakly oxic conditions during semi-arid periods [63]. In the Imhotep W-1X well, the organic-rich shale interbeds of the Lower Safa and the Upper Safa, the basal Zahra, and the carbonates of the basal Kabrit members show fair to very good/excellent organic richness. The Lower Safa Member is characterized by thicker shale source rock interbeds, which were deposited in the relatively low energy distal prodelta setting and contain mostly gas-prone organic facies BC to less commonly organic facies C (Table 3). The Upper Safa Member is characterized by thinner shale and thicker siltstone source rock interbeds, which were deposited in the energetic proximal delta front and delta channel settings and contain only gas-prone organic facies C.
The burial history reconstruction along with the organic geochemical and petrographic data indicate that the maturation of the Khatatba Formation source rock intervals was driven by the tectonic subsidence events, which were related to the Tethyan rifting [10,16,64]. The Khatatba Formation source rocks were brought by the Late Jurassic minor subsidence at shallow burial depths. The deposition of shale and siltstone sealing rocks in the AEB-5 Member during the Early Cretaceous was followed by the late Early Cretaceous subsidence, which initiated the maturation of the Khatatba Formation source rocks. As a result, some oil was generated, migrated, and accumulated in the sandstone reservoirs of the Upper Safa Member of the Middle Jurassic Khatatba Formation and the AEB-6 Member of the Lower Cretaceous Alam El Bueib Formation and trapped in the pre-existing Jurassic and Early Cretaceous structural traps. The Middle Jurassic Khatatba Formation's deeper burial depths due to the Late Cretaceous major subsidence enhanced greatly the maturation. The continued deposition of thick overburden over the seal rocks brought the source rocks to deeper burial depths, which further enhanced their maturation by the Oligocene and resulted in the generation of wet gas and condensates. Generally, the Lower and Upper Safa members of the Khatatba Formation show poor to fair gas generation potential, except for the carbonaceous shale and coal deposits of the middle part of the Lower Safa Member, which show excellent organic richness and fair to excellent wet gas and condensate generation potential. The maturation and generation of hydrocarbons are further supported by the actual evidence in the mud log. As mentioned above, the sedimentation trend shows a notable upward increase in the thickness of the brackish sequences due to shift in climatic conditions towards more humid conditions (Figure 5). The Upper Safa Member shows higher average shale volume with higher kaolinite percentages than those recorded from the Lower Safa Member. This can be explained because it is associated with longer periods of humid climate and the deposition of high clay minerals.
According to the constructed basin model, the Khatatba Formation is located in the late mature zone, which produces gas and condensates, while the AEB-6 is located in the main mature zone. However, AEB-6 produces gas because all source rocks contain mostly kerogen type lll with minor type ll. Thus, the area produces gas and condensate upon maturity. The produced gases from the AEB-6 reservoir are accompanied by condensate, which is consistent with the results of the basin model, which shows late oil-window and postmature gas-window zones, which produce gas and condensates.
Worldwide, [44] studied the XRD-determined clay mineral content of the Barnett Shale and found this formation generally contains less than 30% clay minerals. Silica (clay to silt-size crystalline quartz) was by far the most dominant component of the Barnett Shale, where the increase in the silica content in the Barnett Shale made it more brittle and easier to fracture with drilling. However, the Khatatba Formation shows an increase in the percentage of clay mineral contents up to > 60%, which negatively affects its reservoir quality. Comparing the clay and non-clay mineral content data of the Woodford Formation to the Barnett Shale in west Texas [44] showed that the silica content of the Barnett Shale and Woodford Formation is higher than that of the Western Desert Khatatba Formation. This improved the shale brittleness and allowed it to fracture more easily in Texas basins.
The elemental analysis (XRF) done by [65] on the Barnett Shale cores indicates an average calcium content of ~1.3% (average of 177 samples). While for the Khatatba Formation, the average calcium content is ~7.2% (average of 14 samples from the Imhotep W-1X well). It is evident that the effect of the depositional environment, which is a deltaic environment infringed with a tidal flat environment, contributed to the increase of clay minerals in the prodelta deposits and calcium% in tide-dominated delta channel argillaceous sandstones of the Khatatba Formation. Thus, different types of depositional environments are suggested to have direct impacts on the reservoir quality and drilling process of targeted reservoirs. [66] used an integrated approach to define the core derived geomechanical properties of the Bakken Formation and its relationship with wireline logs, facies characterization, and field scale structural features. He concluded that integration between geomechanics, geochemical, and geophysical approaches can provides insights onto the depositional environment and aids explain why specific mechanical mechanisms arise in determined zones. [67] studied the Permian Roseneath and Murteree shales in Australia using petrophysical and geomechanical models to determine shale mineralogy, organic richness, porosity, and brittleness index, pore pressure, and fracture pressure gradient. They found quartz and siderite-rich rocks have a higher brittleness index than clay, organic matter, and porosity-rich rocks. This is consistent with the findings obtained from the current work on the Khatatba Formation. They suggested that combining a BI with a geomechanical model to identify fracture barriers, potential layers, and induced fractures based on stress regime. [68] developed a workflow for estimating the geomechanical properties of shale intervals in the Early Cretaceous Sembar Formation, Lower Indus Basin of Pakistan, using wireline logs, post-stack seismic data, XRD data, core data, and hydraulic fracturing test data. Their results suggest that the Sembar Shale is promising for gas development, where the 3D mechanical earth model shows an increase in shale brittleness towards the northeastern part of the study area. [69] summarized all the approaches being used in gas shale reservoir petrophysical and geomechanical modeling by using machine learning (ML) and artificial intelligence (AI). They suggested that applying the ML and AI in modeling reservoir petrophysics and geomechanics is crucial to determine new prospects of shale gas reservoirs.
From the discussion provided above, it is suggested that the Khatatba Formation in the Imhotep W-1X well shows evident in situ dual source and reservoir characteristics, which are related to the deposition of alternations of coarse clastic reservoirs and fine clastic and carbonate source rocks. These changes in the depositional environments are connected to the Tethyan Middle Jurassic sea level changes and the development of more humid regional climatic conditions. On the other hand, the main source rocks in the Matruh Basin are believed to be the Middle Jurassic Khatatba Formation shales. The presence of hydrocarbons in several nearby wells shows the need for further investigations of the Khatatba Formation source rock potential. Therefore, integrating geomechanics, geochemical, and petrophysical analysis, along with elemental and bulk mineral analysis, can aid in well-planned operations for optimization. Accordingly, the integration applied in this study can help in defining horizontal well orientation in the case of multi well correlation, evaluating the suitability of particular zones in a formation for hydraulic fracturing, and measuring the pressure required for hydraulic fracturing.
6. Conclusion
Integrated multi approaches as organic/inorganic geochemical, and organic petrographic analyses were made on the Middle Jurassic Khatatba Formation through the Imhotep W-1X well in the Matruh Basin, northwestern Egypt, to investigate its petroleum potential. Results indicate that the Khatatba Formation shows obvious in situ dual source and reservoir characteristics. This is related to the oscillations in sedimentation, which resulted in alternating deposition of organic-poor coarse clastic reservoirs during semi-humid conditions and deposition of organic-rich fine clastic and carbonate source rocks during semi-arid conditions. The shallow marine source rocks are rich in late mature to early postmature (wet-gas to dry-gas windows) gas-prone organic facies, which sourced the juxtaposing intraformational coarse clastic reservoirs with gas and condensates.
Hydrocarbon charge at the location of the Imhotep W-1X well is believed to be sourced from the mature Khatatba shale source rock intervals, which encased the clastic reservoirs. These source rocks are now thermally mature to generate mostly gaseous hydrocarbons, which is confirmed by the maturation proxies and actual shows in the mud log. The thermal maturation of these source rocks was connected to the tectonically driven subsidence events, which were related to the Late Jurassic and Cretaceous Tethyan rifting. The Lower Safa, Upper Safa and Zahra members are shale-dominated in the prospect area. These shales form the top and lateral seals for the Imhotep W-1X well prospect accumulation. However, sealing is not anticipated to be a major problem. The prospect area has direct access to mature source rocks within the studied part of the Matruh Basin, which contains the mature Middle Jurassic Khatatba Formation source rocks. The varying petrophysical characteristics and geomechanical complications of the Upper and Lower Safa sandstone reservoirs necessitate studying other parts of the Matruh Basin to better understand their regional hydrocarbon production potential.
Credit Author Statement
The authors certify that they all contributed to the current article to be included as co-authors. Material preparation, data collection, proposal writing, and the approval process to use the data used in this research from the Egyptian General Petroleum Corporation (EGPC) were performed by the 1st author [Walaa A. Ali], who worked on the concept, design, laboratory preparation of samples, data analysis, drawing illustrations, tabulating data, and finally writing and revision of the manuscript. The 2nd author [Amr S. Deaf] worked on the concept, design, and laboratory preparation of palynological samples, edit writing, and final revision of the manuscript until the submission by the 1st author. The third author [Mohamed Fagelnour] worked on data acquisition, analysis, and drawing illustrations of the basin model section in this manuscript. All authors read and approved the final manuscript for submission. The Fourth author [Thomas Gentzis] is the corresponding author who worked in revising, editing, supervising, and handling the manuscript for publication.
Declaration of competing interest
The authors affirm that they do not possess any identifiable conflicting financial interests or personal ties that could have potentially influenced the findings presented in this paper.
Data availability
The data supporting the findings of this investigation can be obtained from the corresponding author, but there are restrictions on their availability. These data were utilized under license for the current study and are not authorized for public accessibility.
Acknowledgments
Authors are very grateful to the Egyptian General Petroleum Corporation (EGPC) and Khalda Petroleum Company for granting rock samples and well logging data for the Imhotep W-1X well. The 1st author is indebted to the Fulbright Scholarship for getting funds to support the thin section preparation and XRD clay fraction. Besides, thanks should go to Assiut University for granting funds to support the palynological sample preparation.
References
- Metwalli, F.I.; Pigott, J.D.; Ramadan, F.S.; El-Khadragy, A.A.; Afify, W.A. Alam El Bueib reservoir characterization, Tut oil field, North Western Desert, Egypt. Environmental Earth Sciences 2018, 77, 1–21. [Google Scholar] [CrossRef]
- Gentzis, T.; Carvajal-Ortiz, H.; Tahoun, S.S.; Deaf, A.S.; Ocubalidet, S. Organic facies and hydrocarbon potential of the early–middle Albian Kharita Formation in the Abu Gharadig Basin, Egypt, as demonstrated by palynology, organic petrology, and geochemistry. International Journal of Coal Geology 2019, 209, 27–39. [Google Scholar] [CrossRef]
- Deaf, A.S.; Omran, A.A.; El-Arab, E.S.Z.; Maky, A.F. Integrated organic geochemical/petrographic and well logging analyses to evaluate the hydrocarbon source rock potential of the Middle Jurassic upper Khatatba Formation in Matruh Basin, northwestern Egypt. Marine and Petroleum Geology 2022, 140, 105622. [Google Scholar] [CrossRef]
- Fello, N.M.; Deaf, A.S.; Leila, M. 2024. Petroleum Geology of North Africa. In: Z. Hamimi et al. (eds), The Geology of North Africa, Regional Geology Reviews.
- Ali, W.A.; Deaf, A.S.; Mostafa, T. 3D geological and petrophysical modeling of Alam El-Bueib formation using well logs and seismic data in Matruh field, northwestern Egypt. Scientific Reports 2024, 14, 6849. [Google Scholar] [CrossRef] [PubMed]
- Metwalli, F.I.; Pigott, J.D. Analysis of petroleum system criticals of the Matruh–Shushan Basin, Western Desert, Egypt. Petrol. Geosci. 2005, 11, 157–178. [Google Scholar] [CrossRef]
- El-Shorbagy, A.I.; Mousa, D.A.; Makled, W.A.; El Din, M.Y.Z. Sequence stratigraphic modeling and organic matter distribution of Jurassic deposits in the Imhotep Field, Matruh Basin, Western Desert, Egypt. Neues Jahrbuch für Geologie und Paläontologie-Abhandlungen 2023, 215–234.
- El-Shorbagy, A.I.; Mousa, D.A.; Zein El-Din, M.Y. Source rock evaluation of Jurassic rock units for Imhotep Field, Matruh Basin, Western Desert, Egypt. Egyptian Journal of Geology 2023, 67, 123–134. [Google Scholar] [CrossRef]
- Gentzis, T.; Carvajal, H.; Deaf, A.; Tahoun, S.S. Multi-proxy approach to screen the hydrocarbon potential of the Jurassic succession in the Matruh Basin, north Western Desert, Egypt. International Journal of Coal Geology 2018, 190, 29–41. [Google Scholar] [CrossRef]
- Ali, W.A.; Fagelnour, M. Burial and thermal history simulation of the Middle Jurassic source rocks in Matruh basin, north Western Desert, Egypt. Delta Journal of Science 2023, 47, 171–191. [Google Scholar] [CrossRef]
- Ali, W.A. Depositional environment and paleoclimate of the Middle Jurassic sedimentary rocks in Matruh Basin, Northwestern Desert, Egypt. Egyptian Journal of Geology 2023, 67, 299–319. [Google Scholar] [CrossRef]
- Guiraud, R.; Bosworth, W. Phanerozoic geodynamic evolution of north–eastern Africa and the north–western Arabian platform. Tectonophysics 1999, 315, 73–108. [Google Scholar] [CrossRef]
- Shalaby, M.R.; Hakimi, M.H.; Abdullah, W.H. Petroleum system analysis of the Khatatba formation in the Shoushan basin, north western desert, Egypt. Arabian Journal of Geosciences 2014, 7, 4303–4320. [Google Scholar] [CrossRef]
- EL Bastawesy, M.; Afify, W.; Barakat, M.; EL Gendy, N. 2020. Petroleum System analyses of Middle Jurassic and early Cretaceous rocks, Matruh Basin, North Western Desert, Egypt. European Association of Geoscientists & Engineers, Conference Proceedings, 82nd EAGE Annual Conference and Exhibition, 2020, 1–5.
- Deaf, A.S. Sequence stratigraphy and distribution of organic-rich Lower Cretaceous mixed clastic-carbonate strata in Matruh Basin, northwestern Egypt: Constrains on the Tethyan sea level changes, palaeoclimate, and tectonics. Marine and Petroleum Geology 2021, 129, 105105. [Google Scholar] [CrossRef]
- Bosworth, W.; Tari, G. Hydrocarbon accumulation in basins with multiple phases of extension and inversion: Examples from the Western Desert (Egypt) and the western Black Sea. Solid Earth Discussions 2021, 12, 59–77. [Google Scholar] [CrossRef]
- Aljahdali, M.H.; Deaf, A.S.; Gentzis, T.; Bantan, R.A.; Abu-Zied, R.H.; Carvajal-Ortiz, H.; Khalaf, M.M. Organic petrographic, geochemical, and sequence stratigraphic analyses for evaluating the hydrocarbon potential of Middle Jurassic–Lower Cretaceous rocks in Shushan Basin, northwestern Egypt. Frontiers in Earth Science 2023, 11, 1129379. [Google Scholar] [CrossRef]
- EGPC, 1992. Western Desert, Oil and Gas Fields, A comprehensive Overview. EGPC, 11th Petroleum Exploration Production Conference, Cairo, Egypt, pp. 431.
- Mansour, A.; Gentzis, T.; Tahoun, S.S.; Ahmed, M.S.; Gier, S.; Carvajal-Ortiz, H.; Wang, J. Near equatorial paleoclimatic evolution and control on organic matter accumulation during the Cenomanian in the Abu Gharadig Basin, southern Tethys: Insights from palynology, organic petrography, and geochemistry. International Journal of Coal Geology 2023, 270, 104221. [Google Scholar] [CrossRef]
- Khalda Petroleum Company, 2014. Final Report and Composite log of the Imhotep W-1X well (Cairo).
- Bunaciu, A.A.; UdriŞTioiu, E.G.; Aboul-Enein, H.Y. X-ray diffraction: instrumentation and applications. Critical reviews in analytical chemistry 2015, 45, 289–299. [Google Scholar] [CrossRef]
- Hassan, M.S.; Baioumy, H.M. Structural and chemical alteration of glauconite under progressive acid treatment. Clays and clay minerals 2006, 54, 491–499. [Google Scholar] [CrossRef]
- Sýkorová, I.; Pickel, W.; Christanis, K.; Wolf, M.; Talor, G.H.; Flores, D. Classification of huminite – ICCP system 1994. International Journal of Coal Geology 2005, 62, 85–106. [Google Scholar] [CrossRef]
- Pickel, W.; Kus, J.; Flores, D.; Kalaitzidis, S.; Christanis, K.; Cardott, B.J.; et al. Classification of liptinite – ICCP System 1994. International Journal of Coal Geology 2017, 169, 40–61. [Google Scholar] [CrossRef]
- Passey, O.R.; Moretti, F.U. and Stroud, J.D. A practical modal for organic richness from porosity and resistivity logs. American Association of Petroleum Geologists Bulletin 1990, 74, 1777–1794. [Google Scholar]
- Crain, E.R.; Holgate, D. 2014. A 12-step program to reduce uncertainty in kerogen-rich reservoirs. In GeoConvention: Focus Conference, Calgary, May (pp. 12-16).
- Rickman, R.; Mullen, M.; Petre, E.; Grieser, B.; Kundert, D. 2008. A practical use of shale petrophysics for stimulation design optimization: All shale plays are not clones of the Barnett Shale. In SPE Annual Technical Conference and Exhibition. (pp. SPE-115258).
- Perez Altamar, R.; Marfurt, K. Mineralogy-based brittleness prediction from surface seismic data: Application to the Barnett Shale. Interpretation 2014, 24, T255–T271. [Google Scholar] [CrossRef]
- Zhu, H.; Ju, Y.; Huang, C.; Han, K.; Qi, Y.; Shi, M.; Yu, K.; Feng, H.; Li, W.; Ju, L.; Qian, J. Pore structure variations across structural deformation of Silurian Longmaxi shale: an example from the chuandong thrust-fold belt. Fuel 2019, 241, 914–932. [Google Scholar] [CrossRef]
- Zou, C.; Mao, L.; Tan, Z.; Zhou, L.; Liu, L. Geochemistry of major and trace elements in sediments from the Lubei Plain, China: Constraints for paleoclimate, paleosalinity, and paleoredox environment. Journal of Asian Earth Sciences 2021, 6, 100071. [Google Scholar] [CrossRef]
- Sudfeld (2011).
- Waples, D.W. 1985. Geochemistry in petroleum exploration. International Human Resources and Development Corporation, Boston, pp. 226.
- Allen, P.A.; Allen, J.R. 2005. Basin analysis: Principles and Applications. 2nd Ed., Oxford, England: Blackwell Science Publication, pp. 373–318.
- Abd El Gawad, E.A.; Ghanem, M.F.; Lotfy, M.M.; Mousa, D.A.; Temraz, M.G.; Shehata, A.M. Burial and thermal history simulation of the subsurface Paleozoic source rocks in Faghur Basin, north Western Desert, Egypt: Implication for hydrocarbon generation and expulsion history. Egyptian Journal of Petroleum 2019, 28, 261–271. [Google Scholar] [CrossRef]
- Edress, N.A.A.; Darwish, S.; Ismail, A. Geochemical characterization of the source rock intervals, Beni-Suef Basin, West Nile Valley, Egypt. Open Geosciences 2021, 13, 1536–1551. [Google Scholar] [CrossRef]
- Gale, J.F.; Fall, A.; Yurchenko, I.A.; Ali, W.A.; Laubach, S.E.; Eichhubl, P.; Bodnar, R.J. Opening-mode fracturing and cementation during hydrocarbon generation in shale: An example from the Barnett Shale, Delaware Basin, West Texas. American Association of Petroleum Geologists Bulletin 2022, 106, 2103–2141. [Google Scholar] [CrossRef]
- Suggate, R.P. Relations between depth of burial, vitrinite reflectance and geothermal gradient. Journal of Petroleum Geology 1998, 21, 5–32. [Google Scholar] [CrossRef]
- Creaney, S.; Passey, Q.R. Recurring patterns of total organic carbon and source rock quality within a sequence stratigraphic framework. American Association of Petroleum Geologists Bulletin 1993, 77, 386–401. [Google Scholar]
- Peters, K.E.; Walters, C.C.; Moldowan, J.M. ; 2005. The Biomarker Guide, 2nd ed., Cambridge University Press, Cambridge.
- Peters, K.E.; Cassa, M.R. 1994. Applied source rock geochemistry. In: Magoonand, L.B.; Dow, W.G. (Eds.), the petroleum system from source to trap.
- Baskin, D.K. Atomic H/C ratio of kerogen as an estimate of thermal maturity and organic matter conversion. American Association of Petroleum Geologists Bulletin 1997, 81, 1437–1450. [Google Scholar]
- Dembicki, H. Three common source rock evaluation errors made by geologists during prospect or play appraisals. American Association of Petroleum Geologists Bulletin 2009, 93, 34–356. [Google Scholar] [CrossRef]
- Hart, B.S.; Steen, A.S. Programmed pyrolysis (Rock-Eval) data and shale paleoenvironmental analyses: A review. Interpretation, 2015, 3, pp.SH41–SH58. [Google Scholar] [CrossRef]
- Ali, W.A. 2009. Lithofacies, depositional environment, burial history, and calculation of organic richness from the wireline logs: a study of Barnett Shale in the Delaware Basin, Pecos Co., West Texas, and comparison with the Barnett Shale in the Fort Worth Basin (Doctoral dissertation).
- Schmoker, J.W.; Hester, T.C. Organic carbon in Bakken Formation United States portion of Williston Basin. American Association of Petroleum Geologists Bulletin 1983, 67, 2165–2174. [Google Scholar]
- Van Krevelen, D.W. Development of coal research—a review. Fuel 1982, 61, 786–790. [Google Scholar] [CrossRef]
- Hartkopf-Fröder, C.; Königshof, P.; Littke, R.; Schwarzbauer, J. Optical thermal maturity parameters and organic geochemical alteration at low grade diagenesis to anchimetamorphism: A review. International Journal of Coal Geology 2015, 150, 74–119. [Google Scholar] [CrossRef]
- Hackley, P.C.; Cardott, B.J. Application of organic petrography in North American shale petroleum systems: A review. International Journal of Coal Geology 2016, 163, 8–51. [Google Scholar] [CrossRef]
- Tyson, R.V. 1995. Sedimentary Organic Matter; Organic Facies and Palynofacies. Chapman and Hall, London, pp. 615.
- Pillot, D.; Deville, E.; Prinzhofer, A. Identification and quantification of carbonate species using Rock-Eval pyrolysis. Oil & Gas Science and Technology – Revue d’IFP Energies nouvelles 2014, 69, 341–349. [Google Scholar]
- Dow, W.G.; O'Connor, D.I. 1982. Kerogen maturity and type by reflected light microscopy applied to petroleum exploration.
- Pearson, D.L. ; 1984. Pollen/spores colour “standard”, ver 2. Phillips Petrol, privately distribution.
- Galhom, T.; Mann, P.; Rudolph, K. Jurassic–recent stratigraphy, structure, and hydrocarbon potential of the Mesozoic–Cenozoic rifted-passive margin of the Tarfaya–Dakhla basin of southern Morocco. Marine and Petroleum Geology 2022, 139, 105626. [Google Scholar] [CrossRef]
- Bosworth, W.; Drummond, M.; Abrams, M.; Thompson, M. 2015. Jurassic rift initiation source rock in the Western Desert, Egypt – relevance to exploration in other continental rift systems. In: Petroleum Systems in “Rift” Basins, 34th Annual GCSSEPM Foundation Perkins Rosen Research Conference, Houston, pp. 13–16.
- Keeley, M.L.; Dungworth, G.; Floyd, C.S.; Forbes, G.A.; King, C.; McGarva, R.M.; Shaw, D. The Jurassic System in northern Egypt: I. Regional stratigraphy and implications for hydrocarbon prospectivity. Journal of Petroleum Geology 1990, 13, 397–420. [Google Scholar] [CrossRef]
- Sweeney, J.J.; &, *!!! REPLACE !!!*; Burnham, A.K.; Burnham, A.K. Evaluation of a simple model of vitrinite reflectance based on chemical kinetics. AAPG bulletin 1990, 74, 1559–1570. [Google Scholar]
- Fagelnour, M.; Gamil, I.; El Toukhy, M.; Gharieb, A.; Saad, H. 2019, March. Source rock potentiality, basin modeling, and oil to source correlation in Northern Shushan Basin, Western Desert, Egypt. In Offshore Mediterranean conference and exhibition, pp. OMC–2019). OMC.
- Sultan, N.; Halim, M.A. Tectonic framework of northern Western Desert, Egypt and its effect on hydrocarbon accumulations. In proceedings of the EGPC 9th exploration and production conference, Cairo. Egyptian General Petroleum Corporation Bulletin 1988, 2, 1–19. [Google Scholar]
- Said, R. 1990. The Geology of Egypt. Balkema-Rotterdam-Brookfield.
- Tissot, B.P.; Welte, D.H. 2013. Petroleum formation and occurrence. Springer Science and Business Media.
- Walters, C. 2006. The origin of petroleum In: Practical Advances in Petroleum Processing.
- Taha, M.A. 1992. Mesozoic rift basins in Egypt: their southern extension and impact on future exploration. Proceedings of the 11th Petroleum Exploration and Production Conference, Cairo, 1988. The Egyptian General Petroleum Corporation 2, 1–19.
- El-Moghazy, A.F.; Deaf, A.S.; Edress, N.A.A. Integrated organic, inorganic geochemical and palynofacies analyses to characterize the paleoenvironment of the Tortonian (Late Miocene) Wakar Formation, offshore Nile Delta, Egypt. Marine and Petroleum Geology 2023, 156, 106456. [Google Scholar] [CrossRef]
- Guiraud, R.; Issawi, B.; Bosworth, W.; Ziegler, P.A.; Cavazza, W.; Robertson, A.H.F.; Crasquin-Soleau, S. Phanerozoic history of Egypt and surrounding areas. Peri-Tethys Memoir 2001, 6, 469–509. [Google Scholar]
- Rowe, H.; Ruppel, S.; Rimmer, S.; Loucks, R. Core-based chemostratigraphy of the Barnett Shale, Permian Basin, Texas: Gulf Coast Association of Geological Societies Transactions 2009, 59, 675–686.
- Rolfs, S.A. 2015. Integrated geomechanical, geophysical, and geochemical analysis of the Bakken Formation, Elm Coulee field, Williston Basin, Montana. 2015-Mines Theses & Dissertations.
- Iqbal, O.; Ahmad, M.; Abd Kadir, A. Effective evaluation of shale gas reservoirs by means of an integrated approach to petrophysics and geomechanics for the optimization of hydraulic fracturing: A case study of the Permian Roseneath and Murteree Shale Gas reservoirs, Cooper Basin, Australia. Journal of Natural Gas Science and Engineering 2018, 58, 34–58. [Google Scholar] [CrossRef]
- Sohail, G.M.; Hawkes, C.D.; Yasin, Q. An integrated petrophysical and geomechanical characterization of Sembar Shale in the Lower Indus Basin, Pakistan, using well logs and seismic data. Journal of Natural Gas Science and Engineering, 2020, 78, 103327. [Google Scholar] [CrossRef]
- Syed, F.I.; AlShamsi, A.; Dahaghi, A.K.; Neghabhan, S. Application of ML & AI to model petrophysical and geomechanical properties of shale reservoirs–A systematic literature review. Petroleum 2022, 8, 158–166. [Google Scholar]
Figure 1.
Location map of the Matruh Basin along with other Mesozoic basins in the North Western Desert of Egypt and location of the studied Imhotep W-1X well (modified after [18,19] ).
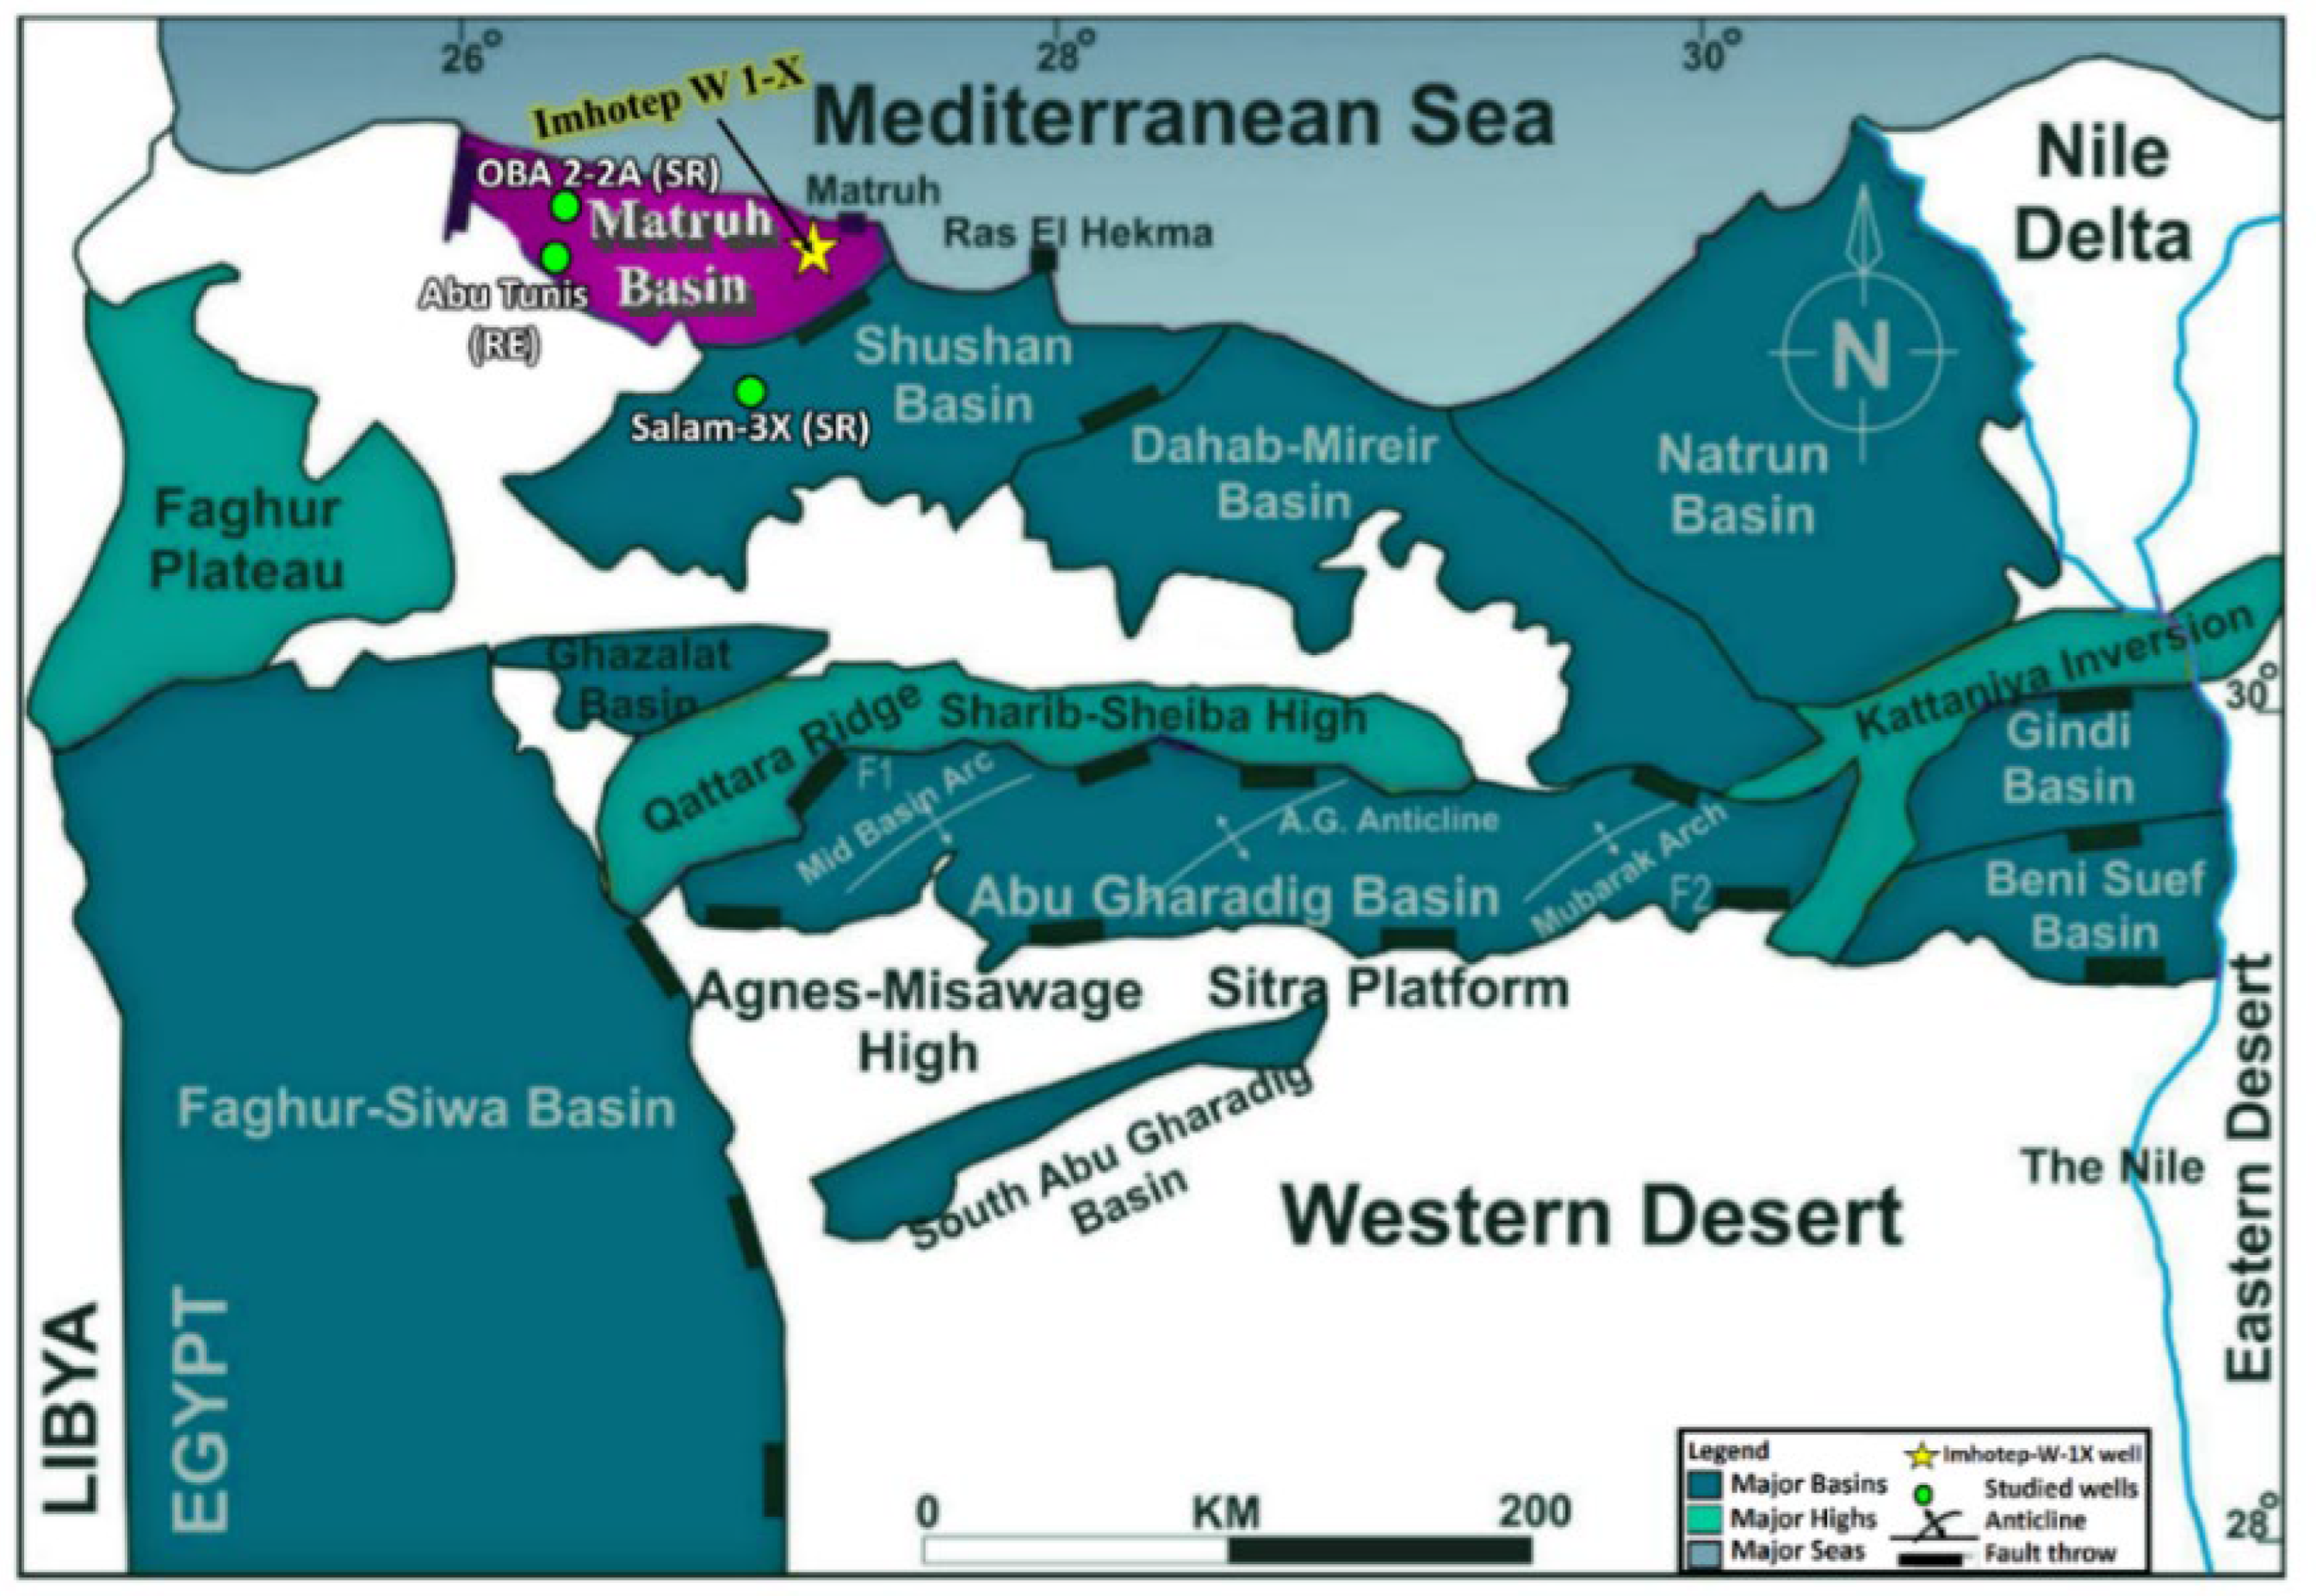
Figure 2.
Stratigraphic column of the Matruh Basin, North Western Desert, Egypt, showing 4 main depositional sequences with the lithology, age, depositional environments, and petroleum system elements of the formations (modified After [11,13,18]).
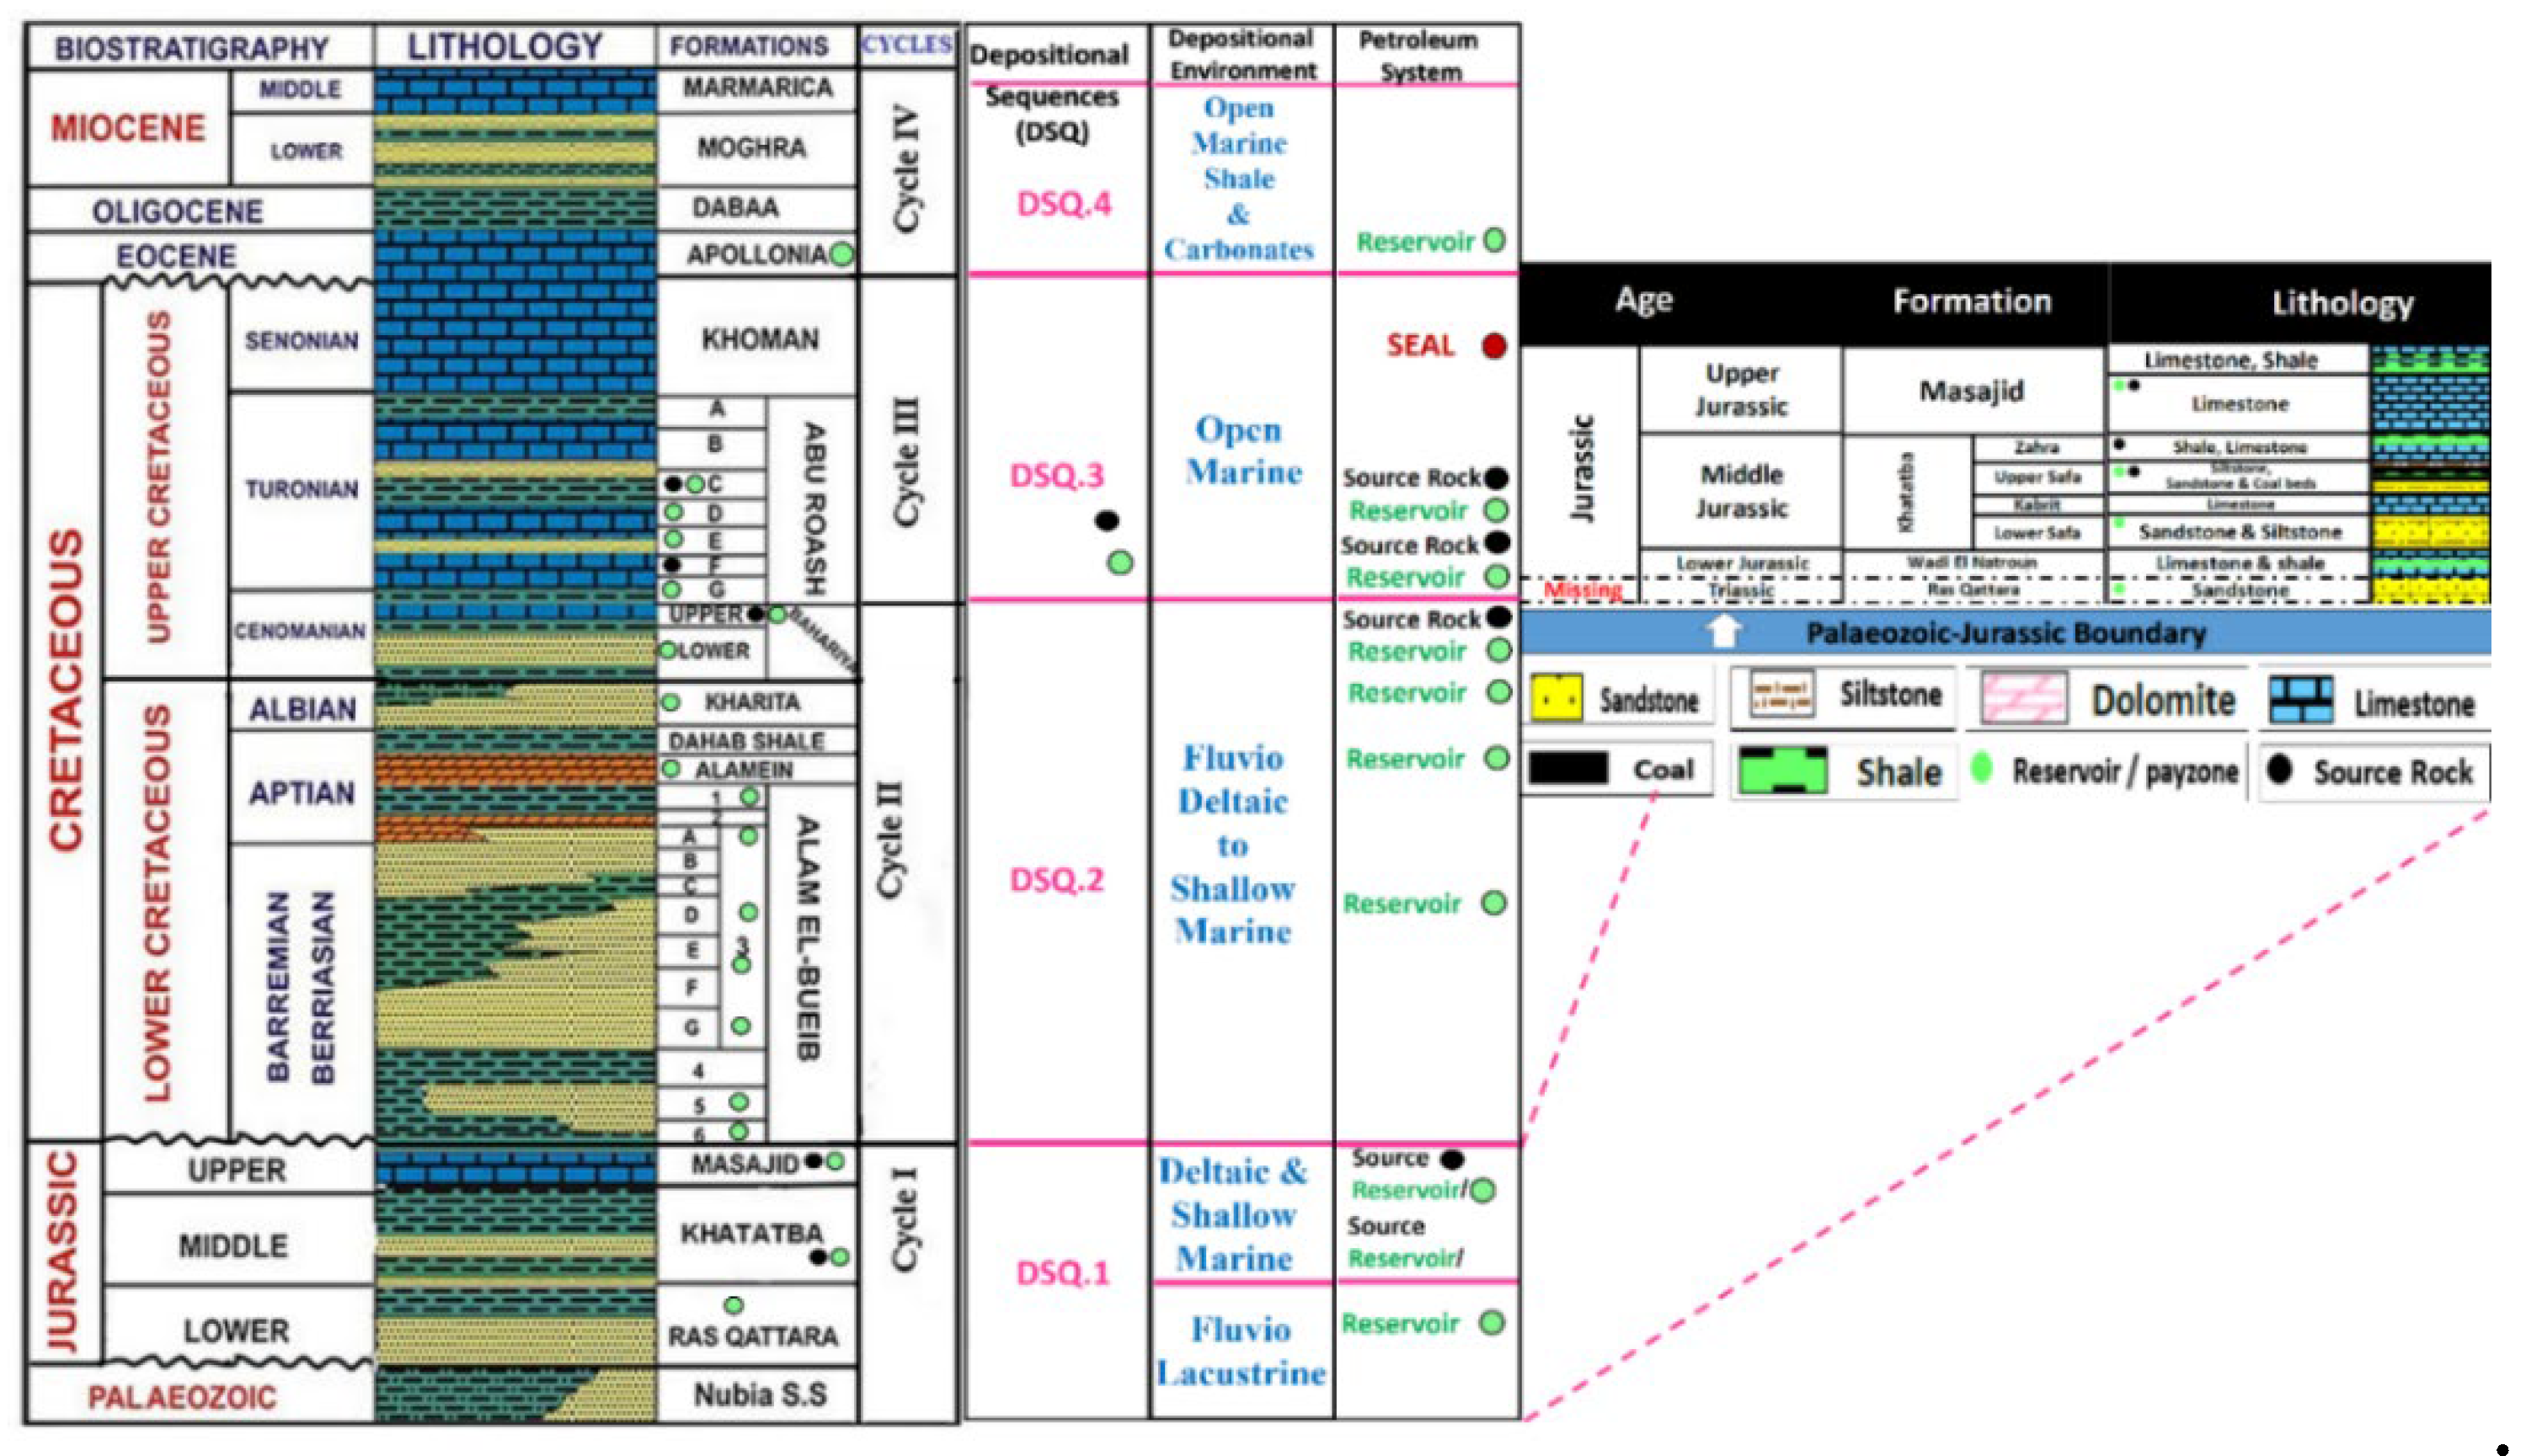
Figure 3.
The resistivity-sonic curves overlay technique (Track 6) was used to determine how rich in organic matter the well logs were in two different units of the Khatatba Formation, (A): Zahra Member and (B): the Lower Safa Member along the Imhotep W-1X well. (C): Henderson petrophysics conversion graph for converting VRo into LMO. LOM corresponding to a (measured) maturity value of 1.33 is estimated to be 11.2 (Adapted from [26]).
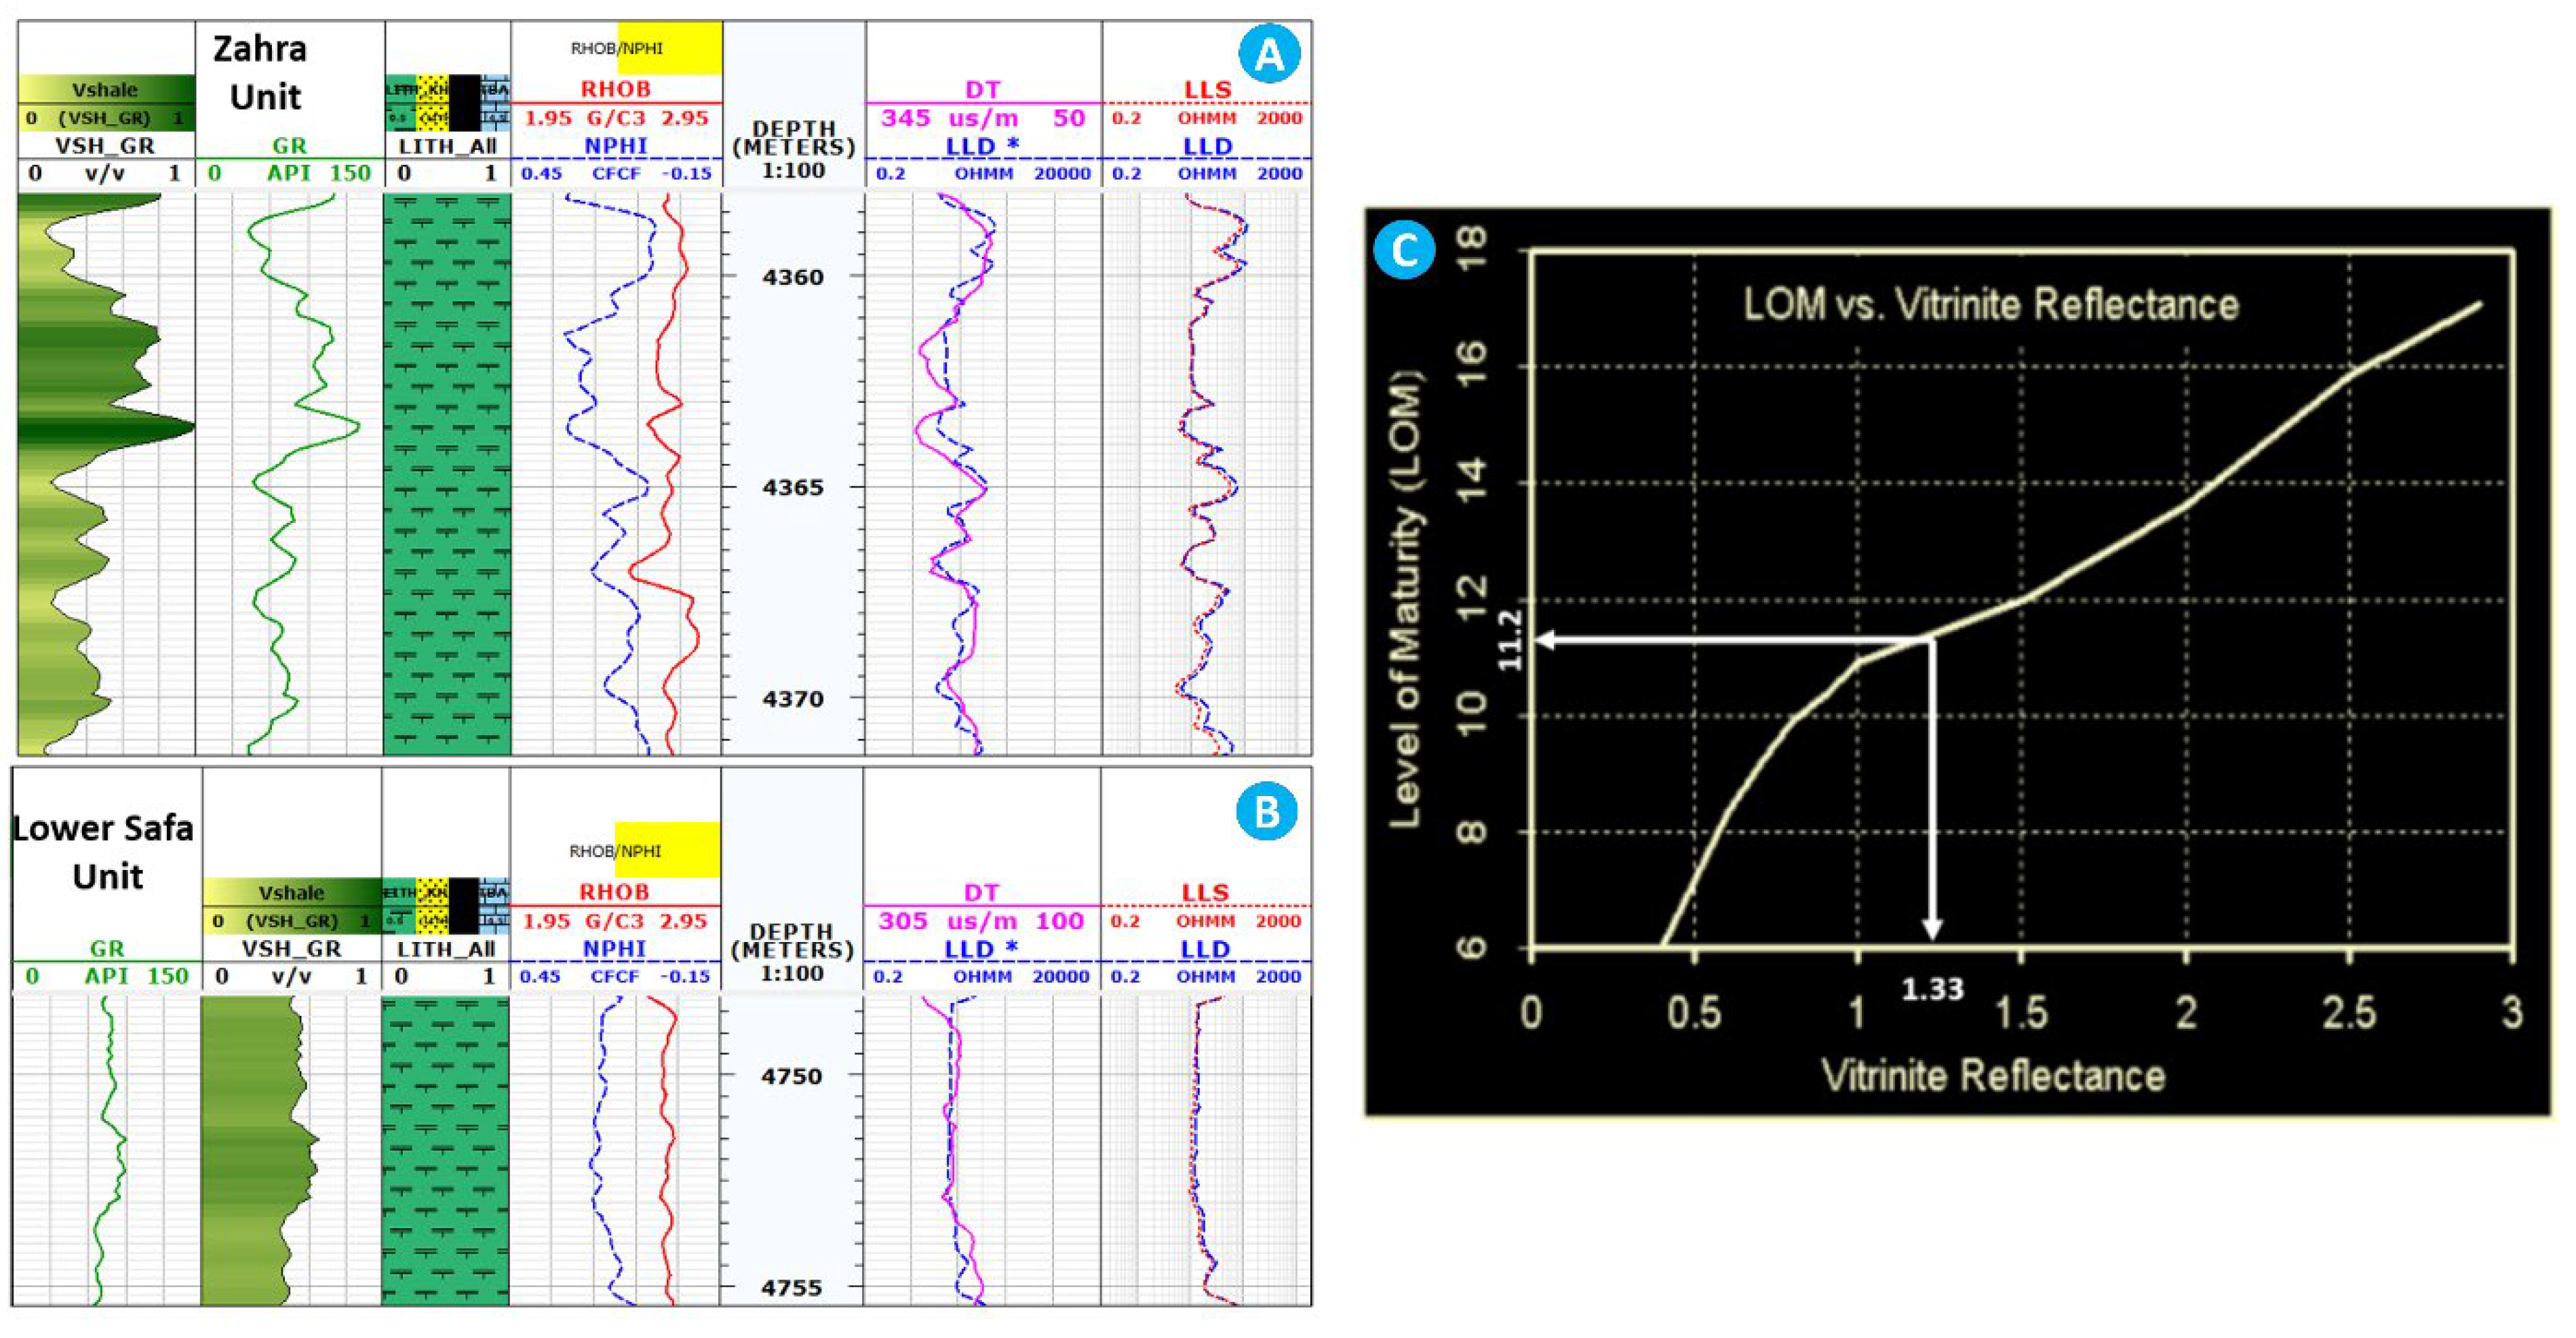
Figure 4.
The workflow of the rock mechanics assessment and used equations to detect the brittle and ductile intervals in the Khatatba Formation in the Imhotep W-1X well.
Figure 4.
The workflow of the rock mechanics assessment and used equations to detect the brittle and ductile intervals in the Khatatba Formation in the Imhotep W-1X well.
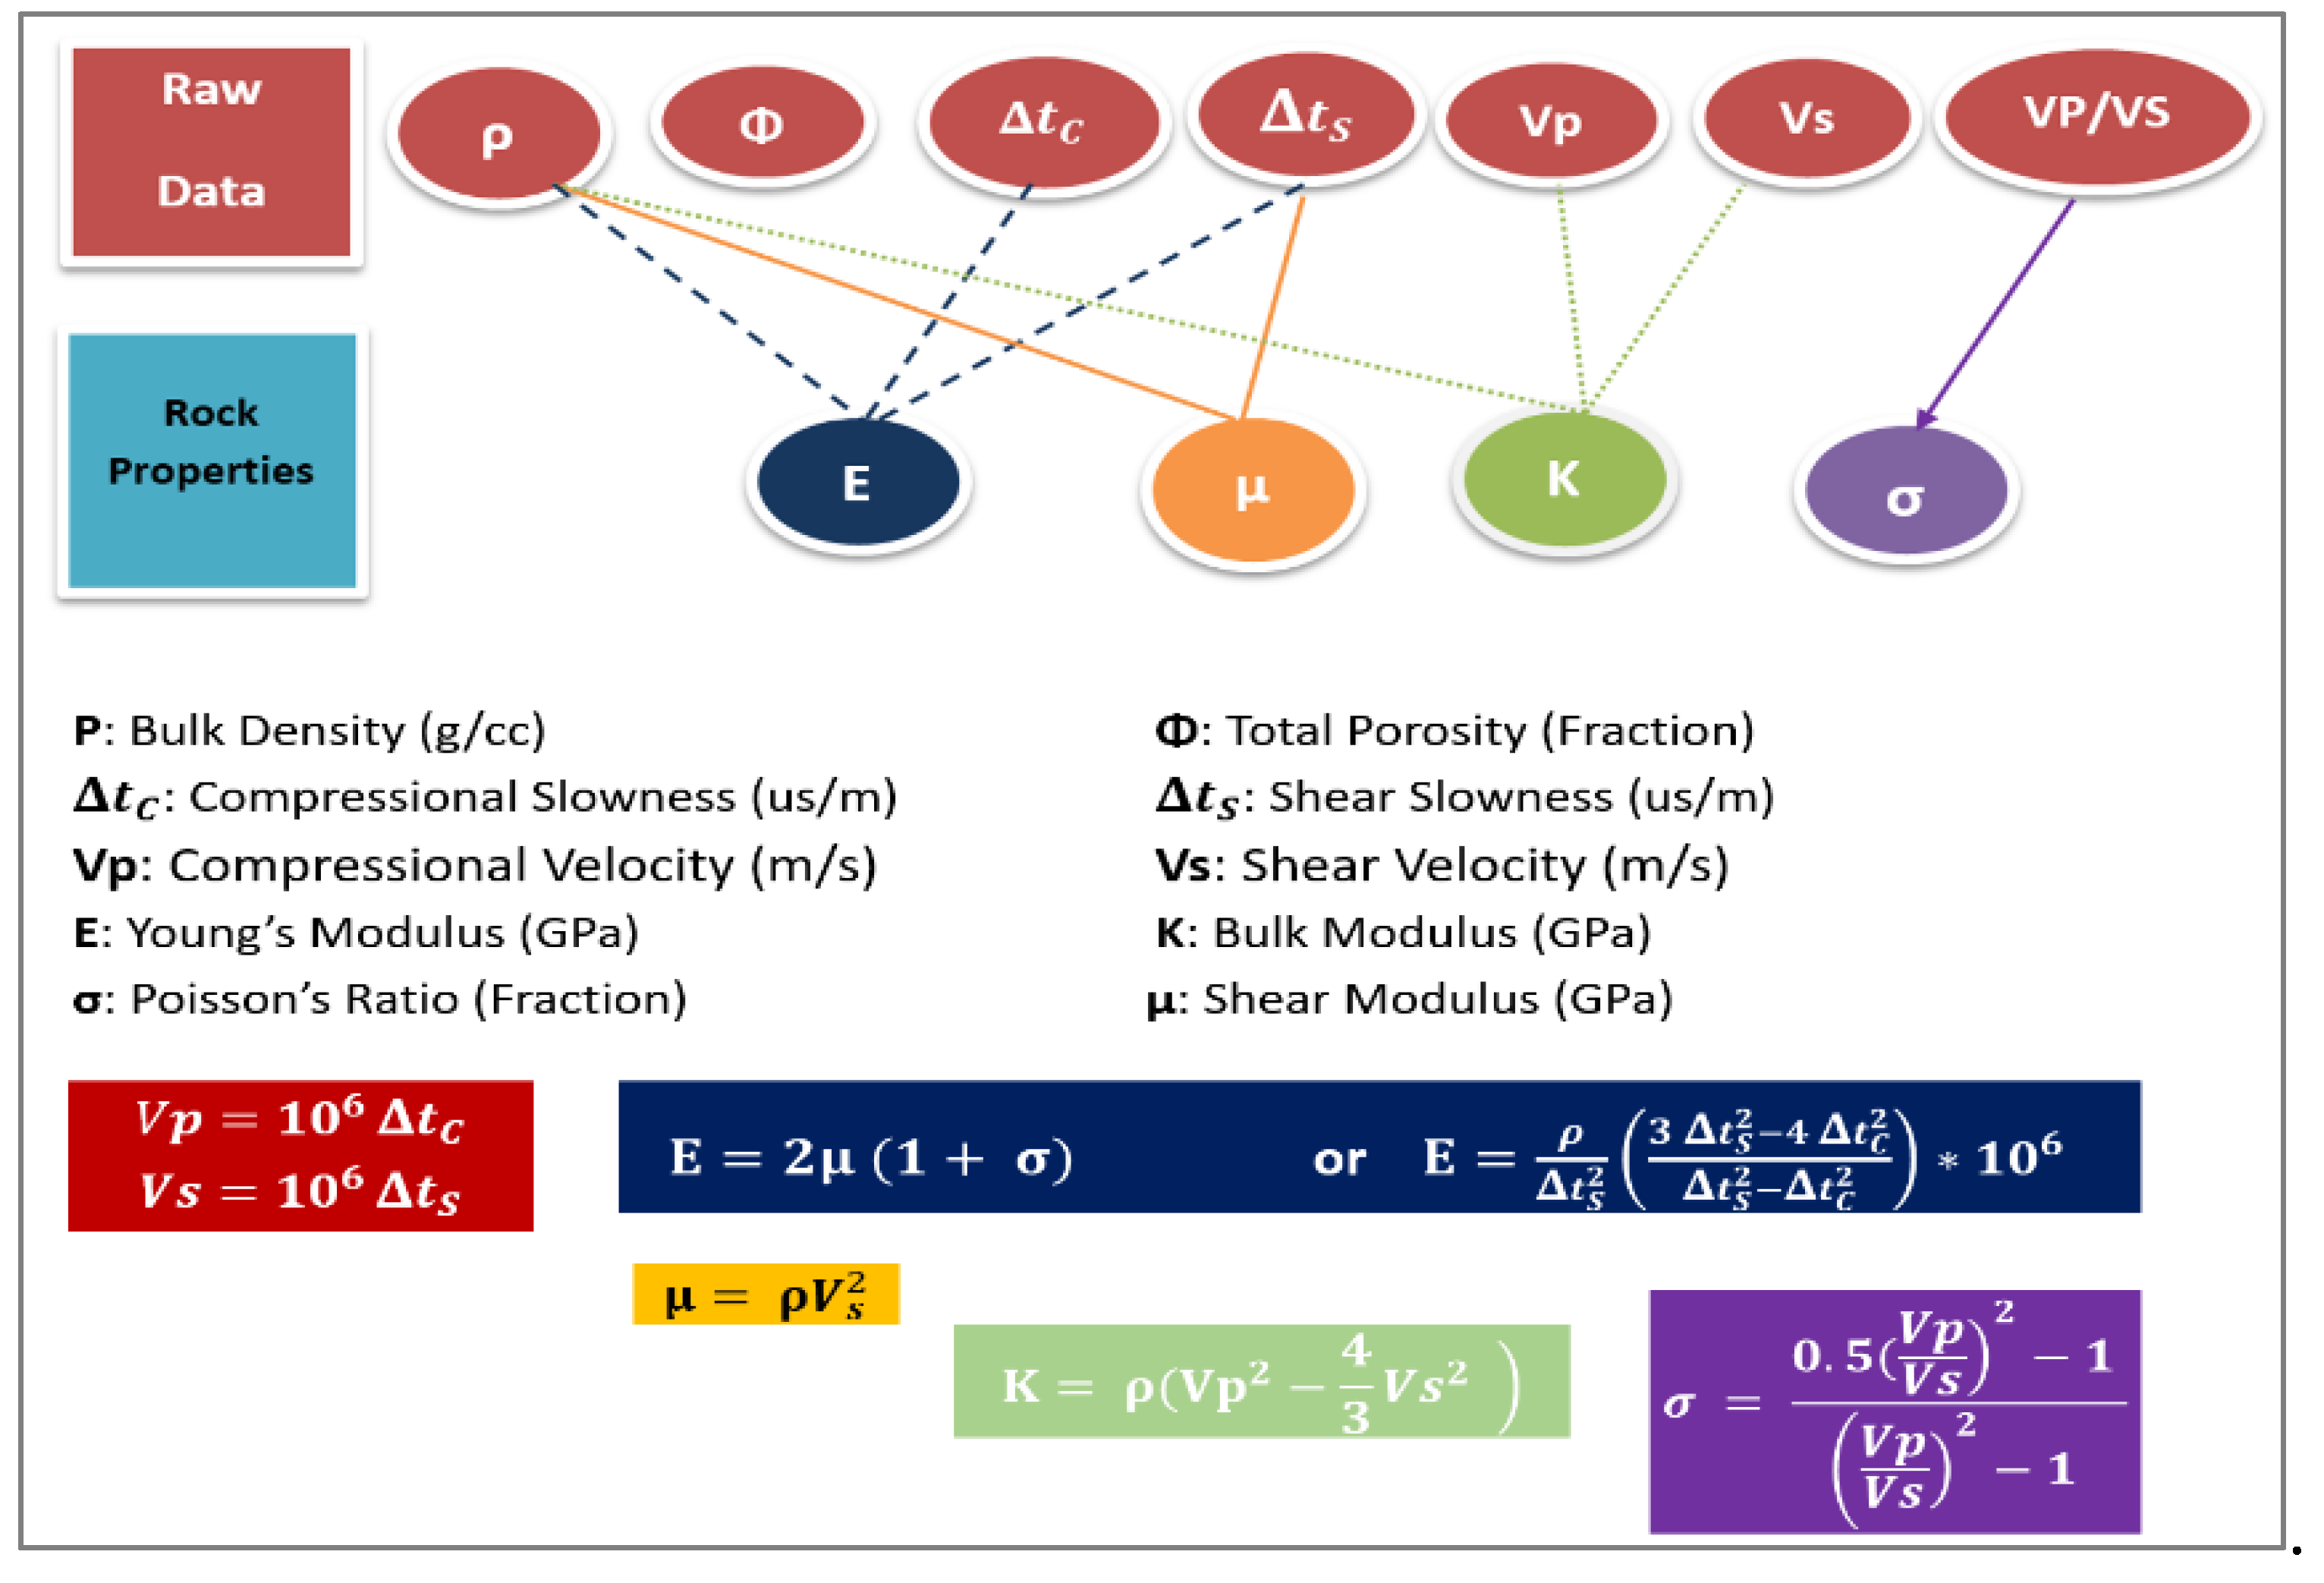
Figure 5.
The depositional settings and a geochemical log showing the source rock potential, kerogen type, and level of thermal maturation of the Khatatba Formation in the Imhotep W-1X well, the Matruh Basin, the northwest of Egypt.
Figure 5.
The depositional settings and a geochemical log showing the source rock potential, kerogen type, and level of thermal maturation of the Khatatba Formation in the Imhotep W-1X well, the Matruh Basin, the northwest of Egypt.
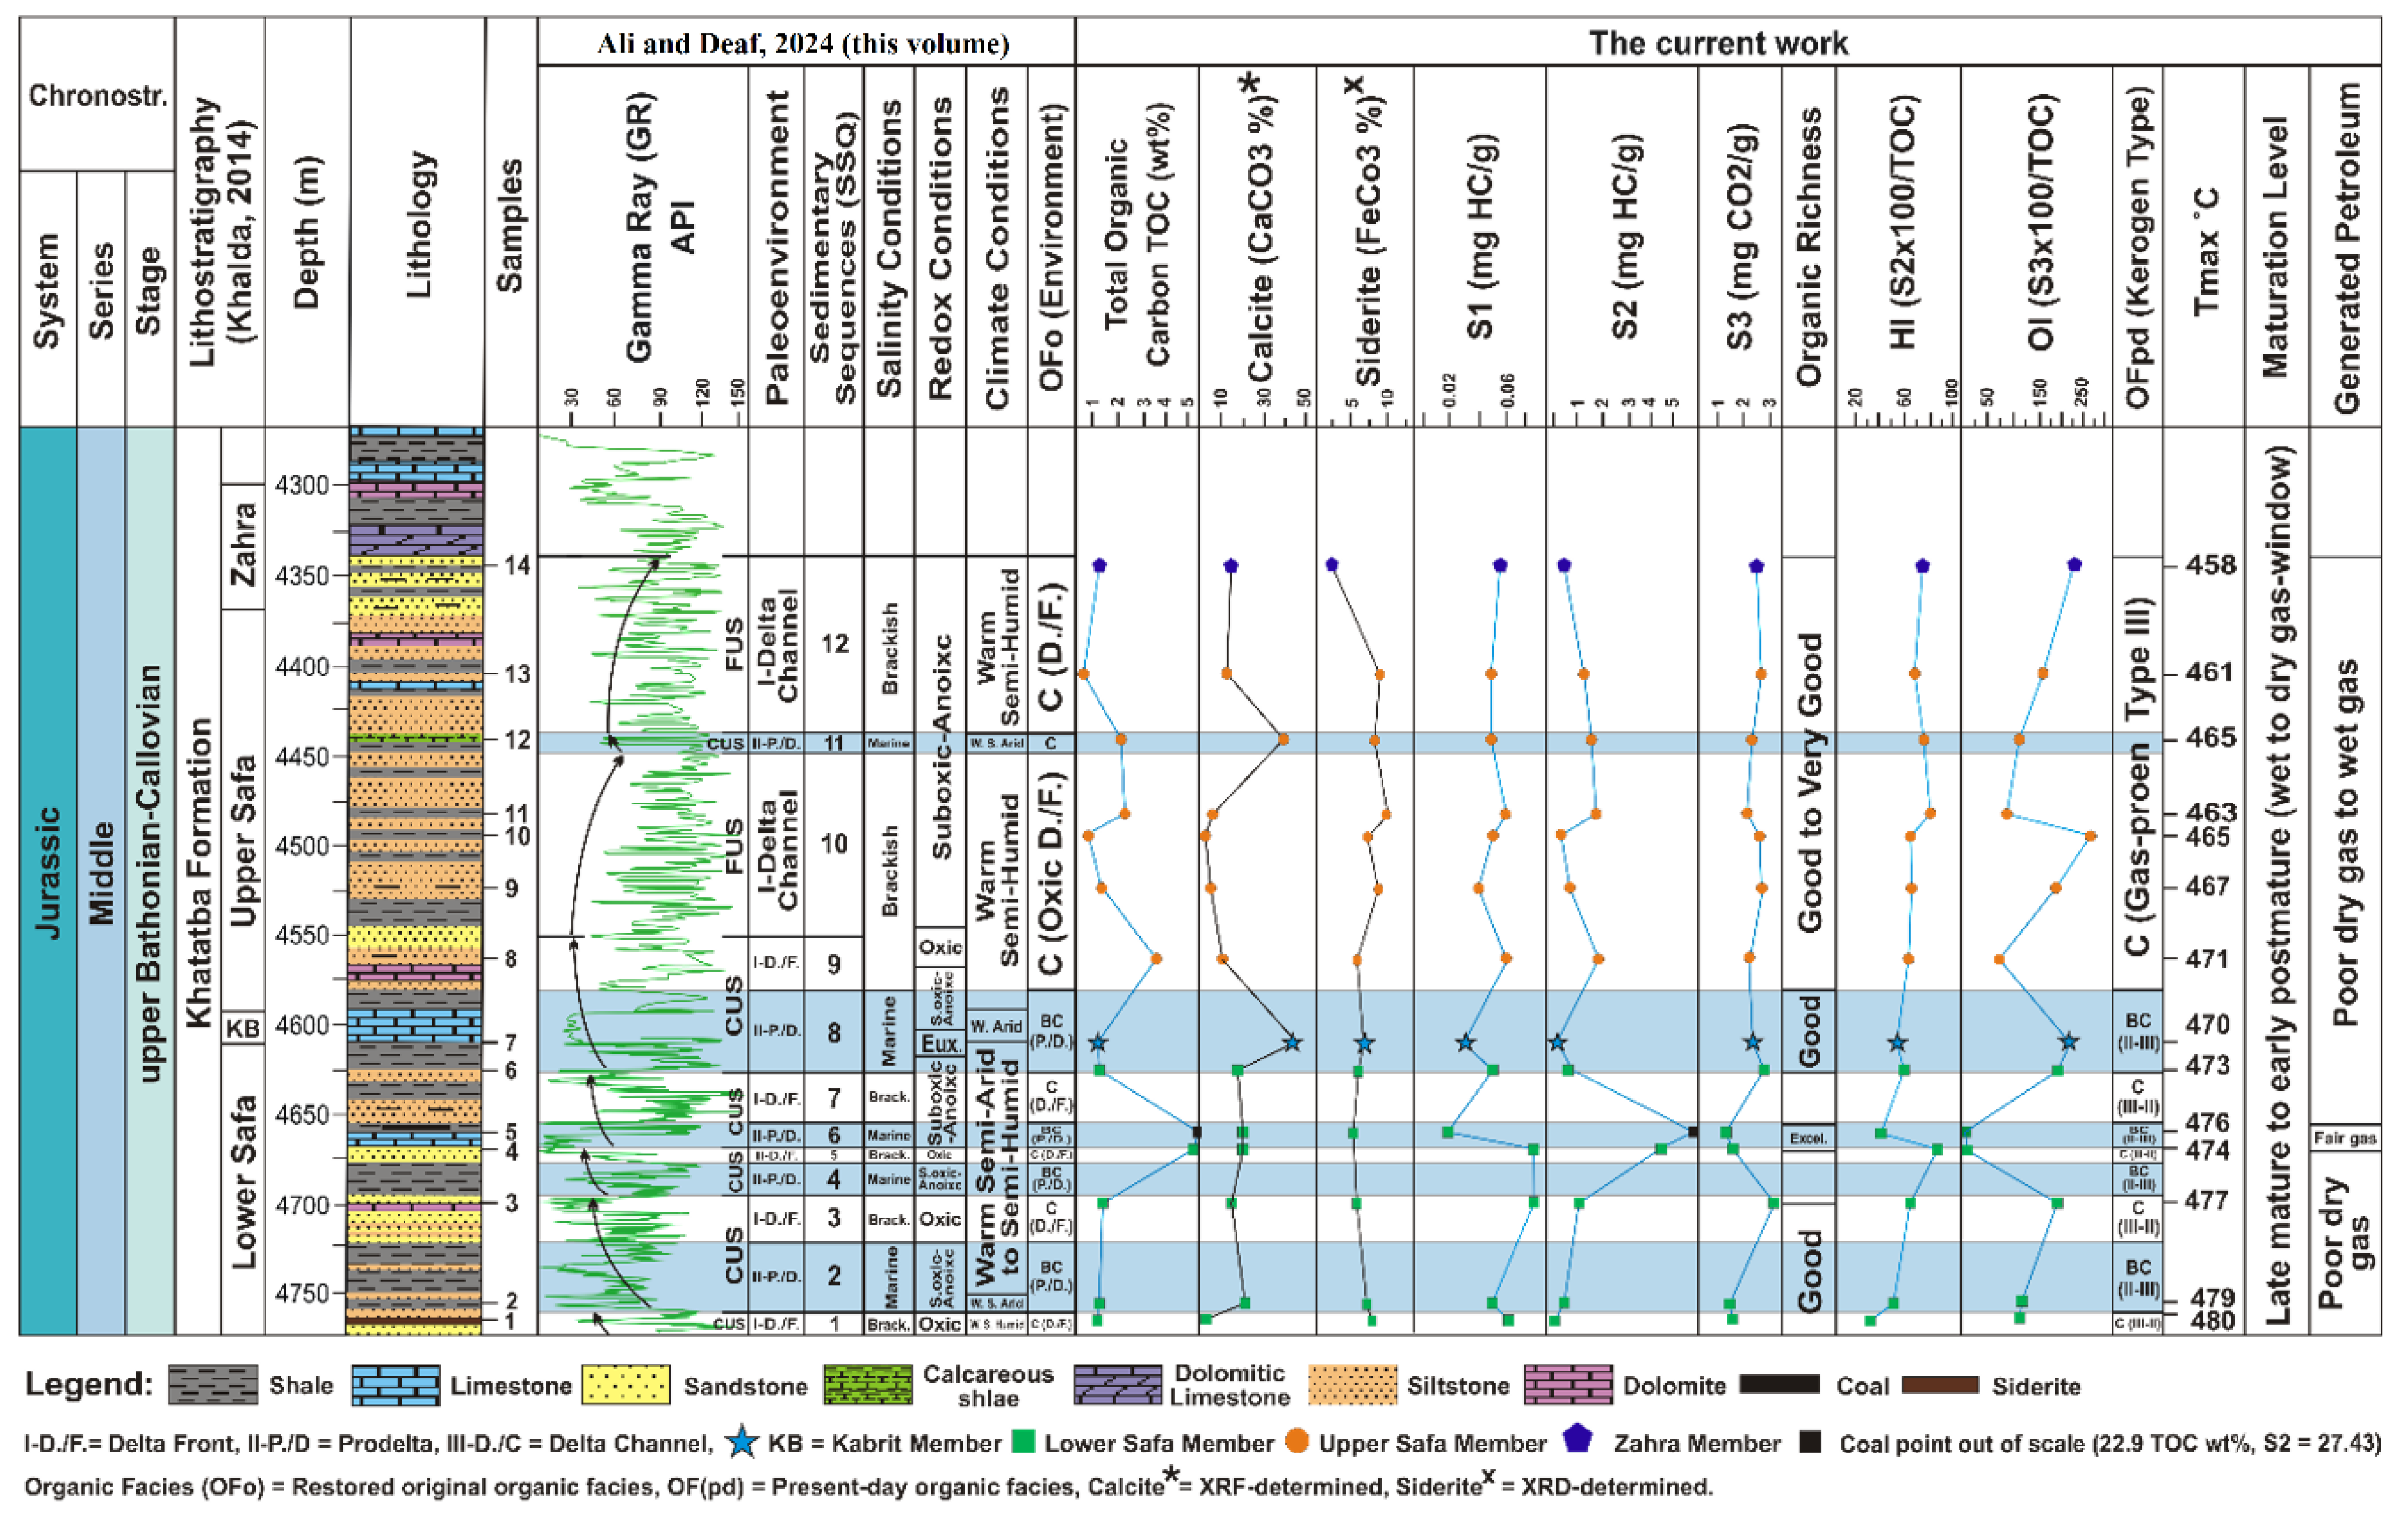
Figure 6.
(a): A cross-plot of the geochemically measured TOC and the geophysically estimated (DLogR) data showing high correlation coefficient values for the Lower Safa and Upper Safa members in the Imhotep W-1X well. (b): Correlation between the geochemically determined TOC data and the geophysically estimated TOC data from the [45] method also shows good consistency at shale samples only.
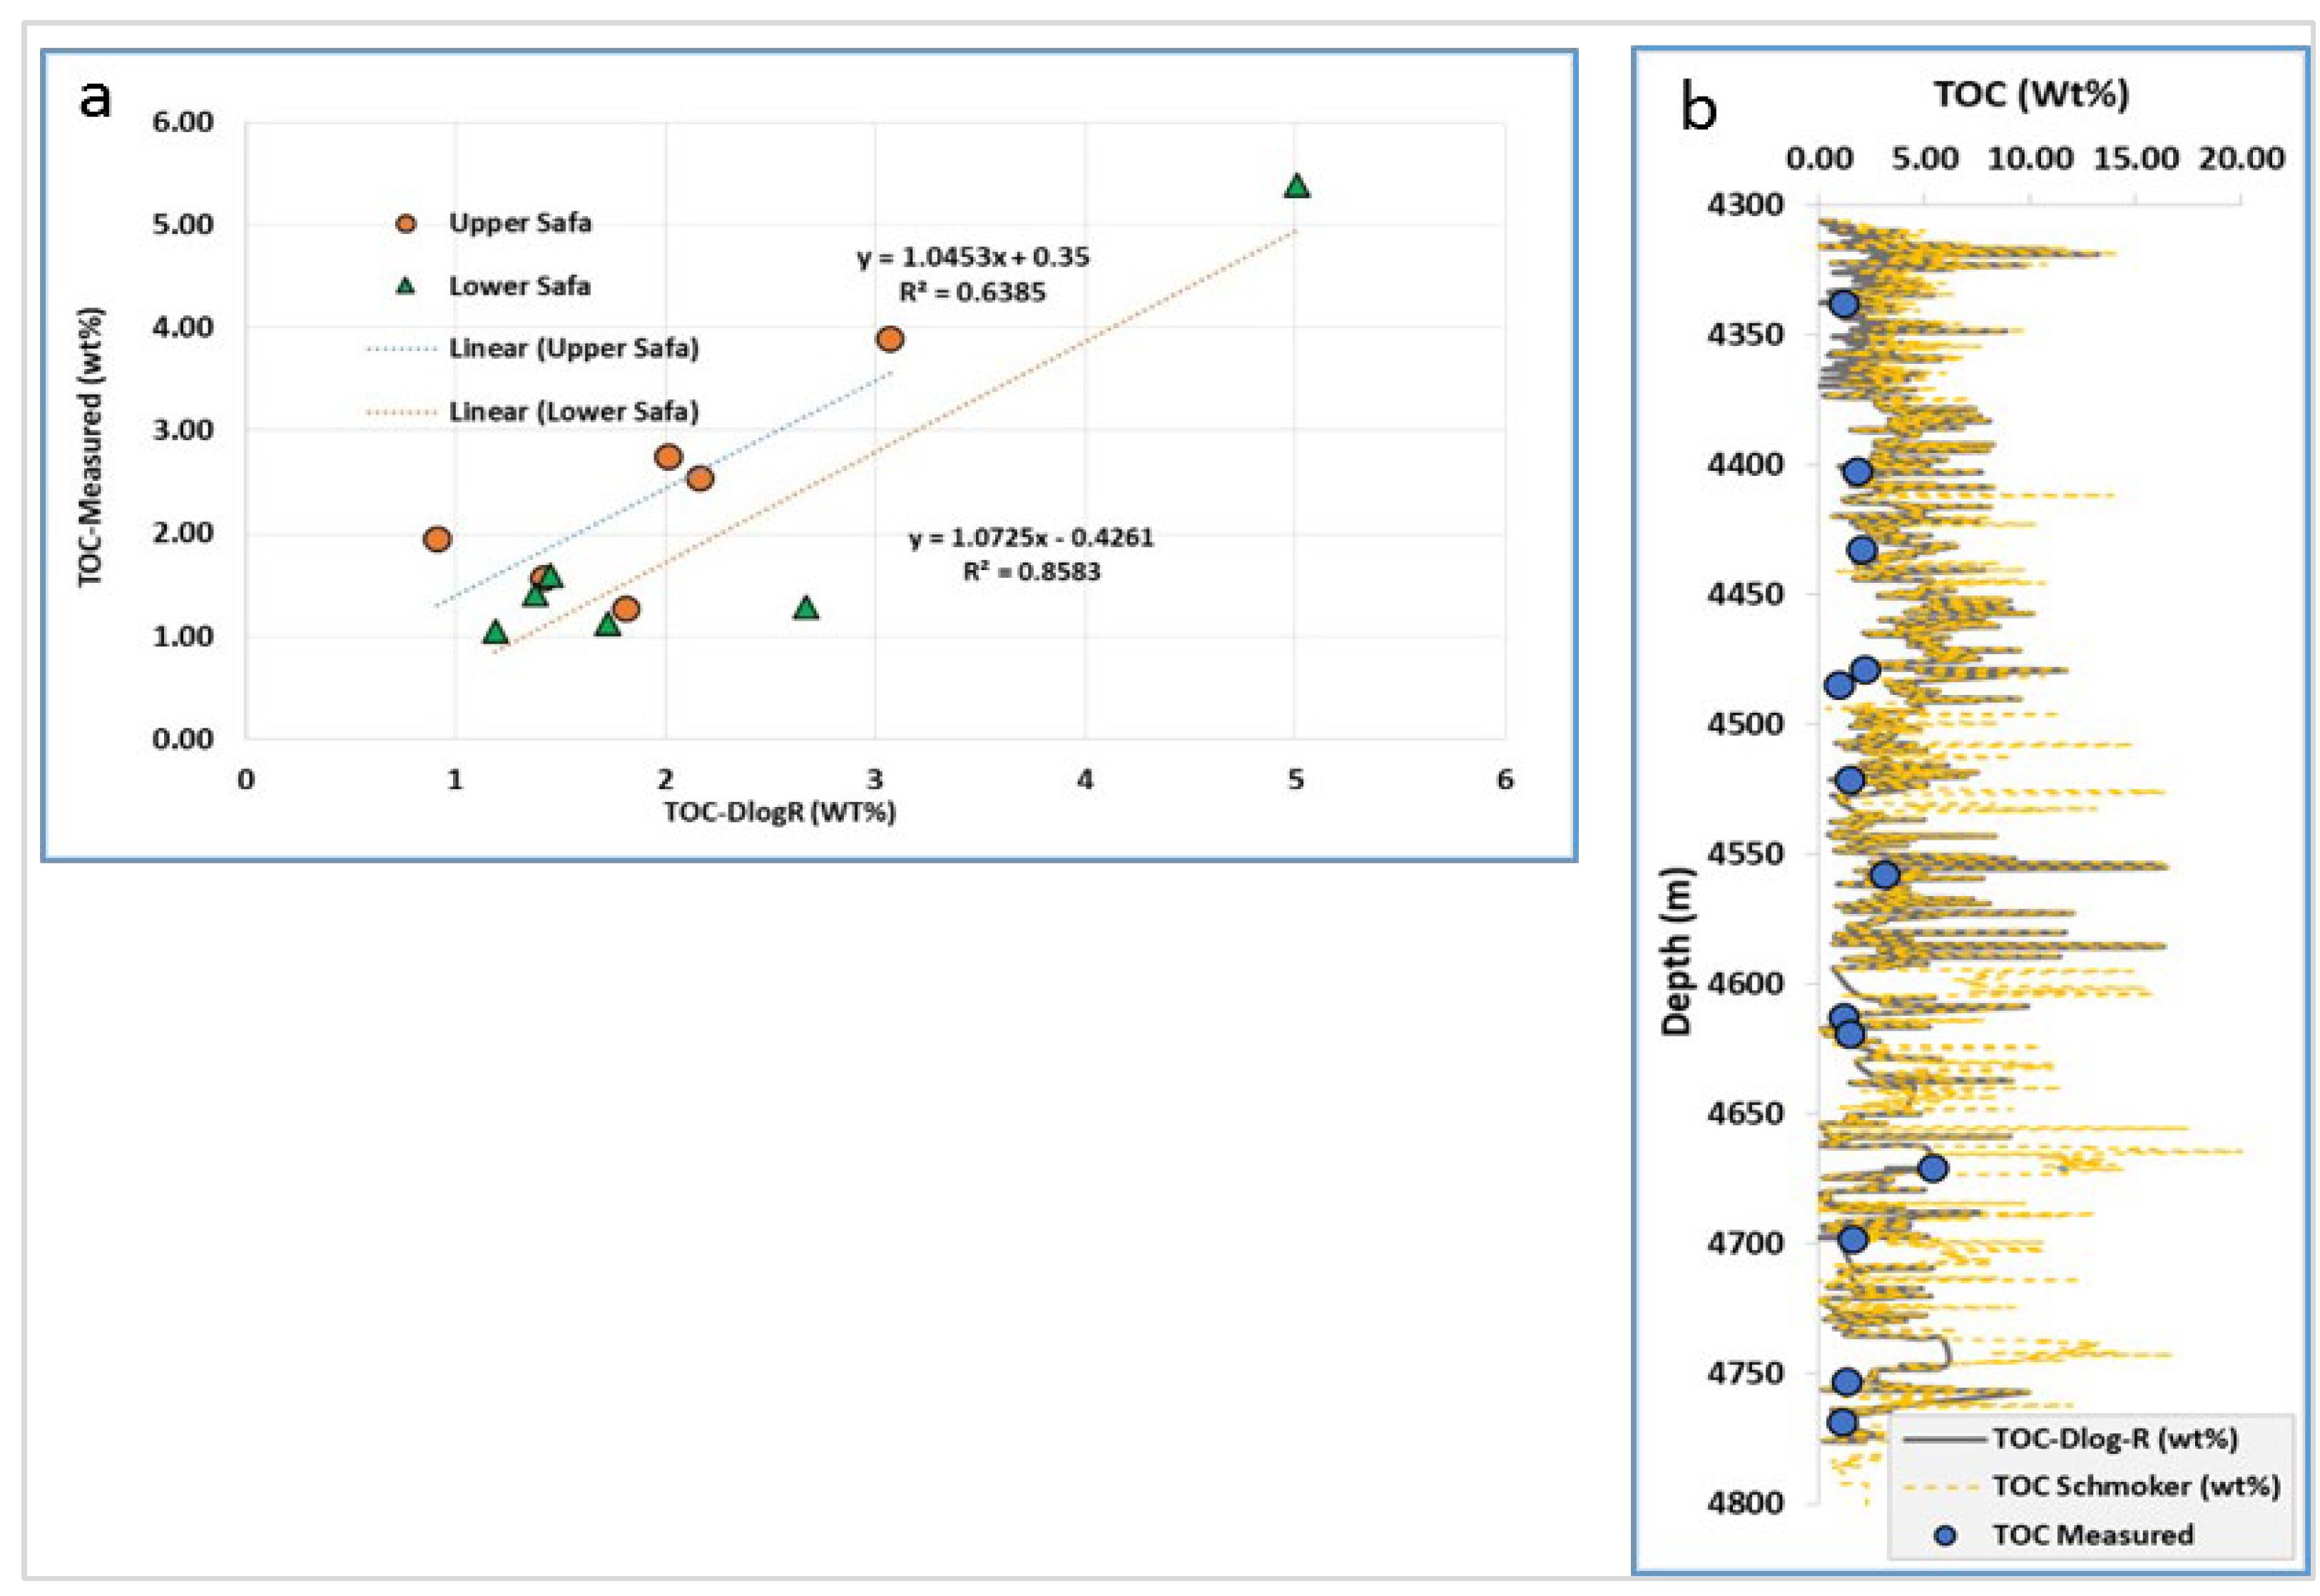
Figure 7.
(A): Plot of the oxygen index (OI) versus the hydrogen index (HI) data indicating a gas-prone kerogen type III in the Khatatba Formation. (B): Plot of Tmax versus HI data indicating late mature to postmature source rocks in the Khatatba Formation, the Imhotep W-1X well, the Matruh Basin, northwestern Egypt.
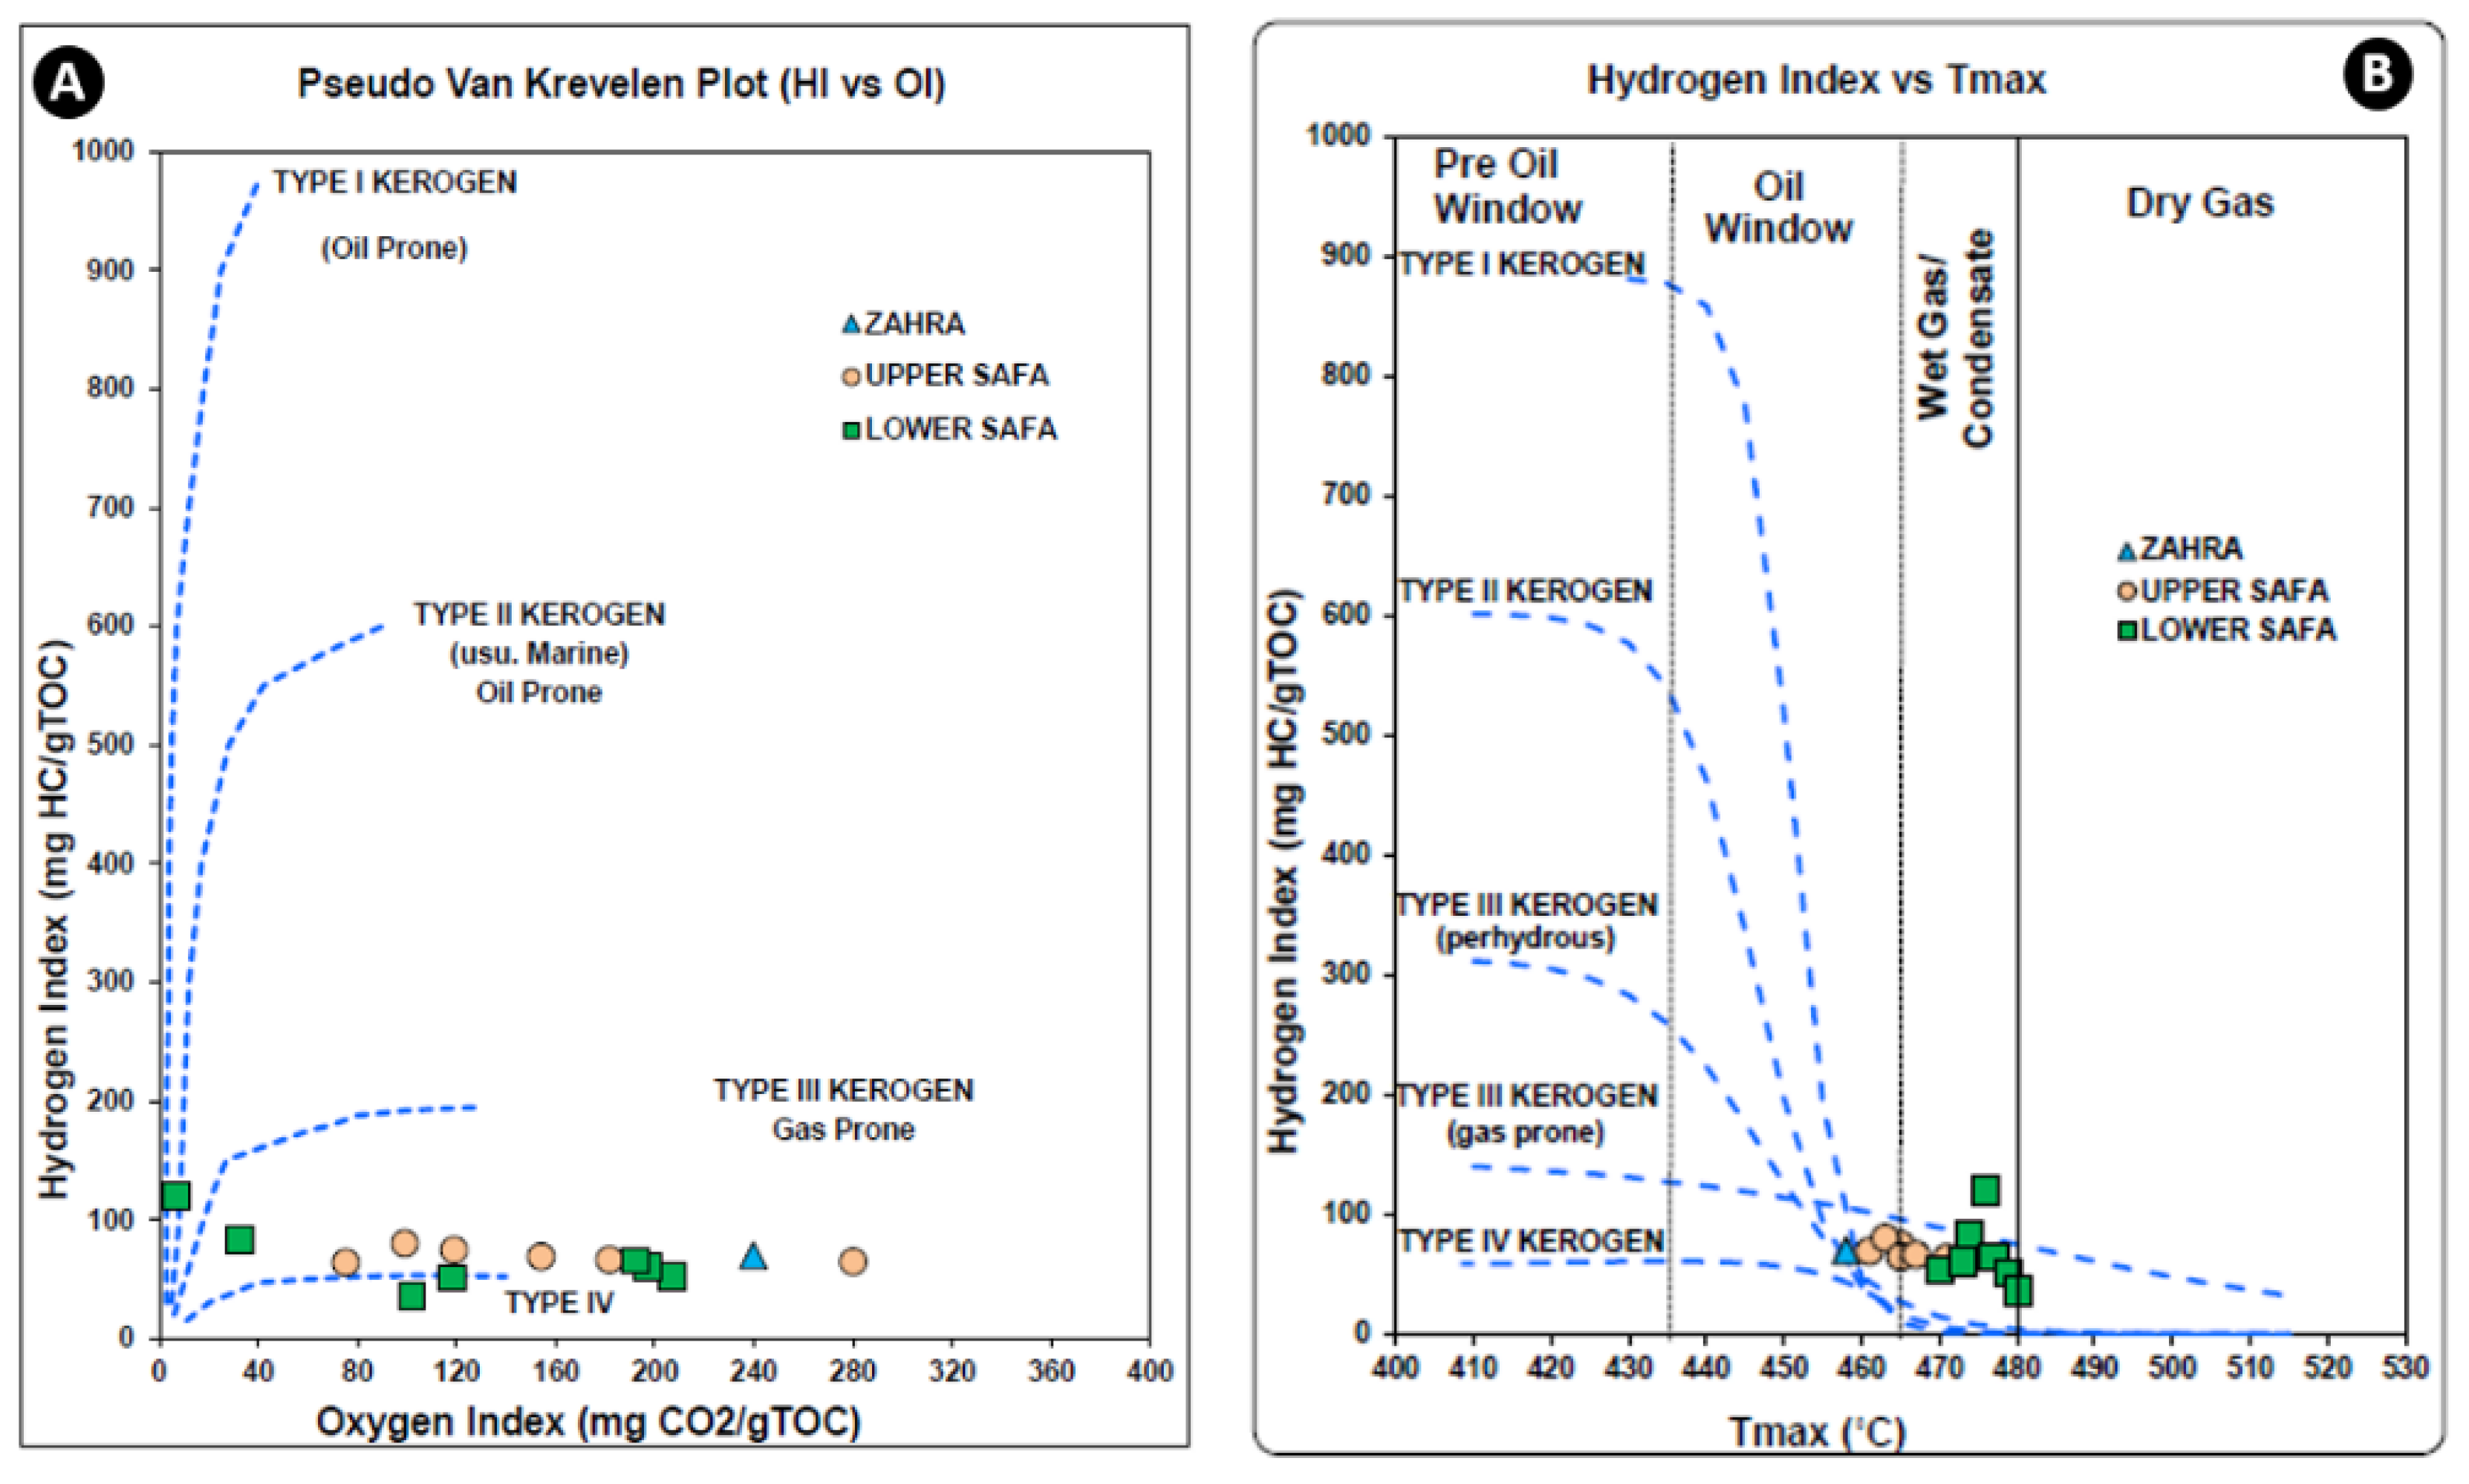
Figure 8.
(A): Cross plots between the OI and calcite, and (B): Cross plots between the OI and siderite, indicating a null impact on the kerogen quality of the Khatatba Formation in the Imhotep W-1X well.
Figure 8.
(A): Cross plots between the OI and calcite, and (B): Cross plots between the OI and siderite, indicating a null impact on the kerogen quality of the Khatatba Formation in the Imhotep W-1X well.
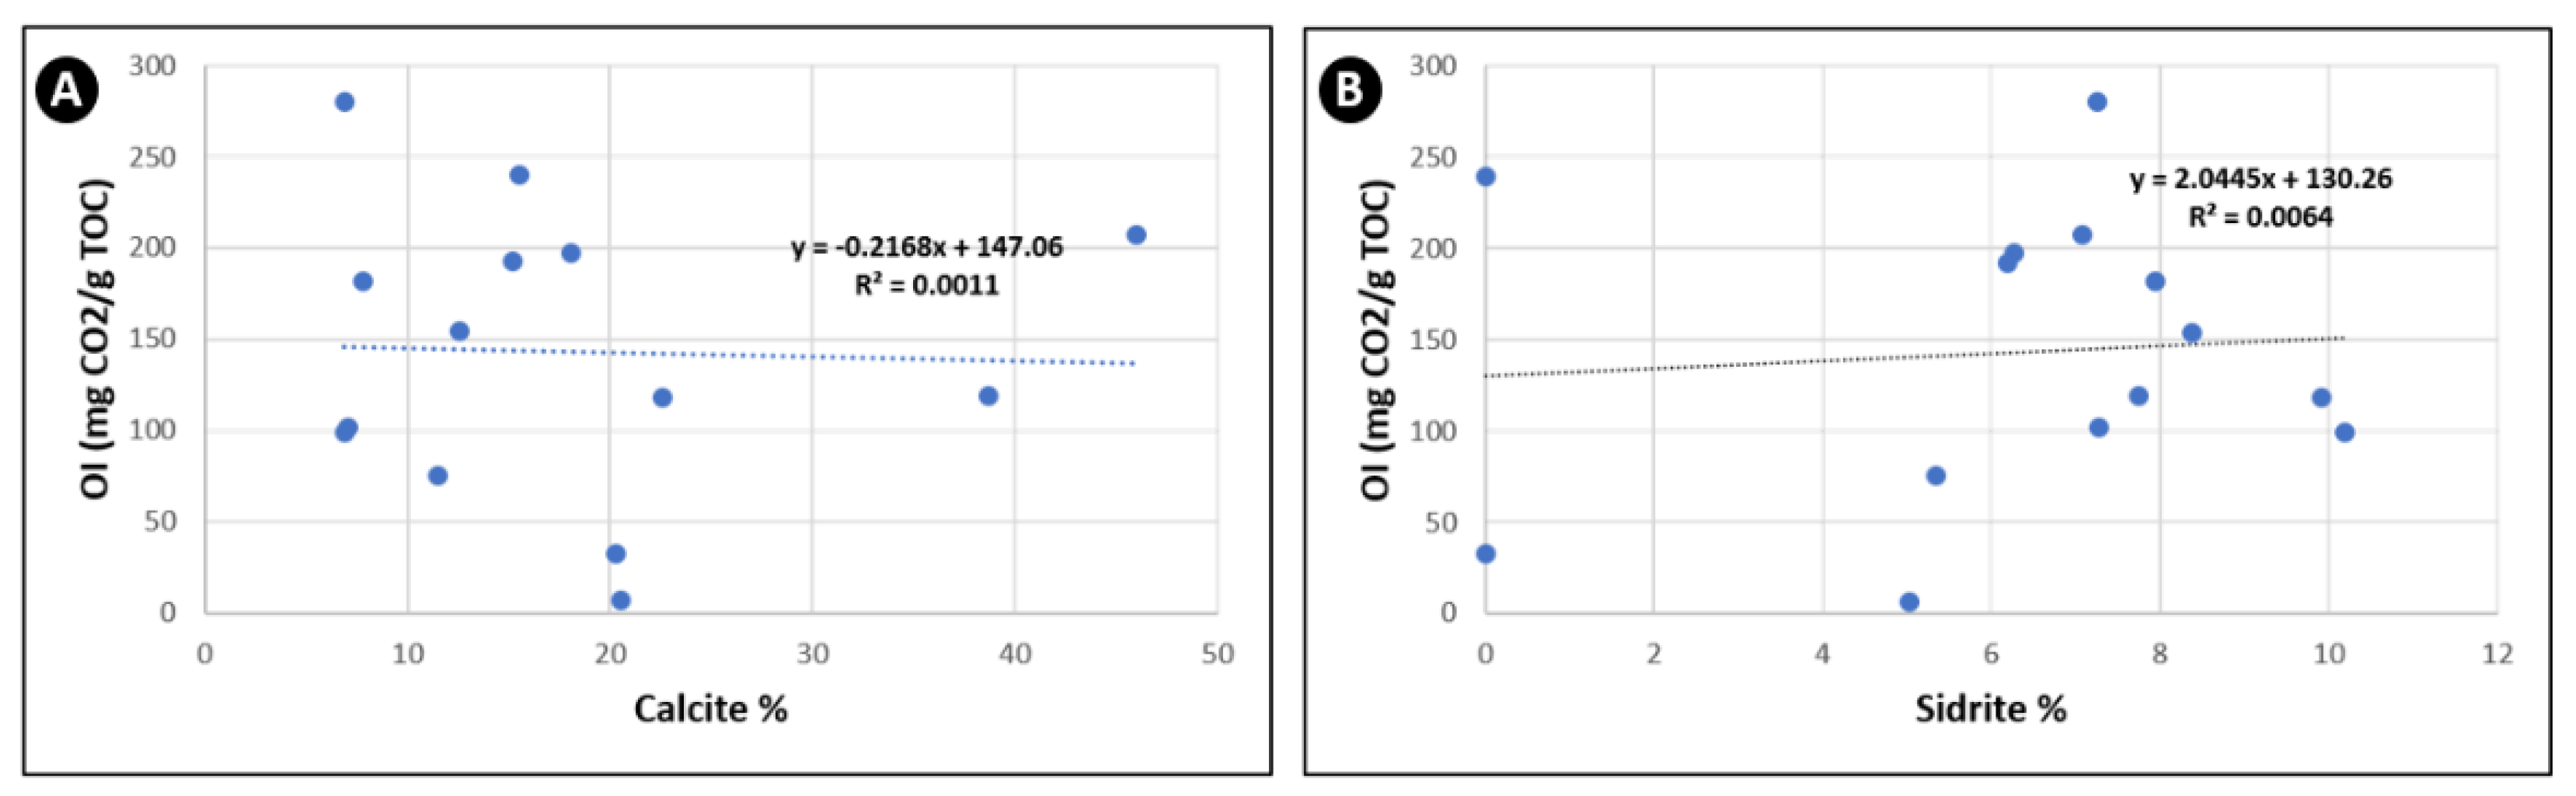
Figure 9.
Plot of the kerogen constituents recovered from the Khatatba Formation in the Imhotep W-1X well in the amorphous organic matter (AOM)–Phytoclasts–Palynomorphs (APP) of Tyson (1995) 49 and Liptinite–Vitrinite–Inertinite (LVI) diagram of [51].
Figure 9.
Plot of the kerogen constituents recovered from the Khatatba Formation in the Imhotep W-1X well in the amorphous organic matter (AOM)–Phytoclasts–Palynomorphs (APP) of Tyson (1995) 49 and Liptinite–Vitrinite–Inertinite (LVI) diagram of [51].
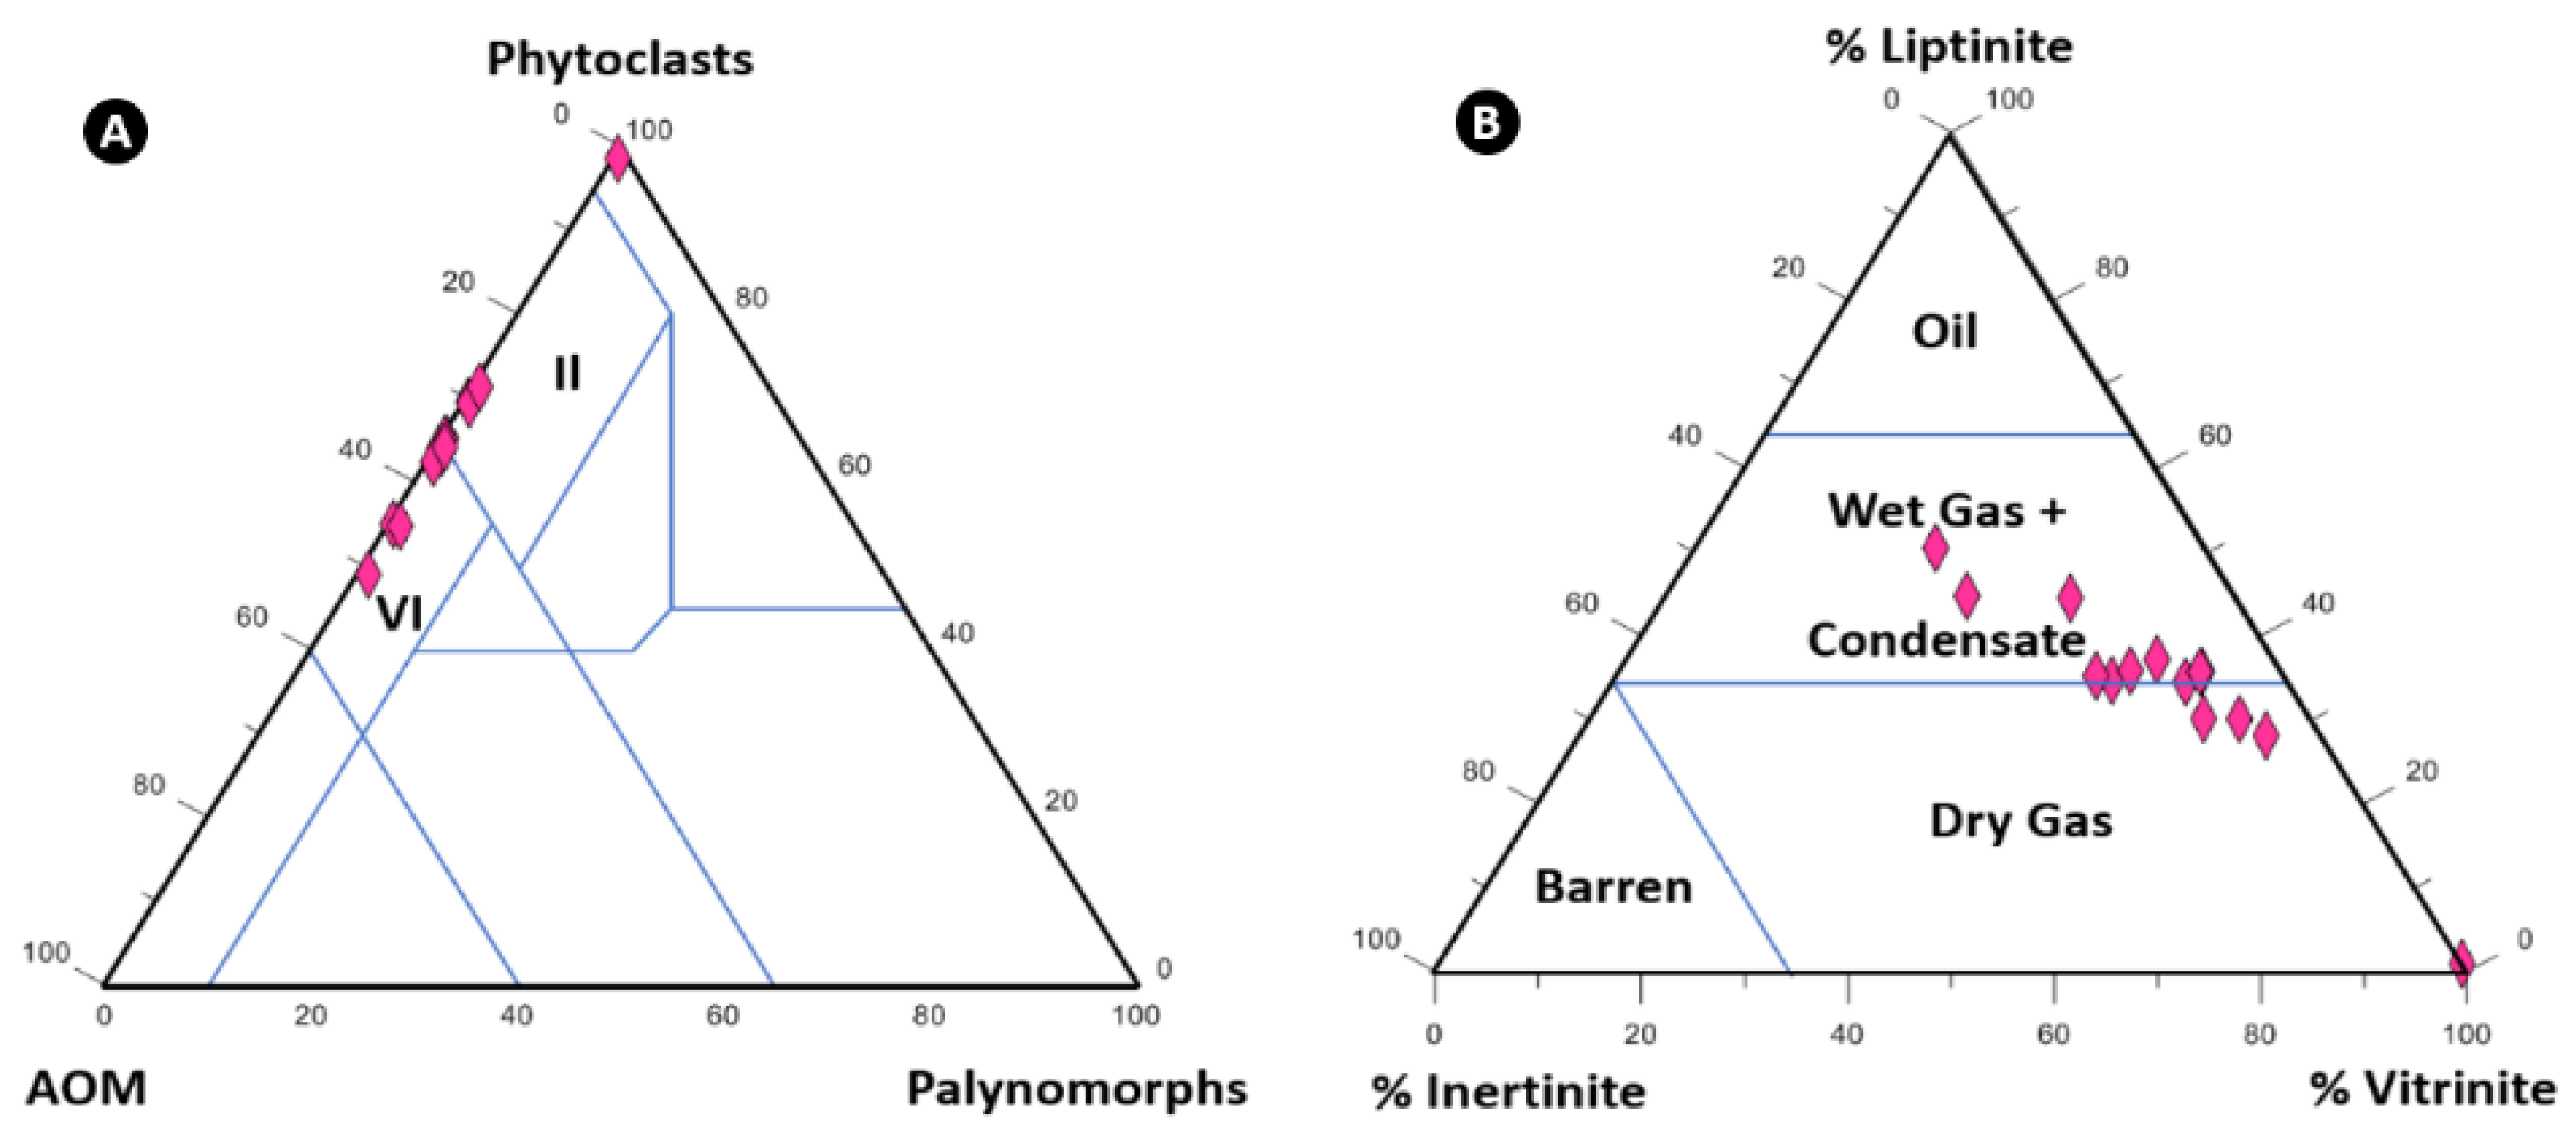
Figure 10.
Photomicrographs of spores taken under transmitted white light (TWL) recovered from the Khatatba Formation deposits in the Imhotep W-1X well. (a): A grain of pteridophyte spore from the Lower Safa Member (Sample 1, depth 4769.6 m) showing a dark brown colour, which corresponds to a TAI value of 4- and indicates a postmature phase (dry gas-window) for this member. (b): A grain of pteridophyte spore from the Upper Safa Member (Sample 13, depth 4403.8 m) showing a brown colour, which corresponds to a TAI value of 3+ and indicates a late mature phase (wet gas-window) for this member.
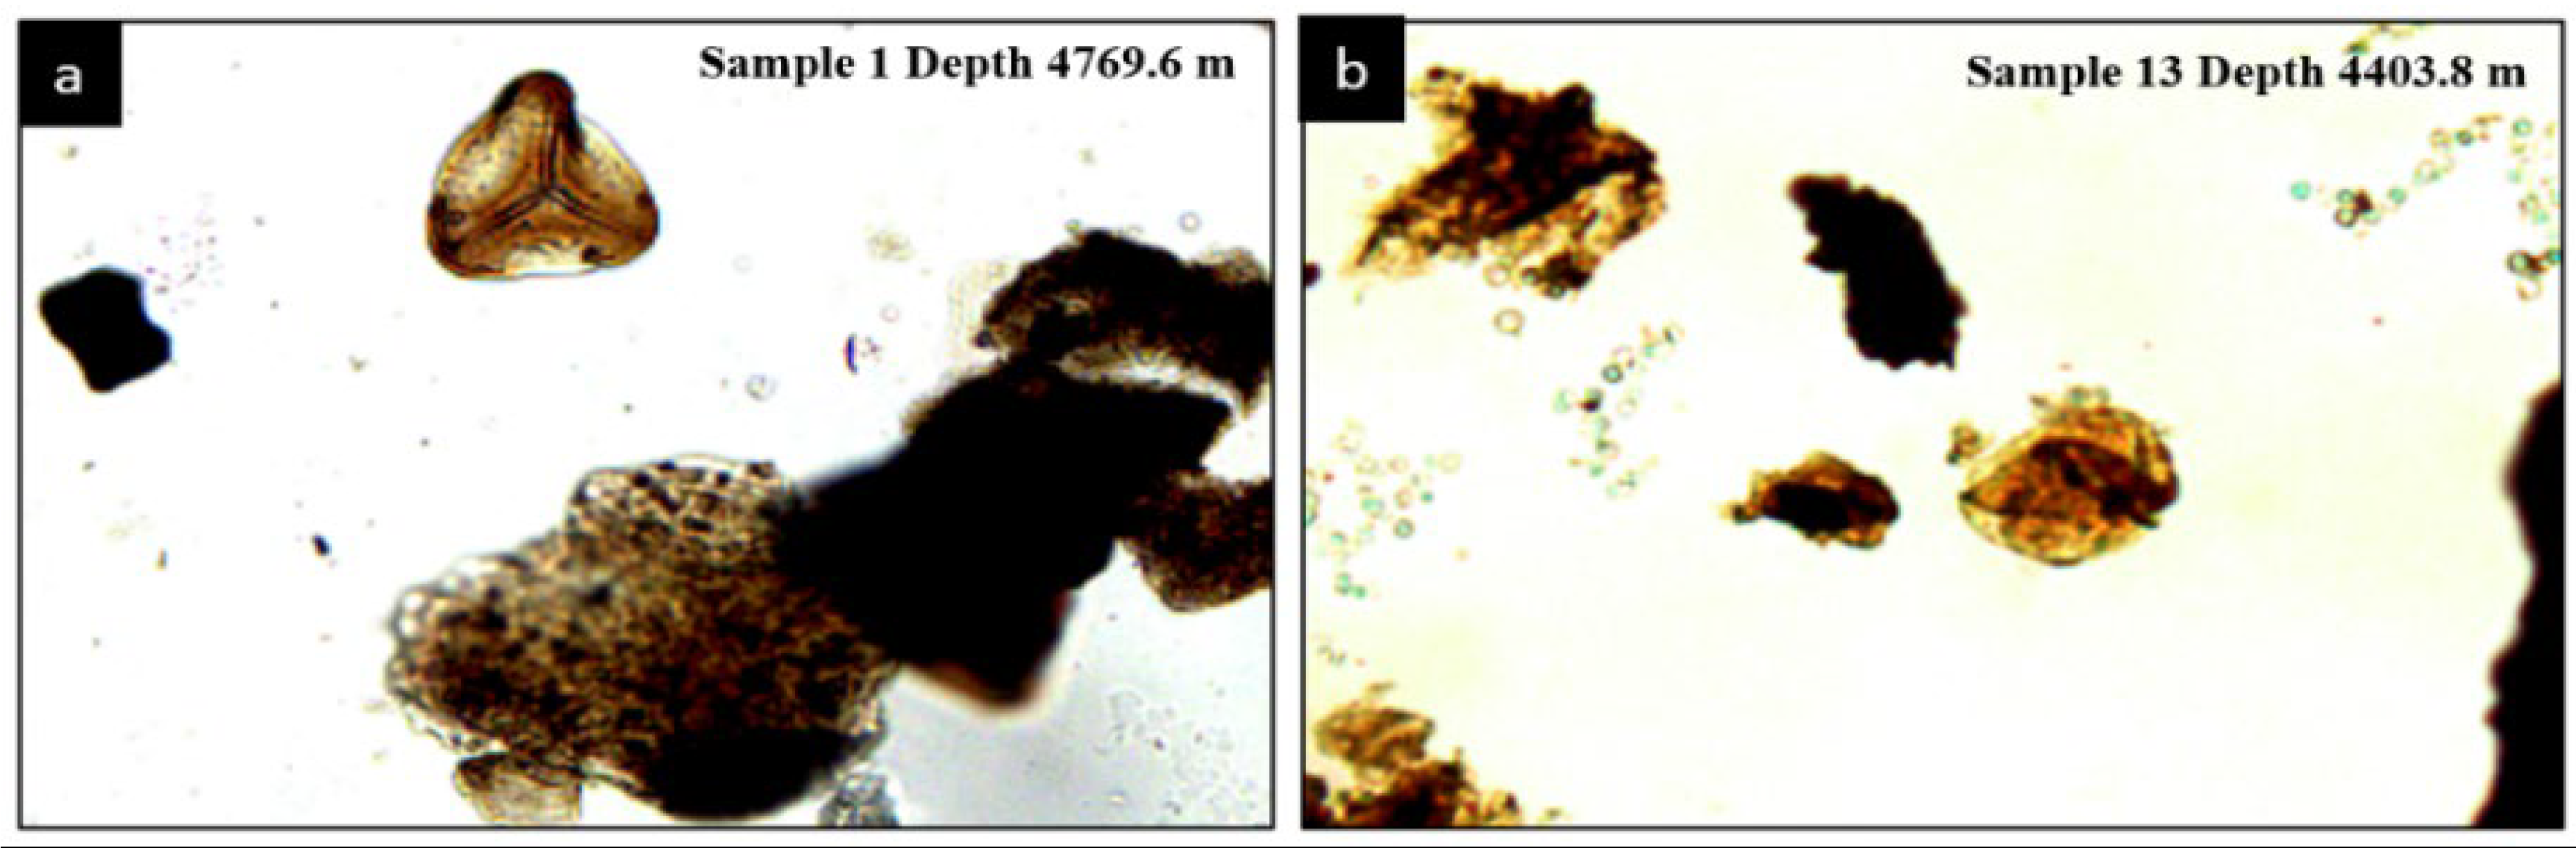
Figure 11.
Photomicrographs of organic matter recovered from the Khatatba Formation deposits in the Imhotep W-1X well. Sample 7 (depth 15143.5 m) was taken under reflected white light (RWL). (A): Primary vitrinite (Vit) in the form of collotelinite has a Ro of 1.37%. (B): Vitrinite (Vit) as collotelinite with a VRo value of 1.33%. (C): As with (A) and (B), the VRo value is 1.35%. (D): Vitrinite with a VRo value of 1.37% enclosing inertinite (Int). (E): vitrinite as collotelinite with a VRo value of 1.32%. (F): Vitrinite with a VRo of 1.39% is associated with clay minerals. (G): Same as (F). (H): Vitrinite band (collotelinite) having a VRo value of 1.38%.
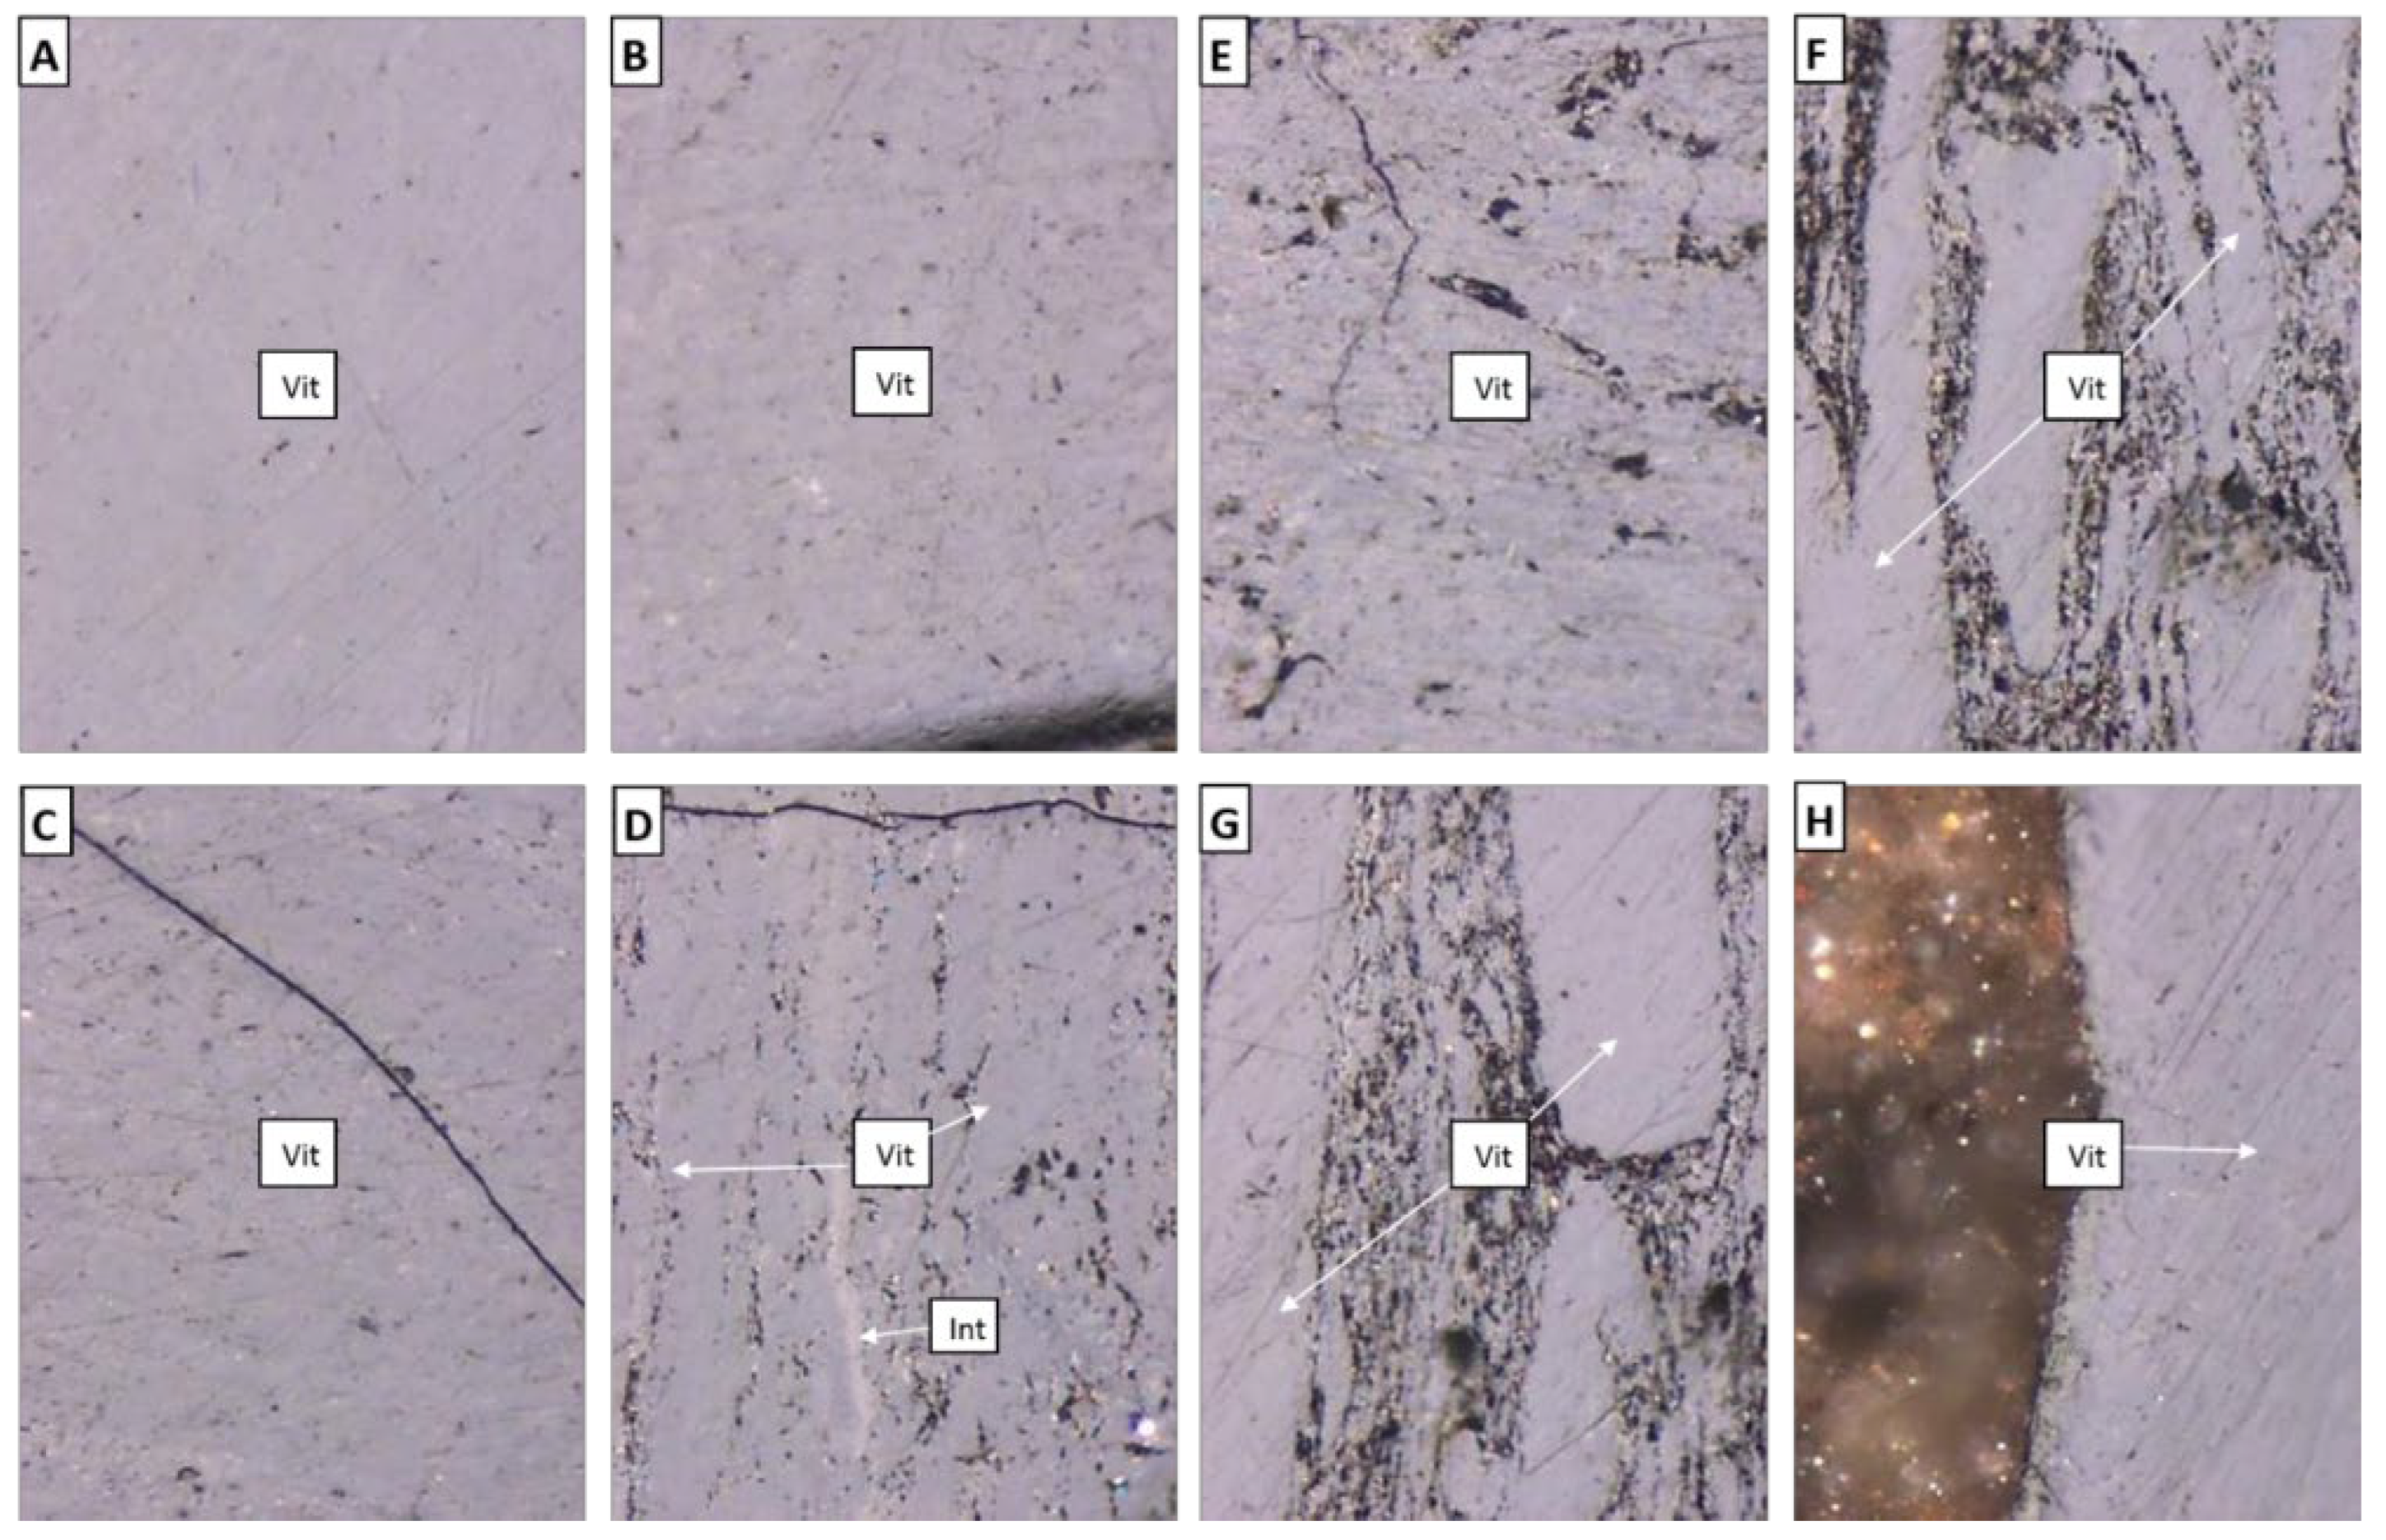
Figure 12.
Relationship between the source rock maturity (TOC%) and brittleness index for the shale of the Upper Safa Member.
Figure 12.
Relationship between the source rock maturity (TOC%) and brittleness index for the shale of the Upper Safa Member.
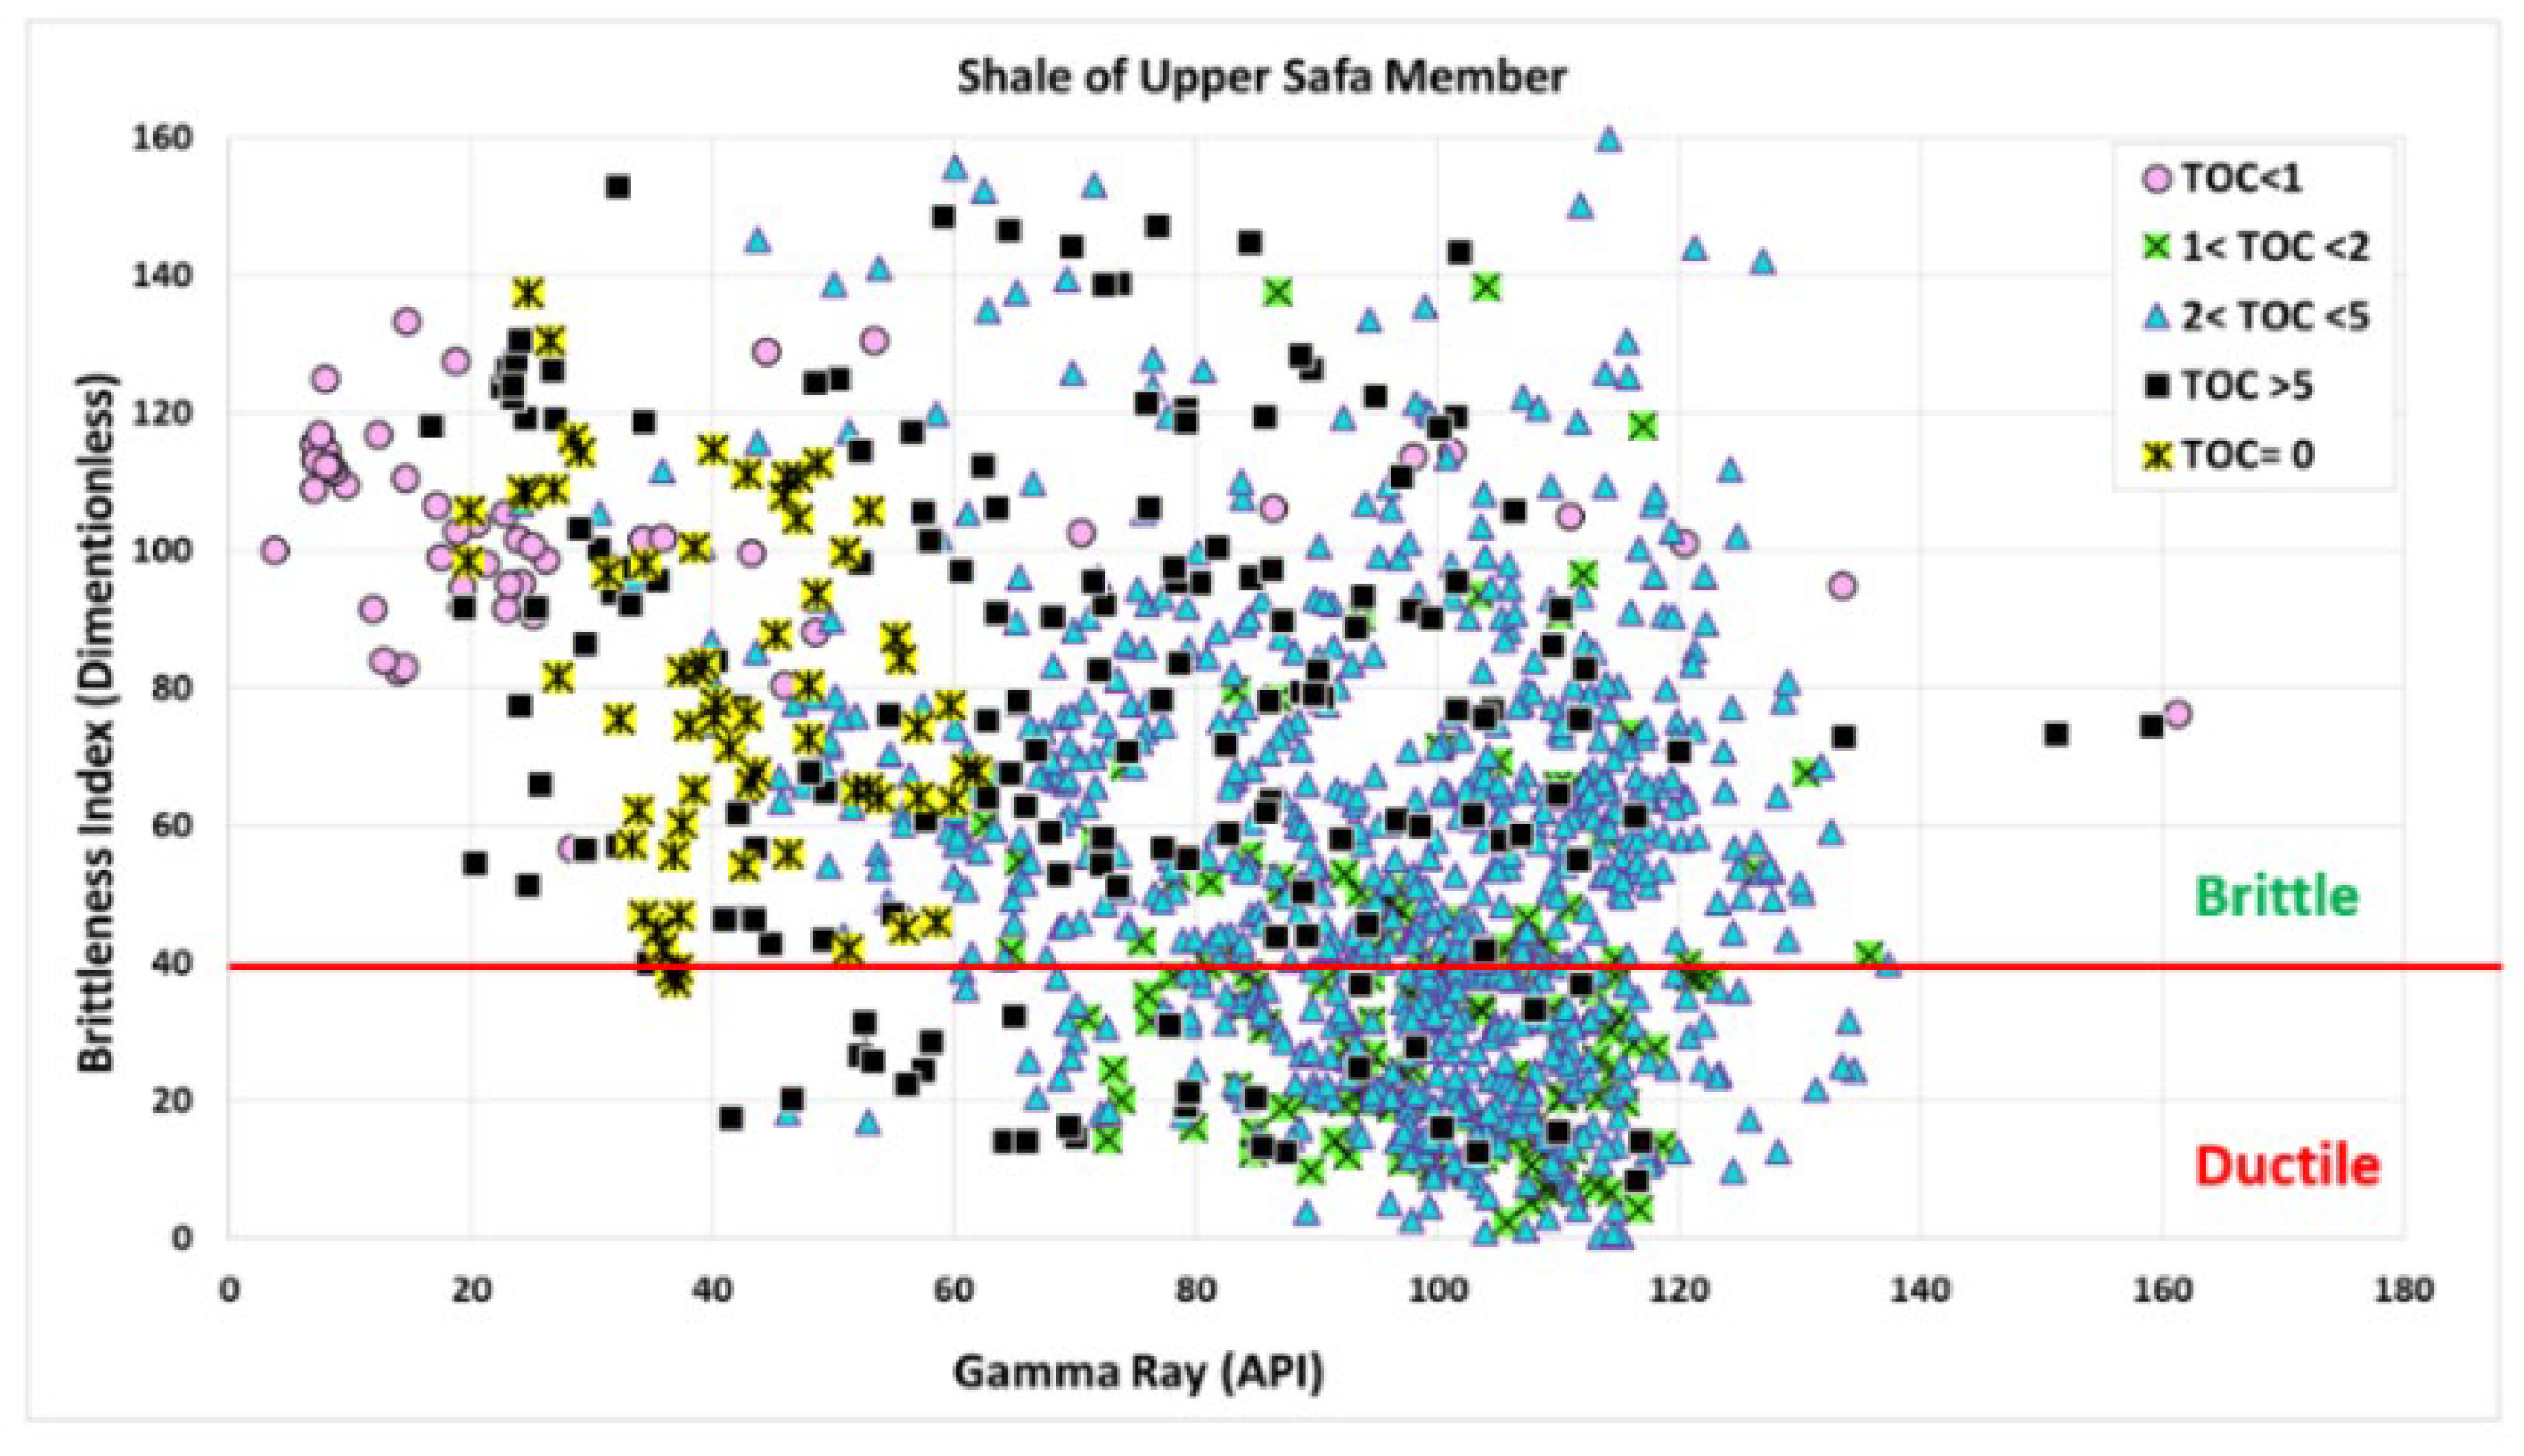
Figure 13.
(a): Young’s modulus vs. Poisson’s ratio of Lower Safa member’s shale shows the brittle and ductile behavior of the shale. (b): Young’s modulus vs. Poisson’s ratio of Upper Safa member’s shale shows the ductile and brittle behaviour of the shale.
Figure 13.
(a): Young’s modulus vs. Poisson’s ratio of Lower Safa member’s shale shows the brittle and ductile behavior of the shale. (b): Young’s modulus vs. Poisson’s ratio of Upper Safa member’s shale shows the ductile and brittle behaviour of the shale.
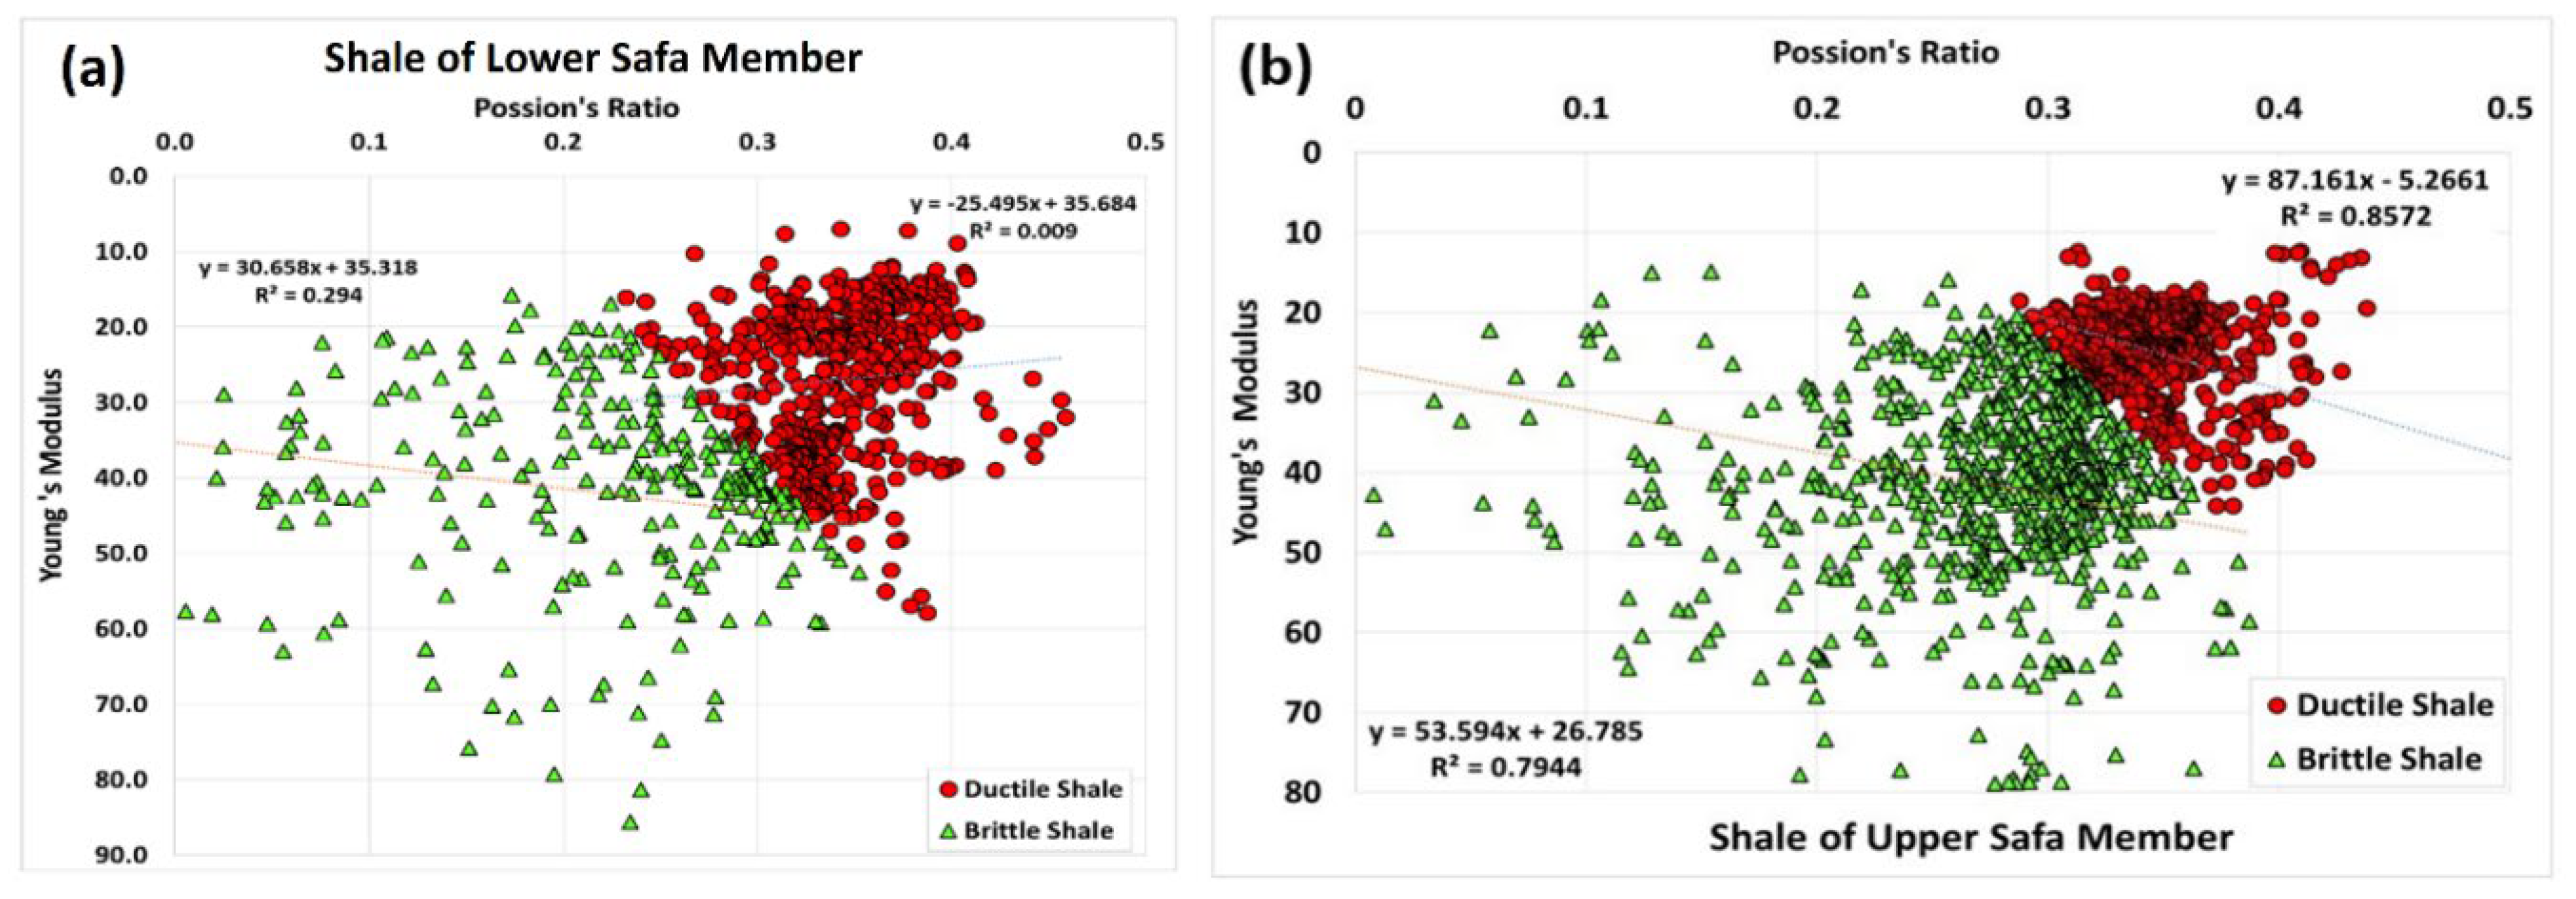
Figure 14.
The boundary conditions for the Imhotep W1X well are (a) paleowater depth, (b) sediment water interface temperature, and (c) heat flow.
Figure 14.
The boundary conditions for the Imhotep W1X well are (a) paleowater depth, (b) sediment water interface temperature, and (c) heat flow.
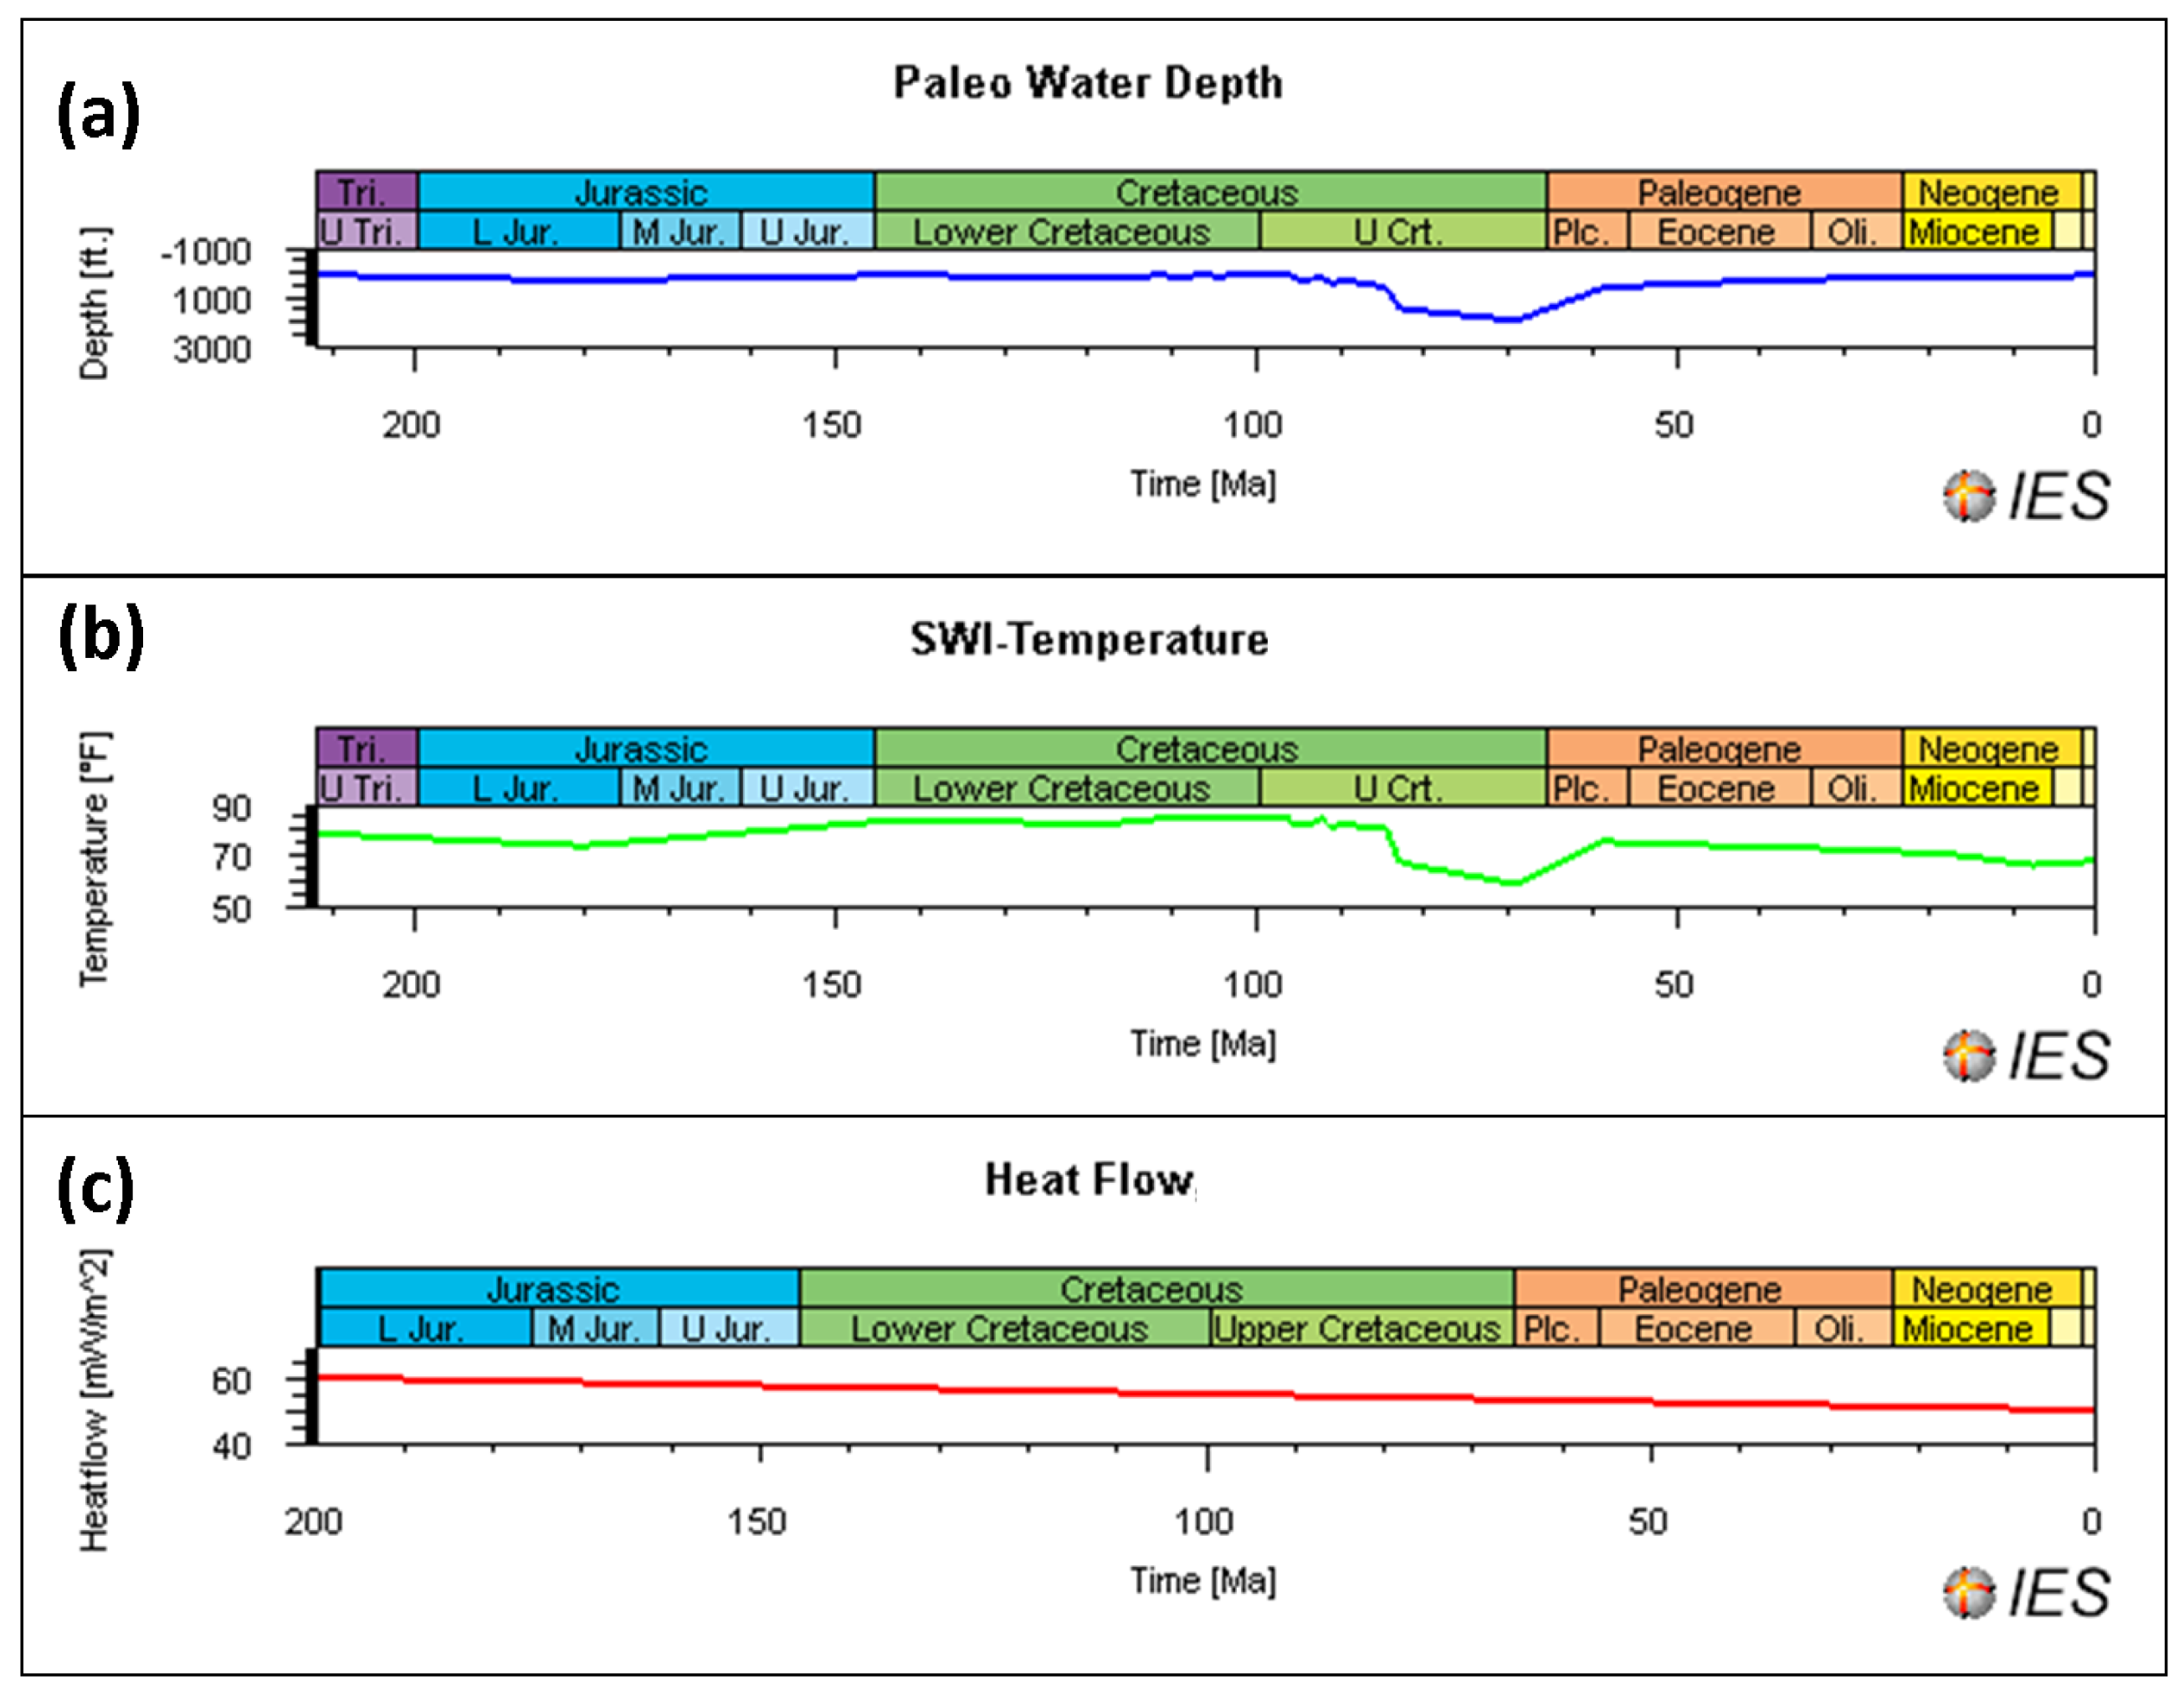
Figure 15.
Computed profiles of maturity and temperature gradient for the Imhotep W1-X well (a) the calculated and measured vitrinite reflectance, and (b) the calculated and measured temperature gradient.
Figure 15.
Computed profiles of maturity and temperature gradient for the Imhotep W1-X well (a) the calculated and measured vitrinite reflectance, and (b) the calculated and measured temperature gradient.
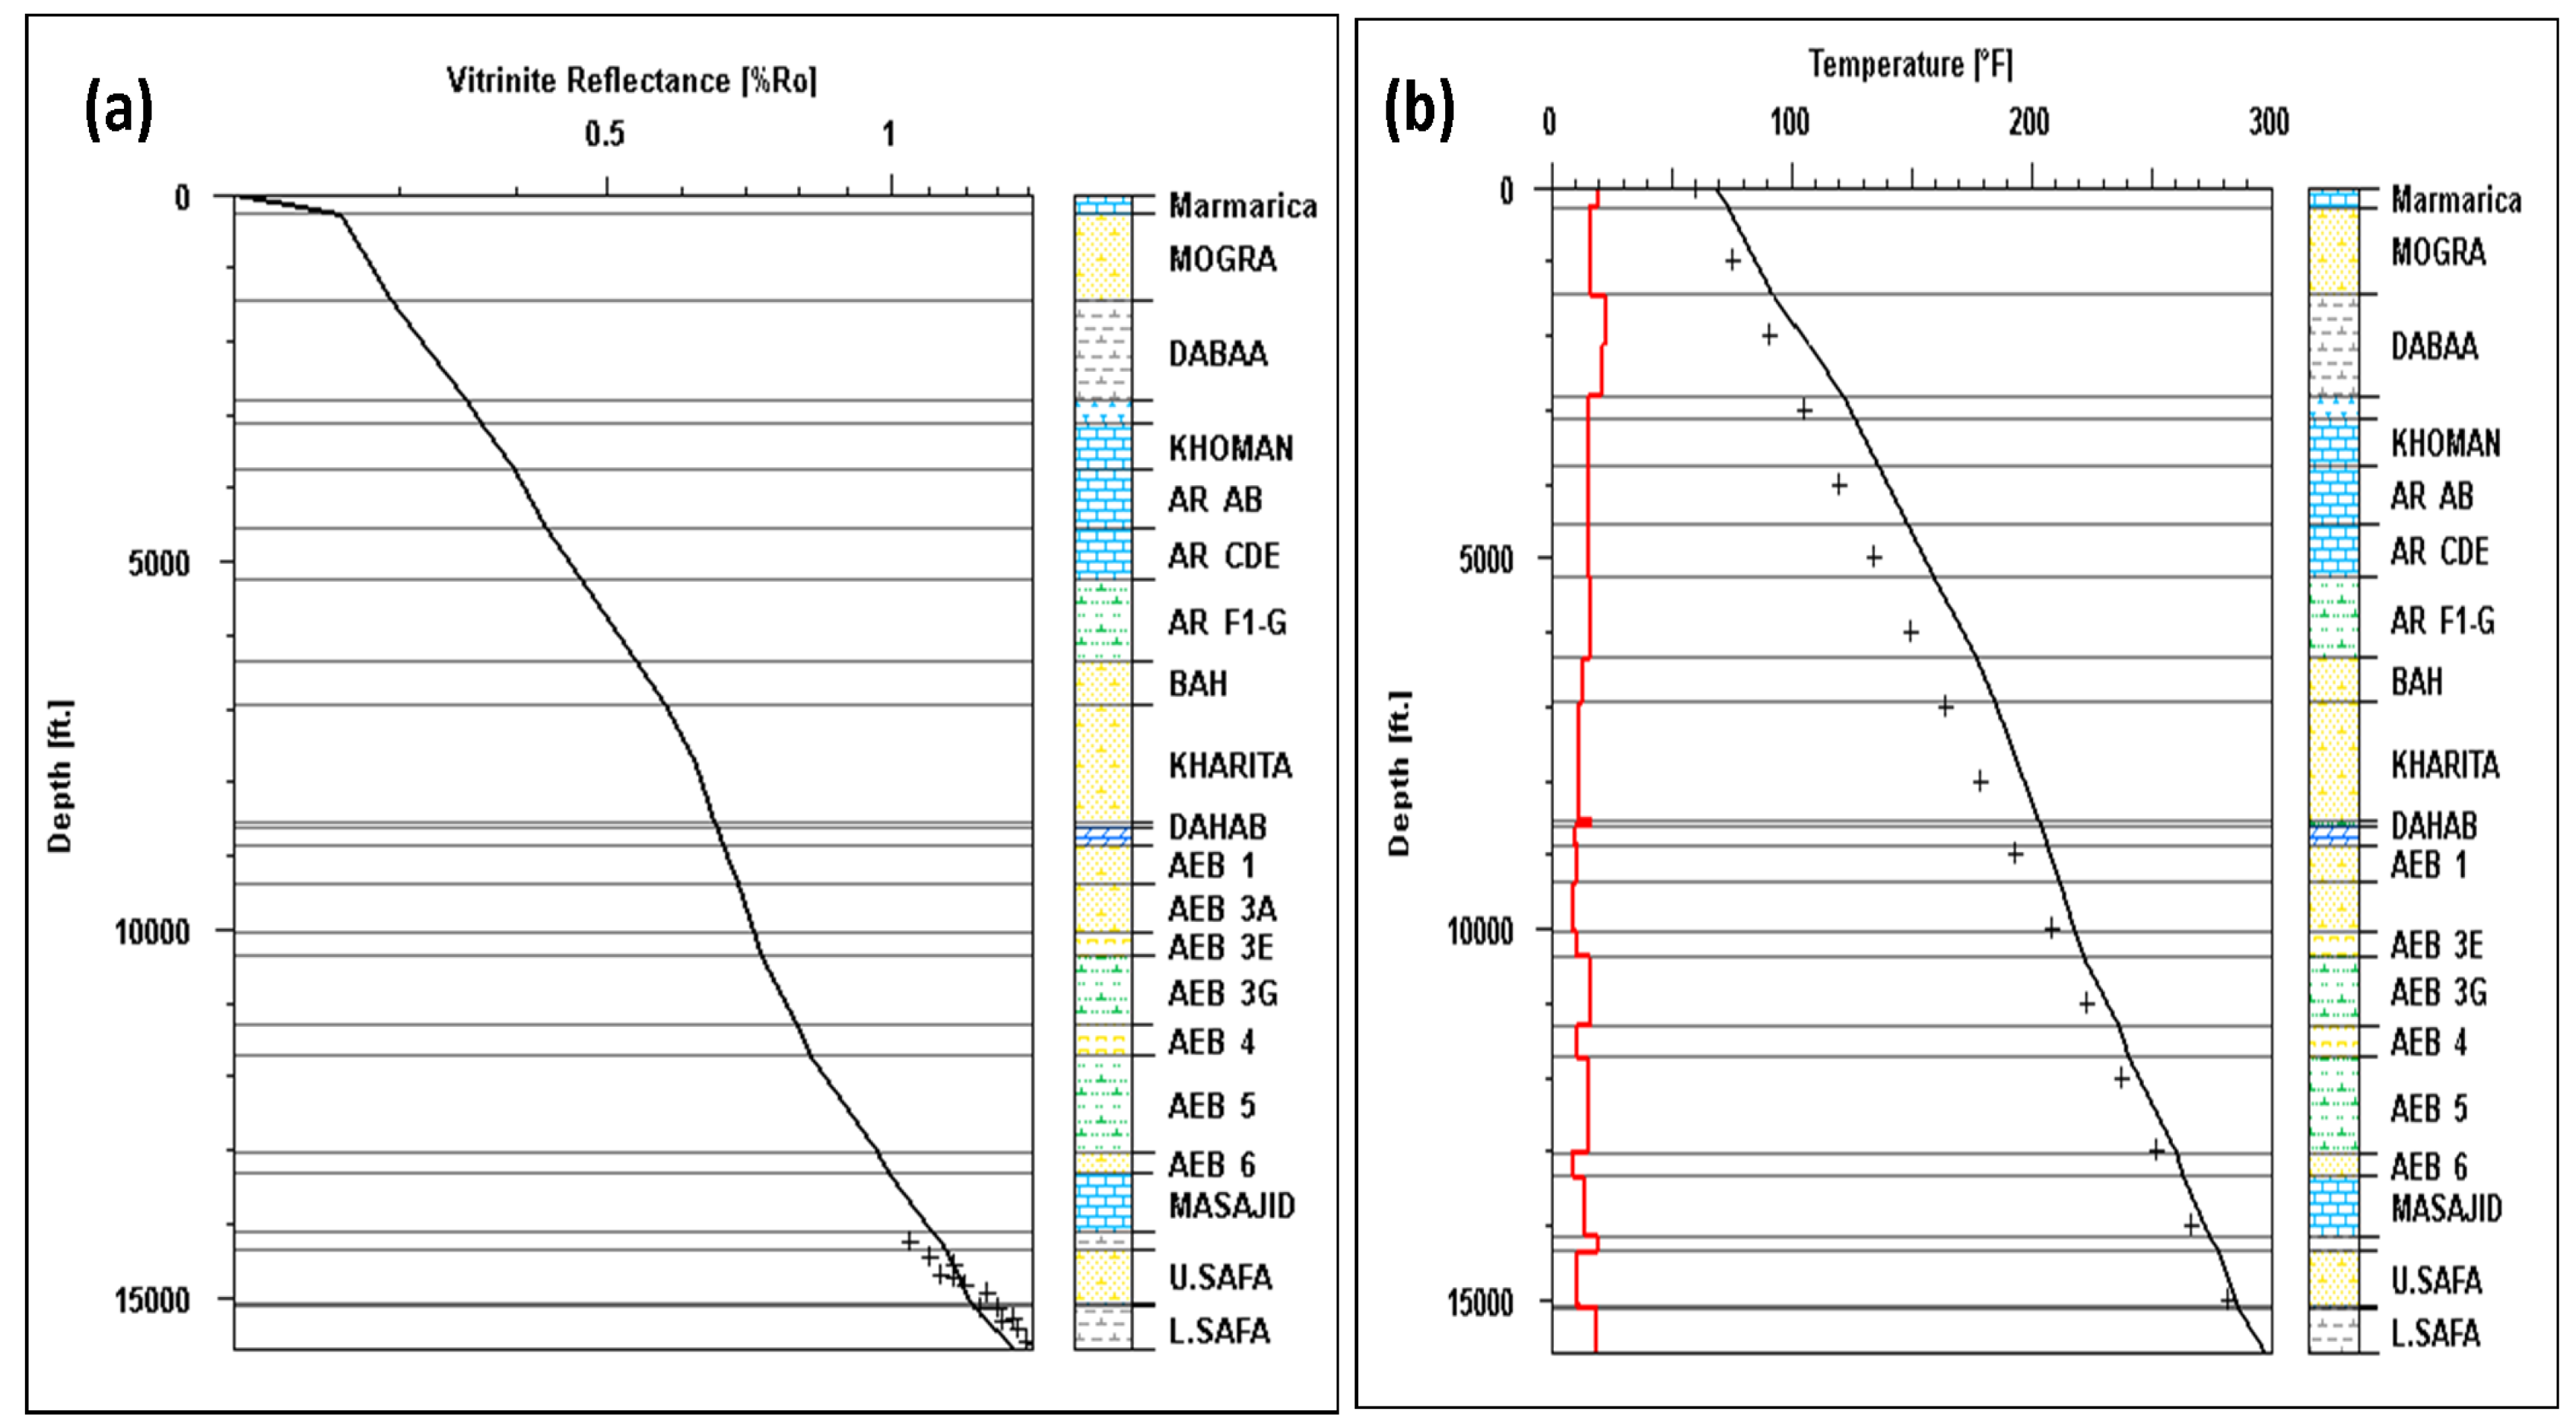
Figure 16.
The sedimentation rate of Imhotep W-1X well in the Matruh Basin.
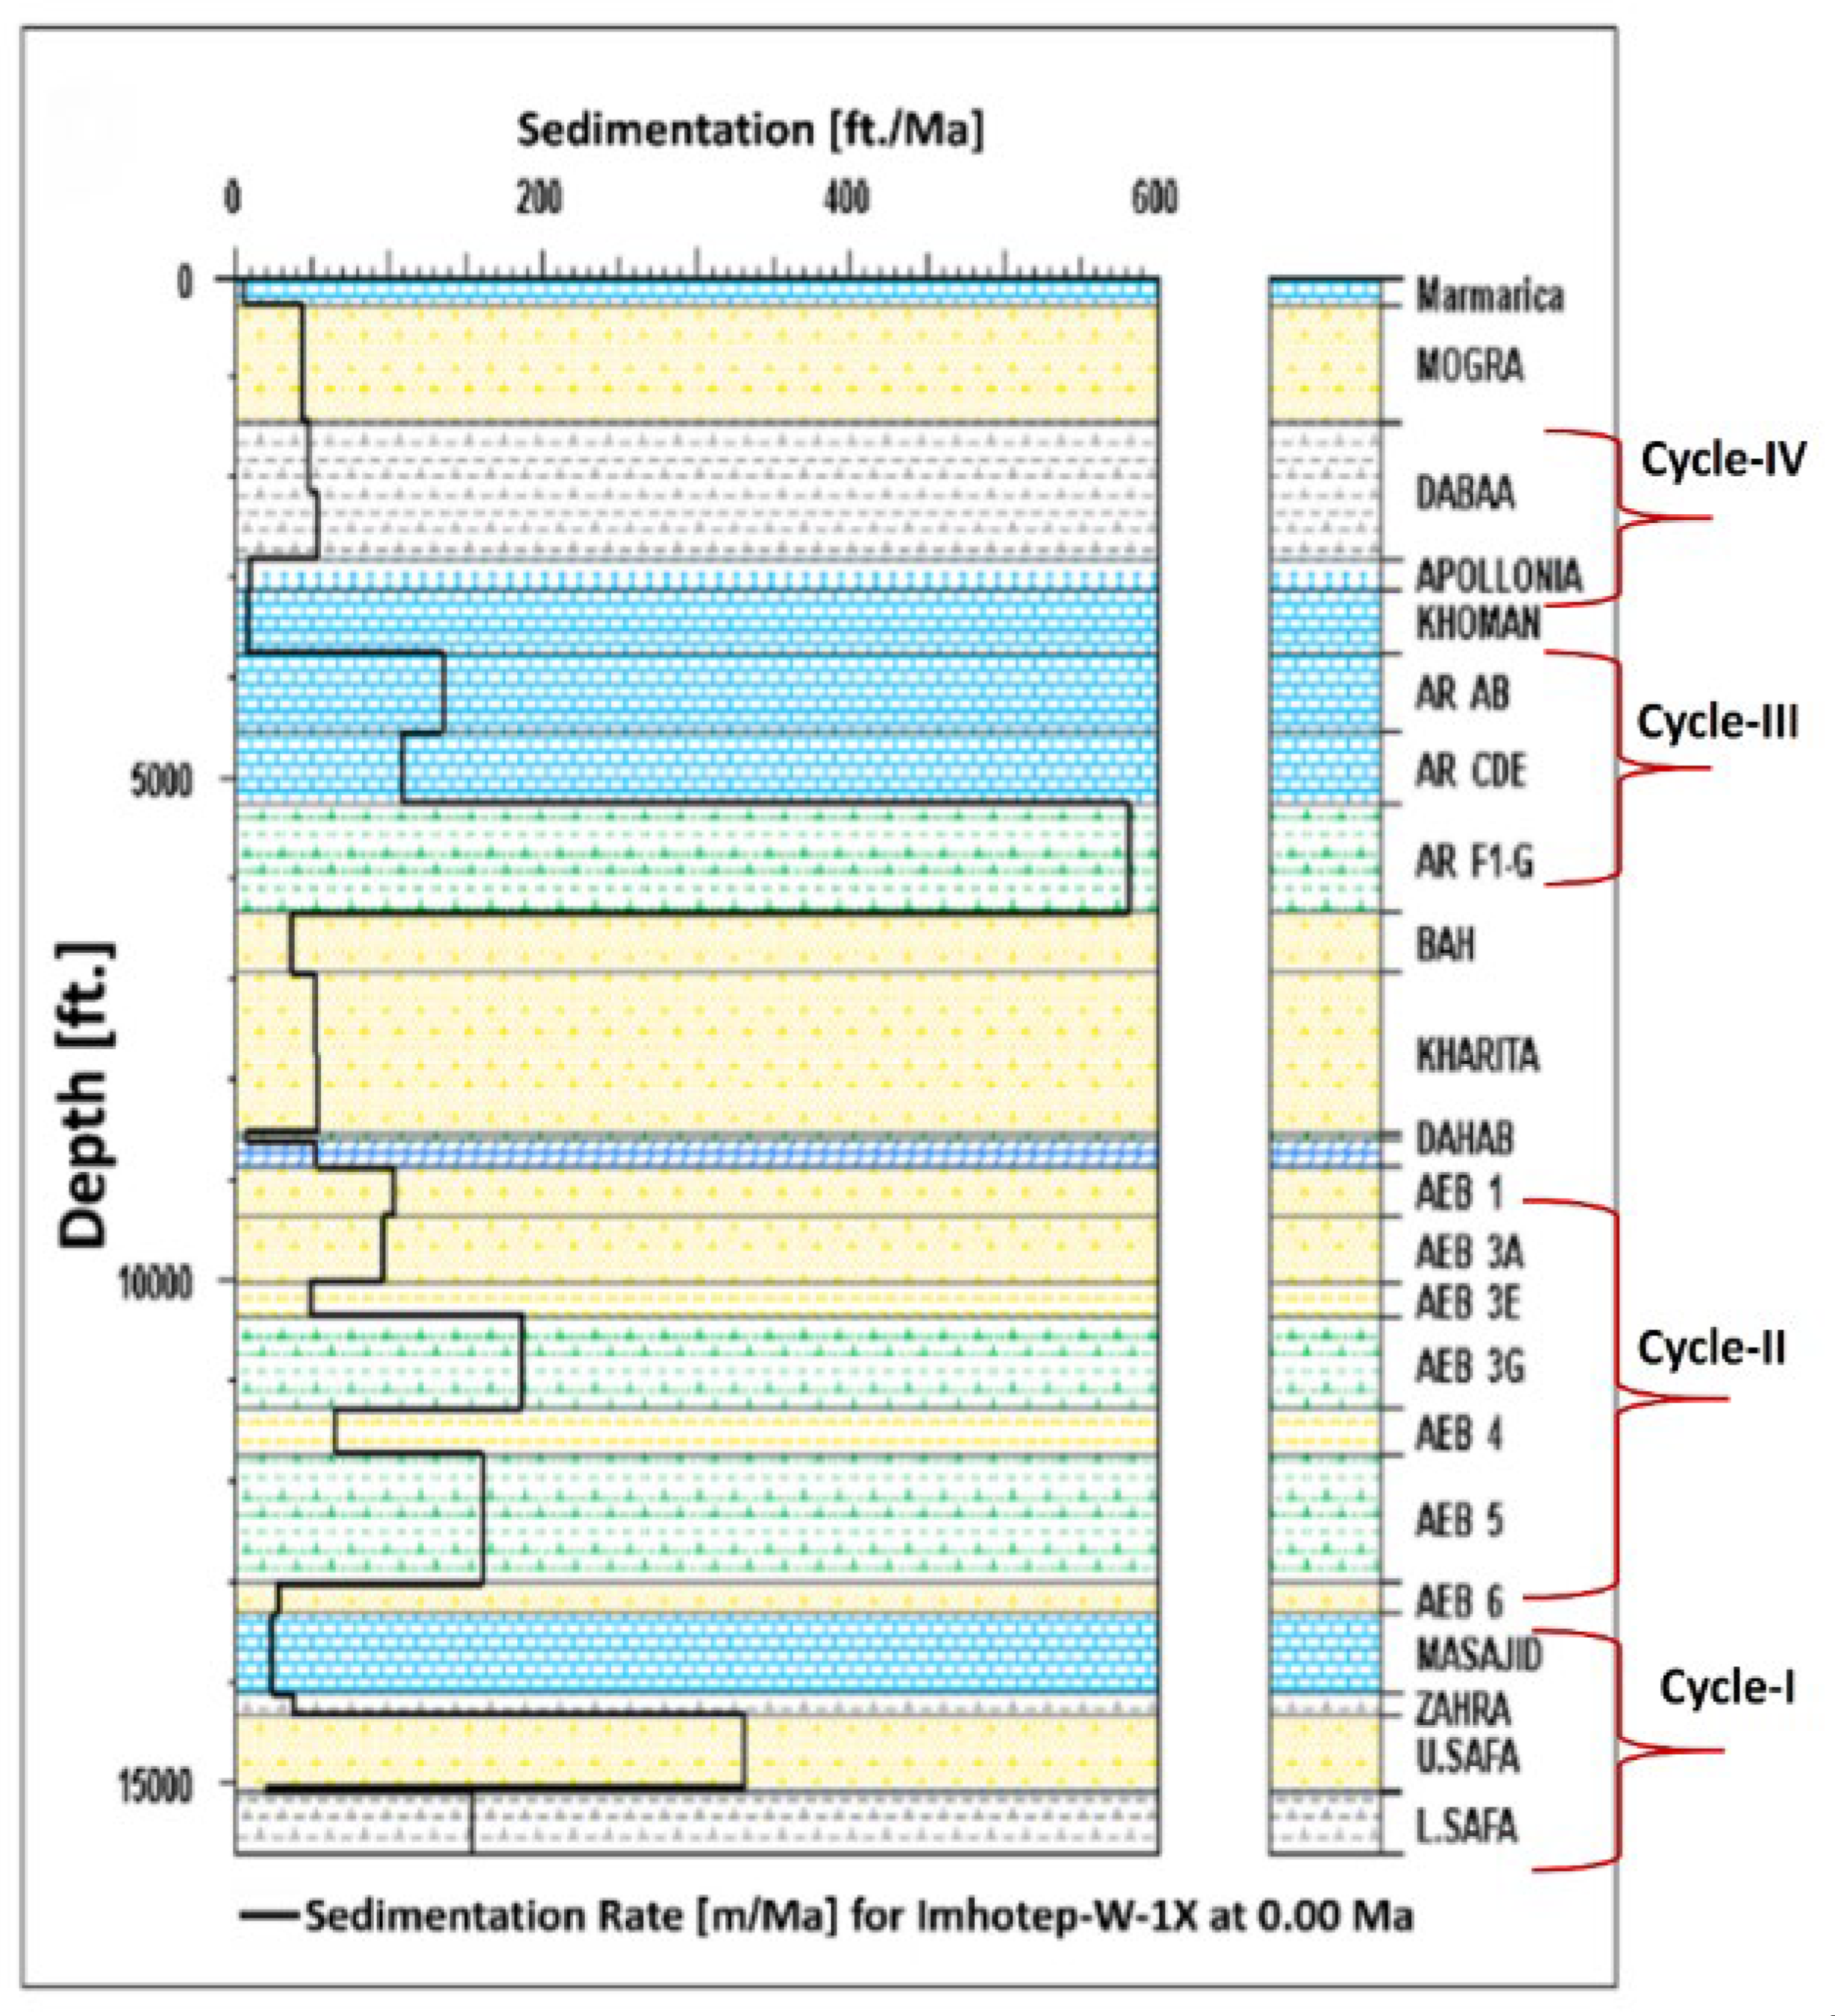
Figure 17.
The burial history of the Imhotep W-1X well in the Matruh Basin.
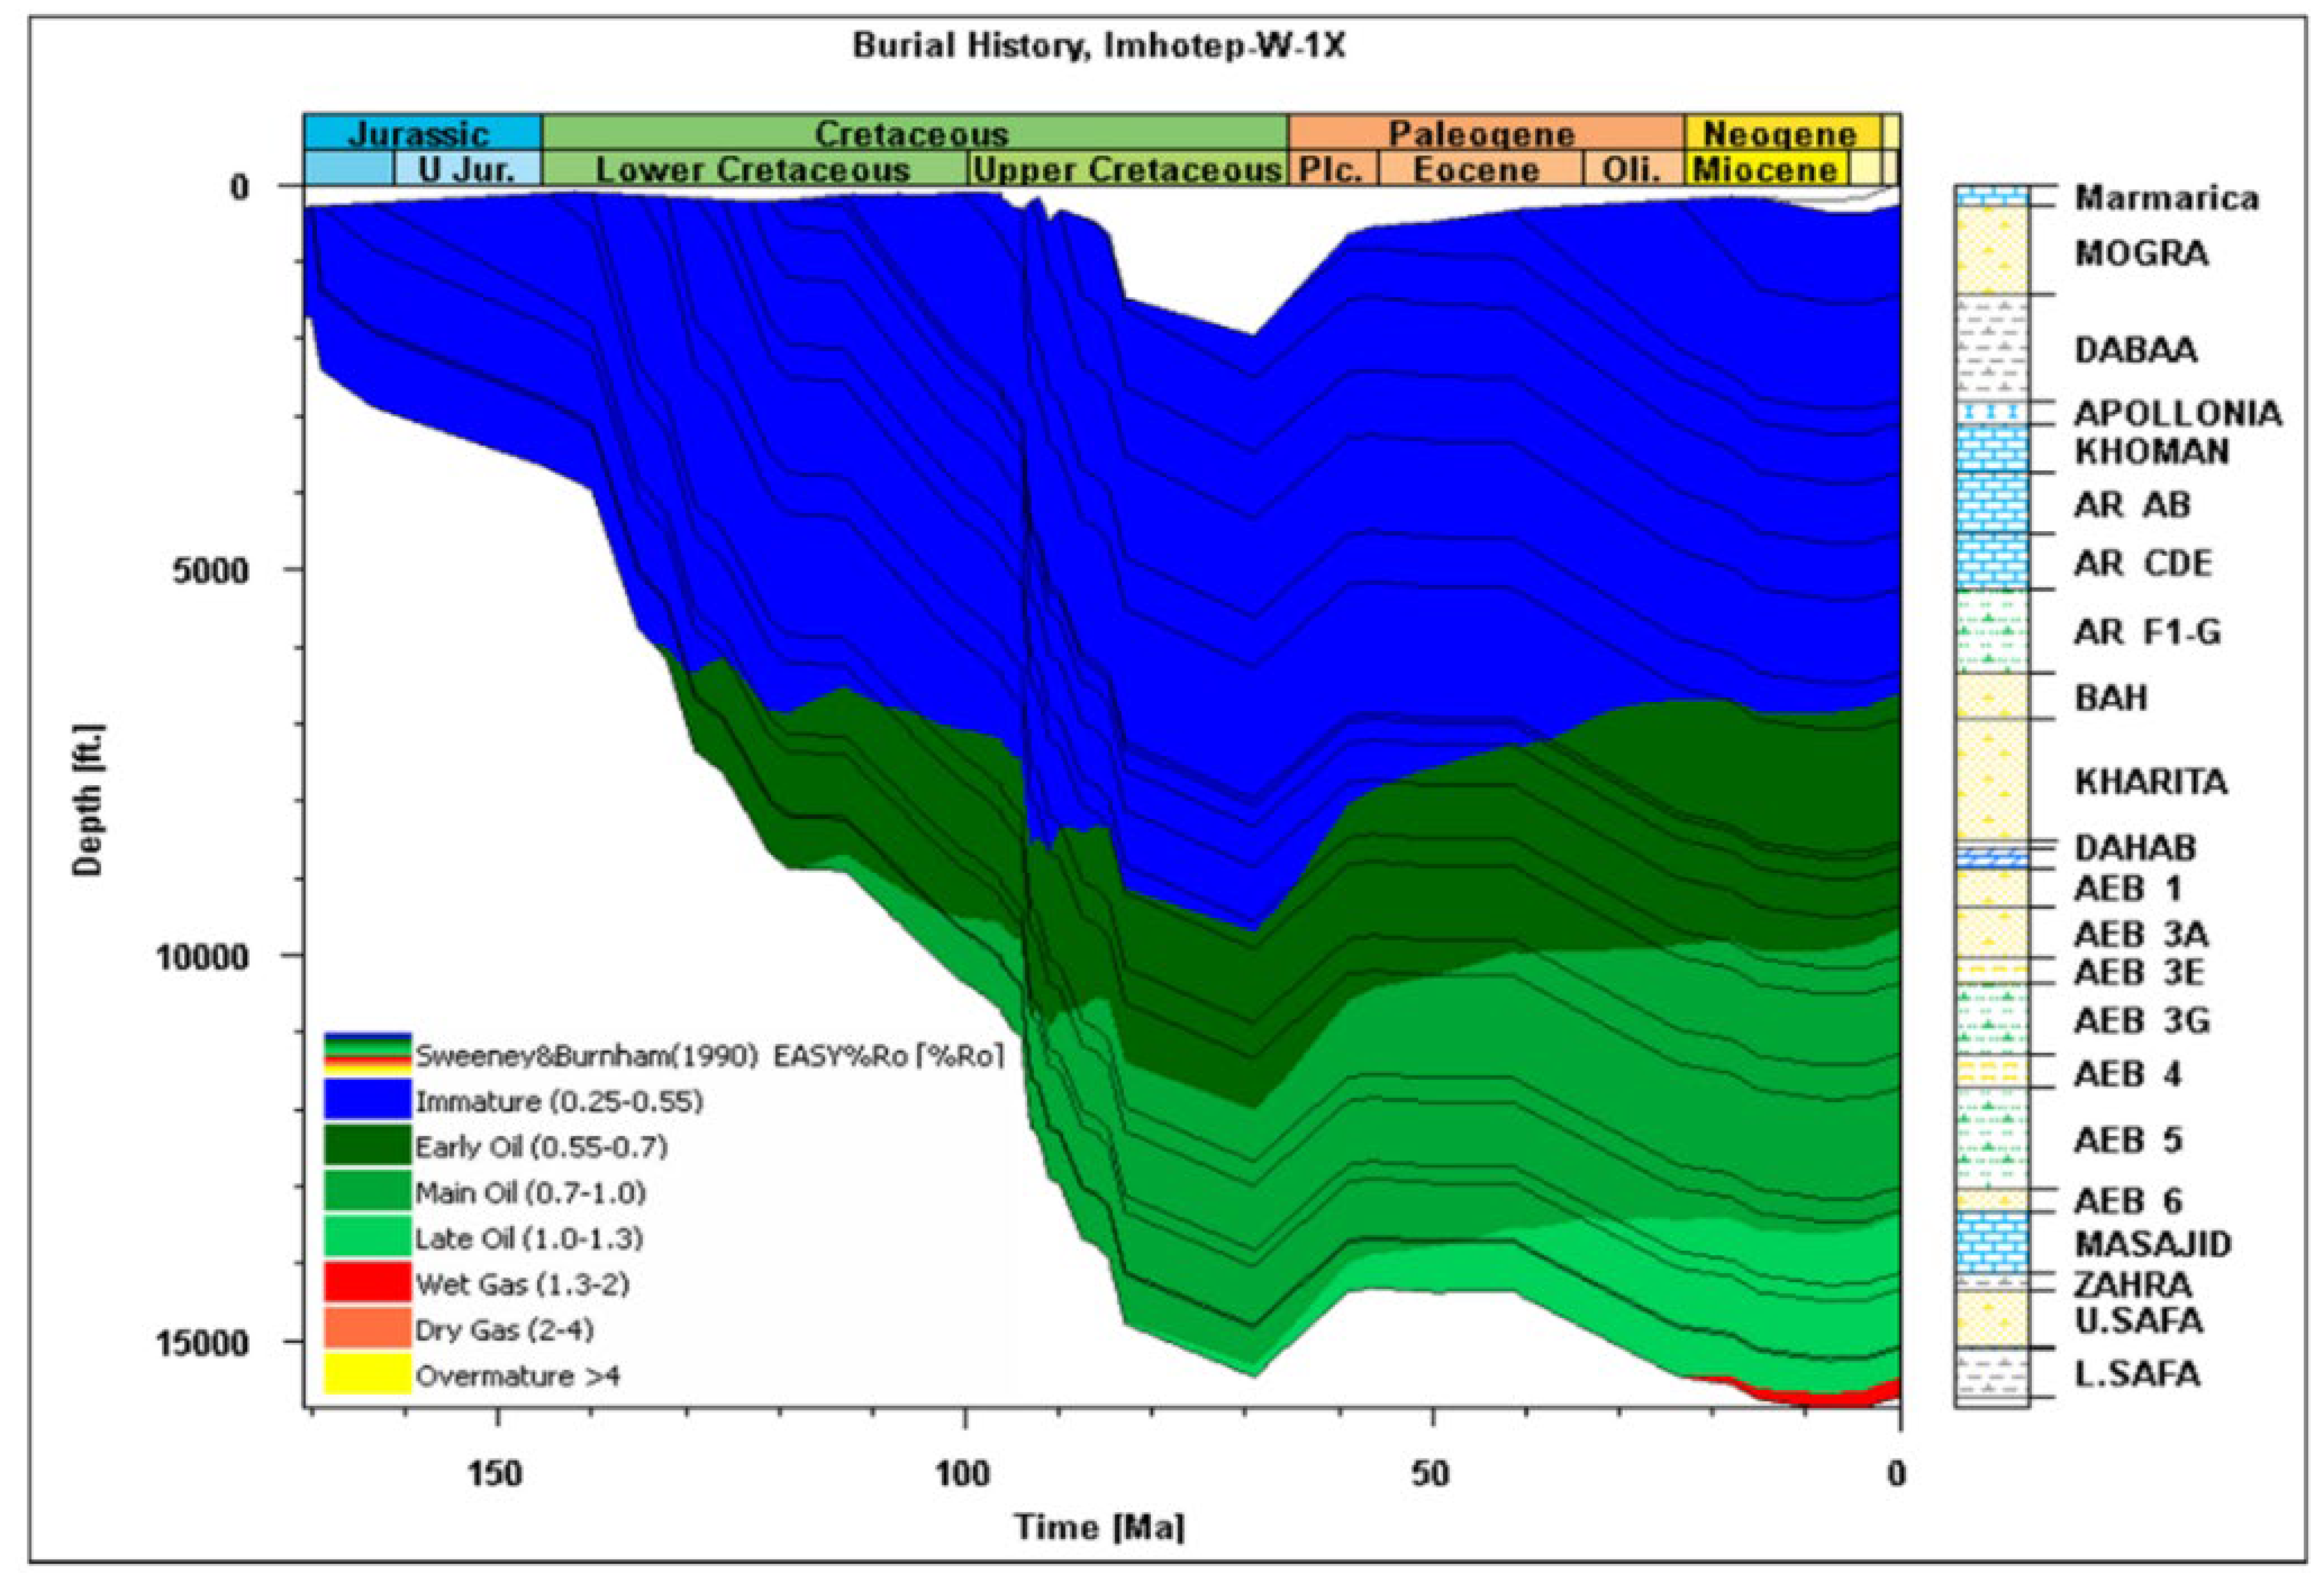
Figure 18.
The petroleum system event chart of the Imhotep W-1X well in the Matruh Basin.
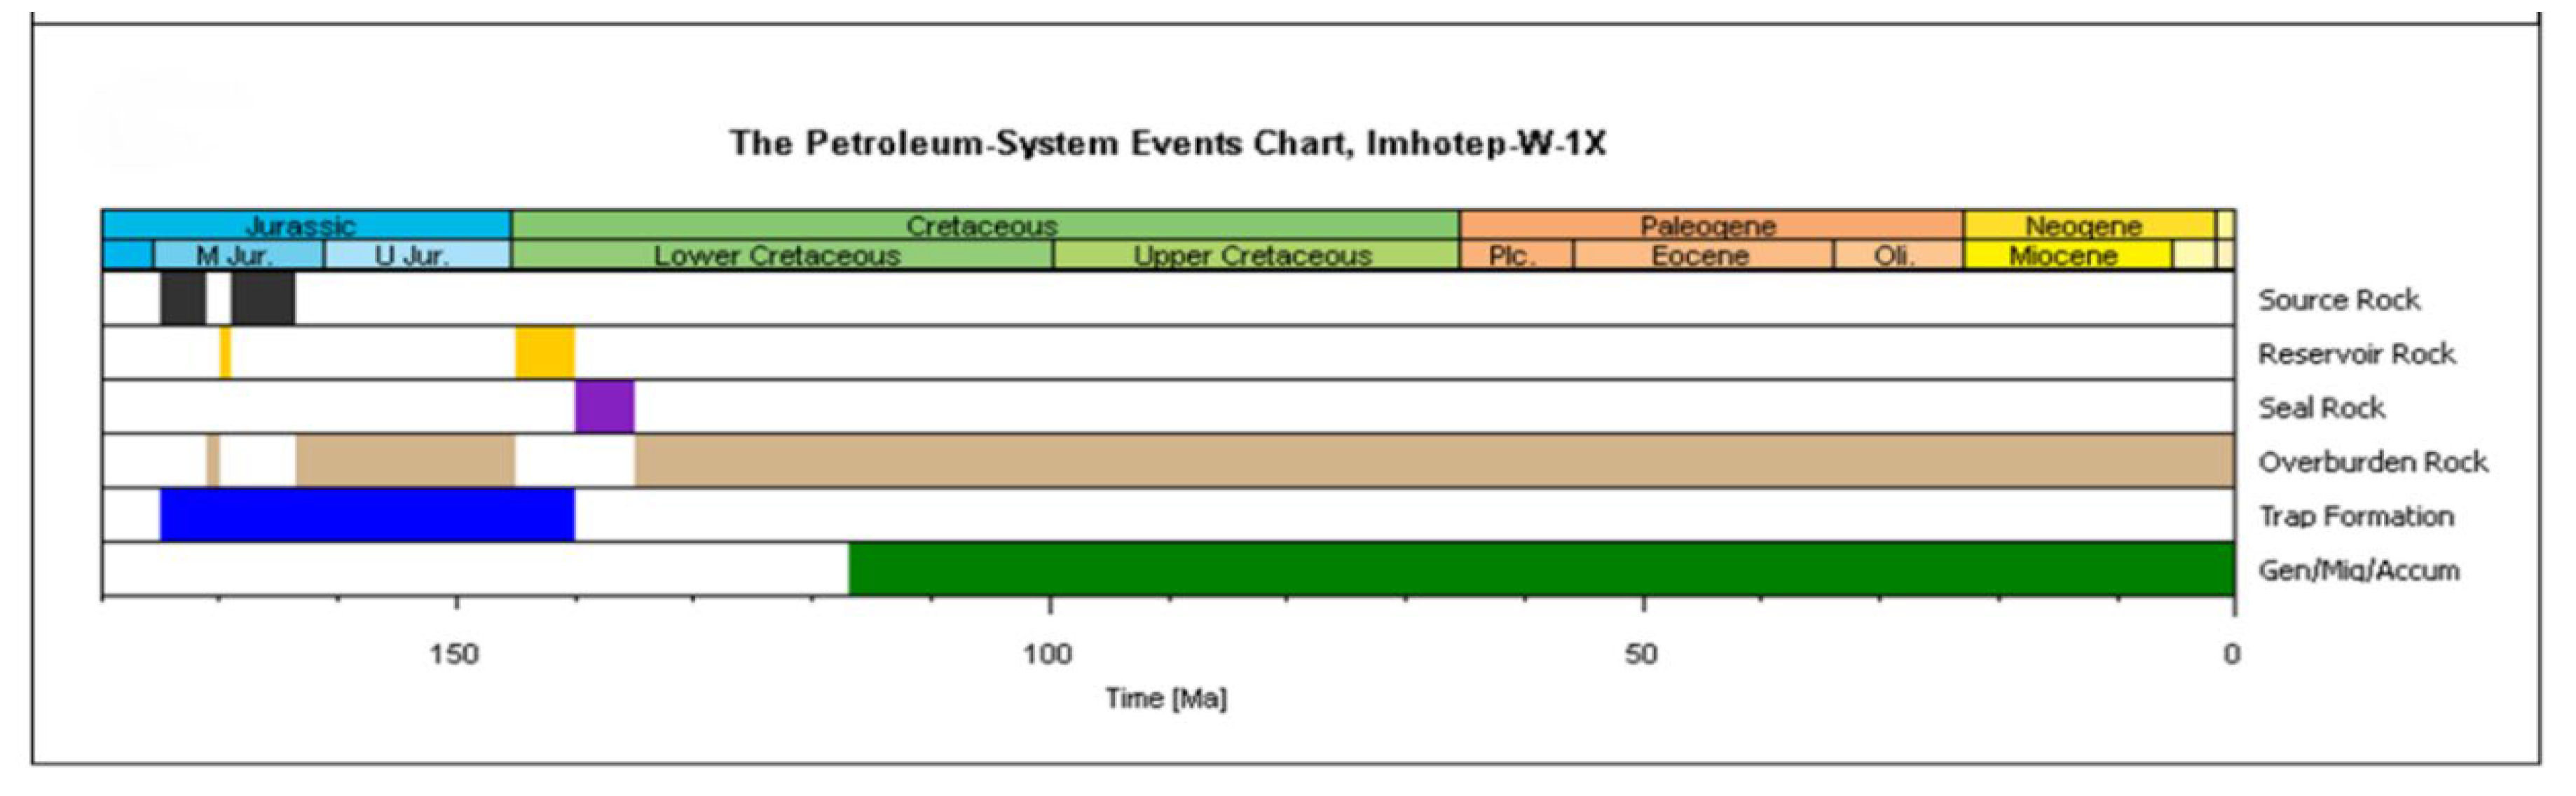

Table 1.
Tops, bottoms, thicknesses and ages of the modelled subsurface units in the Imhotep W-1X well, the Matruh Basin.
Table 1.
Tops, bottoms, thicknesses and ages of the modelled subsurface units in the Imhotep W-1X well, the Matruh Basin.
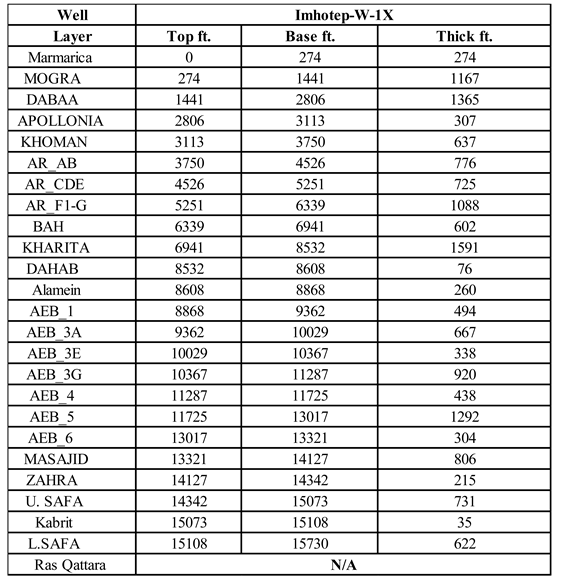 |
Table 2.
Quantitative organic matter analysis used in the APP and LVI ternary plots, the present-day organic facies (OFpd), the restored organic facies (OFo), and their present-day kerogen types in the Imhotep W-1X well.
Table 2.
Quantitative organic matter analysis used in the APP and LVI ternary plots, the present-day organic facies (OFpd), the restored organic facies (OFo), and their present-day kerogen types in the Imhotep W-1X well.
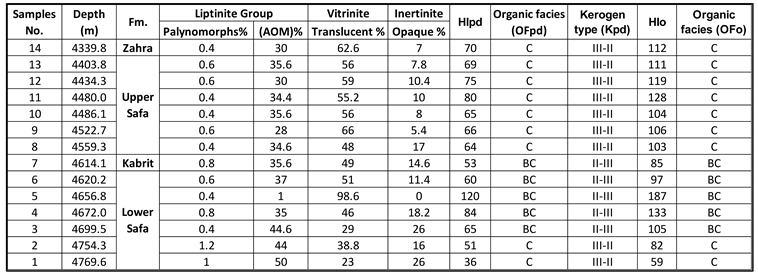 |
Table 3.
XRD-clay fraction analysis for three samples from the Lower and Upper Safa and Members.
 |
Disclaimer/Publisher’s Note: The statements, opinions and data contained in all publications are solely those of the individual author(s) and contributor(s) and not of MDPI and/or the editor(s). MDPI and/or the editor(s) disclaim responsibility for any injury to people or property resulting from any ideas, methods, instructions or products referred to in the content. |
© 2024 by the authors. Licensee MDPI, Basel, Switzerland. This article is an open access article distributed under the terms and conditions of the Creative Commons Attribution (CC BY) license (http://creativecommons.org/licenses/by/4.0/).
Copyright: This open access article is published under a Creative Commons CC BY 4.0 license, which permit the free download, distribution, and reuse, provided that the author and preprint are cited in any reuse.


