
Submitted:
13 May 2024
Posted:
14 May 2024
You are already at the latest version
Abstract
This work presents a Fault-Tolerant Model Predictive Control (FTMPC) algorithm applied to a simulation model for sewer networks. The control system will aim to prevent contaminated water from escaping the network, especially during periods of heavy rainfall, that can cause combined sewer overflows (CSO), while maintaining the flow of water towards the wastewater treatment plant (WWTP) as close as possible to its nominal value. The main purpose of the work is to preserve the operation of the predictive controller as much as possible, in accordance with its operational objectives, when there may be anomalies affecting the elements of the control system, mainly sensors and actuators. Comparing the results obtained considering various types of faults, with situations of normal controlled operation and with the behavior of the sewer network when no control is applied, will allow some conclusions to be drawn at the end.
Keywords:
Fault Detection and Diagnosis
; Fault-Tolerant Control
; Model Predictive Control
; sewer systems
1. Introduction
Generally, urban drainage networks (UDN) collect and carry both urban wastewater and that which comes from precipitation to wastewater treatment stations (WWTPs) for treatment before being discharged into the environment, constituting a combined urban drainage system (CUDS). During periods of heavy rain, the residual water resulting from mixing can overload the urban system and produce overflows (CSOs) that can be harmful to the environment. To avoid CSOs, the current UDNs have retention systems capable of storing the water that reaches the network in times of intense rain and later releasing the stored volume at lower flows suitable for treatment by the WWTPs. Adequate real-time control (RTC) of the volume of water stored in the tanks can significantly improve the operation of the network to minimize the impact of CSOs [1,2,3,4].
Among the techniques used for optimal control of these systems, those that use a simplified model of the process to predict its behavior stand out. This is how Model Predictive Control (MPC) works [5]. MPCs are part of a control methodology that uses a process prediction model to calculate the manipulated variables over a future horizon to optimize a certain cost function. It is an algorithm that has been successfully implemented for several decades, having also been applied to UDNs with great success [6,7,8].
On the other hand, urban water treatment systems (UWS), which integrate both UDNs and WWTPs, have a high degree of interconnection and their proper functioning depends on the reliability of the equipment used, such as sensors (flowmeters, level sensors) and actuators (pumping stations, gates, valves) and communication systems. The environmental conditions surrounding this equipment can cause its deterioration and malfunction. For this reason, it is necessary to develop Fault Tolerant Control Systems (FTCS) to maintain safe and efficient operation. In this way, a Fault-Tolerant Controller (FTC) is one that can achieve control objectives even though faults may exist, which can lead to a reduction in system performance [9,10,11]. Fault-tolerant control takes advantage of the physical and analytical redundancies of the system to increase its performance when an element suffers a malfunction. Furthermore, rapid detection and identification of a fault can help avoid serious and even dangerous breakdowns.
Broadly speaking, FTCS can be classified into two types: passive (PFTCS) and active (AFTCS). In PFTCS, the controllers are fixed and designed to be robust against a class of possible faults. This approach requires neither fault detection and diagnosis (FDD) schemes nor controller reconfiguration, so it has limited fault tolerance capabilities. Unlike PFTCS, AFTCS react to system component faults by actively reconfiguring control actions so that stability and performance are acceptable, even if performance has degraded [10,11].
Normally, AFTCS consist of four subsystems: (1) a reconfigurable controller, (2) a fault detection and diagnosis scheme (FDD), (3) a controller reconfiguration mechanism, and (4) a command/reference governor.
An FDD scheme consists of three tasks: (1) fault detection, which indicates that something is wrong in the system, that is, the occurrence of a fault and the time at which the fault occurred; (2) fault isolation, which determines the location and type of fault (which component has failed); and (3) fault identification, which determines the magnitude (size) of the fault [10,11]. Fault isolation and identification is generally called fault diagnosis in the literature [9]. Based on the above classification, an FDD system often represents functions that include both phases of detection and diagnosis, or simply called fault diagnosis.
Existing FDD approaches can be generally classified into two categories: (1) model-based scheme and (2) data-driven (model-free) scheme [12,13]. These two schemes can further be classified into quantitative and qualitative approaches. Essentially, a quantitative model-based FDD scheme uses a mathematical model (often known as analytical redundancy) to perform real-time FDD. Four of the most used techniques are based on (1) state estimation; (2) parameter estimation; (3) parity space; and (4) combination of the first and third [10]. Within data-driven schemes are divided mainly into two approaches, the multivariate statistical process control methods (MSPC) and machine learning (ML) methodologies. In the first case the most applied methodology is the principal component analysis (PCA) [14,15,16,17]. This technique allows reducing the dimensions of an original space constructed from a set of process data by projecting it into a lower-dimensional space. It is about searching for linear combinations of the variables that best describe the evolution of the process. From a mathematical point of view, it is based on a decomposition of the covariance matrix of the process variables according to the directions that contain most of the variability of the analyzed data. The second approach considered is the machine learning or artificial intelligence techniques. Due to complex physical or chemical processes as well as operating condition transformations and the nonlinearity of the sewer networks, these techniques could be applied successfully to this plant. Support vector machine, multilayer perceptron and random forest methods are some of the most studied methods in this category [18,19,20,21,22,23]. Also, deep learning strategies have become increasingly popular in the face of complex nonlinearity for their power to extract knowledge from large and complex datasets, and can be used for modelling, control, or management of WWTPs as can be seen in the surveys [24,25,26,27,28], however very few studies have addressed the fault detection problems in these WWTPs, or sewer networks [29,30].
The main contribution of this work consists of the development and application to the considered UDN system of an online real-time Fault-Tolerant Model Predictive Control (FTMPC) [31,32,33,34,35], that is formed by three subsystems: first, a fault detection system based on an online PCA technique; a fault diagnosis system, which will be activated only when a fault has been detected and will classify it through statistical calculations that will identify the variable that deviates the most from its normal behavior; and finally a reconfiguration system for the MPC controller to try to maintain control over the entire plant, minimizing the effects of the fault.
The benchmark considered as a study system is described in [36], and various case studies with different disturbance profiles will be analyzed. The results have been compared with the system behavior without control, with the normal MPC control algorithm and with situations of different faults without reconfiguring the system.
The main problem presented by the system under study is the great variability of the disturbances (flows collected in each area) that affect the process. Among the complete series of data that realistically integrates the benchmark, there are time intervals of weeks in which rainfall is very scarce, which means that the control system, even if it works correctly, has little influence on the performance of the system. In this case, a fault in any sensor or actuator, even if large, would be practically undetectable but would also have little impact.
Something similar occurs in the completely opposite situation: if very intense and repeated rainfall occurs, which can saturate the sewer network, the control system will not prevent overflows in the network that can become important even if it functions correctly and, if a fault occurs in some equipment, it will have little impact on the system and therefore its detection and classification will be more difficult.
These same reasons lead us to think that when whatever type of fault occurs, if it is not very significant, it will most likely go unnoticed. The tests carried out in simulation on the benchmark demonstrate this statement.
Consequently, it is advisable to focus on intermediate situations, that is, situations after moments in which precipitation of moderately high intensity occurs, or longer time intervals with medium intensity precipitation is, but with greater continuity. It has been proven that it is in these cases that the MPC controller is most useful in reducing overflows at different points in the network and in maintaining the inlet flow to the treatment station closer to its nominal value.
The article is structured as follows: after an introduction, it begins with the theoretical description of mathematical algorithms that will be used: MPC and PCA. Afterwards, the fault detection, diagnosis and reconfiguration methodology will be detailed. The following section exposes a case of study where previous methodology will be applied: first, the sewer system description is presented, then, the MPC control algorithm and the FTC system that will be applied. Next, the results obtained in each case will be shown, to finish with the conclusions of the work.
2. Theoretical Framework
2.1. Introduction
The proposed methodology is a Real-Time MPC-based Fault-Tolerant system that includes a mixed approach (model-based and data-based approach) that uses an online PCA technique for fault detection and diagnosis. In this section, the mathematical foundation of the MPC and PCA technique will be presented, as well as the statistics used to process monitoring and faults detection and diagnose.
2.2. MPC Formulation
Model Predictive Control (MPC) is a control technique that calculates the control law solving an online optimal problem [5]. Control objectives are formulated as an objective function J to be minimized over a time finite horizon N, considering constraints like system mathematical model, actuator, or sensor limits and/or disturbances. The problem can be stated at a certain time instant t as:
where N is the time optimization horizon; g1 and g2 represent the system model; x0 is the values of the system states at instant t and X(t) is the sequence of the states, U(t) is the sequence of control signals and D(t) is the sequence of disturbances. These sequences are calculated or estimated at instant t and extend to N.
This formulation is suitable for adding fault-tolerant properties to controller because the MPC problem can be updated with the information provided by the FDD module [28].
2.3. Principal Components Analysis (PCA)
This method has two advantages: on the one hand, it allows data from a higher-dimensional space to be represented in a reduced-dimensional space, and on the other hand, it transforms the original correlated variables into new uncorrelated variables, which facilitates the understanding of the data [17].
A matrix representing n data taken from m process variables is arranged. So that all variables are equally considered, it is necessary to normalize the data of the matrix by columns with mean zero and variance one, Xn. From this matrix, the covariance matrix S is calculated and decompose using singular value decomposition (SVD):
where is a diagonal matrix formed by the non-negative real eigenvalues in decreasing order of R () whose value is: and V is formed by the eigenvectors of S. The principal components can be obtained as:
where P is formed taking the first a columns of V (also called loadings) and T are the a principal components of Xn. Each of the components of new space T is called scores.
An important aspect to consider is what criteria to apply when selecting the number of principal components a. A method is based on selecting the number of principal components until a limit of variance (CPV) is reached. CPV values between 80% and 90% are usually selected. This method has been applied in this work.
There are different statistics for monitoring a process considering the PCA by generating control charts to monitor the state of the process. The most used for this task are:
Hotelling statistician (T2): For a observation vector , this index is defined as:
where Λa It has been created with the first rows and columns of Λ and a is the number of principal components selected.
If this index exceeds a preset threshold, it follows that the process is not operating normally, that is, a fault has occurred. The threshold can be calculated offline using historical data, as follows:
where n is the number of samples that have been considered for the calculation of the PCA and is the critical value of the function F (Fisher-Snedecor F distribution) with n and n−a degrees of freedom and α the significance level, which will specify the degree of false alarm commitment. Its typical values vary between 0.01 and 0.05.
Q o SPE statistician: This index is known as squared prediction error (SPE). It is calculated from an observation vector as:
where r is the residue vector and I is the identity matrix mxm.
As for the T2 index, a threshold can be calculated to determine when the process stops operating normally. This threshold is obtained from historical data taken offline for the PCA:
being the inverse of accumulative function χ2, α is the tolerance index to false alarms and µ and v are the mean and variance of Q, respectively.
If the process is operating normally, the Q index measures noise fluctuations. When an abnormal event occurs that affects the covariance of X, it is detected because the Q statistic would exceed the set threshold.
The tests carried out for the system considered, introducing various types of faults that affect sensors and actuators, have shown that the Q index is more effective than the T2 for detecting abnormal operating situations due to the great variability of the disturbances that affect to the process. For this reason, this statistic will be used in this work.
3. Proposed Method for Fault Detection, Diagnosis and Reconfiguration
When we try to apply the PCA-based fault detection and diagnosis techniques directly, as explained in the previous section, these techniques do not work due to the great variability of the data taken from the system affected by disturbances and due to the method used to calculate the tank output flow rate setpoints, since these setpoints are continually changing depending on the waste water stored in the tanks at all times. Therefore, these conditions mean that the thresholds calculated offline in normal operating situations are not useful for online fault detection and diagnosis. To try to solve this problem, it will be necessary to have normal operating data generated online to calculate the threshold corresponding to a certain range of values, considering the effect of disturbances and changes in outflow references, forming a moving data window that allows to calculate an adaptive threshold for the whole simulation data set [37,38]. This data will be generated by a feedforward neural network trained with normal operating data. Once trained, the network will be able to generate normal operating data based on the disturbances at each moment.
The procedure to apply will be the following:
STEP 1: Initialization: A matrix formed by n data of m process variables, is filled up with normal operating data. This matrix is going to be considered a sliding window of process data, with length n.
STEP 2: Obtaining the Q statistic: a data vector is taken from the system. The x data is normalized and the PCA method is applied with this new data, and the Q statistic is calculated as indicated in eq. (6). This value is stored and updated every time a new sample is acquired, up to a maximum of n values.
STEP 3: Q threshold calculation: to obtain the threshold for the Q statistic in an adaptative form in the sliding window, it is necessary the value of the actual disturbances that are collected from the plant, and the value of the rest of the process variables in normal operation conditions. These variables are calculated with a neural network. This network has as inputs the disturbances, and the past value of the process variables. The outputs of the network is the prediction of the process variables in the next time instant. And this network is trained off-line with normal operation data.
So, for the on-line procedure, now a matrix is constructed with the actual disturbances and the outputs of the network, in the sliding window, with n the length of the window, to calculate the Q threshold according to the eq. (7). Each time a new sample is taken, and the last one is discarded, so threshold calculated adapts to disturbances.
STEP 4: Fault detection: the number of times that the Q statistic exceeds the calculated threshold (number of alarms) is calculated and if this number reaches M consecutive values, it is considered that a fault has occurred. Then, go to STEP 5, else, go to STEP 2.
STEP 5: Fault diagnosis: the fault instant is determined and to calculate the contribution plot, i.e., the contribution of each variable to the fault, the residue of the first H samples of the set of M, that were used to detect the fault, is evaluated. The variable whose mean of the residue is greater than those calculated for the set of H samples considered is determined and the failing device is identified.
STEP 6: Reconfiguration of the MPC: mainly, sensor and actuator faults are considered. Thus, if a sensor fails, its real value can be estimated using other measurement of the process, taking advantage of redundancy. On the other hand, if an actuator fails, MPC can be recalculated by adding new constraints about this device.
4. Case study: Benchmark Simulation Model for Sewer Networks
4.1. Benchmark Model Description
Figure 1 shows the sewer system that is used as a benchmark to test control algorithms [36]. It is made up of 6 wastewater and rainwater collection areas (numbered 1 to 6 in the figure), 6 wastewater storage tanks (ST1,…,ST6, one of them, ST5, is off-line), wastewater pipes, 5 valves and a pump for flow control, and a wastewater treatment plant (WWTP) [39]. It involves collecting all the wastewater and conveying it to the treatment plant, maintaining a supply flow rate with the least possible variability and as close to its nominal value. This is achieved by retaining the volume collected in the tanks during heavy rainfalls and by releasing that volume during drought times.
As part of the control algorithm, a simplified model of the process has been developed that will be used to predict the behavior of the system during a given time interval [39]. The simplified mathematical model of the process is made up of the following elements:
- -
- WATER COLLECTION AREA: all water collected in the area constitutes an inflow to the system that is treated as a disturbance.
- -
- LINK ELEMENTS: they are wastewater conductions by gravity in open channels. Its discrete mathematical model would be the following:
qu,i(k) is the sum of inflows to the link element i
qi(k) is the output flow of the element i
τi is the time constant of the element i
T is the sampling period
- -
- STORAGE TANKS: these are places where wastewater is stored. Its discrete model is the following:
uin, i(k) is the inlet flow rate
ui(k) is the outlet flow rate
qov,i(k) is the overflow flow rate
Vmax,i is the maximum capacity of the tank
Vi(k) is the volume stored at the instant k
c0i is the discharge coefficient calculated empirically for each reservoir i
Ai is the surface of the base of the tank i
hmax,i is the tank height i
hi(k) is the water level i
ai(k) is the opening of the deposit i outlet gate (control variable: ai∈[0,1])
- -
- NODES: they represent places of confluence of several wastewater pipes. The resulting flow is the sum of the tributary flows:
The states considered are the levels of the tanks ST1, ST2, ST3, ST4 and ST6 (x1,…,x5) and the output flows of the link elements that communicate the tanks ST2 and ST3, ST4 and ST6 and the ST6 with the WWTP, which correspond to the states (x6,…,x9). The output flows of the link elements of the water collection zones 1, 2, 4, 5 and 6, and the flow collected in zone 3, will be considered as measurable disturbances on the process: (d1,…d6). The system inputs are the desired flows at the outlet of each of the tanks (manipulated variables): (u1,…,u5). The model appears in detail in [39], where the equations of the linearized model of the system that is going to be used as a prediction model in the MPC algorithm are shown:
where:
Generally, possible faults that can affect the system operation, usually happen in sensors (level meters, flowmeters) or actuators (gates controlling the tanks output flow rates). Thus, the study of system faults will focus on these equipments.
4.2. Model Predictive Control Algorithm
The control objective is to ensure a flow rate in the treatment plant that makes the most of its capacity without exceeding a maximum value, avoiding overflows in the tanks and in the station itself as much as possible, and minimizing operating costs.
The algorithm used for predictive control uses a linear model of the process in the state space for prediction that includes disturbances and a cost function that calculates the output flows of the tanks for optimal operation. These flows calculated by the MPC are the setpoints for local output flow regulation loops for each tank, type P-I.
The cost function or objective function of the MPC is a quadratic form that considers both the tracking errors in the states, as well as the increases in the control sequence with respect to the flow reference (penalizing the control efforts), if the prediction and control horizons coincide, and their value is N [5]:
where:
The optimization problem that MPC solves is:
subject to:
where and are the upper bounds for flow rate in the link elements and the tank outputs, respectively.
The matrices Q(k), P and R serve to penalize the tracking errors and the control efforts (inputs) and will be used as adjustment parameters of the controller, in the same way as the control horizon N (P is a terminal penalty for MPC stability obtained by means of the Riccati equation [5]).
A variable Q(k) matrix has been considered, so that, if an overflow occurs in a tank, the corresponding weight is modified to avoid it as much as possible. The non-zero elements of Q(k) that constitute MPC tuning parameters are q9 and:
Parameters fi y αi are used to tune the MPC algorithm.
To get optimal operation of the system, a hierarchical controller has been included calculating the level setpoints according to the strategy of distributing the current volume of water among all the tanks in the most uniform way possible considering their capacity. This is achieved by calculating for each its reference level based on the total capacity of the network and the capacity of that tank [39]:
where is the reference level for deposit i at time k; is the total volume occupied at the moment k; vi is a factor that represents the weight of the tank capacity i in the total available volume (sum of all tank volumes); Vi and Ai are the maximum capacity and the surface area of tank i, respectively. The reference values for the flow rates would be zero because they are not considered except m3/d, which is the desired inlet flow for the WWTP.
The R matrix is a matrix whose first 5 values of the diagonal are used to penalize the variations in the flow references with respect to their reference value and the rest are null, since they cannot be optimized because they correspond to the disturbances. The flow references are calculated using the desired level for each tank according to eq. (19) for the first 5 values:
4.3. Fault-Tolerant Control System for the Sewer Network
A Fault-Tolerant Control system (FTC) will be implemented following the architecture corresponding to a hierarchical control system as shown in Figure 2:
As already indicated, the MPC generates the setpoints of the local P-I type regulators by solving a QP optimization problem considering the measurements of the system variables (levels and flows), the measurable disturbances of the process (inlet flows to the sewer network that comes from urban wastewater and precipitation). At the supervision level is the fault detection and diagnosis system (FDD), which receives the measurements of the system variables and disturbances from the level immediately below and allows the MPC algorithm of that level to be reconfigured after a fault has been detected and diagnosed correctly.
To reduce the number of cases in this study, only the possibility of fault in the actuators (gates that regulate the flow rate of the tanks) and the level sensors of each tank of the network will be considered. The performance of the fault detection system will be studied considering different moments in which a fault will occur in the controlled system and two different disturbance scenarios. The faults under study will be:
- -
- Faults in the level sensors of each tank: the system behavior will be analyzed considering faults in the sensor gain which is reduced to 10% of its nominal value.
- -
- Faults in the actuators: the behavior of the detection and diagnosis system will be studied considering the gate of each tank blocked at 20% of its total opening.
Both types of faults are of great magnitude, justified by the reasons explained in the introduction. These faults will occur on the 2nd, 5th or 8th day of the total 10 days for different simulation scenarios.
Methodology explained in section 3 will be applied to the sewer system considering the following parameters values:
- -
- - The length of the sliding window is n = 50 because it has been heuristically verified that 50 samples are an adequate value. Matrix contains these samples.
- -
- - The data vector , taken from the system, includes the system disturbances, the system state variables (tank levels and flow rates of the link elements 6,7,8 and 9), the output flows and output flow setpoints of each tank, so m = 25.
- -
- - A matrix is created with normal operating data using the neural network, including disturbances, and, considering a variance percentage of 95%, a fault threshold in that interval of 50 samples is calculated, for the Q statistic.
- -
- - The number of consecutive alarms considered to be a fault is M = 20. This is an adequate value for this system to avoid false detections caused by the strong disturbances affecting the system.
- -
- - For diagnosis, the residue of the first 10 samples of the set of 20 that were used to detect the fault is evaluated (H =10) as explained in section 3. This value has been chosen experimentally. The variable whose mean of the residue is greater than those calculated for the set of 10 samples considered is determined. If this variable is the level of a specific tank, it is considered that the corresponding level sensor fails. If the variable is an outlet flow rate, it follows that the correspondent reservoir gate fails.
- -
- - The MPC reconfiguration depends on the element that presents the fault, so different strategies will be applied to reconfigure de MPC controller to minimize the effects caused by the faults:
- -
- Faults in level sensors: considering the eq. (20), when a level sensor fails, the level value of that tank hi(k) can be estimated at a time k, if its output flow ui(k), its discharge coefficient c0i and the gate opening degree vi(k) are known, as follows:
- -
- Faults in the gates: in this case, the MPC algorithm is reconfigured by adding to the QP optimization problem, an equality restriction for the calculation of the reference output flow rate of the affected tank, uiref(k), since its output flow ui(k) can be measured at instant k, as:
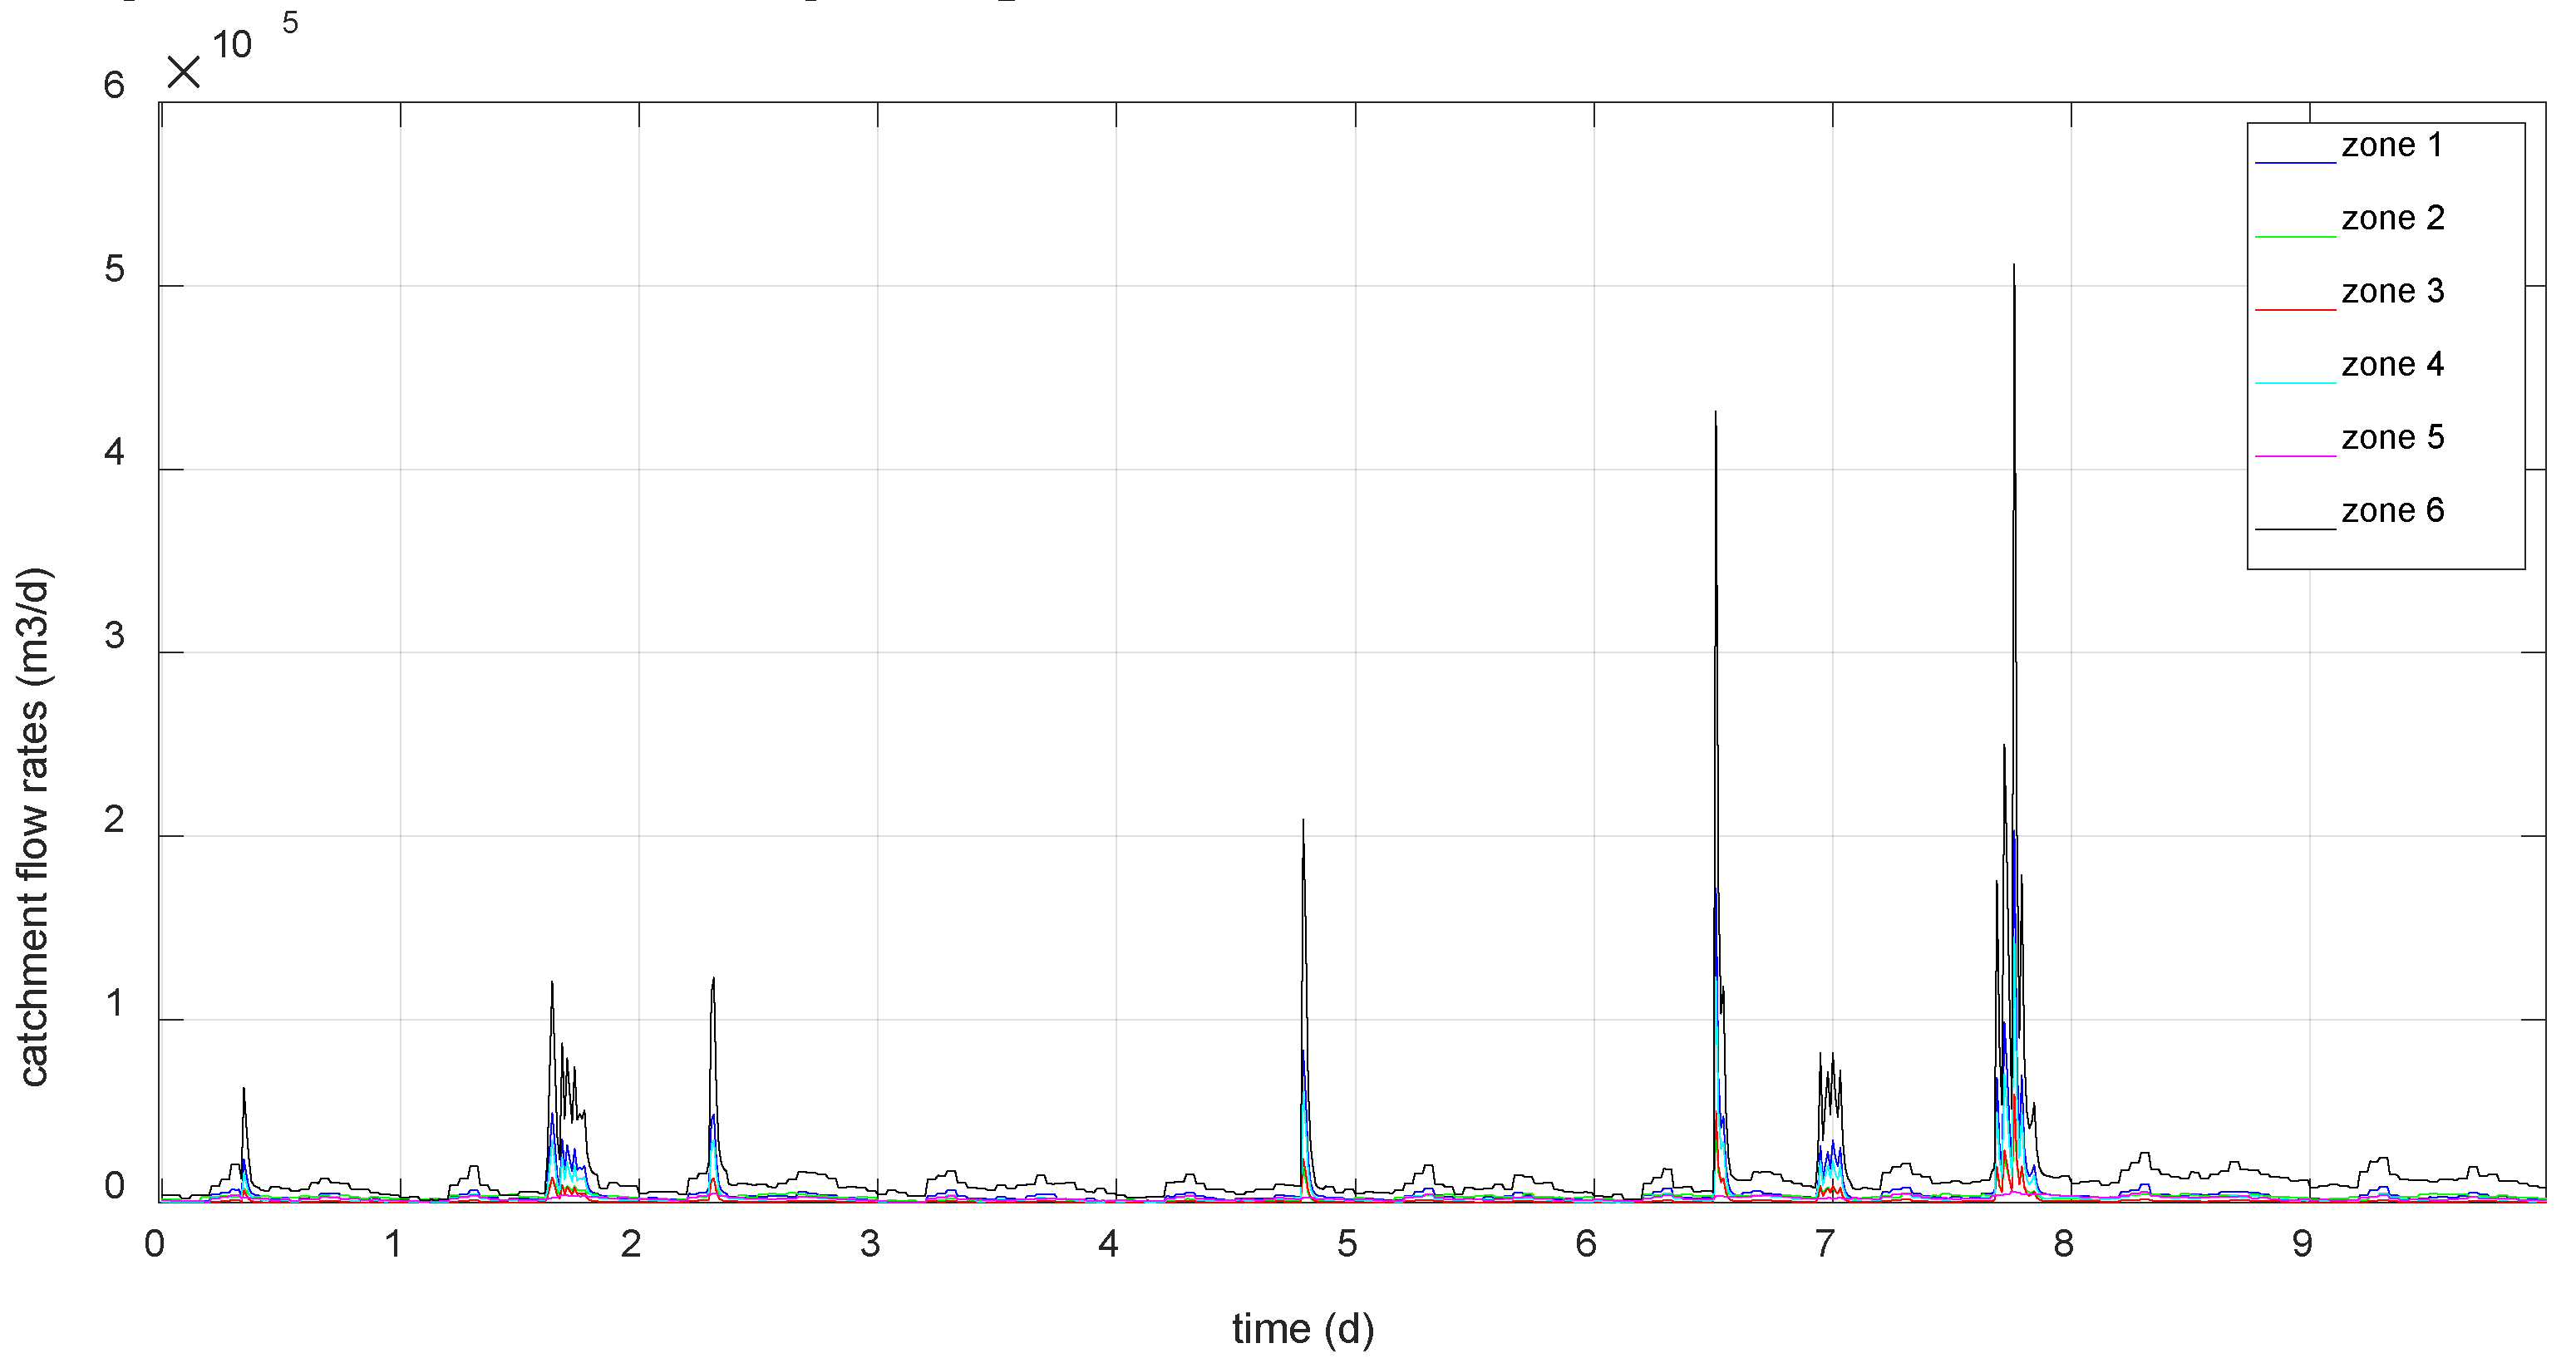
To have normal online operating data, a neural network trained with non-fault data extracted from the benchmark, will be used. The following figure represents the inlet flows to the sewer network collected in each of the catchment areas considered, due to precipitation and wastewater, over a period of 10 days.
The neural network is composed of 25 neurons in the hidden layer and 19 in the output layer. To improve the operation of the neural network, it is fed back with the system outputs of the previous instant. So, the disturbances (d1,…,d6) and the previous outputs are applied to the input (i1,…,i25), and the process variables of interest are obtained at the output (o1,…,o19): state variables (x1,…,x9), flow references (uref1,…,uref5) and output flows of every tank (u1,…,u5).
5. Results and Discussion
Three scenarios have been considered, extracted from the data time-series of the benchmark, in which the flow variations are more significant according to the reasons explained in the introduction of the article. The first scenario provides the neural network training data that will be used to generate normal online operating data. The second and third scenarios will serve to evaluate the fault detection and diagnosis system, as well as its reconfiguration. To perform the simulation tests, the weights of the MPC cost function (non-null elements of matrices Q(k) and R) have been adjusted for eq. (17) and show in Table 1:
The model system parameters are shown in Table 2:
5.1. Training and Validation of the Neural Network
Next figure shows the training data profile of the neural network extracted from the benchmark:
Figure 4.
Catchment flow rates (scenario 1).
Then, to validate the trained network, the data provided by the system and the neural network will be compared with input data corresponding to scenarios 2 and 3:
Figure 5.
Catchment flow rates (scenario 2).
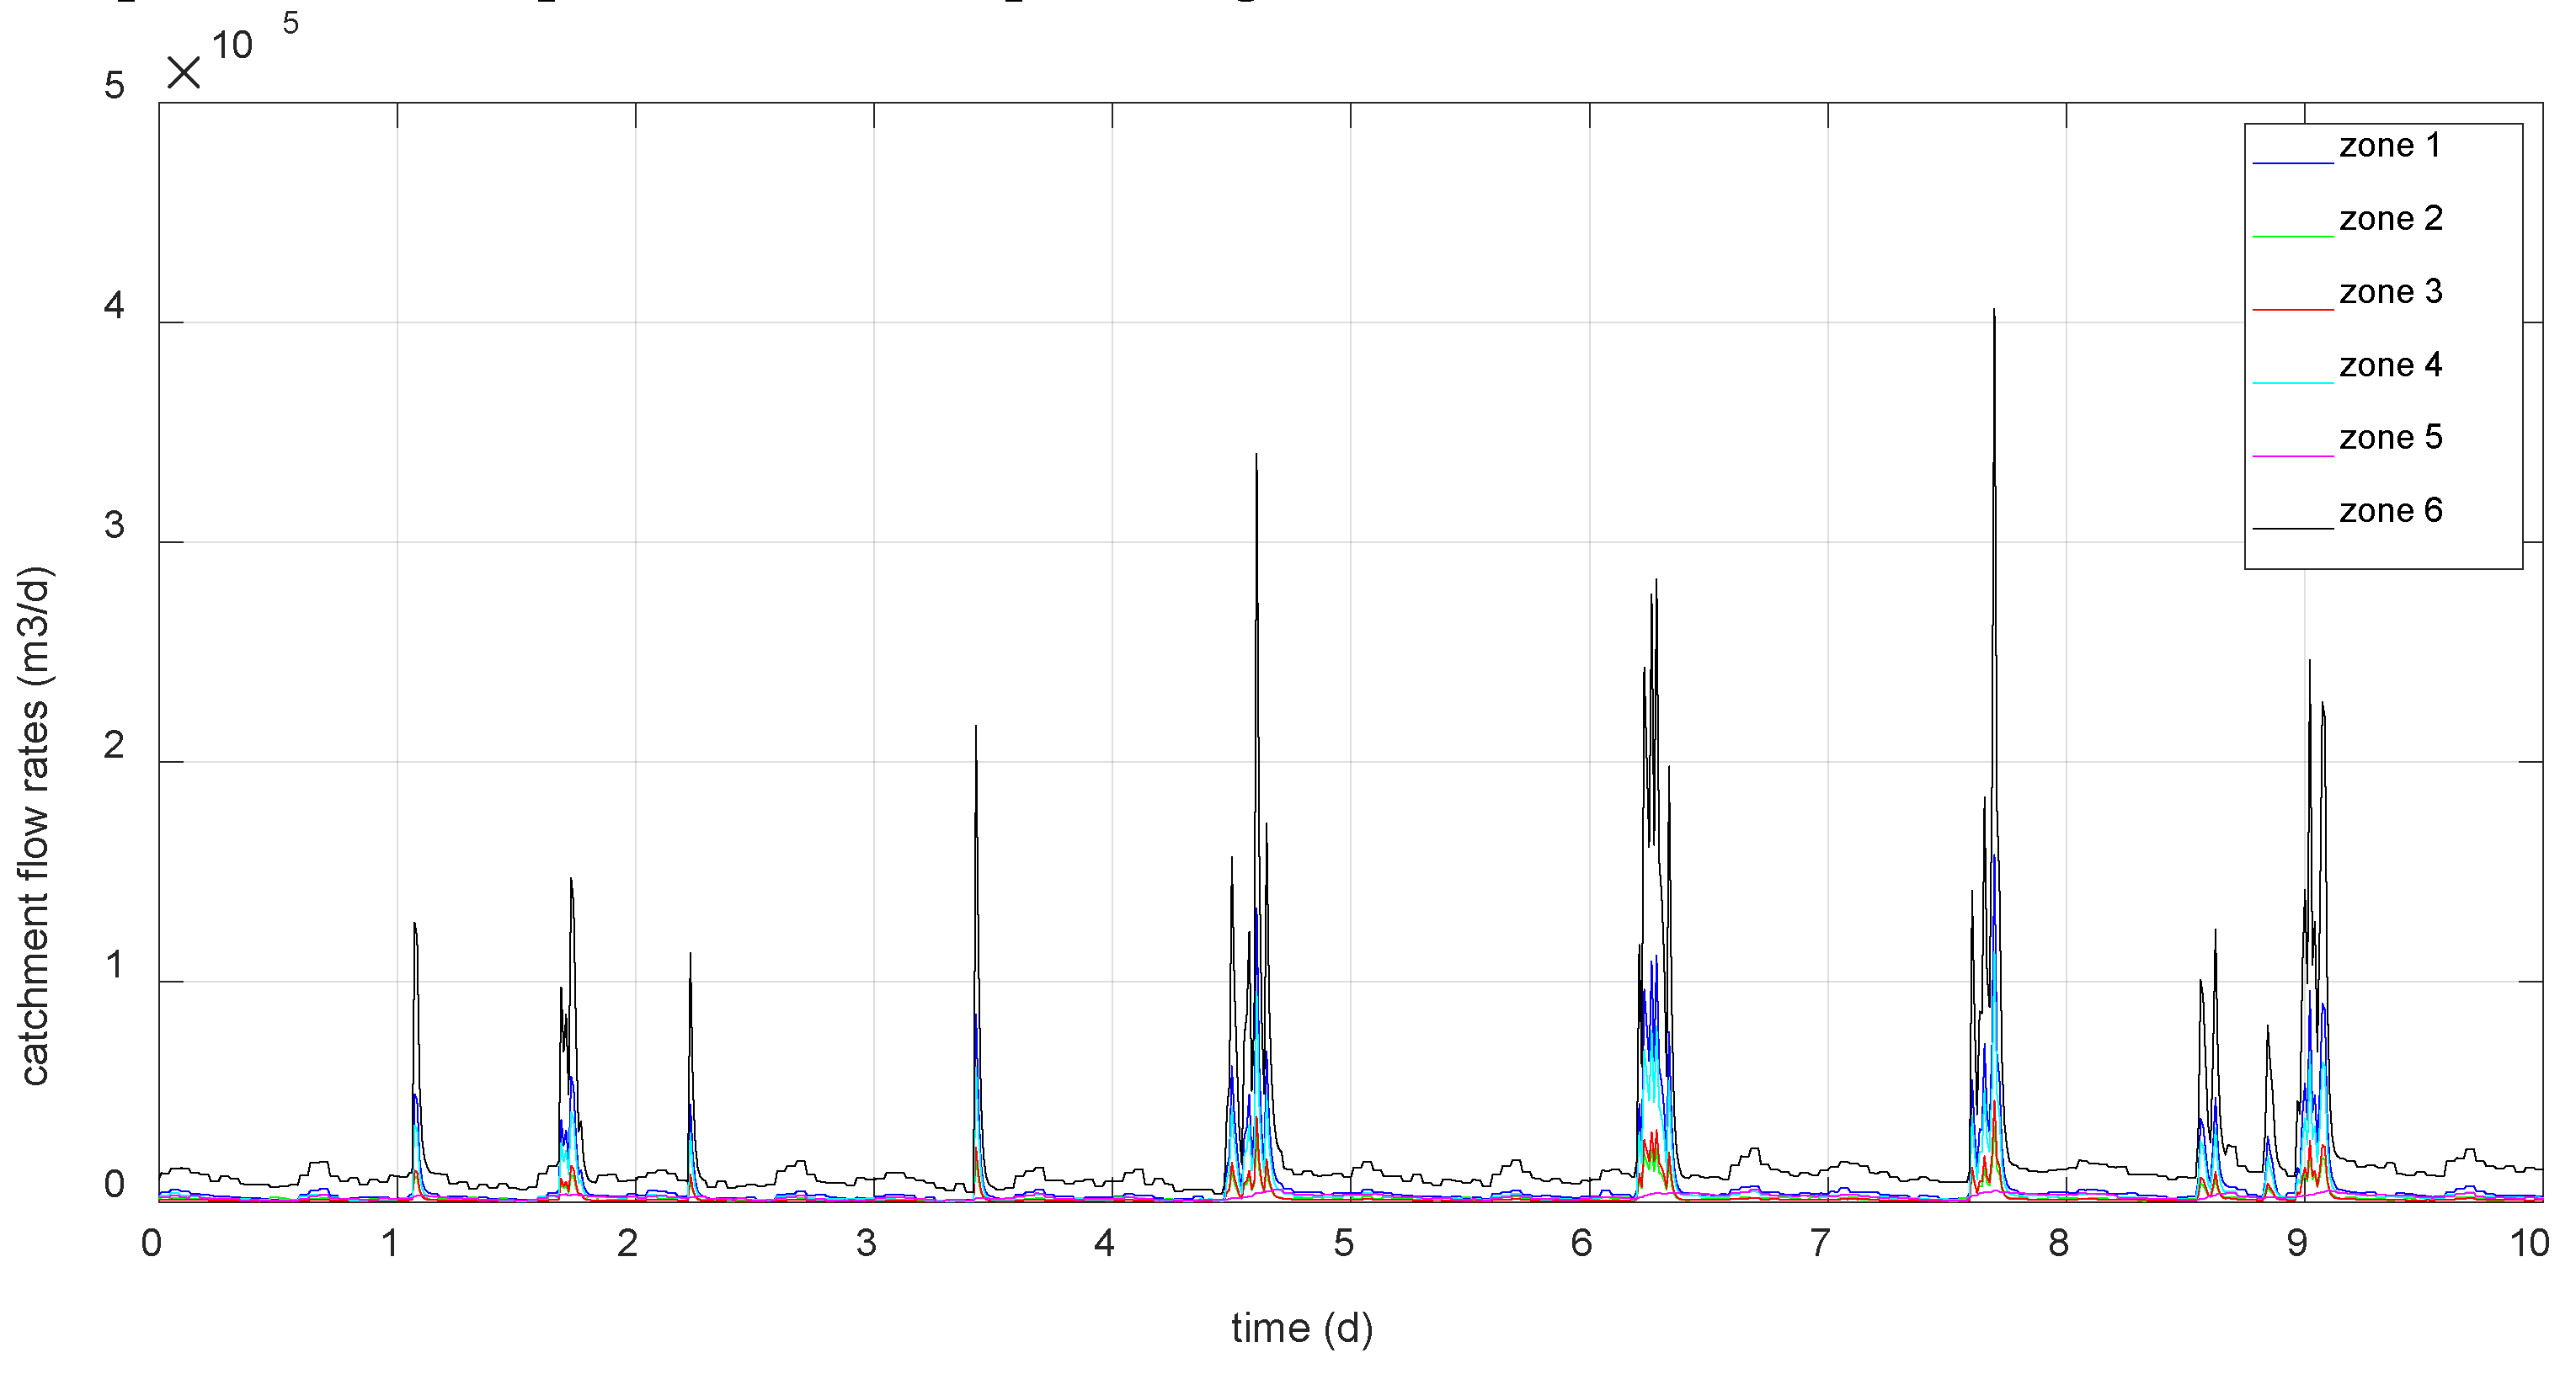
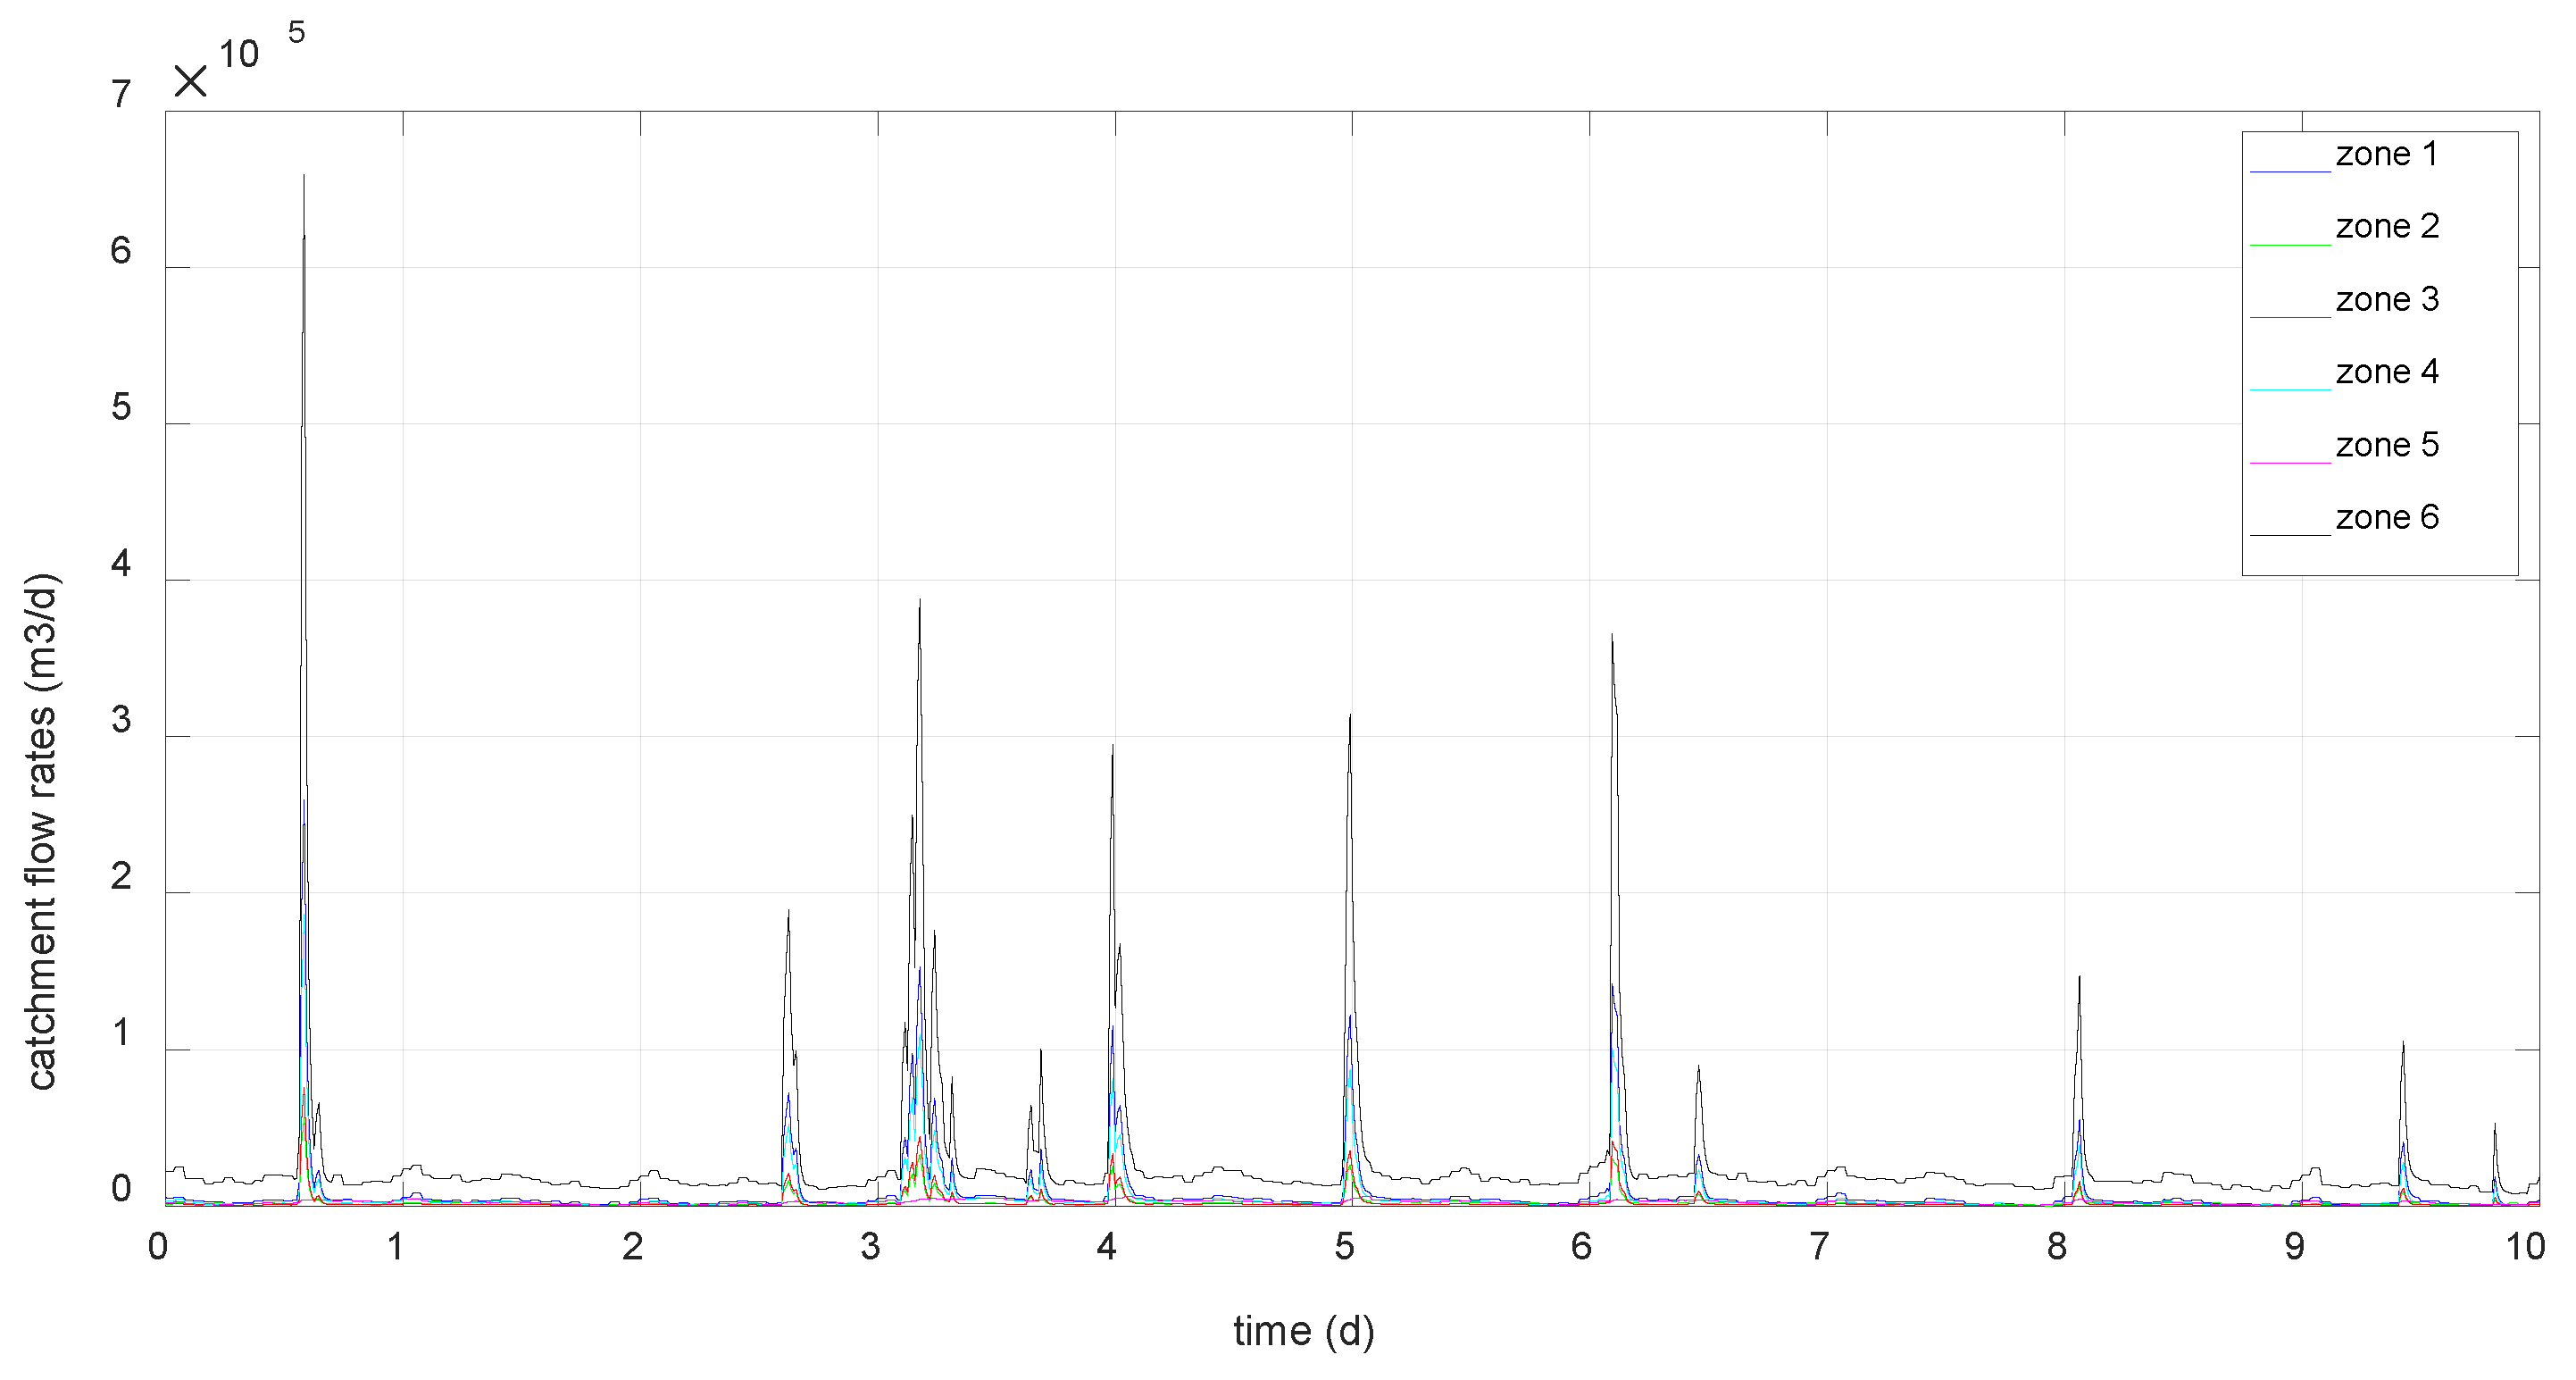
Figure 6.
Catchment flow rates (scenario 3).
Below are some results related to the evaluation of the trained network. The following figures show the levels of the reservoirs provided by the system and by the neural network under normal operating conditions with input data from scenarios 2 and 3.
Figure 7.
Tanks levels (scenario 2).
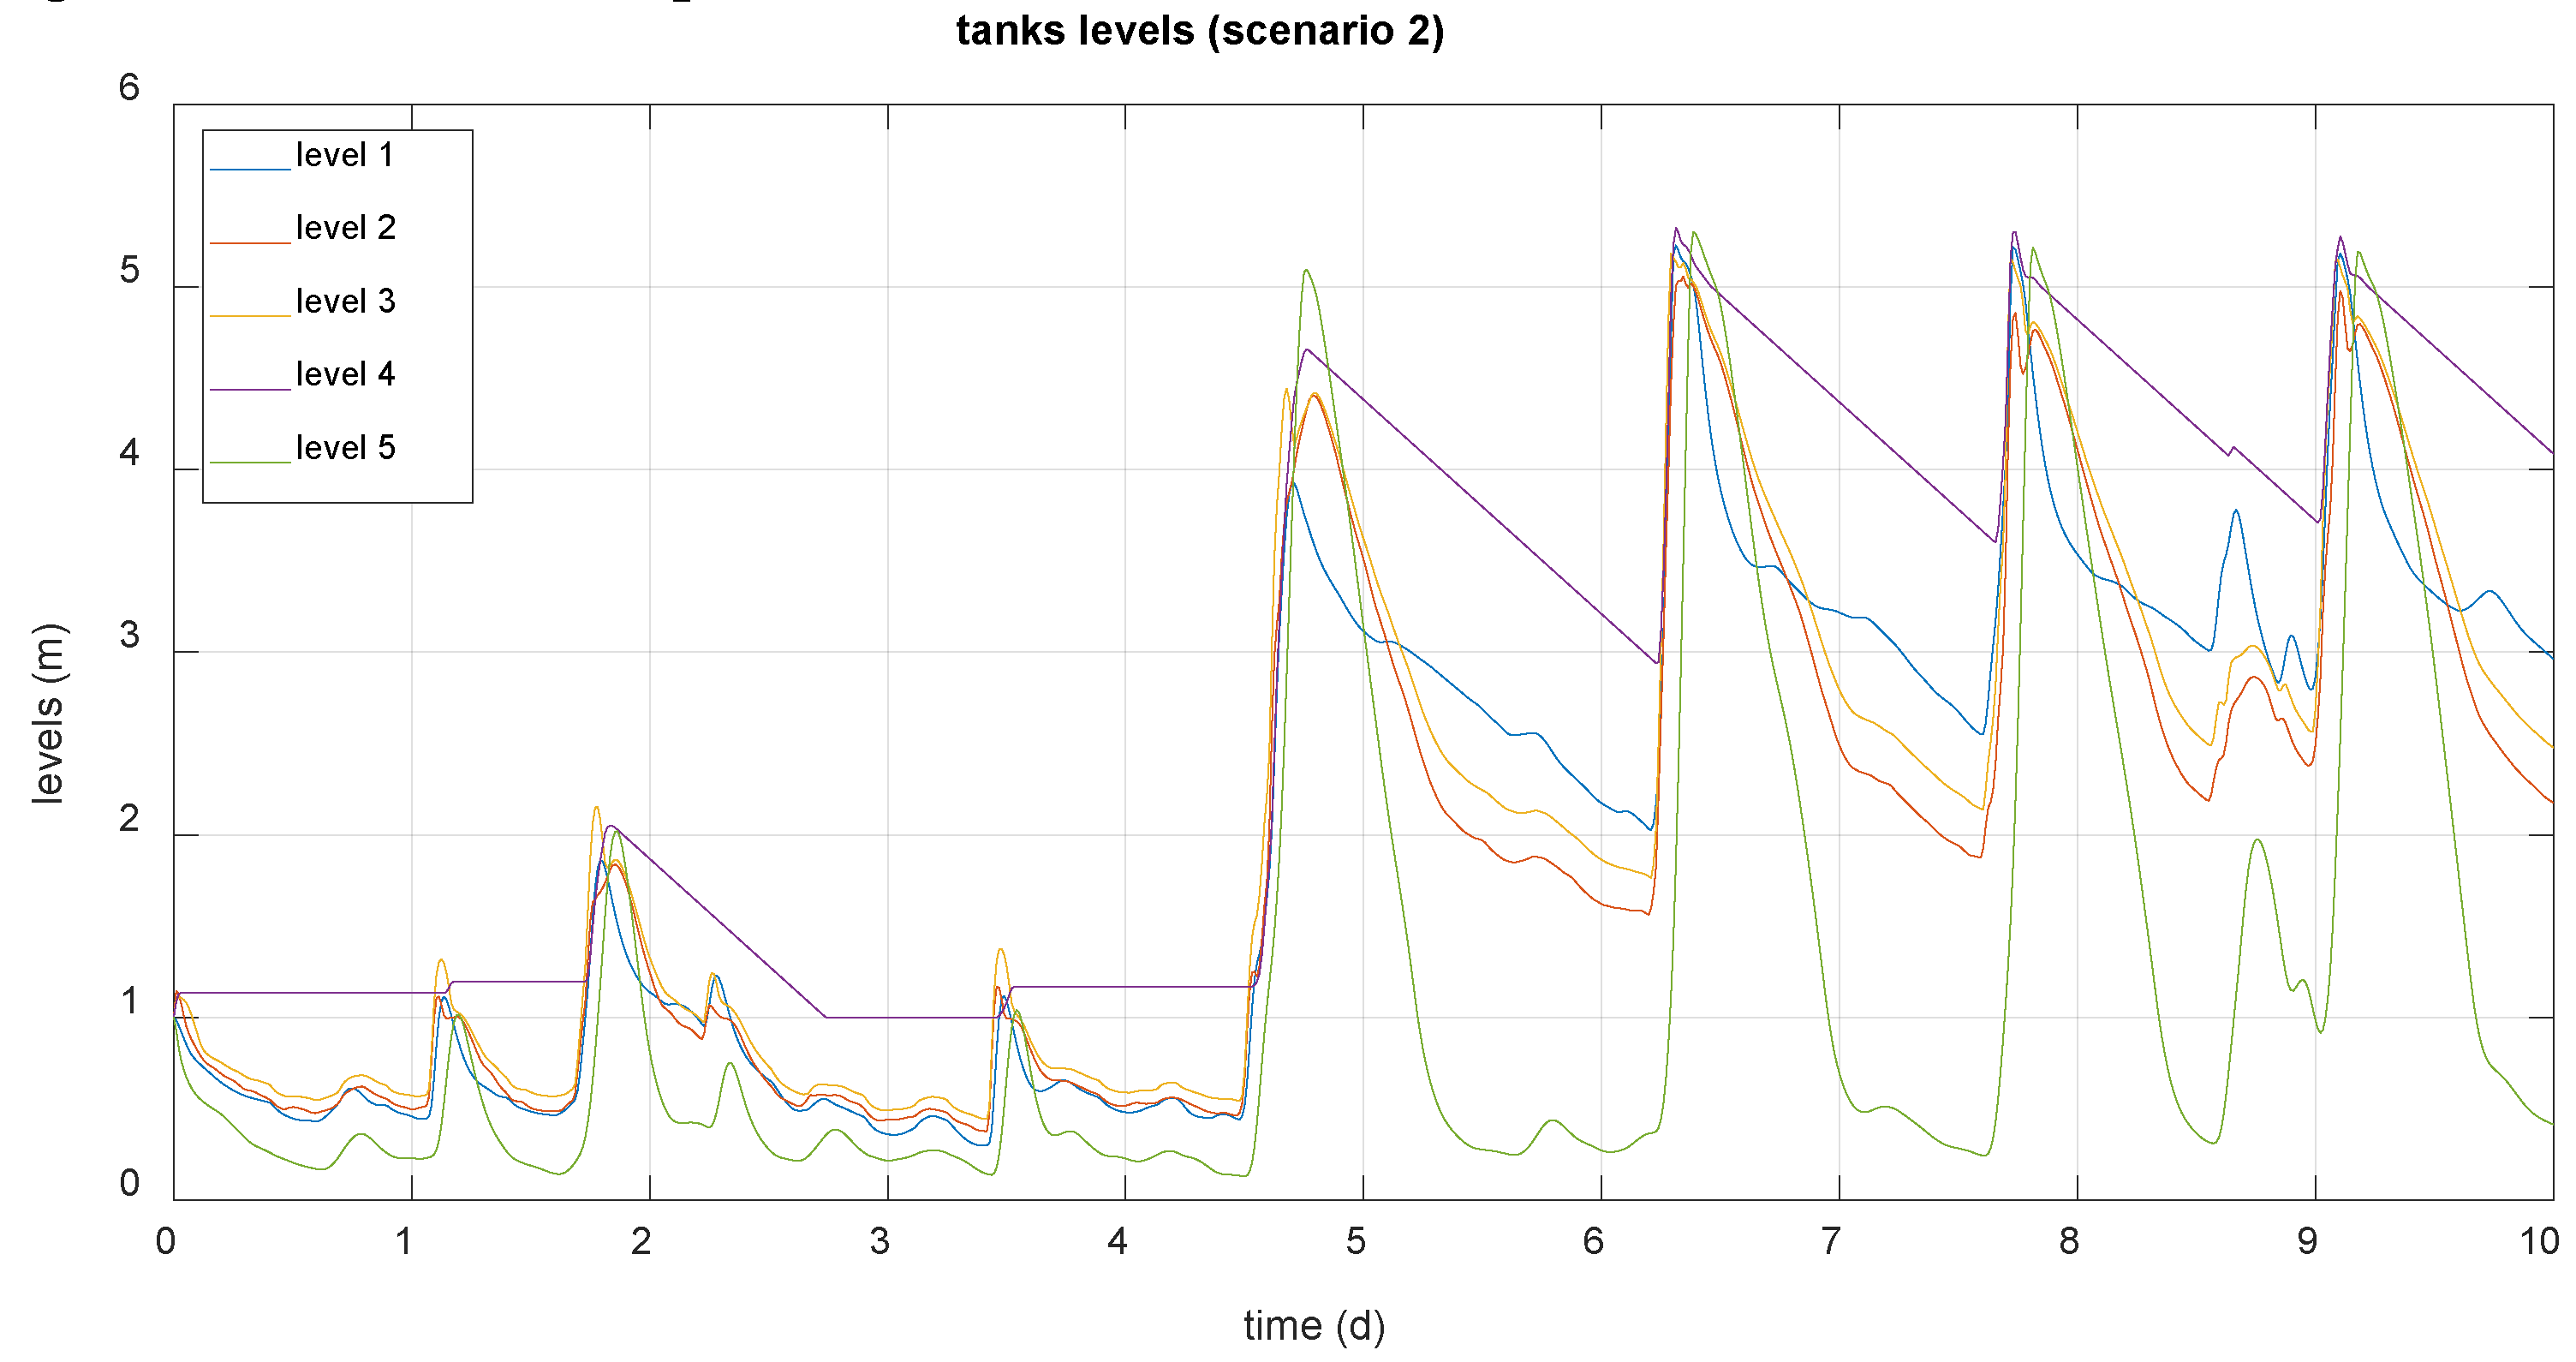
Figure 8.
Tanks levels generated by the neural network (scenario 2).
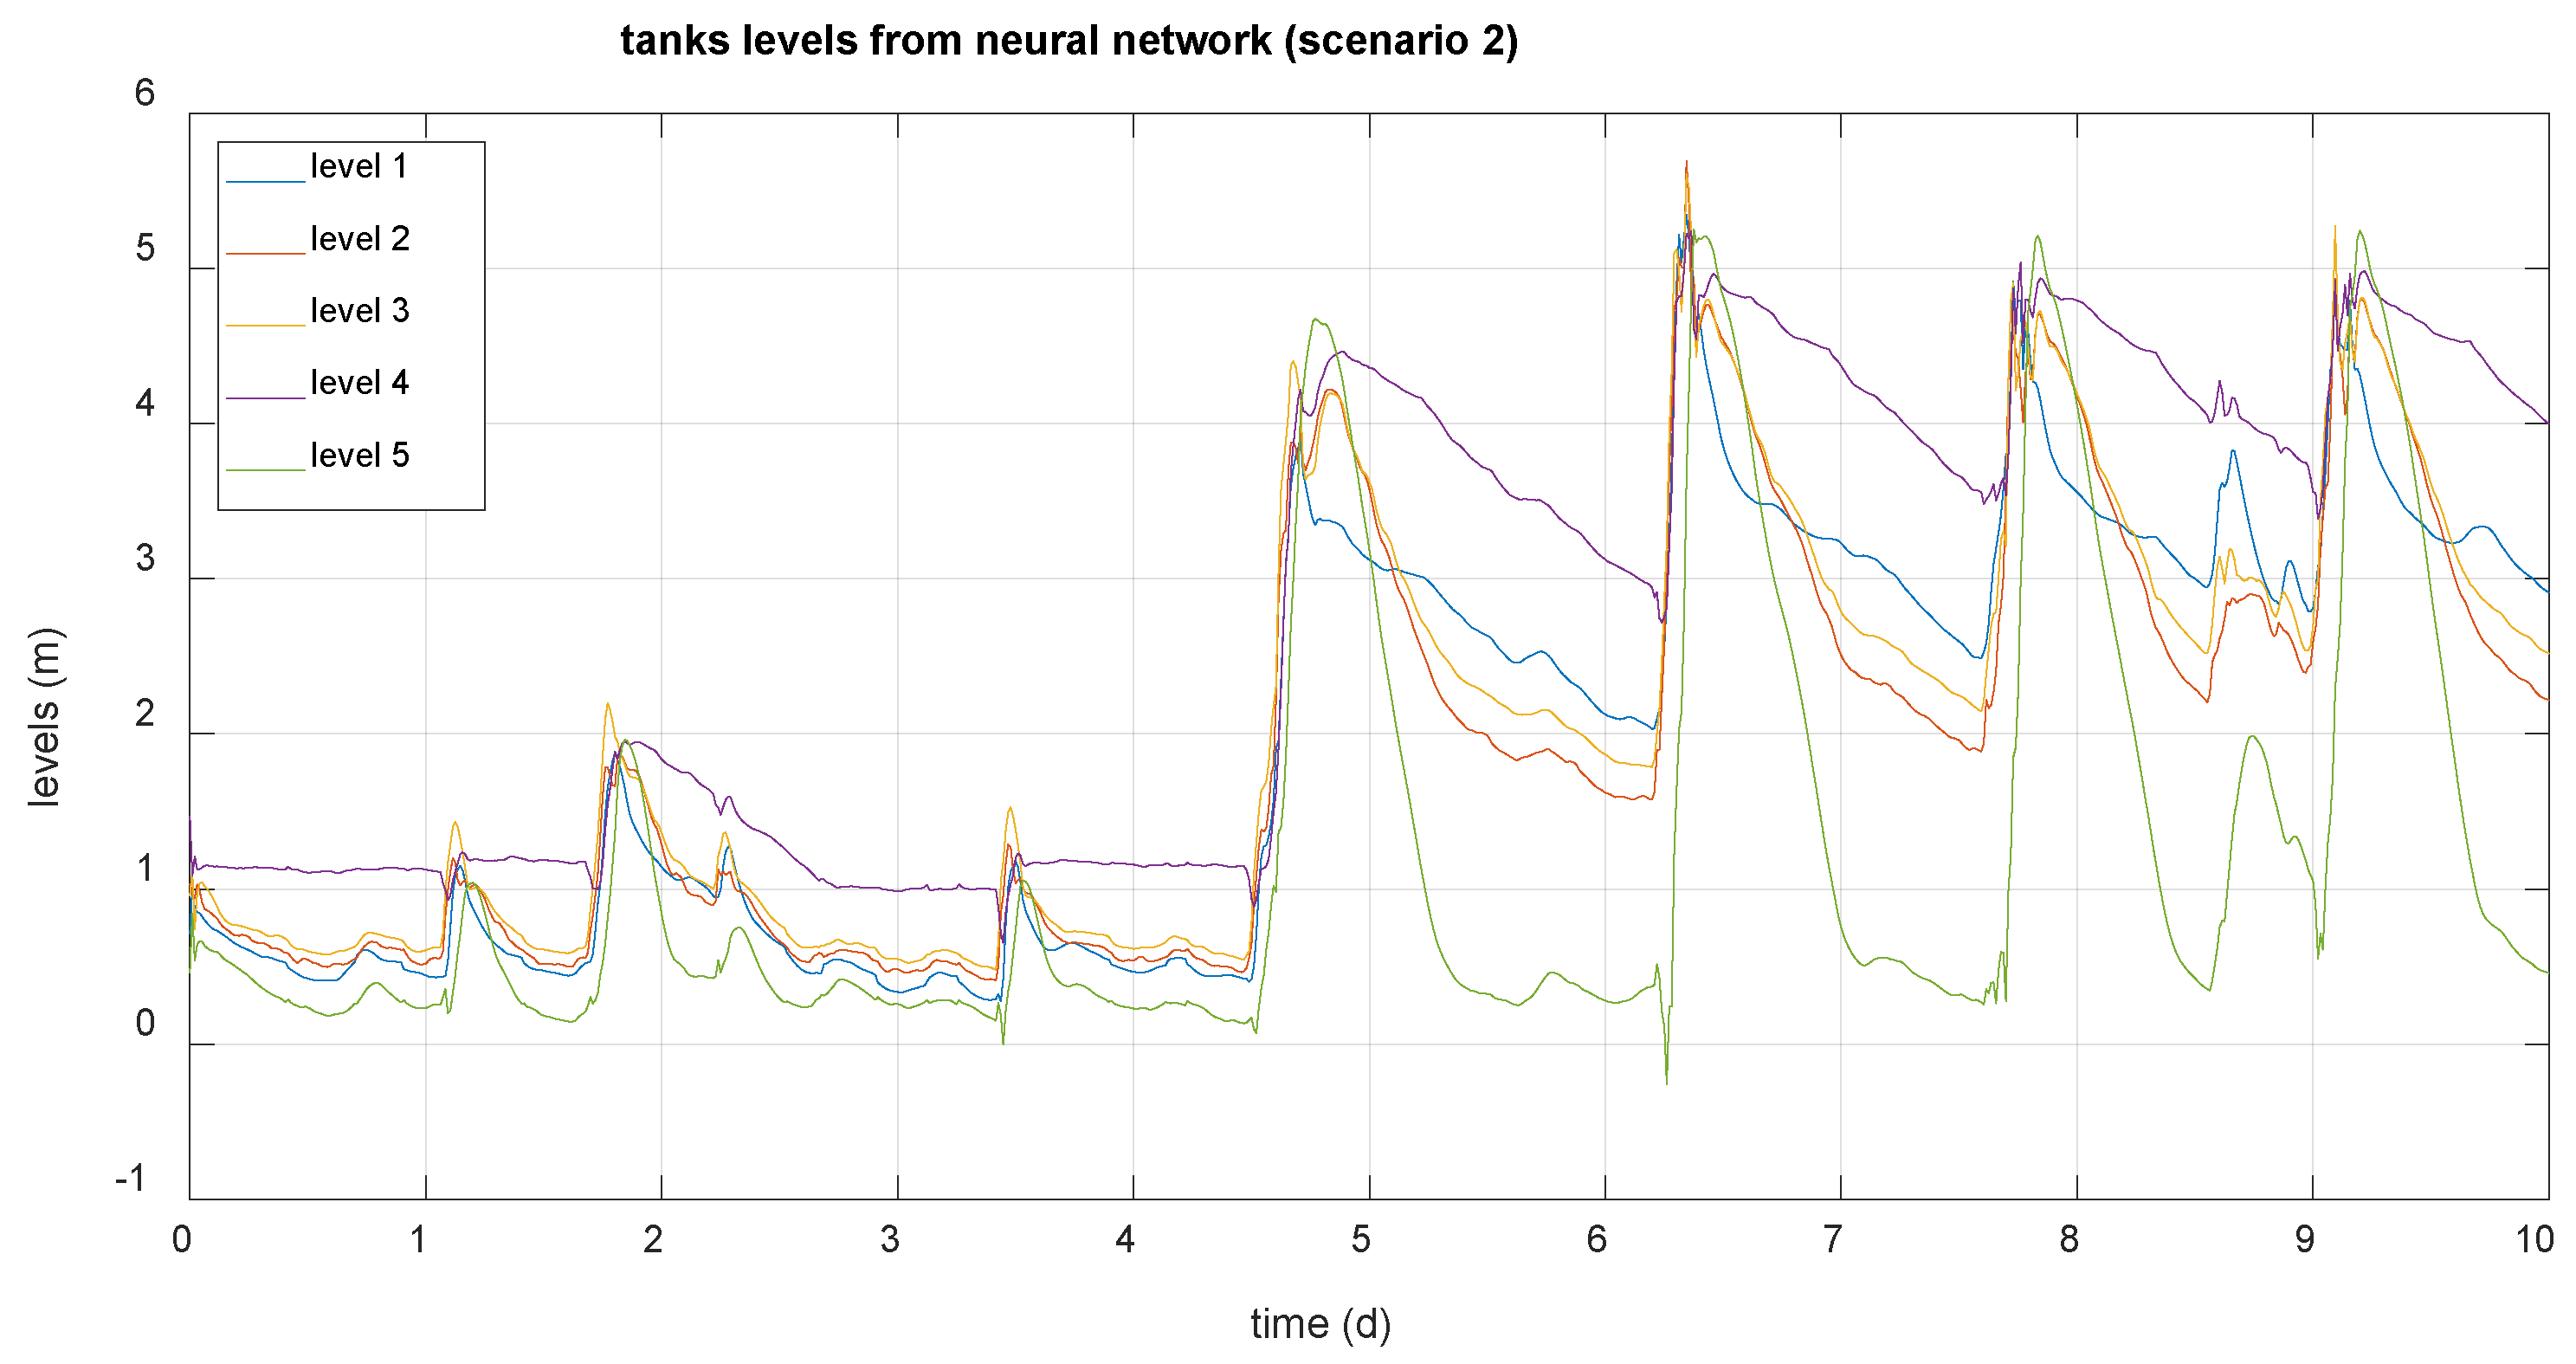
Figure 9.
Tanks levels (scenario 3).
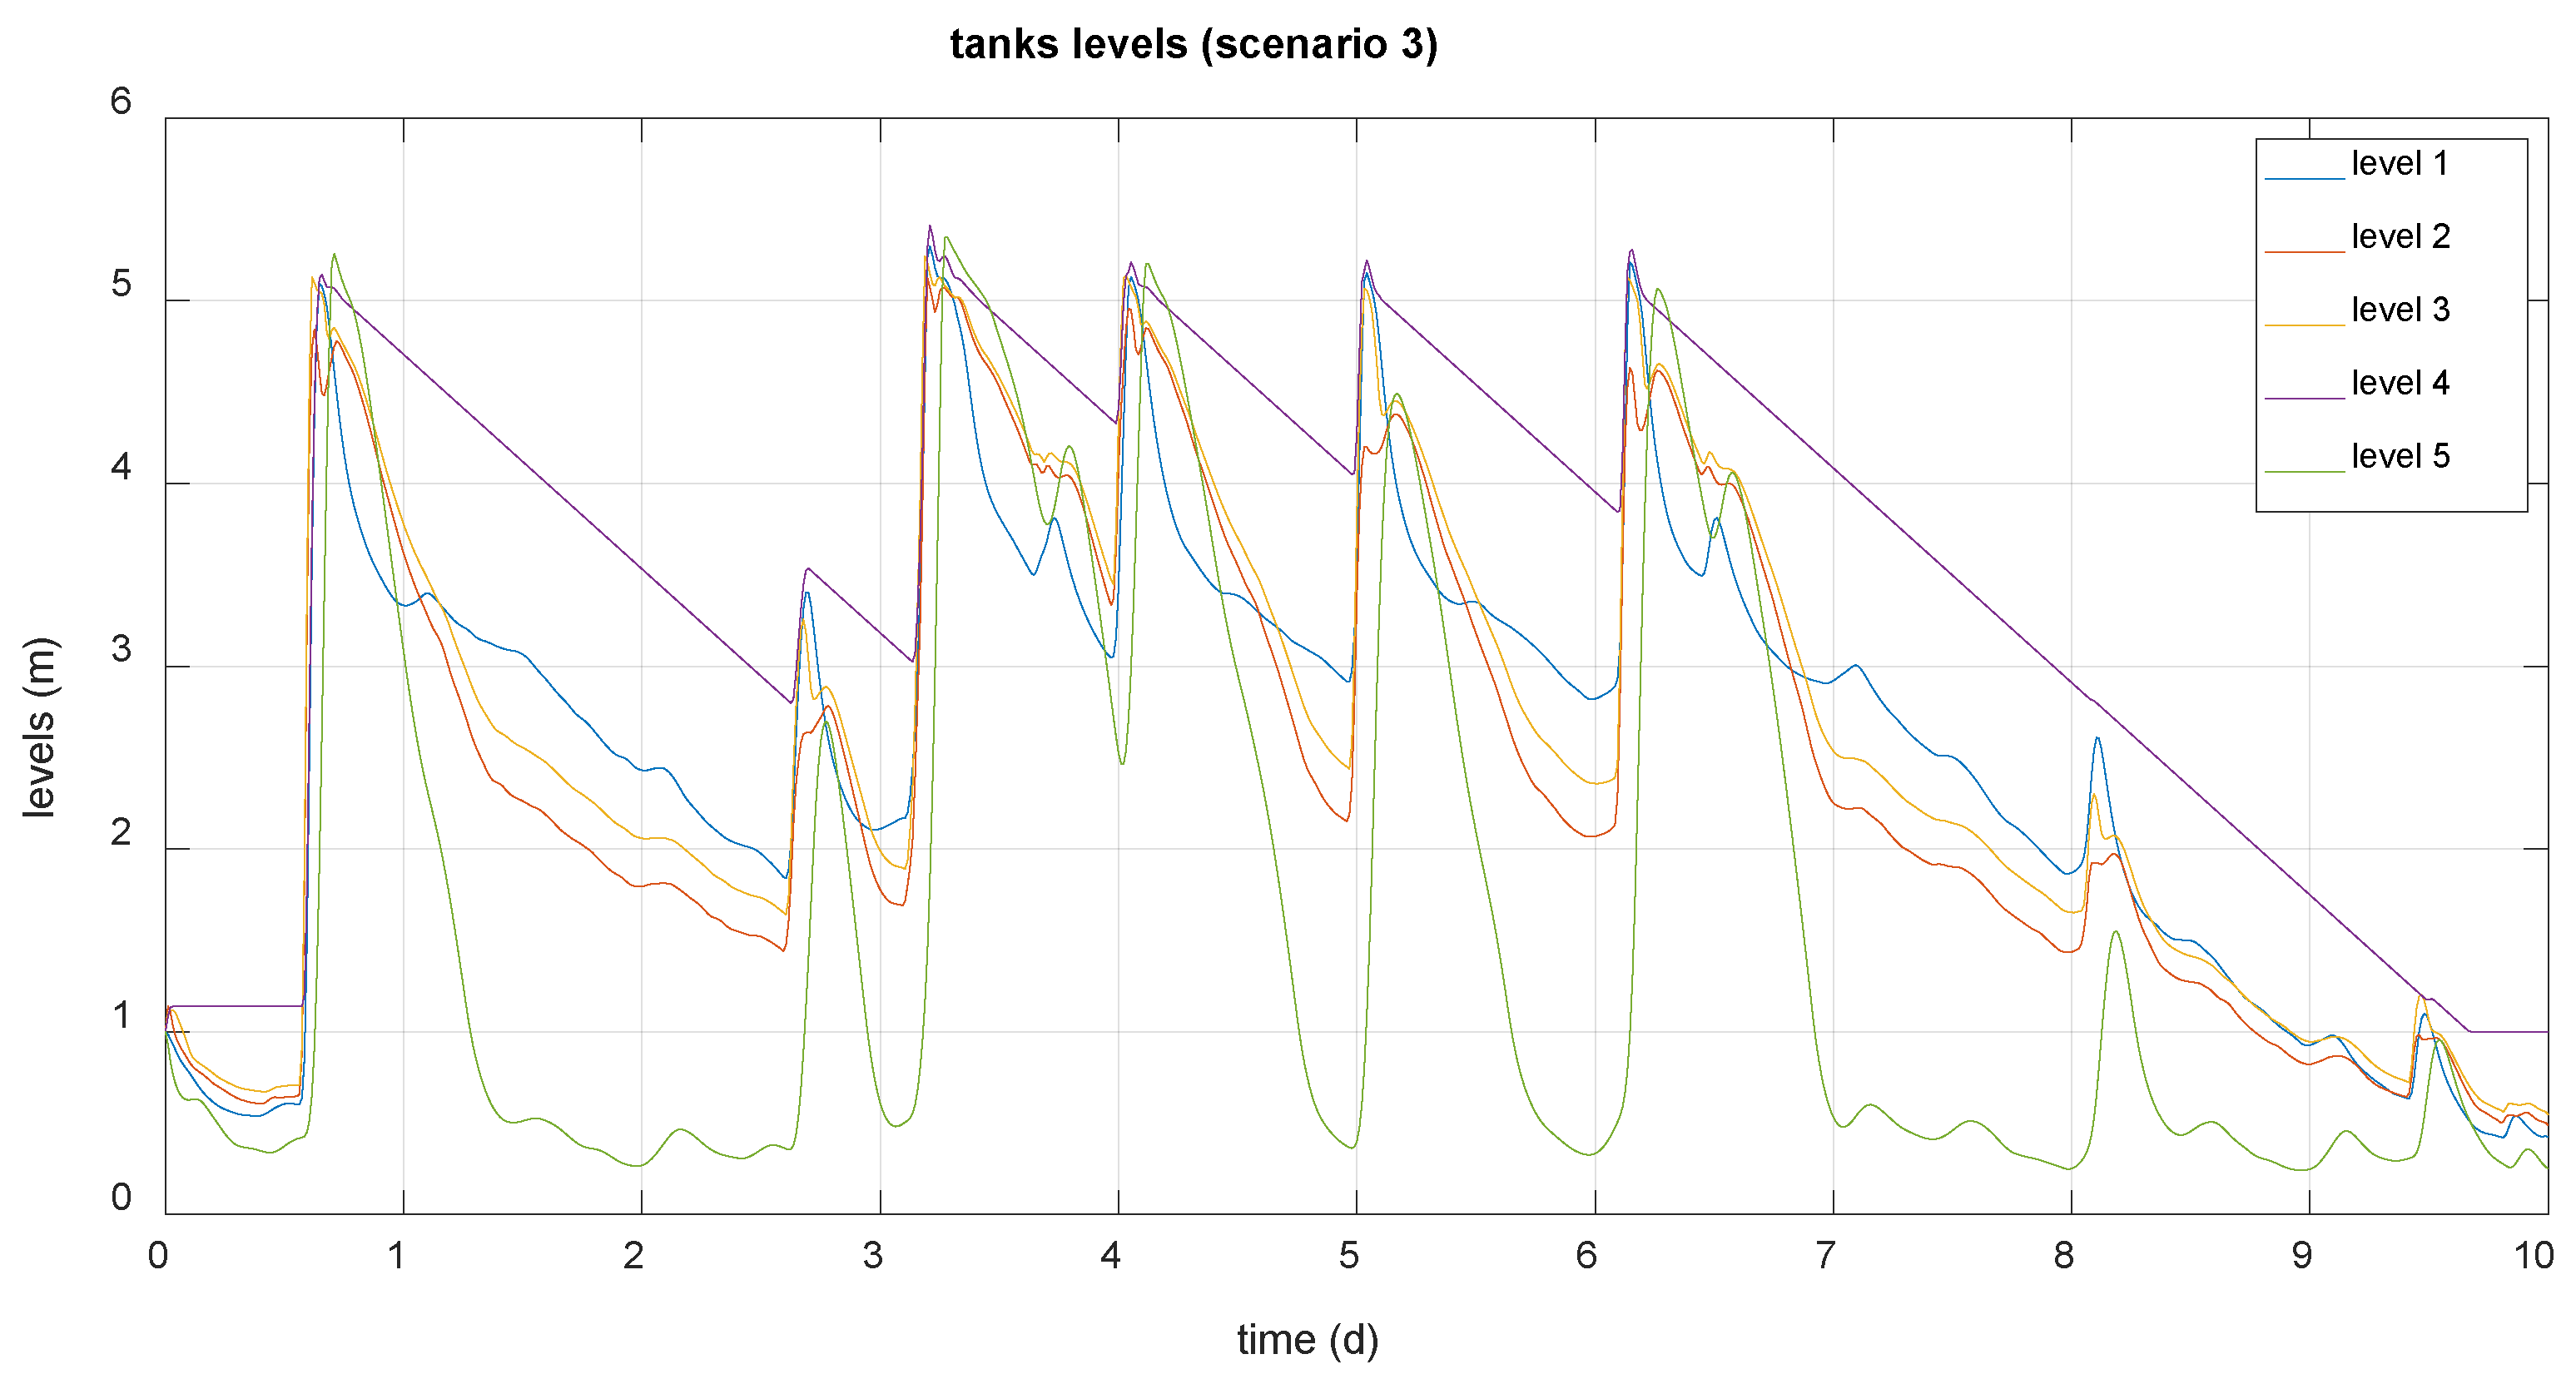
Figure 10.
Tanks levels generated by the neural network (scenario 3).
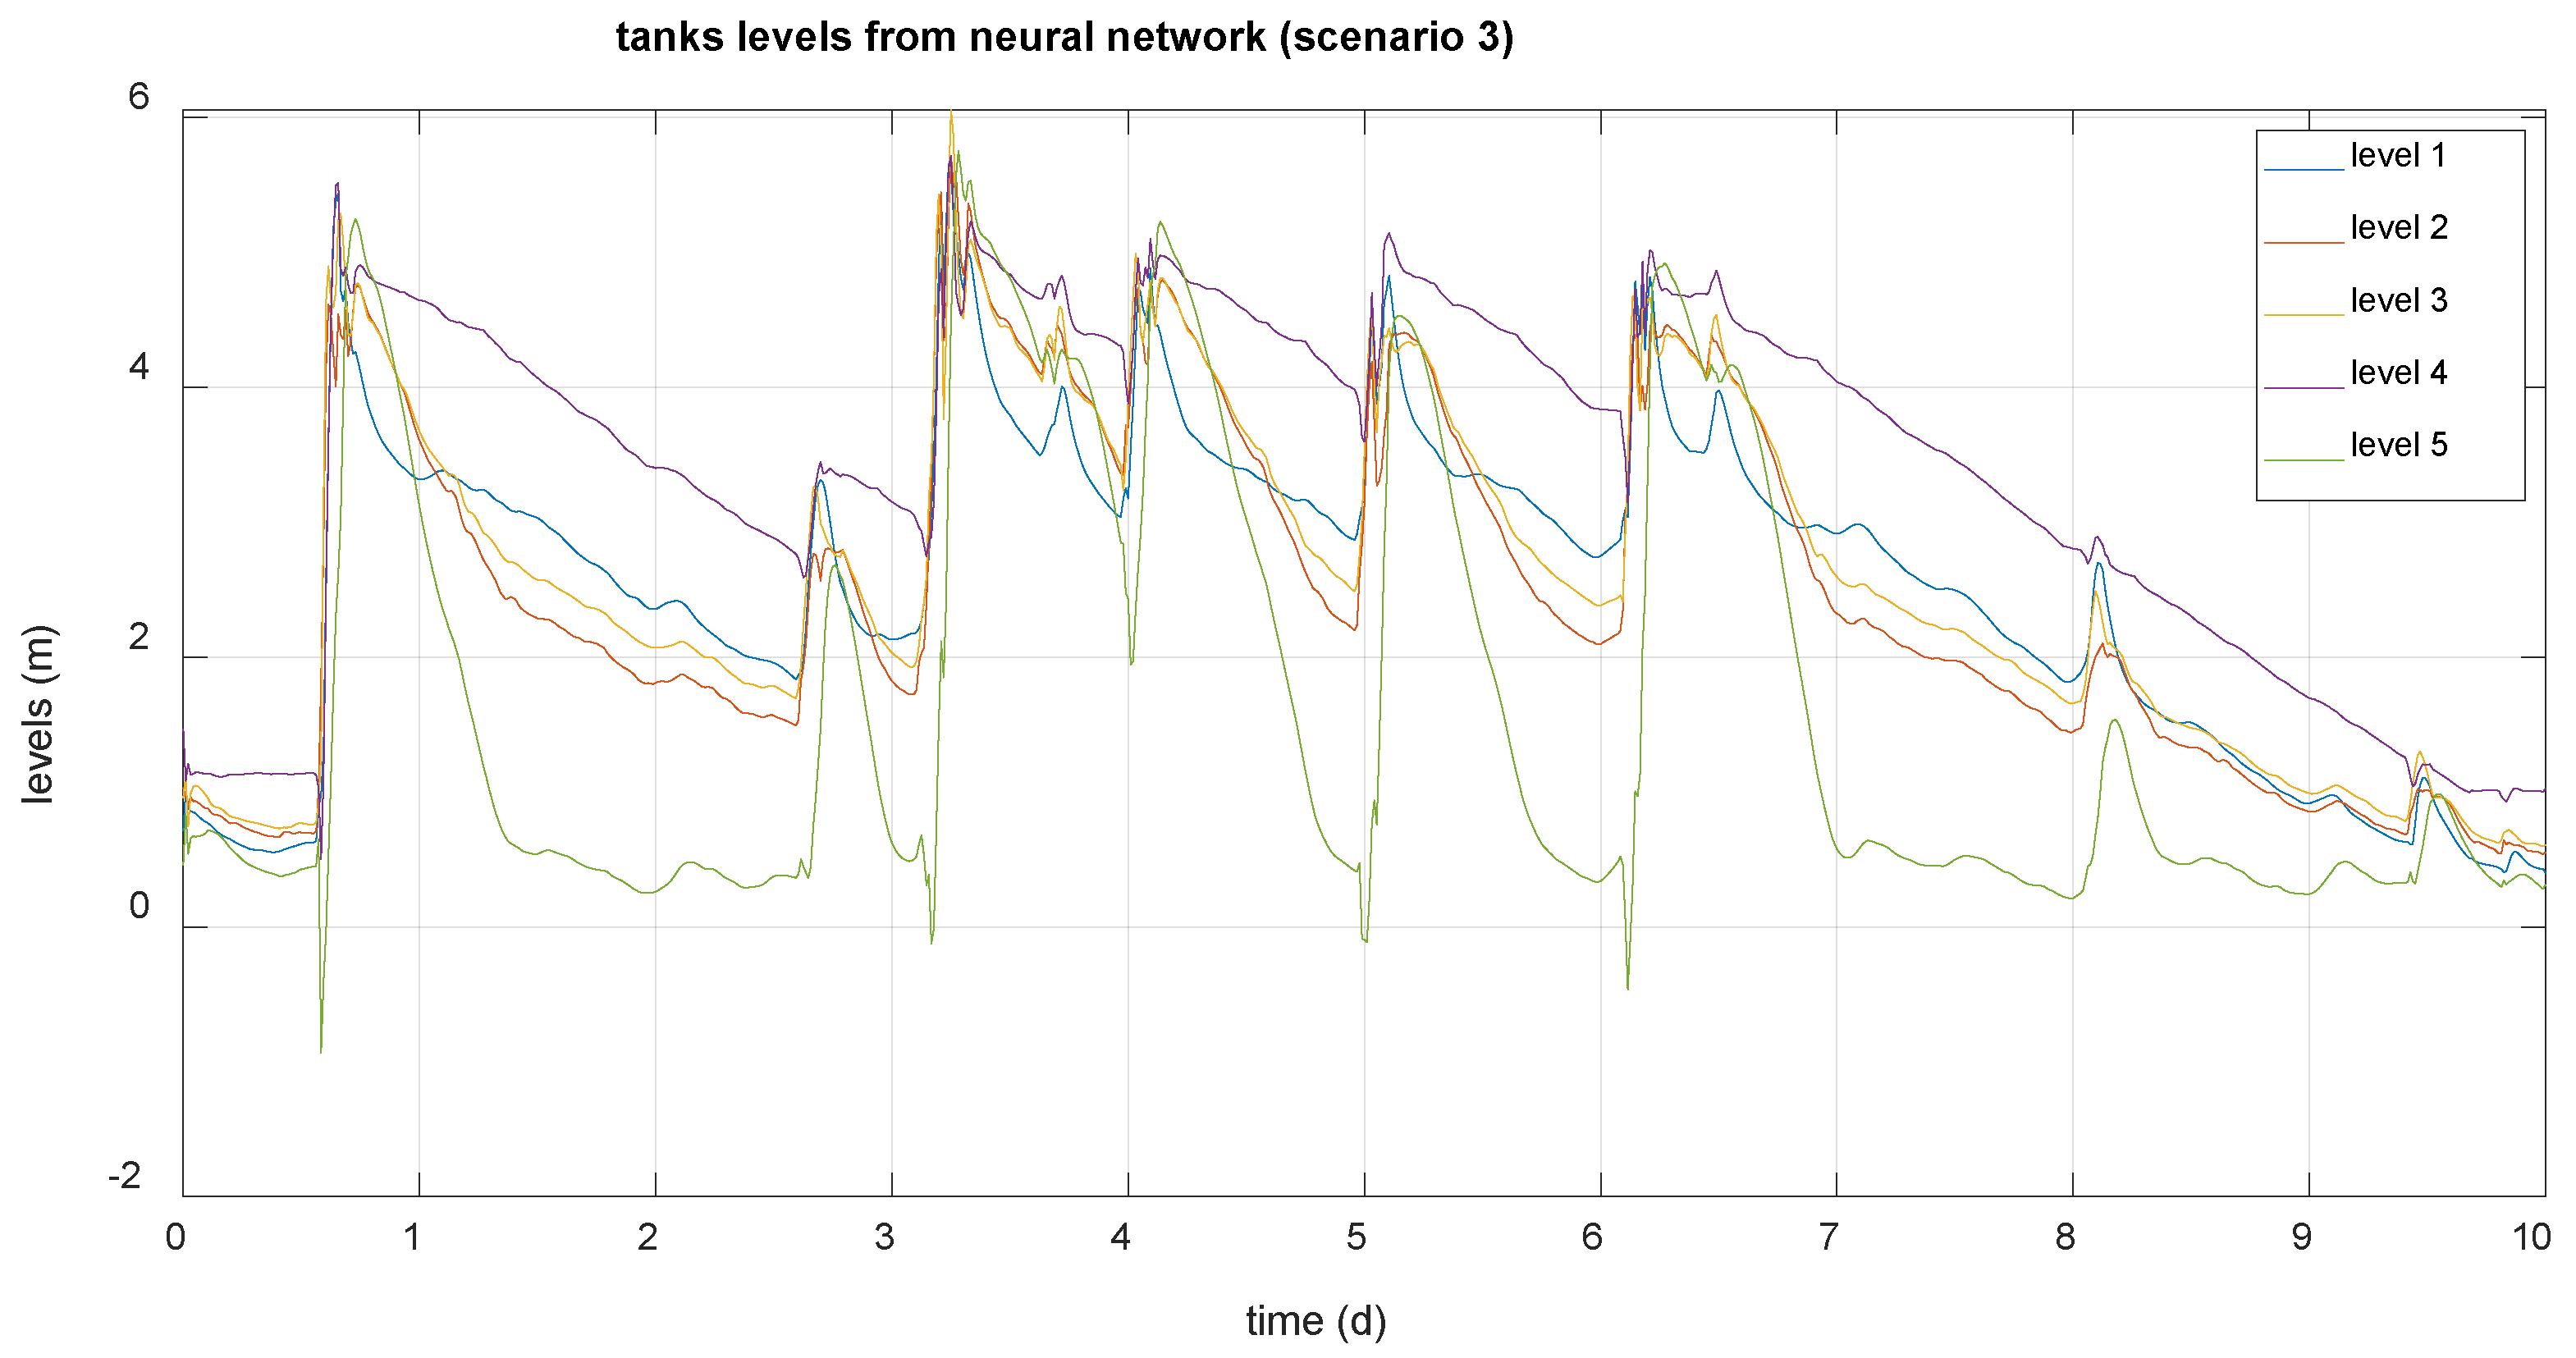
It is verified that the results provided by the network in these cases largely match those generated by the system, so the network can be used to generate normal operating data based on the disturbances that affect the system.
5.2. Fault Detection and Diagnosis Tests
As exposed in section 4.3., the faults under study will be:
- -
- - Faults in the level sensors: sensor gain is reduced to 10% of its nominal value.
- -
- - Faults in the actuators: the gate is blocked at 20% of its total opening.
These faults will be provoked on the 2nd, 5th or 8th day of 10 days interval, considering both scenarios 2 and 3.
It has been proven that, in the absence of faults, the detection system does not detect any type of fault, although it presents an alarms rate for scenarios 2 and 3 of 9.57% and 11.13%, respectively, but as it is necessary 20 consecutive alarms to consider a fault situation, none are detected.
The following graphics show the calculated threshold Q and the Q statistic in the absence of faults, for scenario 2 and 3:
Figure 11.
Q statistic and threshold calculated in normal operating situation (scenario 2).
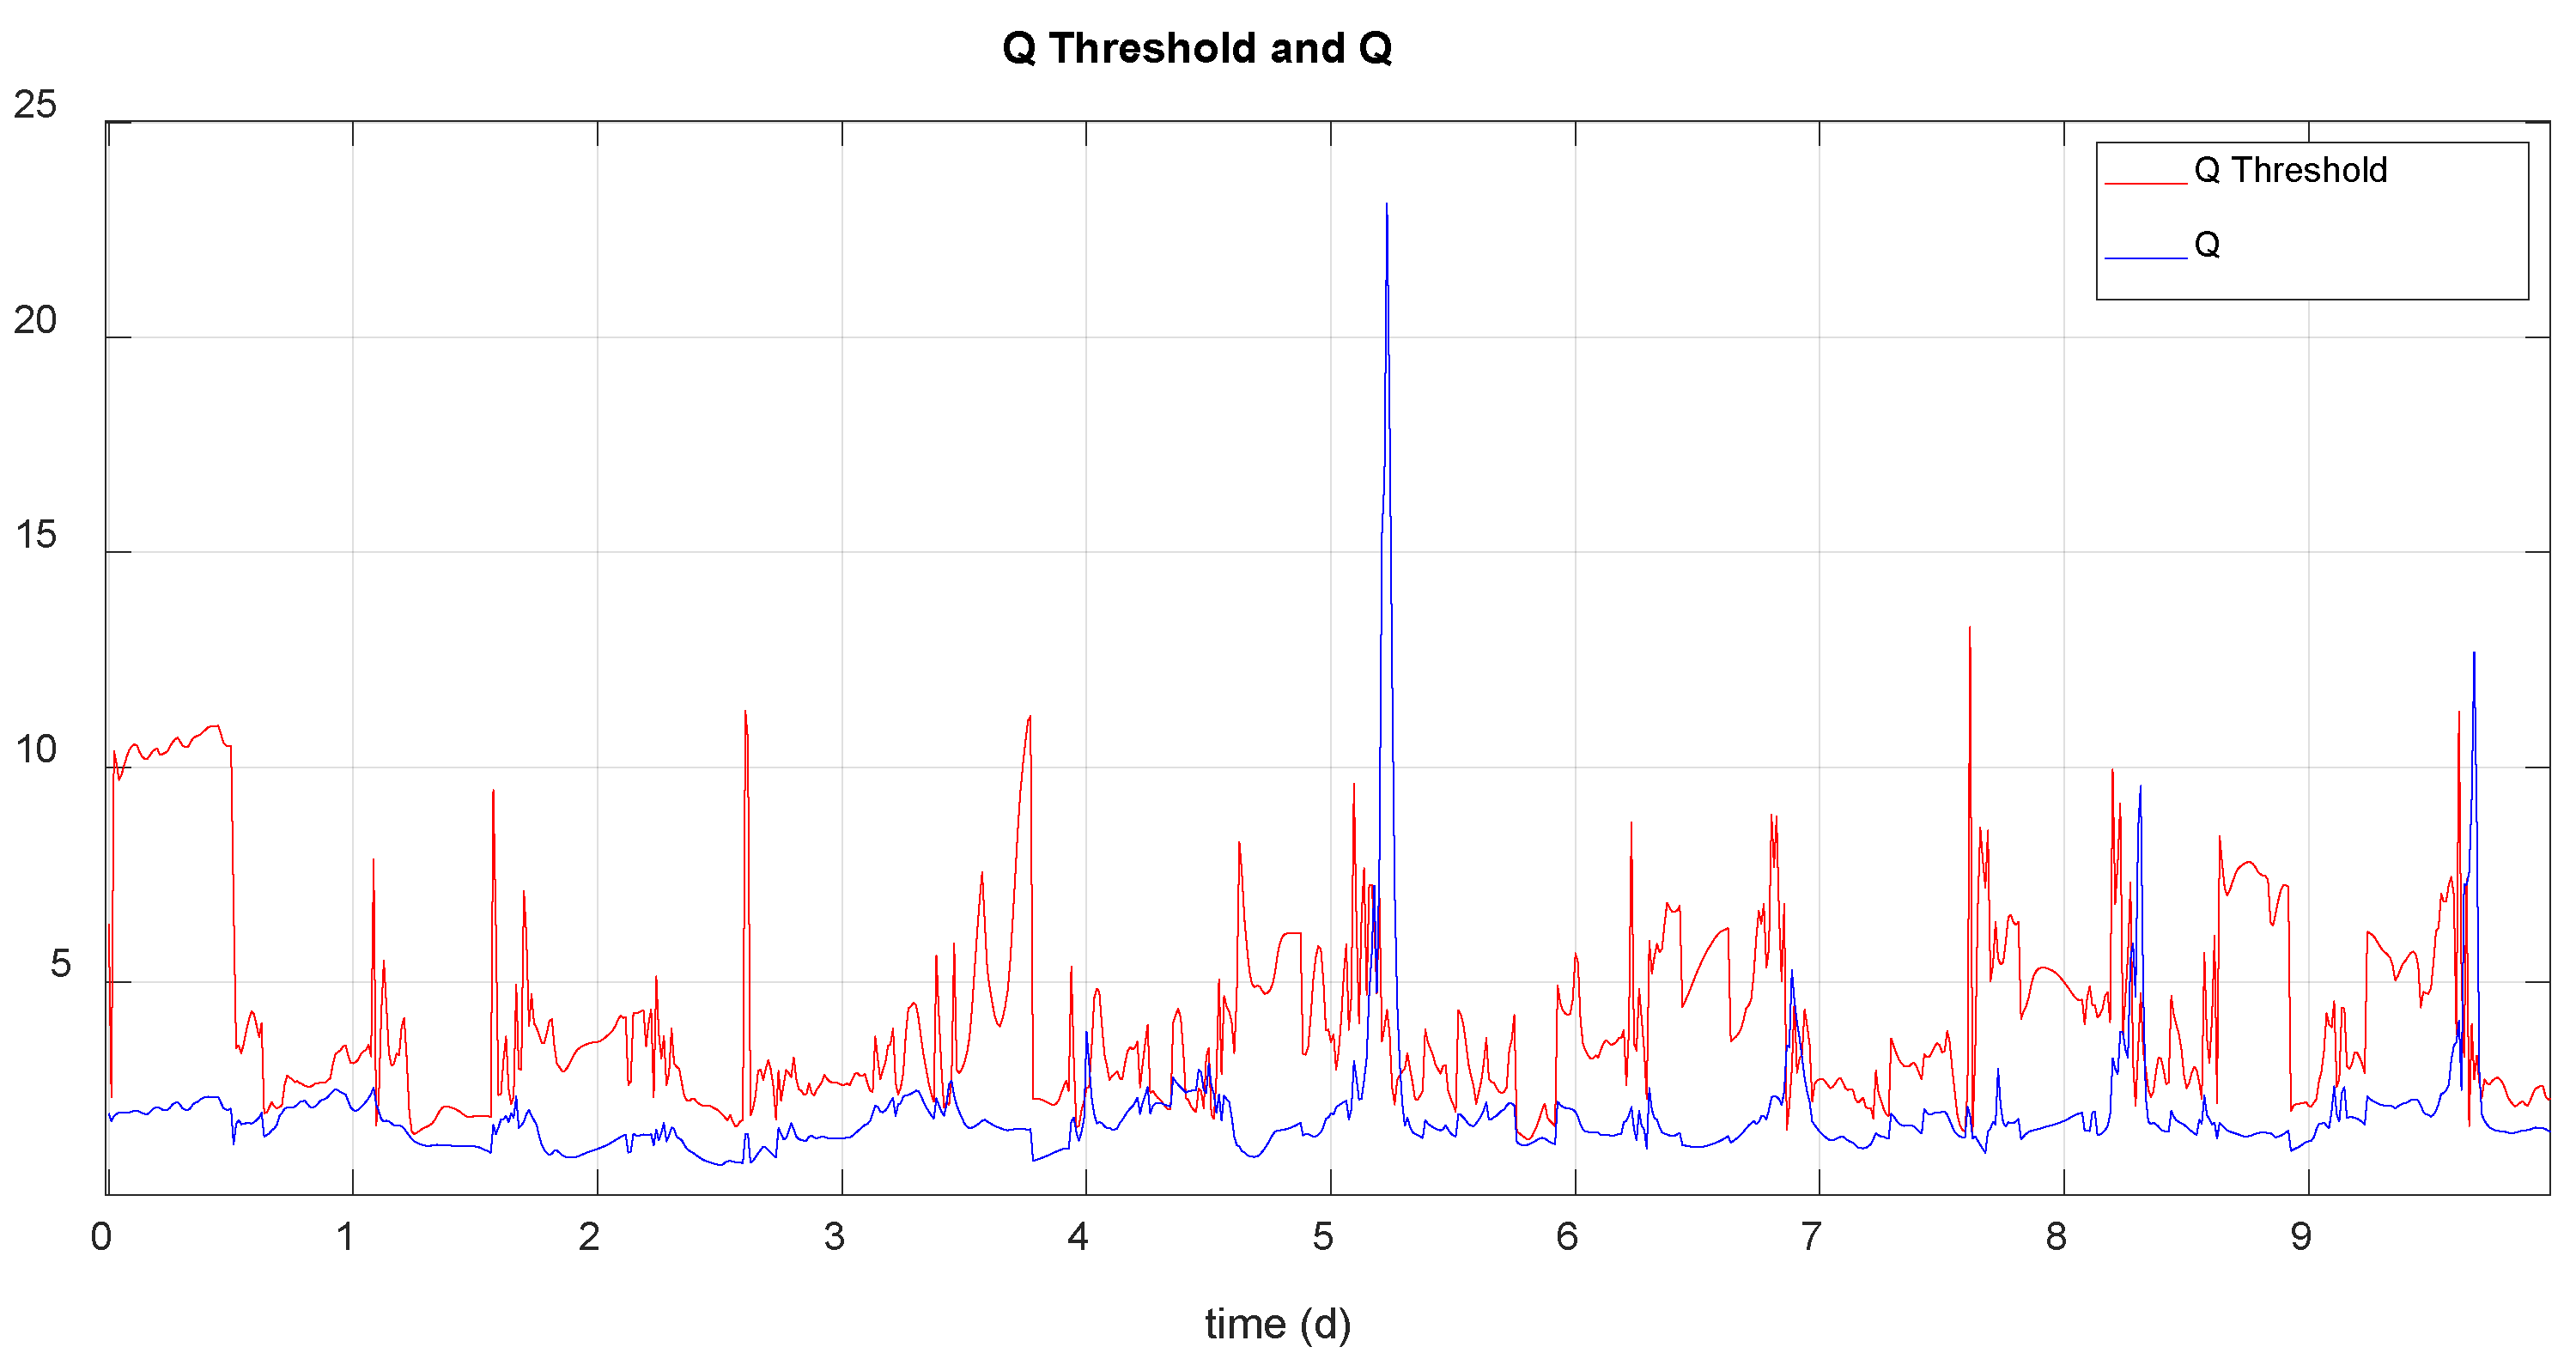
Figure 12.
Q statistic and threshold calculated in normal operating situation (scenario 3).
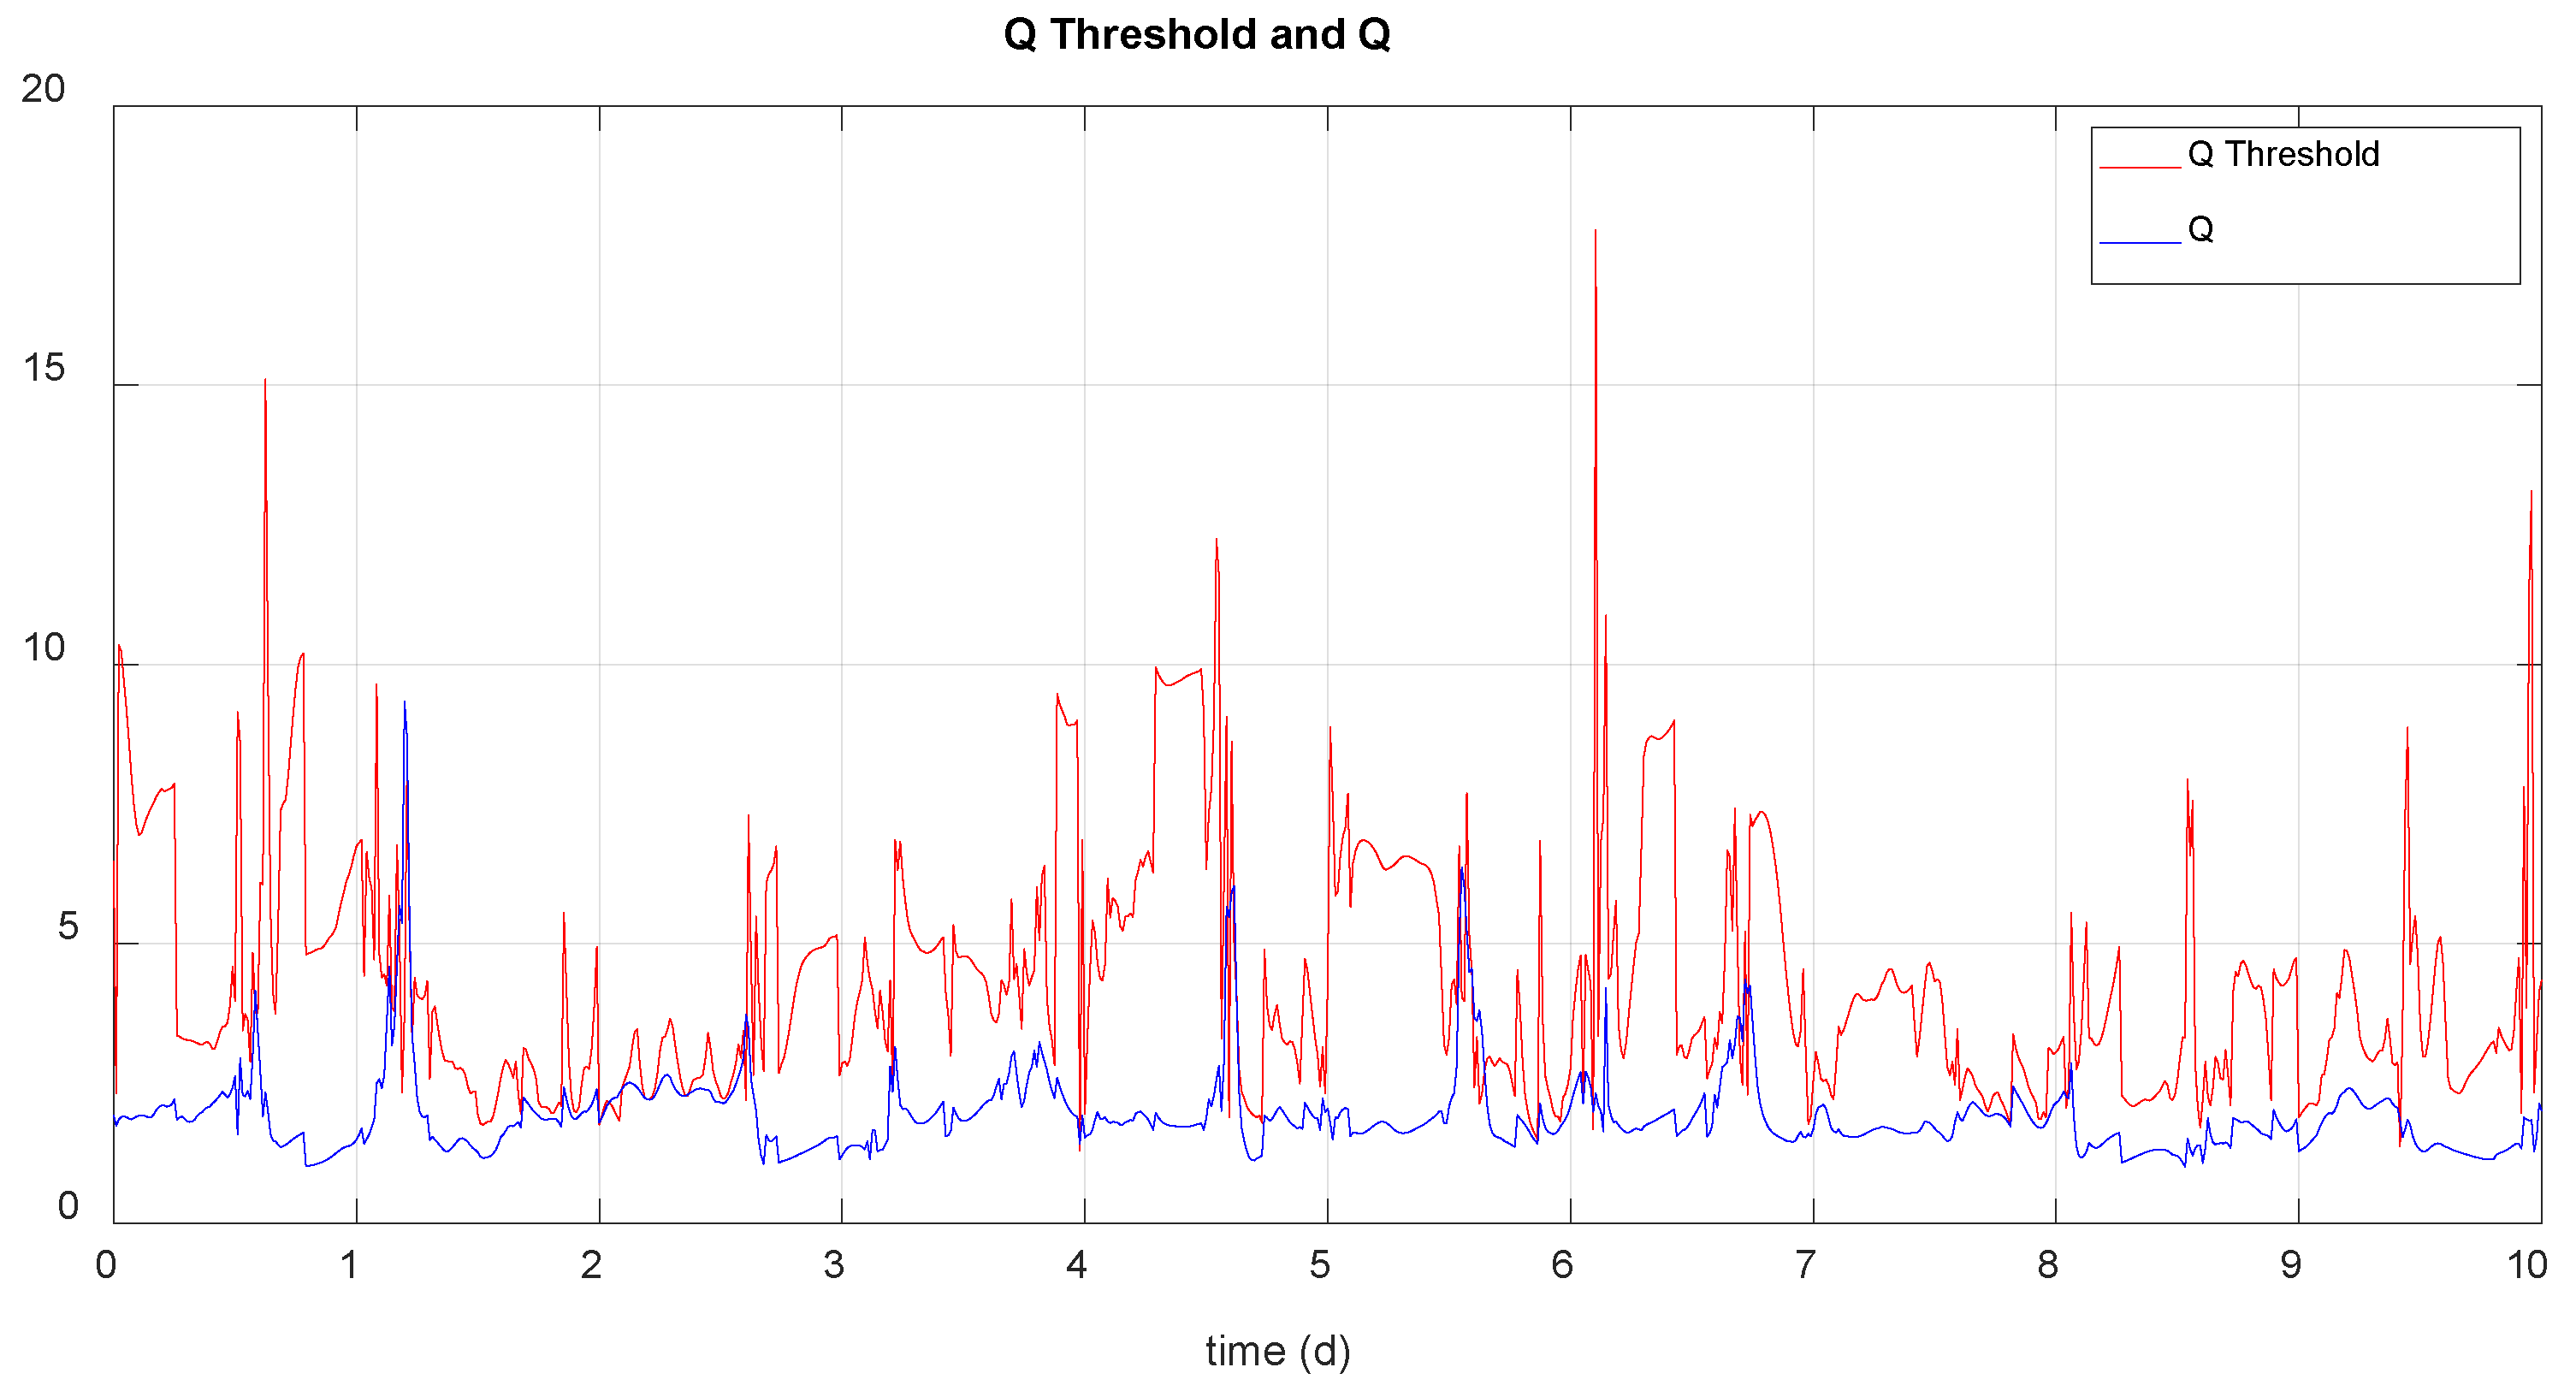
Although the Q statistic exceeds the calculated threshold on some occasions, no fault is detected for the reasons already stated. The following table shows the detection results (detection instant) and the diagnosis for the type of fault considered (fault variable: hi, is the tank i level and ui is the tank i output flow) and each time instant in which the fault is caused, for scenarios 2 and 3 (the correct diagnosis is highlighted in green):

Table 3.
Fault detection and diagnosis results for scenario 2.
| Fault type | Fault on the 2nd day | Fault on the 5th day | Fault on the 8th day | |||
|---|---|---|---|---|---|---|
| Detection (day) | Diagnosis (variable) | Detection (day) | Diagnosis (variable) | Detection (day) | Diagnosis (variable) | |
| Level sensor 1 | 2.285 | h1 | 5.26 | h1 | 8.26 | h1 |
| Level sensor 2 | 2.521 | h2 | 5.26 | u2 | 8.26 | h2 |
| Level sensor 3 | 2.625 | u3 | 5.26 | h3 | 8.271 | h3 |
| Level sensor 4 | 2.75 | h4 | 5.812 | u1 | 8.26 | h4 |
| Level sensor 5 | 3.083 | h2 | 5.521 | h5 | 8.521 | h5 |
| Gate 1 | 2.438 | u3 | 5.312 | h5 | 8.464 | h5 |
| Gate 2 | 2.346 | u3 | 5.277 | u2 | 8.327 | u2 |
| Gate 3 | 2.31 | u3 | 5.269 | u3 | 8.317 | u3 |
| Gate 4 | 5.346 | u4 | 5.531 | u1 | 8.562 | u1 |
| Gate 5 | 2.49 | h4 | 5.531 | u1 | 8.344 | u3 |
Table 4.
Fault detection and diagnosis results for scenario 3.
| Fault type | Fault on the 2nd day | Fault on the 5th day | Fault on the 8th day | |||
|---|---|---|---|---|---|---|
| Detection (day) | Diagnosis (variable) | Detection (day) | Diagnosis (variable) | Detection (day) | Diagnosis (variable) | |
| Level sensor 1 | 2.26 | h1 | 5.26 | u1 | 8.26 | h1 |
| Level sensor 2 | 2.194 | u1 | 5.26 | h3 | 8.26 | h2 |
| Level sensor 3 | 2.26 | h3 | 5.31 | h3 | 8.26 | h3 |
| Level sensor 4 | 2.865 | h4 | 5.26 | h4 | 8.76 | u4 |
| Level sensor 5 | 2.302 | h5 | 5.594 | h5 | 8.896 | h2 |
| Gate 1 | 2.26 | u1 | 5.365 | u1 | 8.579 | u1 |
| Gate 2 | 3.146 | u2 | 5.537 | u3 | 8.419 | h3 |
| Gate 3 | 2.271 | u3 | 5.485 | u3 | 8.387 | u3 |
| Gate 4 | 2.219 | u1 | 5.735 | u1 | 8.677 | u4 |
| Gate 5 | 2.26 | u5 | 5.604 | u3 | 8.438 | h4 |
Regarding fault detection, both scenarios show that all faults are detected with relative speed (almost all of them before the next day). It must be considered, as already mentioned, that these are large-scale faults. In tests carried out with less significant faults, the detection has been considerably delayed with respect to the moment of generation of the fault, and there have been cases in which the fault has not been detected.
Regarding fault classification, success is variable depending on the proximity of the disturbances to the moment of generation of the fault, as well as their magnitude and their frequency. As these characteristics are highly variable, success in detecting the fault is also variable.
5.3. Fault Detection, Diagnosis and MPC Reconfiguration Tests
Next, the comparative results of the control system in four cases will be shown:
- -
- Case 1: sewer network without control, that is, always with all the gates open.
- -
- Case 2: sewer network controlled with MPC in the absence of faults.
- -
- Case 3: sewer network controlled with MPC in the presence of a certain fault.
- -
- Case 4: sewer controlled with FTMPC. Once the fault is correctly detected and identified, the controller is reconfigured to improve system performance compared to the previous case.
In each case, scenarios 2 and 3 will be considered. Two most representative faults that are considered have been selected:
- -
- Fault in the tank 1 level sensor, in which its gain is reduced to 10% of its normal value.
- -
- Fault in the tank 3 gate, which is supposed to be blocked at 20% of its total opening.
Furthermore, to better evaluate the effect of the fault and the reconfiguration of the system, it will be assumed that, in all cases, the fault is generated on the 2nd day of the 10-day period considered for each scenario.
The performance evaluation criteria will be the same as those detailed in [39]. In summary, these criteria are: number of overflows (Nov), duration of overflow (Tov) in days, volume overflowed (Vov) in m3, degree of utilization of WWTP (Gu) in %, and smoothness in the application of control signals (S) in m3/d.
5.3.1. Scenario 2 Results
- Fault in the tank 1 level sensor: alarms percentage before a fault detection: 2.2%. Detection instant: 2.285 days.
Figure 13.
Q statistic and threshold calculated in level fault situation (scenario 2).
The figure above shows the Q threshold and the value of the Q statistic calculated online for fault detection. Detection occurs when Q exceeds the threshold 20 times.
The following table provides the comparative data of system performance, including normal operation situation, fault without reconfiguration, and fault with controller reconfiguration (FTMPC).
Table 5.
System performance in every case: fault in tank 1 level sensor (scenario 2).
| Data | No Control | Normal MPC | MPC with h1 fault | Reconfigured MPC |
|---|---|---|---|---|
| Nov,1 | 0 | 3 | 1 | 1 |
| Nov,2 | 0 | 1 | 1 | 1 |
| Nov,3 | 1 | 3 | 3 | 3 |
| Nov,4 | 3 | 3 | 4 | 3 |
| Nov,5 | 1 | 4 | 4 | 4 |
| Nov,WWTP | 6 | 5 | 6 | 5 |
| Tov,1 | 0 | 0.0396 | 1.0917 | 0.7417 |
| Tov,2 | 0 | 0.0146 | 0.0063 | 0.0104 |
| Tov,3 | 0.0146 | 0.0437 | 0.0396 | 0.0396 |
| Tov,4 | 0.0771 | 0.0917 | 0.1167 | 0.0917 |
| Tov,5 | 0.0083 | 0.0604 | 0.0583 | 0.0583 |
| Tov,WWTP | 0.3563 | 0.5854 | 0.5333 | 0.4937 |
| Vov,1 | 0 | 5.3998× 10³ | 5.0830× 10⁴ | 3.5204× 10⁴ |
| Vov,2 | 0 | 83.5089 | 47.0085 | 79.0783 |
| Vov,3 | 556.6261 | 1.8417× 10³ | 1.6621× 10³ | 1.6522× 10³ |
| Vov,4 | 7.9044× 10³ | 1.3097× 10⁴ | 2.3892× 10⁴ | 1.8166× 10⁴ |
| Vov,5 | 314.0450 | 1.2763× 10⁴ | 1.2246× 10⁴ | 1.3402× 10⁴ |
| Vov,WWTP | 5.9698× 10⁴ | 148.6536 | 155.0684 | 1.2201× 10³ |
| Vov | 6.8473× 10⁴ | 2.7935× 10⁴ | 3.8003× 10⁴ | 3.4520× 10⁴ |
| QWWTP | 3.2379× 10⁴ | 3.5974× 10⁴ | 3.4753× 10⁴ | 3.5129× 10⁴ |
| Gu | 53.9648 | 59.9560 | 57.9210 | 58.5486 |
| S | - | 6.8276×10¹⁰ | 6.7398×10¹⁰ | 3.1712×10¹¹ |
Regarding the Table 5, the main indices are Vov, Gu and S. For discussion, normal MPC controller offers the best performance because the total overflow is the smallest as well as the smoothness in control actions and provides the highest degree of WWTP utilization. MPC with the fault considered, reduces the system performance, worsening all indices, but by comparing with no control case, its performance is much better since Gu is 57.92% vs. 53.96%, Vov is 3.8003× 10⁴ vs. 6.8473× 10⁴ (m3). Finally, by comparing MPC with fault with FTCMPC, this one improves since the total overflow volume is reduced and the degree of WWTP utilization increases although S is worse because the system needs greater control efforts.
- Fault in the tank 3 gate: alarms percentage before a fault detection: 2.01%. Detection instant: 2.31 days.
Figure 14 shows the Q threshold calculated online and the value of the Q statistic for fault detection. Detection happens when Q exceeds the threshold 20 times. The following table provides the comparative data of system performance in each case.
Table 6.
System performance in every case: fault in tank 3 gate (scenario 2).
| Data | No Control | Normal MPC | MPC with u3 fault | Reconfigured MPC |
|---|---|---|---|---|
| Nov,1 | 0 | 3 | 3 | 3 |
| Nov,2 | 0 | 1 | 3 | 3 |
| Nov,3 | 1 | 3 | 4 | 4 |
| Nov,4 | 3 | 3 | 3 | 3 |
| Nov,5 | 1 | 4 | 4 | 3 |
| Nov,WWTP | 6 | 5 | 6 | 6 |
| Tov,1 | 0 | 0.0396 | 0.0396 | 0.0375 |
| Tov,2 | 0 | 0.0146 | 0.0354 | 0.0396 |
| Tov,3 | 0.0146 | 0.0437 | 0.6896 | 0.6896 |
| Tov,4 | 0.0771 | 0.0917 | 0.0792 | 0.0813 |
| Tov,5 | 0.0083 | 0.0604 | 0.0563 | 0.0500 |
| Tov,WWTP | 0.3563 | 0.5854 | 0.5271 | 0.5250 |
| Vov,1 | 0 | 5.3998× 10³ | 4.6476× 10³ | 4.1425× 10³ |
| Vov,2 | 0 | 83.5089 | 716.7745 | 907.9697 |
| Vov,3 | 556.6261 | 1.8417× 10³ | 1.6621× 10³ | 1.6522× 10³ |
| Vov,4 | 7.9044× 10³ | 1.3097× 10⁴ | 9.1273× 10³ | 9.2190× 10³ |
| Vov,5 | 314.0450 | 1.2763× 10⁴ | 1.1609× 10⁴ | 1.1453× 10⁴ |
| Vov,WWTP | 5.9698× 10⁴ | 148.6536 | 134.7366 | 134.5941 |
| Vov | 6.8473× 10⁴ | 2.7935× 10⁴ | 3.5235× 10⁴ | 3.5162× 10⁴ |
| QWWTP | 3.2379× 10⁴ | 3.5974× 10⁴ | 3.5092× 10⁴ | 3.5114× 10⁴ |
| Gu | 53.9648 | 59.9560 | 58.4874 | 58.5230 |
| S | - | 6.8276×10¹⁰ | 6.7277×10¹⁰ | 6.7843×10¹⁰ |
Considering the main indices (Vov, Gu and S), results discussion is like previous section, having normal MPC controller the best performance. Also, MPC with the fault considered, reduces the system performance, but by comparing with no control case, its performance is much better since Gu is 58.49% vs. 53.96%, Vov is 3.5235× 10⁴ vs. 6.8473× 10⁴ (m3). Finally, by comparing MPC with fault with FTCMPC, this one improves slightly the system performance, since the total overflow volume is reduced and the degree of WWTP utilization increases but S is worse because the system needs greater control efforts.
5.3.2. Scenario 3 Results
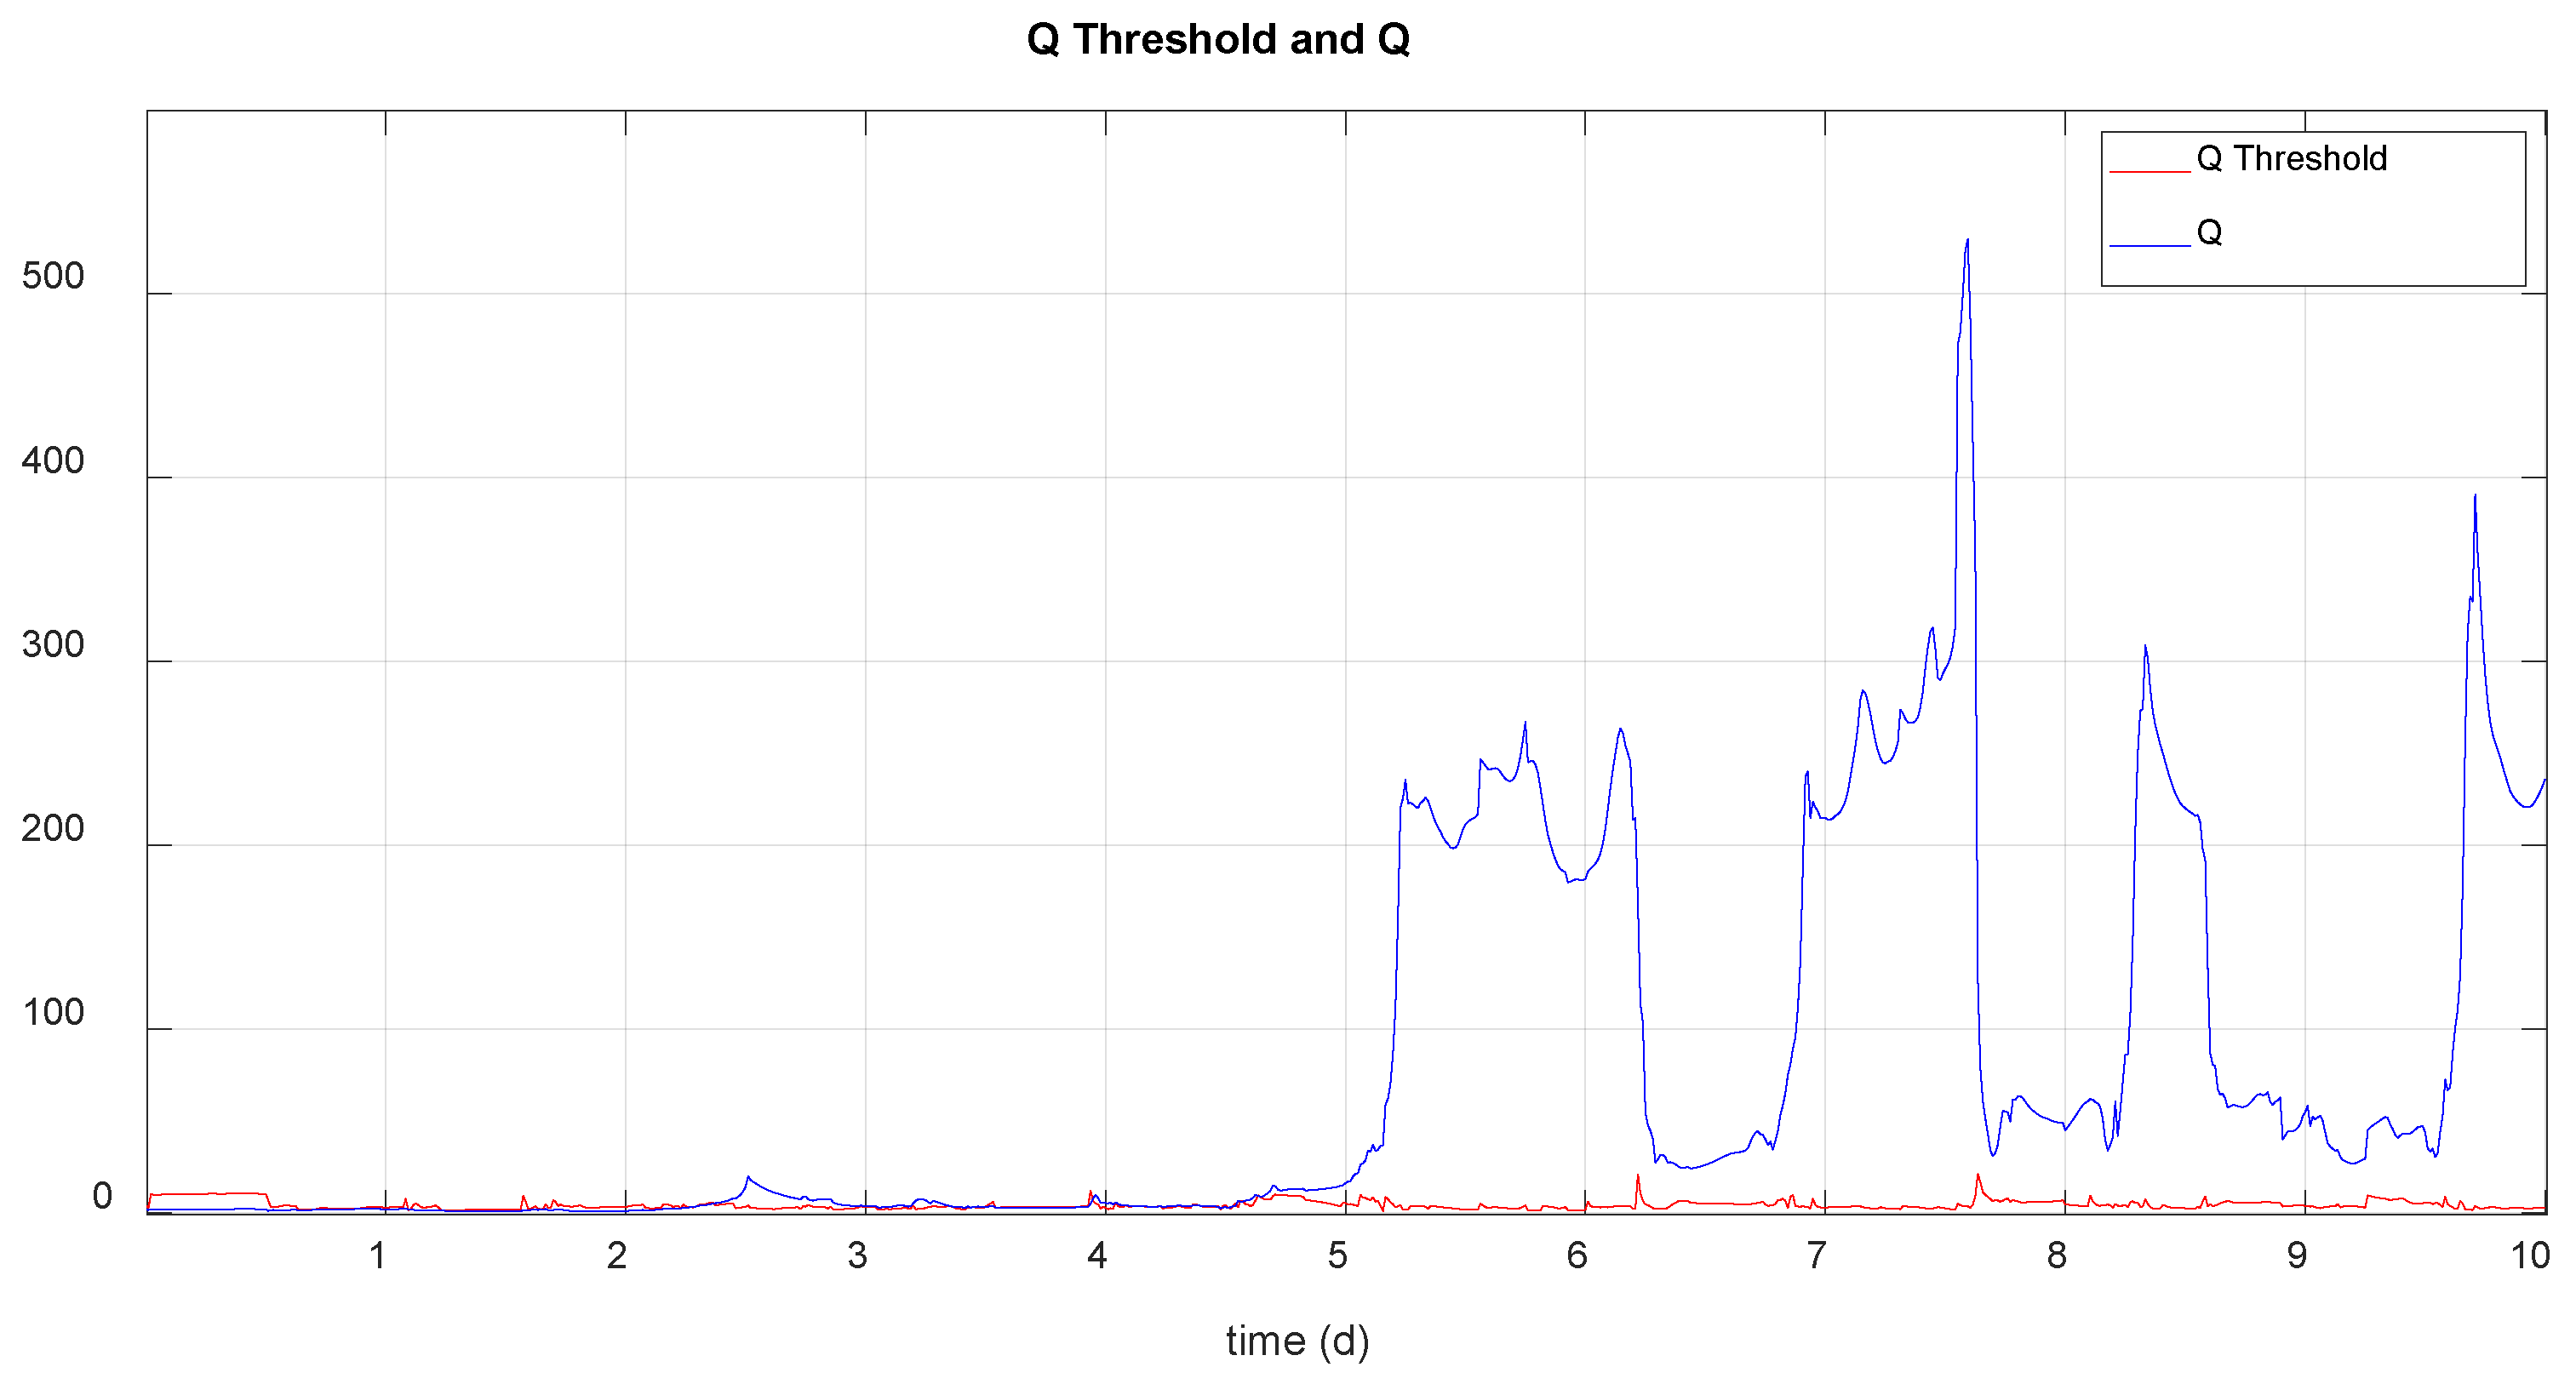
- Fault in the tank 1 level sensor: alarms percentage before a fault detection: 2.44%. Detection instant: 2.26 days.
Next figure shows the Q threshold and the value of the Q statistic calculated online for fault detection. Detection occurs when Q exceeds the threshold 20 times.
Figure 15.
Q statistic and threshold calculated in level fault situation (scenario 3).
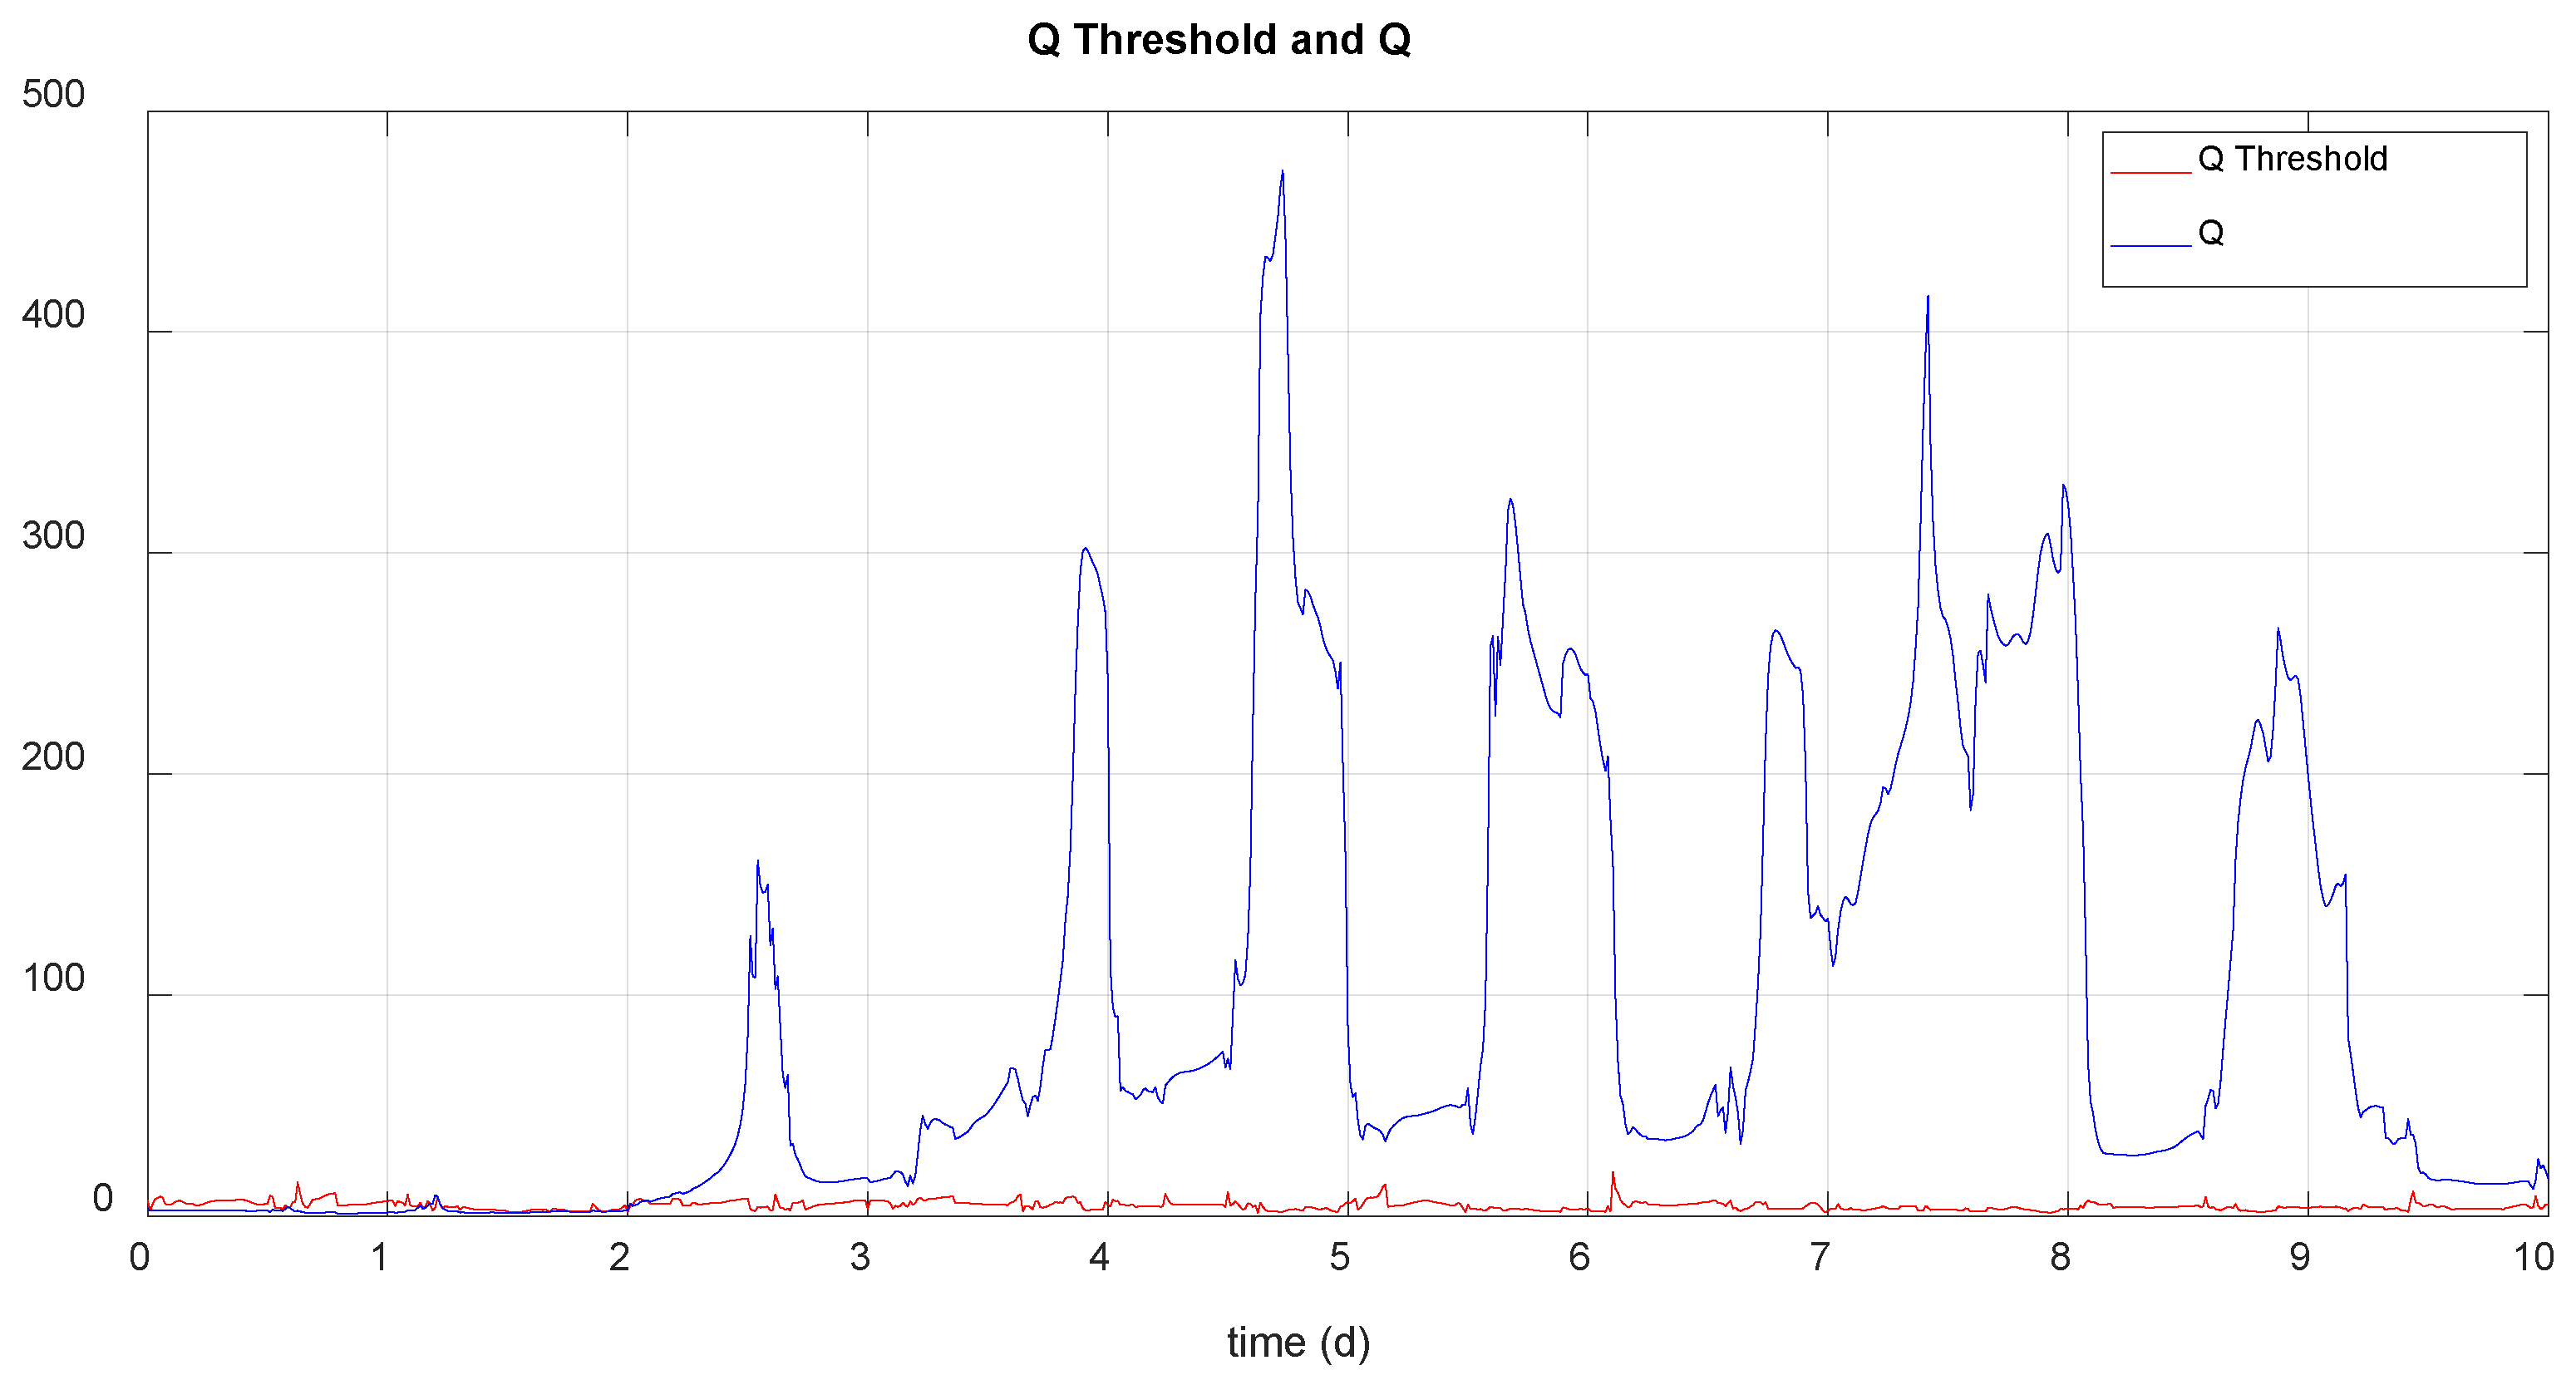
Table 7 provides the comparative data of system performance in every case. These results allow to achieve the same conclusions than scenario 2 results considering the same fault.
Regarding the main indices (Vov, Gu and S), results discussion is like previous cases, having normal MPC controller the best performance. Also, MPC with the fault considered, reduces the system performance, but by comparing with no control case, its performance is better since Gu is 67.28% vs. 61.67%, Vov is 4.77× 10⁴ vs. 8.74×10⁴ (m3). Besides, by comparing MPC with fault with FTCMPC, this one improves slightly the system performance, since the total overflow volume is reduced and the degree of WWTP utilization increases but S is worse because the system needs greater control efforts.
- Fault in the tank 3 gate: alarms percentage before a fault detection: 3.05%. Detection instant: 2.271 days.
Figure 16 shows the Q threshold calculated online and the value of the Q statistic for fault detection and allows to know the detection instant. Detection occurs when Q exceeds the threshold 20 times.
The following table presents the comparative data of system performance in each case. Looking at the main indicators, you can see the same behavior that in previous cases. For instance, by comparison of MPC with fault with FTCMPC, Gu is 67.28% vs. 68.81% and Vov is 4.6066× 10⁴ vs. 4.5926× 10⁴ (m3). Therefore, FTCMPC improves the performance of the system.
Table 8.
System performance in every case: fault in tank 3 gate (scenario 3).
| Data | No Control | Normal MPC | MPC with u3 fault | Reconfigured MPC |
|---|---|---|---|---|
| Nov,1 | 0 | 5 | 5 | 5 |
| Nov,2 | 0 | 1 | 4 | 4 |
| Nov,3 | 2 | 5 | 7 | 7 |
| Nov,4 | 5 | 5 | 5 | 5 |
| Nov,5 | 1 | 4 | 4 | 4 |
| Nov,WWTP | 7 | 6 | 6 | 6 |
| Tov,1 | 0 | 0.0604 | 0.0604 | 0.0542 |
| Tov,2 | 0 | 0.0250 | 0.0500 | 0.0542 |
| Tov,3 | 0.0396 | 0.0729 | 0.6708 | 0.6667 |
| Tov,4 | 0.1271 | 0.1333 | 0.1167 | 0.1187 |
| Tov,5 | 0.0187 | 0.0813 | 0.0750 | 0.0750 |
| Tov,WWTP | 0.4562 | 0.7708 | 0.7354 | 0.7354 |
| Vov,1 | 0 | 6.9554× 10³ | 6.4800× 10³ | 5.6858× 10³ |
| Vov,2 | 0 | 385.1159 | 1.0779× 10³ | 1.4689× 10³ |
| Vov,3 | 1.1834× 10³ | 2.5109× 10³ | 1.3599× 10⁴ | 1.3222× 10⁴ |
| Vov,4 | 1.1874× 10⁴ | 1.8044× 10⁴ | 1.3507× 10⁴ | 1.3430× 10⁴ |
| Vov,5 | 3.2433× 10³ | 1.9535× 10⁴ | 1.7682× 10⁴ | 1.7603× 10⁴ |
| Vov,WWTP | 7.1094× 10⁴ | 219.6231 | 200.5045 | 201.2536× 10³ |
| Vov | 8.7395× 10⁴ | 4.0695× 10⁴ | 4.6066× 10⁴ | 4.5926× 10⁴ |
| QWWTP | 3.7001× 10⁴ | 4.1641× 10⁴ | 4.0910× 10⁴ | 4.0938× 10⁴ |
| Gu | 61.6680 | 69.4022 | 67.2835 | 68.8092 |
| S | - | 6.3711×10¹⁰ | 6.3251×10¹⁰ | 6.3165×10¹⁰ |
5. Conclusions
In this paper, a methodology for fault detection and diagnosis in certain types of sensors and actuators of a wastewater sewer network has been presented and analyzed, based on the PCA technique. Due to the peculiar characteristics of the system, subject to strong disturbances of great variability, only large faults have been detected and classified, since low intensity faults do not greatly affect the performance of the system and, therefore, their detection is more difficult. Even so, the detection algorithm used has managed to detect faults in different elements and in different scenarios, with some speed and reliability. Regarding the diagnosis of the detected faults, its classification is very difficult, not only because of the disturbances in the system, but also because the set point of the flow regulators is constantly being recalculated, therefore the results obtained can be improved and it is intended to continue in this sense with the work started. For cases in which both detection and diagnosis have been successful, the MPC reconfiguration strategies show the improvement in system performance compared to that obtained when a malfunction situation occurs, and the controller is not acted upon. Finally, in all the cases presented, FTCMPC improves the sewer system performance against the cases where a simple MPC is used.
Author Contributions
M.J. and P.V. conceived and designed the general approach; A.C. and M.J. performed the simulations; M.J., P.V. and M.F. contributed to the simulation interpretations; writing—review and editing, A.C., M.J., P.V. and M.F.; supervision, M.J., P.V. and M.F.; A.C. wrote the paper. All authors have read and agreed to the published version of the manuscript.
Funding
This research was funded by Spanish Government through the MICCIN/AEI/10.13039/ 501100011033 projects PID2019-105434RB-C31, TED2021-129201B-I00 and PID2019-105434RB-C32.
Conflicts of Interest
The authors declare no conflict of interest.
References
- Kroll, S.; Weemaes, M.; Van Impe, J.; Willems, P. A Methodology for the Design of RTC Strategies for Combined Sewer Networks. Water 2018, 10, 1675. [Google Scholar] [CrossRef]
- Marinaki, M.; Papageorgiou, M. Optimal Real-time Control of Sewer Networks; Springer-Verlag: Secaucus, NJ, USA, 2005. [Google Scholar]
- Barbu, M.; Vilanova, R. Fuzzy Control Applied on a Benchmark Simulation Model for Sewer Networks. In Proceedings of the 20th International Conference on System Theory, Control and Computing (ICSTCC), Sinaia, Romania, 13–15 October 2016. [Google Scholar]
- García, L.; Barreiro-Gómez, J.; Escobar, E.; Téllez, D.; Quijano, N.; Ocampo-Martínez, C. Modeling and Real-Time Control of Urban Drainage Systems: A review. Adv. Water Resour. 2015, 85, 120–132. [Google Scholar] [CrossRef]
- Rawlings, J.; Mayne, D. Model Predictive Control: Theory and Design; Nob Hill Publishing: Madison, WI, USA, 2017. [Google Scholar]
- Sun, C.; Bernat, J.D.; Cembrano, G.; Puig, V.; Meseguer, J. Advanced Integrated Real-Time Control of Combined Urban Drainage Systems using MPC. In Proceedings of the 13th International Conference on Hydroinformatics, Palermo, Italy, 1–6 July 2018. [Google Scholar]
- Ocampo-Martinez, C.; Puig, V.; Cembrano, G.; Quevedo, J. Application of predictive control strategies to the management of complex networks in the urban water cycle. IEEE Control Syst. Mag. 2013, 33, 15–41. [Google Scholar] [CrossRef]
- Meneses, E.J.; Gaussens, M.; Jakobsen, C.; Mikkelsen, P.S.; Grum, M.; Vezzaro, L. Coordinating Rule-Based and System-Wide Model Predictive Control Strategies to Reduce Storage Expansion of Combined Urban Drainage Systems: The Case Study of Lundtofte, Denmark. Water 2018, 10, 76. [Google Scholar] [CrossRef]
- Blanke, M.; Kinnaert, M.; Lunze, J.; Staroswiecki, M. Diagnosis and Fault-Tolerant Control, 2nd ed.; Springer: Berlin, 2006. [Google Scholar]
- Zhang, Y.; Jiang, J. Bibliographical review on reconfigurable fault-tolerant control systems. Annual Reviews in Control 2008, 32, 229–252. [Google Scholar] [CrossRef]
- Abbaspour, A.; Mokhtari, S.; Sargolzaei, A.; Yen, K.K. A Survey on Active Fault-Tolerant Control Systems. Electronics 2020, 9, 1513. [Google Scholar] [CrossRef]
- Ge, Z. Review on data-driven modeling and monitoring for plant-wide industrial processes. Chemometr. Intell. Lab. Syst. 2017, 171, 16–25. [Google Scholar] [CrossRef]
- Jiang, Q.; Yan, X.; Huang, B. Review and perspectives of data-driven distributed monitoring for industrial plant-wide processes. Ind. Eng. Chem. Res. 2019, 58, 12899–12912. [Google Scholar] [CrossRef]
- Jiang, B.; Xiang, J.; Wang, Y. Rolling bearing fault diagnosis approach using probabilistic principal component analysis denoising and cyclic bispectrum. J. Vib. Control 2016, 22, 2420–2433. [Google Scholar] [CrossRef]
- Chen, H.; Jiang, B.; Lu, N.; Mao, Z. Deep PCA Based Real-time Incipient Fault Detection and Diagnosis Methodology for Electrical Drive in High-Speed Trains. IEEE Trans. Veh. Technol. 2018, 67, 4819–4830. [Google Scholar] [CrossRef]
- Wang, T.; Xu, H.; Han, J.; Elbouchikhi, E.; Benbouzid, M.E.H. Cascaded H-bridge multilevel inverter system fault diagnosis using a PCA and multiclass relevance vector machine approach. IEEE Trans. Power Electron. 2015, 30, 7006–7018. [Google Scholar] [CrossRef]
- Sánchez-Fernández, A.; Fuente, M.J.; Sainz-Palmero, G.I. Fault detection in wastewater treatment plants using distributed PCA methods. in: 2015 IEEE 20th Conference on Emerging Technologies Factory Automation (ETFA), 2015, pp. 1–7. [CrossRef]
- Cid-Galiot, J.J.; Aguilar-Lasserre, A.A.; Rodriguez-Jarquín, J.P.; Villanueva-Vasquez, D.; Posada-Gómez, R.; Juárez-Martínez, U. Fault-Tolerance Techniques and Global Positioning Systems Based on Artificial Intelligence for the Analysis of Corrosion Impact on the Pipelines of Oil and Gas Industry. ASME. J. Pressure Vessel Technol. 2021, 143, 020801. [Google Scholar] [CrossRef]
- Li, Z.; Tian, L.; Jiang, Q.; Yan, X. Dynamic nonlinear process monitoring based on dynamic correlation variable selection and kernel principal component regression. Journal of the Franklin Institute 2022, 359, 4513–4539. [Google Scholar] [CrossRef]
- Cheng, H.; Wu, J.; Liu, Y.; Huang, D. A novel fault identification and root-causality analysis of incipient faults with applications to wastewater treatment processes. Chemometrics and Intelligent Laboratory Systems 2019, 188, 24–36. [Google Scholar] [CrossRef]
- Bellamoli, F.; Di Iorio, M.; Vian, M.; Melgani, F. Machine learning methods for anomaly classification in wastewater treatment plants. Journal of Environmental Management 2023, 344, 118594. [Google Scholar] [CrossRef] [PubMed]
- Khurshid, A.; Pani, A.K. Machine learning approaches for data-driven process monitoring of biological wastewater treatment plant: A review of research works on benchmark simulation model no. 1(bsm1). Environmental Monitoring and Assessment 2023, 195, 96. [Google Scholar] [CrossRef] [PubMed]
- Sánchez-Fernández, A.; Baldan, F.J.; Sainz-Palmero, G.I.; Benitez, J.M.; Fuente, M.J. Fault detection based on time series modeling and multivariate statistical process control. Chemometrics and Intelligent Laboratory Systems 2018, 182, 57–69. [Google Scholar] [CrossRef]
- Newhart, K.B.; Holloway, R.W.; Hering, A.S.; Cath, T.Y. Data-driven performance analyses of wastewater treatment plants: A review. Water Research 2019, 157, 498–513. [Google Scholar] [CrossRef]
- Alvi, M.; Batstone, D.; Mbamba, C.K.; Keymer, P.; French, T.; Ward, A.; Dwyer, J.; Cardell-Oliver, R. Deep learning in wastewater treatment: a critical review. Water Research 2023, 245, 120518. [Google Scholar] [CrossRef] [PubMed]
- Ismail, W.; Niknejad, N.; Bahari, M.; Hendradi, R.; Zaizi NJ, M.; Zulkifli, M.Z. Water treatment and artificial intelligence techniques: a systematic literature review research. Environmental Science and Pollution Research 2023, 30, 71794–71812. [Google Scholar] [CrossRef]
- Cicceri, G.; Maisano, R.; Morey, N.; Distefano, S. SWIMS: the Smart Wastewater Intelligent Management System, In Proceedings of the IEEE International Conference on Smart Computing (SMARTCOMP), Irvine, CA, USA, 2021; pp. 228–233. [CrossRef]
- Liu, Y.; et al. Transforming data into actionable knowledge for fault detection, diagnosis and prognosis in urban wastewater systems with AI techniques: A mini-review. Process Safety and Environmental Protection 2023, 172, 501–512. [Google Scholar] [CrossRef]
- Qiu, C.; et al. Unsupervised Real Time and Early Anomalies Detection Method for Sewer Networks Systems. IEEE Access 2024, 12, 21698–21709. [Google Scholar] [CrossRef]
- Zhou, Q.; et al. Convolutional neural networks–based model for automated sewer defects detection and classification. Journal of Water Resources Planning and Management 2021, 147, 04021036. [Google Scholar] [CrossRef]
- Camacho, E.; Alamo, T.; De la Peña, D.M. Fault-tolerant model predictive control. IEEE 15th Conference on Emerging Technologies Factory Automation (ETFA 2010), pp. 1–8, 2010. [CrossRef]
- Diget, E.L.; Hasan, A.; Manoonpong, P. Fault-Tolerant Model Predictive Control for Multirotor UAVs. In 2022 American Control Conference, ACC 2022 (pp. 4305-4310). IEEE. [CrossRef]
- Svensen, J.L.; Niemann, H.H.; Poulsen, N.K. Model Predictive Control of Overflow in Sewer Networks: A comparison of two methods. In 2019 4th Conference of Control and Fault Tolerant Systems (SysTol), Sep. 2019, pp. 412–417. [CrossRef]
- Ocampo-Martinez, C.; Puig, V.; Quevedo, J.; Ingimundarson, A. Fault tolerant model predictive control applied on the Barcelona sewer network. Proceedings of IEEE Conference on Decision and Control (CDC) and European Control Conference (ECC), Seville, Spain; 2005. [Google Scholar]
- Meseguer, J.; et al. Fault-tolerant model predictive control applied to integrated urban drainage and sanitation systems for environmental protection. A: International Conference on Hydroinformatics. In Proceedings of the HIC 2018: 13th International Conference on Hydroinformatics, proceedings book. 2018, p. 1388-1396. Palermo, Italia, 1–6 July 2018; pp. 1388–1396. [Google Scholar]
- Saagi, R.; Flores-Alsina, X.; Fu, G.; Butler, D.; Gernaey, K.V.; Jeppsson, U. Catchment & Sewer Network Simulation Model to Benchmark Control Strategies within Urban Wastewater Systems; Elsevier: Amsterdam, The Netherlands, 2016. [Google Scholar]
- Liu, J.; Wang, J.; Liu, X.; et al. MWRSPCA: online fault monitoring based on moving window recursive sparse principal component analysis. J Intell Manuf 2022, 33, 1255–1271. [Google Scholar] [CrossRef]
- Jiang, Q.; Gao, F.; Hui, Y.; Yan, X. Multivariate statistical monitoring of key operation units of batch processes based on time-slice CCA. IEEE Transactions on Control Systems Technology 2019, 27, 1368–1375. [Google Scholar] [CrossRef]
- Cembellín, A.; Francisco, M.; Vega, P. Distributed Model Predictive Control Applied to a Sewer System. Processes 2020, 8, 1595. [Google Scholar] [CrossRef]
Figure 1.
Catchment and sewer system.
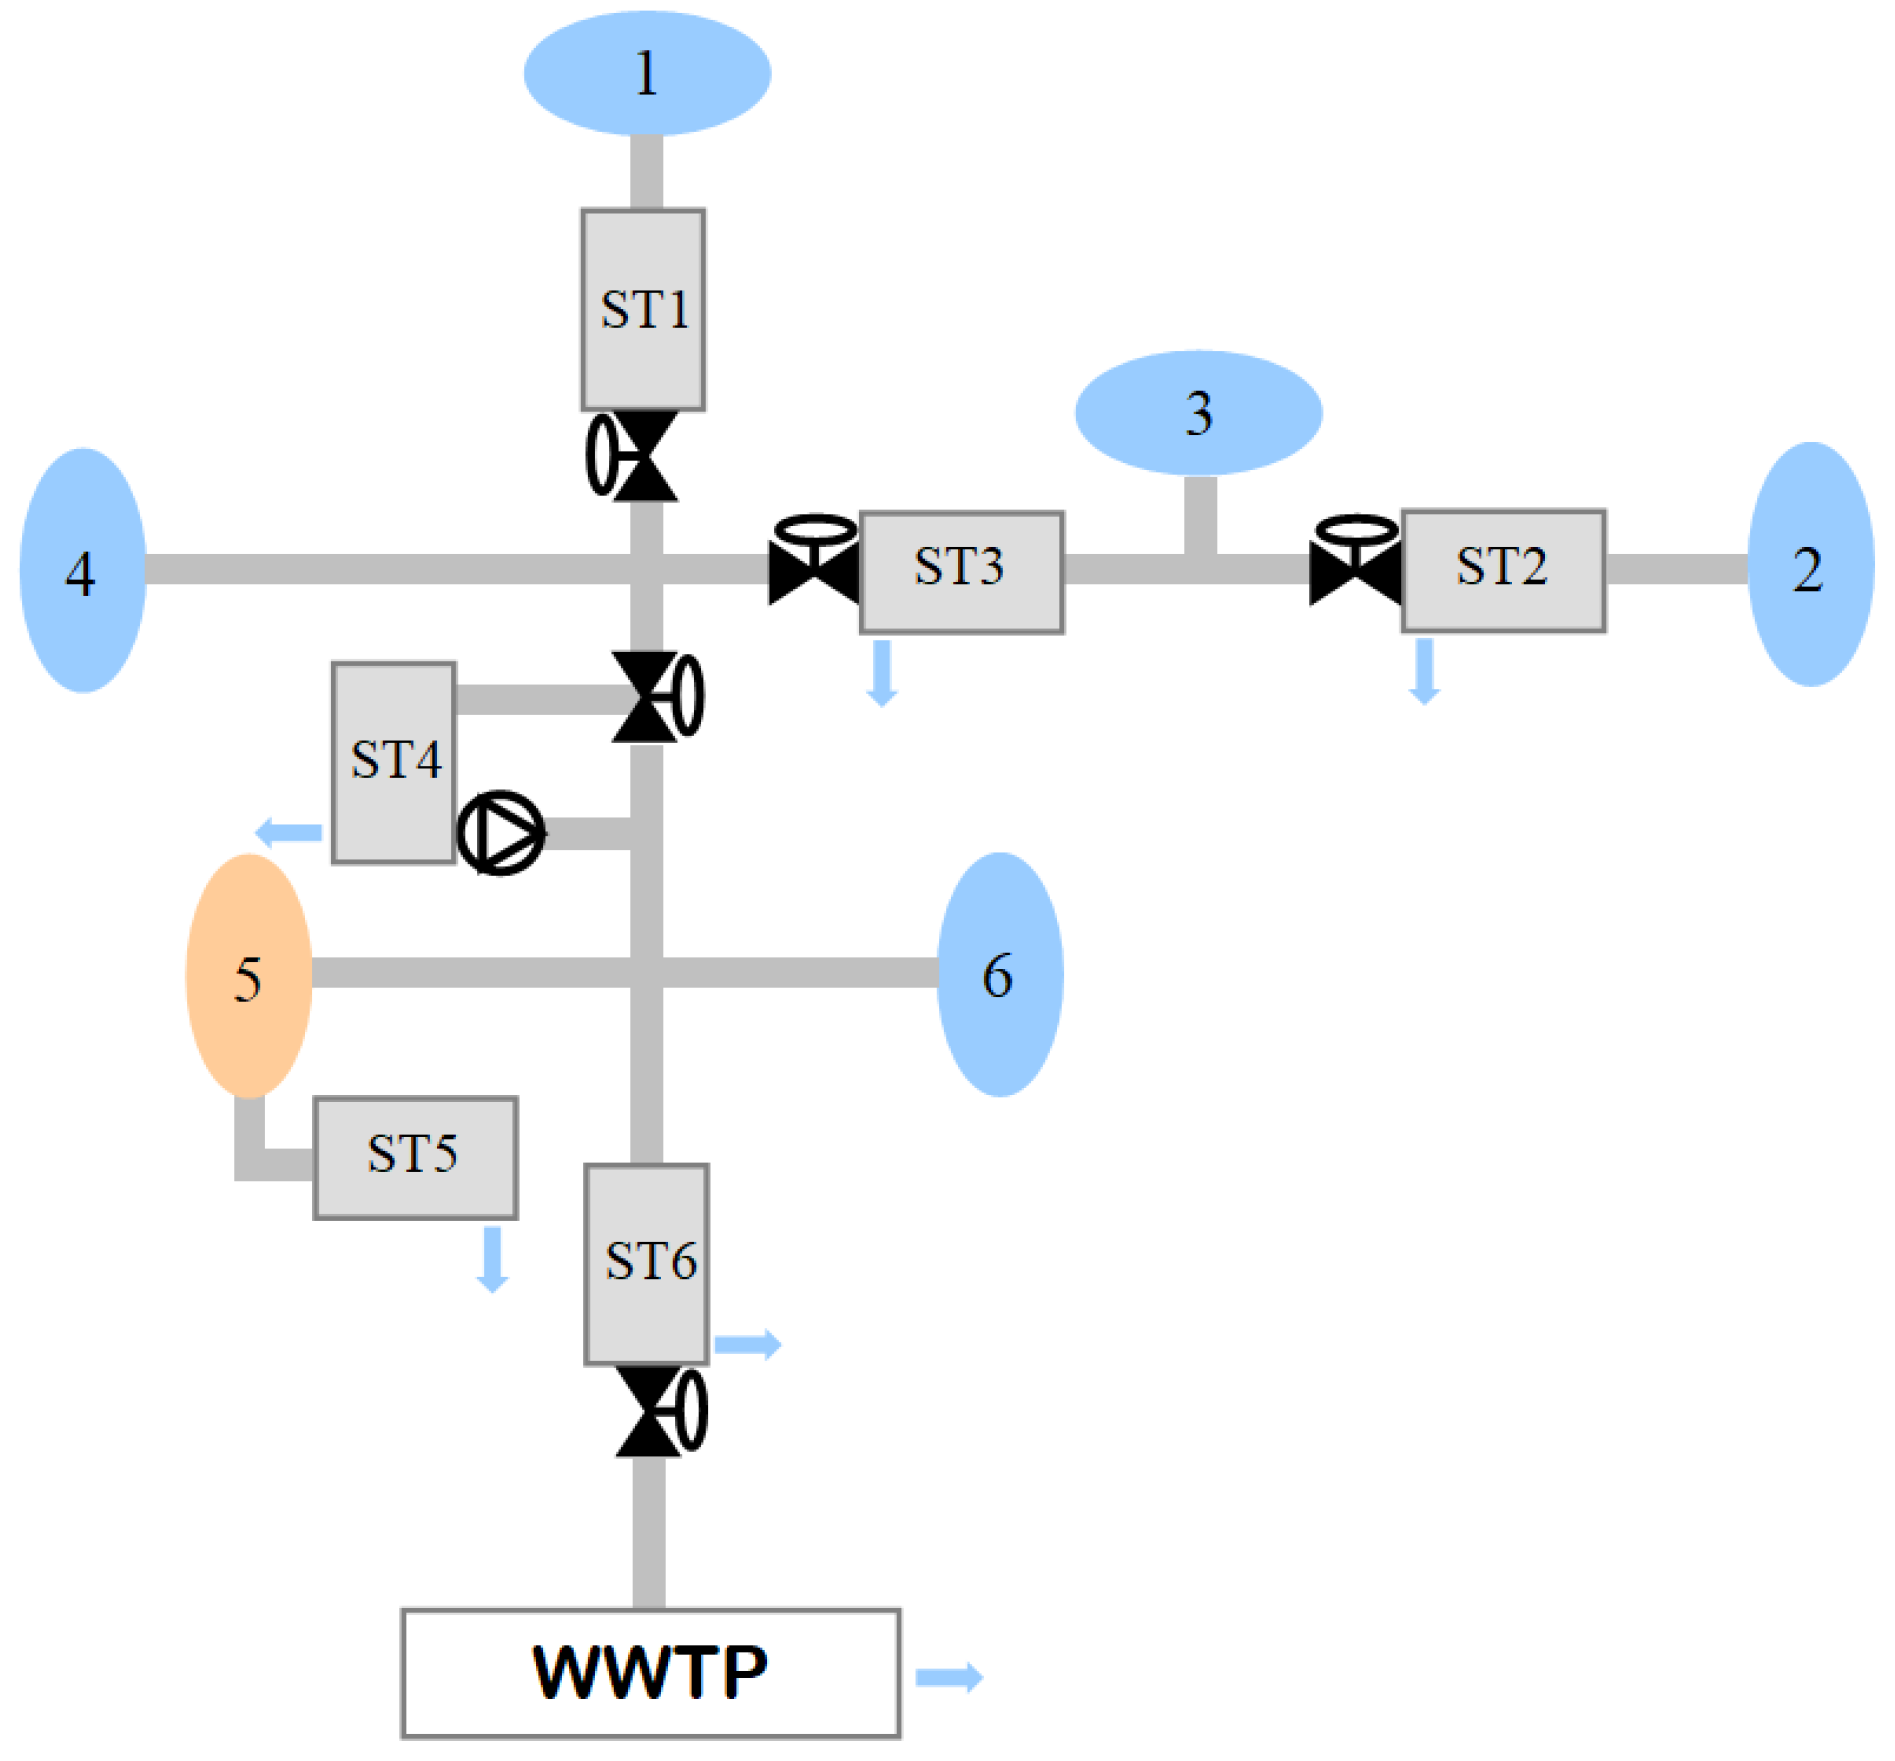
Figure 2.
Hierarchical Fault-Tolerant Control system.
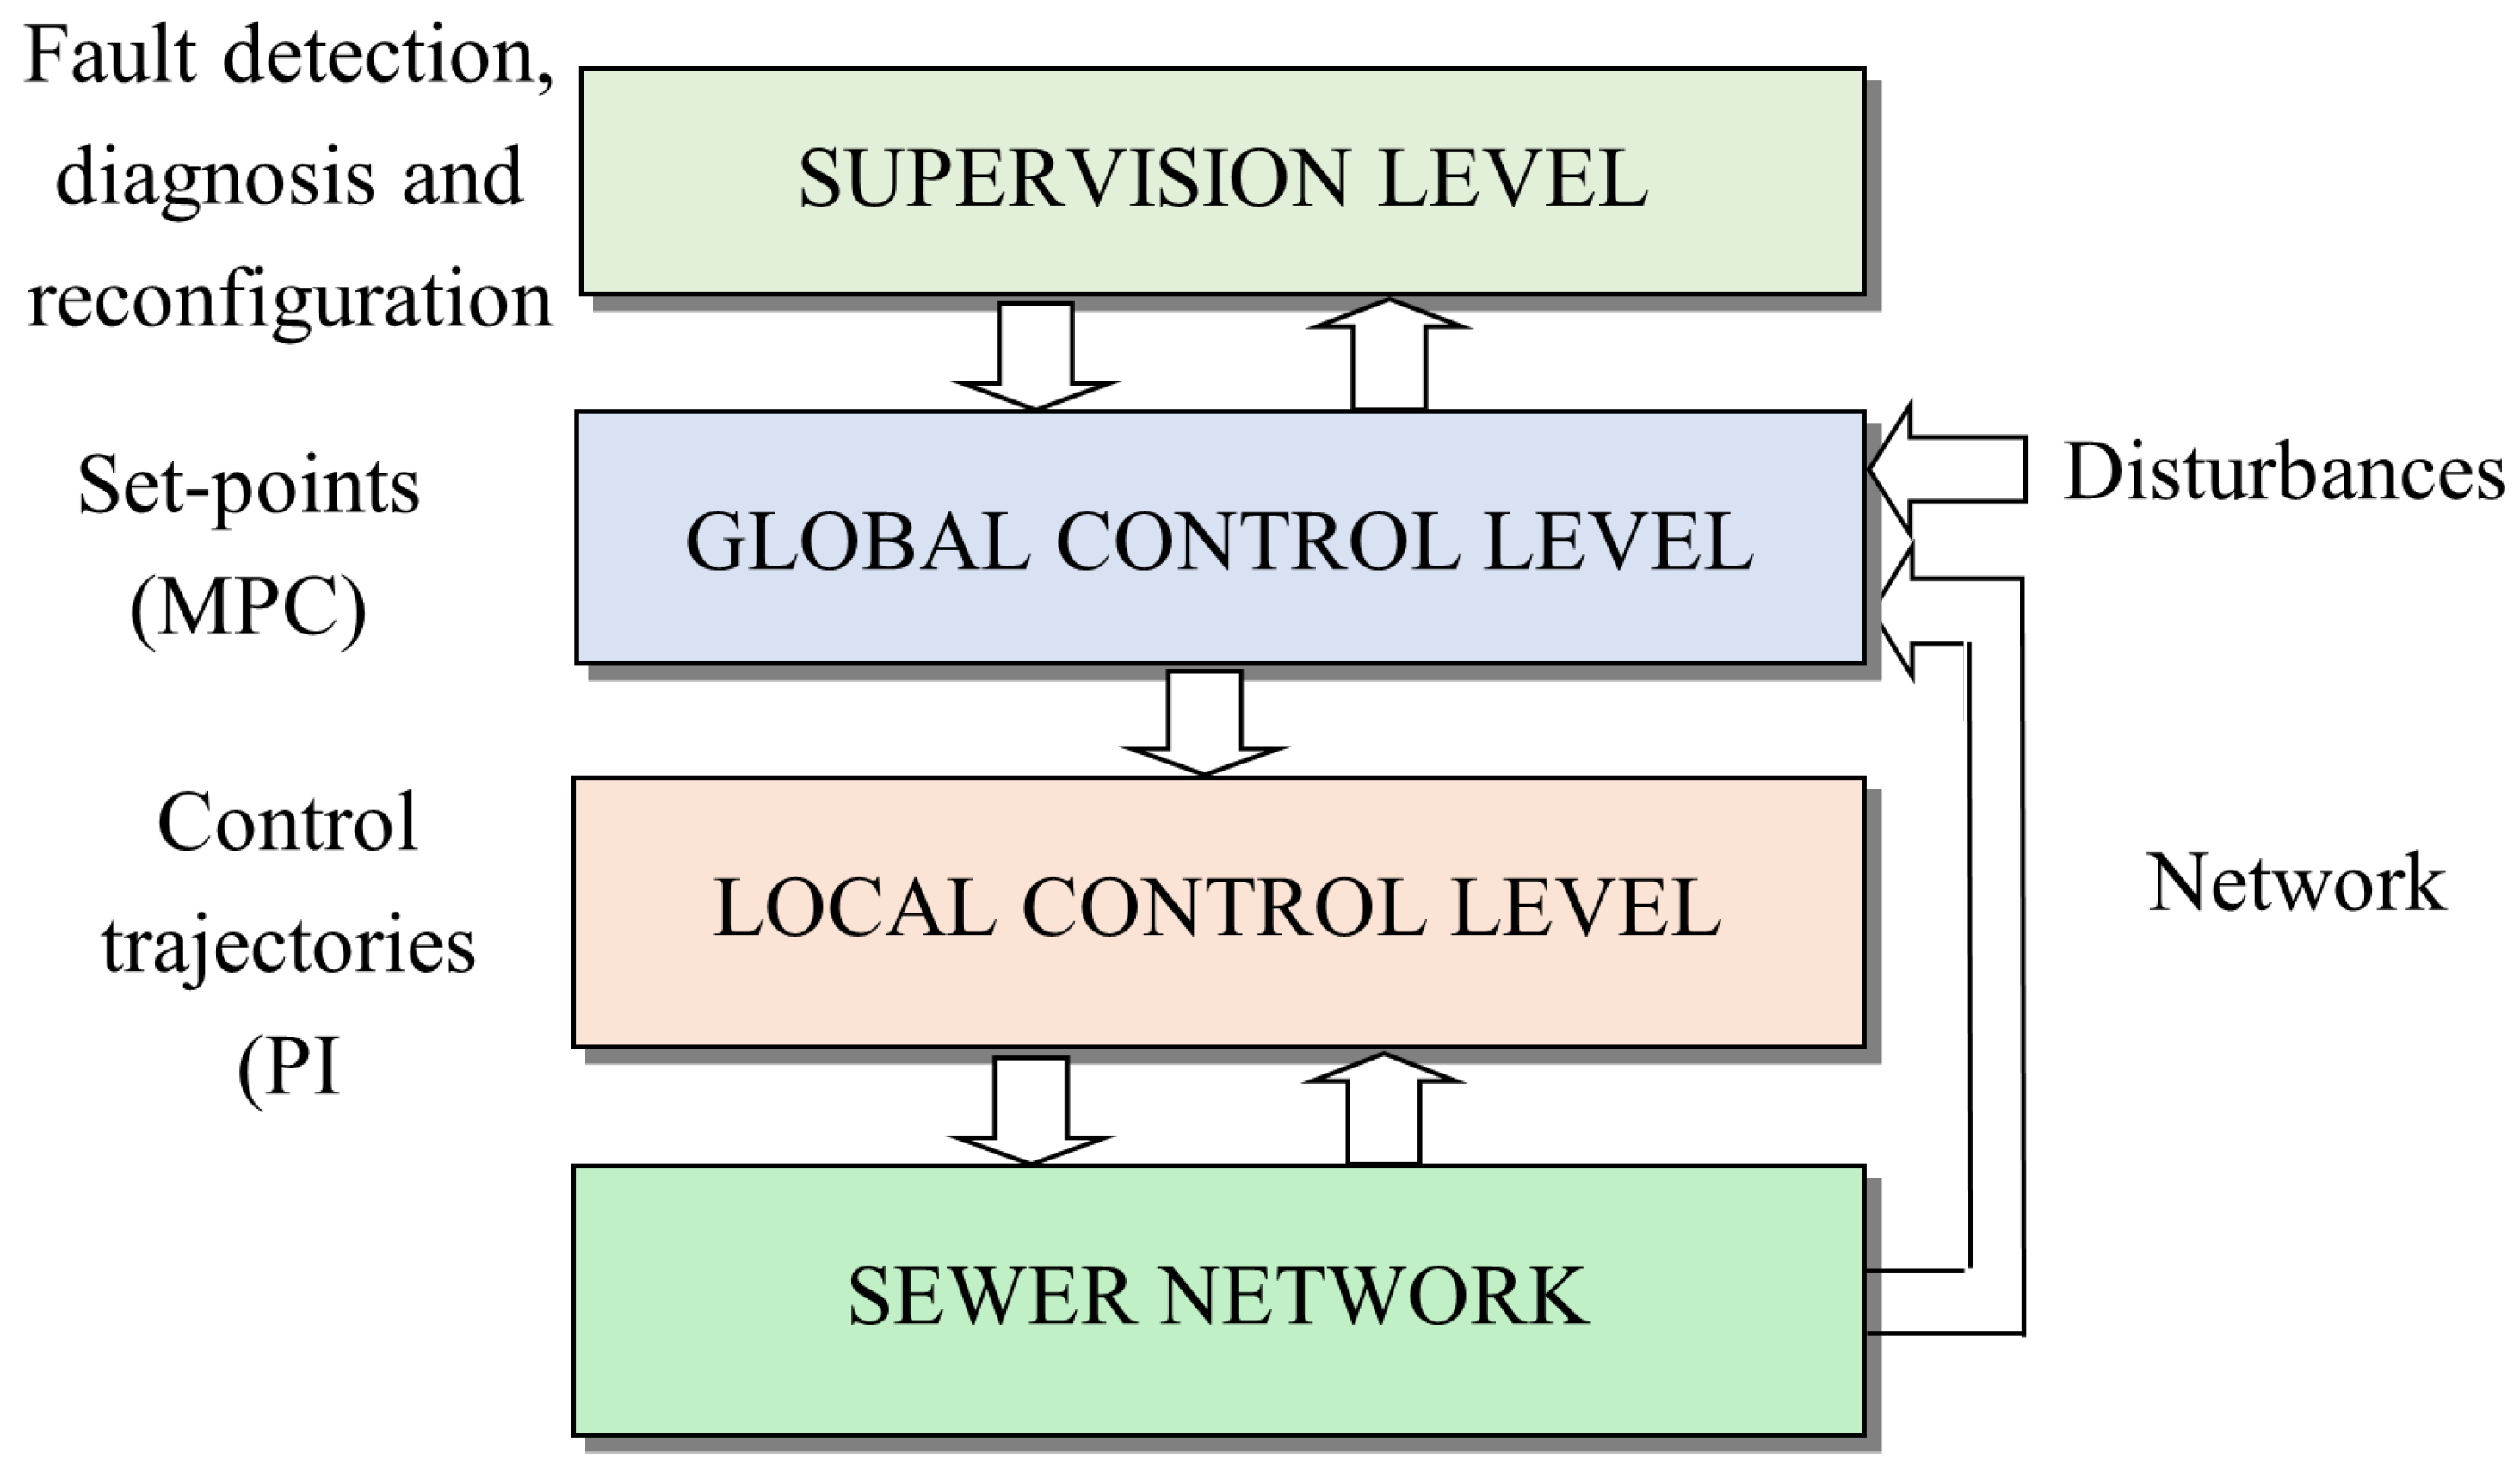
Figure 3.
Neural network structure.
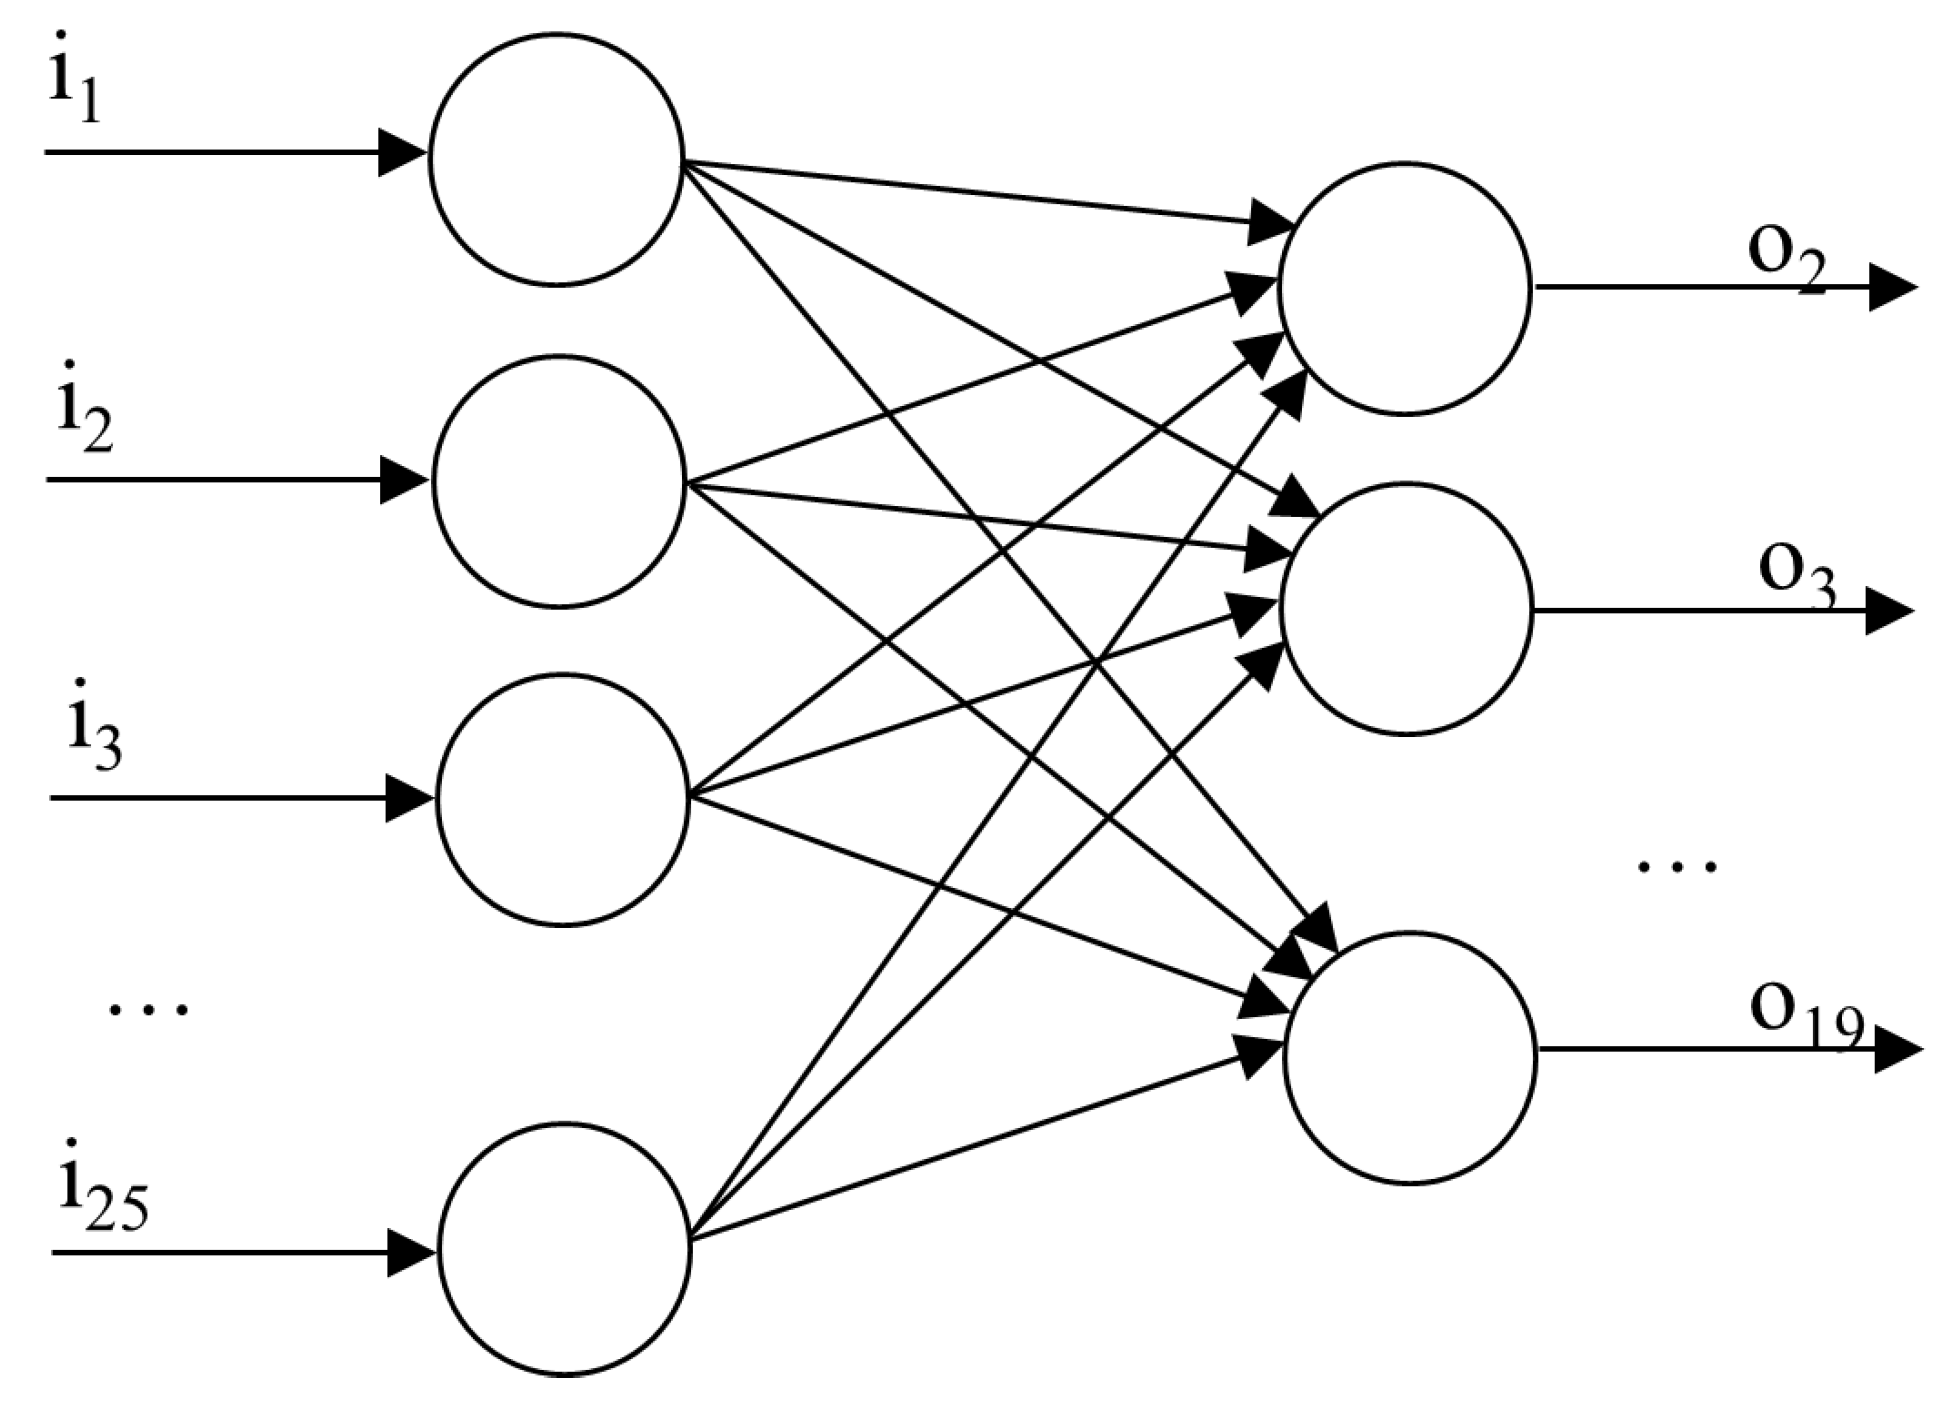
Figure 14.
Q statistic and threshold calculated in gate fault situation (scenario 2).
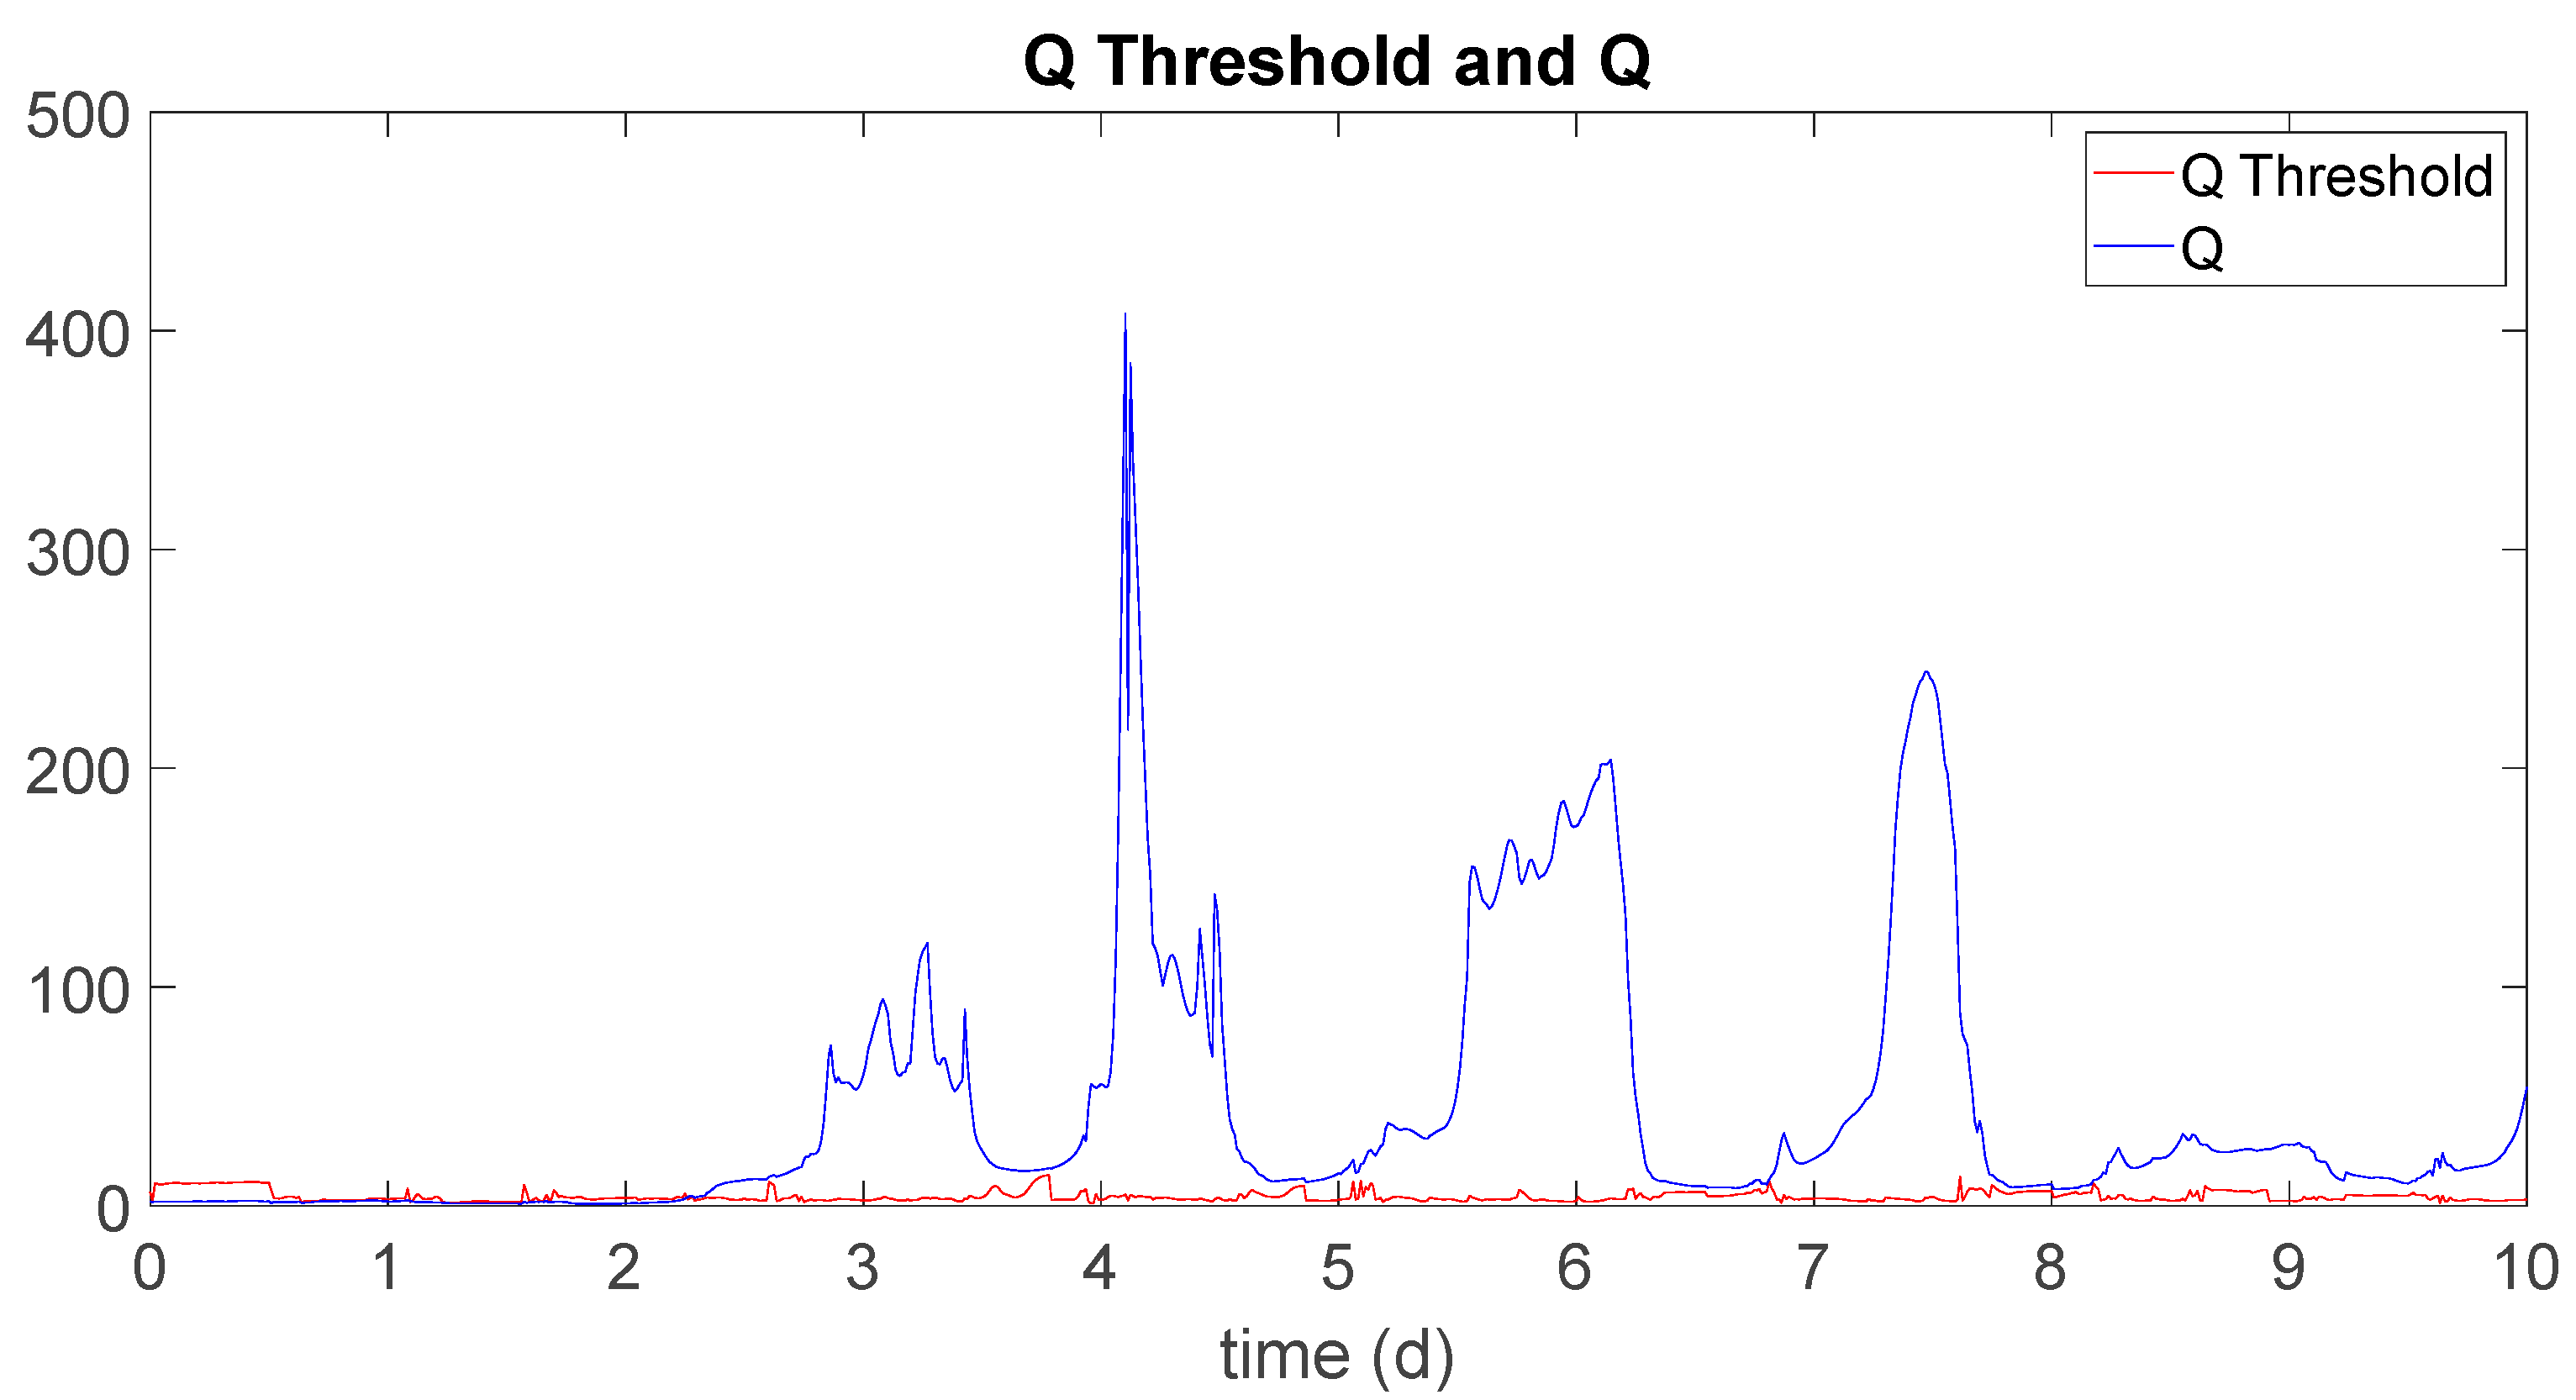
Figure 16.
Q statistic and threshold calculated in gate fault situation (scenario 3).
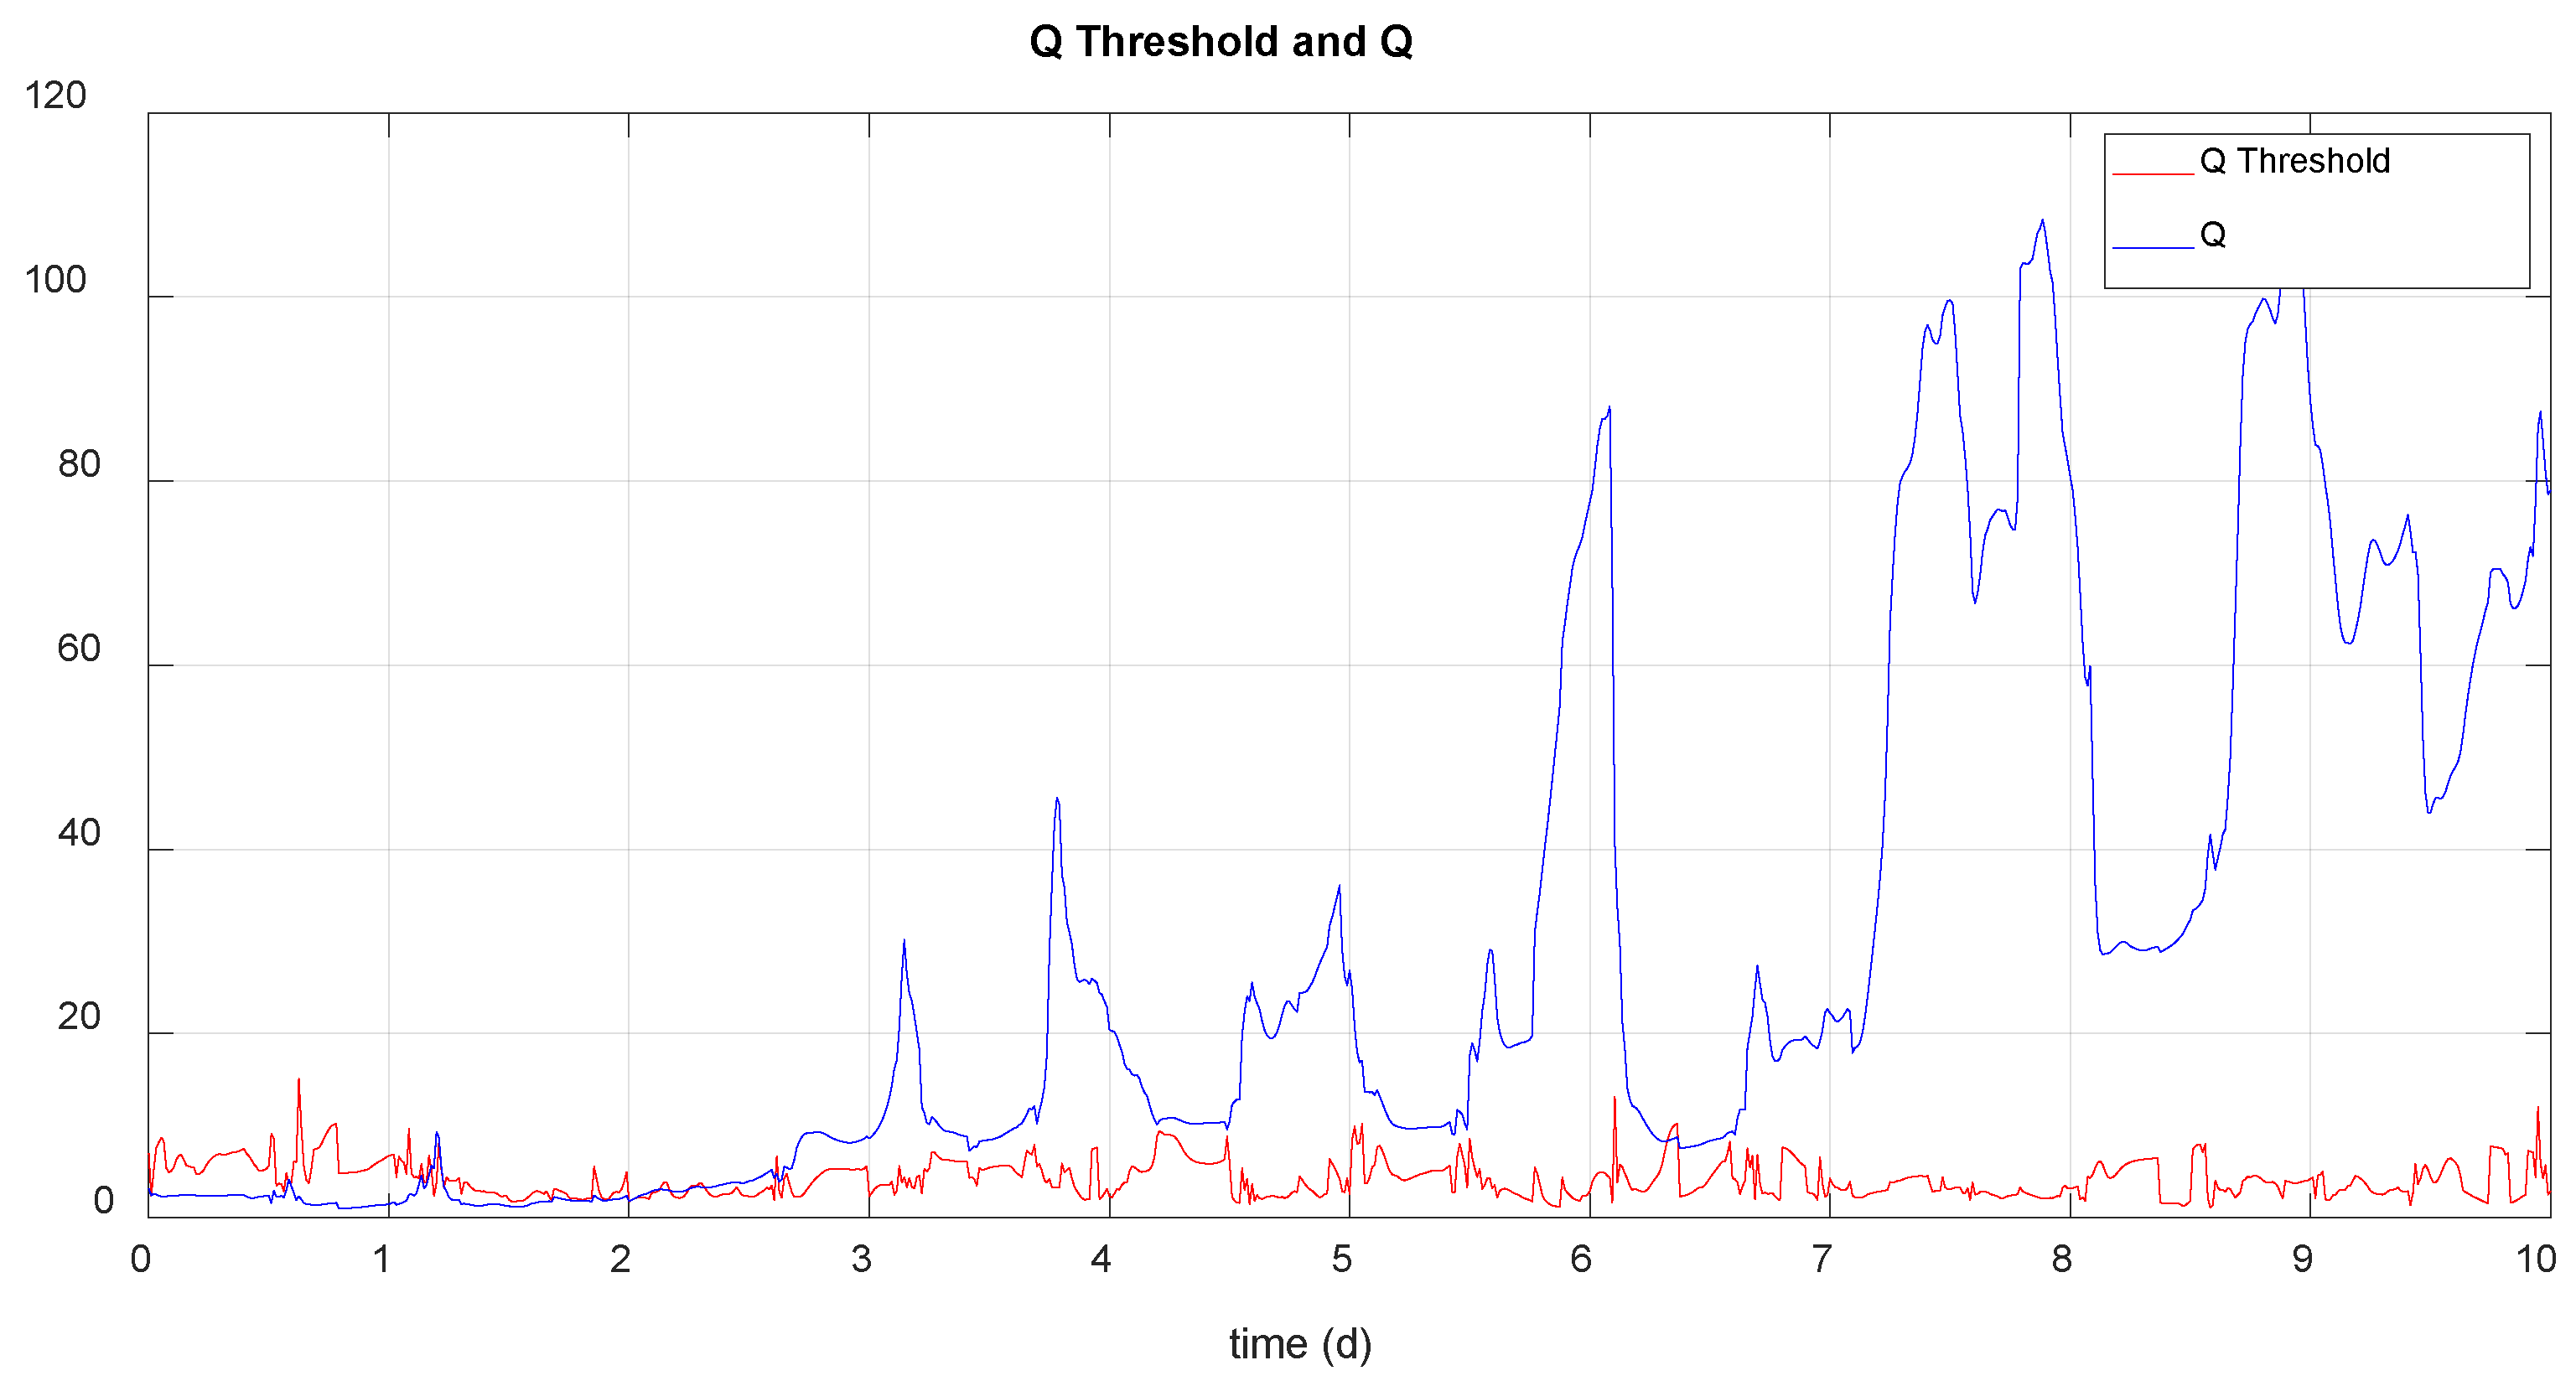
Table 1.
MPC cost function weights.
| Q(k) | R | |
Table 2.
System parameters.
| Parameter | Units | Values |
|---|---|---|
| A1,…, A5 tank areas | m2 | 1188, 252, 348, 852, 2988 |
| c01,…,c05 discharge coefficients | m5/2/d | 1.89, 0.40, 0.55, 1.36, 6.12 (×104) |
| hmax1,…,hmax5 tank heights | m | 5 (for all) |
| hmin1,…,hmin5 minimum levels | m | 0 (for all) |
| qmax1,…, qmax9 maximum flow rates at the pipes outlet | m3/d | 5.99, 1.27, 3.02, 4.29, 4.29, 15.06, 4.29, 23.64, 6 (×104) |
| T sampling time | d | 0.0021 |
| τ1,…,τ9 link elements time constants | d | 0.0313, 0.0104, 0.0104, 0.0208, 0.0208, 0.073, 0.0208, 0.0104, 0.0104 |
| umax1,…, umax5 maximum flow rates at the reservoirs outlet | m3/d | 5.98, 1.27, 1.75, 4.29, 19.34 (×104) |
Table 7.
System performance in every case: fault in tank 1 level sensor (scenario 3).
| Data | No Control | Normal MPC | MPC with h1 fault | Reconfigured MPC |
|---|---|---|---|---|
| Nov,1 | 0 | 5 | 2 | 2 |
| Nov,2 | 0 | 1 | 1 | 1 |
| Nov,3 | 2 | 5 | 4 | 5 |
| Nov,4 | 5 | 5 | 5 | 5 |
| Nov,5 | 1 | 4 | 4 | 4 |
| Nov,WWTP | 7 | 6 | 6 | 6 |
| Tov,1 | 0 | 0.0604 | 1.4750 | 0.8292 |
| Tov,2 | 0 | 0.0250 | 0.0125 | 0.0125 |
| Tov,3 | 0.0396 | 0.0729 | 0.0583 | 0.0583 |
| Tov,4 | 0.1271 | 0.1333 | 0.1292 | 0.1250 |
| Tov,5 | 0.0187 | 0.0813 | 0.0688 | 0.0688 |
| Tov,WWTP | 0.4562 | 0.7708 | 0.7250 | 0.7333 |
| Vov,1 | 0 | 6.9554× 10³ | 5.6633× 10⁴ | 4.0860× 10⁴ |
| Vov,2 | 0 | 385.1159 | 150.8754 | 214.8527 |
| Vov,3 | 1.1834× 10³ | 2.5109× 10³ | 2.0415× 10³ | 2.2327× 10³ |
| Vov,4 | 1.1874× 10⁴ | 1.8044× 10⁴ | 2.7861× 10⁴ | 2.4317× 10⁴ |
| Vov,5 | 3.2433× 10³ | 1.9535× 10⁴ | 1.7412× 10⁴ | 1.7102× 10⁴ |
| Vov,WWTP | 7.1094× 10⁴ | 219.6231 | 222.5543 | 213.9156× 10³ |
| Vov | 8.7395× 10⁴ | 4.0695× 10⁴ | 4.7688× 10⁴ | 4.4080× 10⁴ |
| QWWTP | 3.7001× 10⁴ | 4.1641× 10⁴ | 4.0370× 10⁴ | 4.1286× 10⁴ |
| Gu | 61.6680 | 69.4022 | 67.2835 | 68.8092 |
| S | - | 6.3711×10¹⁰ | 6.4402×10¹⁰ | 1.0547×10¹¹ |
Disclaimer/Publisher’s Note: The statements, opinions and data contained in all publications are solely those of the individual author(s) and contributor(s) and not of MDPI and/or the editor(s). MDPI and/or the editor(s) disclaim responsibility for any injury to people or property resulting from any ideas, methods, instructions or products referred to in the content. |
© 2024 by the authors. Licensee MDPI, Basel, Switzerland. This article is an open access article distributed under the terms and conditions of the Creative Commons Attribution (CC BY) license (http://creativecommons.org/licenses/by/4.0/).
Copyright: This open access article is published under a Creative Commons CC BY 4.0 license, which permit the free download, distribution, and reuse, provided that the author and preprint are cited in any reuse.


