
Submitted:
11 May 2024
Posted:
13 May 2024
You are already at the latest version
Abstract
In 2023, residential and commercial sectors together consumed approximately 27.6% of total U.S. energy, equivalent to about 20.6 quadrillion Btu. Factoring in the electrical system energy losses, the residential sector represented approximately 19.7% of total U.S. energy consumption during that time. There were approximately 144 million housing units in the United States in 2023, which is increasing yearly. In this study, information on energy usage in the United States (U.S.) residential sector has been analyzed and then represented as energy intensities to establish benchmark data and to compare energy consumption of varying sizes and locations. First, public sources were identified, and data from these previously published sources were aggregated to determine the energy use of the residential sector within the US. Next, as part of this study, the energy data for seven houses/apartments from five different United States climate zones were collected firsthand. That data was analyzed, and the energy intensity of each home was calculated and then compared with the energy intensities of the other homes in the same states using RECS data. The energy intensity for each facility was calculated based on the actual energy bills. Finally, the study evaluated the carbon footprint associated with residential energy consumption in all 50 states to reinforce the importance of sustainable development initiatives.
Keywords:
energy intensity
; residential energy consumption
; climate zones
; heating-degree days (HDD)
; sustainable development
1. Introduction
The U.S. residential sector uses more energy than the commercial or industrial sector. Historical data on energy consumption in the United States by end sector, based on the most recent data in [1], are presented in Figure 1.
As in the other sectors, there has been significant and relatively consistent growth in the energy consumed in the US residential sector in the last 60 years. The residential sector consumed more than 10 quadrillion Btu (3.1 trillion kWh) in 2019 and 11.6 quadrillion Btu (3.36 trillion kWh) in 2021. This is equivalent to more than 11% of U.S. energy consumption. In 2022, the residential sector used 1.56 trillion kWh of electricity, which is approximately 38. 4% of the total electricity use in the United States [2]. In 2022, the US used about 100.41 quadrillion British thermal units of energy. Most of this energy, around 38%, was used by the electric power sector. Transportation followed, using 27% of the total energy, while industries used 23% [3]. In 2023, the residential and commercial sectors consumed about 27.6% of total U.S. energy, totaling approximately 20.6 quadrillion Btu. The energy consumed by these sectors includes both end-use consumption and electrical system energy losses associated with retail electricity sales. When considering these losses, the residential sector alone accounted for around 19.7% of total U.S. energy consumption in 2023 [4]. There were approximately 144 million housing units [5] in the United States in 2023, which is increasing yearly. The energy used in homes (residential sector) represented 7% of the total, and commercial buildings used 5%. This breakdown shows how energy is distributed across different parts of the economy, highlighting areas where efficiency improvements could have a big impact. The percentage share of total power consumption is shown in Figure 2 [6].
The annual energy consumption of the residential sector for five US climate zones with different cooling degrees days (CDD) and heating degrees days (HDD) is shown in Figure 3 [7].
The amount of energy needed to heat indoor places during colder months is measured in heating-degree days (HDD). Both HDD and CDD are determined by deducting a base temperature (often 18.3°C or 65°F) from the average outside temperature for a given day.
As seen in Figure 3, zone 1 represents the cold states, while zone 5 represents the hot states in the country. According to the most recent Residential Energy Consumption Survey (RECS) conducted by EIA in 2020, on average about 77 million British thermal units (MMBtu) were consumed by the total U.S households. The results also indicated that the energy used by a household is correlated with the average zone temperature; homes in colder zones, where heating is used more intensely, consume more energy than houses in warmer zones [9]. Sekar et al., in their study, found that Americans are now spending more time at home than before, which means that more residential energy is consumed than before [10]. Several studies suggested that during winter, places with higher HDD use more natural gas, underscoring the importance of effective insulation and heating systems in cold climates.
The data from EIA provides insights into the energy consumption patterns in the U.S. residential sector from 1960 to 2020. Over these decades, fluctuations were observed in the consumption of various energy sources. Coal, natural gas, petroleum, renewable, and electricity have all played significant roles in meeting residential energy needs. Initially, coal was a dominant energy source, but its usage gradually decreased over the years. Conversely, the consumption of natural gas showed a steady increase, reflecting its growing popularity as a cleaner and more efficient alternative. Petroleum usage fluctuated, influenced by factors such as economic conditions and energy policies. The rise of renewable energy sources, including solar and wind power, is evident in the data, although the data start from a relatively small base. Electricity, as a versatile energy carrier, witnessed consistent growth, reflecting technological advancements and lifestyle changes. The data highlight the dynamic nature of residential energy consumption and the evolving energy landscape in the United States. The energy consumption of the US residential sector by energy source, 1960 to 2020 is shown in Figure 4 [11].
Data on state energy-related carbon dioxide (CO2) emissions by sector in 2021 shed light on the carbon footprint associated with residential energy consumption in different states [12]. A closer analysis reveals significant variations in CO2 emissions between states, reflecting differences in energy sources, consumption patterns, and efficiency measures. States with high residential CO2 emissions, such as California, Illinois, New York, and Pennsylvania, often coincide with densely populated areas and extensive urbanization, where energy demand is inherently high. On the contrary, states with lower emissions, such as Hawaii, Vermont, and the District of Columbia, tend to have smaller populations and may rely more on renewable energy sources or have implemented energy efficiency initiatives. For instance, Hawaii has abundant solar resources. It has made substantial investments in solar energy production, leading to lower reliance on fossil fuels and subsequently lower CO2 emissions from residential energy use. These variations underscore the importance of regional considerations in addressing carbon emissions from residential energy use. State energy-related carbon dioxide emissions by residential use are shown in Figure 5 [13].
The average electricity cost for the residential sector in the U.S. was 16.19 cents per kWh in 2023 [14]. Assuming an average annual income of $68,703 per household [15], and an average electricity consumption of 877 kWh per month [16], the average electricity cost per dollar of income would be approximately 1.97 cents. Adding taxes and other surcharges would mean that households in the United States spend about 2 cents for each dollar of income on electricity.
After the above discussions, it can said that studying the energy consumption of residential customers is essential for a range of reasons. It offers insightful information on resource management, helping to maintain the sustainability of limited energy sources. Assessing the effects on the environment is also made possible by an understanding of consumption patterns, especially concerning carbon dioxide emissions. This information is essential to create energy-efficient policies, such as those that encourage the use of renewable energy sources and energy-efficient technologies. Furthermore, assessing household energy use helps with financial decision-making, effective grid management, consumer education on energy efficiency, and solving differences in energy availability and cost between various areas.
2. Residential Energy Consumption Data
Energy intensity analysis is crucial for assessing and enhancing energy efficiency in processes. It helps quantify energy consumed per unit of output, aiding in cost reduction, environmental impact mitigation, and competitive advantage. This analysis targets areas of high energy intensity for optimization, facilitates cost reduction through efficiency upgrades, and supports environmental goals by cutting greenhouse gas emissions. It also informs policy development by revealing consumption patterns, allowing targeted interventions for sustainable energy use and risk mitigation in volatile markets.
The typical energy use of a 2000-square-foot house is roughly 10,400 kWh per year. This equates to an annual energy intensity of 5.2 kWh/ft2. However, the energy intensity varies greatly by geography, and dwellings in colder regions often require more energy due to greater heating demands. On the other hand, warmer-climate homes may have higher cooling demands, resulting in higher energy intensity during the summer months. The Energy Information Administration (EIA) study on 2020 residential energy consumption in the United States provides crucial insights into usage patterns. This national sample survey gathered data from nearly 18,500 households, representing 123.5 million primary residences. The 2020 RECS, the 15th iteration, released its first microdata file in July 2022 with preliminary household characteristics. The second file, from March 2023, includes final housing and square footage data, with differences outlined in the Housing Characteristics documentation’s Appendix A.1.
According to the report, residential energy consumption increased slightly in 2020 compared to the previous year, largely due to the impacts of the COVID-19 pandemic on energy use patterns. With more people staying home due to lockdowns and work-from-home arrangements, energy consumption for space heating, water heating, and cooking increased. In contrast, energy use for transportation and commercial activities decreased. This trend highlights the dynamic nature of energy demand in response to societal shifts, emphasizing the need for flexible energy policies and infrastructure to meet evolving needs and challenges. The data shows that in 2020, the total site energy consumption in the U.S. was 9,481 trillion Btu, with an average of 76.8 million Btu per household, 31.3 million Btu per household member, and 42.2 thousand Btu per square foot. Total energy expenditure was 232.76 billion dollars, with an average of 1,884 dollars per household, 768 dollars per household member, and 1.04 dollars per square foot. Understanding the energy consumption patterns in buildings worldwide is crucial for effective management and sustainability efforts. This involves examining various factors that influence energy usage, such as urbanization, income levels, population growth, initiatives aimed at improving efficiency, and prevailing climate conditions. By comprehensively analyzing these determinants, policymakers, urban planners, and stakeholders can develop targeted strategies to address energy challenges and promote more sustainable building practices on a global scale [17]. The study in [17] identified heating equipment type and home size as primary contributors to energy consumption across most climate zones, with variations observed in different regions. Additionally, the influence of on-site solar power generation was found to be limited, suggesting the need for further research and policy considerations [18].
There are some methodologies for estimating and improving energy efficiency in residential buildings, covering aspects like window replacement, insulation, and shading. They provide rough estimations and exact calculations, emphasizing the importance of factors such as climate conditions and building characteristics for accurate assessments. [19]
When looking at the census region and division, the Northeast had the highest energy consumption and expenditures per household, with an average of 89.2 million Btu and 2,263 dollars, respectively. The Midwest had the highest energy consumption and expenditures per square foot, with an average of 48.3 thousand Btu and 0.94 dollars, respectively. The South had the lowest energy consumption and expenditures per household member, with an average of 27.2 million BTU and 753 dollars, respectively. The West had the lowest energy consumption and expenditures per square foot, with an average of 39.1 thousand Btu and 1.00 dollars, respectively.
The report also highlights the continuing importance of energy efficiency measures in reducing energy consumption and costs for homeowners. By improving insulation, upgrading appliances, and using energy-efficient lighting and heating systems, homeowners can save money on energy bills and reduce their carbon footprint. The table displays data from the 2020 Residential Energy Consumption Survey by the U.S. Energy Information Administration, detailing the main heating fuel sources in U.S. households. Natural gas leads at 62.71%, followed by electricity at 42.57%. Fuel oil kerosene and propane hold smaller shares at 4.93% and 5.21%, respectively, while wood is used by 2.25% of households. Some other fuels, such as coal and district steam, represent a negligible share. Additionally, 5.79% of households do not use heating equipment. These data are based on a sample of primarily occupied housing units across the 50 states and the District of Columbia, classified by the U.S. Census Bureau using 2010 Census data, covering energy consumption, expenditures, climate regions, and household characteristics.
To reduce power consumption we need to implement various measures to reduce power consumption in residential buildings, including improving energy efficiency through better building materials and construction methods, promoting the adoption of smart devices for energy management, and using economic incentives to encourage households to adopt energy-saving behaviors [20]. The report highlights electricity as the primary energy source for residential buildings, followed by natural gas and propane, although there is a growing trend towards renewable sources like solar and wind power. The 2020 Residential Energy Consumption Survey (RECS) recently released data on state household characteristics, offering insights into energy consumption patterns nationwide and facilitating trend analysis [21].
According to the survey findings, the average household size in the U.S. stands at 2.5 people. Utah and South Dakota have the largest households, averaging 3.1 people, while Maine and Vermont have the smallest, at 2.2 people. The average number of rooms per household is 5.5, with Mississippi and New Mexico leading at 6.4 and 6.2 rooms respectively, and Delaware and Rhode Island having the fewest at 4.3 and 4.5 rooms respectively. In terms of energy consumption, Hawaii tops the charts with an average of 22,100 kWh of electricity per year, while Maine has the lowest at 6,900 kWh. Wyoming records the highest average natural gas consumption at 791 therms, whereas Hawaii has the lowest at 17 therms. For fuel oil or kerosene, Maine leads with 501 gallons per year, contrasting Hawaii’s mere 3 gallons. Propane consumption averages 461 gallons annually, with Maine at the top with 766 gallons and Hawaii at the bottom with 3 gallons. Wood consumption remains the lowest among all fuel sources, averaging 1.1 cords annually. According to the U.S. Housing Statistics and Facts, the total space of homes in the United States was estimated to be 256.7 billion square feet in 2023. From 2015 to 2023 as shown in Figure 6, the total space of homes in the U.S. increased from 237 billion square feet in 2015 to 257 billion square feet in 2023 [22].
As shown in Table 1, between 2015 and 2022, there was a general trend of fluctuation in energy consumption, measured in Trillion Btu, across billions of square feet of space, with a corresponding change in energy intensity, measured in kWh per square foot. Despite variations, there was an overall increase in energy consumption from 2015 to 2022, with peaks in 2018 and 2022, while energy intensity showed a slight fluctuating trend but remained relatively stable.
Residential buildings are one of the major contributors to climate change and account for more than 19% of the U.S.’s CO2 emissions by source. According to the annual energy outlook report for the year 2023, the residential sector is responsible for more than 0.9 billion metric tons of CO2 emissions [23,24,25]. The CO2 equivalent for different fuel types is shown in Table 2 [21].
3. Methodology
The major goal of this research is to undertake a comprehensive analysis of energy use in the United States residential sector. This investigation takes a multifaceted approach, integrating existing data from literature and government publications with firsthand data acquired from updates in different parts of the United States. The study focuses on quantifying energy intensity, which is defined as the electricity consumption in kWh per square meter (kWh/f2) of the building’s footprint. This statistic provides a standardized way to compare energy consumption across various residential constructions. We explain the process in more detail in this section.
- Literature Review and Data Compilation: The first phase in this research is a thorough examination of available literature and official records about energy consumption patterns in the United States residential sector [26]. This procedure includes studies, surveys, and reports from reputable sources such as the United States Department of Energy (DOE), the Energy Information Administration (EIA), and academic research. We ensure the analysis is founded on the most recent and credible information accessible by pulling from these reputable sources. This overview of the literature serves as the foundation for comprehending the broader context of household energy usage.
-
Calculation of Energy Intensity: Energy intensity, a key metric in this study, is computed for each residential building by dividing the annual energy consumption (in kWh) by the total floor area (in square meters) of the respective house. This calculation is expressed mathematically as:The energy intensity metric normalizes energy consumption, enabling meaningful comparisons between residential buildings of varying sizes and layouts. This approach aligns with established standards for energy benchmarking and performance assessment [27].
- Data Collection from Sample Residential Homes: In addition to relying on published data, this study collects and analyzes energy-related information for three specific residential homes located in different regions of the United States. This includes acquiring utility bills that detail the energy consumption patterns over a year and recording the total floor area of each house. The data collected from these homes provides a real-world perspective on energy use and allows for in-depth scrutiny.
- Energy Intensity Calculation for Sample Homes: To assess the energy performance of the selected residential homes, the energy intensity is computed for each dwelling using the actual annual energy consumption data obtained from utility bills and the recorded total floor area. These calculations provide insight into the energy efficiency of these specific homes and enable the comparison of consumption trends across the sample.
By combining data from published sources with real-world measurements from the selected residential homes, this research offers a comprehensive and data-driven analysis of energy use within the U.S. residential sector. The calculated energy intensities facilitate the identification of trends, the evaluation of energy efficiency measures, and the formulation of recommendations for optimizing residential energy consumption and sustainability. This methodology aligns with established practices in energy analysis and provides a robust framework for understanding and addressing energy-related challenges in the residential sector.
4. Sample Data Collection and Discussions
Electricity consumption is a key metric for analyzing residential energy use because it’s straightforward to measure and provides a good overview of how much energy homes are using. It shows which appliances and devices are running and how energy needs change with the seasons. By looking at electricity usage, a user can see where they might be using too much energy and find ways to be more efficient. In this section, case studies from five different zones in the United States are presented. The data collection was performed in 2022-23. Monthly energy consumption is affected by the weather and the type of building insulation. To understand the energy characteristics of the building, the utility bills and building information were gathered. Then the energy intensity was calculated. The electricity intensity is calculated based on the total energy (in kWh) divided by the area (in square feet or square meters) as in Equation 1.
4.1. Denton, Texas, Climate Zone 5
The data for zone 5 came from a single-story house in Denton, Texas, with a zip code of 76210. This is a 2,200 ft2 house with brick walls and equipped with central HVAC. As shown in Table 3, the monthly energy consumption for this house ranges from 232 kWh in December to 1,055 kWh in August. August marked the peak energy consumption period for this household, as illustrated in Figure 7, a trend commonly observed in residences within this zone due to the region’s hot climatic conditions.
By analyzing utility bills and building specifications, the annual electricity consumption was determined to be 5,710 kWh, resulting in an energy intensity value of 2.60 ft2. The monthly electricity use and the average temperature for case 1 are presented graphically in Figure 8.
4.2. Atlanta, Georgia, Climate Zone 4
In this case study, data from a 2,072 ft2 apartment built-in 1995 is presented from Atlanta, Georgia, zip code 30005. The apartment is front-brick type, second floor, and vinyl-sided with standard R-18 for walls. The house uses electricity for heating and water heating. As shown in Table 4, the monthly energy consumption of this house ranges from 1,074 kWh in October to 4,010 kWh in January. The most energy consumption happens during the months of January, February, and December as depicted in Figure 9.
The annual electricity consumption for this apartment was recorded as 28,226 kWh. The energy intensity of this house was found to be 13.62 kWh/ft2. Monthly electricity use and the average temperature for case 2 are presented in Figure 10.
4.3. LA, California, Climate Zone 4
The previous data from Atlanta, GA is from the moist area, whereas the data collected in Los Angeles, California, reflects marine weather conditions. This is a 1,400 square foot apartment constructed in 2002 located in Los Angeles, California, with zip code 92563. Energy consumption data was gathered for this 2-bedroom apartment, situated on the second floor of a brick-front, vinyl-sided building with standard R-18 insulation for walls. As illustrated in Table 5, monthly energy consumption for this residence varies from 248 kWh in January to 642 kWh in September. The highest energy consumption for this apartment happened in September, Figure 11. As anticipated for this particular region, the months characterized by higher temperatures corresponded to increased energy consumption periods in this case study. This result aligns with the common expectation that warmer weather typically leads to greater demand for cooling systems, thereby driving up energy usage.
The annual electricity consumption for this apartment is 4,525 kWh. The energy intensity of this apartment is 3.23 kWh/ft2. The monthly electricity use and the average temperature for case 3 are presented graphically in Figure 12.
4.4. Cape Girardeau, MO, Climate Zone 3
In this case study, data from a 1,090 ft2 apartment built in 2003 is presented. This data was collected in Cape Girardeau, Missouri, zip code 63701. The apartment is on the third floor and vinyl-sided with standard R-18 for walls. The house uses electricity for heating and water heating. The monthly energy consumption for this case is shown in Table 6.
The most energy consumption months are depicted in Figure 13. While January and March are highlighted with larger words, it’s important to note that February maintained an average daily consumption of kWh, consistent with the other two months as previously mentioned. It’s worth highlighting that February had 28 days in 2022. The total kWh consumed each month varied throughout the year, ranging from a low of 672 kWh in May to a high of 1,094 kWh in March. The highest consumption occurred during the winter months, which is expected due to the increased use of heating systems.
The annual electricity consumption of the apartment was based on the utility bills for 12 months and amounted to 10,432 kWh. The yearly energy intensity value obtained for this building was 9.57 kWh/ ft2. Monthly electricity uses and average temperature for case 4 are depicted in Figure 14.
4.5. Beaverton, Oregon, Climate Zone 2
This is an 1890 ft2 apartment built in 2002 and is in Beaverton, Oregon, zip code 97003. The energy data for this single-family house was collected. The house is vinyl-sided with a standard R-18 for walls. The house uses electricity for heating and water heating. As shown in Table 7, the monthly energy consumption for this house ranges from 1753 kWh in October to 4,233 kWh in February. The word cloud data visualization in Fig. Figure 15 shows that the month of February had the highest electricity consumption for this apartment which is not quite consistent with the given average temperature data for this month. Energy consumption data for this particular month can be considered an anomaly, possibly influenced by factors beyond temperature alone.
The annual electricity consumption for this apartment is 27,605 kWh. The energy intensity value for this house was found to be 14.61 kWh/ft2. Monthly electricity uses and average temperature for case 5 are presented graphically in Figure 16.
4.6. MA, Chelmsford, Climate Zone 2
A second data from climate zone 2 was also gathered, this time from a 1,275 square foot apartment constructed in 1991, located in Chelmsford, Massachusetts, with zip code 01824. Unlike the data from OR, which represents a cold and dry area, this dataset reflects the conditions of a moist region within Zone 2. The energy data was collected for this single-story apartment, with an additional room in the basement, and it features central HVAC for temperature control. As presented in Table 8, monthly energy consumption for this residence varied from 322 kWh in April to 527 kWh in September with the maximum consumption happening in September, Figure 17.
The collected data revealed a total annual electricity consumption of 4,796 kWh for 2022-23. The energy intensity for this household is 3.76 kWh/ft2. The monthly electricity use and the average temperature for this case are presented graphically in Figure 18.
4.7. WI, Oak Creek, Climate Zone 1
The data for this case study is from climate zone 1 with zip code 53154. This is a 1,110-square-foot apartment located in Oak Creek, Wisconsin. The energy data was collected for this single-story apartment, with a central HVAC for temperature control. As presented in Table 9, monthly energy consumption for this residence varied from 211 kWh in June to 411 kWh in August, Figure 19. The energy consumption was high during the months of higher average temperature days.
The total annual electricity consumption for this case is 3,533 kWh for 2022-23. The energy intensity for this household is 3.18 kWh/ft2. The monthly electricity use and the average temperature for this case are presented graphically in Figure 20.
5. Data Comparison
Energy intensity results vary due to factors such as climate conditions, building design, appliance efficiency, occupant behavior, and the use of renewable energy sources. Regions with extreme temperatures often exhibit higher energy intensity values, as more energy is required for heating or cooling. Well-insulated buildings with energy-efficient features tend to have lower energy intensity values. Additionally, the efficiency of appliances and HVAC systems, along with occupant behavior regarding energy usage, can impact energy consumption patterns. Seven sample cases of energy consumption data are represented in this article. These cases represent residential energy consumption across five different climate zones in the United States. Each case presents the annual electricity usage (in kWh), the area of the residence (in square feet), and the Energy Intensity (EI) value, which indicates the energy consumed per square foot. Case 1, situated in Texas (Climate Zone 5), shows the lowest energy usage with an EI of 2.60 kWh/ft2. In contrast, Case 5 in Oregon (Climate Zone 2) exhibits significantly higher energy consumption with an EI of 14.61 kWh/ft2, likely due to colder climates necessitating more heating. A summary of the collected data is presented in Table 10. Table 11 is prepared based on [28] and [29] to list the average energy intensity from the different states as listed in Table 10. This table includes EI calculations considering both electricity consumption (in kWh) and energy consumption from electricity and other fuel types, e.g. oil, natural gas, and propane (in MMBtu). Interestingly, California (Climate Zone 4) demonstrates relatively lower electricity consumption and energy intensity compared to other states, potentially attributed to energy-efficient practices and regulations.
The energy data of the 50 states were collected and analyzed to assess their carbon footprint. The CO2 equivalent for each state was determined, and further analysis was conducted to calculate the CO2 equivalent per capita and million GDP, providing information on the environmental impact of energy consumption. Table 12 presents a summary of this comprehensive analysis, revealing significant variations in carbon emissions between states. For instance, while Texas exhibits the highest CO2 equivalent at 206,722,404 tons, Vermont has the lowest at 47,248 tons, indicating diverse energy consumption patterns and sources among states. Moreover, the average CO2 equivalent per capita was found to be 7.3 tons, based on data provided by the EPA for the year 2021, compared to 5.5 tons per capita for European Union countries, highlighting potential differences in energy efficiency and environmental policies between regions. Detailed information on the energy intensity of each state is tabulated in Appendix A.1, for an understanding of energy consumption trends and opportunities for sustainability initiatives. A summary of CO2 emission is presented in Table 12.
To analyze and visualize the annual energy use distribution in different states, a spreadsheet was used to create a self-organized map (SOM) for annual energy, CO2/capita, and CO2 equivalent/ GDP for each state. Figure 21 shows the SOM map of the annual CO2 equivalent per capita by the state of the fifty states and Figure 22 shows annual tons of CO2 equivalent per million dollars of GDP by state. These states cluster into different groups based on the annual CO2 equivalent. The blue background color represents states with high annual CO2equivalents.
6. Conclusions
The study of home energy consumption in the US offers an important new perspective on the patterns, trends, and environmental effects of energy use. The study shows that energy consumption has been rising steadily over time, with the residential sector using a large share of the country’s total energy consumption. Energy intensity and consumption patterns are mostly determined by factors including climate zones, household size, heating fuel sources, and regional variances. Furthermore, the examination of the carbon footprint and CO2 emissions between states shows the environmental effects of energy use, as distinct regions exhibit different levels of emission. In this study, the residential homes/apartments energy data from 5 different climate zones were collected, compiled, and analyzed. Energy analysis in this research includes energy intensity (kWh/ft2) and carbon footprint. The energy data for each state was collected and analyzed. The CO2 equivalent per capita and GDP dollar for each state were estimated.
To reduce the environmental impact of residential energy use, we must adopt sustainable behaviors, promote renewable energy sources, and improve energy efficiency. Policymakers, energy experts, and homeowners can use this information in the future to make informed decisions regarding renewable energy investments, energy efficiency upgrades, and sustainable lifestyle options. By focusing on a more energy-efficient and environmentally conscious residential sector, the United States can reach its goals of sustainable development and a brighter future for future generations.
Author Contributions
All the authors contributed equally to this article. Conceptualization, K.B., and M.D.; methodology, K.B., S.D., and M.D.; software, S.D.; validation, K.B., S.D., and M.D.; formal analysis, K.B., S.D., and M.D.; investigation, S.D.; resources, M.D.; data curation, S.D.; writing—original draft preparation, K.B., and M.D.; writing—review and editing, S.D.; visualization, S.D.; supervision, M.D.; project administration, K.B.; funding acquisition, N/A. All authors have read and agreed to the published version of the manuscript.
Funding
This research received no external funding.
Conflicts of Interest
The authors declare no conflicts of interest.
Appendix A
Appendix A.1
| Year | States |
State annual CO2 equivalent emissions (tons) |
Population |
GDP (Million $) |
CO2 eqv. per capita (Ton/ Capita) |
CO2 eqv. per Millions of GDP |
State annual CO2 eqv. total output emission rate (lb./MWh) |
| 2021 | AK | 3,050,448.00 | 734,182.00 | 57,349.00 | 4.15 | 53.19 | 924.96 |
| 2021 | AL | 53,843,989.00 | 5,024,356.00 | 254,110.00 | 10.72 | 211.89 | 754.48 |
| 2021 | AR | 33,395,559.00 | 3,028,122.00 | 148,676.00 | 11.03 | 224.62 | 1,093.14 |
| 2021 | AZ | 39,473,767.00 | 7,264,877.00 | 420,027.00 | 5.43 | 93.98 | 727.62 |
| 2021 | CA | 47,315,238.00 | 39,142,991.00 | 3,373,241.00 | 1.21 | 14.03 | 480.50 |
| 2021 | CO | 34,797,287.00 | 5,811,297.00 | 436,359.00 | 5.99 | 79.75 | 1,224.55 |
| 2021 | CT | 11,419,608.00 | 3,623,355.00 | 298,395.00 | 3.15 | 38.27 | 518.13 |
| 2021 | DC | 60,200.00 | 689,546.00 | 153,670.00 | 0.09 | 0.39 | 652.64 |
| 2021 | DE | 1,872,868.00 | 1,004,807.00 | 81,160.00 | 1.86 | 23.08 | 870.06 |
| 2021 | FL | 103,088,075.00 | 21,828,069.00 | 1,255,558.00 | 4.72 | 82.11 | 837.48 |
| 2021 | GA | 47,346,547.00 | 10,788,029.00 | 691,627.00 | 4.39 | 68.46 | 762.43 |
| 2021 | HI | 6,897,162.00 | 1,447,154.00 | 91,096.00 | 4.77 | 75.71 | 1,502.55 |
| 2021 | IA | 26,020,324.00 | 3,197,689.00 | 216,860.00 | 8.14 | 119.99 | 774.43 |
| 2021 | ID | 2,289,134.00 | 1,904,314.00 | 96,283.00 | 1.20 | 23.78 | 271.96 |
| 2021 | IL | 59,585,067.00 | 12,686,469.00 | 945,674.00 | 4.70 | 63.01 | 657.32 |
| 2021 | IN | 77,321,782.00 | 6,813,532.00 | 412,975.00 | 11.35 | 187.23 | 1,642.93 |
| 2021 | KS | 23,891,944.00 | 2,937,922.00 | 191,381.00 | 8.13 | 124.84 | 844.64 |
| 2021 | KY | 60,808,817.00 | 4,506,589.00 | 237,182.00 | 13.49 | 256.38 | 1,739.76 |
| 2021 | LA | 40,263,346.00 | 4,627,098.00 | 258,571.00 | 8.70 | 155.72 | 828.74 |
| 2021 | MA | 8,350,592.00 | 1,377,238.00 | 77,963.00 | 6.06 | 107.11 | 859.58 |
| 2021 | MD | 13,396,598.00 | 6,174,610.00 | 443,930.00 | 2.17 | 30.18 | 702.00 |
| 2021 | ME | 1,686,245.00 | 6,989,690.00 | 641,332.00 | 0.24 | 2.63 | 309.38 |
| 2021 | MI | 58,242,235.00 | 10,037,504.00 | 572,206.00 | 5.80 | 101.79 | 1,010.28 |
| 2021 | MN | 24,596,482.00 | 5,711,471.00 | 412,459.00 | 4.31 | 59.63 | 831.56 |
| 2021 | MO | 63,437,424.00 | 6,169,823.00 | 358,572.00 | 10.28 | 176.92 | 1,648.98 |
| 2021 | MS | 28,320,693.00 | 2,949,586.00 | 358,572.00 | 9.60 | 78.98 | 836.36 |
| 2021 | MT | 13,135,620.00 | 1,106,227.00 | 58,700.00 | 11.87 | 223.78 | 1,053.04 |
| 2021 | NC | 43,631,987.00 | 10,565,885.00 | 662,121.00 | 4.13 | 65.90 | 672.66 |
| 2021 | ND | 29,067,553.00 | 3,146,402.00 | 63,560.00 | 9.24 | 457.33 | 1,350.96 |
| 2021 | NE | 21,489,970.00 | 1,963,554.00 | 1,221,039.00 | 10.94 | 17.60 | 1,133.71 |
| 2021 | NH | 2,648,145.00 | 1,387,505.00 | 99,673.00 | 1.91 | 26.57 | 308.05 |
| 2021 | NJ | 14,837,491.00 | 9,267,961.00 | 682,946.00 | 1.60 | 21.73 | 483.13 |
| 2021 | NM | 20,006,432.00 | 2,116,677.00 | 109,583.00 | 9.45 | 182.57 | 1,140.83 |
| 2021 | NV | 14,954,965.00 | 10,565,885.00 | 1,901,297.00 | 1.42 | 7.87 | 716.86 |
| 2021 | NY | 28,282,656.00 | 19,857,492.00 | 662,121.00 | 1.42 | 42.72 | 457.02 |
| 2021 | OH | 76,298,692.00 | 11,764,342.00 | 756,617.00 | 6.49 | 100.84 | 1,214.86 |
| 2021 | OK | 30,551,282.00 | 3,991,225.00 | 756,617.00 | 7.65 | 40.38 | 756.65 |
| 2021 | OR | 9,967,679.00 | 4,256,301.00 | 215,336.00 | 2.34 | 46.29 | 326.72 |
| 2021 | PA | 88,023,213.00 | 13,012,059.00 | 844,496.00 | 6.76 | 104.23 | 729.64 |
| 2021 | PR | 14,527,770.00 | 3,262,693.00 | 844,496.00 | 4.45 | 17.20 | 1,563.90 |
| 2021 | RI | 3,882,208.00 | 1,096,985.00 | 66,571.00 | 3.54 | 58.32 | 833.58 |
| 2021 | SC | 27,981,816.00 | 5,193,266.00 | 269,802.00 | 5.39 | 103.71 | 570.39 |
| 2021 | SD | 2,638,110.00 | 896,164.00 | 61,685.00 | 2.94 | 42.77 | 304.59 |
| 2021 | TN | 27,774,674.00 | 6,968,351.00 | 427,125.00 | 3.99 | 65.03 | 702.65 |
| 2021 | TX | 206,722,404.00 | 29,558,864.00 | 2,051,769.00 | 6.99 | 100.75 | 860.24 |
| 2021 | UT | 33,435,337.00 | 3,339,113.00 | 225,340.00 | 10.01 | 148.38 | 1,571.20 |
| 2021 | VA | 28,002,997.00 | 8,657,365.00 | 604,958.00 | 3.23 | 46.29 | 601.55 |
| 2021 | VT | 47,249.00 | 646,972.00 | 37,104.00 | 0.07 | 1.27 | 44.83 |
| 2021 | WA | 11,244,479.00 | 7,740,745.00 | 677,489.00 | 1.45 | 16.60 | 202.95 |
| 2021 | WI | 40,952,458.00 | 5,880,101.00 | 368,611.00 | 6.96 | 111.10 | 1,274.93 |
| 2021 | WV | 64,498,768.00 | 1,785,526.00 | 368,611.00 | 36.12 | 174.98 | 1,959.38 |
| 2021 | WY | 40,145,098.00 | 579,483.00 | 41,510.00 | 69.28 | 967.12 | 1,847.42 |
References
- U.S. energy facts explained - consumption and production - U.S. Energy Information Administration (EIA). https://www.eia.gov/energyexplained/us-energy-facts/, accessed on 2024-03-04.
- Electricity explained - data and statistics -, U.S. Energy Information Administration (EIA). https://www.eia.gov/energyexplained/electricity/data-and-statistics.php, accessed on 2024-03-04.
- Commercial Buildings Factsheet. https://css.umich.edu/publications/factsheets/built-environment/commercial-buildings-factsheet, accessed on 2024-03-05.
- Frequently Asked Questions (FAQs) -, U.S. Energy Information Administration (EIA). https://www.eia.gov/tools/faqs/faq.php, accessed on 2024-05-03.
- U.S. Census Bureau QuickFacts: United States. https://www.census.gov/quickfacts/fact/table/US/HSG010222#HSG010222, accessed on 2024-05-03.
- U.S. Energy Information Administration - EIA - Independent Statistics and Analysis. https://www.eia.gov/consumption/residential/data/2020/, accessed on 2024-03-04.
- Bawaneh, K.; Ghazi Nezami, F.; Rasheduzzaman, M.; Deken, B. Energy Consumption Analysis and Characterization of Healthcare Facilities in the United States. Energies 2019, 12, 3775. [Google Scholar] [CrossRef]
- U.S. Energy Information Administration - EIA - Independent Statistics and Analysis. https://www.eia.gov/consumption/residential/maps.php, accessed on 2024-04-25.
- U.S. households in warmer states consume less site energy than households in colder states - U.S. Energy Information Administration (EIA). https://www.eia.gov/todayinenergy/detail.php?id=56380, accessed on 2024-03-04.
- Sekar, A.; Williams, E.; Chen, R. Changes in Time Use and Their Effect on Energy Consumption in the United States. Joule 2018, 2, 521–536. [Google Scholar] [CrossRef]
- Use of energy in homes -, U.S. Energy Information Administration (EIA). https://www.eia.gov/energyexplained/use-of-energy/homes.php, accessed on 2024-03-04.
- State Carbon Dioxide Emissions Data -, U.S. Energy Information Administration (EIA). https://www.eia.gov/environment/emissions/state/index.php, accessed on 2024-03-05.
- Environment Data -, U.S. Energy Information Administration (EIA). https://www.eia.gov/environment/data.php, accessed on 2024-03-04.
- In most, U.S. regions, 2024 wholesale electricity prices will be similar to 2023 - U.S. Energy Information Administration (EIA). https://www.eia.gov/todayinenergy/detail.php?id=61244, accessed on 2024-03-04.
- Trustees (EOUST), E.O.f.t.U.S. United States Trustee Program Home Page. https://www.justice.gov/ust/eo/bapcpa/20230401/bci_data/median_income_table.htm, accessed on 2024-03-04.
- Short-Term Energy Outlook -, U.S. Energy Information Administration (EIA). https://www.eia.gov/outlooks/steo/, accessed on 2024-03-04.
- González-Torres, M.; Pérez-Lombard, L.; Coronel, J.F.; Maestre, I.R.; Yan, D. A review on buildings energy information: Trends, end-uses, fuels and drivers. Energy Reports 2022, 8, 626–637. [Google Scholar] [CrossRef]
- Debs, L.; Metzinger, J. A Comparison of Energy Consumption in American Homes by Climate Region. Buildings 2022, 12, 82. [Google Scholar] [CrossRef]
- Nacht, T.; Pratter, R.; Ganglbauer, J.; Schibline, A.; Aguayo, A.; Fragkos, P.; Zisarou, E. Modeling Approaches for Residential Energy Consumption: A Literature Review. Climate 2023, 11, 184. [Google Scholar] [CrossRef]
- Quintana, D.I.; Cansino, J.M. Residential Energy Consumption-A Computational Bibliometric Analysis. Buildings 2023, 13, 1525. [Google Scholar] [CrossRef]
- U.S. energy facts - data and statistics - U.S. Energy Information Administration (EIA). https://www.eia.gov/energyexplained/us-energy-facts/data-and-statistics.php, accessed on 2024-03-04.
- Tsemekidi Tzeiranaki, S.; Bertoldi, P.; Diluiso, F.; Castellazzi, L.; Economidou, M.; Labanca, N.; Ribeiro Serrenho, T.; Zangheri, P. Analysis of the EU Residential Energy Consumption: Trends and Determinants. Energies 2019, 12, 1065. [Google Scholar] [CrossRef]
- U.S. CO2 emissions from energy consumption by source and sector, 2022.
- Decarbonizing the, U.S. Economy by 2050: A National Blueprint for the Buildings Sector. https://www.energy.gov/eere/decarbonizing-us-economy-2050-national-blueprint-buildings-sector, accessed on 2024-03-11.
- Where greenhouse gases come from -, U.S. Energy Information Administration (EIA). https://www.eia.gov/energyexplained/energy-and-the-environment/where-greenhouse-gases-come-from.php, accessed on 2024-03-04.
- Residential Energy Consumption Survey (RECS) - Energy Information Administration. https://www.eia.gov/consumption/residential/, accessed on 2024-03-05.
- LEED rating system |, U.S. Green Building Council. https://www.usgbc.org/leed, accessed on 2024-03-05.
- State Square Footage. https://www.eia.gov/consumption/residential/data/2020/state/pdf/State%20Square%20Footage.pdf, accessed on 2024-05-04.
- Residential Energy Consumption Survey Dashboard. https://experience.arcgis.com/experience/cbf6875974554a74823232f84f563253?src=%E2%80%B9%20Consumption%20%20%20%20%20%20Residential%20Energy%20Consumption%20Survey%20(RECS)-b1, accessed on 2024-05-04.
Figure 1.
U.S. energy consumption by end sector.
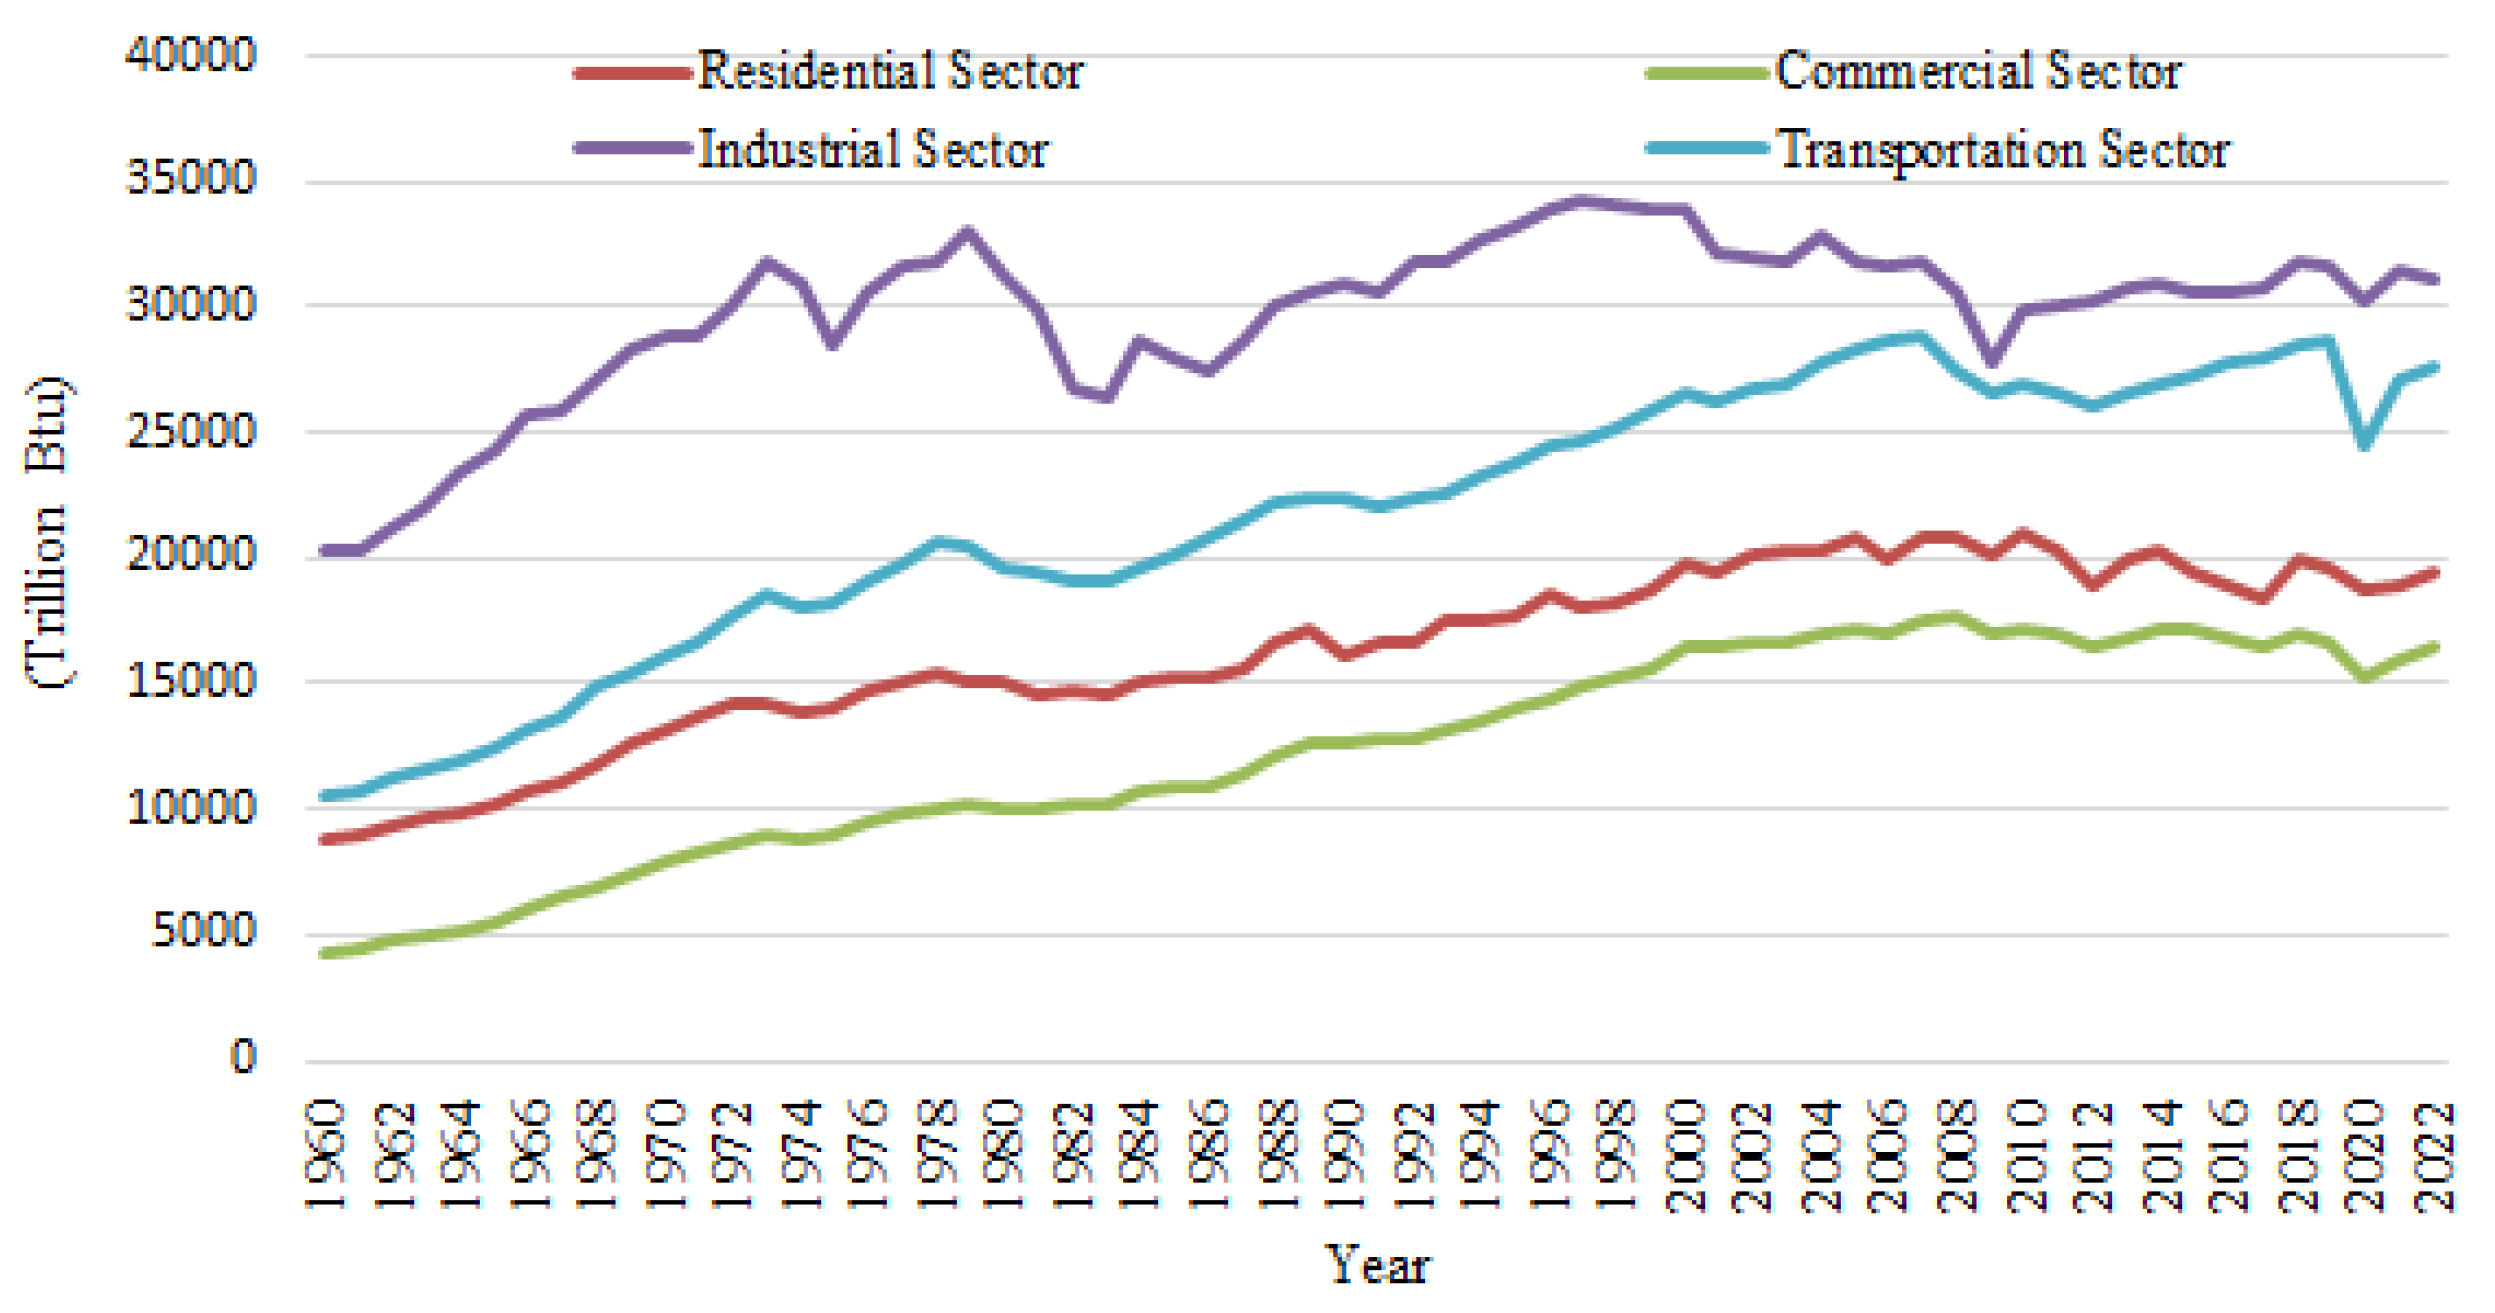
Figure 2.
Percentage share of total primary energy consumption by U.S. energy use sector, 2022.
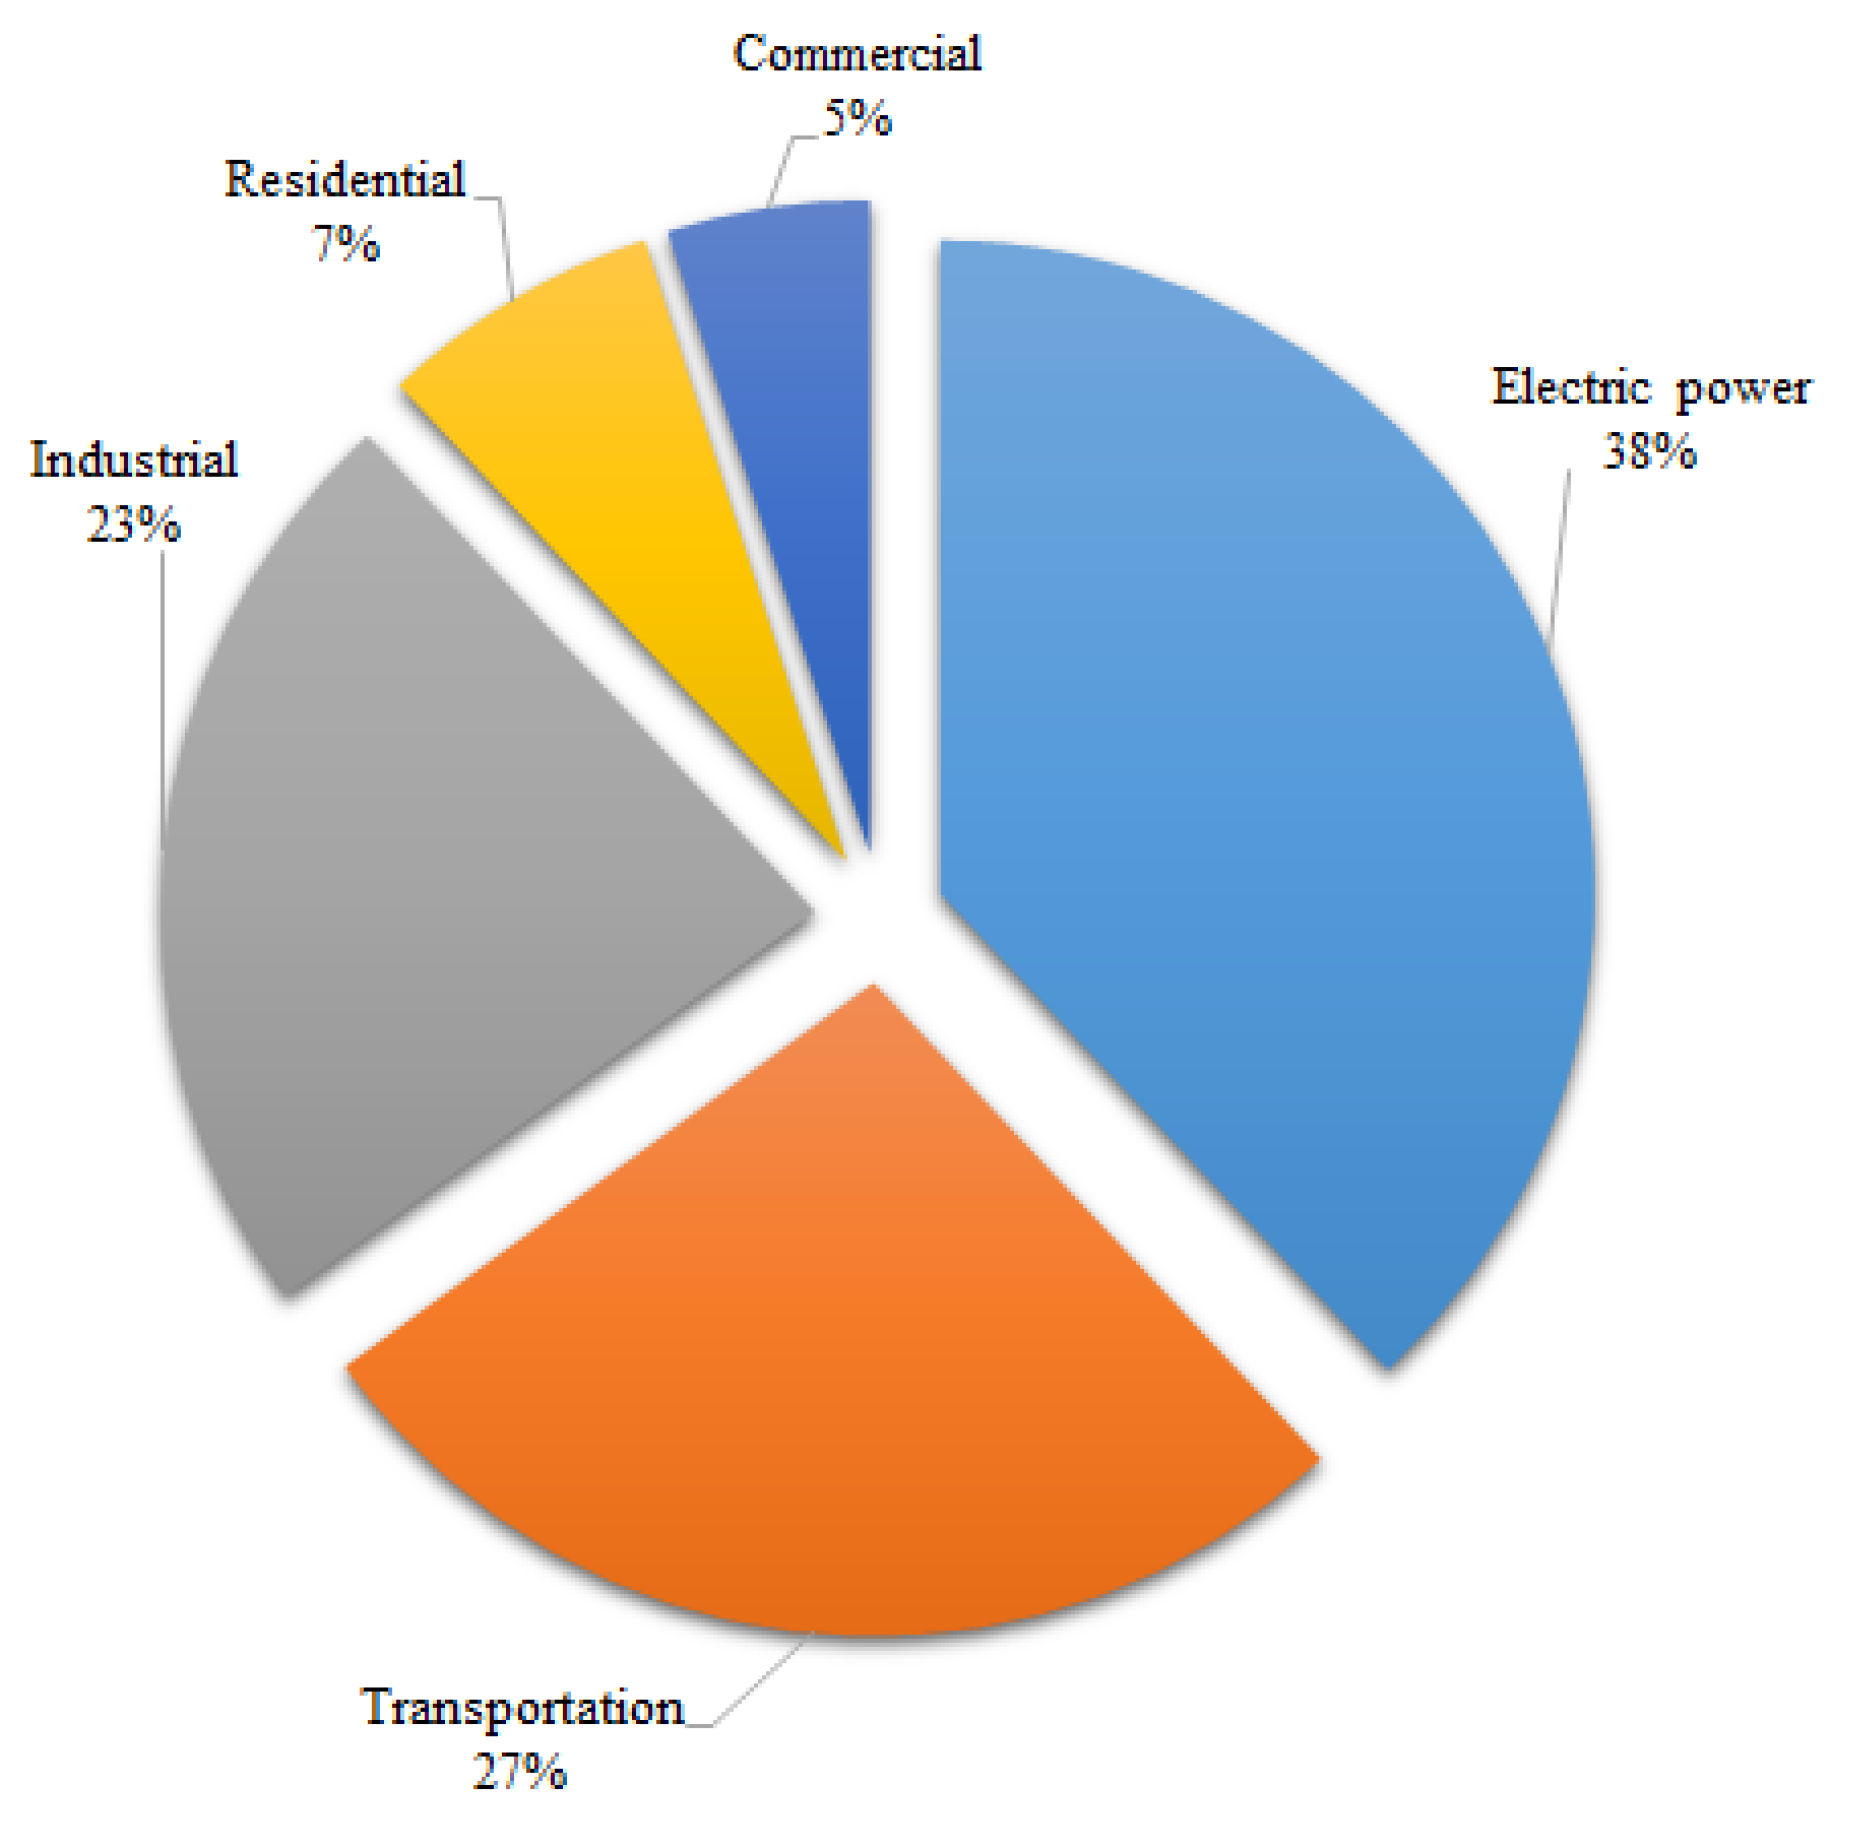
Figure 3.
Different climate zones in the United States [8].
Figure 3.
Different climate zones in the United States [8].
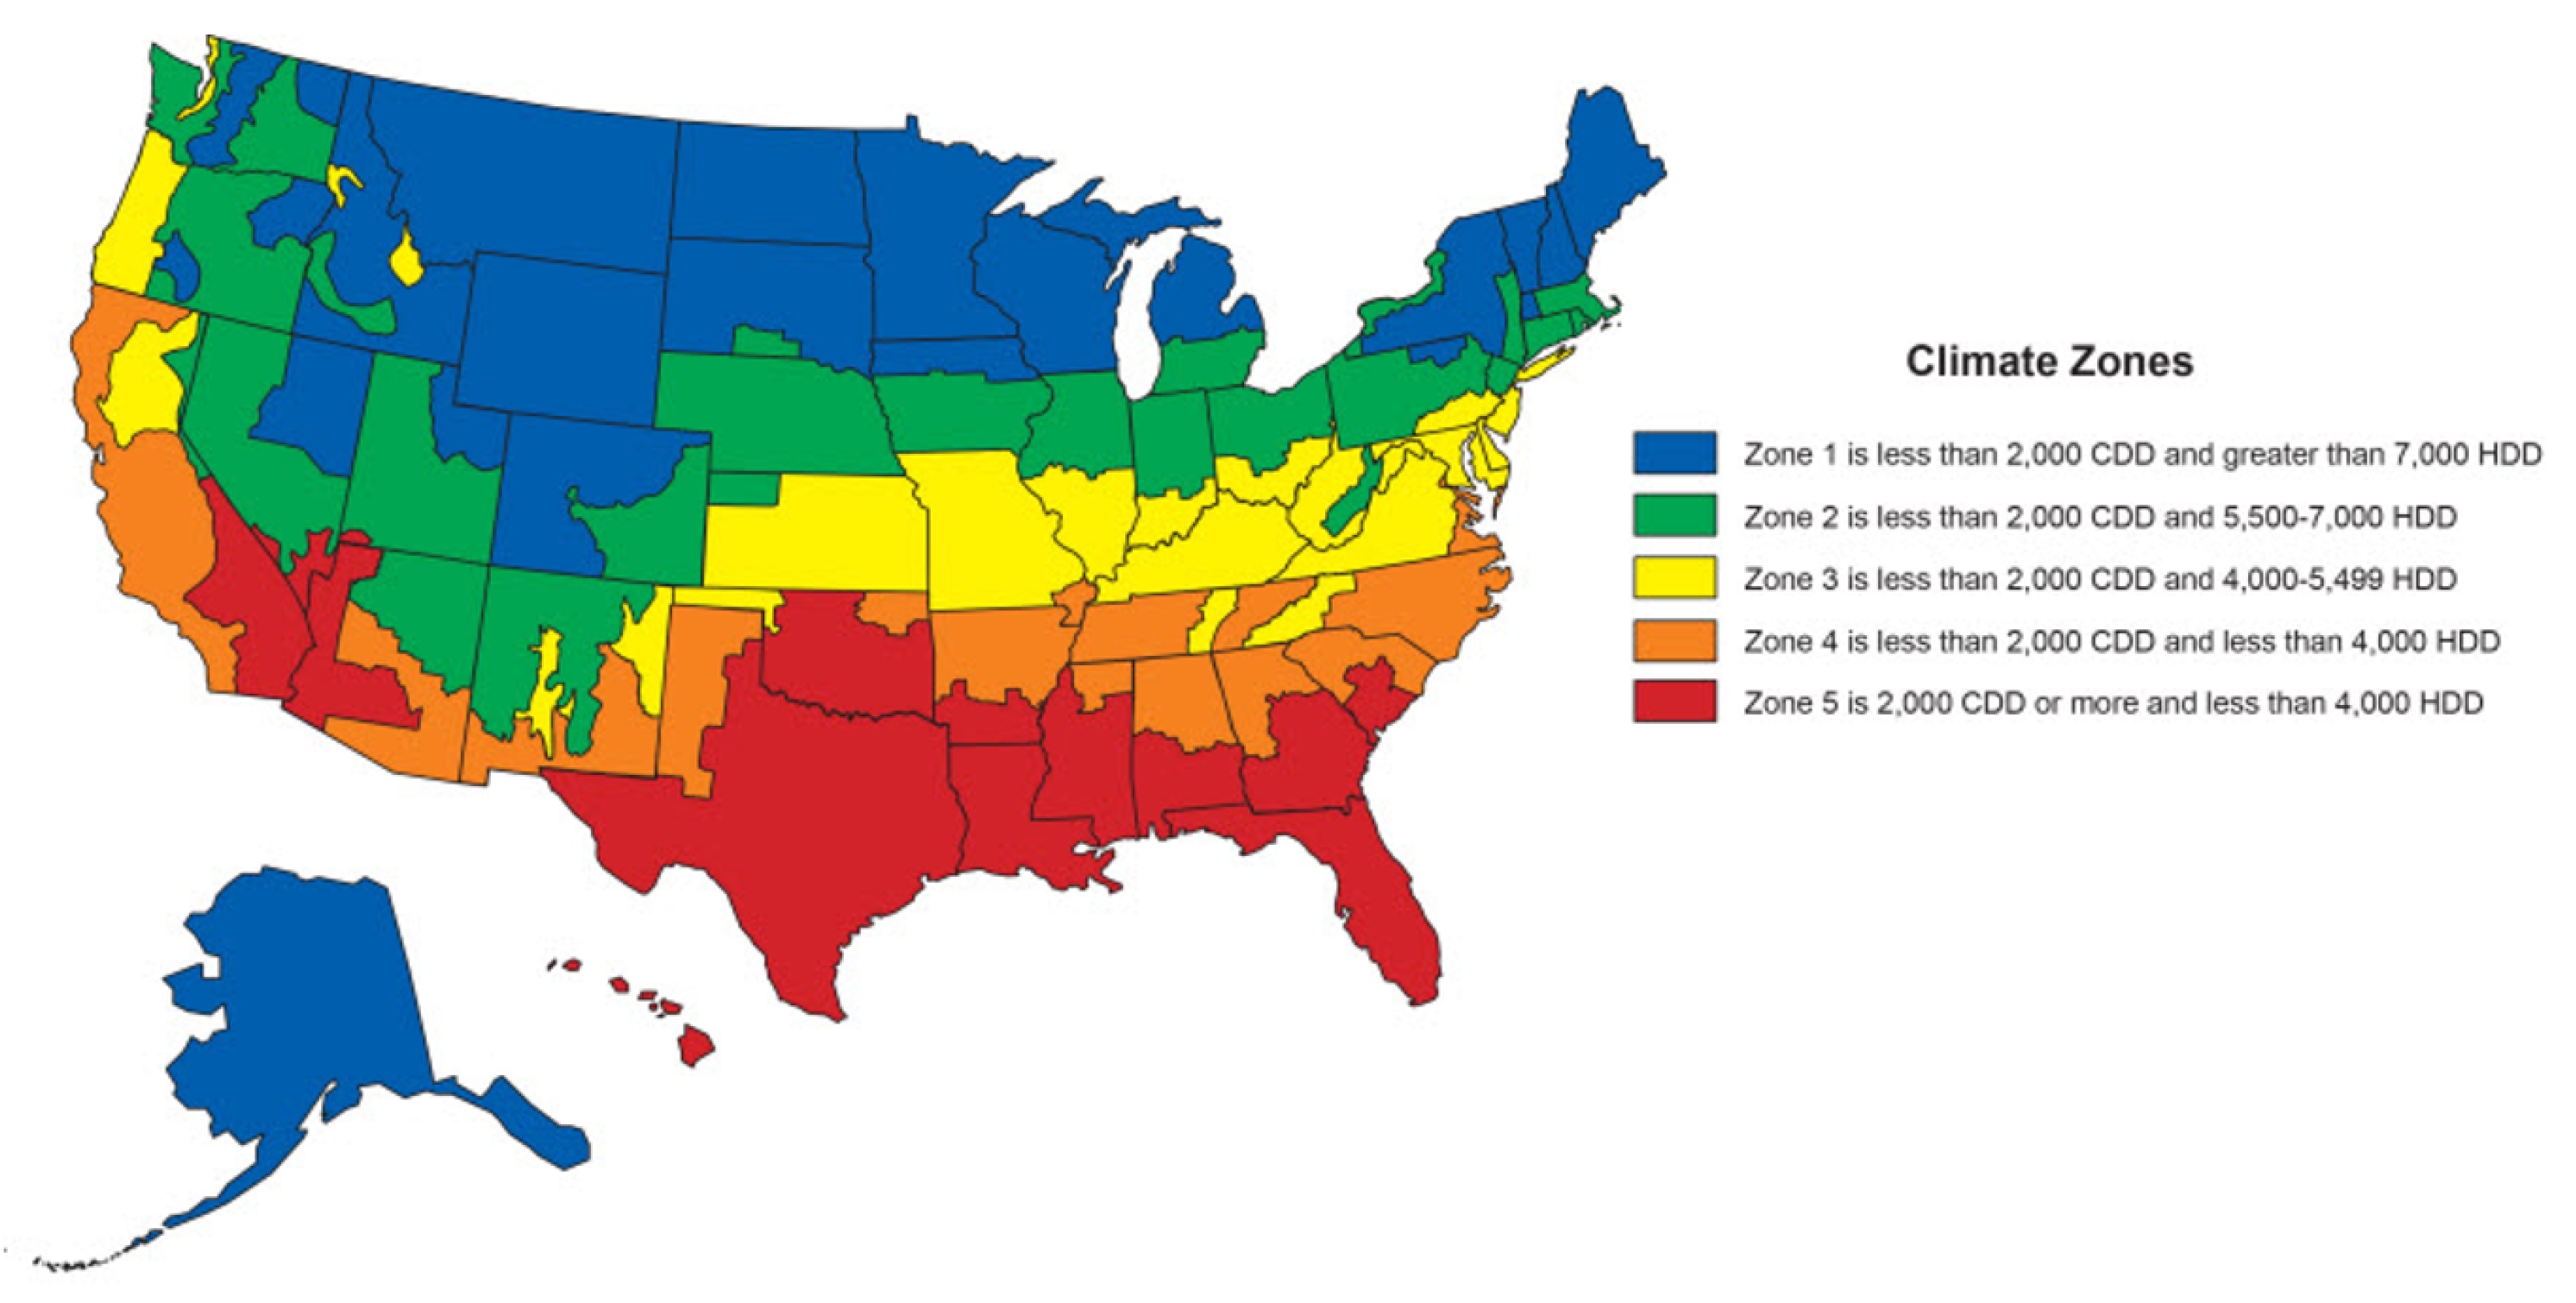
Figure 4.
The U.S. residential sector energy consumption by energy source, 1960 to 2020.
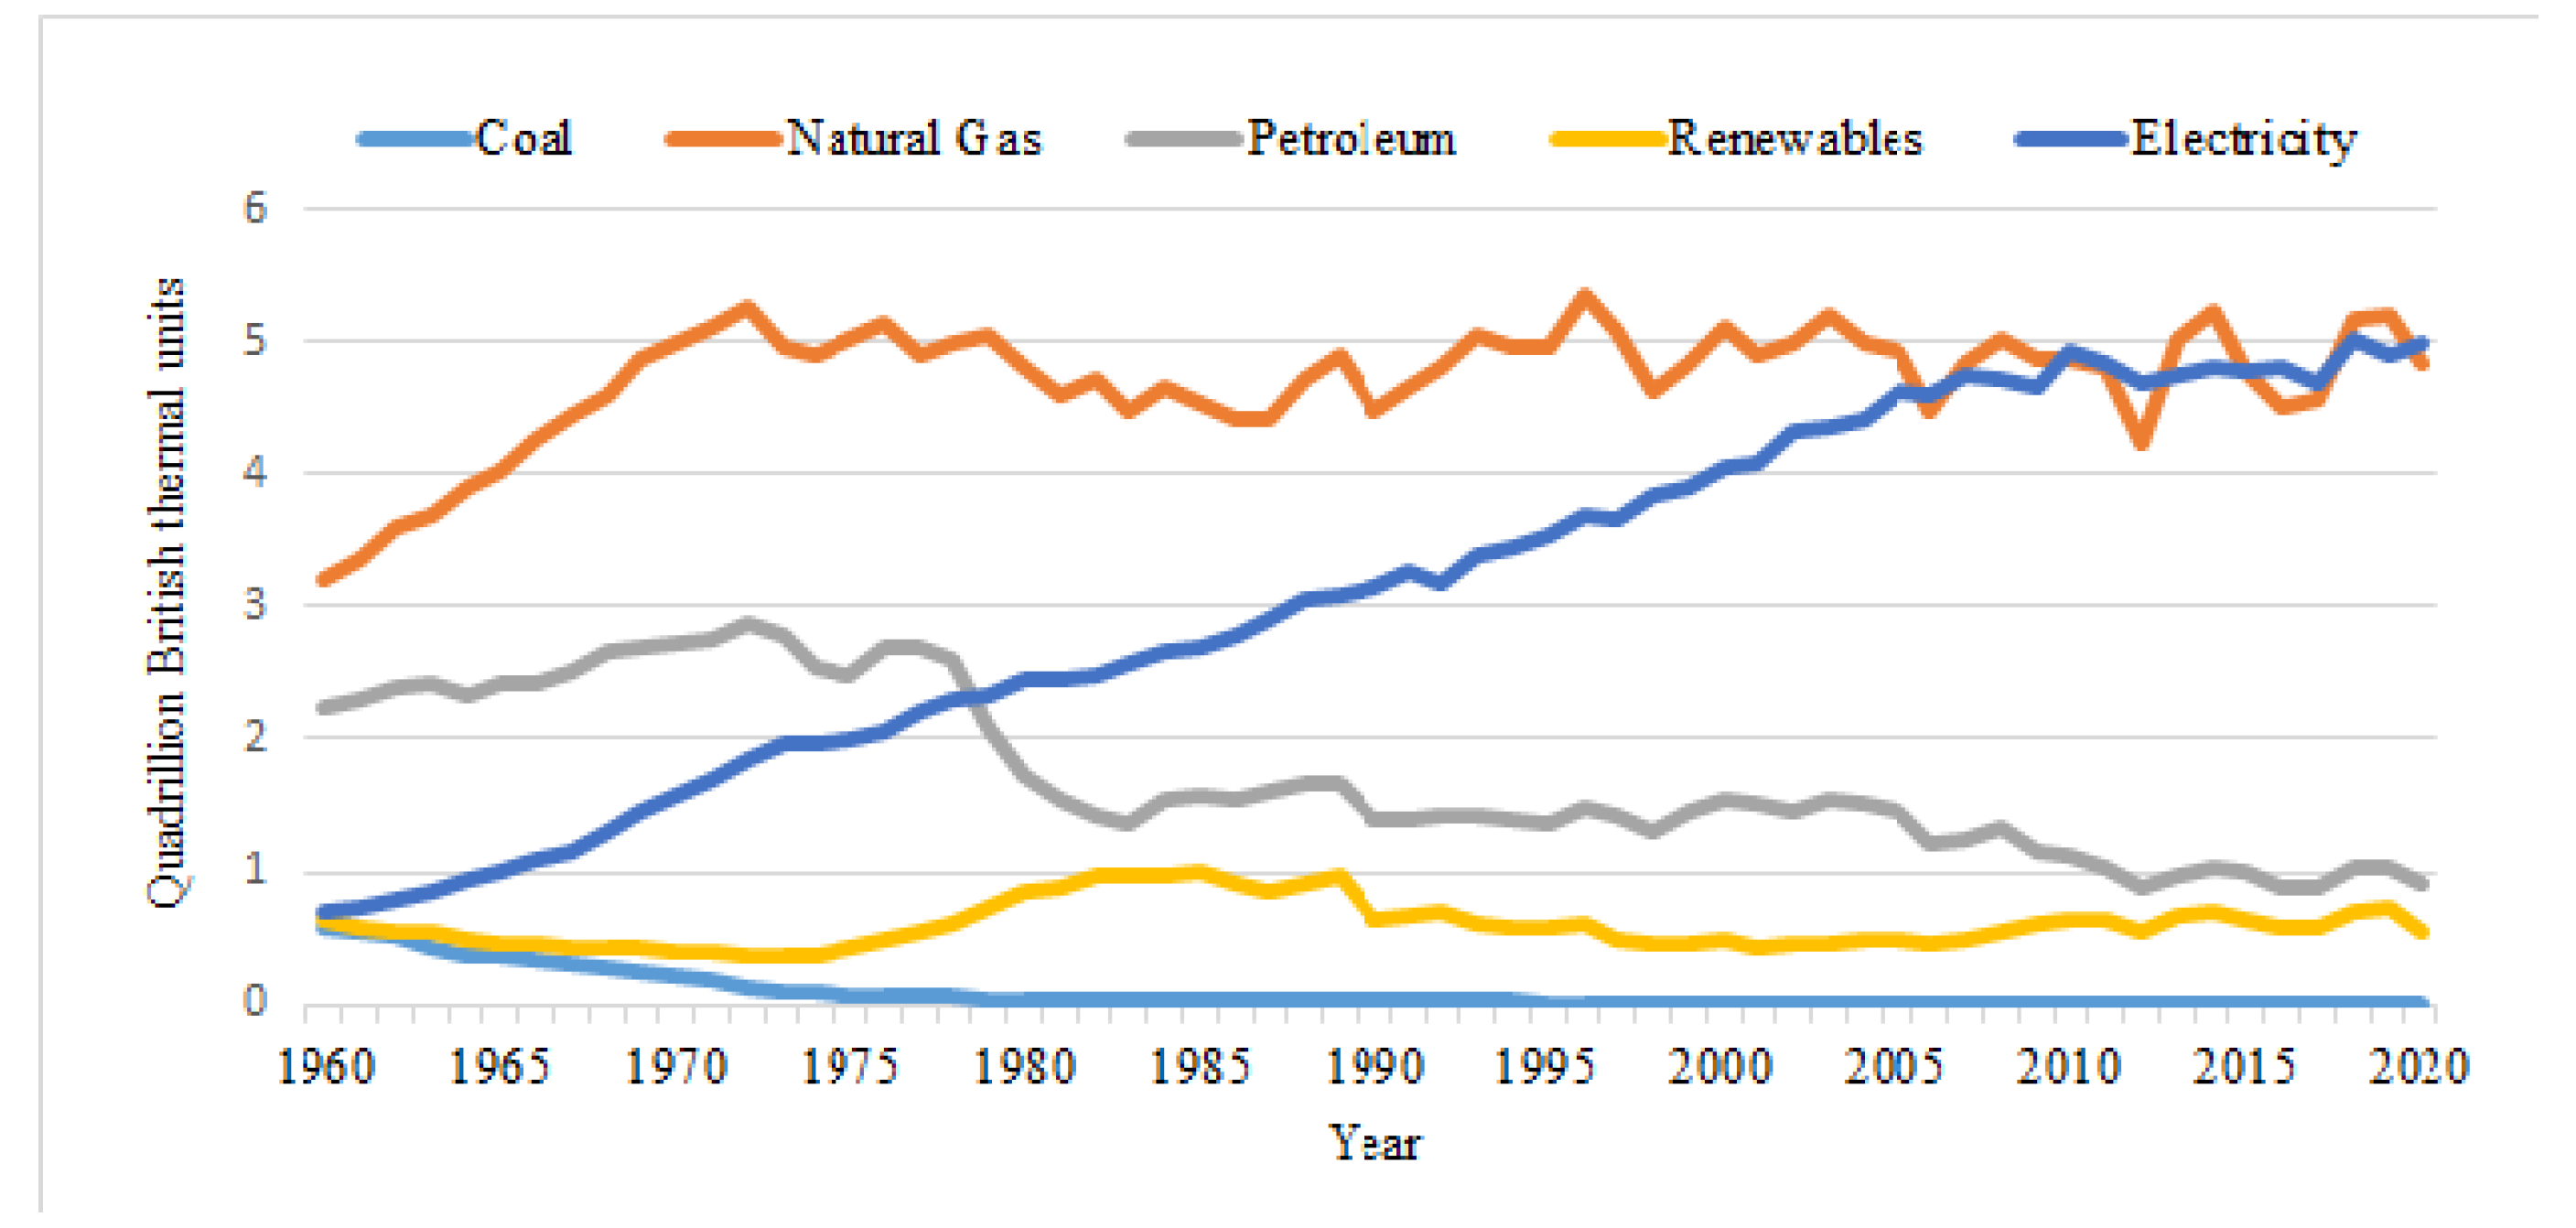
Figure 5.
2021 State energy-related carbon dioxide emissions by sector.
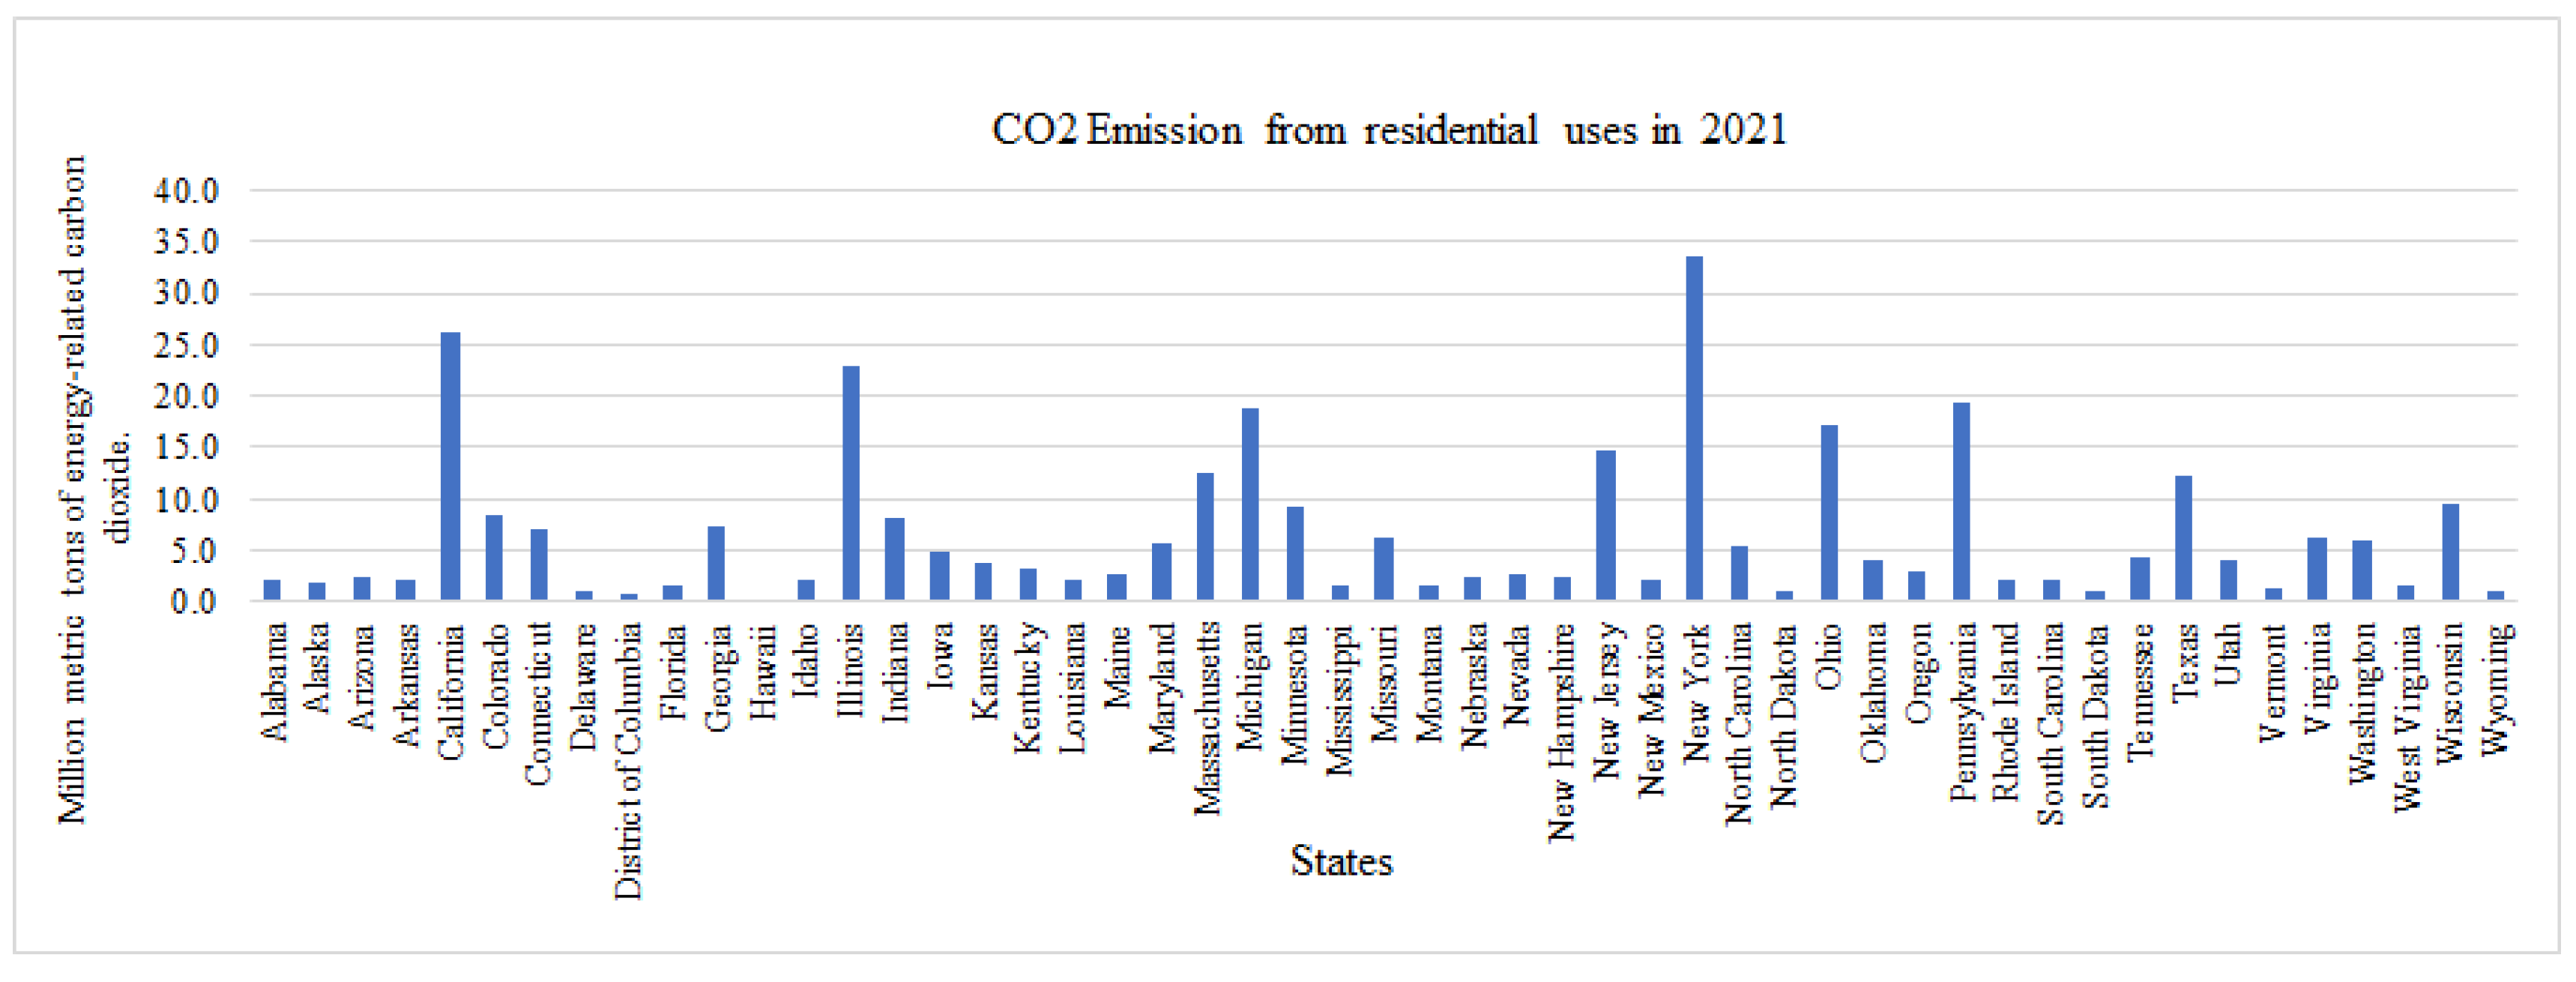
Figure 6.
Total space of homes.

Figure 7.
High energy consumption months for case 1 as visualized with a word cloud.

Figure 8.
Monthly electricity use and average temperature for case 1.
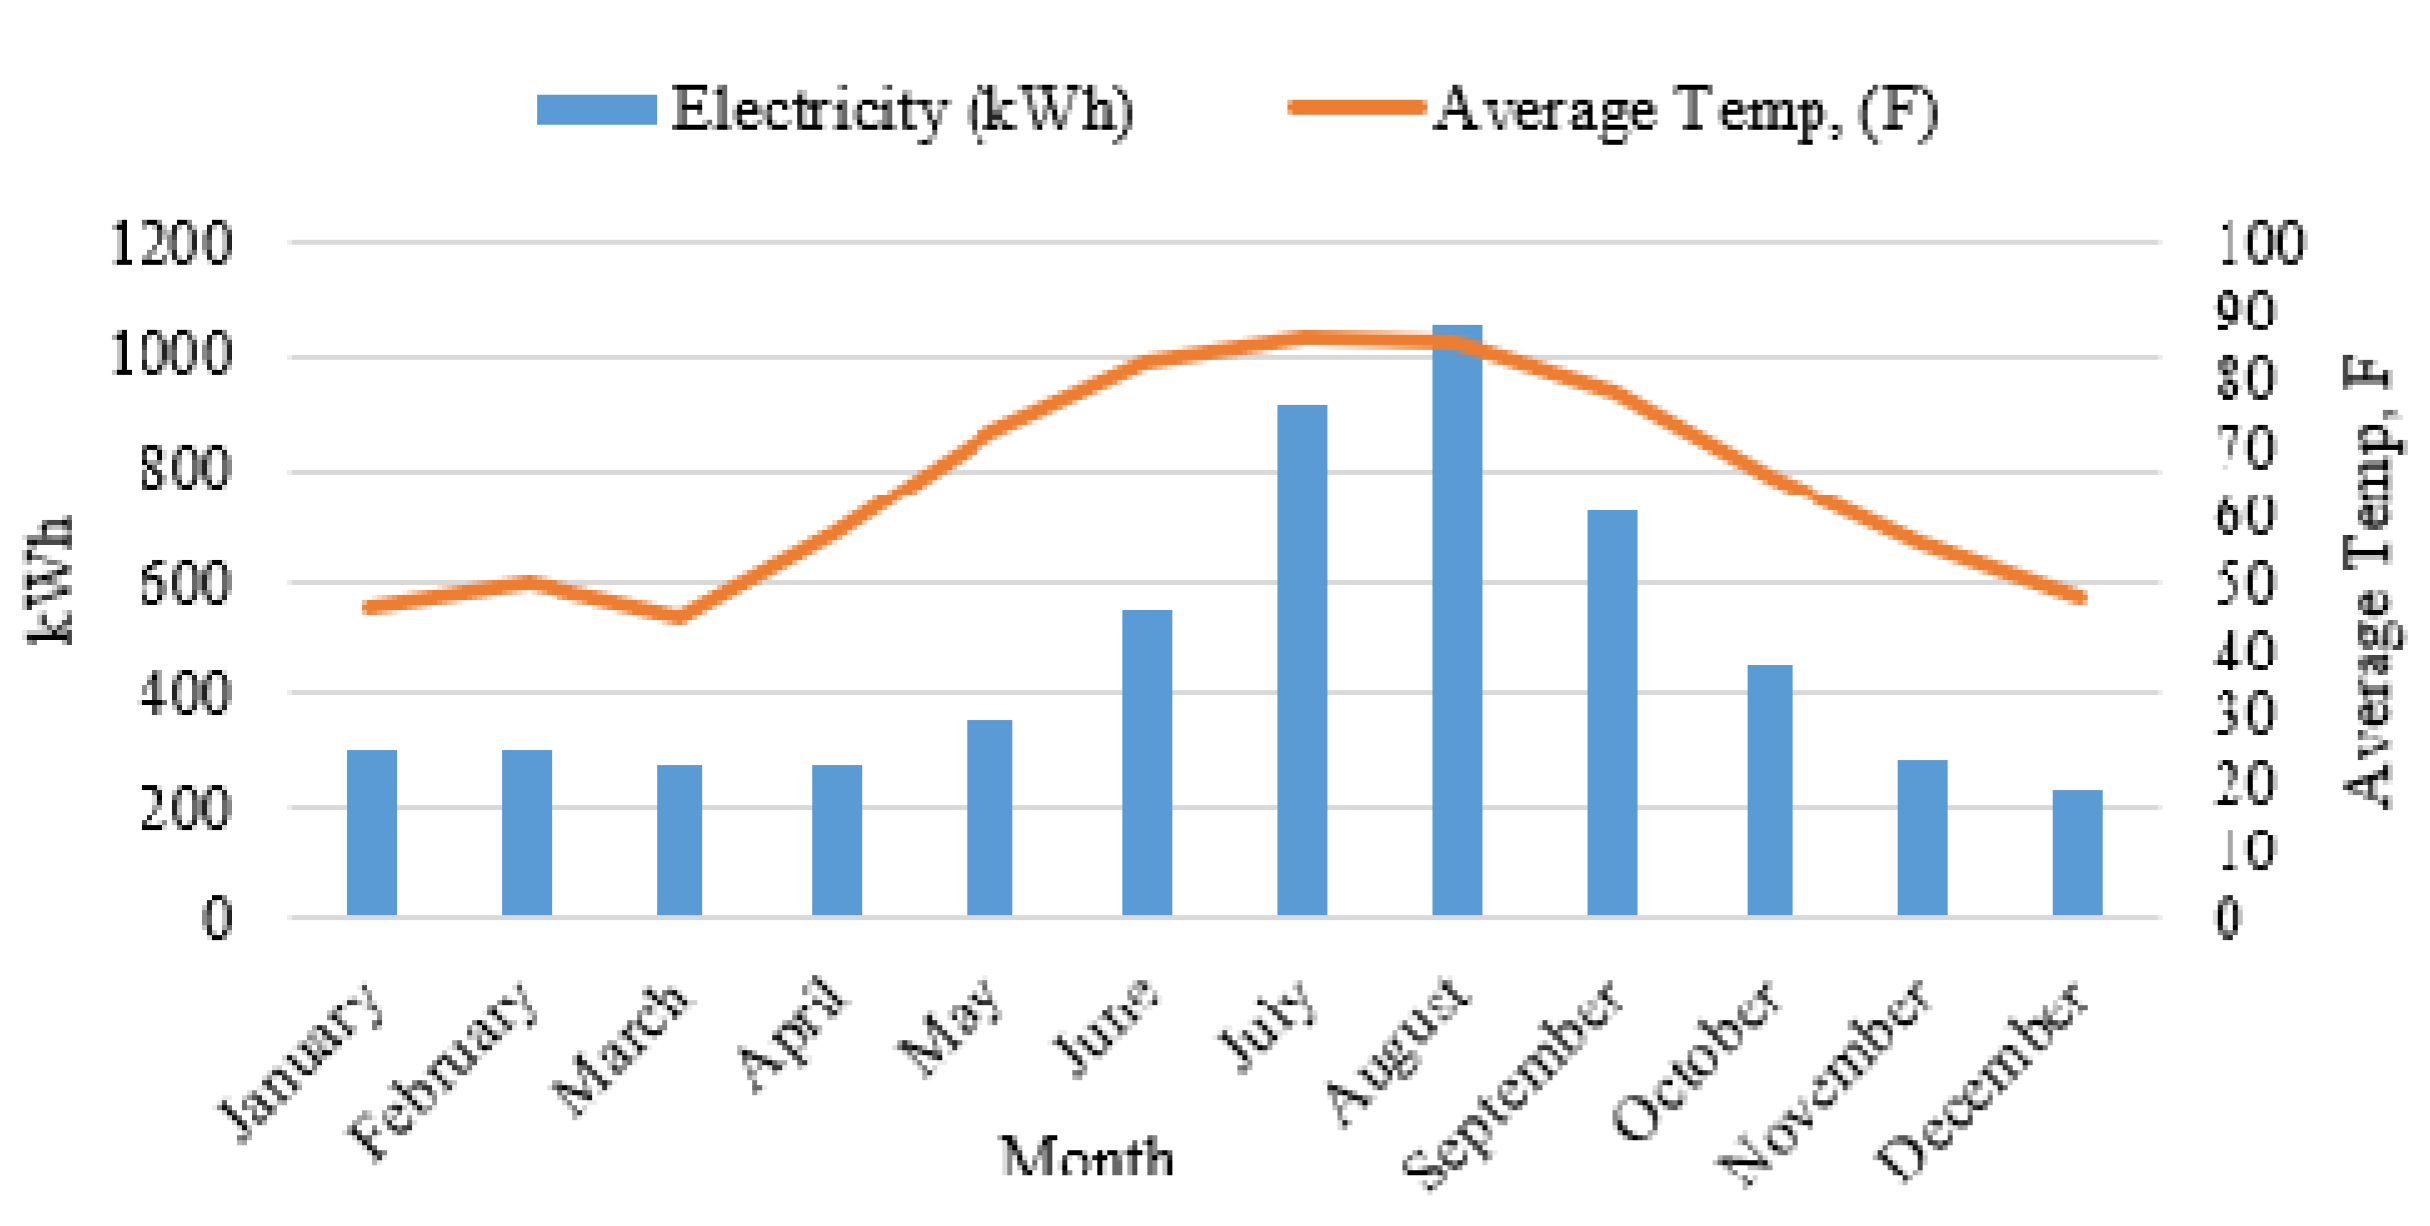
Figure 9.
High energy consumption months for case 2 as visualized with word cloud.

Figure 10.
Monthly electricity use and average temperature for case 2.
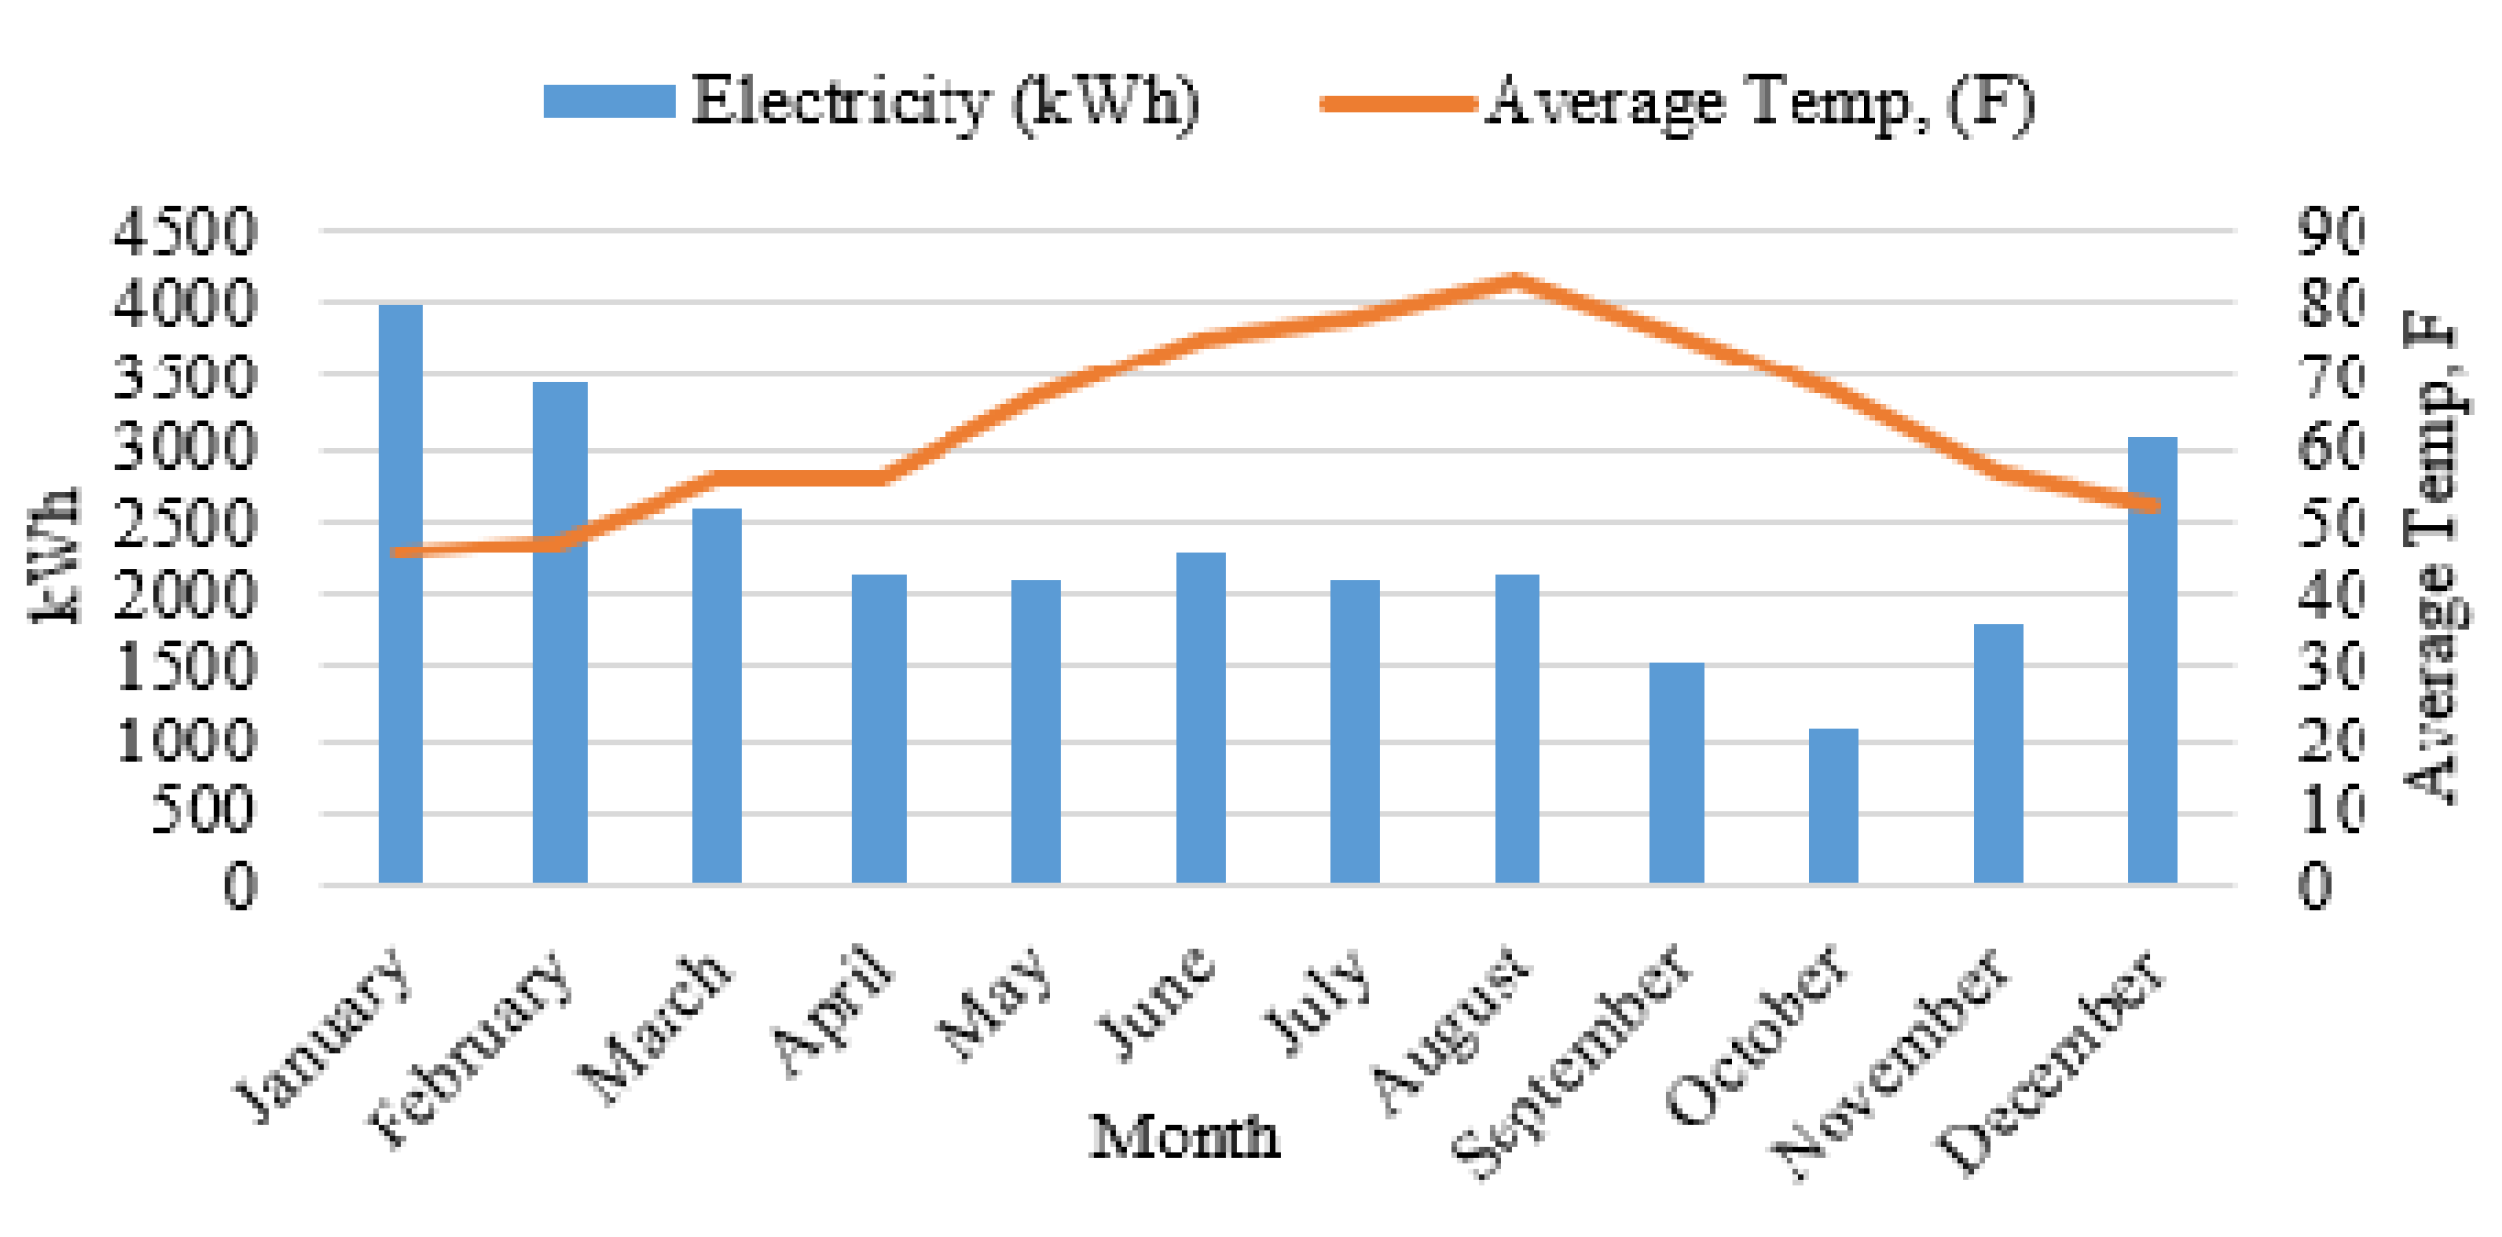
Figure 11.
High energy consumption months for case 3 as visualized with a word cloud.

Figure 12.
Monthly electricity use and average temperature for case 3.

Figure 13.
High energy consumption months for case 4 as visualized with word cloud.

Figure 14.
Monthly electricity use and average temperature for case 4.
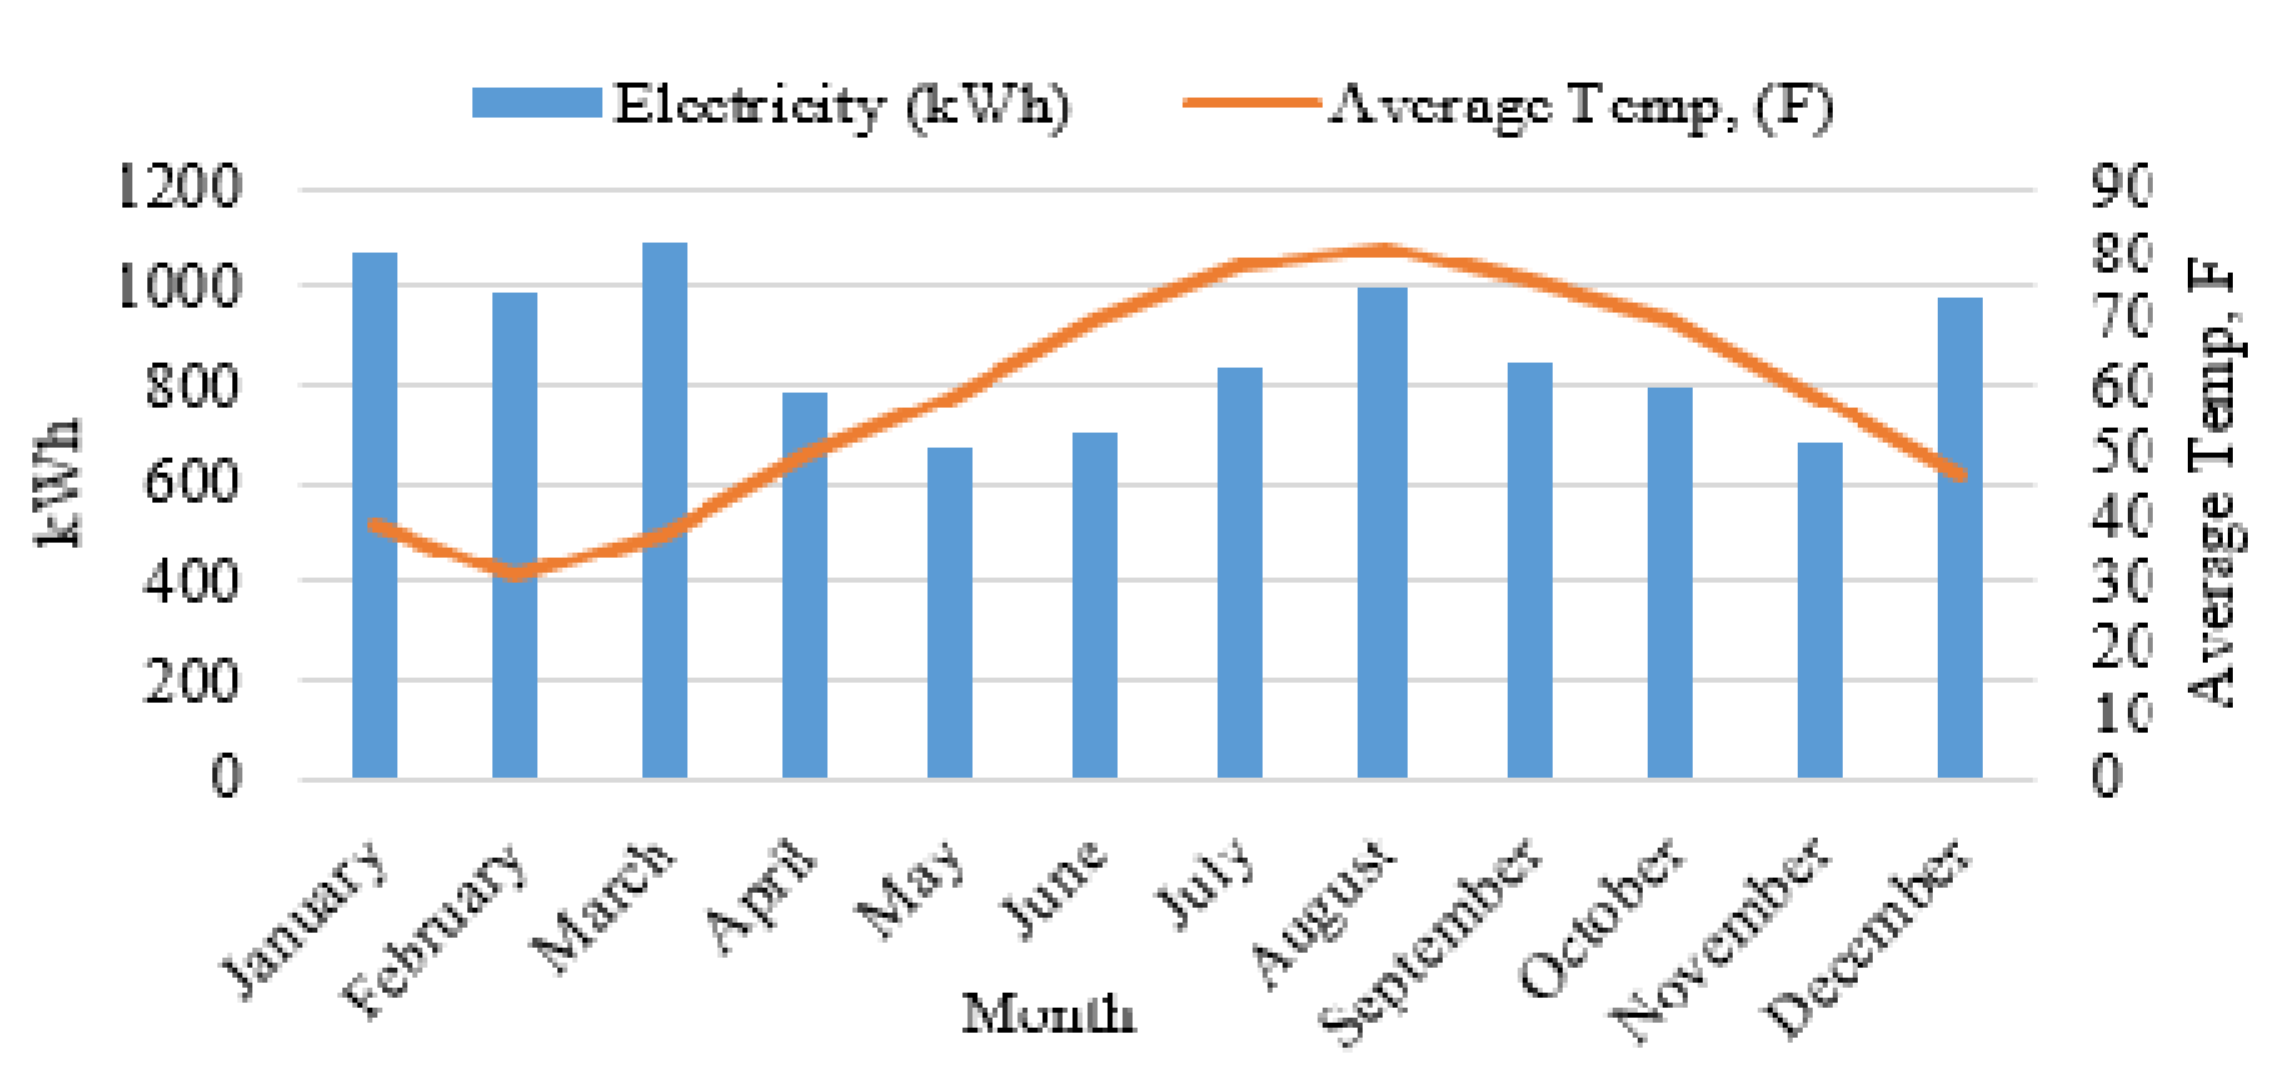
Figure 15.
High energy consumption months for case 5 as visualized with word cloud.

Figure 16.
Monthly electricity use and average temperature for case 5
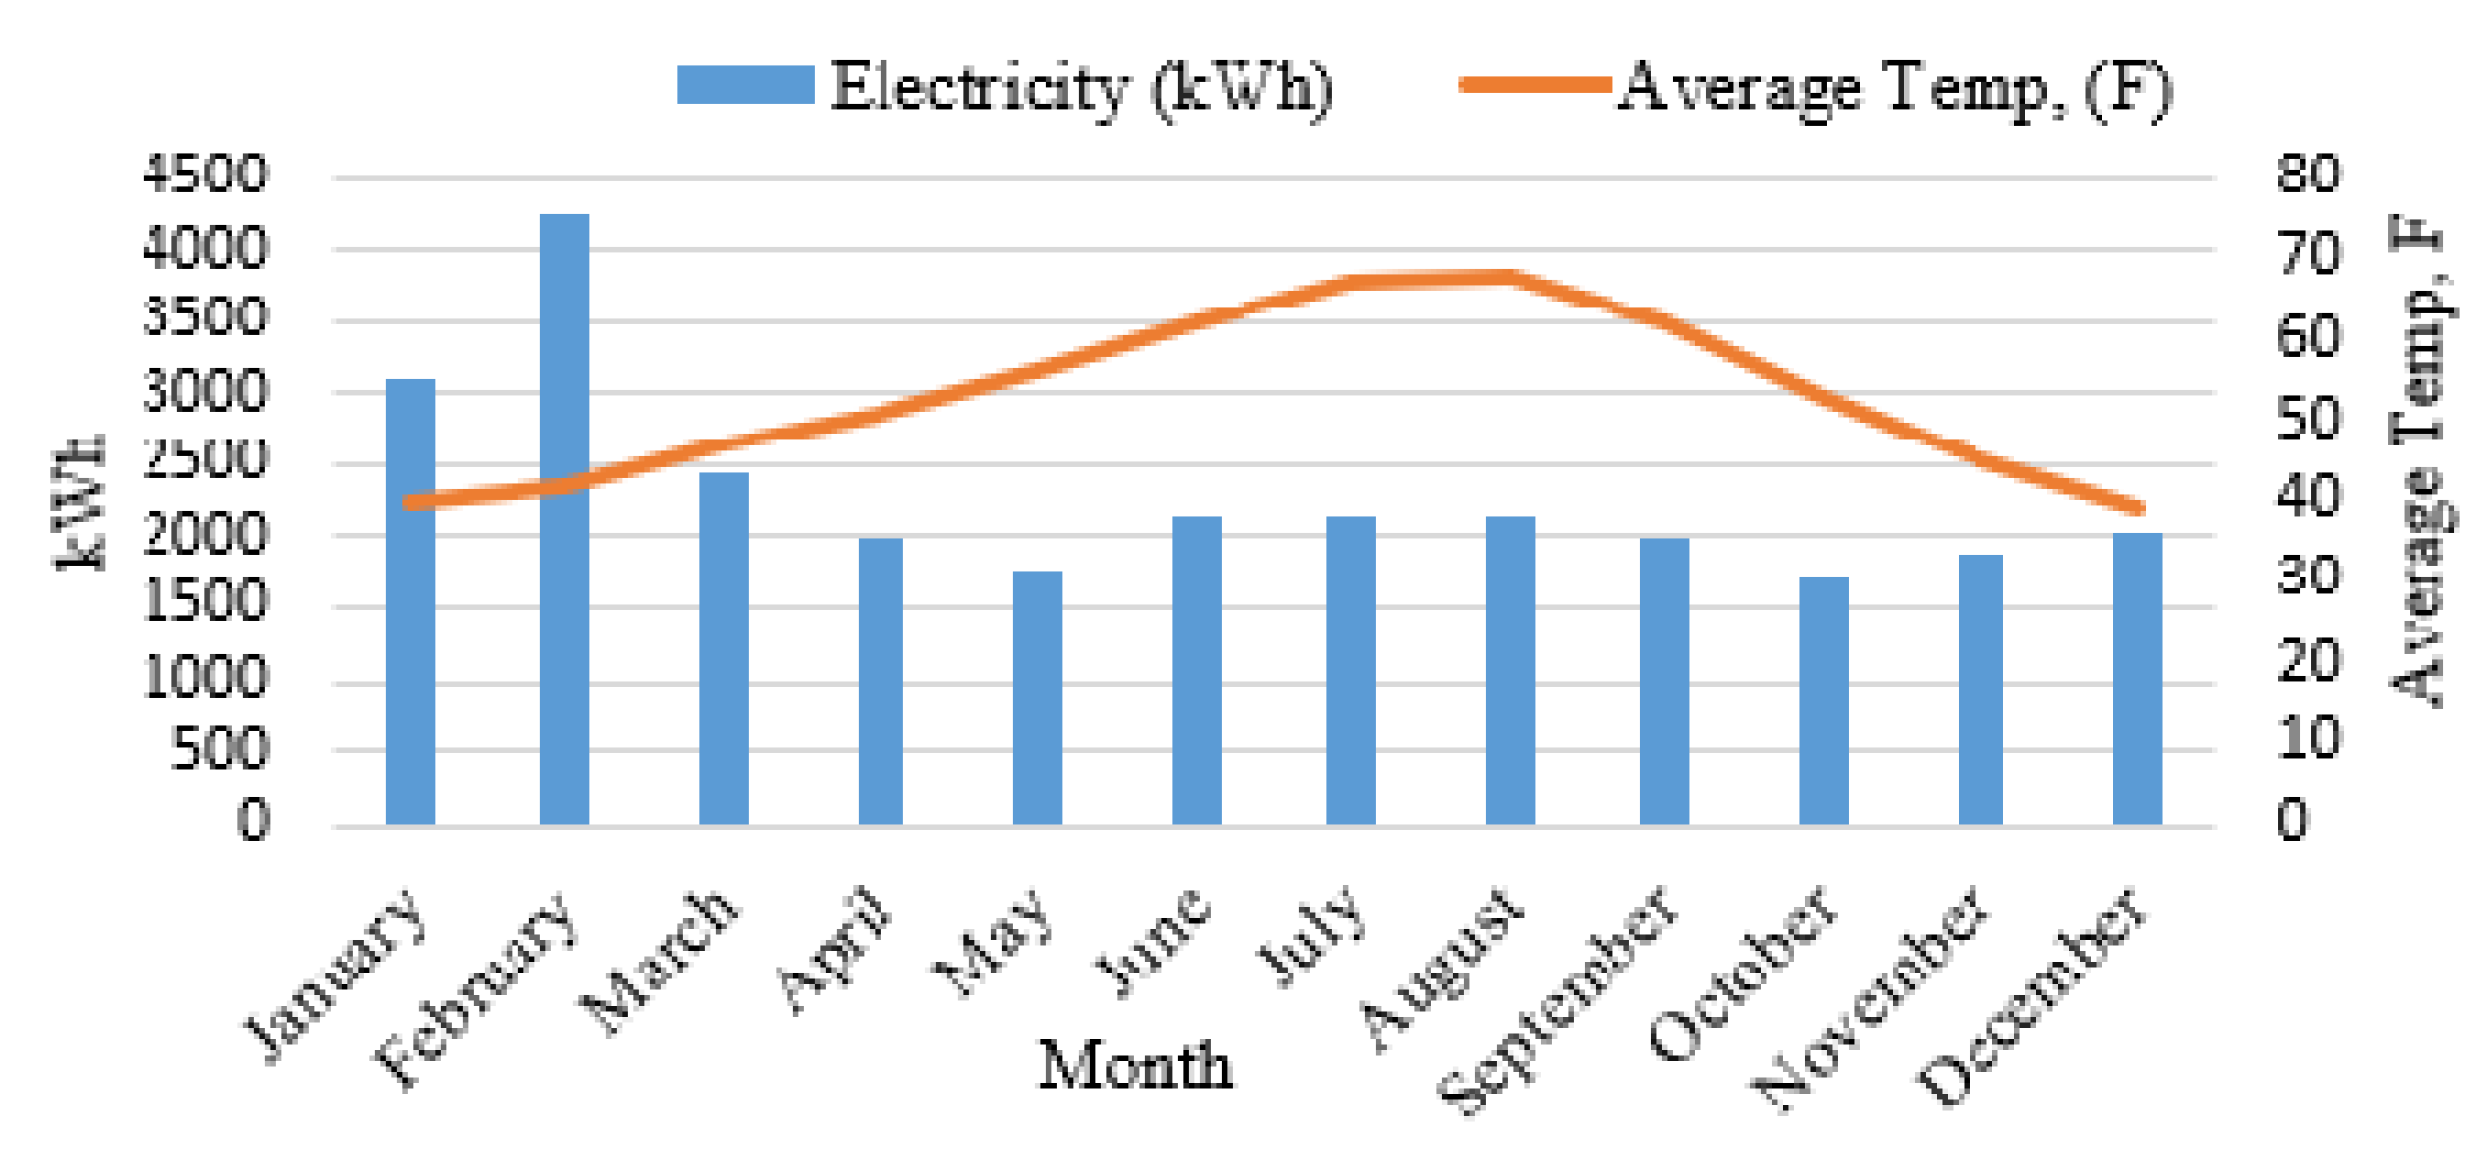
Figure 17.
High energy consumption months for case 6 as visualized with word cloud.

Figure 18.
Monthly electricity use and average temperature for case 6.
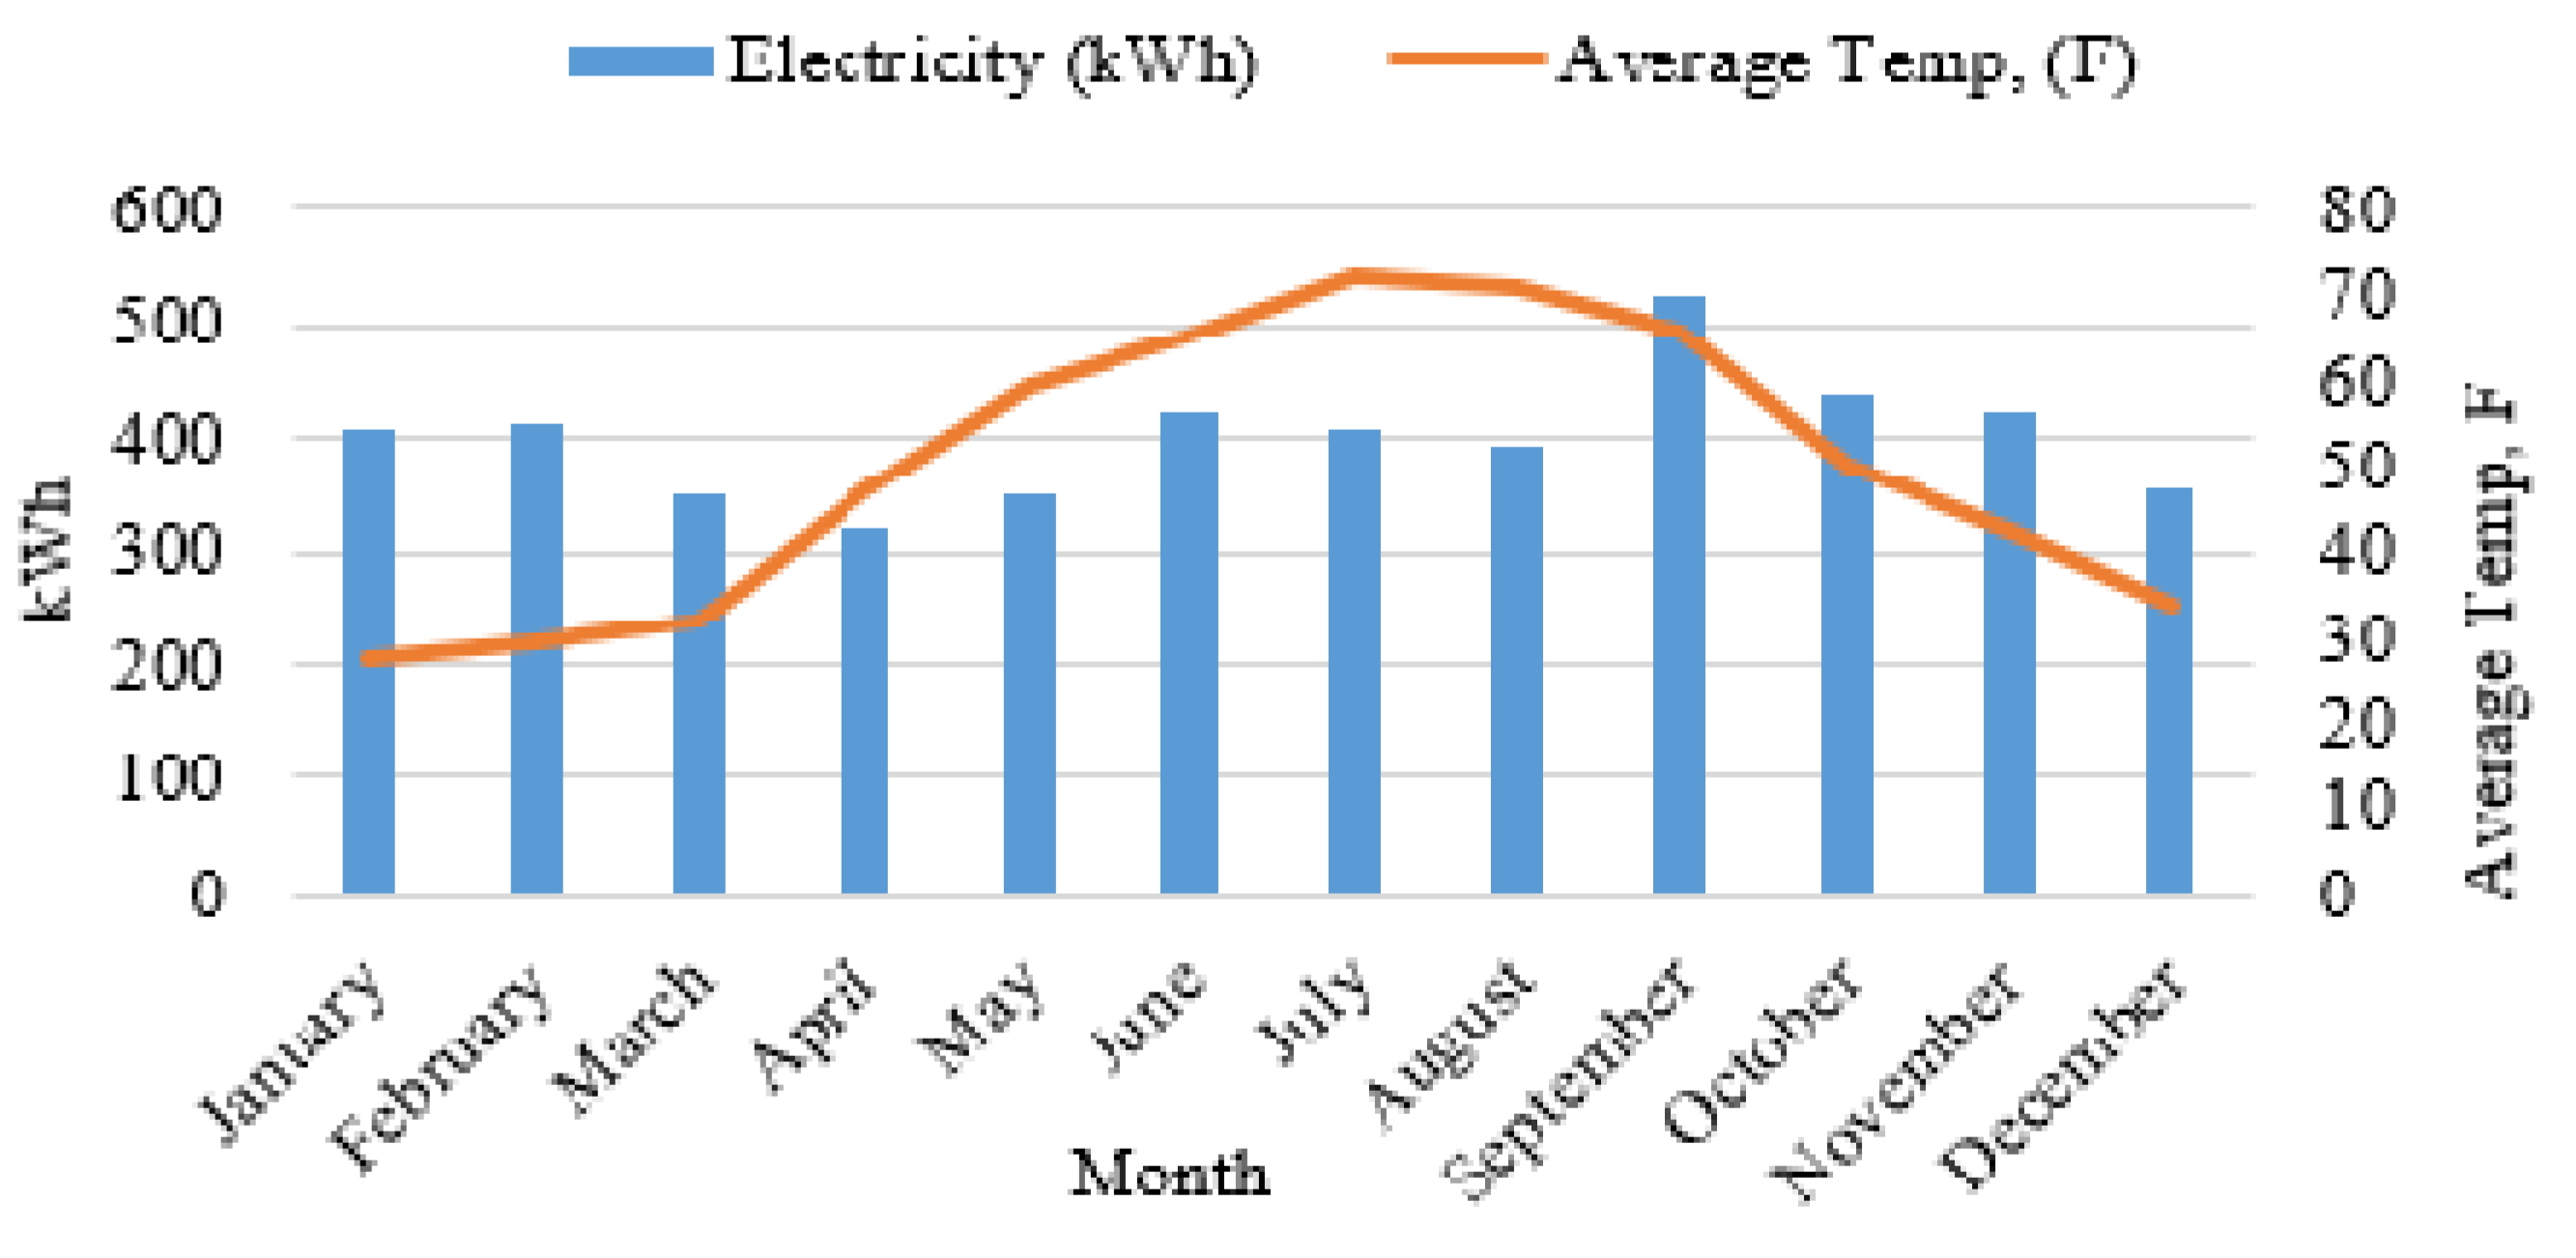
Figure 19.
High energy consumption months for case 7 as visualized with word cloud.

Figure 20.
Monthly electricity use and average temperature for case 7.

Figure 21.
Annual CO2 equivalent per capita by state.
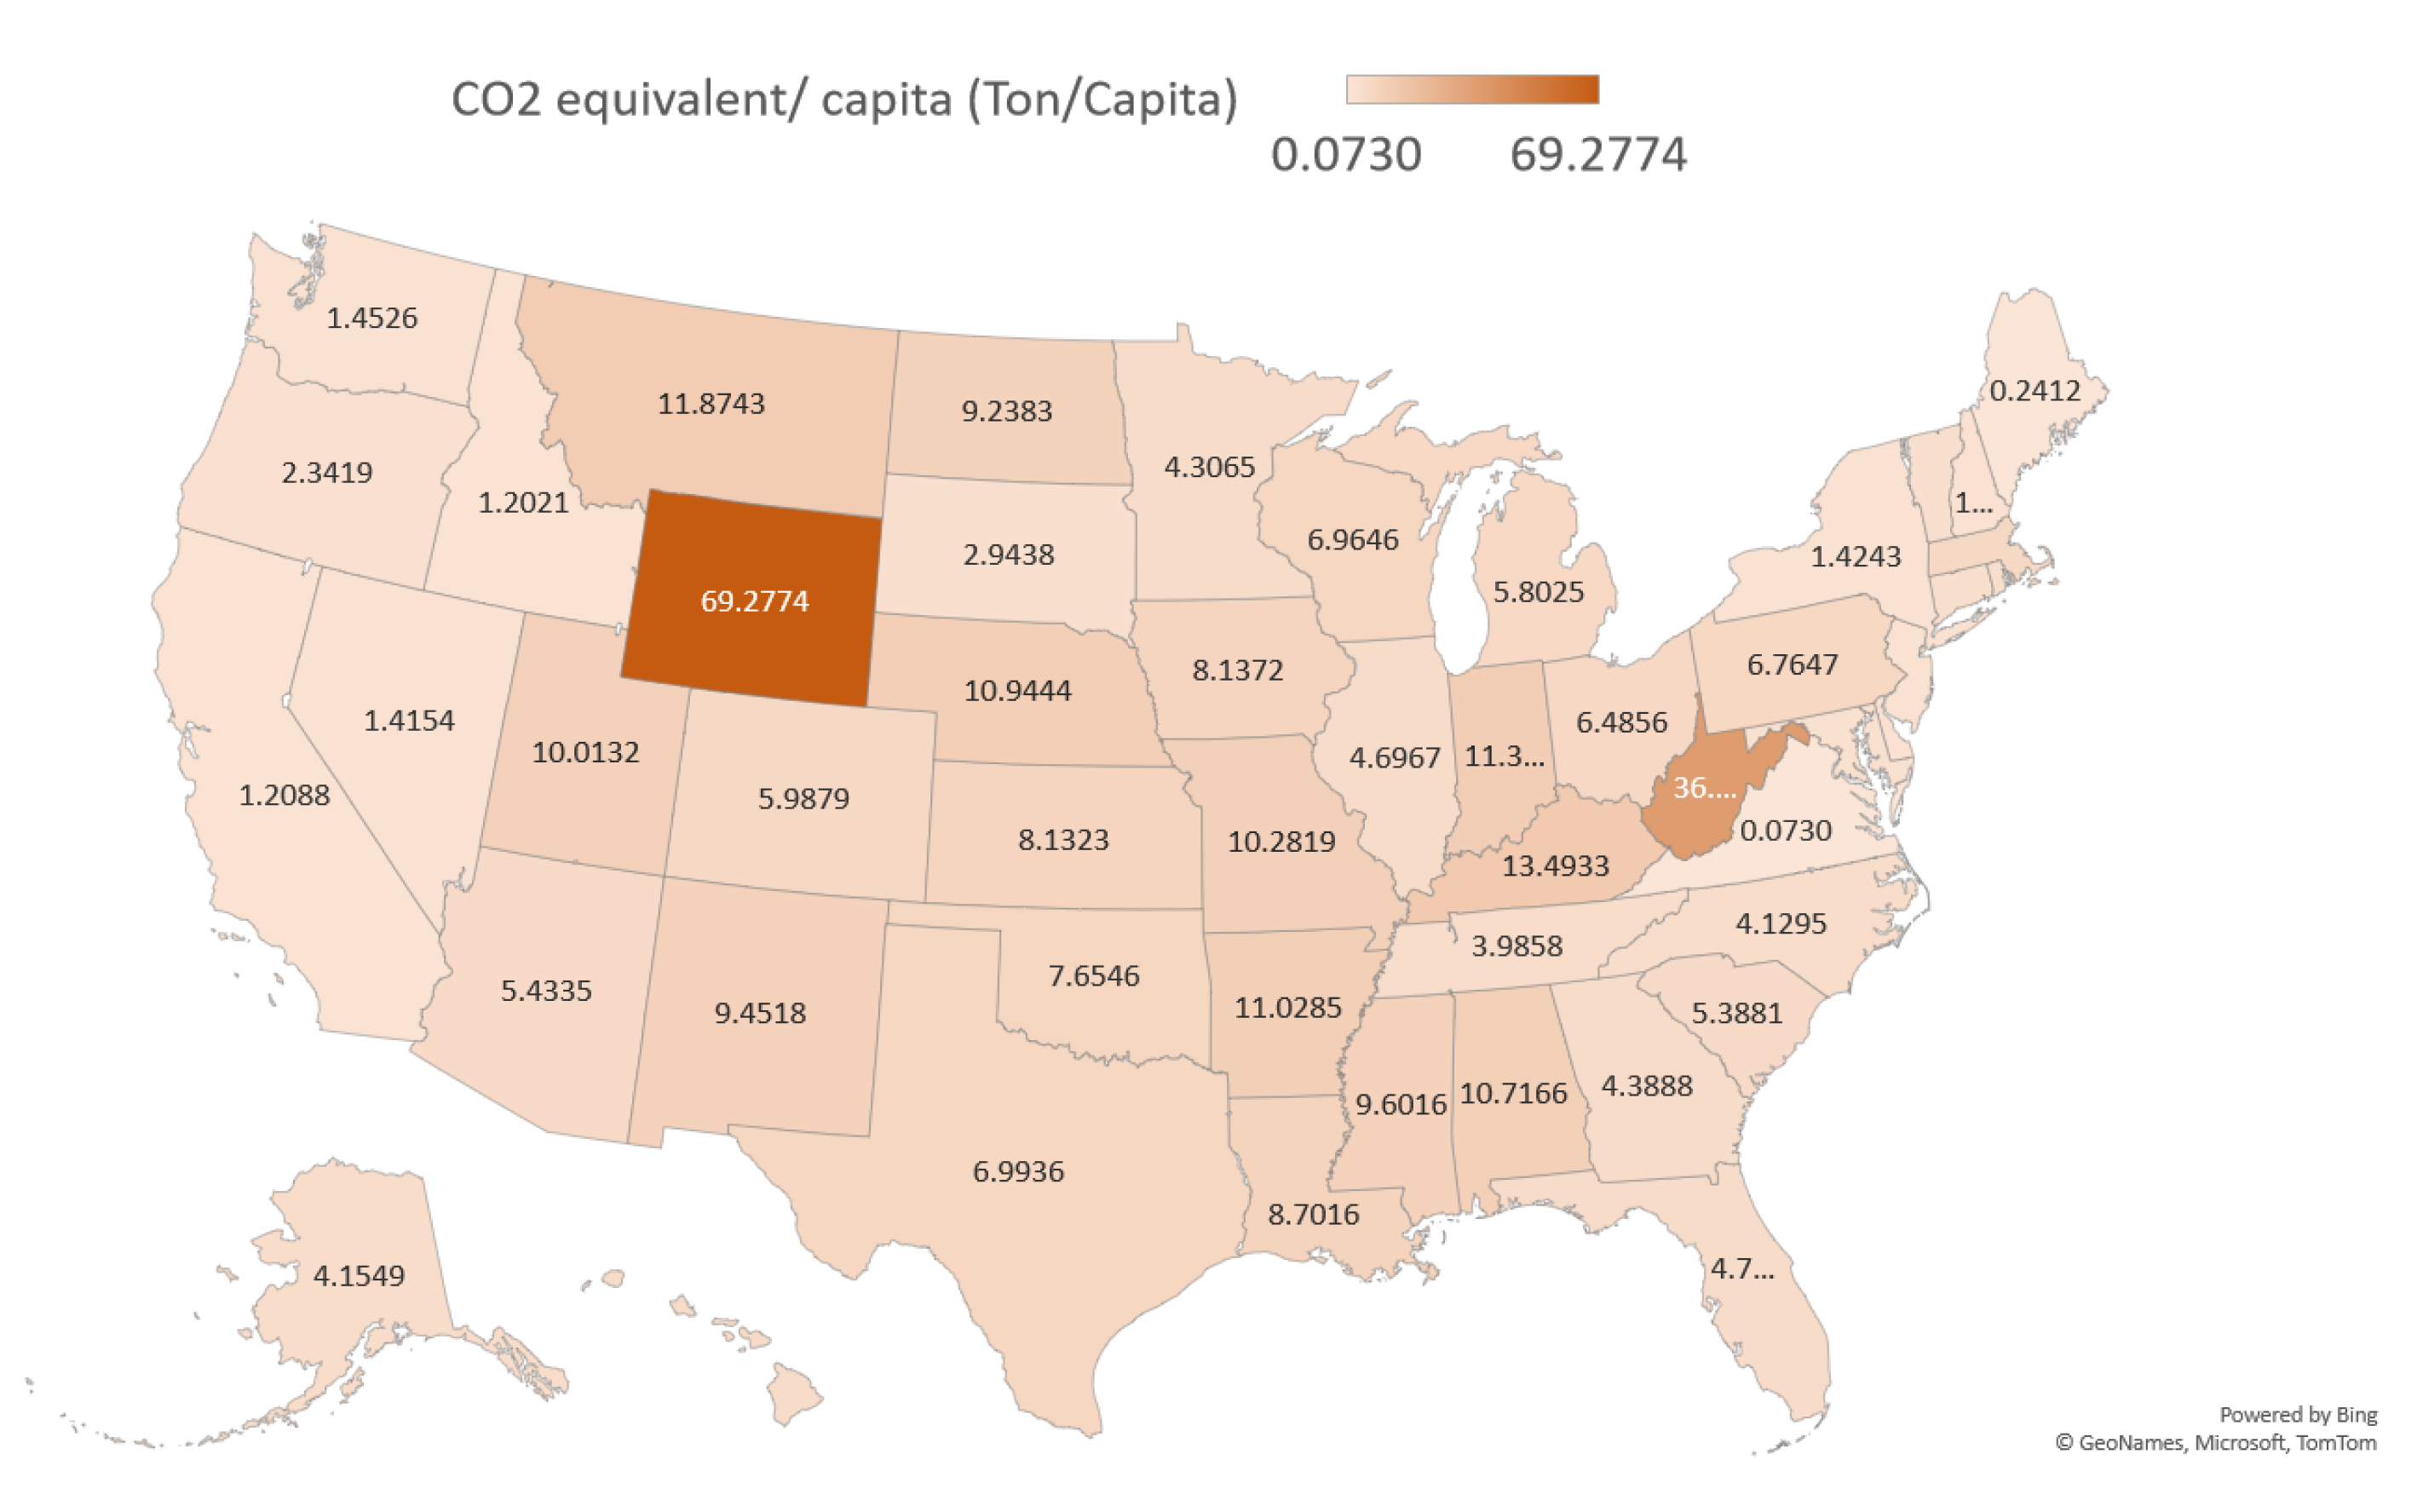
Figure 22.
Annual Tons of CO2 equivalent per million Dollars of GDP by state.
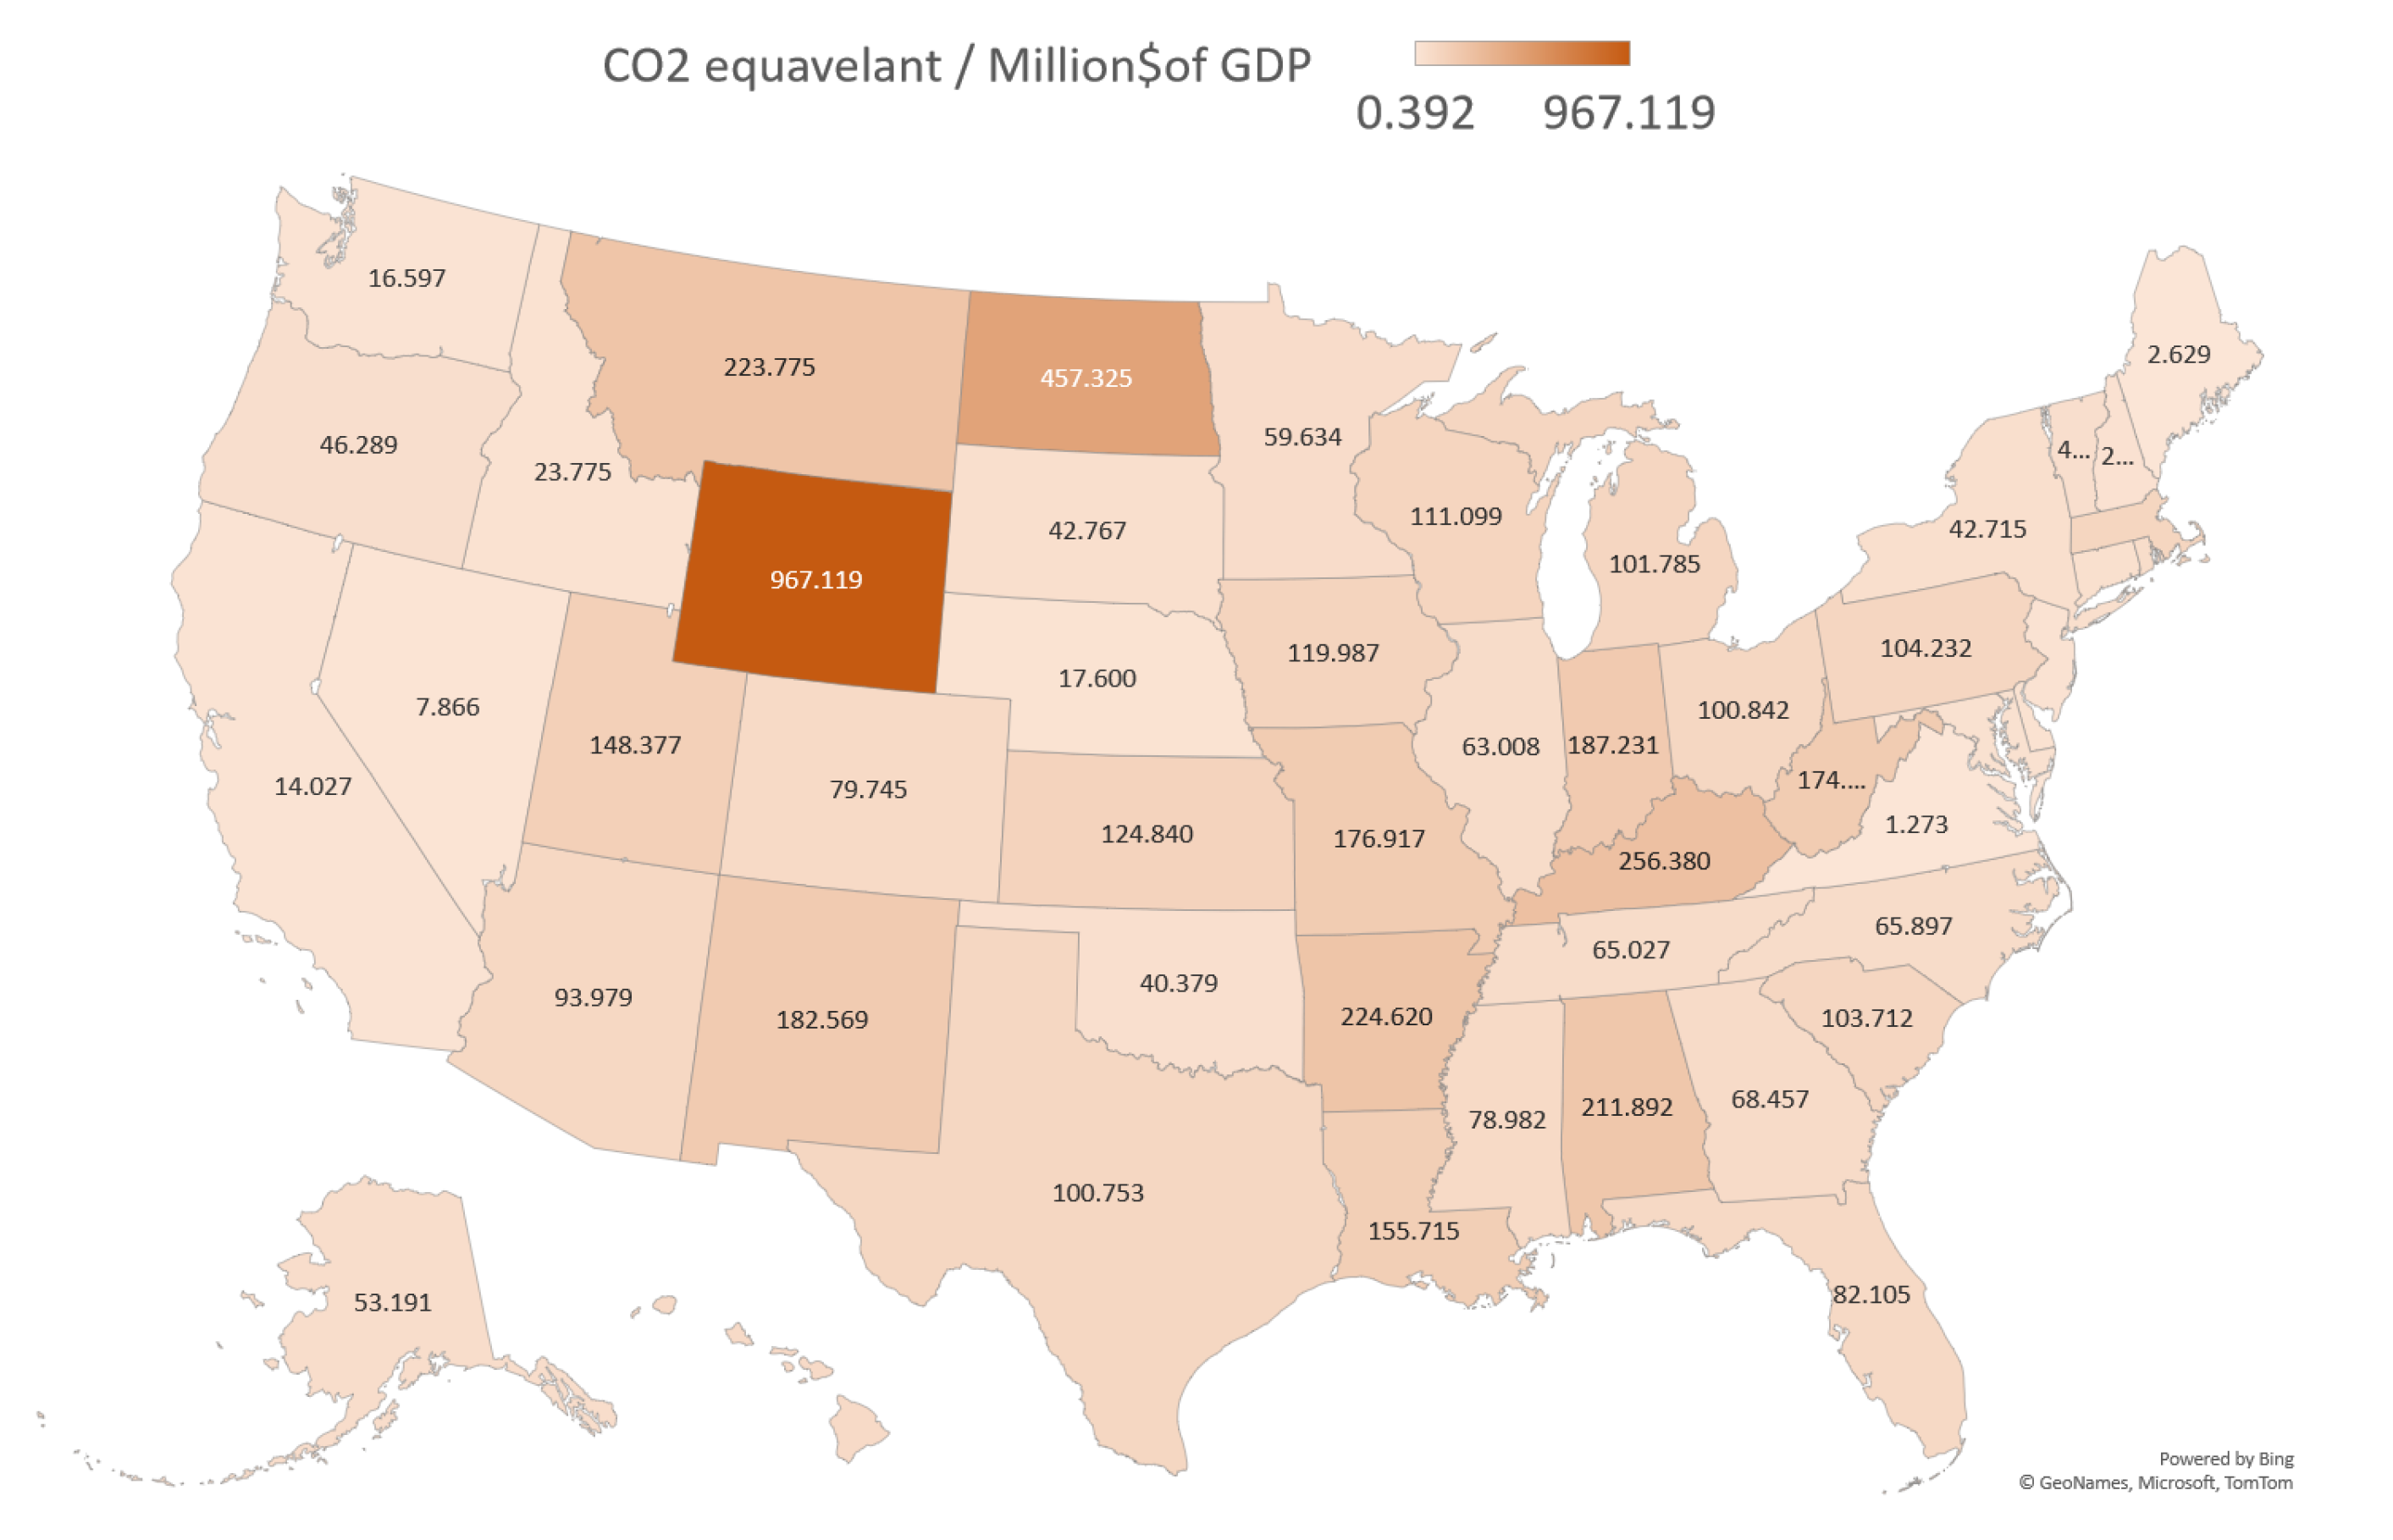

Table 1.
U.S. residential energy vs. total space of homes.
| Year | Trillion Btu | Billion Square foot | Energy intensity kWh/ft2 |
|---|---|---|---|
| 2015 | 20616.594 | 237.40 | 25.451 |
| 2016 | 20177.837 | 239.73 | 24.667 |
| 2017 | 19885.619 | 242.08 | 24.074 |
| 2018 | 21511.62 | 242.46 | 26.002 |
| 2019 | 21076.141 | 244.86 | 25.226 |
| 2020 | 20555.522 | 249.29 | 24.166 |
| 2021 | 20870.848 | 251.74 | 24.297 |
| 2022 | 21792.075 | 254.21 | 25.123 |
Table 2.
Carbon Dioxide Emissions Coefficients by Fuel.
| CO2 Factors | Pounds CO2 Per Unit of Volume or Mass |
Unit | Kilograms CO2 Per Unit of Volume or Mass |
Unit | Pounds CO2 Per Million Btu |
Kilograms CO2 Per Million Btu |
|---|---|---|---|---|---|---|
| Propane | 12.68 | gallon | 5.75 | gallon | 138.63 | 62.88 |
|
Diesel and Home Heating Fuel (Distillate Fuel Oil) |
22.45 | gallon | 10.19 | gallon | 163.45 | 74.14 |
| Kerosene | 21.78 | gallon | 9.88 | gallon | 161.35 | 73.19 |
| Coal (All types) | 3,876.61 | short ton | 1,758.40 | short ton | 211.87 | 96.10 |
| Natural Gas | 120.96 | thousand ft3 | 54.87 | thousand ft3 | 116.65 | 52.91 |
|
Finished Motor Gasoline |
17.86 | gallon | 8.10 | gallon | 148.47 | 67.34 |
| Motor Gasoline | 19.37 | gallon | 8.78 | gallon | 155.77 | 70.66 |
|
Residual Heating Fuel (Businesses only) |
24.78 | gallon | 11.24 | gallon | 165.55 | 75.09 |
Table 3.
Monthly energy consumption for case 1
| Month | kWh | Average Temp, F |
|---|---|---|
| January | 297 | 46 |
| February | 300 | 50 |
| March | 273 | 45 |
| April | 272 | 57 |
| May | 351 | 72 |
| June | 551 | 82 |
| July | 914 | 86 |
| August | 1055 | 85 |
| September | 723 | 78 |
| October | 455 | 66 |
| November | 287 | 56 |
| December | 232 | 48 |
| Total | 5710 |
Table 4.
Monthly energy consumption for case 2.
| Month | Electricity, kWh | Average Temp, F |
|---|---|---|
| January | 4010 | 46 |
| February | 3429 | 47 |
| March | 2604 | 56 |
| April | 2104 | 56 |
| May | 2090 | 67 |
| June | 2300 | 75 |
| July | 2087 | 78 |
| August | 2130 | 83 |
| September | 1525 | 76 |
| October | 1074 | 68 |
| November | 1781 | 57 |
| December | 3092 | 52 |
| Total | 28226 |
Table 5.
Monthly energy consumption for case 3.
| Month | kWh | Average Temp, F |
|---|---|---|
| January | 248 | 53 |
| February | 293 | 54 |
| March | 313 | 56 |
| April | 280 | 60 |
| May | 320 | 64 |
| June | 420 | 68 |
| July | 571 | 72 |
| August | 518 | 74 |
| September | 642 | 72 |
| October | 385 | 65 |
| November | 281 | 58 |
| December | 254 | 52 |
| Total | 4525 |
Table 6.
Monthly energy consumption for case 4.
| Month | Electricity, kWh | Average Temp, F |
|---|---|---|
| January | 1071 | 39 |
| February | 985 | 31 |
| March | 1094 | 37 |
| April | 791 | 49 |
| May | 672 | 58 |
| June | 702 | 70 |
| July | 833 | 78 |
| August | 989 | 81 |
| September | 843 | 76 |
| October | 796 | 70 |
| November | 682 | 58 |
| December | 974 | 46 |
| Total | 10432 |
Table 7.
Monthly energy consumption for case 5.
| Month | kWh | Average Temp, F |
|---|---|---|
| January | 3100 | 40 |
| February | 4233 | 42 |
| March | 2450 | 47 |
| April | 2000 | 51 |
| May | 1767 | 56 |
| June | 2134 | 62 |
| July | 2151 | 67 |
| August | 2131 | 68 |
| September | 1987 | 62 |
| October | 1753 | 53 |
| November | 1878 | 45 |
| December | 2021 | 39 |
| Total | 27605 |
Table 8.
Monthly energy consumption for case 6.
| Month | kWh | Average Temp, F |
|---|---|---|
| January | 410 | 27 |
| February | 412 | 29 |
| March | 347 | 32 |
| April | 322 | 47 |
| May | 347 | 59 |
| June | 422 | 65 |
| July | 408 | 72 |
| August | 391 | 71 |
| September | 527 | 66 |
| October | 437 | 50 |
| November | 420 | 42 |
| December | 353 | 34 |
| Total | 4796 |
Table 9.
Monthly energy consumption for case 7.
| Month | kWh | Average Temp, F |
|---|---|---|
| January | 271 | 31 |
| February | 255 | 29 |
| March | 217 | 34 |
| April | 308 | 47 |
| May | 227 | 50 |
| June | 211 | 63 |
| July | 392 | 73 |
| August | 411 | 74 |
| September | 299 | 70 |
| October | 297 | 63 |
| November | 321 | 50 |
| December | 324 | 39 |
| Total | 3533 |
Table 10.
Summary of results for case studies.
| Case | State | Climate Zone | Annual kWh | Area (ft2) | EI (kWh/ft2) |
|---|---|---|---|---|---|
| 1 | TX | 5 | 5710 | 2200 | 2.60 |
| 2 | GA | 4 | 28226 | 2072 | 13.62 |
| 3 | CA | 4 | 4525 | 1400 | 3.23 |
| 4 | MO | 3 | 10432 | 1090 | 9.57 |
| 5 | OR | 2 | 27605 | 1890 | 14.61 |
| 6 | MA | 2 | 4796 | 1275 | 3.76 |
| 7 | WI | 1 | 3533 | 1110 | 3.18 |
Table 11.
Data from 2020 RECS survey.
| State | Climate | Site electricity consumption | Total site consumption | Area (ft2) | EI (kWh/ft2) | EI (kBtu/ft2) |
|---|---|---|---|---|---|---|
| Zone | per household (kWh) | per household (MMBtu) | per housing unit | |||
| TX | 5 | 13,440 | 66.2 | 1,734 | 7.75 | 38.18 |
| GA | 4 | 13,270 | 73.9 | 1,974 | 6.72 | 37.44 |
| CA | 4 | 6,482 | 53.7 | 1,504 | 4.31 | 35.70 |
| MO | 3 | 11,983 | 88.8 | 2,043 | 5.87 | 43.47 |
| OR | 2 | 11,132 | 67.4 | 1,701 | 6.54 | 39.62 |
| MA | 2 | 7,237 | 87.7 | 1,853 | 3.91 | 47.33 |
| WI | 1 | 8,432 | 91.5 | 2,067 | 4.08 | 44.27 |
Table 12.
Summary of CO2 emissions by state.
| Category | Average | Max | Min | Median |
|---|---|---|---|---|
| State annual CO2equivalent | ||||
| emissions (tons) | 33952317.0 | 206722404.5 | 47248.9 | 28002997.1 |
| Population | 6636105.1 | 39142991.0 | 579483.0 | 4627098.0 |
| GDP (Million Dollars) | 510853.9 | 3373241.0 | 37104.0 | 368611.0 |
| CO2 equivalent (Ton/Capita) | 7.3 | 69.3 | 0.1 | 5.4 |
| CO2 equivalent Ton/ Millions of $ | ||||
| generated by GDP | 108.6 | 967.1 | 0.4 | 75.7 |
| State annual CO2 equivalent | ||||
| total output emission rate (lb./MWh) | 884.4 | 1959.4 | 44.8 | 828.7 |
Disclaimer/Publisher’s Note: The statements, opinions and data contained in all publications are solely those of the individual author(s) and contributor(s) and not of MDPI and/or the editor(s). MDPI and/or the editor(s) disclaim responsibility for any injury to people or property resulting from any ideas, methods, instructions or products referred to in the content. |
© 2024 by the authors. Licensee MDPI, Basel, Switzerland. This article is an open access article distributed under the terms and conditions of the Creative Commons Attribution (CC BY) license (http://creativecommons.org/licenses/by/4.0/).
Copyright: This open access article is published under a Creative Commons CC BY 4.0 license, which permit the free download, distribution, and reuse, provided that the author and preprint are cited in any reuse.


