Submitted:
07 May 2024
Posted:
08 May 2024
Read the latest preprint version here
Abstract
The Pantanal region in the state of Mato Grosso suffers from intensive biomass burning at the dry season. A great volume of anthropogenic emissions affects the ecosystem, damaging the richest fauna and flora internationally recognized. The collect and characterization of natural aerosols is important to accompany the variations in the composition and concentration of these particles, this work determined the total mass concentration of fine inhalable particles, concentration of aerosol compound Black Carbon (BC) and the presence of 25 chemical elements in the samples. Maximum total mass inhalable fine (PM2.5) and BC concentration was, respectively, 83.66 μg m-3 and 4.52 μg m-3, and the median values of both was 36.62 ± 31.69 μg m-3 and 1.83 ± 1.65 μg m-3. The Pb element concentration demonstrated a great maximum value of 25 ng m-3, around twenty-one times bigger than a similar study realized ten years ago in the same area. The results indicate a low correlation between aerosols concentration and environmental parameters, nonetheless, we verify a considerable increase in concentration of PM2.5, BC and chemical elements S, K, Fe, Si and heavy metals compared with previous studies.
Keywords:
aerosol
; AOD
; EDXRF
; biomass burning
; black carbon
1. Introduction
Extreme weather events and climate changes were modifying the stability of global climate quickly [1]. Biomass burning is a significant anthropogenic source of aerosols, the area and the type of vegetation can influence in the composition and concentration of emitted aerosols, the heating of surface by burning process and the floatability of smoke plume makes the particulate matter affect directly the regional air quality and promote climate impacts globally [2]. Other studies in Mato Grosso and Brazil evidenced the effect of environmental parameters in the growth of viral transmission and mortality risk by respiratory diseases[3,4]. Currently, there is a scientific effort in the characterization of aerosols under ambient conditions [5]. Nevertheless, Pantanal of Mato Grosso lacks studies related with physicochemical characterization of aerosols [6].
Brazilian Pantanal has an extension about 140 thousand km2, and are positioned in the Upper Paraguay Bacin in the Middle-West distributed in the states of Mato Grosso (35%) and Mato Grosso do Sul (65%), the weather is seasonal and well defined by a dry season and a wet season. Since 2000 the Pantanal biome is considered Natural Patrimony of Humanity and World Biosphere Reserve by UNESCO, furthermore, the biome is considered the largest floodplain on the planet [7,8]. Despite the recognized importance of ecosystem, the human actions like biomass burning and gold digging affect the Pantanal, promoting contamination by heavy metals, changes in natural landscape and in the air quality [6,9,10]. In the year 2020 a large biomass burning have been recorded, the burned area was equivalent of 5.6 million of soccer fields, more than 25% of Brazilian Pantanal territory was consumed by fire, this year’s fires were the most devastating in the last two decades [11]. O material emitted is composed mainly of carbonaceous compounds, these aerosols it is based on carbon and belongs the fine inhalable particles with less than 2.5 μm of diameter size (PM2.5), at tropical regions these aerosols can contribute equal up 90% of total mass [2]. The carbon present in the aerosols is not homogenous, this means that exist a variety of carbon species. The Black Carbon (BC) and the Organic Carbon (OC) are compounds of these aerosols and must be present in the same sample [12,13].
Although a rise number of emissions sources makes the aerosol concentration increase, Earth’s atmosphere uses deposit mechanisms to retire aerosols and decrease it concentration [14]. During the dry season, between April and September, the dry deposition is the main responsible to retire aerosols from atmosphere, through mechanisms like turbulent transference, impaction, interception by vegetation and fall of aerosols by gravidity in soil [15]. During the wet season, which spans from October to March, the trend is a low aerosol concentration. This is because the processes of wet deposition, such as the incorporation of aerosols into raindrops and droplets, aid in removing aerosols from the atmosphere [14]. The larges fires that achieve Pantanal in the year’s 2020 affected areas that never was burned before, changing the weather like a unique shape [11], this episode motive us to study the changes in physicochemical characteristics of aerosols. Therefore, we propose a work to characterize the aerosols in this region with few studies in this way, the samples were collected in Pantanal of Mato Grosso during the dry season in the year’s 2022, and results compared with previous studies realized in the same site and other Brazilian regions.
2. Materials and Methods
2.1. Study Site and Sampling
The atmospheric aerosols samples were collected in the Advanced Pantanal Research Base of the Federal University of Mato Grosso (BAPP - UFMT). Research site placed at in the SESC Private Reserve of Natural Heritage (PRNH SESC), 160 km south far from state capital Cuiabá, in the Park SESC Pantanal – Baía das Pedras (16º29’56’’ S, 56º24’47’’ W) in the city of Poconé (Figure 1). Pantanal of Mato Grosso is located in the north of biome, the weather is classified Humid Tropical with rainy summers and dry winters, Aw into Köppen-Geiger classification [16]. Climatological factors make the Pantanal a rare ecosystem, such as the plain relief and the seasonal dynamics of rain, corroborate to flood part of biome [6]. From the analysis of time series between 1981 and 2018, considering only the cities within Pantanal of Mato Grosso, the median annual precipitation is around 1360 mm [17].
The research group Física Aplicada, Detectores e Automação (FADA) of Programa de Pós-Graduação em Física Ambiental do Universidade Federal do Mato Grosso (PGFA - UFMT) operate the sample collect. Aerosol samples can be made by mechanisms of impaction, interception and diffusion to deposit the particulate matter in filters. This mechanism depends on the characteristics of air flux, filter pore diameter and particle sizes, these methods are consolidated to sampling aerosols [18]. Sampling campaigns of this work are based on inertial impaction (Figure 2) it was realized through a Thermo Scientific collector, in Whatman filters of polytetrafluoroethylene (PTFE) with 47 mm of diameter and 1 μm of porosity. Initial flux adjusted at 17 L min-1, as stipulated at ISO 7708:1995 to aerosols sampling [19]. Additionally, an automated system connected to the vacuum pump was programmed to shut off if the flow rate dropped below 16 L min-1.
Each filter was left sampling during seven days or until the shut off system by low pump flow rate. The collection campaign occurs between 25 August 2022 and 14 October 2022, about two months, 7 periods had aerosols concentration and composition determined. We classified the samples collected by periods, being rom 25 August to 1st September period 1, from 2 September to 8 September period 2, from 9 September to 15 September period 3, from 16 September to 22 from September period 4, from September 23 to September 30 period 5, from October 1 to October 7 period 6 and from October 8 to October 14 period 7. This study collected samples during the dry season of Pantanal of Mato Grosso, historically marked by few rains and high concentrations of aerosols with significant biomass burning emissions [20].
2.2. Measurements and Environmental Parameters
Characterization of collected aerosols was realized in the Laboratório de Física Atmosférica da Universidade de São Paulo (LFA - USP). Gravimetry determined the accumulation mass in each sample we used an electronic scale Mettler Toledo model XP6U with nominal reading of 1 μg, the mass accumulate in white filter was discounted of other filters. The detection limit of aerosols is 0.3 μg m-3 and the precision estimated at 10% [21].
To determine the concentration of BC, its optical proprieties was used through a reflectometer of Diffusion System model M43D with higher photoptic response efficiency at 550 nm and maximum emission at 650 nm. White filter fixed the standard of total reflection of light (100%), to calculate the equivalent BC concentration we used [12] equation (1), as shown:
BC = [(88.3 – (77.5 * log R)) + (16.7 ∗ (log R)2)] ∗ A/V
Where R is the measured reflection, A is the filter area (in this case, 13.85 cm2), V is the volume of air in m3 and BC concentration is given in μg m-3.
The chemical concentration of aerosols uses Energy Dispersive X-ray Fluorescence (EDXRF) analytical technique, on the device of PANalytical model Epsilon 5, having as main target the scandium/tungsten (Sc/W) anode. Analyzes determined the concentration of 25 chemical elements (Na, Mg, Al, Si, P, S, Cl, K, Ca, Ti, V, Cr, Mn, Fe, Ni, Cu, Zn, As, Se, Br, Rb, Sr, Cd, Sb e Pb) in the samples.
The use of specific mass of few elements calculates the mass of Dust in the samples, the calculation presented by [22] can be seen at equation:
Dust = 1.16*(1.90Al+2.15Si+1.41Ca+1.67Ti+2.09Fe)
To assist in the comprehension of variability in aerosols concentration, were utilized micrometeorological data referent to relative humidity (RH), accumulate rain (AR), radiation balance (Rn), air temperature (AT) and direction and intensity of wind. The data of environmental parameters was acquired by sensors installed at a tower above 20 m of soil, localized at BAPP – UFMT. Another data referent a fire outbreaks (FO) and the sum of fire radiative power (FRP), obtained through online platform BDQueimadas, available at (https://queimadas.dgi.inpe.br/queimadas/bdqueimadas) database managed by Instituto Nacional de Pesquisas Espaciais (INPE). To each period the filters used was South America as continent, Brazil as country, Mato Grosso as state, AQUA_M-T like reference satellite and Pantanal as biome, to limit the region only cities of Mato Grosso belonging to Pantanal was considered.
We collected data from aerosols remote sensing to descript Aerosol Optical Deep (AOD), to compare with the concentration of PM2.5 determined by characterization. The AOD data is measured by a solar photometer CIMEL of monitoring network AEtosol RObotic NETwork (AERONET) and represents the quantity of aerosols optically active in the vertical column in the Earth’s atmosphere with determined wavelength [23]. Thus, we analyzed the available data in wavelength 500 nm of total AOD (AODtotal), AOD fine mode (AODfine) and AOD course mode (AODcourse) both products from version 3.0 and processing lvl 1.5 of CUIABÁ-MIRANDA site, localized around 90 km of BAPP - UFMT.
We apply statistics test to data to assess the relation between PM2.5 and BC concentration concomitant to micrometeorological parameters and aerosols remote sensing. The Shapiro-Wilk Normality Test accused a non-parametric distribution, therefore, opted to perform a Spearman Correlation Test to determine the degree of association between the variables. The coefficient of Spearman correlation (ρ) varies from -1 to 1 and indicate the force and direction of relation between two parameters, the intervals defined by Cohen (1988) consider a weak correlation to |0.1| < ρ ≤ |0.3|, moderate to |0.3| < ρ ≤ |0.5| and strong to |0.5| < ρ ≤ |1.0| [24].
3. Results
3.1. Aerosol Concentration and Composition
Accumulate mass average of samples was 1374.3 μg, during the initial periods more mass was accumulated and nearest the rain season accumulate mass decreases. The total mass concentration of PM2.5 and BC compound determined by gravimetry, and optical reflectance (Figure 3) presents a great variability. To sampling period, the variation on concentration usually is associate to natural factors like wind and humidity deposition caused by rains, as well anthropogenic factors such as biomass burning [14]. The average of PM2.5 concentration during all period was 36.62 ± 31.69 μg m-3 (Table 1). In another research realized by [6] at the same site, with identical collecting and characterization equipment, from 2012 to 2013, the average value of concentration to dry season was 8.66 μg m-3, wherefore, over the ten years between the studies the average concentration growth significantly. Maximum value of PM2.5 concentration determined by other study in the same site and season [6] was 18.2 μg m-3, while in this work the maximum was 83.66 μg m-3 an increase greater than four and a half times. Regarding the BC concentration, this work the maximum value was 4.52 μg m-3 and at [6] work, it was 1.68 μg m-3. The comparison of two results indicates a significant increase in the concentration of aerosols in the Pantanal wetland region.
Brazilian territory has a region called arc of deforestation (DOMINGUES and BERMANN, 2012) a severe number of biomass burnings affects it, promoting a large volume of emission that modify the atmosphere of these places. The study of Maenhaut et al. (2002) realized at city of Alta Floresta, in the north of Mato Grosso state, the PM2.5 concentration stayed between 20 - 200 μg m-3 during dry season, with average value of 47 μg m-3. In Rondônia, during dry season, the work of [21] measured the maximum of PM2.5 concentration as 250 μg m-3, while the average was 66.9 μg m-3. Therefore, the concentration of PM2.5 determined in this work at BAPP - UFMT remained below other regions that belong to the arc of deforestation and close to the Amazon.
The concentrations of BC remained less than 1 μg m-3 to four periods (1, 3, 4 and 7), despite that, the average concentration was 1.83 ± 1.65 μg m-3. The peaks in the concentration match with periods of higher total mass concentration, it occurs because the carbonaceous aerosols belong predominantly to PM2.5 [2]. In the study of [6], [25] and [21] the average concentration of BC on the dry season was, respectively, 0.76, 7.7 e 3.6 μg m-3. In this sense, the BC concentration exhibited an increase of 240% in the Pantanal, although it remains lower compared to areas in the Amazon and its vicinity.
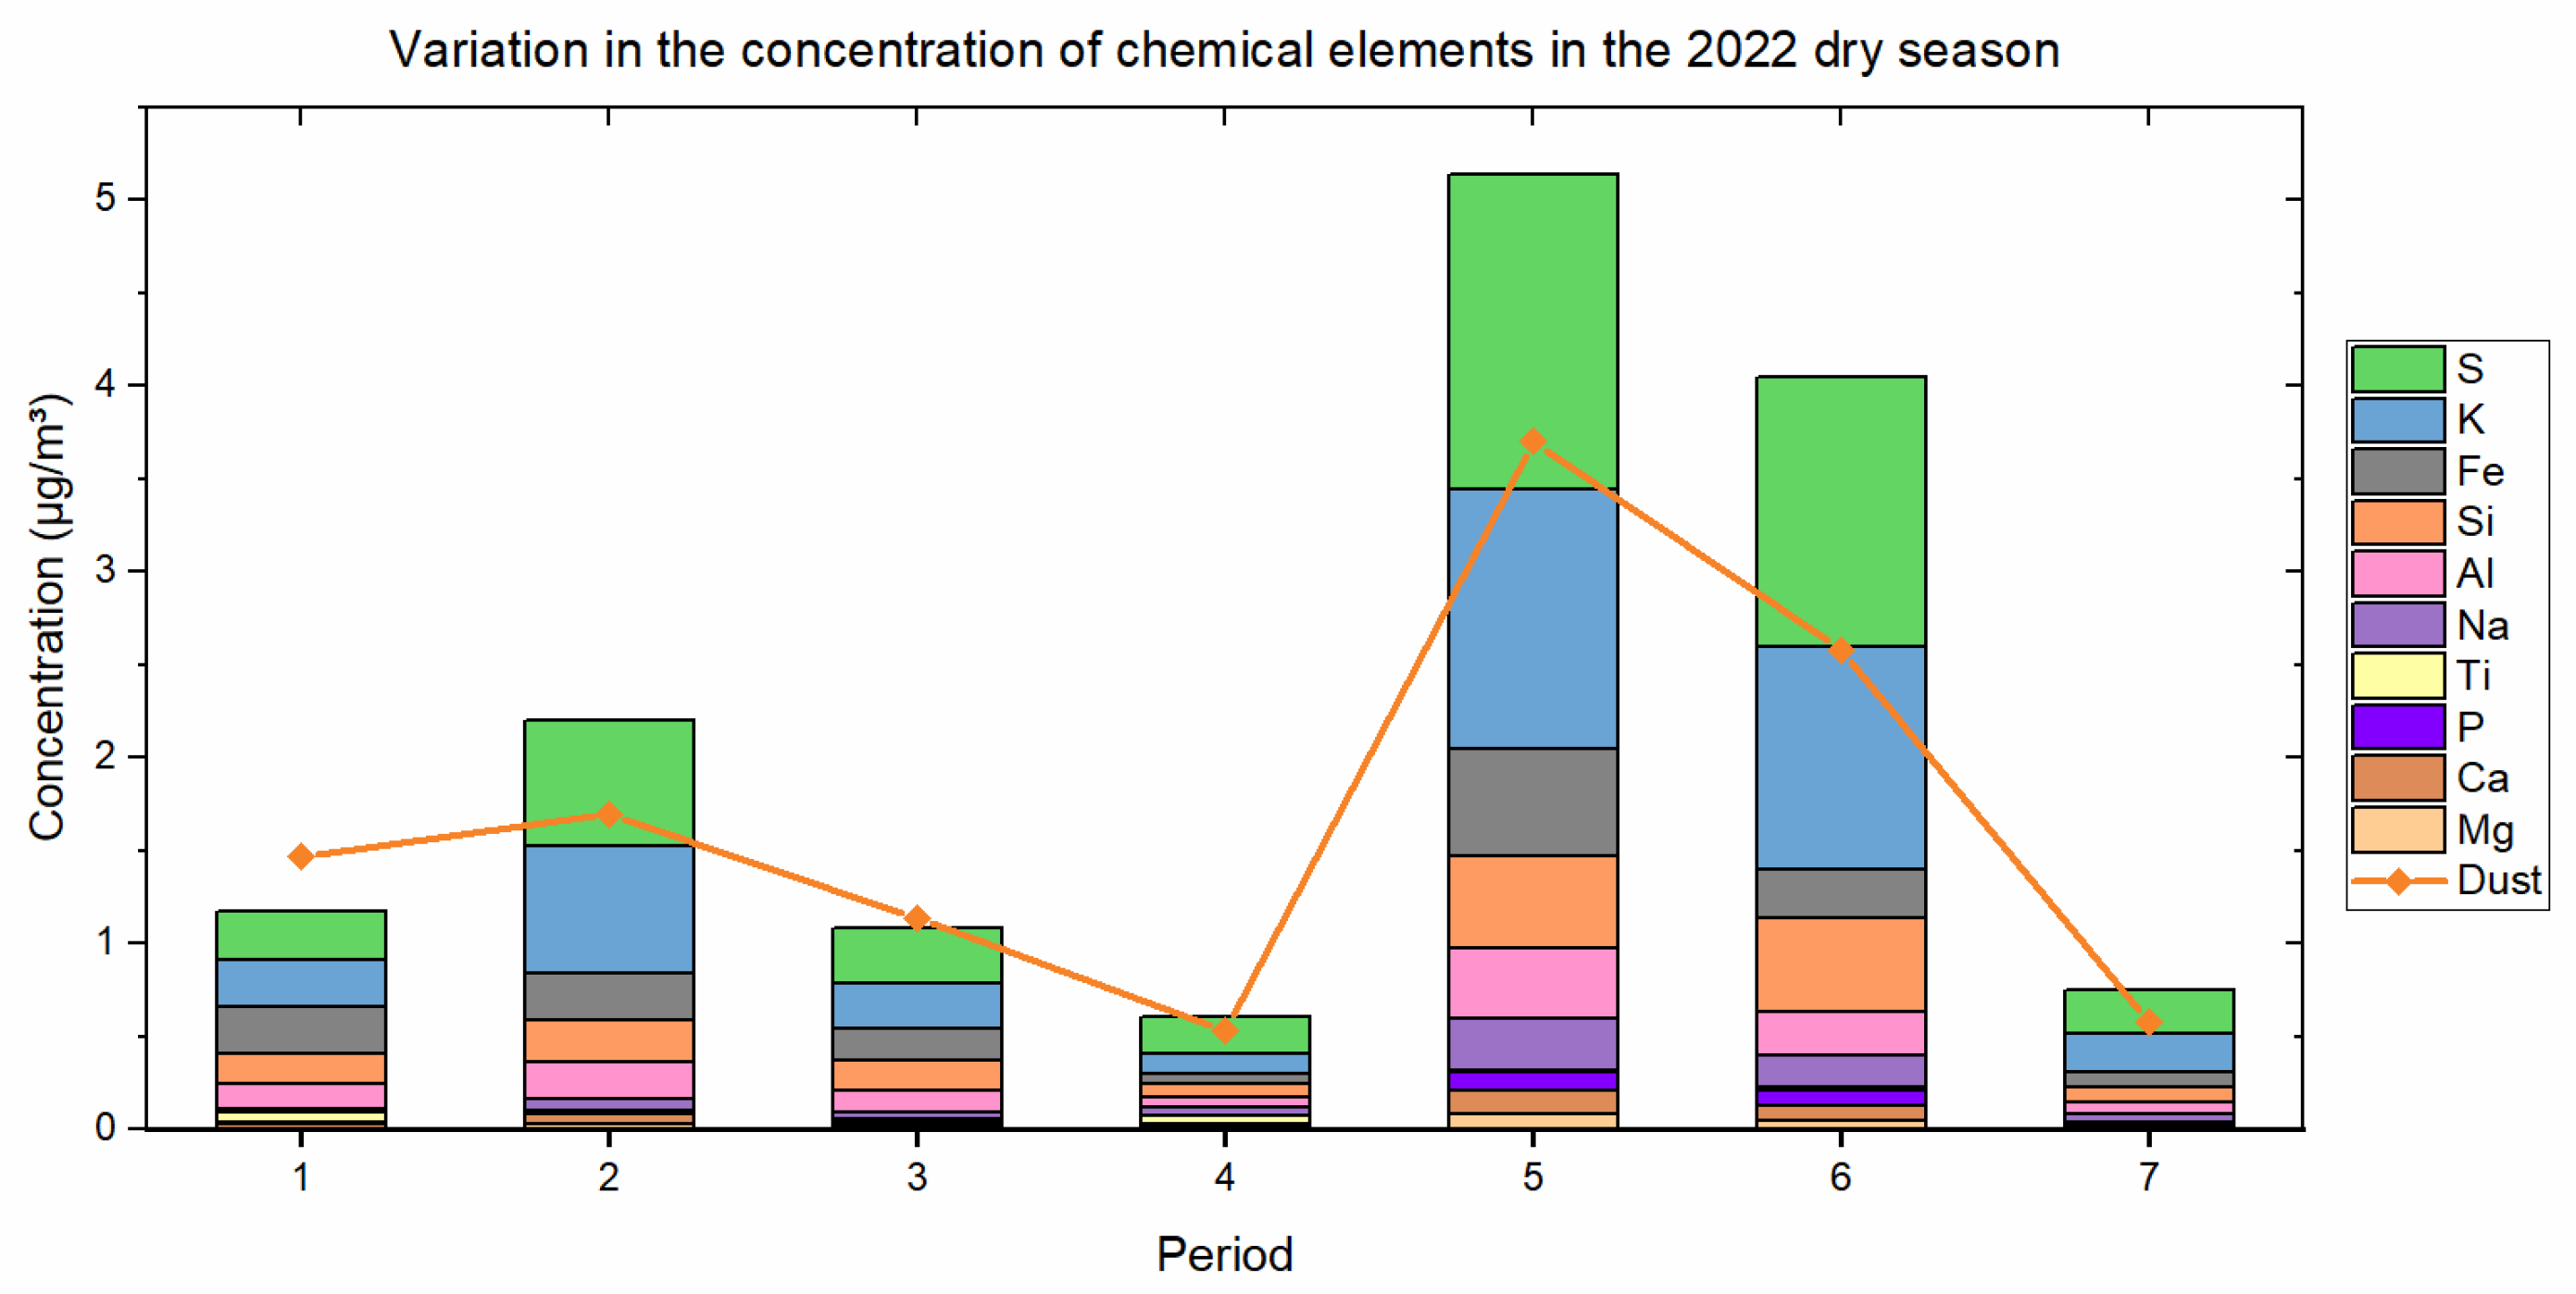
Chemical elements with higher concentration were S, K, Fe and Si, comparing the concentration of these elements with the results of [6], there are a significant increase. Regarding the maximum value, elements Fe and Si showed close concentration, nevertheless, the maximum concentration of S and K exhibited value three times higher. Due to their toxicity and harmful to health the heavy metals Pb and Cd stand out [26], it averages was, respectively, 4.28 e 8.56 ng m-3. In the case of Pb the maximum concentration reaches 24.93 ng m-3, this peak of concentration occurs at period 5, a value six times higher than the average concentration of this element (Table 1). The presence of Pb can be related with anthropic factors, above all activities of mining that contaminate the soil with heavy metals and increase the contaminated soil suspension [26]. Compared to the study by [6] the concentration of Pb in PM2.5 during dry season demonstrated a great average increase, it could be related with the rise of anthropogenic influence in the region of north Pantanal. The periods with high variation on elementary concentration were 5 and 6 followed by period 2, the remaining maintain the concentration of PM2.5 below 2 μg m-3 with negligible variation in elemental concentration. The results indicate a change in the composition of PM2.5 in the Pantanal region, it is not possible to attribute this change to a direct factor but considering the elements with greatest variation in the period of ten years, human activities may be responsible for this alteration.
The dust compound, calculated from the concentration of Al, Si, Ca, Ti and Fe elements (Equation 2), is the main constituent of natural atmospheric aerosols. Annually the Amazon receives a substantial load of dust from the African continent, which carries tons across the Pacific Ocean [27]. In the Pantanal, the uses of soil by agricultural activities, mining, and vehicular traffic are responsible for the suspension of dust, which, depending on the soil composition, can pose health risks [6,9]. This work calculated the maximum dust concentration in 3.7 μg m-3, while in the study by [12] during dry season at Amazon Tall Tower Observatory (ATTO) the maximum concentration was 1.4 μg m-3, it reinforces that areas with more human activities promote a greater soil suspension.
Figure 4.
Temporal serie of mainly chemical elements concentration in the BAPP – UFMT aerosols samples.
Figure 4.
Temporal serie of mainly chemical elements concentration in the BAPP – UFMT aerosols samples.
The adimensional value of AOD is a parameter that indirectly indicate the quantity of aerosols and evaluate how it change over a long period of time (Figure 5). The AOD at 500 nm is usefull to analyze the particulate matter emitted from biomass burning, once this wavelength has a strong interaction with BC [28], it is the reason, the AODfine represents the greater part of AODtotal at 500 nm (Figure 5 (A)). The values stay above 0.4 at five initial periods to AODtotal and period three registered the higher average of AODfine being of 0.93. We reinforce that AODfine were linked with quantity of atmospheric aerosols there is a difference between the measure of PM2.5 concentration determined by filters, this discrepancy could be associated with the distance of the two sites and potential differences in the atmospheric conditions encountered by each sample. In the period 4 exist a cohesion between increase of AR and decrease of PM2.5 and BC concentration, it indicates the acting of wet deposition.
The FO are a recurrent problem at Mato Grosso state, due the environmental impact and health damage it could cause [9]. During the dry season, the burnings are constants (Figure 6), the wind acts as a dissipator of aerosols that could cross long distances, the FRP index could be used to estimate the size and intensity of wildfires.
The period one got the higher value to FRP reaching 16711 W, nervertheless, the distance of BAPP - UFMT and FO (Figure 6), wind direction (Figure 7) and concentration of PM2.5 (Figure 3) suggest a low influence of burnings at collected aerosols at first period. The greatest peaks of PM2.5 occurs at period two and five, with the value of FRP 3561 and 8606 W, respectively, considering the position of FO and wind velocity and direction, the samples collected in these periods may have been directly influenced by regional wildfires. Furthermore, the period five shown the highest number of FO (Figure 6) and at the same time the maximum concentration of dust of 3.7 μg m-3 (Figure 3), highest concentration of chemical elements, including, the maximum concentration of Pb of 25 ng m-3 of collecting campaign.
To verify the correlation between the variables this work uses the Spearman test, the results are available at Table 2. Although the concentrations of BC and AODfine 500 nm are linked to biomass burning, there is no significant correlation between the two, in general, a greater number of samples could provide better statistical analyzes. The variables AODtotal, AODfine and AODcourse represents strong correlation with RH, the AT demonstrate a strong correlation with AODcourse and AR, and likewise, Rn had a strong correlation with BC. Nonetheless, the p-value were above 0.05 to these variables with high correlation coefficient, indicating any significant statistic. The PM2.5 and BC concentration demonstrate a correlation coefficient of 0.929 and p-value < 0.05, indicating in a strong, positive and significant correlation between the variables. Another significant correlation encountered were although AR and AODcourse with coefficient -0.852, confirming a strong and inverse correlation.
4. Conclusions
At this study the concentrations of PM2.5 total mass and of the compound BC was determined by gravimetry analyzes and optical reflectance. It presents a great variability between the seven periods sampled. To year 2022 dry season, the average concentration of PM2.5 were 36.62 ± 31.69 μg m-3 as the compound BC presents an average concentration of 1.83 ± 1.65 μg m-3. These results when compared with measurements realized one decade later in the same study site and in the dry season as well indicate an increase of 422% in the average concentration of PM2.5 and 240% in the average concentration of BC compound. The greatest average elementary concentration of PM2.5 and dust concentration was during period five follow by period six and two. The elements with highest concentration were S, K, Fe and Si being 688.32 ± 627.43 ng m-3, 582.71 ± 524.06 ng m-3, 238.28 ± 172.63 ng m-3, 243.52 ± 181.99 ng m-3, respectively, and comparing with registers of the same season and site one decade ago it shows a significant increase. Furthermore, the results indicate a significant increase of heavy metals in the composition of aerosols we highlight Pb average concentration compared with other study. The investigating of relations between average values by period of BC and PM2.5 concentration and environmental parameters pointed a strong and significant correlation between PM2.5 and BC compound with correlation coefficient 0.929, and in the relationship between AR and AODcourse with correlation coefficient -0.852, there is no other interesting relation between other variables. The results, both for the elemental composition and the BC component in the interval of ten years, indicate a change in the regional dynamics of Pantanal. We suspect that the increasing of anthropic activities in the biome in the last decade are responsible for this alteration in the atmospheric aerosol concentration and composition of the Mato Grosso Pantanal and we expect to explore better this question in a future study.
Author Contributions
Conceptualization, (L.C.R.), (J.B.M.) and (F.C.V.); Methodology, (L.C.R.) and (T.C.B.); software, (T.C.B.) and (J.B.M.); Validation, (F.C.V.), (R.d.S.P.) and (A.M.d.S.L.); Investigation, (L.C.R.), (F.G.M.), (J.B.M.) and (F.C.V.); Resources, (J.B.M.) and (L.F.A.C.); Data curation, (L.C.R.) and (F.G.M.); writing—original draft preparation, (L.C.R.) and (T.C.B.); writing—review and editing, (N.N.d.O.), (F.G.M.), (A.M.d.S.L.), (L.F.A.C.) and (F.C.V.). All authors have read and agreed to the published version of the manuscript.
Funding
The research was funded by Coordenação de Aperfeiçoamento de Pessoal de Nível Superior (CAPES) the authors thanks by the concession of research grant processes (88887.625975/2021-00 and 23108.0414102/2021-02).
Data Availability Statement
The AERONET website provides data analysis and dissemination tools at https://aeronet.gsfc.nasa.gov (accessed on 16 November 2022). Data can be viewed in the data display interface, acquired using the data download tool, analyzed, and downloaded using some analysis tools provided by AERONET. The INPE website provides data analysis and dissemination tools at https://queimadas.dgi.inpe.br/queimadas/portal (accessed on 20 November 2022). Every other data must be request directly to the authors.
Acknowledgments
The authors appreciate P Artaxo and J S Nogueira, as well as your team, to establish and maintain the site used in the investigation, to the members of Laboratório de Física Atmosférica (LFA – USP) to support in the samples analyzes and Pró-Reitoria de Pesquisa e Pós-graduação da Universidade Federal de Mato Grosso PROPG/UFMT.
Conflicts of Interest
The authors declare no conflicts of interest
References
- Masson-Delmotte, V.; Zhai, A.; Pirani, S.L.; Connors, C.; Péan, S.; Berger, N.; Caud, Y.; Chen, L.; Goldfarb, M.I.; Gomis, M. Climate Change 2021: The Physical Science Basis, Cambridge, 2021.
- Monks, P.S.; Granier, C.; Fuzzi, S.; Stohl, A.; Williams, M.L.; Akimoto, H.; Amann, M.; Baklanov, A.; Baltensperger, U.; Bey, I.; et al. Atmospheric Composition Change - Global and Regional Air Quality. Atmos Environ 2009, 43, 5268–5350. [Google Scholar] [CrossRef]
- Brunelli, T.C.; Paiva, S.; Yara, A.; Elizeu, C.; Otávio, L.; Basso, J. ENVIRONMENTAL PARAMETERS AND RELATIONSHIPS WITH COVID-19 CASES IN CENTRAL SOUTH AMERICA. Quim Nova 2021, 44, 1236–1244. [Google Scholar] [CrossRef]
- Jacobson, L. da S.V.; de Oliveira, B.F.A.; Schneider, R.; Gasparrini, A.; Hacon, S. de S. Mortality Risk from Respiratory Diseases Due to Non-Optimal Temperature among Brazilian Elderlies. Int J Environ Res Public Health, 2021; 14. [Google Scholar] [CrossRef]
- Santos, D.M. Dos; Rizzo, L.V.; Carbone, S.; Schlag, P.; Artaxo, P. Physical and Chemical Properties of Urban Aerosols in São Paulo, Brazil: Links between Composition and Size Distribution of Submicron Particles. Atmos Chem Phys 2021, 21, 8761–8773. [Google Scholar] [CrossRef]
- Santos, A.C.A.; Finger, A.; De Souza Nogueira, J.; Curado, L.F.A.; Da Silva Palácios, R.; Pereira, V.M.R. Análise Da Concentração e Composição de Aerossóis de Queimadas Do Pantanal Mato-Grosso. Quim Nova 2016, 39, 919–924. [Google Scholar] [CrossRef]
- Pinto, O.B.; Marques, A.C.A.; Vourlitis, G.L. Aboveground Carbon Storage and Cycling of Flooded and Upland Forests of the Brazilian Pantanal. Forests 2020, 11, 1–15. [Google Scholar] [CrossRef]
- Tomas, W.M.; de Oliveira Roque, F.; Morato, R.G.; Medici, P.E.; Chiaravalloti, R.M.; Tortato, F.R.; Penha, J.M.F.; Izzo, T.J.; Garcia, L.C.; Lourival, R.F.F.; et al. Sustainability Agenda for the Pantanal Wetland: Perspectives on a Collaborative Interface for Science, Policy, and Decision-Making. Trop Conserv Sci 2019, 12. [Google Scholar] [CrossRef]
- Caumo, S.; Lázaro, W.L.; Sobreira Oliveira, E.; Beringui, K.; Gioda, A.; Massone, C.G.; Carreira, R.; de Freitas, D.S.; Ignacio, A.R.A.; Hacon, S. Human Risk Assessment of Ash Soil after 2020 Wildfires in Pantanal Biome (Brazil). Air Qual Atmos Health 2022, 15, 2239–2254. [Google Scholar] [CrossRef] [PubMed]
- Meneses, H. do N. de M.; Oliveira-Da-costa, M.; Basta, P.C.; Morais, C.G.; Pereira, R.J.B.; de Souza, S.M.S.; Hacon, S. de S. Mercury Contamination: A Growing Threat to Riverine and Urban Communities in the Brazilian Amazon. Int J Environ Res Public Health 2022, 19, 12. [Google Scholar] [CrossRef] [PubMed]
- Libonati, R.; Geirinhas, J. o. L.; Silva, P.S.; Russo, A.; Rodrigues, J.A.; Belém, L.B.C.; Nogueira, J.; Roque, F.O.; Dacamara, C.C.; Nunes, A.M.B.; et al. Assessing the Role of Compound Drought and Heatwave Events on Unprecedented 2020 Wildfires in the Pantanal. Environmental Research Letters 2022, 17. [Google Scholar] [CrossRef]
- MORAIS, F.G. Estudo Das Propriedades de Absorção de Brown Carbon e Black Carbon Utilizando Sensoriamento Remoto e Medidas in Situ Na Amazônia, Instituto de Pesquisas Energéticas e Nucleares, 2022.
- Ouf, F.X.; Parent, P.; Laffon, C.; Marhaba, I.; Ferry, D.; Marcillaud, B.; Antonsson, E.; Benkoula, S.; Liu, X.J.; Nicolas, C.; et al. First In-Flight Synchrotron X-Ray Absorption and Photoemission Study of Carbon Soot Nanoparticles. Sci Rep 2016, 6, 1–12. [Google Scholar] [CrossRef] [PubMed]
- Seinfeld, J.H.; Pandis, S.N. Atmospheric Chemistry and Physics: From Air Pollution to Climate Change; 2nd ed.; John Wiley & Sons: Hoboken, USA, 2006; ISBN 978-0-471-72018-8. [Google Scholar]
- Zhang, L.; Gong, S.; Padro, J.; Barrie, L. A Size-Segregated Particle Dry Deposition Scheme for an Atmospheric Aerosol Module. Atmos Environ 2001, 35, 549–560. [Google Scholar] [CrossRef]
- Köppen, G.W.; Geiger, M.R. Handbuch Der Klimatologie; Berlin, 1936.
- Guimarães, D.P.; Landau, E.C.; Santos, M.C.B.; Mendes, S.H.G. da S. Caracterização de Chuvas Do Pantanal Mato-Grossense; 2018; Vol. 15.
- Burden, F.R.; McKelvie, I.D.; Förstner, U.; Guenther, A. Environmental Monitoring Handbook; McGraw-Hill: New York, USA, 2004; ISBN 0071500286. [Google Scholar]
- ISO Air Quality: Particle Size Fraction Definitions for Health-Related Sampling; Genebra, 1995.
- Rothmund, L.D.; Palácios, R.D.S.; Marques, J.B.; Oliveira, L.G.B.; Rodrigues, T.R.; Curado, L.F.A.; Nogueira, J.D.S. Characterization of Physical Properties of Aerosols Atmospheric on Regions Affected by Burning Biomass in Brazil. Holos Environment 2018, 18, 68. [Google Scholar] [CrossRef]
- Artaxo, P.; Martins, J.V.; Yamasoe, M.A.; Procópio, A.S.; Pauliquevis, T.M.; Andreae, M.O.; Guyon, P.; Gatti, L. V.; Leal, A.M.C. Physical and Chemical Properties of Aerosols in the Wet and Dry Seasons in Rondônia, Amazonia. Journal of Geophysical Research: Atmospheres 2002, 107, LBA–49. [Google Scholar] [CrossRef]
- Maenhaut, W.; Raes, N.; Chi, X.; Cafmeyer, J.; Wang, W.; Salma, I. Chemical Composition and Mass Closure for Fine and Coarse Aerosols at a Kerbside in Budapest, Hungary, in Spring 2002. X-Ray Spectrometry 2005, 34, 290–296. [Google Scholar] [CrossRef]
- Holben, B.N.; Eck, T.F.; Slutsker, I.; Tanré, D.; Buis, J.P.; Setzer, A.; Vermote, E.; Reagan, J.A.; Kaufman, Y.J.; Nakajima, T.; et al. AERONET - A Federated Instrument Network and Data Archive for Aerosol Characterization. Remote Sens Environ 1998, 66, 1–16. [Google Scholar] [CrossRef]
- Cohen, J. Statistical Power Analysis for the Behavioral Sciences; 2nd ed.; Lawrence Erlbaum Associates: New York, 1988; ISBN 0805802835.
- Maenhaut, W.; Fernández-Jiménez, M.T.; Rajta, I.; Artaxo, P. Two-Year Study of Atmospheric Aerosols in Alta Floresta, Brazil: Multielemental Composition and Source Apportionment. Nucl Instrum Methods Phys Res B 2002, 189, 243–248. [Google Scholar] [CrossRef]
- Garba, S.T.; Abubakar, M.A. Source and Distribution of The Heavy Metals: Pb, Cd, Cu, Zn, Fe, Cr, and Mn in Soils of Bauchi Metropolis, Nigeria. American Journal of Engineering Research (AJER) 2018, 7, 13–22. [Google Scholar]
- Holanda, B.A.; Pöhlker, M.L.; Walter, D.; Saturno, J.; Sörgel, M.; Ditas, J.; Ditas, F.; Schulz, C.; Aurélio Franco, M.; Wang, Q.; et al. Influx of African Biomass Burning Aerosol during the Amazonian Dry Season through Layered Transatlantic Transport of Black Carbon-Rich Smoke. Atmos Chem Phys 2020, 20, 4757–4785. [Google Scholar] [CrossRef]
- Petzold, A.; Ogren, J.A.; Fiebig, M.; Laj, P.; Li, S.M.; Baltensperger, U.; Holzer-Popp, T.; Kinne, S.; Pappalardo, G.; Sugimoto, N.; et al. Recommendations for Reporting Black Carbon Measurements. Atmos Chem Phys 2013, 13, 8365–8379. [Google Scholar] [CrossRef]
Figure 1.
Sampling site BAPP – UFMT, Private Reserve of Natural Heritage of Social Service of Commerce – Baía das Pedras, state of Mato Grosso, north of Brazilian Pantanal.
Figure 1.
Sampling site BAPP – UFMT, Private Reserve of Natural Heritage of Social Service of Commerce – Baía das Pedras, state of Mato Grosso, north of Brazilian Pantanal.
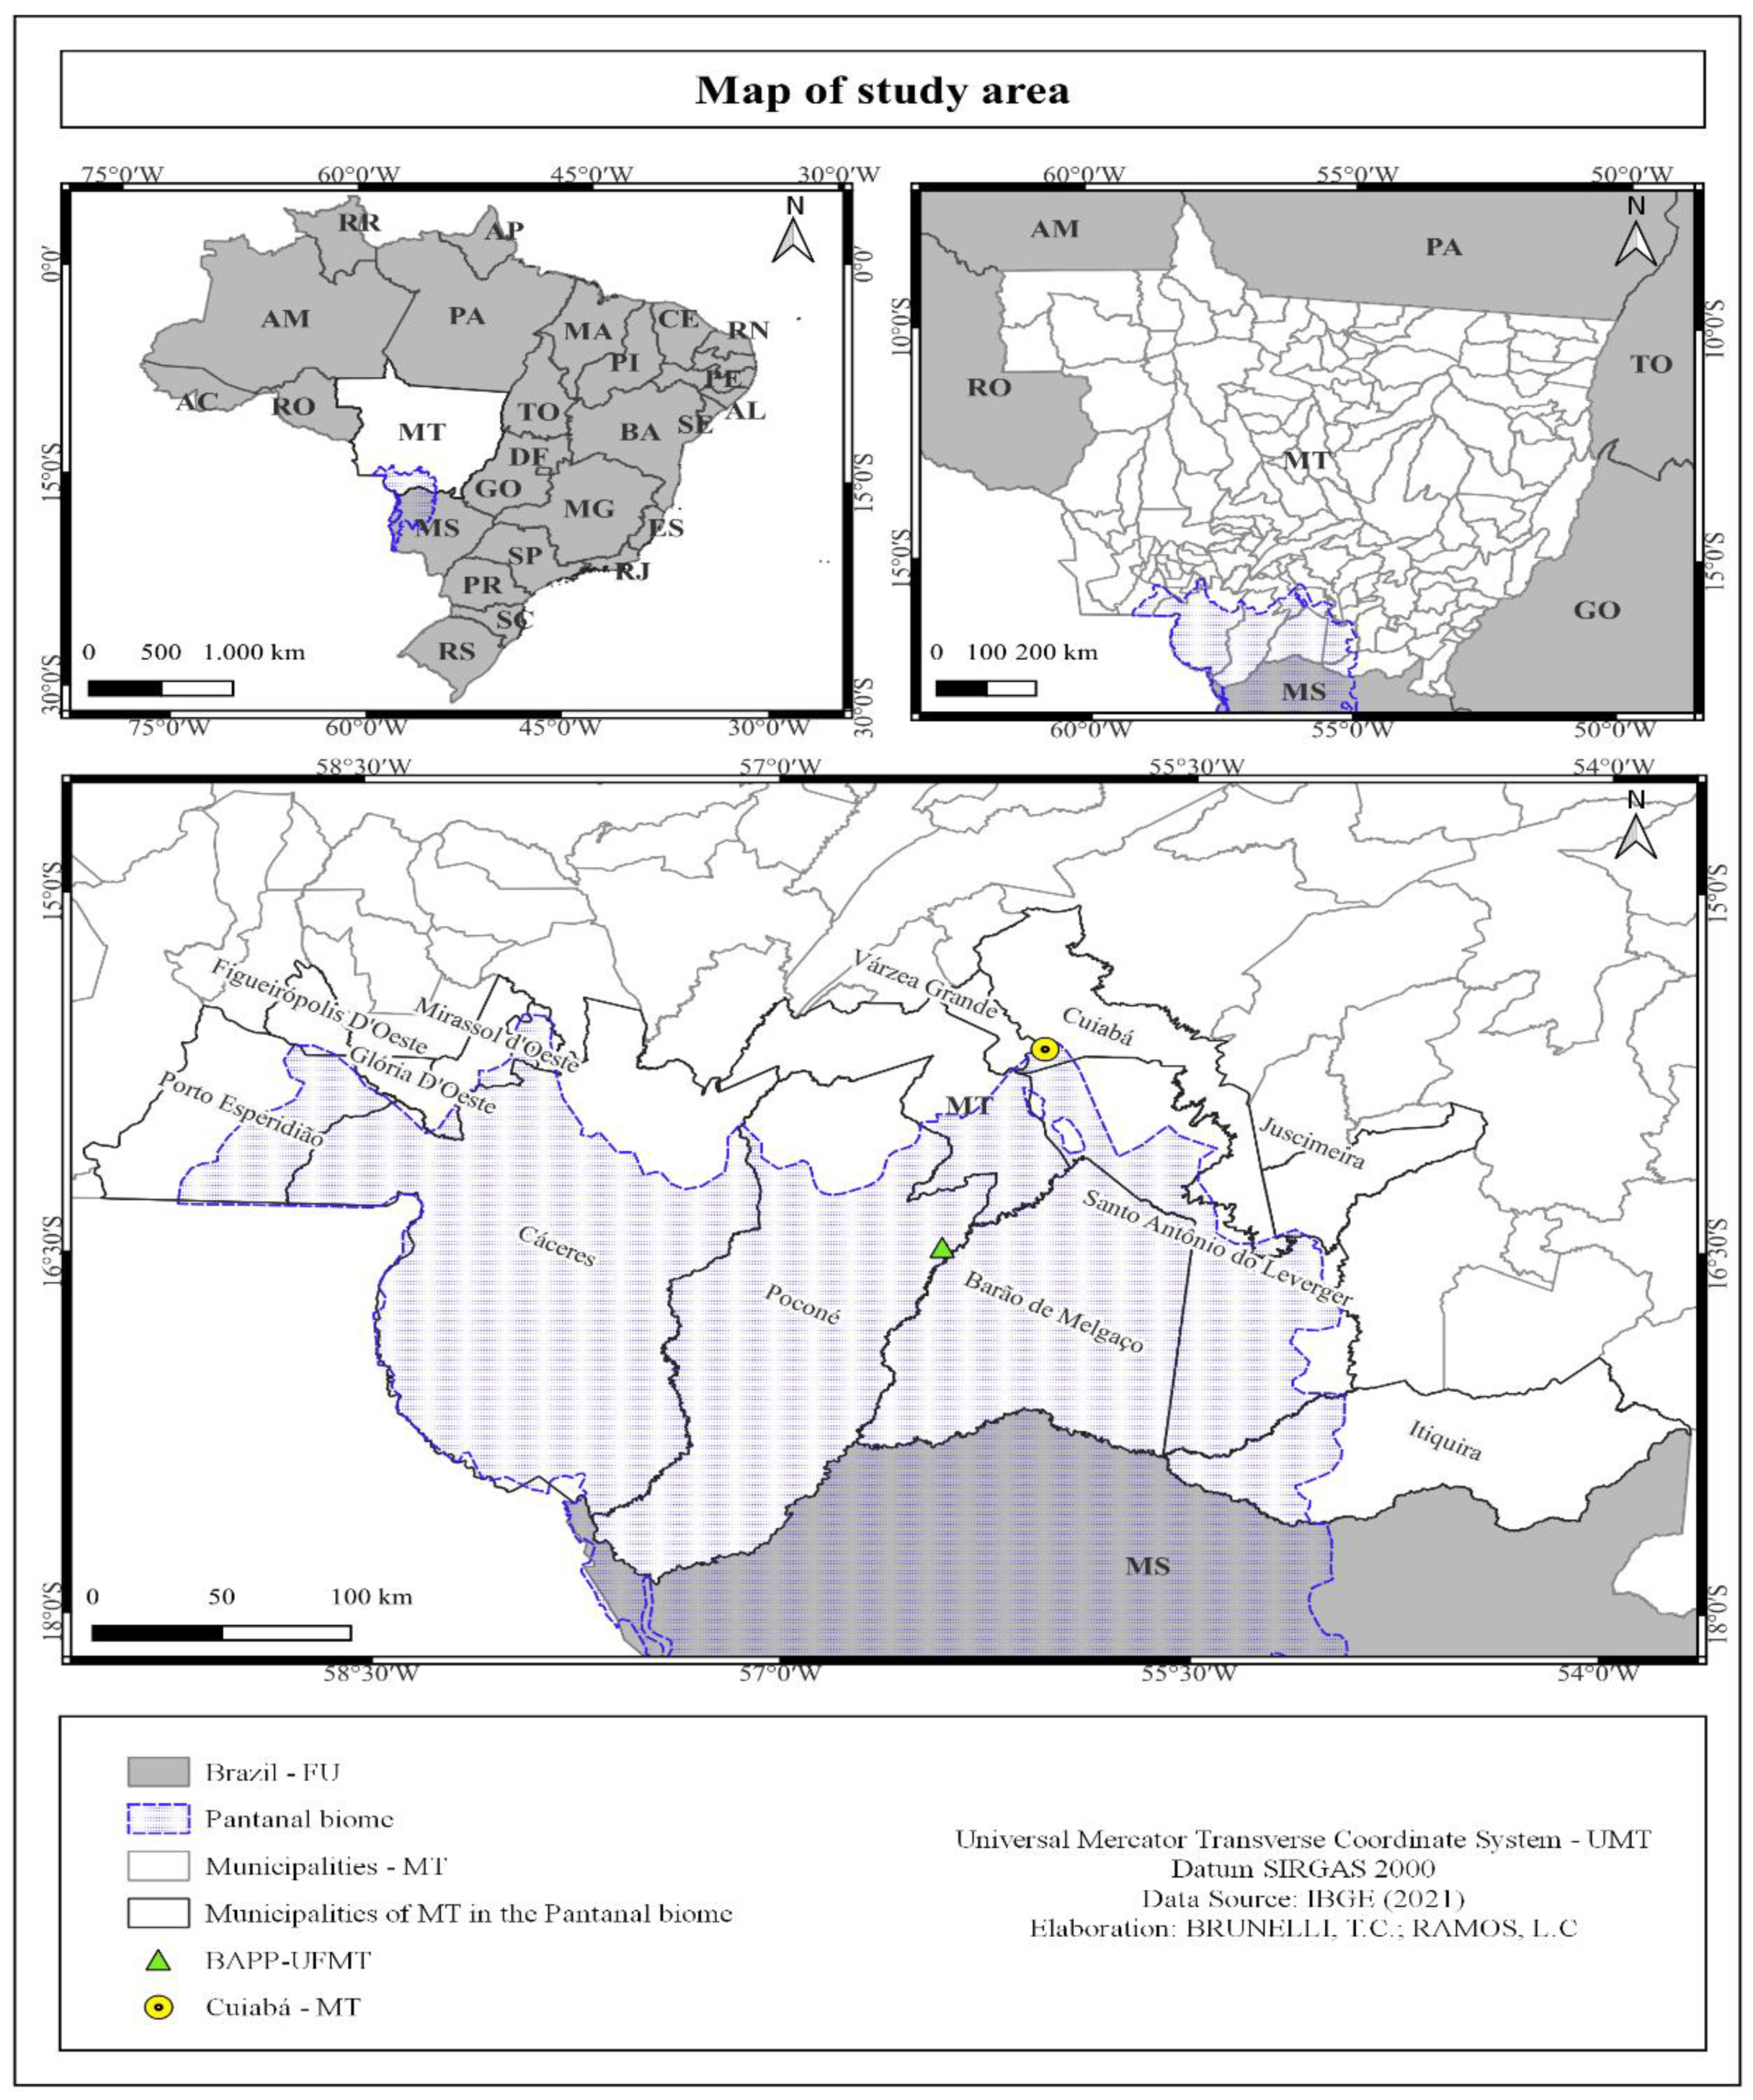
Figure 2.
Representative scheme of sampling system of atmospheric aerosols.
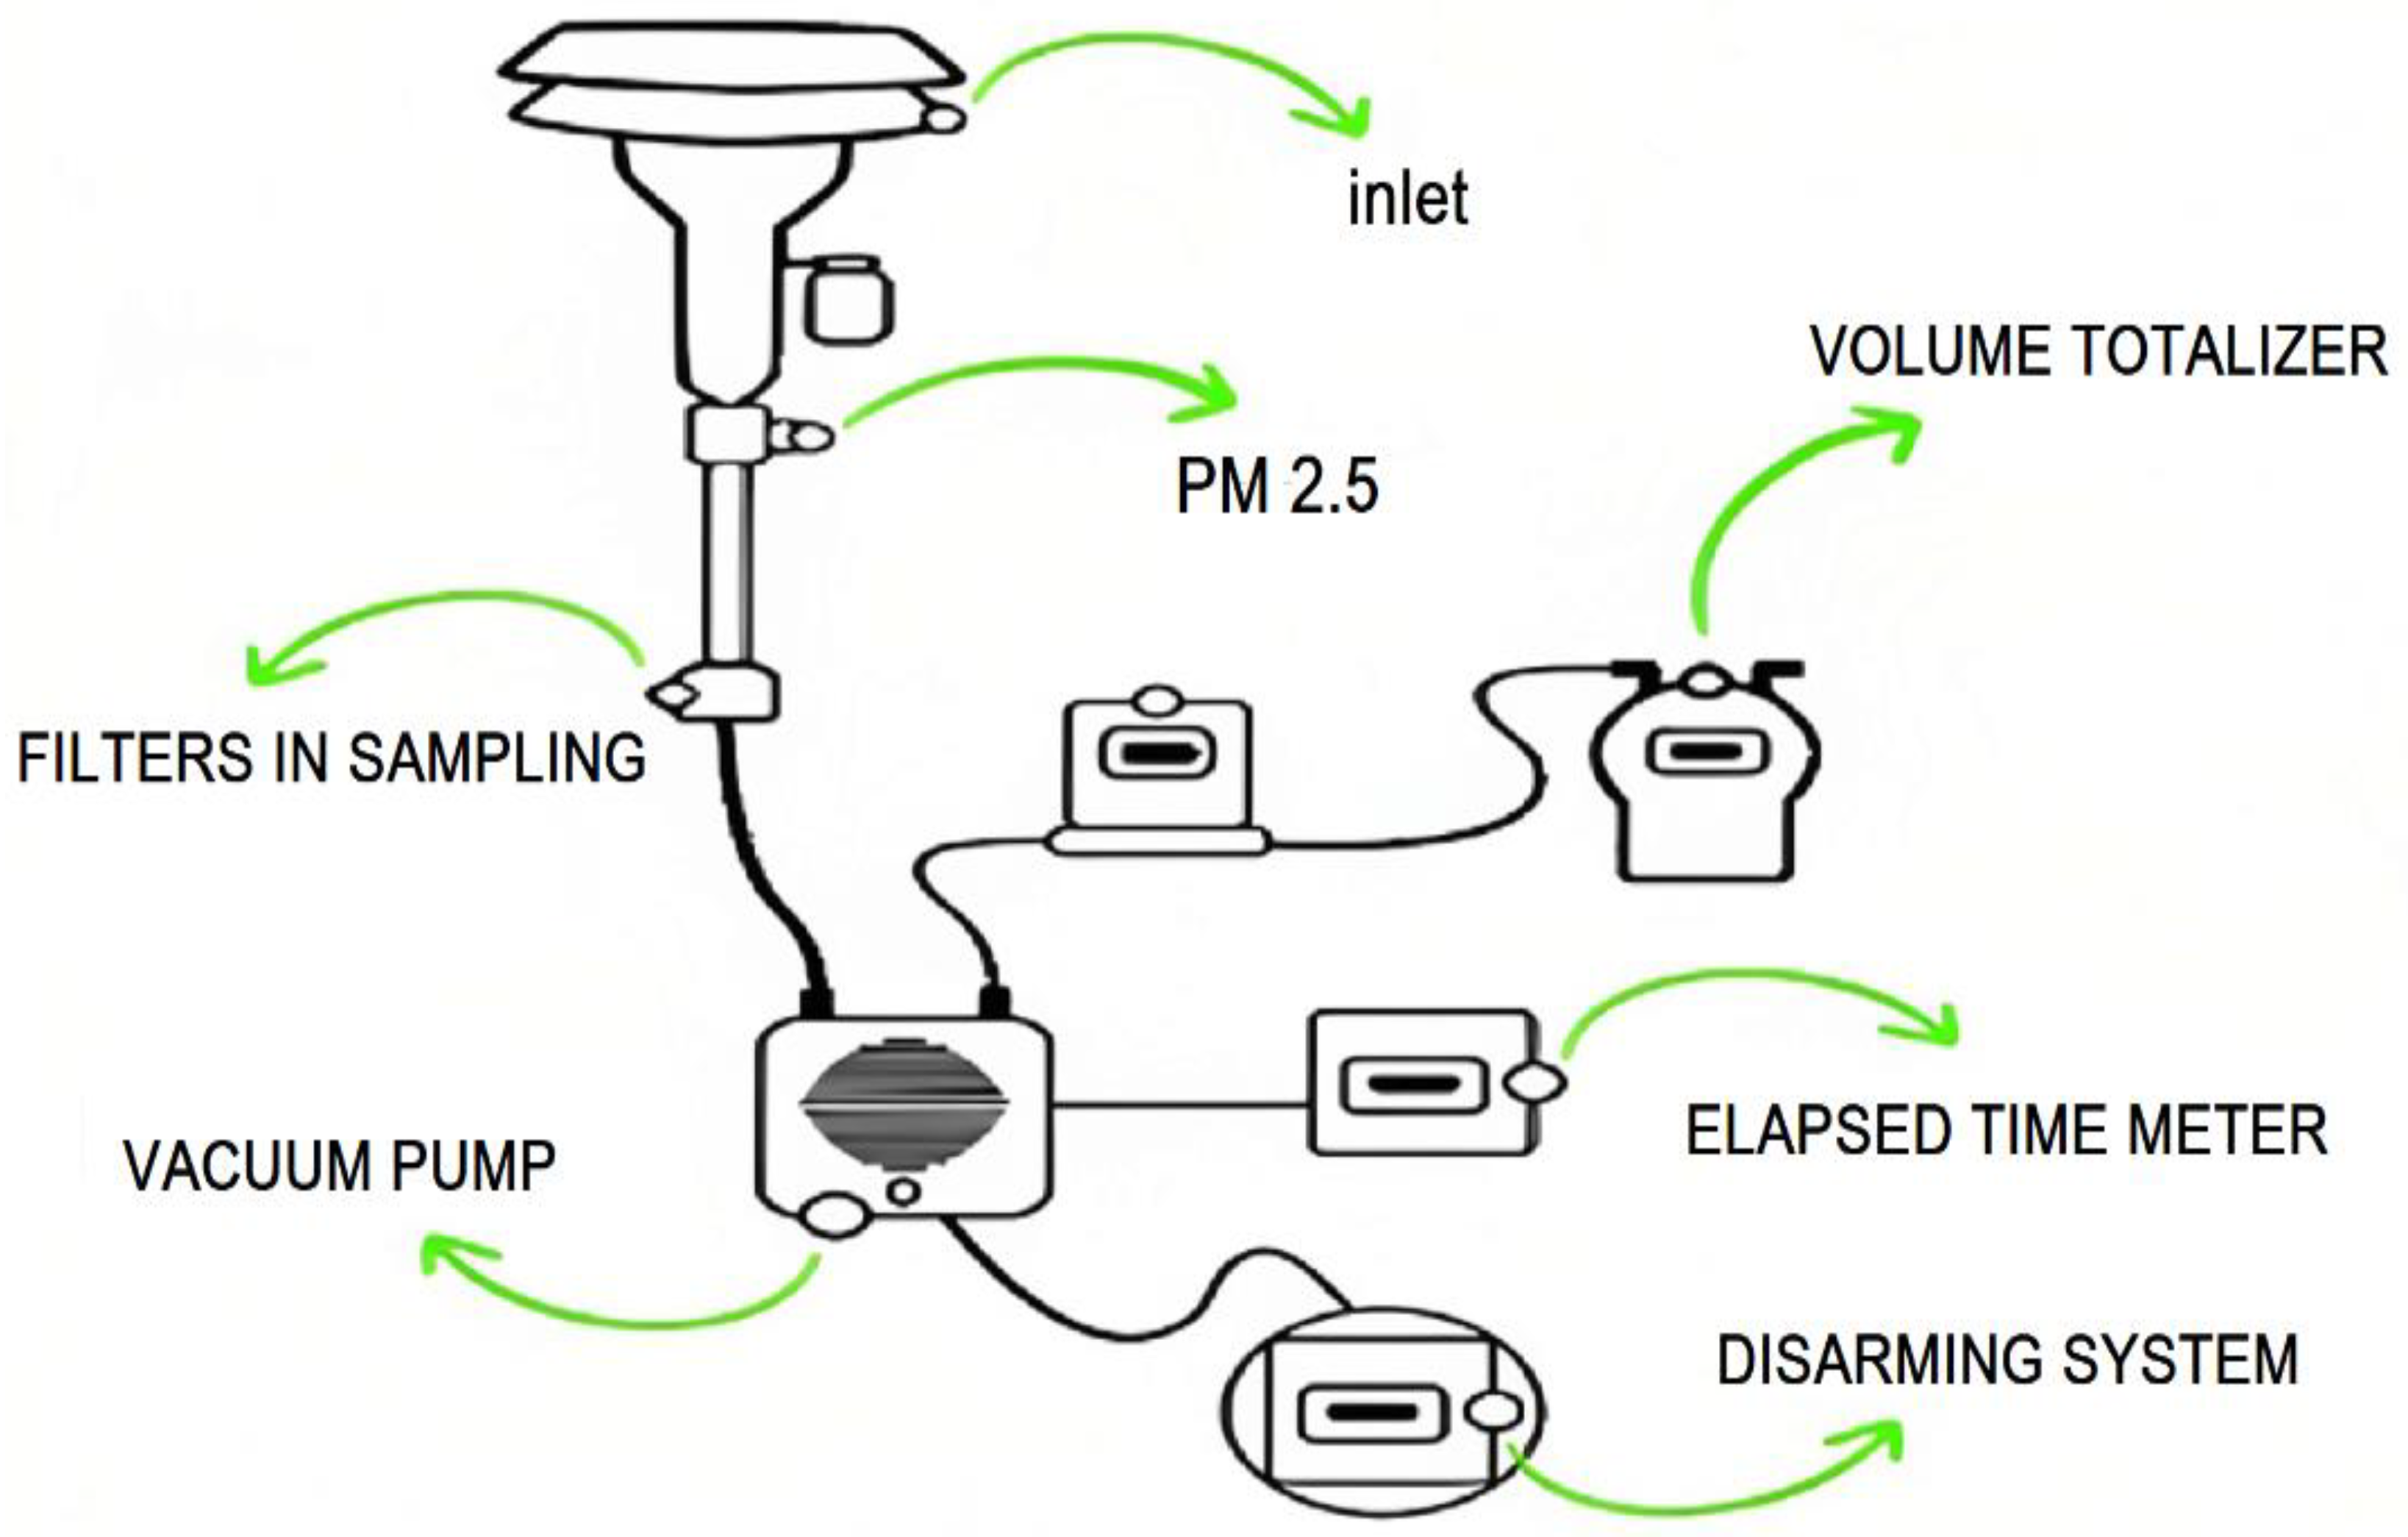
Figure 3.
Concentration variation of PM2.5 and BC concentration measured in the BAPP – UFMT between August and October 2022.
Figure 3.
Concentration variation of PM2.5 and BC concentration measured in the BAPP – UFMT between August and October 2022.
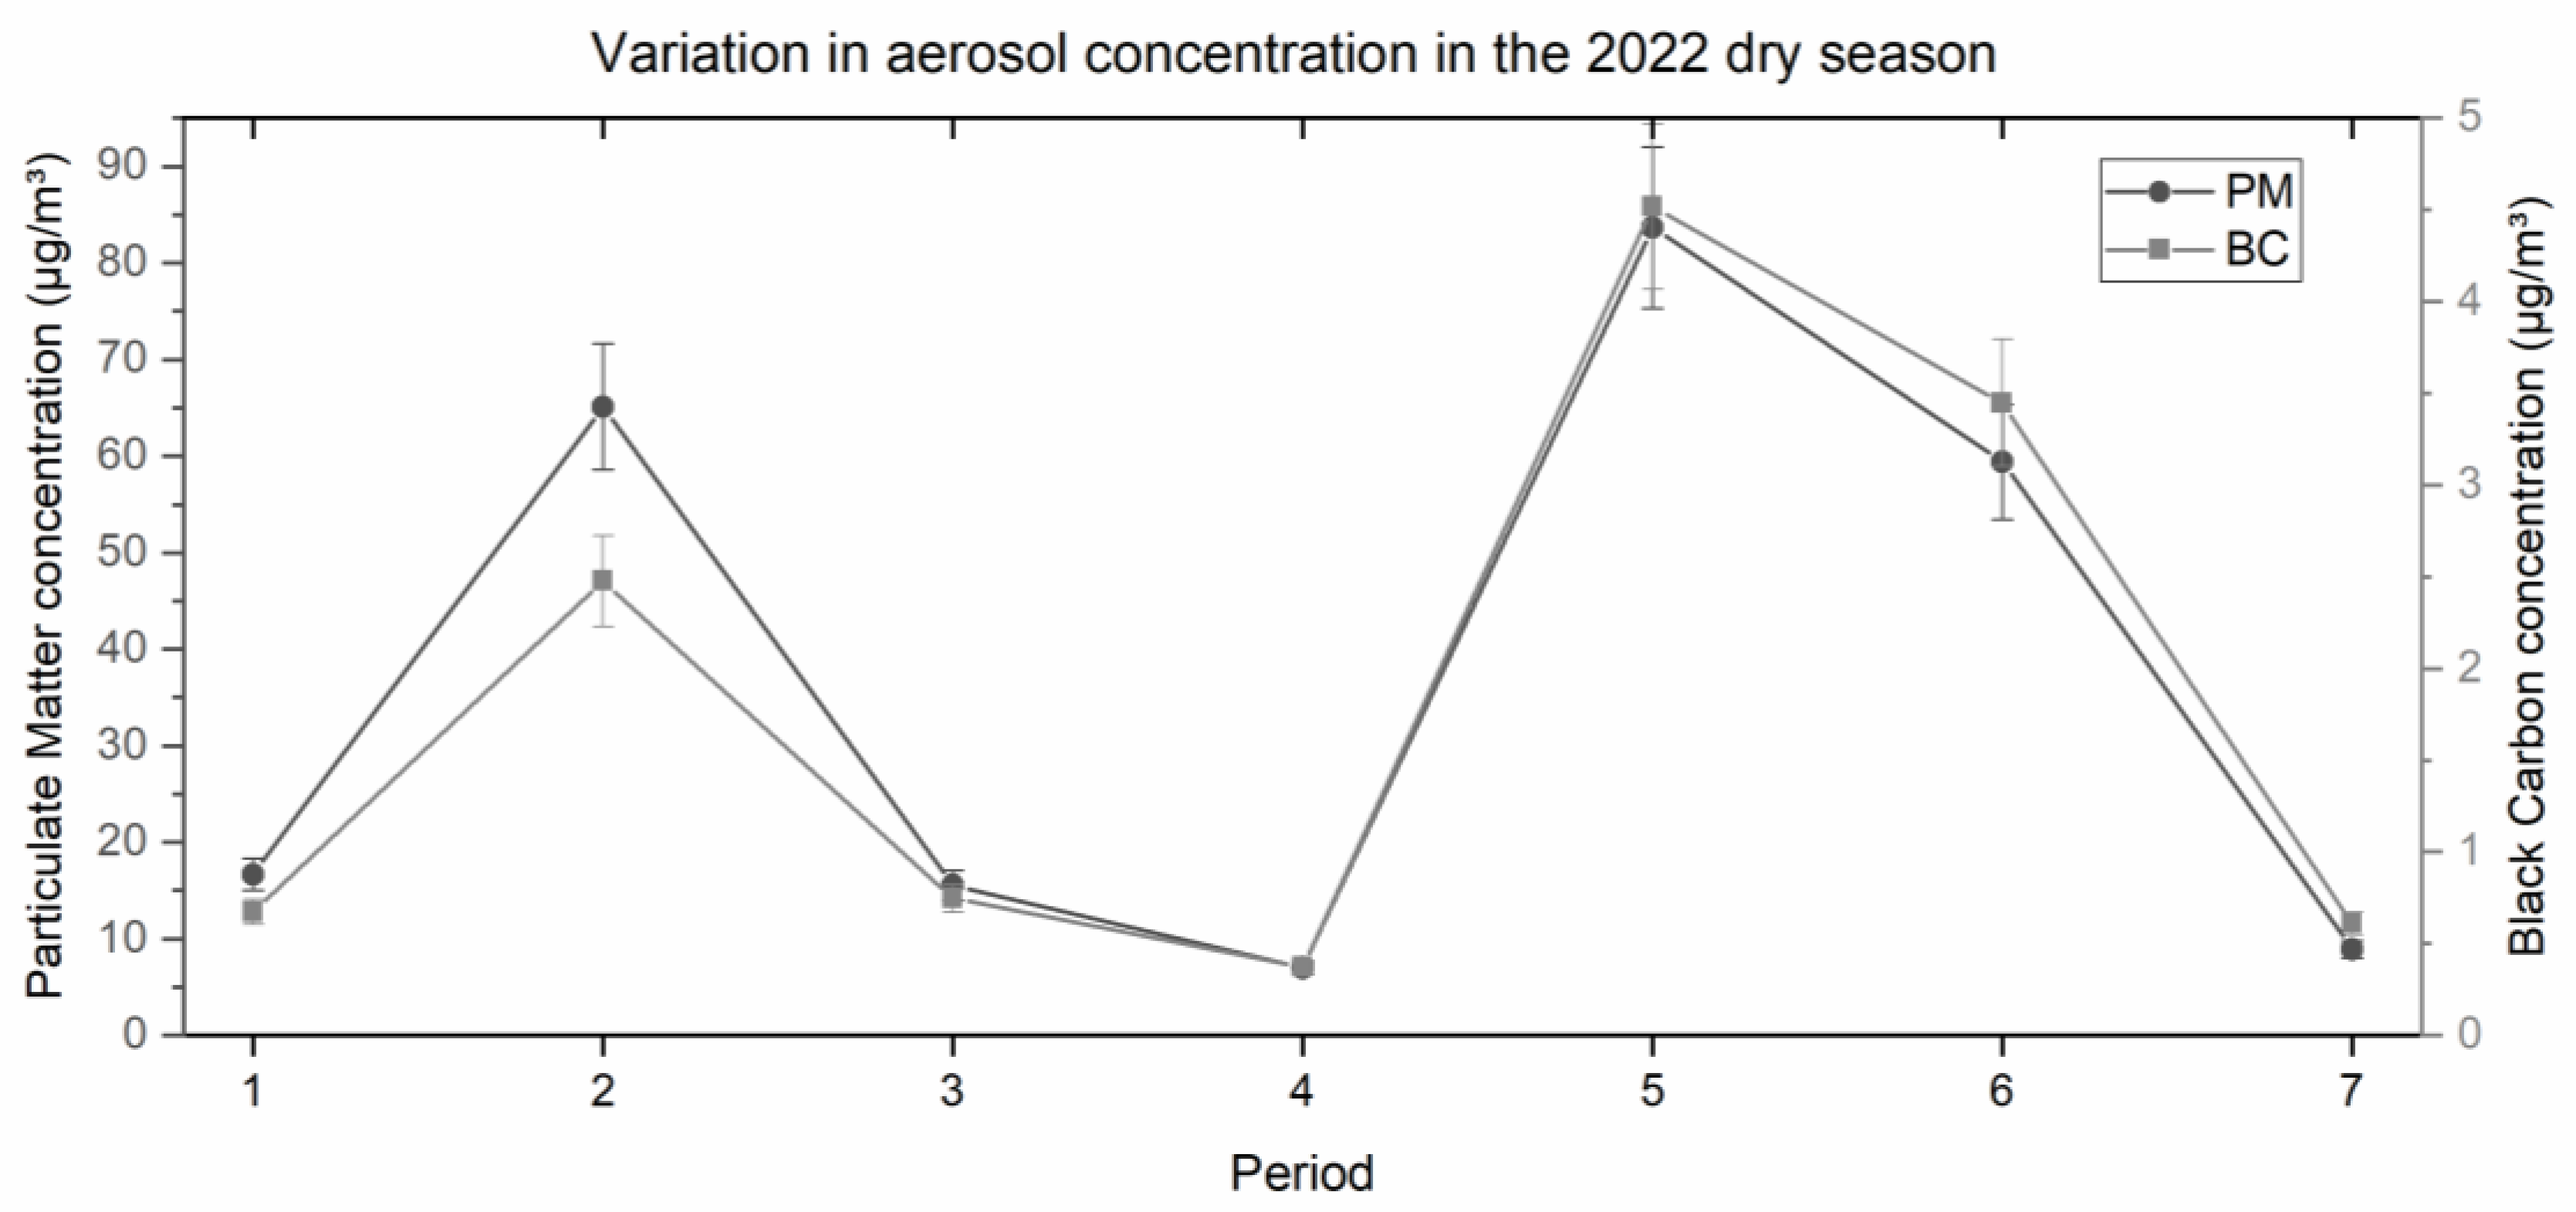
Figure 5.
Average by period diary measurements of AODtotal, AODfine and AODcourse at wavelength 500 nm and AR (A) and median by period of environmental parameters (B) between August and October 2022.
Figure 5.
Average by period diary measurements of AODtotal, AODfine and AODcourse at wavelength 500 nm and AR (A) and median by period of environmental parameters (B) between August and October 2022.
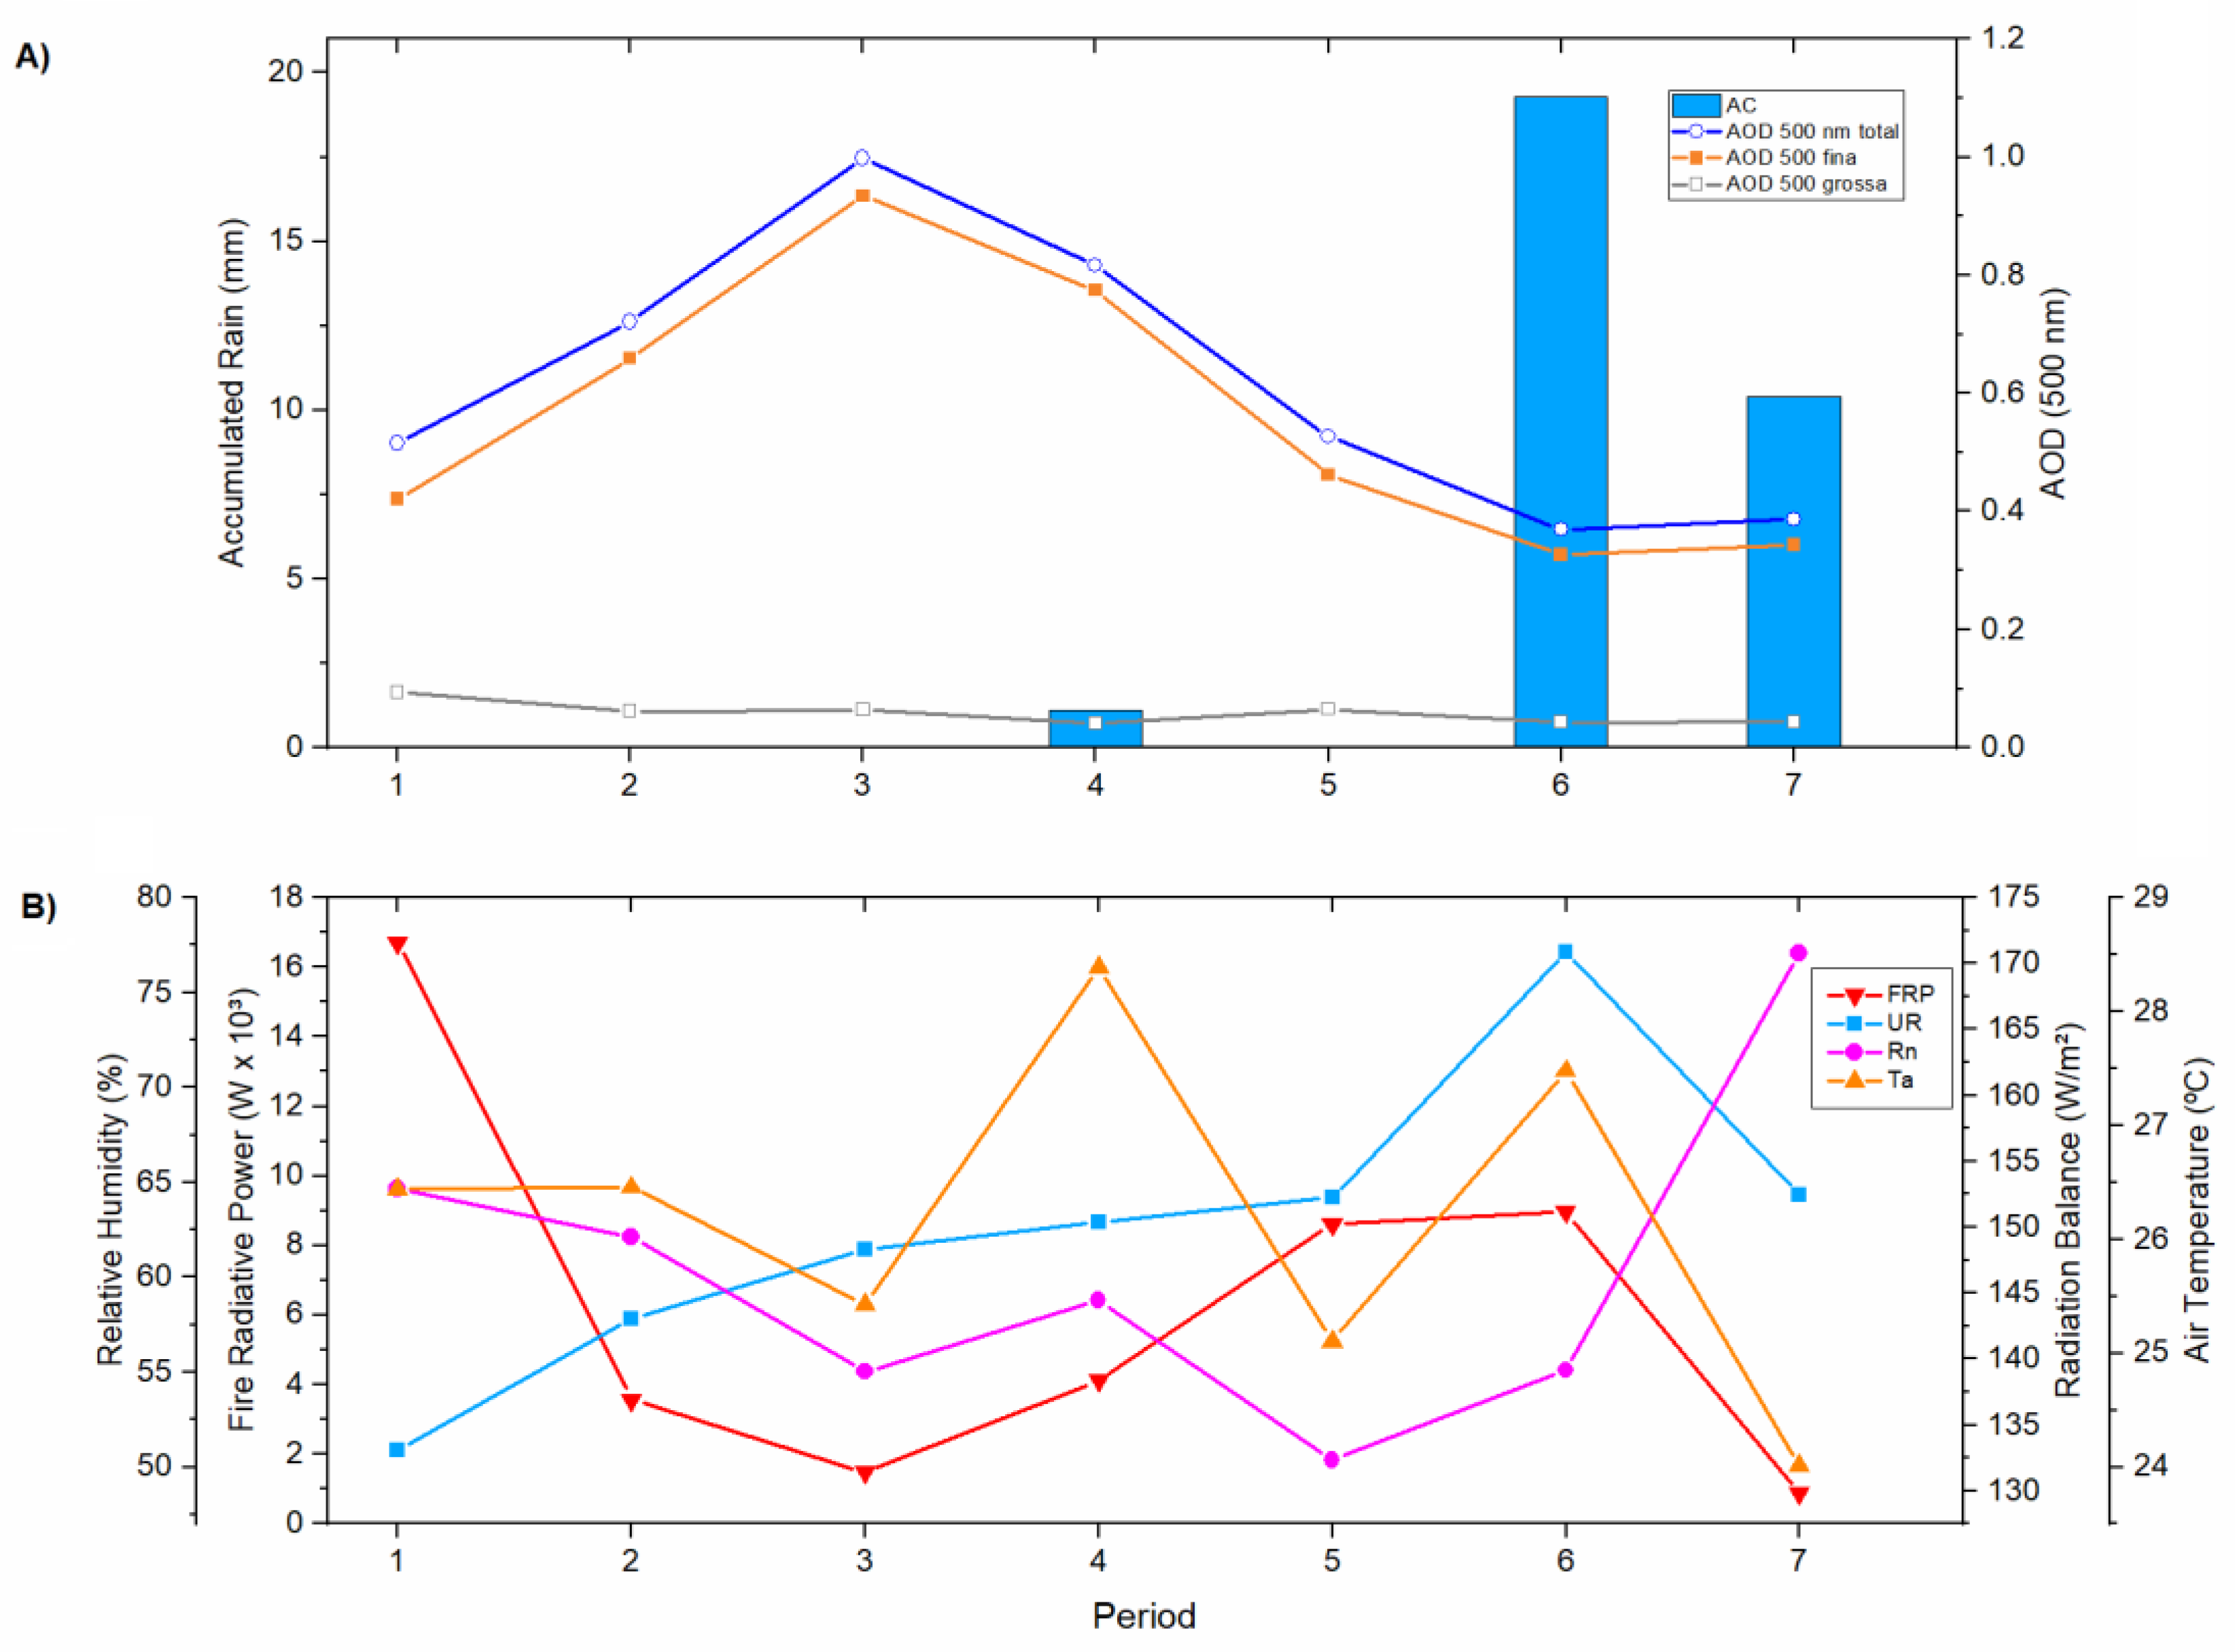
Figure 6.
Geographical distribution of fires by period in the municipalities of Mato Grosso in the Pantanal biome between August and October 2022.
Figure 6.
Geographical distribution of fires by period in the municipalities of Mato Grosso in the Pantanal biome between August and October 2022.
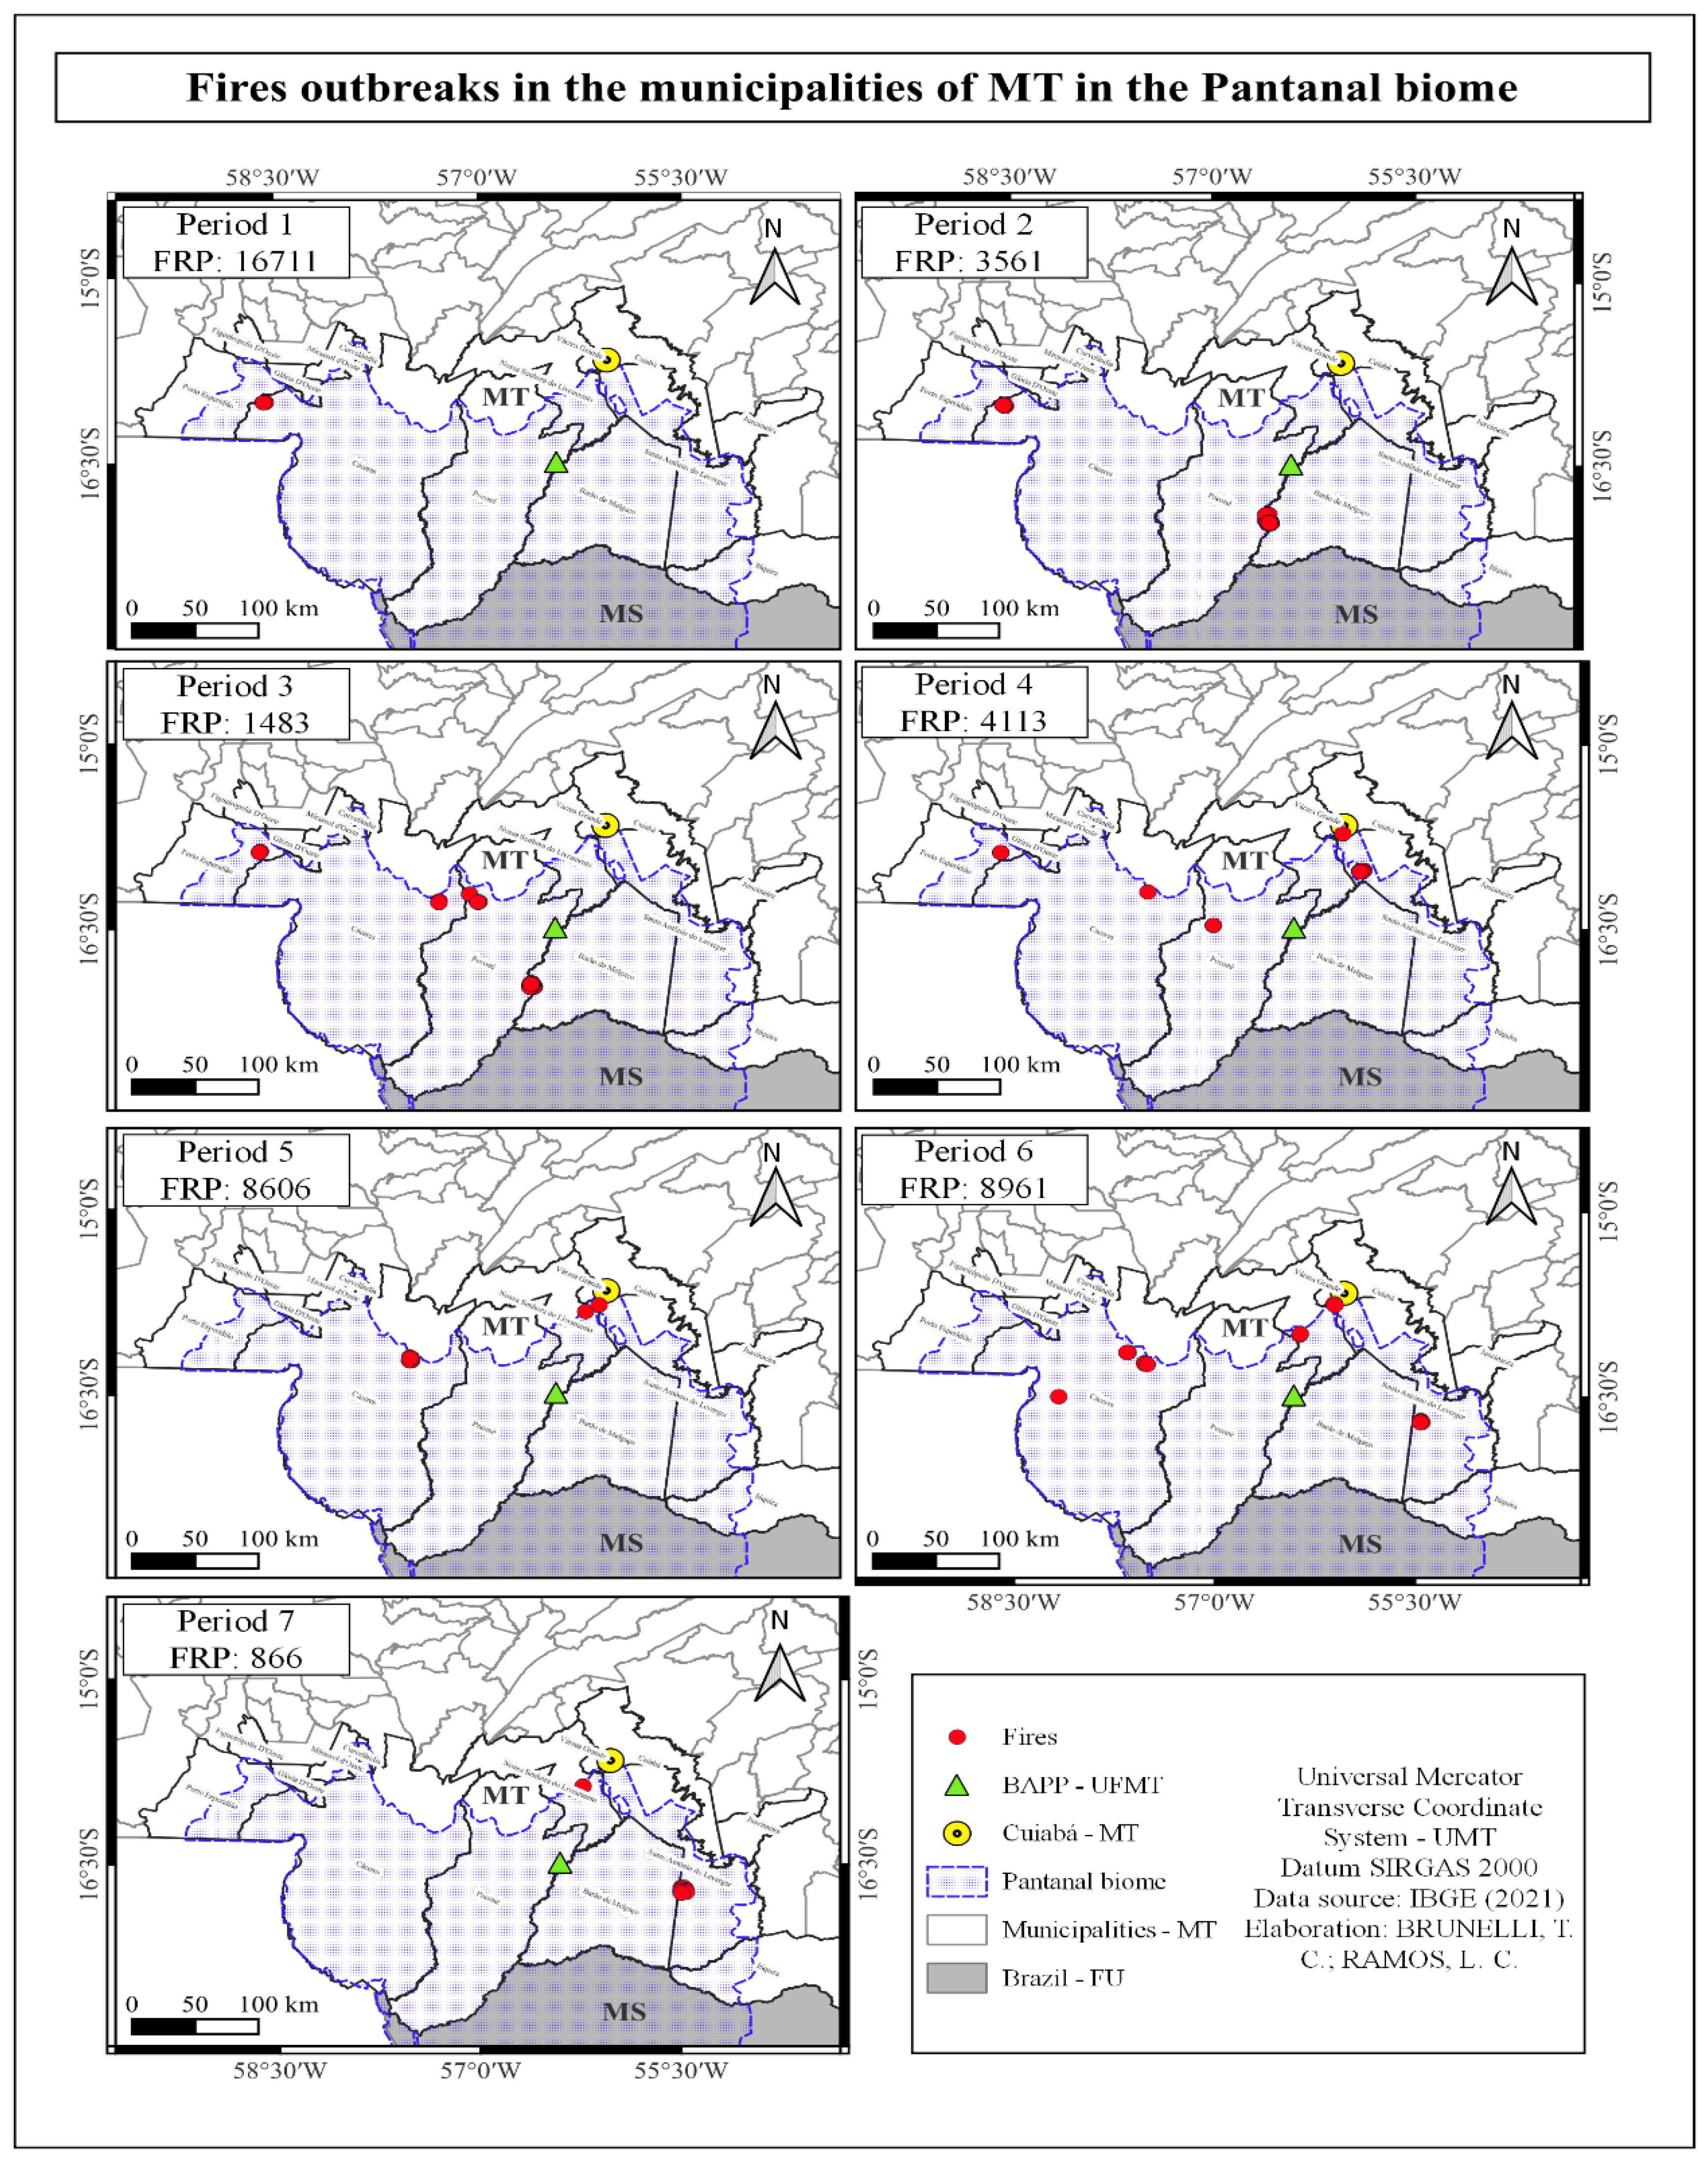
Figure 7.
Roses of wind indicating the mean velocity and direction of the wind thorough the period between August and October 2022 measured at the micrometeorological tower in the BAPP – UFMT.
Figure 7.
Roses of wind indicating the mean velocity and direction of the wind thorough the period between August and October 2022 measured at the micrometeorological tower in the BAPP – UFMT.
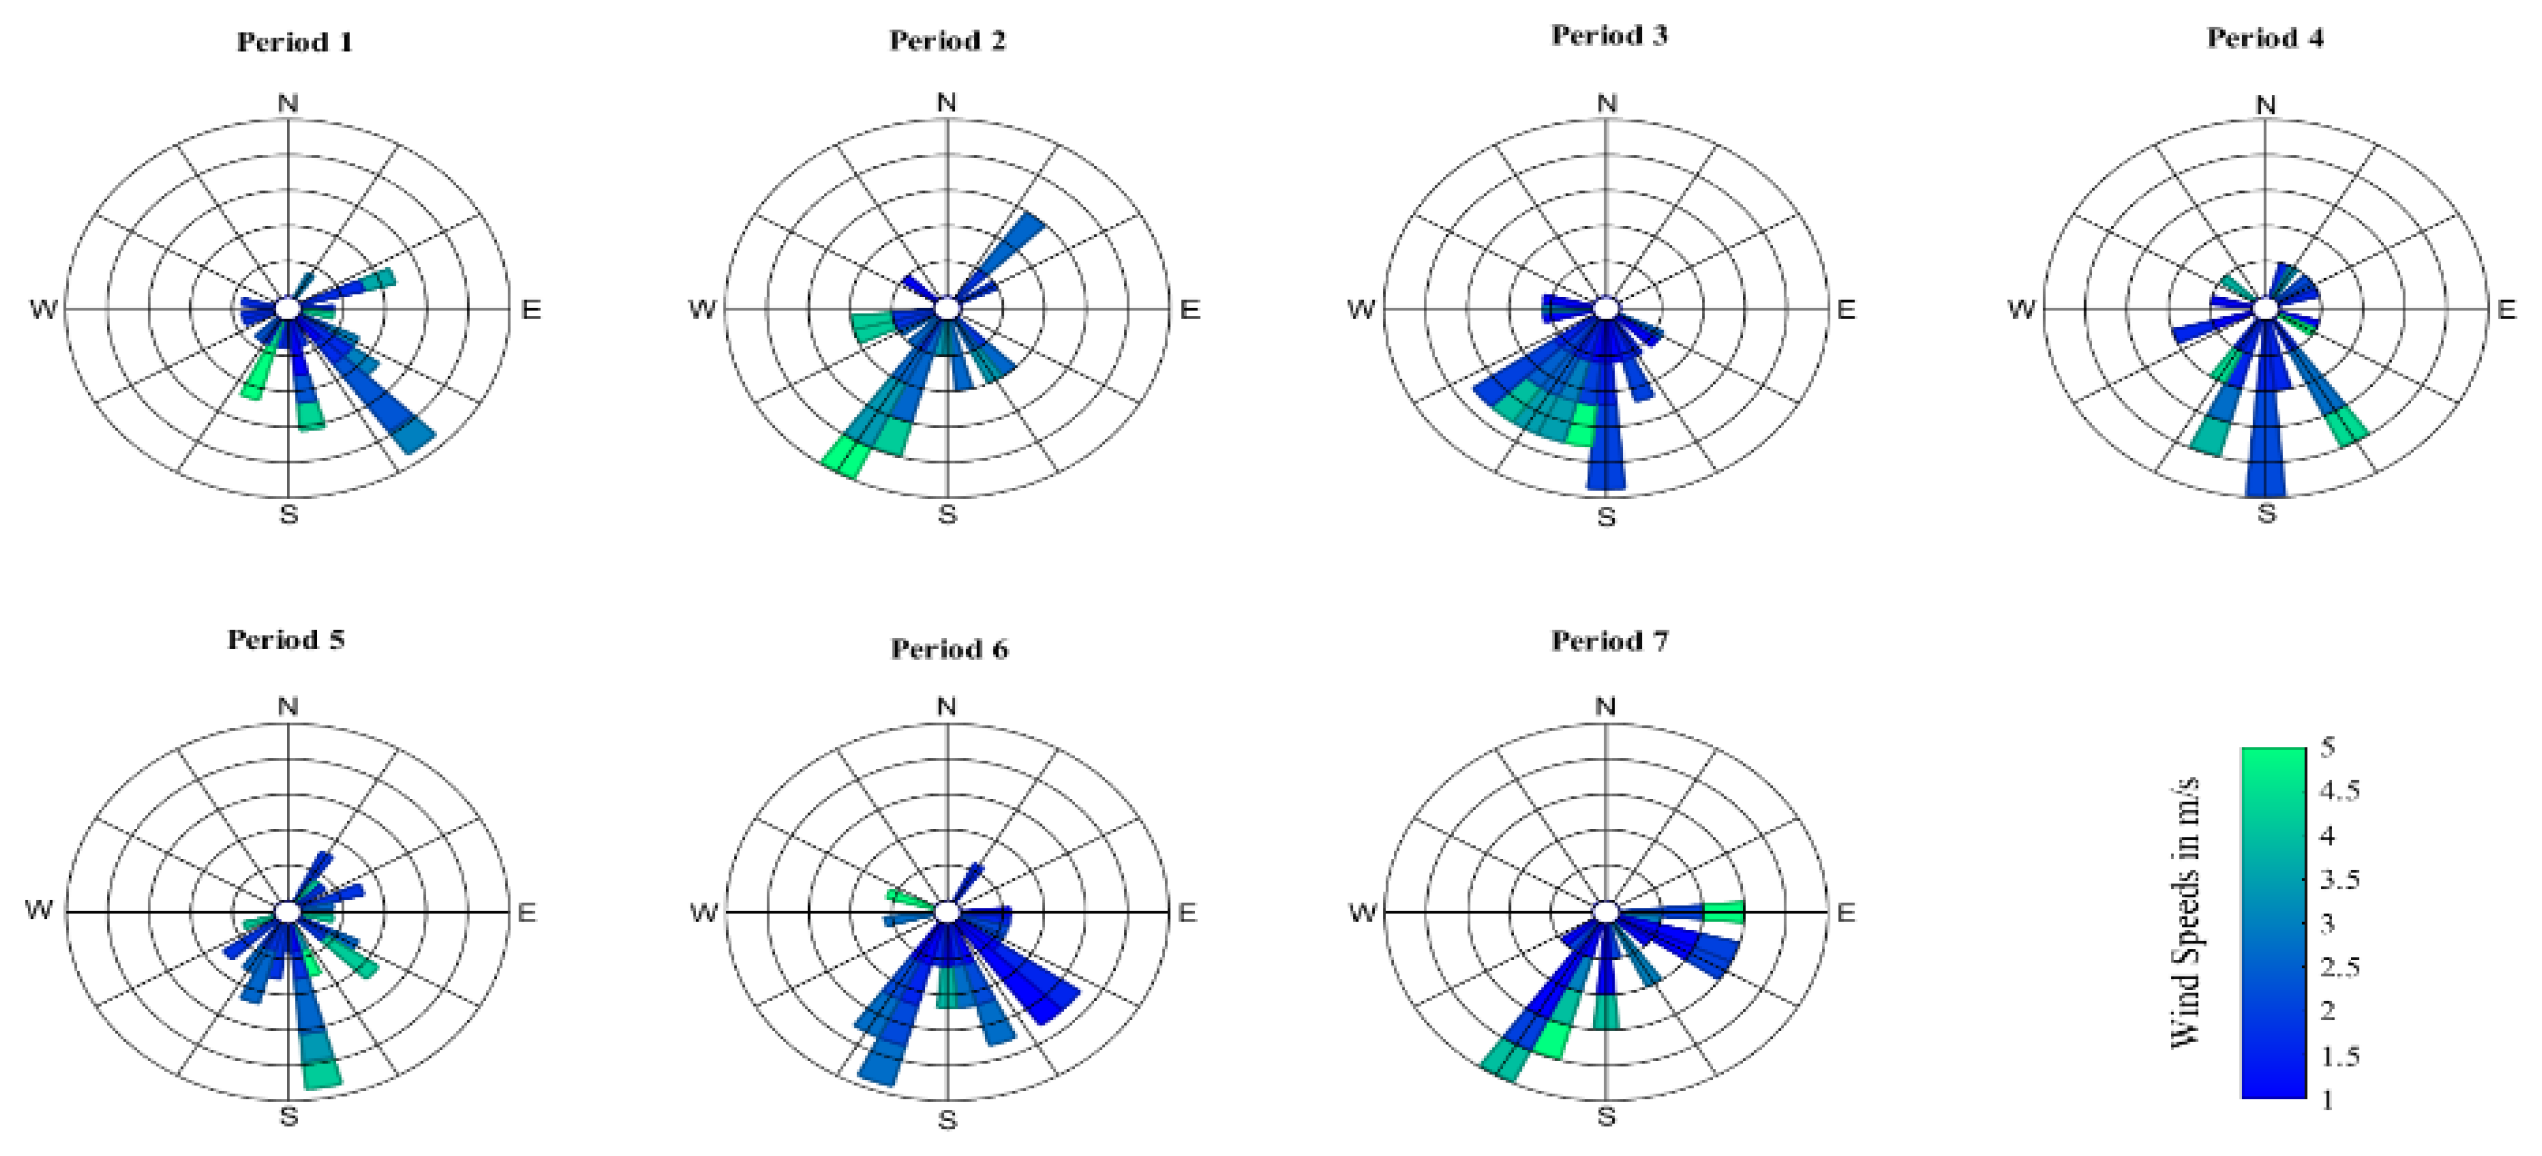

Table 1.
Statistical summary of the physical and chemical properties of aerosols in the Pantanal dry season in 2022*.
Table 1.
Statistical summary of the physical and chemical properties of aerosols in the Pantanal dry season in 2022*.
| Fine particulate matter BAPP - UFMT | ||||
| Avg | σ | Min | Max | |
| PM | 36.62 | 31.69 | 7.02 | 83.66 |
| BC | 1.83 | 1.65 | 0.37 | 4.52 |
| Na | 94.05 | 95.33 | 19.68 | 279.87 |
| Mg | 28.12 | 27.45 | 0.86 | 81.81 |
| Al | 167.60 | 113.47 | 53.82 | 377.72 |
| Si | 243.52 | 181.99 | 71.59 | 500.15 |
| P | 33.54 | 38.88 | 5.74 | 98.82 |
| S | 688.32 | 627.43 | 200.90 | 1693.09 |
| Cl | 2.19 | 3.13 | 0.05 | 8.55 |
| K | 582.71 | 524.06 | 106.69 | 1392.17 |
| Ca | 49.07 | 45.44 | 11.56 | 132.15 |
| Ti | 18.93 | 21.01 | 0.02 | 53.30 |
| Cr | 2.05 | 1.71 | 0.42 | 4.62 |
| Mn | 3.86 | 3.30 | 0.74 | 8.65 |
| Fe | 238.28 | 172.63 | 56.47 | 582.40 |
| Ni | 0.53 | 0.49 | 0.11 | 1.45 |
| Cu | 2.65 | 3.15 | 0.69 | 9.16 |
| Zn | 7.66 | 7.22 | 1.33 | 22.49 |
| As | 0.14 | 0.10 | 0.01 | 0.31 |
| Se | 0.12 | 0.16 | 0.00 | 0.45 |
| Br | 8.62 | 7.47 | 2.36 | 18.84 |
| Rb | 0.98 | 0.80 | 0.20 | 2.53 |
| Sr | 2.27 | 3.96 | 0.00 | 11.00 |
| Cd | 8.56 | 8.48 | 0.85 | 22.37 |
| Sb | 5.47 | 4.55 | 1.78 | 13.39 |
| Pb | 4.28 | 9.16 | 0.08 | 24.93 |
*The PM2.5 and BC concentrations expressed in μg m-3 and the elements expressed in ng m-3. Only elements with concentration above the detection limit were considered at average and standard deviation (σ) calculation.
Table 2.
Correlation coefficient to concentration and environmental variables.
| PM2,5 | BC | AODtotal | AODfina | AODcourse | FRP | UR | AC | Rn | Ta | |
| PM2,5 | 1 | |||||||||
| BC | 0.929* | 1 | ||||||||
| AODtotal | -0.214 | -0.214 | 1 | |||||||
| AODfine | -0.214 | -0.214 | 1 | 1 | ||||||
| AODcourse | 0.500 | 0.357 | 0.071 | 0.071 | 1 | |||||
| FRP | 0.393 | 0.321 | -0.357 | -0.357 | 0.286 | 1 | ||||
| RH | -0.036 | 0.214 | -0.536 | -0.536 | -0.571 | -0.143 | 1 | |||
| AR | -0.297 | -0.185 | -0.556 | -0.556 | -0.852* | -0.148 | 0.704 | 1 | ||
| Rn | -0.429 | -0.643 | -0.357 | -0.357 | -0.107 | -0.179 | -0.214 | 0.259 | 1 | |
| AT | -0.143 | -0.143 | 0.143 | 0.143 | -0.536 | 0.429 | -0.107 | 0.593 | -0.071 | 1 |
*p-value < 0.05.
Disclaimer/Publisher’s Note: The statements, opinions and data contained in all publications are solely those of the individual author(s) and contributor(s) and not of MDPI and/or the editor(s). MDPI and/or the editor(s) disclaim responsibility for any injury to people or property resulting from any ideas, methods, instructions or products referred to in the content. |
© 2024 by the authors. Licensee MDPI, Basel, Switzerland. This article is an open access article distributed under the terms and conditions of the Creative Commons Attribution (CC BY) license (https://creativecommons.org/licenses/by/4.0/).
Copyright: This open access article is published under a Creative Commons CC BY 4.0 license, which permit the free download, distribution, and reuse, provided that the author and preprint are cited in any reuse.


